review article correlation of ccna1 promoter...
TRANSCRIPT
Review ArticleCorrelation of CCNA1 Promoter Methylation withMalignant Tumors: A Meta-Analysis Introduction
Bin Yang,1 Shuai Miao,2 Le-Ning Zhang,1 Hong-Bin Sun,1
Zhe-Nan Xu,1 and Chun-Shan Han1
1Department of Thoracic Surgery, China-Japan Union Hospital of Jilin University, Changchun 130033, China2Department of Geriatrics, China-Japan Union Hospital of Jilin University, Changchun 130033, China
Correspondence should be addressed to Chun-Shan Han; [email protected]
Received 19 July 2014; Revised 23 October 2014; Accepted 7 November 2014
Academic Editor: Sabine Rohrmann
Copyright © 2015 Bin Yang et al.This is an open access article distributed under the Creative Commons Attribution License, whichpermits unrestricted use, distribution, and reproduction in any medium, provided the original work is properly cited.
Epigenetic silencing of tumor suppressor genes by promoter methylation plays vital roles in the process of carcinogenesis. Thepurpose of this meta-analysis was to determine whether the aberrantmethylation of cyclin A1 (CCNA1) may be of great significanceto human malignant tumors. By searching both English and Chinese language-based electronic databases carefully, we tabulatedand analyzed parameters from each study. All human-associated case-control studies were included providing available data forCCNA1 methylation and reporting the adjusted odds ratios (ORs) and 95% confidence intervals (CI) conducted with the use ofVersion 12.0 STATA software. A total of 10 case-control studies (619 patients with cancers and 292 healthy controls) were includedfor the following statistical analysis. Pooled OR values from all articles revealed that the frequency ofCCNA1methylation in cancertissues was significantly higher than those of normal tissues (𝑃 < 0.001). Further ethnicity indicated that the frequency of CCNA1methylation was correlated with the development of malignant tumors among all those included experimental subgroups (all 𝑃 <0.05).These data from results indicated a significant connection ofCCNA1methylation with poor progression in humanmalignanttumors among both Caucasian and Asian populations.
1. Introduction
Cancer, as the leading cause of mortality in developed coun-tries, refers to a variety of malignant diseases containingabnormal cell growthwith the possibility to invade ormigrateto other parts of the body, with lung, prostate, colorectal, andstomach cancers being prevalent inmales and breast, colorec-tal, lung, and cervical cancers being common in females [1].Clinically, cancer is possibly characterized by a new lump,abnormal bleeding, a prolonged cough, unexplained weightloss, and a change in bowel movements [2]. It has beenreported that approximately 14.1 million new cancer caseswere diagnosedworldwide in 2012, responsible for 8.2milliondeaths, equivalent to 14.6% of all human deaths (World Can-cer Report Fund/American Institute for Cancer Research:Food, Nutrition, Physical Activity, and the Prevention ofCancer: a Global Perspective, Washington, DC: AICR, 2007).In addition, about 1,660,290 new cases of cancer and 580,350cancer deaths are estimated to have occurred in the US in
2013 [3]. It is widely accepted that the pathogenesis of cancersis regarded to be complicated involving both genetic andenvironmental influences [4, 5]. Various risk factors may beimplicated in cancer etiology, including obesity, lack of phys-ical activity, drinking, smoking, a poor diet, and exposureto ionizing radiation [4, 6–8]. Recent evidence has demon-strated that methylation of cyclin A1 (CCNA1) gene may alsoconsiderably conduce to the process of tumorigenesis [9, 10].
CCNA1 belongs to the highly conserved cyclin family,which are manifested by a dramatic periodicity in proteinabundance via the cell division cycle and function as acti-vating subunits of enzymatic complex in combination withcyclin-dependent kinases (CDKs) [11]. CCNA1 is capable oftargeting activated cell division cycle 2 and cyclin-dependentkinase 2 to substrates essential for condensation of chromatinand other alterations in morphology during the process ofapoptosis [12]. In general, the expression of CCNA1 is tissue-specific and high CCNA1 expression is limited to testis;besides, lower levels of CCNA1 expression are also observed
Hindawi Publishing CorporationBioMed Research InternationalVolume 2015, Article ID 134027, 12 pageshttp://dx.doi.org/10.1155/2015/134027

2 BioMed Research International
in other human cell lines and in healthy brain [13]. Currently,CCNA1 expression has been illustrated to be downregulatedin various tumors, including head and neck squamous-cellcancer (HNSCC) and nasopharyngeal carcinoma; and thepromoter of the CCNA1 gene is found to be frequentlymethylated in colon cancer and HNSCC [14–16]. HumanCCNA1 gene has been mapped to chromosome 13q12.3-q13,consisting of 9 exons and 8 introns and extending overapproximately 13 kb in length [17, 18]. It has been widelydescribed in several studies thatCCNA1may be an importanttumor suppressor gene and plays a crucial part in head andneck carcinoma and cervical and nasopharyngeal cancers [12,19, 20]. More importantly, promoter methylation of tumorsuppressor genes including CCNA1 gene may conduce to animmortalized phenotype via silencing expression of geneswhich possess the ability to control cell differentiation orsuppress cell growth [9]. From this aspect, we postulated thatCCNA1 gene promoter methylation may lead to tumor cellproliferation in the development of cancers. In a preciousstudy, promoter methylation of CCNA1 gene is found in 45%of tumors but in none of the normal tissues, suggesting theimplication of CCNA1 gene methylation in carcinogenesis[12]. Furthermore, a relatively high frequency of methylationCCNA1 gene was observed in bladder cancer tissues butnot in normal uroepithelium, revealing that CCNA1 genepromoter methylation may participate in the pathogenesis ofbladder cancer [5]. Nevertheless, there still existed discordantfindingswith regard to the role ofCCNA1 genemethylation intumorigenesis [21, 22]. Hence, the present meta-analysis wascarried out to explore the plausible impact of CCNA1 genemethylation on cancer development.
2. Materials and Methods
2.1. Data Sources and Keywords. To identify all pertinentpapers that assessed the correlations of CCNA1 methyla-tion with malignant tumors, we comprehensively searchedPubMed, Embase, Web of Science, Cochrane Library, CIS-COM, CINAHL, Google Scholar, CBM, and CNKI databases(last updated search on May 1, 2014), utilizing selected com-mon keywords regarding the CCNA1 protein and tumor. Asfor the keywords to be applied in our initial literature search,we selected (“CCNA1 protein, human” or “CCNA1” or “cyclinA1” or “cyclin A1 protein” or “Cyclin-A1”) and (“Methylation”or “DNA Methylation” or “Hypermethylation” or “demethy-lation”) for the exposure factors. In addition, (“Neoplasms”or “Neoplasm” or “Cancer” or “Cancers” or “carcinomas” or“carcinoma” or “tumor” or “tumors”) were selected as the out-come factors. No restriction was set to the language of thearticle.We also further scanned the bibliographies of relevantarticles manually to identify additional potential relevantpapers.When the enrolled papers supplied unclear additionaldata in their original publications, the first authors would becontacted and asked for clarifications.
2.2. Selection Criteria. We searched throughout for allhuman-associated case-control studies providing availabledata for CCNA1 methylation, including patients with malig-nant tumors and normal controls, and reporting the adjusted
odds ratios (ORs) and 95% confidence intervals (CI). We justextracted studies supplying the sample number and sufficientinformation about CCNA1 methylation and excluded thosearticles with incomplete unavailable or inappropriate clini-copathologic data or those regarding tumors not confirmedby histopathologic examinations. In addition, only the studieswith the minimum number of samples greater than 30 wereenrolled. However, when the extracted studies had subjectsoverlapping more than 50% with two or more papers, wemerely enrolled the one whose populationwas themost com-prehensive. At the same time, only the newest or completestudywas includedwhen the extracted studieswere publishedby the same authors or groups, after careful reexamination.
2.3. Data Extraction. In order to reduce the bias and enhancethe credibility, two investigators extracted information fromthe retrieved papers according to the selection criteria sepa-rately and arrived at a consensus on all the items through dis-cussion and reexamination. The following relevant data wereextracted from eligible studies prospectively in the final anal-yses: surname of first author, year of publication, source ofpublication, study type, study design, source of samples, sam-ple size, age, sex, ethnicity and country of origin, disease type,detection method for CCNA1 methylation, and methylationof CCNA1 in cancer tissues and normal tissues. All authorsapproved the final determinant of the studies to be enrolled.
2.4. Quality Assessment. To decide whether the study inquestion is of high quality, the two authors used a set ofpredefined criteria based on the REMARK guidelines andNewcastle-Ottawa Scale (NOS) criteria to assess the studiesindependently [23, 24]. The REMARK guidelines, consistingof 20 detailed items, assess several aspects of the enrolledstudies, such as study aim, study design, patient enrollment,biomarker detection, statistical analysis method, and reportof results. On the other hand, the NOS criteria are scoredbased on three aspects: (1) subject selection: 0∼4; (2) com-parability of subject: 0∼2; (3) clinical outcome: 0∼3. TotalNOS scores range from 0 (lowest) to 9 (highest). Accordingto the NOS scores, the included studies were classifiedinto two levels: low quality (0–6) and high quality (7–9),respectively. Discrepancies on NOS scores of the enrolledarticles were resolved by discussion and consultationwith thethird reviewer.
2.5. Statistical Analysis. To calculate the effect size for eachstudy, the summary ORs with 95% CI were used for cancertissue versus normal tissue categories of CCNA1methylationwith the utilization of 𝑍 test. In order to supply quantitativeevidence of all selected studies and minimize the variance ofthe summary ORs with 95% CI, we conducted the currentstatistical meta-analyses by utilizing a random-effects model(DerSimonian and Laird method) or a fixed-effects model(Mantel-Haenszel method) of individual study results underthe situation where data from independent studies couldbe combined. Random-effects model was applied when het-erogeneity existed among studies, while fixed-effects modelwas applied when there was no statistical heterogeneity. Thesubgroup meta-analyses were also conducted by ethnicity,

BioMed Research International 3
Articles identified through electronic database searching
Articles reviewed for duplicates
Articles after removing duplicates
Full-text articles assessed for eligibility
Studies included in qualitative synthesis
Studies included in quantitative synthesis (meta-analysis)
Additional articles identified through a manual search
Iden
tifica
tion
Scre
enin
gEl
igib
ility
Inclu
ded
Studies were excluded, due to
Studies were excluded, due to
Studies were excluded, due to:
(N = 80)
(N = 80) (N = 0)
(N = 78)
(N = 36)
(N = 13)
(N = 10)
(N = 9) being letters, reviews, or meta-analyses,(N = 13) not being human studies,(N = 20) not being related to research topics
(N = 4) not being case-control or cohort study,(N = 7) not being relevant to CCNA1(N = 12) not being relevant to cancer
(N = 3) insufficient data
Studies were excluded, due to(N = 2) duplicates
Figure 1: Flow chart shows study selection procedure. Eleven case-control studies were included in this meta-analysis.
disease type, sample size, and detection method to explorepotential effect modification, and heterogeneity across theenrolled studies was evaluated by Cochran’s Q-statistic (𝑃 <0.05 was regarded as statistically significant) [25]. As a resultof low statistical power of Cochran’s Q-statistic, 𝐼2 test wasalso measured to reflect the possibility of heterogeneitybetween studies [26]. The 𝐼2 test values ranged from 0% (noheterogeneity) to 100% (maximal heterogeneity). The one-way sensitivity analysis was performed to evaluate whetherthe results could have been affected significantly throughdeleting a single study in our meta-analysis one by one toreflect the influence of the individual data set on the pooledORs. The funnel plot was constructed to assess publica-tion bias which might affect the validity of the estimates.
The symmetry of the funnel plot was further evaluated byEgger’s linear regression test [27]. All tests were two-sidedand a𝑃 value of<0.05 was regarded as statistically significant.To make sure that the results are credible and accurate,two investigators inputted all information in the STATAsoftware, Version 12.0 (StataCorp, College Station, TX, USA),separately and arrived at an agreement.
3. Results
3.1. Included Studies. Our present meta-analysis hit a totalof 10 case-control studies that provided information on thecorrelation of CCNA1 methylation with tumors [5, 9, 10, 12,19–22, 28, 29]. Seven studies were conducted in populations

4 BioMed Research International
Table 1: Characteristics of included studies focused on methylation ratio of CCNA1.
First author Year Ethnicity Disease Sample Number Gender (M/F) Age (years) Method NOS scoreTumor Benign Normal
Longo [29] 2014 Caucasians HNSCC Tissue 96 0 79 75/21 59 (20∼90) qMSP 8Liu [28] 2013 Asians CC Tissue 40 0 40 0/40 — MSP 6Weiss [10] 2011 Caucasians HNSCC Tissue 49 0 31 — 63.7 ± 11.8 MSP 7Yang [9] 2010 Caucasians CC Tissue 60 40 20 — 46 (38∼57) qMSP 7Yanatatsaneejit [20] 2008 Asians NPC Tissue 46 0 20 — — Duplex MSP 6
Brait [5] 2008 Caucasians BCa Tissue93 0 26 — 67 (39∼83) qMSP 825 0 5 — 66 (34∼84) qMSP
Yu [21] 2003 Asians BCa Tissue 132 23 0 107/25 — MSP 8Kitkumthorn [19] 2006 Asians CC Tissue 30 24 25 — — Duplex MSP 6Tokumaru [12] 2004 Asians HNSCC Tissue 20 0 11 — — MSP 6Yu [21] 2003 Asians HCC Tissue 28 0 28 — — MSP 6M: male; F: female; NOS: Newcastle-Ottawa Scale; HNSCC: head and neck cancer; NSCLC: non-small-cell lung cancer; CC: choriocarcinoma; NPC:nasopharyngeal carcinoma; BCa: bladder cancer; HCC: hepatocellular carcinoma; MSP: methylation specific PCR.
of Asian descent and 4 in populations of Caucasian descent,including 911 subjects in total (619 patients with cancers and292 healthy controls), which were published between 2003and 2014. The characteristics and methodological quality ofthe extracted studies were presented in Table 1. The coun-tries where the studies were performed were Brazil, China,Germany, The Netherlands, Thailand, USA, and Korea. Thesources of samples in our present meta-analysis were all fromtissues. Diseases involved in ourmeta-analysis consist of headand neck squamous-cell carcinoma (HNSCC), colorectalcancer (CC), nasopharyngeal carcinoma (NPC), bladdercancer (BCa), and hepatocellular carcinoma (HCC). Themethods detecting CCNA1methylation in this current meta-analysis included MSP (𝑛 = 5), qMSP (𝑛 = 3), and DuplexMSP (𝑛 = 2). Additionally, as for the step of screening, aflow chart of the study selection process was displayed inFigure 1. Initially, a total of 80 papers were selected fromthe 9 databases through screening the title and keywords.After excluding the duplicates (𝑛 = 2), letters, reviews, ormeta-analyses (𝑛 = 9), nonhuman studies (𝑛 = 13), andthe studies not related to research topics (𝑛 = 20), theremaining studies (𝑛 = 36) were reviewed and additional 23studies were excluded for not being case-control or cohortstudy (𝑛 = 4), relevant to CCNA1 (𝑛 = 7), or relevant tocancer (𝑛 = 12). After the remaining 13 trials were furtherreviewed, 10 papers were enrolled in the final analysis. Duringthe final selection process, the major reason for abandon wasnot supplying enough information (𝑛 = 3). All quality scoresof the included studies were higher than 6 (high quality).From 2001 to 2014, the number of articles selected from thoseelectronic databases was shown in Figure 2.
3.2. Association of CCNA1 Methylation with Cancers. Asshown in Figure 3, the major findings of the present meta-analysis revealed a higher CCNA1 methylation level inpatients with cancers compared to that in normal controls(OR = 12.45, 95% CI: 6.35–24.42, and 𝑃 < 0.001). Subgroupanalysis based on ethnicity implied that CCNA1methylationlevel was higher in cancer tissues than in normal tissues in
Publication year
Num
ber o
f art
icle
s
PubMed database All databases
2013∼2014
2011∼2012
2009∼2010
2007∼2008
2005∼2006
2003∼2004
2001∼2002
20
15
10
5
0
Figure 2: Distribution of the number of topic-related literatures inelectronic databases over the last decade.
both Caucasians and Asians (all 𝑃 < 0.05) (Figure 4). Inaddition, subgroup analysis by disease type implicated thatmethylation level of CCNA1 in cancer tissues was higher thanthat in normal tissues in all HNSCC, CC, NPC, BCa, andHCC subgroups (all 𝑃 < 0.05). Subgroup analysis basedon sample size revealed that the CCNA1 hypermethylationoccurred more frequently in the cancer tissues relative to thenormal tissues; in the large sample size subgroup, similarassociation was also observed in the small sample sizesubgroup (all 𝑃 < 0.05). Further subgroup analysis basedon detection method implied that CCNA1 methylation levelin patients with cancers was higher than that in the normalcontrols by using qMSP,MSP, andDuplexMSP (all𝑃 < 0.05).
3.3. Sensitivity Analysis and Publication Bias. A leave-one-out sensitivity analysis was carried out to evaluate whethera particular study or studies would lead to heterogeneityand impact on the pooled ORs for CCNA1methylation level.

BioMed Research International 5
Yanatatsaneejit et al. (2008)
Kitkumthorn et al. (2006)
Brait et al. (2008b)
Tokumaru et al. (2004)
Yu et al. (2007)
Brait et al. (2008a)
Weiss et al. (2011)
Yu et al. (2003)
Liu et al. (2013)
Zhong H (2013)
Longo et al. (2014)
Yang et al. (2010)
12.85 (6.83, 24.18)
41.60 (19.57, 88.42)
1.97 (1.06, 3.66)
4.71 (2.58, 8.59)
145.60 (32.75, 647.40)
13.24 (5.44, 32.23)
11.35 (5.58, 23.06)
72.80 (26.17, 202.49)
8.51 (3.22, 22.49)
24.27 (11.68, 50.40)
15.87 (8.89, 28.34)
5.53 (2.70, 11.32)
100.00
8.59
8.94
8.99
6.33
8.20
8.71
7.79
7.95
4.16 (1.66, 10.41) 8.12
8.65
9.04
8.69
10.00154 647
10.00361 277
Included study OR (95% CI) Weight (%)
Cancer tissue versus normal tissue
Cancer tissue versus benign tissue
Random-effects analysis
Heterogeneity test (I2 = 87.5%, P < 0.001)
Z test (Z = 7.91, P < 0.001)
Yanatatsaneejit et al. (2008)
Kitkumthorn et al. (2006)
Tokumaru et al. (2004)
Yu et al. (2007)
Weiss et al. (2011)
Yu et al. (2003)
Liu et al. (2013)
Zhong H (2013)
Longo et al. (2014)
Yang et al. (2010)
5.38 (2.85, 10.16)
17.40 (7.84, 38.64)
0.82 (0.42, 1.61)
1.97 (1.02, 3.79)
60.90 (13.39, 276.96)
5.54 (2.19, 13.99)
4.75 (2.23, 10.10)
30.45 (10.60, 87.50)
3.56 (1.30, 9.73)
10.15 (4.67, 22.05)
6.64 (3.52, 12.53)
2.31 (1.08, 4.96)
100.00
8.59
8.93
8.98
6.35
8.20
8.71
7.80
7.95
1.74 (0.67, 4.51) 8.12
8.65
9.03
8.69
Included study OR (95% CI) Weight (%)
Random-effects analysis
Heterogeneity test (I2 = 86.0%, P < 0.001)
Z test (Z = 5.19, P < 0.001)
Brait et al. (2008b)
Brait et al. (2008a)
Figure 3: Forest plot for the associations between aberrant cyclin A1 promoter methylation and the pathogenesis of human tumors.

6 BioMed Research International
Tokumaru et al. (2004)Yu et al. (2003)
Yu et al. (2007)Yanatatsaneejit et al. (2008)Liu et al. (2013)Zhong H (2013)
Kitkumthorn et al. (2006)
CaucasiansLongo et al. (2014)
Yang et al. (2010)
Asians
Weiss et al. (2011)
12.85 (6.83, 24.18)
8.51 (3.22, 22.49)4.16 (1.66, 10.41)
4.71 (2.58, 8.59)
1.97 (1.06, 3.66)
14.30 (5.02, 40.70)
11.35 (5.58, 23.06)72.80 (26.17, 202.49)24.27 (11.68, 50.40)
145.60 (32.75, 647.40)
11.64 (5.37, 25.24)
15.87 (8.89, 28.34)
41.60 (19.57, 88.42)
5.53 (2.70, 11.32)
13.24 (5.44, 32.23)
100.00
7.958.12
8.99
8.94
56.49
8.71
8.657.79
6.33
43.51
9.04
8.59
8.69
8.20
10.00154 647
Included study OR (95% CI) Weight (%)
Cancer tissue versus normal tissue(ethnicity)
Random-effects analysis
Heterogeneity test (I2 = 83.9%, P < 0.001)
Heterogeneity test (I2 = 90.4%, P < 0.001)
Heterogeneity test (I2 = 87.5%, P < 0.001)
Cancer tissue versus benign tissue(ethnicity)
Tokumaru et al. (2004)
Yu et al. (2003)
Yu et al. (2007)
Yanatatsaneejit et al. (2008)
Liu et al. (2013)
Zhong H (2013)
Kitkumthorn et al. (2006)
CaucasiansLongo et al. (2014)
Yang et al. (2010)
Asians
Weiss et al. (2011)
5.38 (2.85, 10.16)
3.56 (1.30, 9.73)
1.74 (0.67, 4.51)
1.97 (1.02, 3.79)
0.82 (0.42, 1.61)
5.98 (2.10, 17.05)
4.75 (2.23, 10.10)
30.45 (10.60, 87.50)
10.15 (4.67, 22.05)
60.90 (13.39, 276.96)
4.87 (2.24, 10.57)
6.64 (3.52, 12.53)
17.40 (7.84, 38.64)
2.31 (1.08, 4.96)
5.54 (2.19, 13.99)
100.00
7.95
8.12
8.98
8.93
56.51
8.71
8.65
7.80
6.35
43.49
9.03
8.59
8.69
8.20
10.00361 277
Included study OR (95% CI) Weight (%)
Random-effects analysis
Z test (Z = 4.00, P < 0.001)
Z test (Z = 5.19, P < 0.001)
Z test (Z = 3.35, P = 0.001)
Heterogeneity test (I2 = 81.6%, P < 0.001)
Heterogeneity test (I2 = 89.4%, P < 0.001)
Heterogeneity test (I2 = 86.0%, P < 0.001)
Z test (Z = 6.22, P < 0.001)
Z test (Z = 7.91, P < 0.001)
Z test (Z = 4.98, P < 0.001)
Brait et al. (2008b)
Brait et al. (2008a)
Brait et al. (2008b)
Brait et al. (2008a)
(a)
Figure 4: Continued.

BioMed Research International 7
Tokumaru et al. (2004)
Liu et al. (2013)
Zhong H (2013)
Longo et al. (2014)
BCa
Kitkumthorn et al. (2006)Yang et al. (2010)
NPC
CC
NSCLC
Yu et al. (2003)
Weiss et al. (2011)
Yanatatsaneejit et al. (2008)
Yu et al. (2007)
HNSCC
12.85 (6.83, 24.18)
8.51 (3.22, 22.49)
24.27 (11.68, 50.40)24.27 (11.68, 50.40)
4.16 (1.66, 10.41)4.16 (1.66, 10.41)
15.87 (8.89, 28.34)
11.35 (5.58, 23.06)11.35 (5.58, 23.06)
13.24 (5.44, 32.23)
61.20 (32.42, 115.53)145.60 (32.75, 647.40)
41.60 (19.57, 88.42)72.80 (26.17, 202.49)
9.38 (4.72, 18.67)
4.76 (1.77, 12.79)
5.53 (2.70, 11.32)
1.97 (1.06, 3.66)
4.71 (2.58, 8.59)
100.00
7.95
8.65
8.128.12
9.04
8.718.71
8.94
22.71
7.798.596.33
8.65
25.68
8.69
26.13
8.998.20
10.00154 647
Included study OR (95% CI) Weight (%)Cancer tissue versus normal tissue
(disease)
Random-effects analysis
Z test (Z = 6.38, P < 0.001)
Z test (Z = 8.55, P < 0.001)
Z test (Z = 6.71, P < 0.001)
Z test (Z = 7.91, P < 0.001)
Z test (Z = 3.09, P = 0.002)
Z test (Z = 3.05, P = 0.002)
Z test (Z = 12.69, P < 0.001)
Heterogeneity test (I2 = 16.5%, P = 0.302)
Heterogeneity test (I2 = 83.6%, P = 0.002)
Heterogeneity test (I2 = 87.5%, P < 0.001)
Heterogeneity test (I2 = 61.4%, P = 0.075)
Cancer tissue versus benign tissue(disease)
Tokumaru et al. (2004)
Liu et al. (2013)
Zhong H (2013)
Longo et al. (2014)
BCa
Kitkumthorn et al. (2006)Yang et al. (2010)
NPC
CC
NSCLC
Yu et al. (2003)HCC
HCC
Weiss et al. (2011)
Yanatatsaneejit et al. (2008)
Yu et al. (2007)
HNSCC
5.38 (2.85, 10.16)
3.56 (1.30, 9.73)
10.15 (4.67, 22.05)10.15 (4.67, 22.05)
1.74 (0.67, 4.51)1.74 (0.67, 4.51)
6.64 (3.52, 12.53)
4.75 (2.23, 10.10)4.75 (2.23, 10.10)
5.54 (2.19, 13.99)
25.60 (13.56, 48.34)60.90 (13.39, 276.96)
17.40 (7.84, 38.64)30.45 (10.60, 87.50)
9.93 (1.99, 7.74)
1.99 (0.73, 5.41)
2.31 (1.08, 4.96)
0.82 (0.42, 1.61)
1.97 (1.02, 3.79)
100.00
7.95
8.65
8.128.12
9.03
8.718.71
8.93
22.73
7.808.596.35
8.65
25.67
8.69
26.12
8.988.20
10.00361 277
Included study OR (95% CI) Weight (%)
Random-effects analysis
Z test (Z = 3.95, P < 0.001)
Z test (Z = 5.85, P < 0.001)
Z test (Z = 4.04, P < 0.001)
Z test (Z = 5.19, P < 0.001)
Z test (Z = 1.35, P = 0.176)
Z test (Z = 1.14, P = 0.255)
Z test (Z = 10.00, P < 0.001)
Heterogeneity test (I2 = 11.3%, P = 0.324)
Heterogeneity test (I2 = 81.6%, P = 0.004)
Heterogeneity test (I2 = 86.0%, P < 0.001)
Heterogeneity test (I2 = 55.1%, P = 0.108)
Brait et al. (2008b)Brait et al. (2008a)
Brait et al. (2008b)Brait et al. (2008a)
(b)Figure 4: Continued.

8 BioMed Research International
Z test (Z = 5.73, P < 0.001)
Z test (Z = 4.22, P < 0.001)
Z test (Z = 7.91, P < 0.001)
Z test (Z = 2.84, P = 0.004)
Heterogeneity test (I2 = 89.1%, P = 0.002)
Heterogeneity test (I2 = 85.4%, P < 0.001)
Heterogeneity test (I2 = 89.8%, P < 0.001)
Heterogeneity test (I2 = 87.5%, P < 0.001)
Zhong H (2013)Liu et al. (2013)
Duplex MSP
Yu et al. (2003)
Kitkumthorn et al. (2006)
Tokumaru et al. (2004)
Weiss et al. (2011)
Yanatatsaneejit et al. (2008)
qMSPLongo et al. (2014)
MSP
Yang et al. (2010)
Yu et al. (2007)
12.85 (6.83, 24.18)
37.22 (3.07, 451.23)
24.27 (11.68, 50.40)
8.51 (3.22, 22.49)
13.24 (5.44, 32.23)
4.16 (1.66, 10.41)9.14 (3.27, 25.55)
145.60 (32.75, 647.40)
1.97 (1.06, 3.66)
72.80 (26.17, 202.49)
11.35 (5.58, 23.06)
4.71 (2.58, 8.59)
15.87 (8.89, 28.34)
41.60 (19.57, 88.42)
5.53 (2.70, 11.32)
14.04 (5.68, 34.66)
100.00
15.05
8.65
7.95
8.20
50.14
6.33
8.94
8.12
7.79
8.71
8.99
9.04
8.59
8.69
34.82
0.00154 1 647
Included study OR (95% CI) Weight (%)
Cancer tissue versus normal tissue(method)
Random-effects analysis
Cancer tissue versus benign tissue(method)
Z test (Z = 3.84, P < 0.001)
Z test (Z = 2.56, P = 0.011)
Z test (Z = 5.19, P < 0.001)
Z test (Z = 2.16, P = 0.031)
Heterogeneity test (I2 = 88.5%, P = 0.003)
Heterogeneity test (I2 = 83.1%, P < 0.001)
Heterogeneity test (I2 = 88.6%, P < 0.001)
Heterogeneity test (I2 = 86.0%, P < 0.001)
Zhong H (2013)Liu et al. (2013)
Duplex MSP
Yu et al. (2003)
Kitkumthorn et al. (2006)
Tokumaru et al. (2004)
Weiss et al. (2011)
Yanatatsaneejit et al. (2008)
qMSPLongo et al. (2014)
MSP
Yang et al. (2010)
Yu et al. (2007)
5.38 (2.85, 10.16)
15.57 (1.28, 188.73)
10.15 (4.67, 22.05)
3.56 (1.30, 9.73)
5.54 (2.19, 13.99)
1.74 (0.67, 4.51)
3.82 (1.37, 10.68)
60.90 (13.39, 276.96)
0.82 (0.42, 1.61)
30.45 (10.60, 87.50)
4.75 (2.23, 10.10)
1.97 (1.02, 3.79)
6.64 (3.52, 12.53)17.40 (7.84, 38.64)
2.31 (1.08, 4.96)
5.87 (2.38, 14.47)
100.00
15.06
8.65
7.95
8.20
50.14
6.35
8.93
8.12
7.80
8.71
8.98
9.038.59
8.69
34.80
0.00361 1 277
Included study OR (95% CI) Weight (%)
Random-effects analysis
Brait et al. (2008b)
Brait et al. (2008a)
Brait et al. (2008b)Brait et al. (2008a)
(c)
Figure 4: Subgroup analyses of the relationships between aberrant cyclin A1 promoter methylation and the pathogenesis of human tumors.
BioMed Research International 9
5.87 12.856.83 24.18 28.13
2.46 5.382.85 10.16 11.79
Longo et al. (2014)
Liu et al. (2013)
Zhong H (2013)
Weiss et al. (2011)
Yang et al. (2010)
Yanatatsaneejit et al. (2008)
Yu et al. (2007)
Kitkumthorn et al. (2006)
Tokumaru et al. (2004)
Yu et al. (2003)
Longo et al. (2014)
Liu et al. (2013)
Zhong H (2013)
Weiss et al. (2011)
Yang et al. (2010)
Yanatatsaneejit et al. (2008)
Yu et al. (2007)
Kitkumthorn et al. (2006)
Tokumaru et al. (2004)
Yu et al. (2003)
Lower CI limitEstimate
Upper CI limit
Lower CI limitEstimate
Upper CI limit
Cancer tissue versus normal tissue
Cancer tissue versus benign tissue
Brait et al. (2008b)
Brait et al. (2008a)
Brait et al. (2008b)
Brait et al. (2008a)
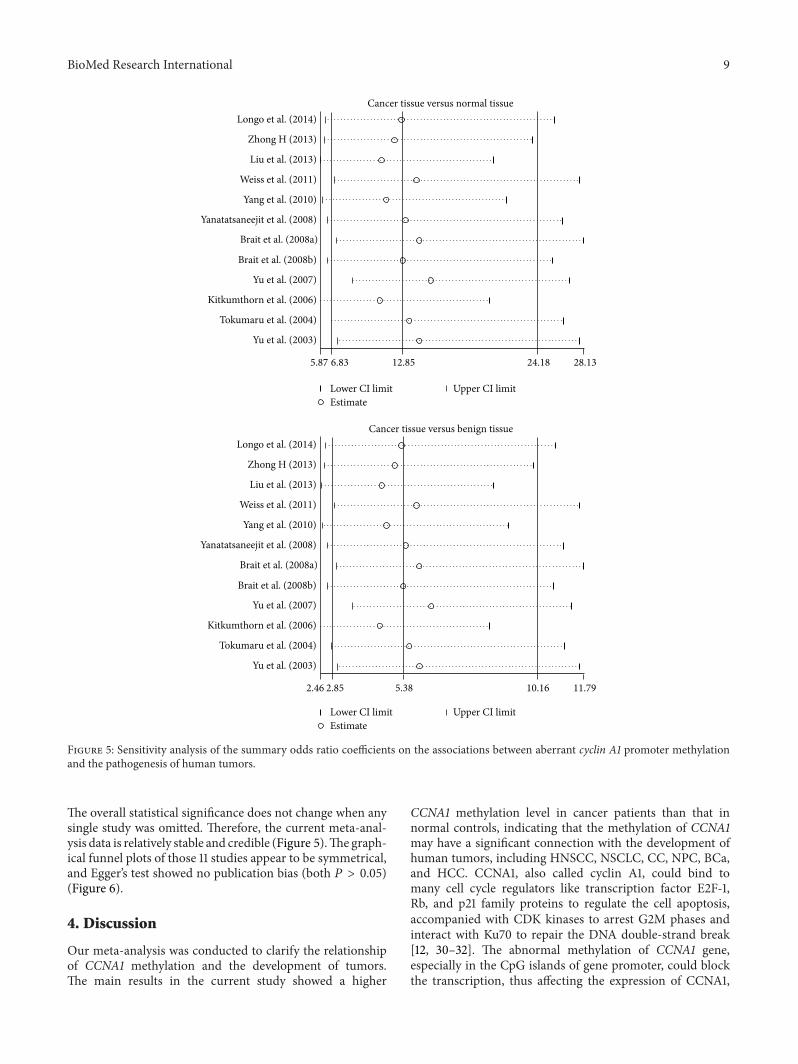
Figure 5: Sensitivity analysis of the summary odds ratio coefficients on the associations between aberrant cyclin A1 promoter methylationand the pathogenesis of human tumors.
The overall statistical significance does not change when anysingle study was omitted. Therefore, the current meta-anal-ysis data is relatively stable and credible (Figure 5).The graph-ical funnel plots of those 11 studies appear to be symmetrical,and Egger’s test showed no publication bias (both 𝑃 > 0.05)(Figure 6).
4. Discussion
Our meta-analysis was conducted to clarify the relationshipof CCNA1 methylation and the development of tumors.The main results in the current study showed a higher
CCNA1 methylation level in cancer patients than that innormal controls, indicating that the methylation of CCNA1may have a significant connection with the development ofhuman tumors, including HNSCC, NSCLC, CC, NPC, BCa,and HCC. CCNA1, also called cyclin A1, could bind tomany cell cycle regulators like transcription factor E2F-1,Rb, and p21 family proteins to regulate the cell apoptosis,accompanied with CDK kinases to arrest G2M phases andinteract with Ku70 to repair the DNA double-strand break[12, 30–32]. The abnormal methylation of CCNA1 gene,especially in the CpG islands of gene promoter, could blockthe transcription, thus affecting the expression of CCNA1,

10 BioMed Research International
0 0.2 0.4 0.6 0.8
0 0.2 0.4 0.6 0.8
0
2
4
0
2
1
3
4
6
Log[
OR]
Log[
OR]
SE Log[OR]
SE Log[OR]
Cancer tissue versus normal tissue(Egger’s test: t = 1.82, P = 0.099)
Cancer tissue versus benign tissue(Egger’s test: t = 1.87, P = 0.091)
Figure 6: Funnel plot of publication biases on the associationsbetween aberrant cyclin A1 promotermethylation and the pathogen-esis of human tumors.
whichmay lead to CCNA1 dysfunctions in cell differentiationand cell growth, contributing to the progression of manyhuman tumors, such asHNSCC,NSCLC,CC,NPC, BCa, andHCC [9, 10, 20, 33–35]. The hypermethylation of promoterin the CCNA1 gene was found in the saliva and plasma ofpatients suffering from HNSCC, while the frequency ofCCNA1 hypermethylation decreased significantly after treat-ment, indicating that CCNA1 gene hypermethylation may bean essential reason for HNSCC development [29]. CCNA1gene hypermethylation might hinder its antitumor functionin regulating the cell apoptosis by binding cell cycle regu-lators like transcription factor E2F-1, Rb, and p21 familyproteins as we mentioned before, which is thus related tothe development of NSCLC, NPC, BCa, and HCC (http://www.i-md.com/docsearch/doc/edbe90ca-14a0-4780-8286-7fa6e0be1b51?dp=Respiratory) [5, 20, 21]. In addition, asa potential suppressor gene for epithelial tumors, CCNA1could participate in the TP53 activation in the CC patientsby viral protein and host protein interaction; CCNA1 genehypermethylation of promoter is more frequently foundin invasive CC compared to that in squamous-cell CC,
suggesting its role as an effective marker for invasive CCdiagnosis [19]. To confirm our analysis, we found similarconclusion from the study of Rettori et al. They showed thatCCNA1 was frequently hypermethylated in HNSCC patientswith second primary tumors and thus could be used as apotent marker for neoplastic evolution [36]. To evaluate theinfluence of ethnicity, different kinds of diseases, samplesize, and methylation detection method on the relationshipbetween CCNA1 methylation and tumors development, afurther deep stratified analysis was performed. We couldobserve no obvious effect of ethnicity and methylationdetection method on the relationship, which demonstratedthe subjectivity and reasonability of our analysis.
A number of potential limitations have been taken intoaccount in our meta-analysis. First and foremost, it waswidely acknowledged that methylation analysis dependedmostly on harvested cells; in this regard, it was easier toignore the issue of sampling error. Besides, there was alack of an accepted gold standard against which to comparemethylation results, thereby having a strong influence on thereliability of the further investigation in this field. Secondly,although there was no heterogeneity existing in ethnicity,different kinds of diseases, sample size, and methylationdetection methods in our subgroup analysis, other differ-ent types of heterogeneity sources should be better to bepresented among all the included studies. A third limita-tion of this analysis may be the publication and reportingbias which may be existent. We attempted to use severalChinese and English databases as complete as possible forthe purpose of minimizing publication bias; however, wedid not take unpublished papers and abstracts into accountentirely. Fourthly, in some of the included literatures, thenumber of cancer patients or healthy controls was relativelysmall, which may restrict the outcome of this meta-analysis.Finally, it is difficult to determine the cut-off point of CCNA1hypermethylation for predicting cancer risk, and thereby thesensitivity and specificity of genes methylation respectingcancer risks could not be easily decided.
To sum up, the findings of our meta-analysis demon-strated that CCNA1 was frequently and specifically hyper-methylated in several cancer samples, suggesting that theaberrant methylation of CCNA1 was significantly relatedto the development of human cancers, especially visible inHNSCCCC and NPC in the general populations. However,it is essential to carry out a more extensive larger scale studywith larger patient groups and longer follow-up period forfurther validation.
Conflict of Interests
The authors have declared that no conflict of interests existsregarding the publication of this paper.
Acknowledgment
Theauthors would like to acknowledge the reviewers for theirhelpful comments on this paper.

BioMed Research International 11
References
[1] A. Jemal, F. Bray, M. M. Center, J. Ferlay, E. Ward, and D.Forman, “Global cancer statistics,” CA: Cancer Journal for Cli-nicians, vol. 61, no. 2, pp. 69–90, 2011.
[2] A. E. Simon, J. Waller, K. Robb, and J. Wardle, “Patient delayin presentation of possible cancer symptoms: the contributionof knowledge and attitudes in a population sample from theUnited Kingdom,” Cancer Epidemiology, Biomarkers & Preven-tion, vol. 19, no. 9, pp. 2272–2277, 2010.
[3] R. Siegel, D.Naishadham, andA. Jemal, “Cancer statistics, 2013,”CA:ACancer Journal for Clinicians, vol. 63, no. 1, pp. 11–30, 2013.
[4] A. McTiernan, M. Irwin, and V. VonGruenigen, “Weight, phys-ical activity, diet, and prognosis in breast and gynecologiccancers,” Journal of Clinical Oncology, vol. 28, no. 26, pp. 4074–4080, 2010.
[5] M. Brait, S. Begum, A. L. Carvalho et al., “Aberrant promotermethylation of multiple genes during pathogenesis of bladdercancer,” Cancer Epidemiology Biomarkers and Prevention, vol.17, no. 10, pp. 2786–2794, 2008.
[6] S. Iodice, S. Gandini, P. Maisonneuve, and A. B. Lowenfels,“Tobacco and the risk of pancreatic cancer: a review and meta-analysis,” Langenbeck’s Archives of Surgery, vol. 393, no. 4, pp.535–545, 2008.
[7] S. M. Zhang, I.-M. Lee, J. E. Manson, N. R. Cook, W. C. Willett,and J. E. Buring, “Alcohol consumption and breast cancer riskin the women’s health study,”American Journal of Epidemiology,vol. 165, no. 6, pp. 667–676, 2007.
[8] S. Sadetzki, A. Chetrit, A. Lubina, M. Stovall, and I. Novikov,“Risk of thyroid cancer after childhood exposure to ionizingradiation for tinea capitis,”The Journal of Clinical Endocrinologyand Metabolism, vol. 91, no. 12, pp. 4798–4804, 2006.
[9] N. Yang, E. R. Nijhuis, H. H. Volders et al., “Gene promotermethylation patterns throughout the process of cervical car-cinogenesis,”CellularOncology, vol. 32, no. 1-2, pp. 131–143, 2010.
[10] D. Weiss, T. Basel, F. Sachse, A. Braeuninger, and C. Rudack,“Promoter methylation of cyclin A1 is associated with humanpapillomavirus 16 induced head and neck squamous cell carci-noma independently of p53mutation,”Molecular Carcinogene-sis, vol. 50, no. 9, pp. 680–688, 2011.
[11] S. Lapenna and A. Giordano, “Cell cycle kinases as therapeutictargets for cancer,” Nature Reviews Drug Discovery, vol. 8, no. 7,pp. 547–566, 2009.
[12] Y. Tokumaru, K. Yamashita,M.Osada et al., “Inverse correlationbetween cyclin A1 hypermethylation and p53 mutation in headand neck cancer identified by reversal of epigenetic silencing,”Cancer Research, vol. 64, no. 17, pp. 5982–5987, 2004.
[13] A. S. Syed Khaja, N. Dizeyi, P. K. Kopparapu, L. Anagnostaki,P. Harkonen, and J. L. Persson, “Cyclin A1 modulates theexpression of vascular endothelial growth factor and promoteshormone-dependent growth and angiogenesis of breast cancer,”PLoS ONE, vol. 8, no. 8, Article ID e72210, 2013.
[14] V. Sriuranpong, A. Mutirangura, J. W. Gillespie et al., “Globalgene expression profile of nasopharyngeal carcinoma by lasercapture microdissection and complementary DNA microar-rays,” Clinical Cancer Research, vol. 10, no. 15, pp. 4944–4958,2004.
[15] C.Muller-Tidow, P. Ji, S. Diederichs et al., “The cyclin A1-CDK2complex regulates DNA double-strand break repair,”Molecularand Cellular Biology, vol. 24, no. 20, pp. 8917–8928, 2004.
[16] X.-L. Xu, J. Yu, H.-Y. Zhang et al., “Methylation profile ofthe promoter CpG islands of 31 genes that may contribute to
colorectal carcinogenesis,” World Journal of Gastroenterology,vol. 10, no. 23, pp. 3441–3454, 2004.
[17] R. Yang, R. Morosetti, and H. P. Koeffler, “Characterization of asecond human cyclin A that is highly expressed in testis and inseveral leukemic cell lines,” Cancer Research, vol. 57, no. 5, pp.913–920, 1997.
[18] C. Muller, R. Yang, L. Beck-von-Peccoz, G. Idos, W. Verbeek,and H. P. Koeffler, “Cloning of the cyclin A1 genomic structureand characterization of the promoter region: GC boxes areessential for cell cycle-regulated transcription of the cyclin A1gene,” The Journal of Biological Chemistry, vol. 274, no. 16, pp.11220–11228, 1999.
[19] N. Kitkumthorn, P. Yanatatsanajit, S. Kiatpongsan et al., “CyclinA1 promoter hypermethylation in human papillomavirus-associated cervical cancer,” BMCCancer, vol. 6, article 55, 2006.
[20] P. Yanatatsaneejit, T. Chalermchai, V. Kerekhanjanarong etal., “Promoter hypermethylation of CCNA1, RARRES1, andHRASLS3 in nasopharyngeal carcinoma,” Oral Oncology, vol.44, no. 4, pp. 400–406, 2008.
[21] J. Yu, H. Y. Zhang, Z. Z. Ma, W. Lu, Y. F. Wang, and J. Zhu,“Methylation profiling of twenty four genes and the concordantmethylation behaviours of nineteen genes that may contributeto hepatocellular carcinogenesis,”Cell Research, vol. 13, no. 5, pp.319–333, 2003.
[22] J. Yu, T. Zhu, Z. Wang et al., “A novel set of DNA methylationmarkers in urine sediments for sensitive/specific detection ofbladder cancer,” Clinical Cancer Research, vol. 13, no. 24, pp.7296–7304, 2007.
[23] D. G. Altman, L. M. McShane, W. Sauerbrei, and S. E. Taube,“Reporting recommendations for tumor marker prognosticstudies (REMARK): explanation and elaboration,” PLoS Med-icine, vol. 9, no. 5, Article ID e1001216, 2012.
[24] A. Stang, “Critical evaluation of the Newcastle-Ottawa scale forthe assessment of the quality of nonrandomized studies inmeta-analyses,” European Journal of Epidemiology, vol. 25, no. 9, pp.603–605, 2010.
[25] D. Jackson, I. R.White, and R. D. Riley, “Quantifying the impactof between-study heterogeneity in multivariate meta-analyses,”Statistics in Medicine, vol. 31, no. 29, pp. 3805–3820, 2012.
[26] J. L. Peters, A. J. Sutton, D. R. Jones, K. R. Abrams, and L.Rushton, “Comparison of two methods to detect publicationbias in meta-analysis,” The Journal of the American MedicalAssociation, vol. 295, no. 6, pp. 676–680, 2006.
[27] E. Zintzaras and J. P. A. Ioannidis, “HEGESMA: genome searchmeta-analysis and heterogeneity testing,”Bioinformatics, vol. 21,no. 18, pp. 3672–3673, 2005.
[28] Y. Y. Liu, J. L. Zhang, Y. H. Li et al., “Detection of CCNA1 genemethylation in Uyghur women with cervical cancer,” Maternaland Child Health Care of China, vol. 28, no. 11, pp. 1791–1792,2013.
[29] A. L. B. Longo,M.M. Rettori, A. C. De Carvalho, L. P. Kowalski,A. L. Carvalho, andA. L.Vettore, “Evaluation of themethylationprofile of exfoliated cell samples from patients with head andneck squamous cell carcinoma,” Head and Neck, vol. 36, no. 5,pp. 631–637, 2014.
[30] S. Lim and P. Kaldis, “Cdks, cyclins and CKIs: roles beyond cellcycle regulation,” Development, vol. 140, no. 15, pp. 3079–3093,2013.
[31] M. S. Von Bergwelt-Baildon, E. Kondo, N. Klein-Gonzlez, andC. M. Wendtner, “The cyclins: a family of widely expressedtumor antigens?” Expert Review of Vaccines, vol. 10, no. 3, pp.389–395, 2011.

12 BioMed Research International
[32] C. H. Yam, T. K. Fung, and R. Y. C. Poon, “Cyclin A in cell cyclecontrol and cancer,”Cellular andMolecular Life Sciences, vol. 59,no. 8, pp. 1317–1326, 2002.
[33] R. Qi, H. An, Y. Yu et al., “Notch1 signaling inhibits growthof human hepatocellular carcinoma through induction of cellcycle arrest and apoptosis,” Cancer Research, vol. 63, no. 23, pp.8323–8329, 2003.
[34] H. Ma, J. Chen, S. Pan et al., “Potentially functional polymor-phisms in cell cycle genes and the survival of non-small cell lungcancer in a Chinese population,” Lung Cancer, vol. 73, no. 1, pp.32–37, 2011.
[35] J. Kim, W.-J. Kim, Z. Liu, M. F. Loda, and M. R. Freeman, “Theubiquitin-specific protease USP2a enhances tumor progressionby targeting cyclin A1 in bladder cancer,” Cell Cycle, vol. 11, no.6, pp. 1123–1130, 2012.
[36] M. M. Rettori, A. C. de Carvalho, A. L. B. Longo et al., “TIMP3and CCNA1 hypermethylation in HNSCC is associated withan increased incidence of second primary tumors,” Journal ofTranslational Medicine, vol. 11, no. 1, article 316, 2013.

Submit your manuscripts athttp://www.hindawi.com
Hindawi Publishing Corporationhttp://www.hindawi.com Volume 2014
Anatomy Research International
PeptidesInternational Journal of
Hindawi Publishing Corporationhttp://www.hindawi.com Volume 2014
Hindawi Publishing Corporation http://www.hindawi.com
International Journal of
Volume 2014
Zoology
Hindawi Publishing Corporationhttp://www.hindawi.com Volume 2014
Molecular Biology International
GenomicsInternational Journal of
Hindawi Publishing Corporationhttp://www.hindawi.com Volume 2014
The Scientific World JournalHindawi Publishing Corporation http://www.hindawi.com Volume 2014
Hindawi Publishing Corporationhttp://www.hindawi.com Volume 2014
BioinformaticsAdvances in
Marine BiologyJournal of
Hindawi Publishing Corporationhttp://www.hindawi.com Volume 2014
Hindawi Publishing Corporationhttp://www.hindawi.com Volume 2014
Signal TransductionJournal of
Hindawi Publishing Corporationhttp://www.hindawi.com Volume 2014
BioMed Research International
Evolutionary BiologyInternational Journal of
Hindawi Publishing Corporationhttp://www.hindawi.com Volume 2014
Hindawi Publishing Corporationhttp://www.hindawi.com Volume 2014
Biochemistry Research International
ArchaeaHindawi Publishing Corporationhttp://www.hindawi.com Volume 2014
Hindawi Publishing Corporationhttp://www.hindawi.com Volume 2014
Genetics Research International
Hindawi Publishing Corporationhttp://www.hindawi.com Volume 2014
Advances in
Virolog y
Hindawi Publishing Corporationhttp://www.hindawi.com
Nucleic AcidsJournal of
Volume 2014
Stem CellsInternational
Hindawi Publishing Corporationhttp://www.hindawi.com Volume 2014
Hindawi Publishing Corporationhttp://www.hindawi.com Volume 2014
Enzyme Research
Hindawi Publishing Corporationhttp://www.hindawi.com Volume 2014
International Journal of
Microbiology