review draft prioritization of brine shrimp and … review draft prioritization of brine shrimp and...
TRANSCRIPT

1
Review Draft
Prioritization of Brine Shrimp and
Brine Fly Bioassay Test Pollutants for Gilbert Bay, Great Salt Lake, Utah
July 10, 2013
Problem Statement: The Utah Division of Water Quality (Division) intends to derive water
quality criteria specific to the Great Salt Lake in accordance with the draft Great Salt Lake Water Quality
Strategy (DWQ, 2012). In support of these efforts, the Division is implementing a grant from the Utah
Water Quality Board to conduct toxicity testing on brine flies and brine shrimp. Because resources are
limited, the top pollutants need to be prioritized for additional testing and research.
Conclusion: Pollutants are recommended to be evaluated in the following order of priority:
arsenic, copper, methylmercury, and lead. The prioritization of ammonia, cadmium, total mercury,
selenium, thallium, and zinc and the remaining priority pollutants is deferred.
Background At the request of the Great Salt Lake Advisory Council, the Division received a grant from the Utah
Water Quality Board to conduct bioassays (specifically toxicity testing) using brine shrimp and brine flies
as test organisms. This testing is identified as a critical step in deriving numeric criteria in the Great Salt
Lake Water Quality Strategy, Strategy for Developing Numeric Criteria (DWQ, 2012). The testing will also
provide data useful for setting Utah Pollution Discharge Elimination System permit effluent limits and
assessing water quality.
Methods In 2011, the Division commenced analyzing samples collected from Gilbert, Farmington and Bear River
Bay, twice per year. One intended use of the data generated by these efforts was to prioritize pollutants
for bioassay testing. Although additional data from the past 10-15 years is available, this data was not
used pending validation. Great Salt Lake water is prone to causing analytical interferences and historical
analytical data should be validated prior to using. The pedigree of the 2011-2012 data is known and is
representative of current conditions.
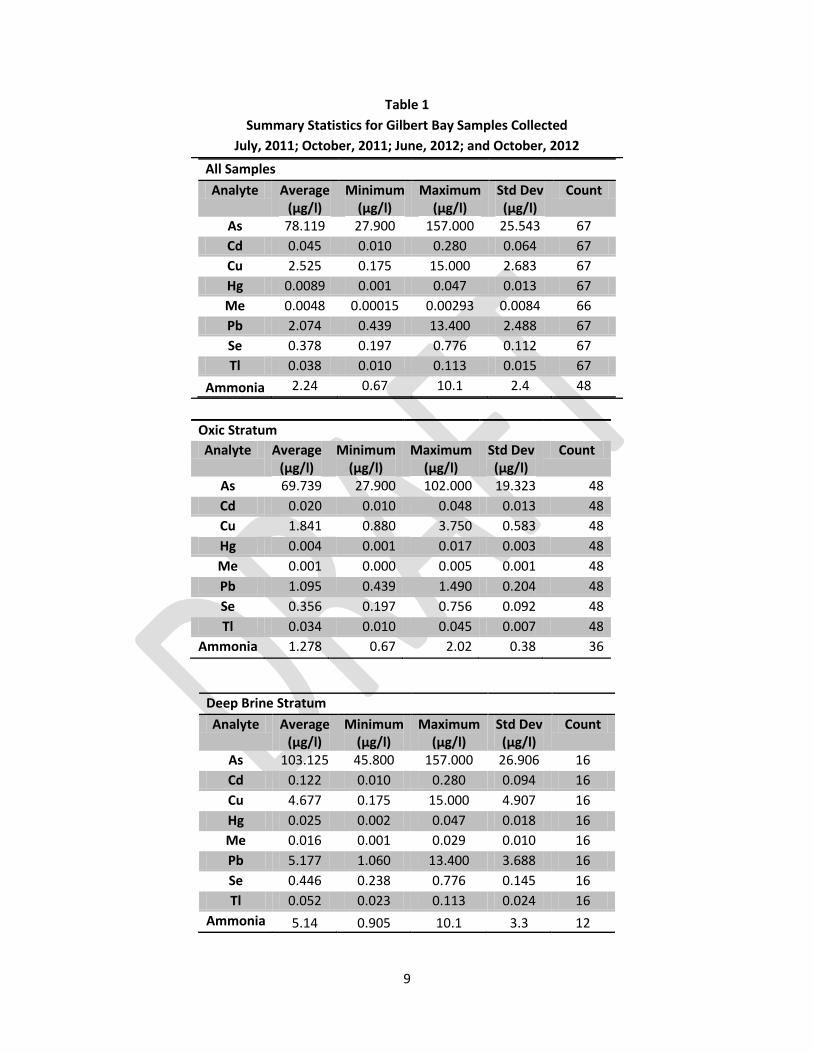
Table 1 shows the summary statistics for the 2011-2012 monitoring. Target analytes for the 2011-2012
monitoring included total arsenic, cadmium, copper, lead, mercury, selenium, thallium, ammonia, and
dissolved methylmercury. At each monitoring location (Figure 1), samples were collected 1 meter from
the surface and 1 meter from the bottom of the water column. At some locations, a chemocline was
present and the bottom sample was collected from the denser stratum commonly referred to as the
deep brine layer. The concentrations of some analytes increased markedly in the deep brine stratum.
The deep brine stratum is inhospitable to brine shrimp and brine flies because of the higher salinity and
low dissolved oxygen. Therefore, the concentrations measured in the deep brine layer are not
representative of potential exposures to brine flies and brine shrimp. Although brine flies and brine
shrimp are not exposed to the pollutant concentrations in the deep brine stratum, some mixing of the
2
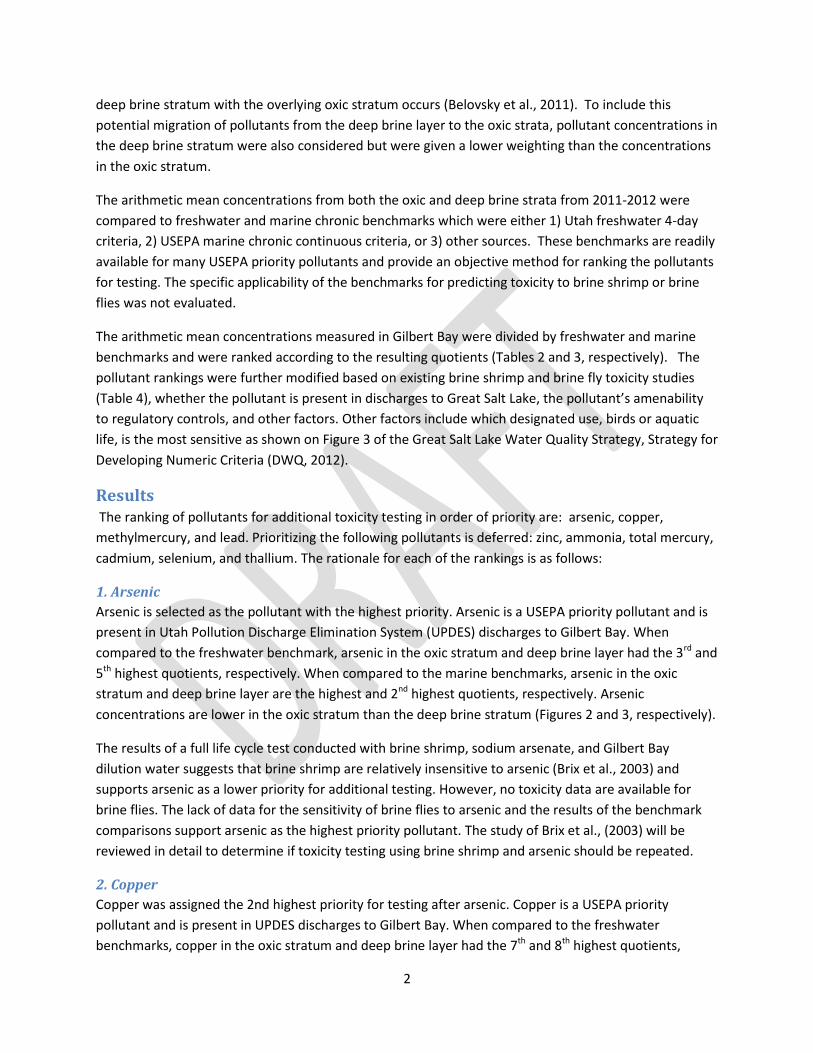
deep brine stratum with the overlying oxic stratum occurs (Belovsky et al., 2011). To include this
potential migration of pollutants from the deep brine layer to the oxic strata, pollutant concentrations in
the deep brine stratum were also considered but were given a lower weighting than the concentrations
in the oxic stratum.
The arithmetic mean concentrations from both the oxic and deep brine strata from 2011-2012 were
compared to freshwater and marine chronic benchmarks which were either 1) Utah freshwater 4-day
criteria, 2) USEPA marine chronic continuous criteria, or 3) other sources. These benchmarks are readily
available for many USEPA priority pollutants and provide an objective method for ranking the pollutants
for testing. The specific applicability of the benchmarks for predicting toxicity to brine shrimp or brine
flies was not evaluated.
The arithmetic mean concentrations measured in Gilbert Bay were divided by freshwater and marine
benchmarks and were ranked according to the resulting quotients (Tables 2 and 3, respectively). The
pollutant rankings were further modified based on existing brine shrimp and brine fly toxicity studies
(Table 4), whether the pollutant is present in discharges to Great Salt Lake, the pollutant’s amenability
to regulatory controls, and other factors. Other factors include which designated use, birds or aquatic
life, is the most sensitive as shown on Figure 3 of the Great Salt Lake Water Quality Strategy, Strategy for
Developing Numeric Criteria (DWQ, 2012).
Results The ranking of pollutants for additional toxicity testing in order of priority are: arsenic, copper,
methylmercury, and lead. Prioritizing the following pollutants is deferred: zinc, ammonia, total mercury,
cadmium, selenium, and thallium. The rationale for each of the rankings is as follows:
1. Arsenic
Arsenic is selected as the pollutant with the highest priority. Arsenic is a USEPA priority pollutant and is
present in Utah Pollution Discharge Elimination System (UPDES) discharges to Gilbert Bay. When
compared to the freshwater benchmark, arsenic in the oxic stratum and deep brine layer had the 3rd and
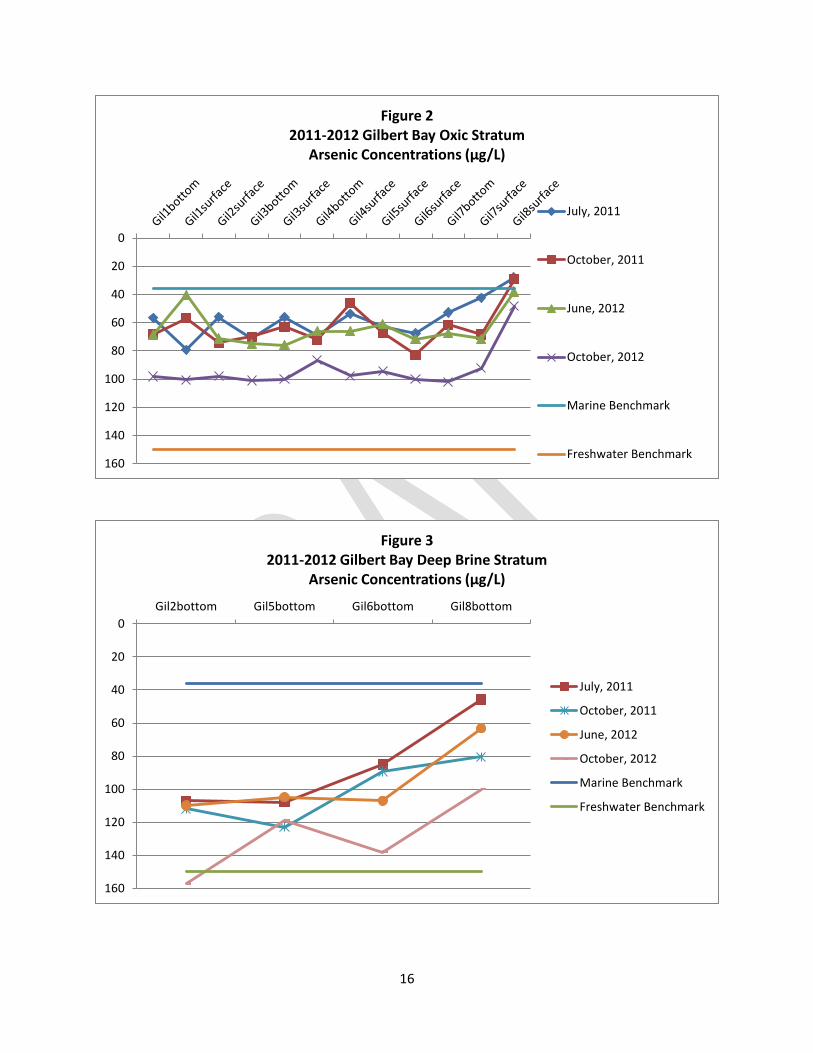
5th highest quotients, respectively. When compared to the marine benchmarks, arsenic in the oxic
stratum and deep brine layer are the highest and 2nd highest quotients, respectively. Arsenic
concentrations are lower in the oxic stratum than the deep brine stratum (Figures 2 and 3, respectively).
The results of a full life cycle test conducted with brine shrimp, sodium arsenate, and Gilbert Bay
dilution water suggests that brine shrimp are relatively insensitive to arsenic (Brix et al., 2003) and
supports arsenic as a lower priority for additional testing. However, no toxicity data are available for
brine flies. The lack of data for the sensitivity of brine flies to arsenic and the results of the benchmark
comparisons support arsenic as the highest priority pollutant. The study of Brix et al., (2003) will be
reviewed in detail to determine if toxicity testing using brine shrimp and arsenic should be repeated.
2. Copper
Copper was assigned the 2nd highest priority for testing after arsenic. Copper is a USEPA priority
pollutant and is present in UPDES discharges to Gilbert Bay. When compared to the freshwater
benchmarks, copper in the oxic stratum and deep brine layer had the 7th and 8th highest quotients,

3
respectively. When compared to the marine benchmarks, copper had the third highest quotients for
both the oxic and deep brine strata. Copper concentrations are lower in the oxic stratum than in the
deep brine stratum (Figures 4 and 5, respectively).
Brix et al., (2006) measured an EC50 (concentration at which 50% of the test population showed a
reduction in hatching success) for Great Salt Lake brine shrimp exposed to copper. The EC50 with
laboratory dilution was 12 µg/l and 68 µg/l when Great Salt Lake was the source of the dilution water.
These EC50s support that the site-specific chemistry of Gilbert Bay water decreases the observed toxicity
of copper when compared to laboratory water. However, no data were available for brine flies and an
EC50 is not optimal for deriving chronic numeric criteria. These factors result in copper being the 2nd
highest priority.
3. Methylmercury
Methylmercury is recommended as the 3rd highest priority. Total mercury, which includes
methylmercury, is a USEPA priority pollutant. UPDES discharges to Gilbert Bay contain trace
concentrations of mercury measured in parts per trillion (ppt). However, about 80%, of the mercury in
Great Salt Lake is from air deposition (Naftz et al., 2009). Some of this mercury is changed into
methylmercury by the microbes in Great Salt Lake.
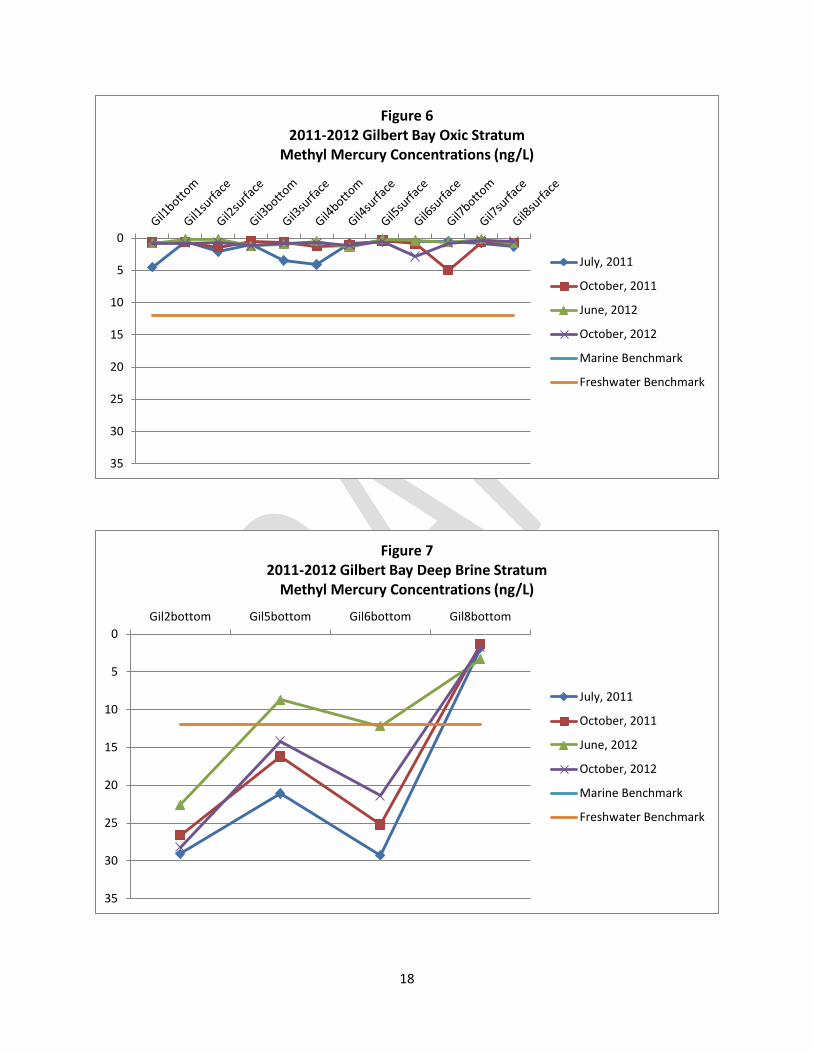
Methylmercury concentrations increased by 15 times from the oxic stratum to the deep brine stratum
(Figures 6 and 7, respectively). Methylmercury is readily absorbed by aquatic organisms resulting in
biomagnification between trophic levels that often results in the higher trophic levels having the highest
exposures.
Some of the mercury analytical results for the 2011-2012 are anomalous. Specifically, for several
samples the concentrations of methylmercury exceeded total mercury concentrations. Total mercury
includes methylmercury, so methylmercury concentrations should never exceed total mercury. These
data met all of the analytical quality controls and were not qualified. The mean concentration in the
oxic layer from the 2011-2012 data was 0.001 µg/l. This concentration is consistent with those
measured by Wurtsbaugh et al. (2011) and Naftz et al. (2011) suggesting the outliers in the 2011-2012
data set do not adversely affect the representativeness of the mean.
When compared to the freshwater benchmark, methylmercury in the oxic and deep brine layer have the
4th highest and highest quotients, respectively. The freshwater benchmark, based on the protection of
aquatic life, is not a USEPA or Utah numeric criterion. Utah does not have a methylmercury criterion and
the USEPA criterion is a fish tissue concentration based on human health. The comparison value used is
for protection of aquatic life based on a database that included fish, daphnids, and algae (LANL, 2013).
No benchmarks specific to marine waters were identified.
In other aquatic systems such as the Great Lakes, biomagnification of methylmercury resulted in the
criteria being based on protection of birds (USEPA, 1995). If birds are more sensitive than the brine
shrimp and brine flies, methylmercury may be a lower priority for toxicity testing on brine shrimp and
brine flies. However, no toxicity data for brine flies or brine shrimp are available and the bird exposures
are still being evaluated. Therefore, methylmercury is recommended for additional testing as the 3rd

4
highest priority. Methylmercury was not prioritized higher because the dominant and uncontrollable
source of mercury to Great Salt Lake is air deposition and there are no significant UPDES discharges of
mercury.
4. Lead
Lead is a USEPA priority pollutant, is a pollutant in UPDES discharges to Gilbert Bay, and is
recommended as the 4th highest priority. Lead concentrations increased by a factor of 5 between the
oxic stratum and the deep brine stratum (Figures 8 and 9, respectively). When Gilbert Bay mean
concentrations for the oxic stratum and deep brine stratum were compared to the freshwater
benchmark, lead was ranked 8th and 6th, respectively. When the mean concentrations were compared
to the marine benchmark, lead was ranked the fourth highest. In a test using San Francisco Bay brine
shrimp, Gajbhiye and Hirota (1990) ranked lead higher in toxicity when compared to cadmium, copper,
nickel, zinc, and manganese. No toxicity tests with Great Salt Lake biota are available. Therefore, lead is
recommended as the 4th highest priority for testing with brine shrimp and brine flies.
Ammonia (deferred)
Ammonia is a USEPA priority pollutant but UPDES discharges to Gilbert Bay do not include ammonia.
Ammonia concentrations increased by a factor of 4 between the oxic stratum and the deep brine
stratum (Figures 10 and 11, respectively).
When compared to the freshwater benchmark, ammonia in the oxic stratum and deep brine layer had
the 2nd highest quotients. When compared to the marine benchmark, ammonia in the oxic stratum and
deep brine layer had the 2nd highest and highest quotient, respectively. No toxicity tests are available
for ammonia on Great Salt Lake brine shrimp and brine flies.
The prioritization of ammonia is deferred for two reasons. First, an ammonia criterion is not a high
priority for Gilbert Bay because ammonia is not a pollutant in UPDES discharges. The source of some or
most of the ammonia may be the brine shrimp and brine flies and elevated ammonia concentrations are
common in terminal lakes (Belovsky et al., 2011). The second reason is uncertainties regarding the
concentrations of ammonia. Unpublished ammonia results for monthly samples collected by the
Artemia Association between June 2012 and June 2013 were compared to the concentrations in Table 1.
The Artemia Association results were lower than the Division’s results. The minimum and maximum
ammonia concentrations measured in Artemia Association samples for the oxic stratum were 0.01 and
0.35 mg/l, respectively whereas the minimum and maximum observed in the Division’s samples were
0.67 and 2.2 mg/l (Table 1). The discrepancy between the Division and Artemia Association results are
due to natural variability in ammonia concentrations or analytical error. In either case, the
representativeness or accuracy of the Division is uncertain and will require additional sampling to
determine the source(s) of the discrepancies. Prioritization of ammonia is deferred pending more data.
Zinc (deferred)
Zinc is a USEPA priority pollutant but was not a target analyte for the 2011 and 2012 sampling. Zinc is
present in UPDES discharges to Gilbert Bay. Analytical data from the Division’s Bluefish Database
indicate that the mean concentration in Gilbert Bay is 3 µg/l. Utah’s 4-hour freshwater criterion is 120
5
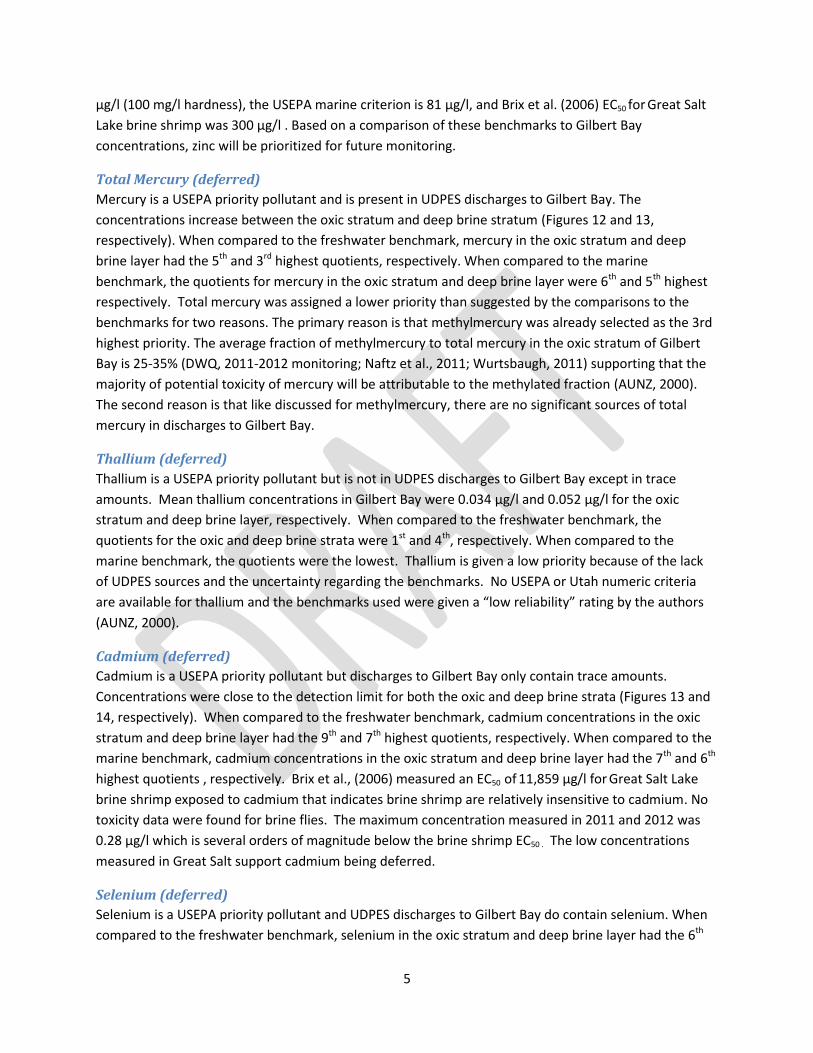
µg/l (100 mg/l hardness), the USEPA marine criterion is 81 µg/l, and Brix et al. (2006) EC50 for Great Salt
Lake brine shrimp was 300 µg/l . Based on a comparison of these benchmarks to Gilbert Bay
concentrations, zinc will be prioritized for future monitoring.
Total Mercury (deferred)
Mercury is a USEPA priority pollutant and is present in UDPES discharges to Gilbert Bay. The
concentrations increase between the oxic stratum and deep brine stratum (Figures 12 and 13,
respectively). When compared to the freshwater benchmark, mercury in the oxic stratum and deep
brine layer had the 5th and 3rd highest quotients, respectively. When compared to the marine
benchmark, the quotients for mercury in the oxic stratum and deep brine layer were 6th and 5th highest
respectively. Total mercury was assigned a lower priority than suggested by the comparisons to the
benchmarks for two reasons. The primary reason is that methylmercury was already selected as the 3rd
highest priority. The average fraction of methylmercury to total mercury in the oxic stratum of Gilbert
Bay is 25-35% (DWQ, 2011-2012 monitoring; Naftz et al., 2011; Wurtsbaugh, 2011) supporting that the
majority of potential toxicity of mercury will be attributable to the methylated fraction (AUNZ, 2000).
The second reason is that like discussed for methylmercury, there are no significant sources of total
mercury in discharges to Gilbert Bay.
Thallium (deferred)
Thallium is a USEPA priority pollutant but is not in UDPES discharges to Gilbert Bay except in trace
amounts. Mean thallium concentrations in Gilbert Bay were 0.034 µg/l and 0.052 µg/l for the oxic
stratum and deep brine layer, respectively. When compared to the freshwater benchmark, the
quotients for the oxic and deep brine strata were 1st and 4th, respectively. When compared to the
marine benchmark, the quotients were the lowest. Thallium is given a low priority because of the lack
of UDPES sources and the uncertainty regarding the benchmarks. No USEPA or Utah numeric criteria
are available for thallium and the benchmarks used were given a “low reliability” rating by the authors
(AUNZ, 2000).
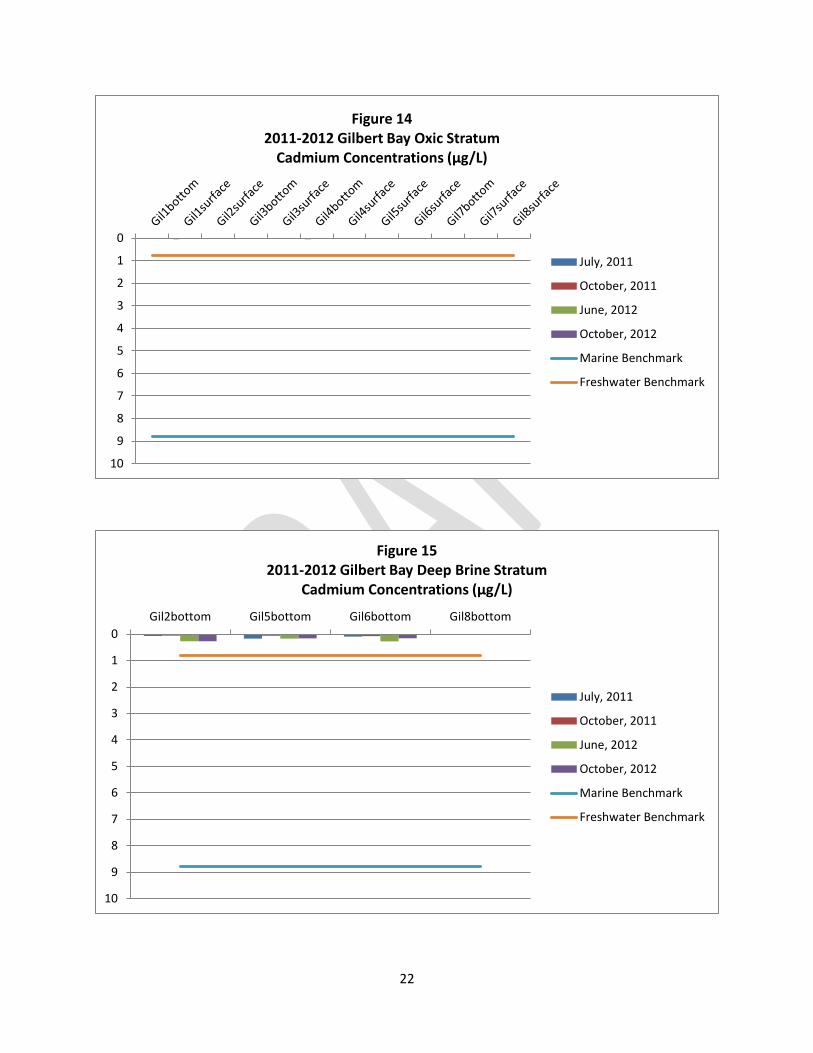
Cadmium (deferred)
Cadmium is a USEPA priority pollutant but discharges to Gilbert Bay only contain trace amounts.
Concentrations were close to the detection limit for both the oxic and deep brine strata (Figures 13 and
14, respectively). When compared to the freshwater benchmark, cadmium concentrations in the oxic
stratum and deep brine layer had the 9th and 7th highest quotients, respectively. When compared to the
marine benchmark, cadmium concentrations in the oxic stratum and deep brine layer had the 7th and 6th
highest quotients , respectively. Brix et al., (2006) measured an EC50 of 11,859 µg/l for Great Salt Lake
brine shrimp exposed to cadmium that indicates brine shrimp are relatively insensitive to cadmium. No
toxicity data were found for brine flies. The maximum concentration measured in 2011 and 2012 was
0.28 µg/l which is several orders of magnitude below the brine shrimp EC50 . The low concentrations
measured in Great Salt support cadmium being deferred.
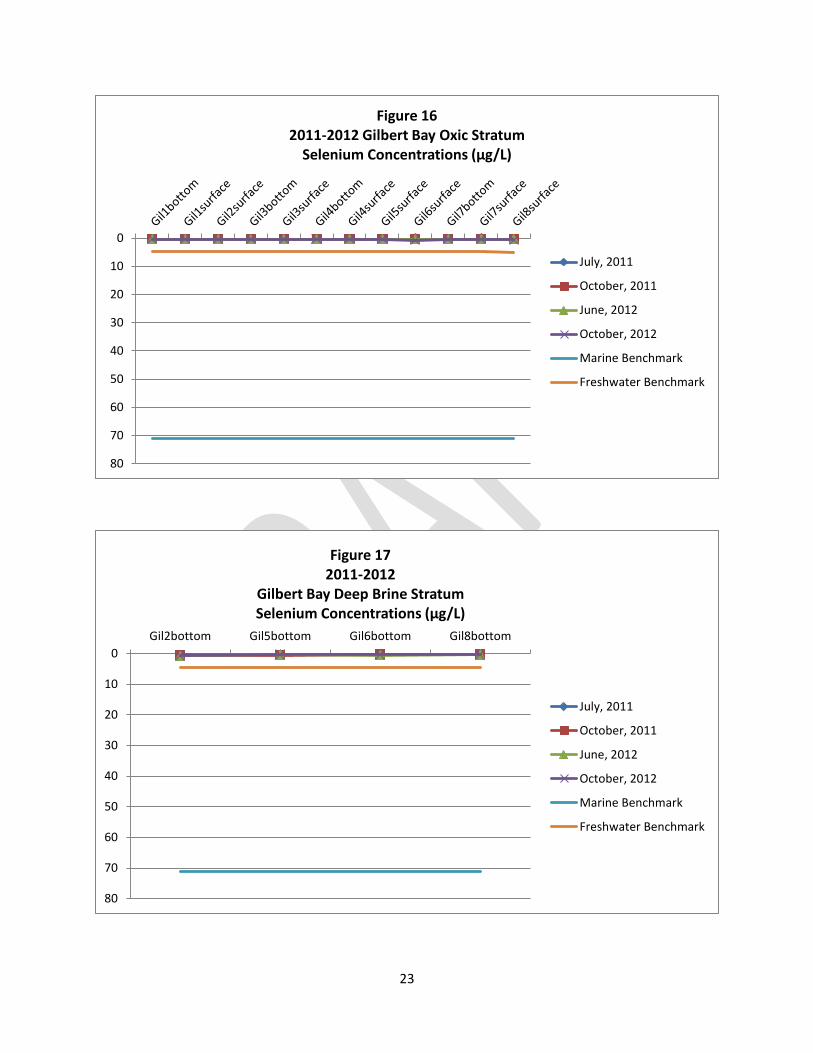
Selenium (deferred)
Selenium is a USEPA priority pollutant and UDPES discharges to Gilbert Bay do contain selenium. When
compared to the freshwater benchmark, selenium in the oxic stratum and deep brine layer had the 6th

6
and 9th (of 9) quotients, respectively. When compared to the marine benchmarks, selenium in the oxic
stratum and deep brine layer had the 5th and 7th highest quotients of 8, respectively.
Gilbert Bay has a numeric criterion based on bird egg tissue because bird reproduction was determined
to be the most sensitive toxic endpoint for selenium (DWQ, 2008). Brix et al., (2004) conducted acute
tests on selenate with brine shrimp, brine flies, and algae. Of the three organisms, brine shrimp were
the most sensitive, followed by the algae, and then brine flies. Therefore, additional testing for
selenium is a low priority.
7
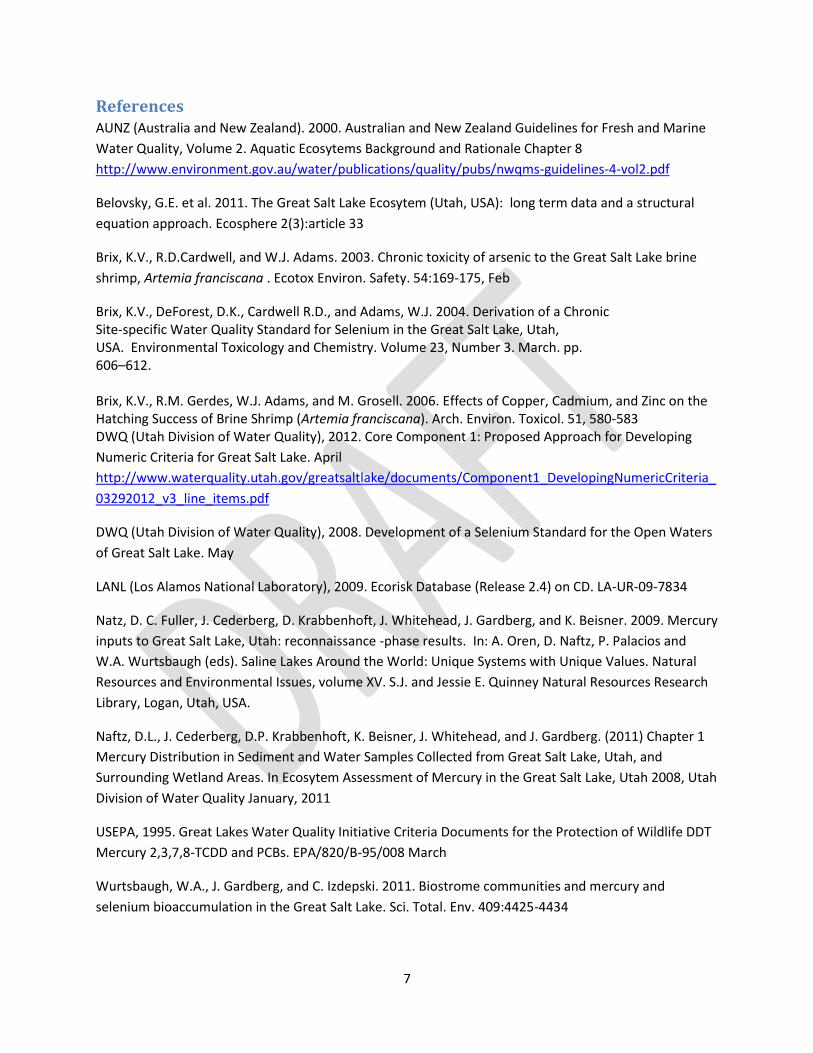
References AUNZ (Australia and New Zealand). 2000. Australian and New Zealand Guidelines for Fresh and Marine
Water Quality, Volume 2. Aquatic Ecosytems Background and Rationale Chapter 8
http://www.environment.gov.au/water/publications/quality/pubs/nwqms-guidelines-4-vol2.pdf
Belovsky, G.E. et al. 2011. The Great Salt Lake Ecosytem (Utah, USA): long term data and a structural
equation approach. Ecosphere 2(3):article 33
Brix, K.V., R.D.Cardwell, and W.J. Adams. 2003. Chronic toxicity of arsenic to the Great Salt Lake brine
shrimp, Artemia franciscana . Ecotox Environ. Safety. 54:169-175, Feb
Brix, K.V., DeForest, D.K., Cardwell R.D., and Adams, W.J. 2004. Derivation of a Chronic Site-specific Water Quality Standard for Selenium in the Great Salt Lake, Utah, USA. Environmental Toxicology and Chemistry. Volume 23, Number 3. March. pp. 606–612. Brix, K.V., R.M. Gerdes, W.J. Adams, and M. Grosell. 2006. Effects of Copper, Cadmium, and Zinc on the Hatching Success of Brine Shrimp (Artemia franciscana). Arch. Environ. Toxicol. 51, 580-583 DWQ (Utah Division of Water Quality), 2012. Core Component 1: Proposed Approach for Developing
Numeric Criteria for Great Salt Lake. April
http://www.waterquality.utah.gov/greatsaltlake/documents/Component1_DevelopingNumericCriteria_
03292012_v3_line_items.pdf
DWQ (Utah Division of Water Quality), 2008. Development of a Selenium Standard for the Open Waters
of Great Salt Lake. May
LANL (Los Alamos National Laboratory), 2009. Ecorisk Database (Release 2.4) on CD. LA-UR-09-7834
Natz, D. C. Fuller, J. Cederberg, D. Krabbenhoft, J. Whitehead, J. Gardberg, and K. Beisner. 2009. Mercury
inputs to Great Salt Lake, Utah: reconnaissance -phase results. In: A. Oren, D. Naftz, P. Palacios and
W.A. Wurtsbaugh (eds). Saline Lakes Around the World: Unique Systems with Unique Values. Natural
Resources and Environmental Issues, volume XV. S.J. and Jessie E. Quinney Natural Resources Research
Library, Logan, Utah, USA.
Naftz, D.L., J. Cederberg, D.P. Krabbenhoft, K. Beisner, J. Whitehead, and J. Gardberg. (2011) Chapter 1
Mercury Distribution in Sediment and Water Samples Collected from Great Salt Lake, Utah, and
Surrounding Wetland Areas. In Ecosytem Assessment of Mercury in the Great Salt Lake, Utah 2008, Utah
Division of Water Quality January, 2011
USEPA, 1995. Great Lakes Water Quality Initiative Criteria Documents for the Protection of Wildlife DDT
Mercury 2,3,7,8-TCDD and PCBs. EPA/820/B-95/008 March
Wurtsbaugh, W.A., J. Gardberg, and C. Izdepski. 2011. Biostrome communities and mercury and
selenium bioaccumulation in the Great Salt Lake. Sci. Total. Env. 409:4425-4434

8
TABLES and FIGURES
9
Table 1
Summary Statistics for Gilbert Bay Samples Collected
July, 2011; October, 2011; June, 2012; and October, 2012
All Samples
Analyte Average (µg/l)
Minimum (µg/l)
Maximum (µg/l)
Std Dev (µg/l)
Count
As 78.119 27.900 157.000 25.543 67
Cd 0.045 0.010 0.280 0.064 67
Cu 2.525 0.175 15.000 2.683 67
Hg 0.0089 0.001 0.047 0.013 67
Me 0.0048 0.00015 0.00293 0.0084 66
Pb 2.074 0.439 13.400 2.488 67
Se 0.378 0.197 0.776 0.112 67
Tl 0.038 0.010 0.113 0.015 67
Ammonia 2.24 0.67 10.1 2.4 48
Oxic Stratum
Analyte Average (µg/l)
Minimum (µg/l)
Maximum (µg/l)
Std Dev (µg/l)
Count
As 69.739 27.900 102.000 19.323 48
Cd 0.020 0.010 0.048 0.013 48
Cu 1.841 0.880 3.750 0.583 48
Hg 0.004 0.001 0.017 0.003 48
Me 0.001 0.000 0.005 0.001 48
Pb 1.095 0.439 1.490 0.204 48
Se 0.356 0.197 0.756 0.092 48
Tl 0.034 0.010 0.045 0.007 48
Ammonia 1.278 0.67 2.02 0.38 36
Deep Brine Stratum
Analyte Average (µg/l)
Minimum (µg/l)
Maximum (µg/l)
Std Dev (µg/l)
Count
As 103.125 45.800 157.000 26.906 16
Cd 0.122 0.010 0.280 0.094 16
Cu 4.677 0.175 15.000 4.907 16
Hg 0.025 0.002 0.047 0.018 16
Me 0.016 0.001 0.029 0.010 16
Pb 5.177 1.060 13.400 3.688 16
Se 0.446 0.238 0.776 0.145 16
Tl 0.052 0.023 0.113 0.024 16
Ammonia 5.14 0.905 10.1 3.3 12

10
Table 2 Comparison of Gilbert Bay Mean Concentrations from 2011-2012 to
Freshwater Benchmarks
Rank Analyte Mean, oxic stratum
(µg/l)
Chronic Benchmark
(µg/l)
Ref. Ratio
1 Tl 0.034 18 2 0.002
2 Ammonia 1.278 2.21 1 0.6
3 As 69.739 150 1 0.5
4 MeHg 0.001 0.0028 2 0
5 Hg 0.004 0.012 1 0.3
6 Se 0.356 4.6 1 0.08
7 Cu 1.841 30.5 1 0.06
8 Pb 1.095 18.6 1 0.06
9 Cd 0.020 0.76 1 0.03
Rank Analyte Mean, deep brine
stratum (µg/l)
Chronic Benchmark
(µg/l)
Ref. Ratio
1 MeHg 0.016 0.0028 2 6 2 Ammonia 5.14 2.21 1 2 3 Hg 0.025 0.012 1 2 4 Tl 0.052 0.03 5 2 5 As 103.125 150 1 0.7 6 Pb 5.177 18.6 1 0.3 7 Cd 0.122 0.76 1 0.2 8 Cu 4.677 30.5 1 0.2 9 Se 0.446 4.6 1 0.1
Notes: 1: Utah (freshwater) 4-day criterion, adjusted to 400 mg/l hardness when appropriate. Ammonia benchmark based on pH of 8 and temperature 18˚C 2: LANL, 2009 Tier II value for protection of aquatic life communities 5: Australian and New Zealand Guidelines for Fresh and Marine Water Quality, Volume 2. 2000. http://www.environment.gov.au/water/publications/quality/pubs/nwqms-guidelines-4-vol2.pdf

11
Table 3 Comparison of Gilbert Bay Mean Concentrations from 2011-2012 to Marine
Benchmarks
Rank Analyte Mean, oxic stratum
(µg/l)
Chronic Benchmark
(µg/l)
Ref. Ratio
1 As 69.739 36 3 2
2 Ammonia 1.278 1.6 3 0.8
3 Cu 1.841 3.1 3 0.6
4 Pb 1.095 8.1 3 0.1
5 Se 0.356 71 3 0.01
6 Hg 0.004 0.94 3 0.004
7 Cd 0.020 8.8 3 0.002
8 Tl 0.034 17 4 0.002
Rank Analyte Mean, deep brine stratum
(µg/l)
Chronic Benchmark
(µg/l)
Ref. Ratio
1 Ammonia 5.14 1.6 3 3
2 As 103.125 36 3 3
3 Cu 4.677 3.1 3 2
4 Pb 5.177 8.1 3 0.6
5 Hg 0.025 0.94 3 0.03 6 Cd 0.122 8.8 3 0.01
7 Se 0.446 71 3 0.01
8 Tl 0.052 17 4 0.003
Notes: 2: LANL, 2009 Tier II value for protection of aquatic life communities 3-USEPA 4-day marine criteria, Ammonia benchmark based on pH of 8 and temperature 18˚C 4: Australian and New Zealand Guidelines for Fresh and Marine Water Quality, Volume 2. 2000. http://www.environment.gov.au/water/publications/quality/pubs/nwqms-guidelines-4-vol2.pdf
12
Table 4 Existing Toxicity Studies for Great Salt Lake, Utah
Reference Test Organism
Pollutants Notes
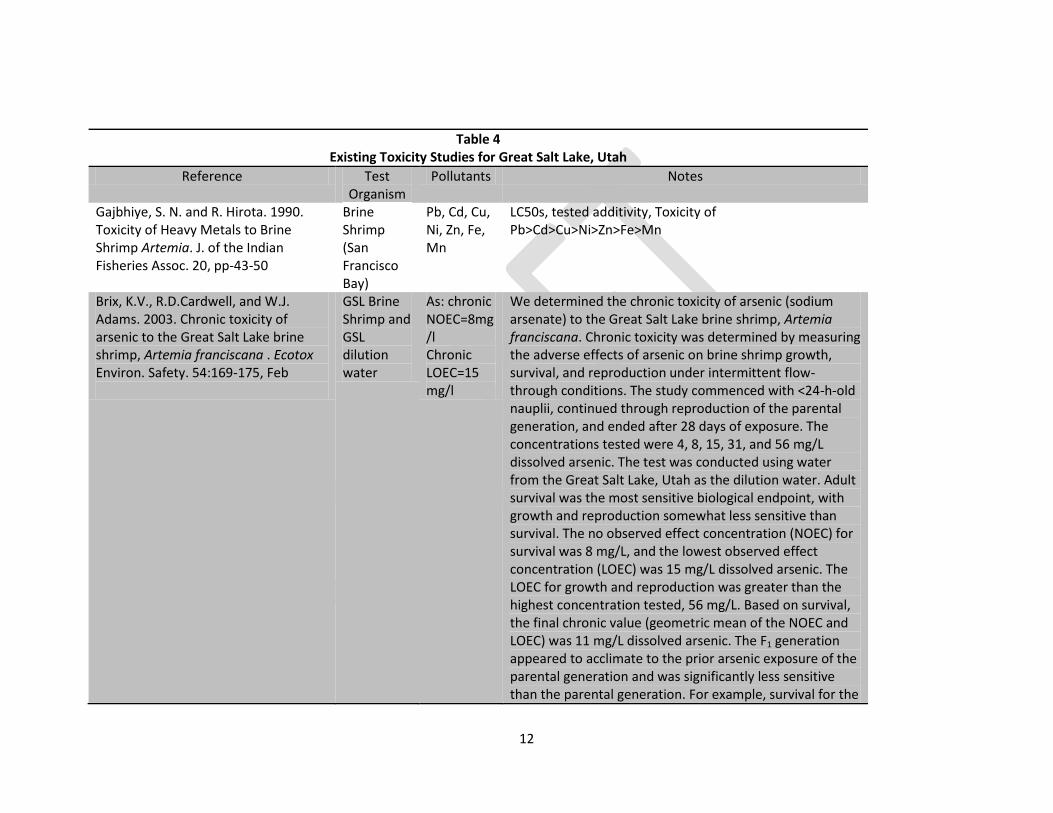
Gajbhiye, S. N. and R. Hirota. 1990. Toxicity of Heavy Metals to Brine Shrimp Artemia. J. of the Indian Fisheries Assoc. 20, pp-43-50
Brine Shrimp (San Francisco Bay)
Pb, Cd, Cu, Ni, Zn, Fe, Mn
LC50s, tested additivity, Toxicity of Pb>Cd>Cu>Ni>Zn>Fe>Mn
Brix, K.V., R.D.Cardwell, and W.J. Adams. 2003. Chronic toxicity of arsenic to the Great Salt Lake brine shrimp, Artemia franciscana . Ecotox Environ. Safety. 54:169-175, Feb
GSL Brine Shrimp and GSL dilution water
As: chronic NOEC=8mg/l Chronic LOEC=15 mg/l
We determined the chronic toxicity of arsenic (sodium arsenate) to the Great Salt Lake brine shrimp, Artemia franciscana. Chronic toxicity was determined by measuring the adverse effects of arsenic on brine shrimp growth, survival, and reproduction under intermittent flow-through conditions. The study commenced with <24-h-old nauplii, continued through reproduction of the parental generation, and ended after 28 days of exposure. The concentrations tested were 4, 8, 15, 31, and 56 mg/L dissolved arsenic. The test was conducted using water from the Great Salt Lake, Utah as the dilution water. Adult survival was the most sensitive biological endpoint, with growth and reproduction somewhat less sensitive than survival. The no observed effect concentration (NOEC) for survival was 8 mg/L, and the lowest observed effect concentration (LOEC) was 15 mg/L dissolved arsenic. The LOEC for growth and reproduction was greater than the highest concentration tested, 56 mg/L. Based on survival, the final chronic value (geometric mean of the NOEC and LOEC) was 11 mg/L dissolved arsenic. The F1 generation appeared to acclimate to the prior arsenic exposure of the parental generation and was significantly less sensitive than the parental generation. For example, survival for the

13
F1 generation through day 12 was 100% in 56 mg/L dissolved arsenic, compared to 26% for the parental generation. Growth of the F1 generation was significantly less than that of the parental generation across all concentrations including the control, indicating a generational difference in brine shrimp growth rather than an arsenic effect. This study represents one of the few full life cycle toxicity tests conducted with brine shrimp.
Brix, K.V., R.M. Gerdes, W.J. Adams, and M. Grosell. 2006. Effects of Copper, Cadmium, and Zinc on the Hatching Success of Brine Shrimp (Artemia franciscana). Arch. Environ. Toxicol. 51, 580-583
GSL Brine Shrimp
Cu: EC50=12 ug/l (lab); EC50 GSL=68 ug/l Cd: EC50=11,859 (lab) ug/l Zn: EC50=289 (lab) ug/l
Hatching success measured.
Forsythe II, B.L. and S.J.Klaine. 1994. The interaction of sulfate and selenate (Se+6) effects on brine shrimp, Artemia SPP. Chemosphere Vol. 29, Issue 4, 789-800
San Joaquin Brine Shrimp
Se Sulfate has been shown to be antagonistic to selenate toxicity in aquatic organisms. Brine Shrimp, Artemia spp., flourish in evaporation ponds of the San Joaquin Valley which have selenium concentrations between 1 and 6,000 μg/l. The salinity is dominated by Na2SO4 rather than NaCl in these ponds. Brine shrimp raised in artificial seawater at 25°C exhibited a 96h LC50 of 0.006 mg/l selenate with sulfate levels at 0.05 mg/l. The LC50 for those in waters containing 14,000 mg/l sulfate was 81.97 mg/l selenate. Developmental assay results indicated that selenate had no effect on emergence or hatching of brine shrimp regardless of the sulfate concentration. However, selenate
14
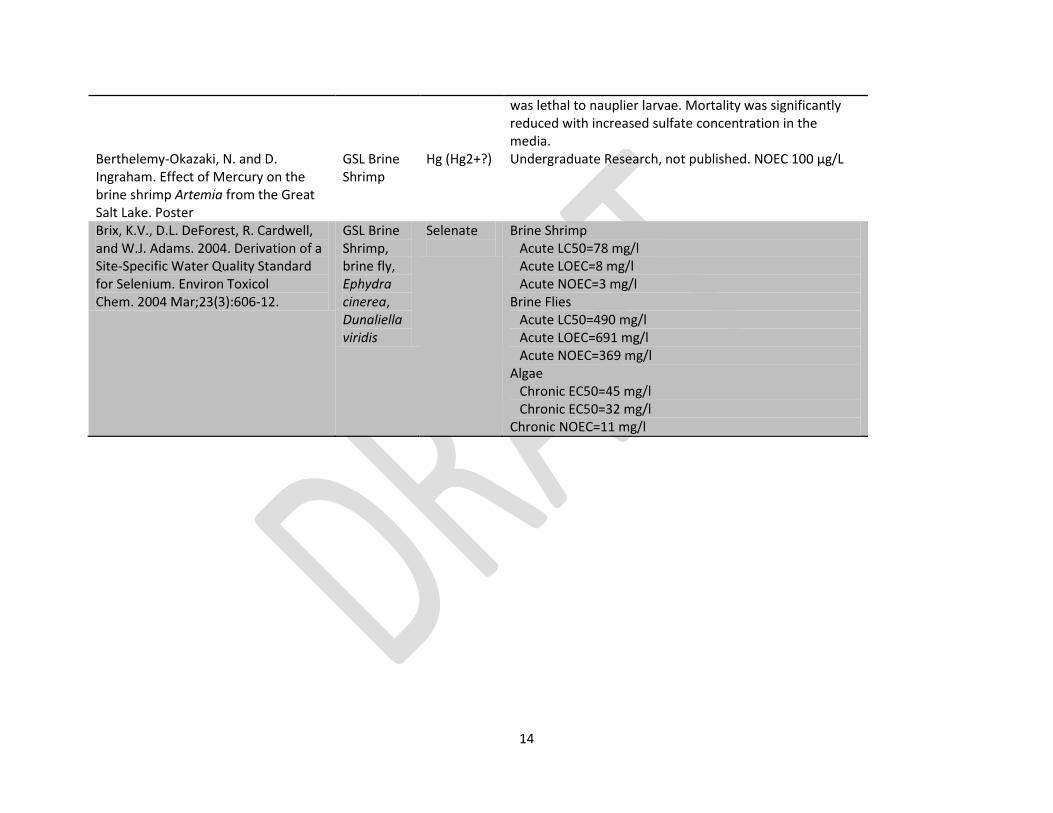
was lethal to nauplier larvae. Mortality was significantly reduced with increased sulfate concentration in the media.
Berthelemy-Okazaki, N. and D. Ingraham. Effect of Mercury on the brine shrimp Artemia from the Great Salt Lake. Poster
GSL Brine Shrimp
Hg (Hg2+?) Undergraduate Research, not published. NOEC 100 µg/L
Brix, K.V., D.L. DeForest, R. Cardwell, and W.J. Adams. 2004. Derivation of a Site-Specific Water Quality Standard for Selenium. Environ Toxicol Chem. 2004 Mar;23(3):606-12.
GSL Brine Shrimp, brine fly, Ephydra cinerea, Dunaliella viridis
Selenate
Brine Shrimp Acute LC50=78 mg/l Acute LOEC=8 mg/l Acute NOEC=3 mg/l
Brine Flies Acute LC50=490 mg/l Acute LOEC=691 mg/l Acute NOEC=369 mg/l
Algae Chronic EC50=45 mg/l Chronic EC50=32 mg/l
Chronic NOEC=11 mg/l

15
Figure 1 Great Salt Lake Utah Division of Water Quality Sample Locations
16
0
20
40
60
80
100
120
140
160
Figure 2 2011-2012 Gilbert Bay Oxic Stratum
Arsenic Concentrations (µg/L)
July, 2011
October, 2011
June, 2012
October, 2012
Marine Benchmark
Freshwater Benchmark
0
20
40
60
80
100
120
140
160
Gil2bottom Gil5bottom Gil6bottom Gil8bottom
Figure 3 2011-2012 Gilbert Bay Deep Brine Stratum
Arsenic Concentrations (µg/L)
July, 2011
October, 2011
June, 2012
October, 2012
Marine Benchmark
Freshwater Benchmark

17
0
5
10
15
20
25
30
35
Figure 4 2011-2012 Gilbert Bay Oxic Stratum
Copper Concentrations (µg/L)
July, 2011
October, 2011
June, 2012
October, 2012
Marine Benchmark
Freshwater Benchmark
0
5
10
15
20
25
30
35
Gil2bottom Gil5bottom Gil6bottom Gil8bottom
Figure 5 2011-2012 Gilbert Bay Deep Brine Stratum
Copper Concentrations (µg/L)
July, 2011
October, 2011
June, 2012
October, 2012
Marine Benchmark
Freshwater Benchmark
18
0
5
10
15
20
25
30
35
Figure 6 2011-2012 Gilbert Bay Oxic Stratum
Methyl Mercury Concentrations (ng/L)
July, 2011
October, 2011
June, 2012
October, 2012
Marine Benchmark
Freshwater Benchmark
0
5
10
15
20
25
30
35
Gil2bottom Gil5bottom Gil6bottom Gil8bottom
Figure 7 2011-2012 Gilbert Bay Deep Brine Stratum
Methyl Mercury Concentrations (ng/L)
July, 2011
October, 2011
June, 2012
October, 2012
Marine Benchmark
Freshwater Benchmark

19
0
2
4
6
8
10
12
14
16
18
20
Figure 8 2011-2012 Gilbert Bay Oxic Stratum
Lead Concentrations (µg/L)
July, 2011
October, 2011
June, 2012
October, 2012
Marine Benchmark
Freshwater Benchmark
0
2
4
6
8
10
12
14
16
18
20
Gil2bottom Gil5bottom Gil6bottom Gil8bottom
Figure 9 2011-2012 Gilbert Bay Deep Brine
Lead Concentrations (µg/L)
July, 2011
October, 2011
June, 2012
October, 2012
Marine Benchmark
Freshwater Benchmark

20
0
2
4
6
8
10
Figure 10 2011-2012 Gilbert Bay Oxic Stratum
Ammonia Concentrations (mg/L)
July, 2011 October, 2011 June, 2012
Marine benchmark Freshwater Benchmark
0
2
4
6
8
10
12
Gil2bottom Gil5bottom Gil6bottom Gil8bottom
Figure 11 2011-2012 Gilbert Bay Deep Brine Stratum
Ammonia Concentrations (mg/L)
July, 2011 October, 2011 June, 2012
Marine benchmark Freshwater Benchmark

21
0
10
20
30
40
50
Figure 12 2011-2012 Gilbert Bay Oxic Stratum Total Mercury Concentrations (ng/L)
July, 2011
October, 2011
June, 2012
October, 2012
Marine Benchmark
Freshwater Benchmark
0
10
20
30
40
50
Gil2bottom Gil5bottom Gil6bottom Gil8bottom
Figure 13 2011-2012 Gilbert Bay Deep Brine Stratum
Total Mercury Concentrations (ng/L)
July, 2011
October, 2011
June, 2012
October, 2012
Marine Benchmark
Freshwater Benchmark
22
0
1
2
3
4
5
6
7
8
9
10
Figure 14 2011-2012 Gilbert Bay Oxic Stratum
Cadmium Concentrations (µg/L)
July, 2011
October, 2011
June, 2012
October, 2012
Marine Benchmark
Freshwater Benchmark
0
1
2
3
4
5
6
7
8
9
10
Gil2bottom Gil5bottom Gil6bottom Gil8bottom
Figure 15 2011-2012 Gilbert Bay Deep Brine Stratum
Cadmium Concentrations (µg/L)
July, 2011
October, 2011
June, 2012
October, 2012
Marine Benchmark
Freshwater Benchmark
23
0
10
20
30
40
50
60
70
80
Figure 16 2011-2012 Gilbert Bay Oxic Stratum
Selenium Concentrations (µg/L)
July, 2011
October, 2011
June, 2012
October, 2012
Marine Benchmark
Freshwater Benchmark
0
10
20
30
40
50
60
70
80
Gil2bottom Gil5bottom Gil6bottom Gil8bottom
Figure 17 2011-2012
Gilbert Bay Deep Brine Stratum Selenium Concentrations (µg/L)
July, 2011
October, 2011
June, 2012
October, 2012
Marine Benchmark
Freshwater Benchmark

24
0
2
4
6
8
10
12
14
16
18
Figure 18 2011-2012 Gilbert Bay Oxic Stratum
Thallium Concentrations (µg/L)
July, 2011
October, 2011
June, 2012
October, 2012
Marine Benchmark
Freshwater Benchmark
0
2
4
6
8
10
12
14
16
18
Gil2bottom Gil5bottom Gil6bottom Gil8bottom
Figure 19 2011-2012 Gilbert Bay Deep Brine Stratum
Thallium Concentrations (µg/L)
July, 2011
October, 2011
June, 2012
October, 2012
Marine Benchmark
Freshwater Benchmark

25