review hypothesis testing starts with a null...
TRANSCRIPT

REVIEW Hypothesis testing starts with a null hypothesis
and a null distribution. We compare what we have to the null distribution,
if the result is too extreme to belong to the null distribution (p<.05), we reject the null hypothesis. Or this means the result supports our research/alternative hypothesis.
Test the assumption before you do the independent t-test. This affects which row of the statistical output to read for your decision-making.
Note: You DON’T have to have equal sample size for independent t-test.
8/2/2017
1
陈芳
华东师大英语系

CHAPTER 9: CORRELATION
Day 6 Summer 2017.08.03
8/2/2017
2
陈芳
华东师大英语系

DECISION TREE 8/2/2017
3
陈芳
华东师大英语系

RESEARCH ON RELATIONSHIP
8/2/2017
4
陈芳
华东师大英语系

OVERVIEW
Scatter plots Correlation & covariance Various correlation coefficients Significance & null hypotheses Read SPSS output
8/2/2017
5
陈芳
华东师大英语系

8/2/2017
6
SCATTER PLOT: THE GRAPHIC REPRESENTATION A scatter plot is a graphical representation of the
relationship between two variables. Each subject or observation must have a pair of values,
one for X, one for Y.
陈芳
华东师大英语系
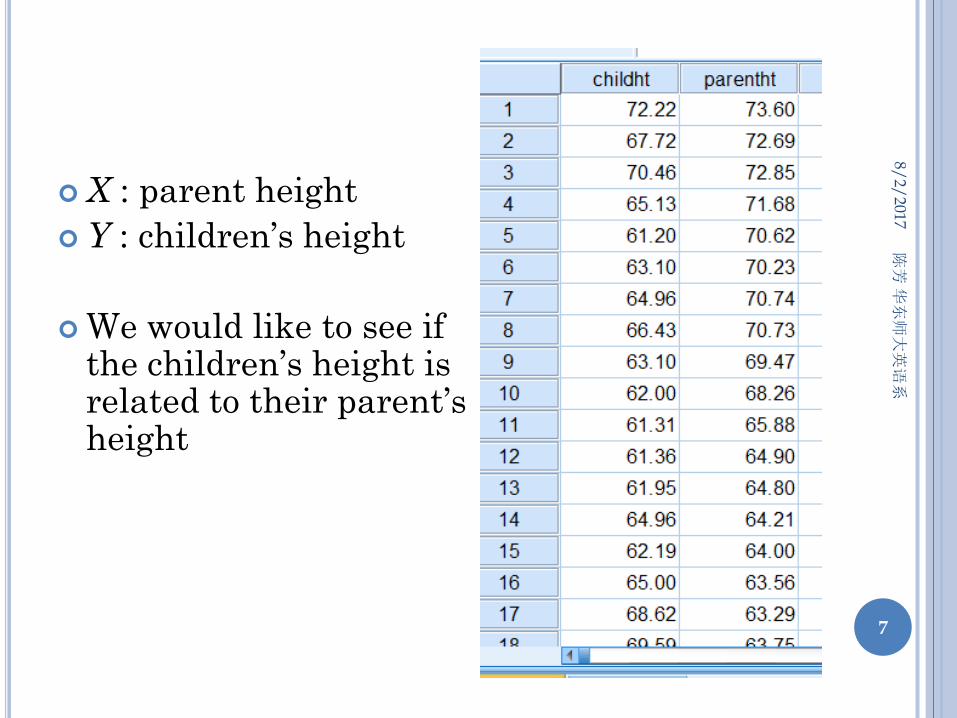
X : parent height Y : children’s height
We would like to see if
the children’s height is related to their parent’s height
8/2/2017
7
陈芳
华东师大英语系

SCATTER PLOTS: POSITIVE RELATIONSHIP As X increase, Y also increases.
8/2/2017
8
陈芳
华东师大英语系
r=.81

SCATTER PLOTS: NEGATIVE RELATIONSHIPS As X increase, Y decreases.
8/2/2017
9
陈芳
华东师大英语系
r=-.79

SCATTER PLOTS: NO RELATIONSHIP
8/2/2017
10
陈芳
华东师大英语系
r=.14

RELATIONSHIP DOES NOT HAVE TO BE LINEAR
8/2/2017 陈芳
华东师大英语系
11

ANSCOMBE’S QUARTET
8/2/2017
12
陈芳
华东师大英语系

SPSS DEMO Parent and child height data Select your X and Y variable:
sometimes it matters Incidence of cancer would be dependent on amount smoked,
not amount smoked dependent on cancer, thus it is more reasonable that amount smoked is selected as X, incidence of cancer is selected as Y.
sometimes it does not
Scatter plot Edit it Read the SPSS output
8/2/2017
13
陈芳
华东师大英语系

COVARIANCE
8/2/2017
14
陈芳
华东师大英语系
NXXXX
NXX
X∑∑ −−
=−
=))(()( 2
2σ
NYYXX
XY∑ −−
=))((
cov
Variance is defined as :
Covariance is defined as:

CORRELATION COEFFICIENTS
A correlation coefficient standardizes the covariance. We’ve seen the same thing before with z-scores Centered at 0.0, and divided by σ
Pearson product-moment correlation coefficient is defined as
8/2/2017
15
陈芳
华东师大英语系
∑∑∑
∑∑
∑
−−
−−=
−−
−−
==2222 )()(
))((
)()(
))((cov
YYXX
YYXX
NYY
NXX
NYYXX
ssr
YX
XY

CORRELATION COEFFICIENTS
A correlation coefficient ranges between –1.0 and +1.0 Coefficient of 0 = no relationship between two
variables Negative values reflect a negative relationship Positive values reflect a positive relationship
The population coefficient is notated with ρ (rho)
8/2/2017
16
陈芳
华东师大英语系

SEEING STATISTICS Drop the dots wherever you want and see how r
changes right away as you add more data.
http://www.uvm.edu/~dhowell/fundamentals8/SeeingStatisticsApplets/CorrelationPoints.html
8/2/2017
17
陈芳
华东师大英语系

CORRELATION COEFFICIENTS
There are several correlation coefficients used by researchers
Common ones are: Pearson product-moment correlation (r) Spearman correlation (rs)
Different coefficients are appropriate for different situations.
8/2/2017
18
陈芳
华东师大英语系

8/2/2017
19
CORRELATION COEFFICIENTS
X
Y
Continuous Dichotomous Ranked
Continuous Pearson’s r Point-biserial
Dichotomous Point-biserial Phi (φ)
Ranked Spearman
陈芳
华东师大英语系

REMEMBER PEARSON’S R FOR TWO CONTINUOUS VARIABLES Defined as:
The closer to +1 or -1, the stronger the relationship The closer to 0, the weaker the relationship Some rules of thumb (very general)
Correlation between about 0.0 to 0.1 are very small and almost negligible
0.1 to 0.3 are small 0.3 to 0.7 are moderate 0.7 and above are strong
8/2/2017
20
YX
XY
ssr cov= 陈
芳 华
东师大英语系

WHAT AFFECTS CORRELATIONS?
4 major factors affect the calculation of correlations:
1. Nonlinearity of relationship 2. Restriction of range (or variance) of X and/or Y http://www.uvm.edu/~dhowell/fundamentals8/
SeeingStatisticsApplets/RangeRestrict.html 3. Use of heterogeneous sub-samples http://www.uvm.edu/~dhowell/fundamentals8/Seei
ngStatisticsApplets/HeteroSubSamp.html 4. Outliers http://www.uvm.edu/~dhowell/fundamentals8/Seei
ngStatisticsApplets/CorrPointRemove.html
8/2/2017
21
陈芳
华东师大英语系

RESTRICTION OF RANGE P205 8/2/2017
22
陈芳
华东师大英语系

HETEROGENEOUS SUBSAMPLES
A sample is heterogeneous when the observations can be divided one or more distinct sets on the basis of some other variable (e.g. gender, age group, etc.)
Conversely, a homogeneous sample is when the sample is very similar
8/2/2017
23
陈芳
华东师大英语系

HETEROGENEOUS SUBSAMPLES
Let’s take a look at the example from the book. The correlation between height and weight with
both males & females is 0.78—a high correlation…
When we separate out males and females, we get much different results: Males: r = 0.60 Females: r = 0.49
8/2/2017
24
陈芳
华东师大英语系

HETEROGENEOUS SUBSAMPLES 8/2/2017
25
陈芳
华东师大英语系

OUTLIERS 8/2/2017
26
陈芳
华东师大英语系
r=.224, p=.509
r=.784, p=.007

CAUTION
CORRELATION ≠
CAUSATION
8/2/2017
27
陈芳
华东师大英语系

CORRELATION ≠ CAUSATION
An observed association between variables does NOT indicate that one variable causes the other—though often we would like this to be the case.
Otts (2005) presents an excellent list of
possible explanations of a significant correlation between two variables. Howell p209
8/2/2017
28
陈芳
华东师大英语系

PREREQUISITES TO ESTABLISH CAUSALITY 1. In order for A to cause B, A must occur before
or at the same time of B. 2. Other variables are ruled out. No other
variables can count for the difference. Randomization is the key to start with.
3. A reasonable explanation has to be provided how A causes B. I we can’t explain why we found what we did, the best that we can say is that there is a relationship between A and B, but more research needs to be carried out to find out why they are related.
8/2/2017
29
陈芳
华东师大英语系

HYPOTHESIS TESTING & CORRELATIONS The rules of hypothesis testing will still apply to
correlations H1: ρ ≠ 0 (two-tailed test) H0: ρ = 0 We set up alpha (a rejection level) and compare. If have strong evidence to reject the null, we say our
correlation is statistically significant.
8/2/2017
30
陈芳
华东师大英语系
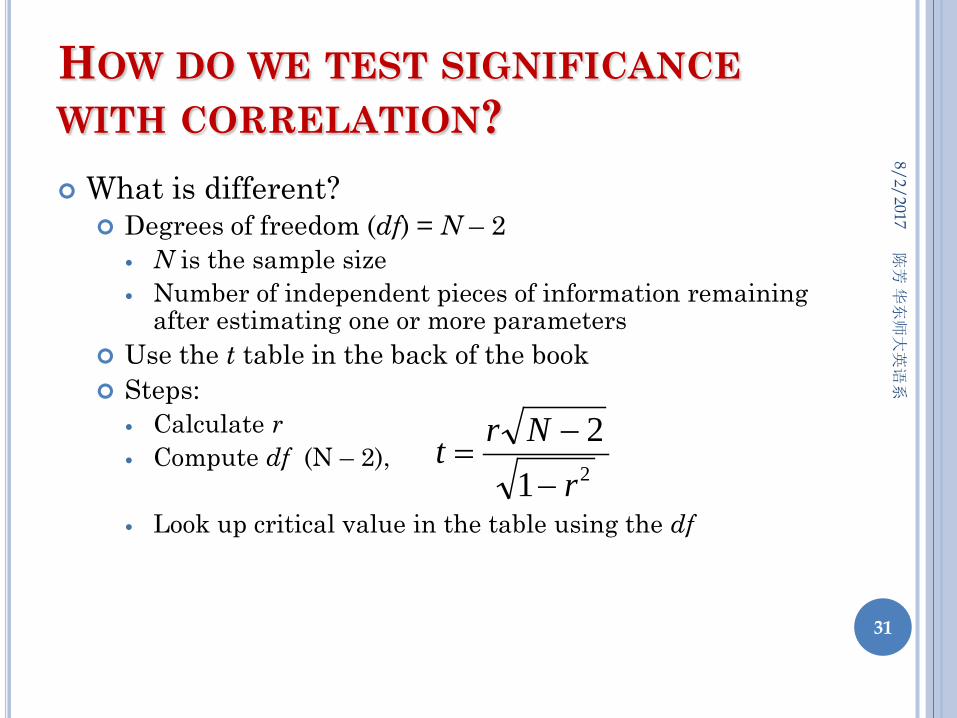
HOW DO WE TEST SIGNIFICANCE WITH CORRELATION? What is different?
Degrees of freedom (df) = N – 2 N is the sample size Number of independent pieces of information remaining
after estimating one or more parameters Use the t table in the back of the book Steps:
Calculate r Compute df (N – 2),
Look up critical value in the table using the df
8/2/2017
31
212
rNrt−
−=
陈芳
华东师大英语系

CORRELATION OUTPUT IN SPSS
8/2/2017
32
If the p value is <.05, this correlation is statistically significant.
You will see 2 stars if the correlation is significant at alpha level of 0.01, and 1 star at alpha level of .05.
陈芳
华东师大英语系

SUMMARY Correlation is the standardized covariance, can
be positive, negative or 0. 0 means no correlation. The sign of the correlation coefficient reveals the
direction of the relationship. The absolute value of the correlation coefficient
reveals the strength of the relationship. There are different correlation coefficients
appropriate for different situations. We can graph the scatter plot to reveal the
relationship in SPSS. SPSS output provides tests results on the
significance of the correlation coefficients.
8/2/2017
33
陈芳
华东师大英语系

Break
8/2/2017
34
陈芳
华东师大英语系

CHAPTER 10: SIMPLE REGRESSION
8/2/2017
35
陈芳
华东师大英语系

OVERVIEW Independent and dependent variables Regression
The regression line Intercept and slope estimates in a regression line
Unstandardized Standardized
Handling outliers Hypothesis testing Prediction as a purpose SPSS Extension
8/2/2017
36
陈芳
华东师大英语系

INDEPENDENT AND DEPENDENT VARIABLES Independent variables (IV)自变量: Often the
variable manipulated by a researcher. We are usually interested to see the influence of them on something else. We will call them the “predicting” variables or “predictors”, usually noted as “X”. Explanatory variable
Dependent variables (DV)因变量: Often the
variable whose value depends on predictors. In the next two chapters we call these the “criterion” variable or “response” variable, usually noted as “Y”. Response variable
8/2/2017
37
陈芳
华东师大英语系

REGRESSION Regression is the process of finding the best
fitting line using the data we have. This line is most often used to predict or
estimate a score of one variable (Y) from another (X). Predict for future occurrences
Once the relationship between GPA and College Entrance Examination (CEE) is established, we could predict an applicant’s possible GPA based on his CEE scores to help with admission decisions.
Estimate a mean value Once the relationship between height and shoesize is
decided, we can estimate a person’s height based on the footprint.
8/2/2017
38
陈芳
华东师大英语系
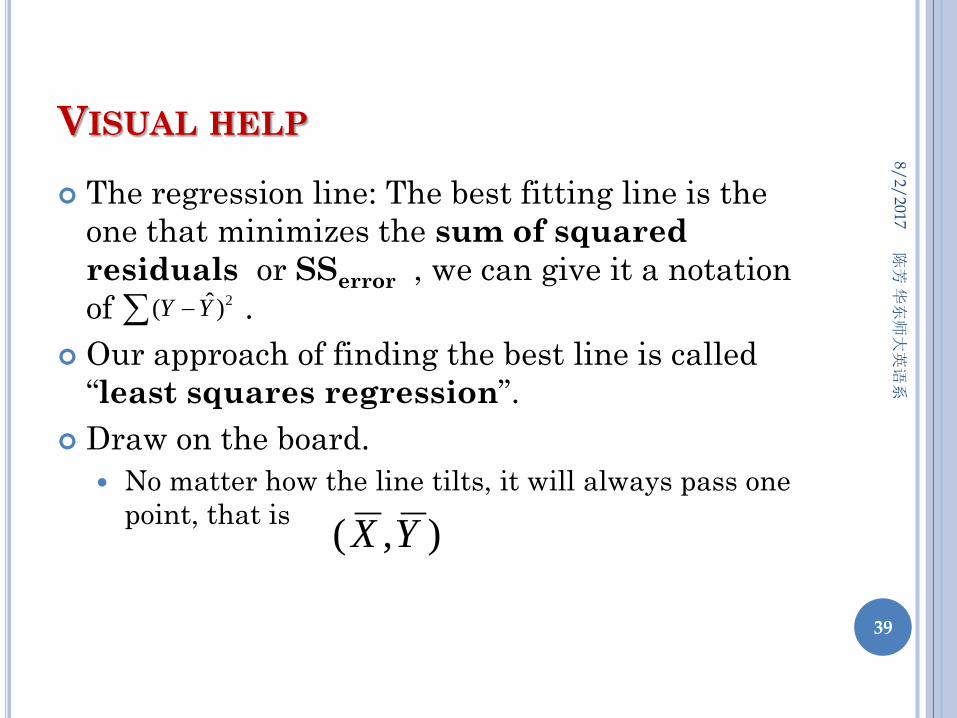
VISUAL HELP The regression line: The best fitting line is the
one that minimizes the sum of squared residuals or SSerror , we can give it a notation of .
Our approach of finding the best line is called “least squares regression”.
Draw on the board. No matter how the line tilts, it will always pass one
point, that is
8/2/2017
39
),( YX
∑ − 2)ˆ( YY
陈芳
华东师大英语系

THE REGRESSION LINE Think back to your high school math class…the
equation for a straight line is:
8/2/2017
40
Predicted value of Y
Slope of regression
line
Value of X
Intercept
bXaY +=ˆ
陈芳
华东师大英语系

A AND B DEFINE THE LINE Find the line is the same as finding a and b that
defines the line.
8/2/2017
41
陈芳
华东师大英语系

THE REGRESSION LINE
The slope of the best fitting line we just described can be estimated as below, this can be proven, but we will not do that here.
==
X
Y
X
XY
ssr
sb 2
cov
8/2/2017
42
bXaY +=ˆ
Pearson correlation between X and Y.
Standard deviation of Y.
Standard deviation of X.
陈芳
华东师大英语系

THE REGRESSION LINE: CAN SKIP
After we solve for the slope (b), we can find the intercept a with:
8/2/2017
43
NXbY
XbYa ∑ ∑−=−=
bXaY +=ˆ
陈芳
华东师大英语系

HYPOTHESIS TESTING
Regression has two coefficients (slope & intercept) Like in correlation, we are testing to see if these values
are different from zero, although we are not interested in testing the intercept (we do not care whether the intercept is 0 or not).
We still use t-test to test this. In SPSS, the t-test has a p-value attached to it. As
usual, if p<alpha(usually 0.05), we reject the null hypothesis and conclude the coefficient is significantly different from 0.
8/2/2017
44
陈芳
华东师大英语系

JUST FOR YOUR INFORMATION t-test for correlation r. t-test for slope coefficient b. It follows a t
distribution with n-2 degrees of freedom.
You can use either equation to double-check the t statistic in the following example
8/2/2017
45
[ ]21
22
−=−
−== ndf
rNr
srtr
21)1(
1)(1)(
12ˆˆ
−−
−
−=
−=
−
=−−
NNrs
Nsbs
Nsb
Nss
bt
Y
X
YY
X
X
YY
陈芳
华东师大英语系

SPSS DEMO
8/2/2017
46
Tab10.1 on line. Predicting symptom scores from level of stress. Can you write the equation for this best fitting line?
Intercept
Slope
Standardized slope coefficient. =r (simple regression only.)
Does not include 0. Yes, significant.
Smaller than .05. Significant. Reject null hypothesis and conclude the slope is different from 0.
We don’t care about this.
Unstandardized slope coefficient
陈芳
华东师大英语系
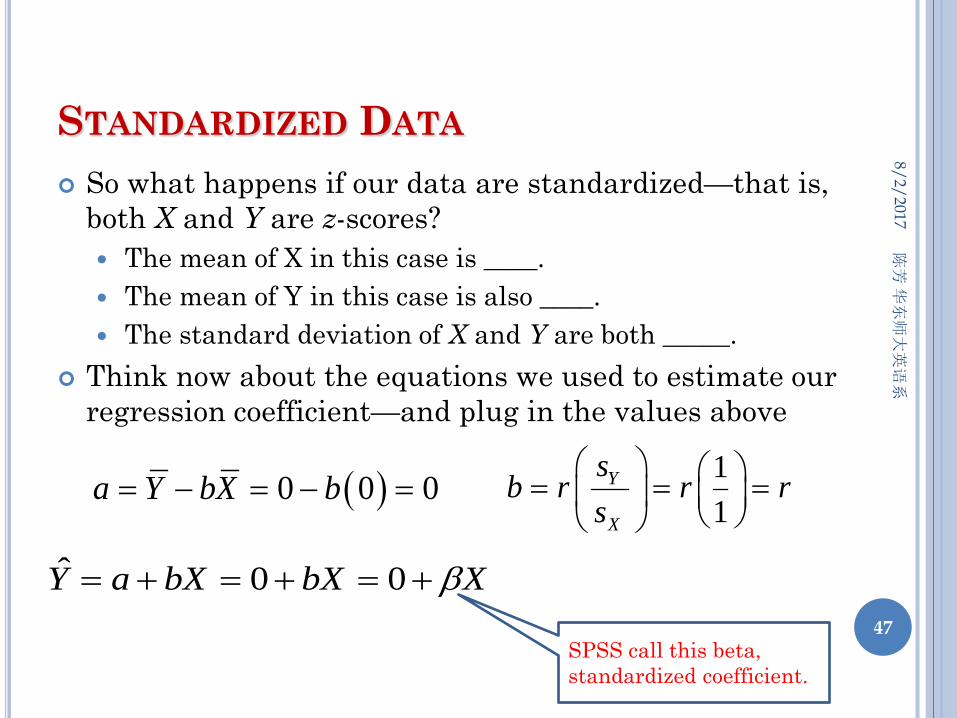
STANDARDIZED DATA So what happens if our data are standardized—that is,
both X and Y are z-scores? The mean of X in this case is ____. The mean of Y in this case is also ____. The standard deviation of X and Y are both _____.
Think now about the equations we used to estimate our regression coefficient—and plug in the values above ( )0 0 0a Y bX b= − = − =
11
Y
X
sb r r r
s = = =
8/2/2017
47
XbXbXaY β+=+=+= 00ˆ
SPSS call this beta, standardized coefficient.
陈芳
华东师大英语系

PREDICTABLE VARIABILITY & R2
If a correlation (r) is found to be 0.8, we calculate r2 = 0.82 = 0.64
The higher the r2, the better the predictors are working (the more variance in Y that are explained by the predictors).
How do we interpret this? This means that 64% of the variance of Y can be
explained by the variability of X. Remember, this does NOT mean that 64% of Y is
caused by X.
8/2/2017
48
陈芳
华东师大英语系

USE SPSS Sleep and mood: This is fictional data Create scatter plot to check the linear
relationship assumption. Check for outliers.
Delete outliers. Read the output. Make your conclusion. Interpret the results. Evaluate model fit.
8/2/2017
49
陈芳
华东师大英语系

CHAPTER 11: MULTIPLE REGRESSION
8/2/2017 陈芳
华东师大英语系
50

A QUICK EXAMPLE
8/2/2017
51
陈芳
华东师大英语系

CORRELATION
8/2/2017
52
陈芳
华东师大英语系

REGRESSION: ENTER
8/2/2017
53
陈芳
华东师大英语系

IMPROVE THE REGRESSION: STEPWISE
8/2/2017
54
陈芳
华东师大英语系