review of 2021 valuation reports
TRANSCRIPT

Review of 2021 Valuation Reports
Presentation to thePension Benefits, Design, and
Funding Task Force
November 3, 2021

Purpose of the Annual Valuation
• To set or assess the adequacy of the retirement system to pay current and future retirement benefits.
• To assure intergenerational equity in the allocation of costs.
• Outputs:• Calculate the actuarially accrued liabilities• Calculate the actuarial value of assets• Calculate the funding status • Determine the Actuarially Determined Employer Contribution (ADEC)• Identify Gains and Losses: Review annual experience and compare against current actuarial
assumptions• Review within the context of the statutorily established funding policy (amortization period)• Assess risks to the pension system
• Closed System• Estimate of a plan’s financial position as of the valuation date• Snapshot

Experience Studies
• “Assumptions are used to estimate a plan’s future benefit payments and their present value and do not determine outcomes.”
- Segal Group
• Outcomes are determined by actual member behavior, benefit provisions, actual contributions, and investment income.
• Actuarial assumptions do, however, provide a way to project future liabilities and assets for decision-making purposes.
• The reliability of an actuarial valuation depends on the use of reasonable methods and assumptions.
• Experience studies are used to “true up” these assumptions to keep them reasonable in a changing environment.
• Best practices recommend that experience studies be conducted no less frequently than every five years.
• Vermont statute now requires experience studies to be completed every three years.

Actuarial UAAL as aActuarial Accrued Unfunded Percentage of Value of Liability AAL Funded Covered Covered
Year ending Assets (AAL) (UAAL) Ratio Payroll PayrollJune 30 (a) (b) (b-a) (a/b) ( c) ((b-a)/c)
2021 2,216,499$ 3,280,868$ 1,064,369 67.6% 552,317$ 192.7%2020 2,054,826 3,095,291 1,040,465 66.4% 551,981 188.5%2019 1,964,501 2,779,966 815,465 70.7% 527,571 154.6%2018 1,881,805 2,661,609 779,804 70.7% 521,671 149.5%2017 1,793,795 2,511,373 717,578 71.4% 504,553 142.2%2016 1,707,268 2,289,452 582,184 74.6% 471,268 123.5%2015 1,636,268 2,178,827 542,559 75.1% 462,057 117.4%2014 1,566,076 2,010,090 444,014 77.9% 437,676 101.4%2013 1,469,170 1,914,300 445,130 76.8% 416,766 106.8%2012 1,400,779 1,802,604 401,825 77.7% 385,526 104.2%2011 1,348,763 1,695,301 346,538 79.6% 398,264 87.0%2010 1,265,404 1,559,324 293,920 81.2% 393,829 74.6%2009 1,217,638 1,544,144 326,506 78.9% 404,516 80.7%2008 1,377,101 1,464,202 87,101 94.1% 404,593 21.5%2007 1,318,687 1,307,643 (11,044) 100.8% 386,917 -2.9%2006 1,223,323 1,232,367 9,044 99.3% 369,310 2.4%2005 1,148,908 1,174,796 25,888 97.8% 349,258 7.4%2004 1,081,359 1,107,634 26,275 97.6% 336,615 7.8%2003 1,025,469 1,052,004 26,535 97.5% 319,855 8.3%2002 990,450 1,017,129 26,679 97.4% 300,994 8.9%2001 954,821 1,026,993 72,172 93.0% 278,507 25.9%2000 895,151 967,064 71,913 92.6% 266,519 27.0%1999 804,970 876,412 71,442 91.8% 238,281 30.0%1998 733,716 804,501 70,785 91.2% 235,956 30.0%1997 639,128 753,883 114,755 84.8% 227,000 50.6%
(in thousands)
Funding Progress of the VSERS Retirement System - (Amounts in Thousands)
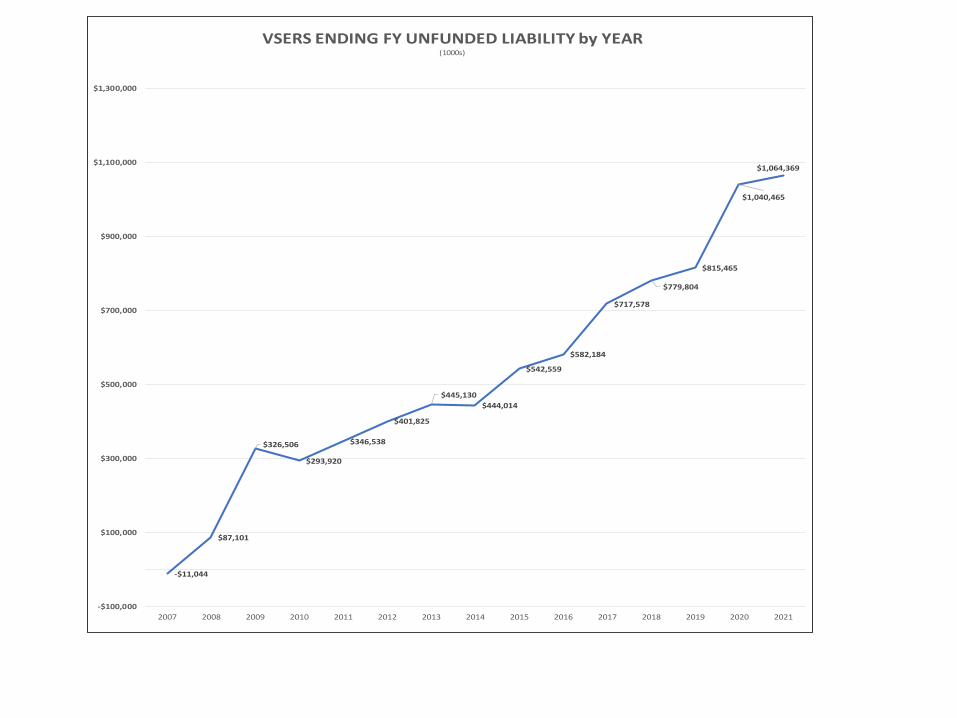
-$11,044
$87,101
$326,506
$293,920
$346,538
$401,825
$445,130$444,014
$542,559
$582,184
$717,578
$779,804
$815,465
$1,040,465
$1,064,369
-$100,000
$100,000
$300,000
$500,000
$700,000
$900,000
$1,100,000
$1,300,000
2007 2008 2009 2010 2011 2012 2013 2014 2015 2016 2017 2018 2019 2020 2021
VSERS ENDING FY UNFUNDED LIABILITY by YEAR(1000s)

2019 Valuation*
2021 budget
Estimated Results based on Experience
Study
2020 Valuation** 2022 budget
Add 2021 Valuation**
* 2023 budget
Unfunded Liability $815.5 $1,032.3 $1,040.5 $1,064.4
change $216.8 $225.0 $248.9
ADEC $83.9 $113.6 $119.9 $125.9change $29.7 $36.0 $42.0
* Used to develop FY2021 budget** Impacts the FY2022 budget***Impacts the FY2023 budgetVariances due to rounding
VSERS - Scope of the Challenge (Dollars in Millions)

Actuarial UAAL as aActuarial Accrued Unfunded Percentage of Value of Liability AAL Funded Covered Covered
Year ending Assets (AAL) (UAAL) Ratio Payroll PayrollJune 30 (a) (b) (b-a) (a/b) ( c) ((b-a)/c)
2021 2,191,651$ 4,142,015$ 1,950,364$ 52.9% 657,935$ 296.4%2020 2,035,714 3,969,003 1,933,289 51.3% 645,903.0 299.3%2019 1,950,860 3,505,319 1,554,459 55.7% 624,908.0 248.8%2018 1,866,121 3,379,554 1,513,433 55.2% 612,899 246.9%2017 1,779,592 3,282,045 1,502,453 54.2% 607,355 247.4%2016 1,716,296 2,942,024 1,225,728 58.3% 586,397 209.0%2015 1,662,346 2,837,375 1,175,029 58.6% 557,708 210.7%2014 1,610,286 2,687,049 1,076,764 59.9% 567,074 189.9%2013 1,552,924 2,566,834 1,013,910 60.5% 563,623 179.9%2012 1,517,410 2,462,913 945,503 61.6% 561,179 168.5%2011 1,486,698 2,331,806 845,108 63.8% 547,748 154.3%2010 1,410,368 2,122,191 711,823 66.5% 562,150 126.6%2009 1,374,079 2,101,838 727,759 65.4% 561,588 129.6%2008 1,605,462 1,984,967 379,505 80.9% 535,807 70.8%2007 1,541,860 1,816,650 274,790 84.9% 515,573 53.3%2006 1,427,393 1,686,502 259,109 84.6% 499,044 51.9%2005 1,354,006 1,492,150 138,144 90.7% 468,858 29.5%2004 1,284,833 1,424,661 139,828 90.2% 453,517 30.8%2003 1,218,001 1,358,822 140,821 89.6% 437,239 32.2%2002 1,169,294 1,307,202 137,908 89.5% 418,904 32.9%2001 1,116,846 1,254,341 137,495 89.0% 403,258 34.1%2000 1,037,466 1,174,087 136,621 88.4% 387,999 35.2%1999 931,056 1,065,754 134,698 87.4% 372,299 36.2%1998 821,977 955,694 133,717 86.0% 357,899 37.4%
(in thousands)
Funding Progress of the VSTRS Retirement System - (Amounts in Thousands)
Reflects different actuarial method that overstated funded ratio

$274,790
$379,505
$727,759
$711,823
$845,108
$945,503$1,013,910
$1,076,764$1,175,029
$1,225,728
$1,502,453
$1,513,433$1,554,459
$1,933,289
$1,950,364
-$100,000
$400,000
$900,000
$1,400,000
$1,900,000
$2,400,000
2007 2008 2009 2010 2011 2012 2013 2014 2015 2016 2017 2018 2019 2020 2021
VSTRS ENDING FY UNFUNDED LIABILITY by YEAR(1000s)

2019 Estimated 2020 Add 2021
Unfunded Liability $1,554.0 $1,880.0 $1,933.3 $1,950.4change $326.0 $379.3 $396.4
ADEC $135.6 $186.4 $196.2 $205.2change $50.8 $60.6 $69.6
* Used to develop FY2021 budget** Impacts the FY2022 budget***Impacts the FY2023 budgetVariances due to rounding
VSTRS - Scope of the Challenge (Dollars in Millions)

• A pension plan has actuarial gains or losses each year. • Actual events during the year (“experience”) do not exactly match the long-term assumptions
previously made.
• Economic gains/losses: • The actual investment returns, cost of living, or inflation were higher or lower than anticipated.
• Experience and demographic gains or losses: • Mortality, Salary Increases, Termination, Staff Turnover, Retirement.
• An Experience Study is completed to reset assumptions.
• Patterns of gains/losses exist in both VSERS and VSTRS (see next slides).
• While gains and losses are measured against assumptions, it is actual performance (economic and demographic) that drives the liabilities.
• Per Segal: “Assumptions are used to estimate a plan’s future benefit payments and their present value and do not determine outcomes.”
Actuarial Gains and LossesKey Points

Components of Change in the Unfunded Actuarial Liability -VSERS
Cumulative Valuation CumulativeCategory 2011-2020 2021 2011-2021
Beginning FY Unfunded liability $293,920,094 $293,920,094 Changes in Actuarial Assumptions 489,354,525 - 489,354,525 Changes in System Provisions 22,252 - 22,252 Incorporation of Temp Salary Decreases - - - Change in employee contribution rate (2,610,261) - (2,610,261 Expected adj. not incl. assumption/benefit changes (79,843,570) 12,683,164 (67,160,406 Other expense (gain)/loss 9,482,240 - 9,482,240 Salary experience (gain)/loss 95,627,506 4,448,937 100,076,443 COLA experience (gain)/loss (110,469,758) 35,588,639 (74,881,119 Net Turnover (new members, terminations) 61,630,140 (3,446,914) 58,183,226 Investment (gain)/Loss 56,205,931 (52,180,733) 4,025,198 Mortality (gain)/loss 40,657,045 4,440,365 45,097,410 Retirements (gain)/loss 97,520,027 19,015,951 116,535,978 Disability experience (gain)/loss 2,357,312 158,342 2,515,654 Other (gain)/loss 86,611,636 3,195,329 89,806,965 Ending FY Unfunded Liability $1,040,465,119 $1,064,368,199

Note: From 2011 through 2021, investments, combined for both VSERS and VSTRS, are a net gain, slightly exceeding the assumed rate of return.
Components of Change in the Unfunded Actuarial Liability -VSTRS
Cumulative Valuation CumulativeCategory 2011-2020 2021 2011-2020
Beginning FY Unfunded liability $711,823,061 711,823,061 Changes in Actuarial Assumptions 783,238,313 - 783,238,313 Changes in System Provisions - - - Incorporation of Temp Salary Decreases - - - Change in employee contribution rate - - - Expected adj. not incl. assumption/benefit changes (5,786,660) 29,161,309 23,374,649 Other expense (gain)/loss (663,448) 6,407,934 5,744,486 Salary experience (gain)/loss (125,779,835) (9,493,027) (135,272,862) COLA experience (gain)/loss (88,185,397) 22,593,555 (65,591,842) Net Turnover (new members, terminations) 319,901,420 10,518,767 330,420,187 Investment (gain)/Loss 52,038,767 (57,785,688) (5,746,921) Mortality (gain)/loss 20,000,804 (1,761,346) 18,239,458 Retirements (gain)/loss 162,532,393 16,872,089 179,404,482 Disability experience (gain)/loss 2,670,773 560,942 3,231,715 Other (gain)/loss - Contribution Shortfall incl. Health Care Appropriation 101,499,179 - 101,499,179 Ending FY Unfunded Liability $1,933,289,370 $1,950,363,905

Investments
Managed by The Vermont Pension Investment Commission (VPIC)Key Points
• Investments are a significant contribution to the pension fund.• Roughly 60-62% of each dollar paid to retirees is from investment income.
• Investments are volatile and subject to market conditions.• Long-Term View
• Investment performance has met the assumed rate of return. • FY2021 return: 24.62% (highest return percentage since the 1980s).• Combined interest earnings (state, teachers, and municipal plan) of over $1.14 billion.
• Good news, but….• Investments alone cannot solve the unfunded liability!
• Investment results are “smoothed,” theoretically so as to avoid peaks and valleys in appropriations (ADEC). Stabilizes contribution levels.
• VPIC’s assumed rate of return is in line with other public pension funds.
• VPIC sets the smoothing period - 5 years. Is in line with other states.
Note: VPIC Chair and Chief Investment Officer can provide additional information

Significant Market Events Early 1980s- historically high inflation rates FY1988: Stock market crash of October 19,19871991 and early 90s- RecessionFY2000-2002: The Dot-Com Crash from peak in late 1990s and 2000 subsequent crash; 9/11/2001FY2008- 2009: Great Recession, European Sovereign Debt Crisis2015: China-driven international equity drawdown2020: COVID2016: BREXIT
Source: VPIC, historical valuation reports

Source: RVK
Markets are Volatile

Rate (%) Percentage Count5.25-5.5 0.8% 16.25-6.5 0.8% 16.5-6.75 6.9% 96.75-7 13.7% 187-7.25 31.3% 417.25-7.5 22.1% 297.5-7.75 21.4% 287.75-8 3.1% 4Total 100.0% 131
Average 7.13Median 7.00
Source: NASRA May Data
Rate of Return as Reported to NASRA May 2021
1 1
9
18
41
29 28
4
0
5
10
15
20
25
30
35
40
45
5.25-5.5 6.25-6.5 6.5-6.75 6.75-7 7-7.25 7.25-7.5 7.5-7.75 7.75-8
Distribution of Public Pension Plan Rates of Return by Count
0.8% 0.8%
6.9%
13.7%
31.3%
22.1% 21.4%
3.1%
0.0%
5.0%
10.0%
15.0%
20.0%
25.0%
30.0%
35.0%
5.25-5.5 6.25-6.5 6.5-6.75 6.75-7 7-7.25 7.25-7.5 7.5-7.75 7.75-8
Percentage
Vermont's Return Assumption In Line With National Average

VSTRS
VSERS
Source: Segal

• Crossover or Depletion: Plan assets and expected future contributions are no longer sufficient to pay expected future benefit payments.
• The critical tipping point is not when assets run out or even decline, but when Governors and Legislatures no longer believe the required contributions are realistic and give up trying to fund the actuarially required contributions.
- Treasurer’s Office 2005 Teacher Funding Report
Balancing Act of Pension Systems
Contribution Income
(Employer and Employee)
Investment Income
Benefits Paid Expenses
Retirement Equation
C + I = B + E