review of available technologies for the removal of ... · oil refining -crude oil from certain...
TRANSCRIPT

Knowledge… Commitment... Integrity… at Your Service
North American Metals Council 5th
White Paper- Review of Available Technologies for the Removal of Selenium from Water
Presented by Tom Sandy/CH2M HILL
North American Metals CouncilSelenium Work Group
November 24, 200910:15 – 11:00 a.m.

Agenda
• Provide a Project Update
–
Objectives–
Approach
–
Status/Schedule–
Outline
• Selenium Basics
–
Sources–
Regulatory
–
Chemistry–
Wastewater by Industry
–
Prevention/Source Control
• Industry Specific Treatment Approaches
• Review Case Studies During Discussion Session

Objectives of 5th White Paper
•
Summarize available Se removal technologies including physical, chemical and biological treatment
•
Describe successful case studies of Se removal applied to aqueous effluents at the commercial or pilot stage, as well as cases of scaling up to full scale for these industry sectors:–
Power generation –
Mining and agriculture–
Oil and gas•
Treatment is only one of three approaches for selenium removal: –
Prevention –
Source control–
Treatment

Approach
•
Literature Review•
Questionnaires to Normalize Case Study Information
•
Draft Body Text•
Collect Case Study Questionnaires
•
Incorporate Merge with Body Text•
Solicit and Incorporate Comments from SWG Meeting
•
Draft Complete by December 2009•
Finalize by January 2010

Questionnaires
•
Solicits design and type of treatment
•
Flow diagrams•
Size of Treatment
•
Demonstration Scale
•
Selenium Types •
Selenium Performance
•
Cost Information

Case Studies- Overview of Input from NAMC Members
Industry Sector Solicited ReceivedPower Generation
8* 8
Mining and Agriculture
23 6
Oil and Gas 5 1
*Utilities solicited by Electric Power Research Institute

Review Outline
•
Selenium Sources and Important Characteristics–
Se benefit/toxicity
–
Biological reactions involving Se –
Analytical methods for its detection in biological and non-biological samples
–
Regulations and understanding of current Se environmental and regulatory challenges
•
Prevention Strategies–
Power Generation
–
Mining and Agriculture–
Oil and Gas

Review Outline, continued
•
Treatment Technologies for Se Removal–
Treatment at the Source vs. Treatment at the “end of pipe”–
Available Treatment Technologies for Removal of Se•
Physical•
Chemical•
Biological–
Industry-Specific Approaches to Se Removal•
One size fits all approach is not possible•
Management of Residuals–
Case Studies of Pilot-Scale and Full-Scale Technologies for Removal of Se for:
•
Mining and Agriculture•
Power Generation•
Oil and Gas

Anthropogenic Sources of Selenium
•
Fossil fuel combustion -
Combustion of fossil fuels (coal and oil)
•
Mining -
Coal, phosphate, and sulfidic
ore mining produces waste rock that is excavated during active mining to reach the coal, phosphate, or ore body
•
Agricultural irrigation -
Irrigation of saline and sometimes seleniferous
soils has led to significant Se
contamination in aquatic ecosystems from impoundment of irrigation drainage
•
Oil refining -
Crude oil from certain geological formations such as marine shales

Regulatory Drivers/Horizon
•
United States–
National Recommended Water Quality Criteria (NRWQC) based on total recoverable Se concentration in water, with a chronic value of 5 µg Se/L and an acute value of 20 µg Se/L
–
In 2004, USEPA published draft criteria that included chronic exposure limits based on Se concentrations in whole-body fish
–
Pending USEPA release of new Se fish tissue data–
USEPA has chosen Steam Electric Generating Industry for Effluent Guidelines revision
–
Resource Conservation Recovery Act (RCRA)-
Characteristic Hazardous, Se 1 mg/L-Toxicity Characteristic Leaching Procedure (TCLP).

Regulatory Drivers/Horizon continued
•
Canada–
Permits may require stakeholders to monitor levels in water or the biota or possibly comply with the Ministry of Environment Canadian Water Quality Guideline of 1 µg/L total Se in surface waters
•
State/Providence/Local –
Interpretations more stringent than the above

Selenium Chemistry and Treatment Selection
•
Success of treatment technology is Se species-specific•
Se is a nonmetal with chemical qualities similar to sulfur•
Dissolved Se exists as various species–
(+ VI) in selenates
(HSeO4-, SeO4
2-) and selenic
acid (H2
SeO4
), –
(+ IV) in selenites
(HSeO3-, SeO3
2-) and selenous
acid (H2
SeO3
), –
0 in elemental selenium, and –
(-II) in selenides
(Se2-, HSe-)–
(-I) in Selenocyanates
(HSeCN, SeCN-)•
Analysis of Se and its various chemical forms (species) at ambient concentrations is complicated, and inappropriate analytical procedures have frequently been used

Characterization of Selenium by Industry: Power Generation
•
Wastewater Streams–
FGD Water–
Fly Ash Pond–
Coal Pile Runoff–
Fly Ash Leachate•
More FGD scrubbers coming online
•
FGD Water presents small flow but high concentration of Se for power plants–
Chloride purge stream–
Speciation affected by scrubber type, additives, reagents
–
More common forced oxidation scrubbers create more difficult to treat selenate species
Parameter “Typical” RangeSelenium 100 to 10,000 μg/LFlow 30 gpm to 2,300 gpmTotal suspended solids 1.4% to 17%Sulfate 1,500 to 35,000 mg/LChloride 1,000 to 28,000 mg/LCalcium 750 to 4,000 mg/LNitrate 10 to 1,000 mg/L
FGD Water “Typical” Ranges

Single Cycle Pulverized Coal Plant

Flue Gas Desulfurization System
P-
FGD Wet Scrubber
LimestoneSilo
Coal-Fired Steam Boiler
Electrostatic Precipitator
HydrocycloneSeparator
Ball Mill
OxidationAir Blower
StackGas/GasHeater
IDFans
VacuumBelt Filter
Gypsum Solids
FGD Blowdownto Wastewater Treatment
MM
P-
FGD Wet ScrubberFGD Wet Scrubber
LimestoneSilo
LimestoneSilo
Coal-Fired Steam BoilerCoal-Fired
Steam BoilerElectrostatic PrecipitatorElectrostatic Precipitator
HydrocycloneSeparator
Ball Mill
OxidationAir BlowerOxidationAir Blower
StackGas/GasHeaterGas/GasHeater
IDFans
IDFans
VacuumBelt Filter
VacuumBelt Filter
Gypsum Solids
FGD Blowdownto Wastewater Treatment
MMM

Selenium Speciation in Influent FGD Water Among Power Plants
Source: Electric Power Research Institute
0
2,000
4,000
6,000
8,000
10,000
12,000
14,000
Z - Untr
eated
FGD Was
tewate
r
Se1 - U
ntreate
d FGD W
astewate
r
Y - Untr
eated
FGD Waste
water
T - Untr
eated
FGD Was
tewate
r
8-D F
ilter E
ffluen
t
2-D Thic
kner
Overflo
w
6-D Thic
kner
Overflo
w
S - Hyd
roclone
Ove
rflow
D-3 Hyd
roclon
e Ove
rflow
D-4 Hyd
roclon
e Ove
rflow
C-6 Hyd
roclon
e Ove
rflow
C-3 Hyd
roclon
e Ove
rflow
S2 - W
WTP Influ
ent
S7 - W
WTP Influ
ent
F-1 W
WTP In
fluen
t
L1 - W
WTP In
fluent
S5 - W
TTP Influ
ent
S11 - W
WTP Influ
ent
S14 - W
WTP Influ
ent
S15 - W
WTP Influ
ent
1-D C
entrif
uge C
entra
te
U - Untre
ated F
GD Was
tewater
5-D Thic
kner
Overflo
w
9-D Thic
kner
Overflo
w
7-D Thic
kner
Overflo
w
4-D Thic
kner
Overflo
w
B-2 Thic
kner
Overflo
w
B-4 Thic
kner
Overflo
w
3-D C
entrif
uge C
entra
te (6/
30/08
)
3-D C
entrif
uge C
entra
te (6/
27/08
)
Selenium IV Selenium VI SeCN MeSe(IV) SeMe SeSO3 Other
Con
cent
ratio
n (u
g/L)

Flue Gas Scrubber Desaturation System
Chemical MixTank
Flocculant
EqualizationTank
Organo-sulfide
M M
EffluentMedia Filter
Treated Effluent
SecondaryClarifier
Sand Filter
Plate-and-Frame Filter Press
M
M
FGD Wastewater
DesaturizationTank
PrimaryClarifier
Lime Silo
Lime Mix Tank
Solids Blending Tank
M
M
Iron Salt for co-precipitation &
coagulation, Acid for pH adjustment
Chemical MixTank
Chemical MixTank
Chemical MixTank
Flocculant
EqualizationTank
EqualizationTank
Organo-sulfide
M M
EffluentMedia Filter
Treated Effluent
SecondaryClarifier
Sand Filter
EffluentMedia Filter
EffluentMedia Filter
Treated EffluentTreated Effluent
SecondaryClarifier
SecondaryClarifier
Sand Filter
Plate-and-Frame Filter PressPlate-and-Frame Filter Press
M
M
FGD Wastewater
DesaturizationTank
PrimaryClarifier
Lime Silo
Lime Mix Tank
Solids Blending Tank
M
M
M
FGD Wastewater
FGD Wastewater
DesaturizationTank
DesaturizationTank
PrimaryClarifierPrimaryClarifier
Lime Silo
Lime Mix Tank
Solids Blending Tank
M
M
Iron Salt for co-precipitation &
coagulation, Acid for pH adjustment
Chemical MixTank
Chemical MixTank

Characterization of Selenium by Industry: Mining
•
Coal Surface Mining–
Se located in upper and lower boundary of the coal seam
–
Overburden management–
Se issue dependent on geography: Northern vs.. Southern Appalachia
–
Primarily selenate (10-
1,000 μg/L)
–
Stormwater, surface water and groundwatercontact

Characterization of Selenium by Industry: Mining•
Metal Mining–
Extraction processes cause release of Se
–
Overburden management
–
Tailings ponds–
Primarily selenate (20-
4,000 μg/L)
Source: US EPA, Mine Waste Technology Program Project 46, Cortez Gold Mine Project Nevada

Characterization of Selenium by Industry: Mining
•
Phosphate Mining –
Similar to Surface Coal mining–
Se associated with phosphate rock and mudstone
–
Overburden from mine pits exposes Se to air
–
Se oxidizes and leaches from overburden
–
Stormwater, surface and groundwater contact
Source: www.smokycanyonmine.com

Characterization of Selenium by Industry: Mining
•
Mining, Bitumen–
Tailings produced as a result of the extraction process consist of a mixture of water, sand and fine clay particles
–
Tailings ponds–
Stormwater
and surface water contact
Source: Canada’s Oil Sands a Supply to Market Outlook to 2015, National Energy Board, An Energy Market Assessment , October 2000, pp 23-24.

Characterization of Selenium by Industry: Agriculture
•
Drainage in areas with soils that contain high Se
•
Se is concentrated through excessive irrigation and evaporation in the Imperial Valley
•
Se concentrations vary widely with geography
–
Southern California–
San Joaquin Valley•
Selenate is the predominant species found in agricultural drainage
•
Se levels typically range from 10 to 1,000 ug/L
Source: USGS

Characterization of Selenium by Industry: Oil and Gas
•
Wastewater streams containing Se at Bay Area Refineries (WSPA, 1995):
•
Stripped Sour Water is the primary source of Se in a refinery:
–
Total Selenium: 170 to 4,870 µg/L–
Selenocyanate: 53 to 100% of Total•
Desalter Effluent•
Biotreater Effluent
–
Total Selenium: 11 to 300 µg/L–
Selenite: 54 to 97% of Total–
Selenate: ND to 15% of Total
•
Produced Water–
San Juan (up to 80 µg/L)

Integrated Refinery
Source: Integrated Pollution Prevention and Control, Reference Document on the Best Aviailable
Techniques for Mineral Oil and Gas Refineries, February 20003, European Commission, Pg 23
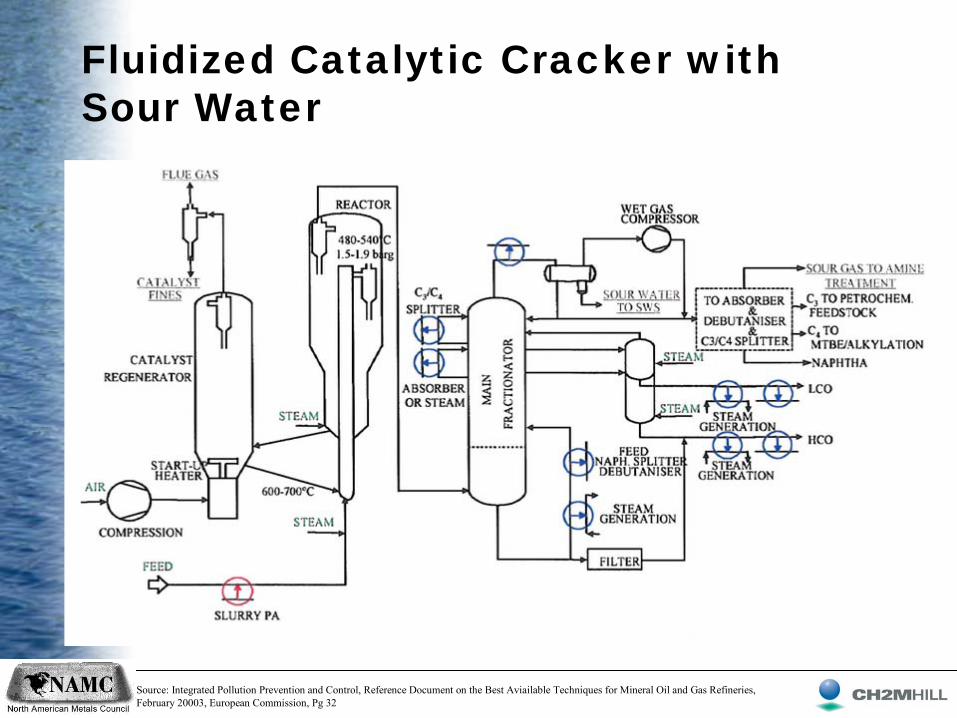
Fluidized Catalytic Cracker with Sour Water
Source: Integrated Pollution Prevention and Control, Reference Document on the Best Aviailable
Techniques for Mineral Oil and Gas Refineries, February 20003, European Commission, Pg 32

Typical Upstream Systems
Common Production PracticesCommon Production Practices
Source: Photo by Jack Knutson, Front Range Realty, Mesa, CO

Upstream Natural Gas and Steam Assisted Gravity Drainage Production

Prevention Strategies by Industry
•
Power Generation–
Wet to Dry Fly Ash Handling Conversion–
Complete Recycle for FGD Water•
Mining–
Encapsulated Overburden Areas–
Position Final Pit At Highest Elevation–
Stream Alteration and Reconstruction–
Caps and Covers•
Agriculture –
Optimize Irrigation Practices by Conducting Soil Moisture Monitoring
•
Oil and Gas–
Sour water management–
Desalting

Crude Desalting
Source: Integrated Pollution Prevention and Control, Reference Document on the Best Aviailable
Techniques for Mineral Oil and Gas Refineries, February 20003, European Commission, Pg 40

Sour Water Stripper
Source: Integrated Pollution Prevention and Control, Reference Document on the Best Aviailable
Techniques for Mineral Oil and Gas Refineries, February 20003, European Commission, Pg 368

Overview of Technologies for Removal of Selenium in Water•
Physical–
reverse osmosis –
nanofiltration–
evaporation ponds–
ion exchange•
Chemical–
iron co-precipitation–
zero valent iron–
cupric co-precipitation–
electrocoagulation•
Biological–
algal-bacterial Se removal–
algal volatilization–
heterotrophic microbial reduction (active and passive)
–
constructed wetlands
•
Physical, cont.–
ferrihydrite
and activated alumina adsorption
•
Chemical, cont.–
enhanced cementation–
photoreduction–
carbohydrazide
•
Biological, cont.–
phytoremediation

Reverse Osmosis
•
Pressure driven membrane filtration technology
•
Microfiltration for removal of total suspended solids that will foul reverse osmosis
•
High pressure is required to force the water through the RO membranes
•
Generates high quality effluent•
Effluent requires reconstitution to ensure isotonic discharge
•
Brine requires further treatment –
Evaporator + Crystallizer
Source: GE Water

Different Membrane Configurations
Source: CH2M HILL Membrane Design Guide

Range of Filtration
BacteriaMetal Ion
Micrometers(Log Scale)
Angstorm Units(Log Scale)
Approx. Molecular Weight
RelativeSize of
CommonMaterials
Processfor
Separation
Reverse Osmosis
Aqueous SaltAqueous Salt
Carbon Black GiardiaCyst
Human HairBeach Sand
MistMistBacteriaVirusVirusMetal Ion
AtomicRadius
SugarSugar
GelatinGelatin
Colloidal Silica
Paint PigmentPaint Pigment
Coal DustPin
PointBlue Indigo Dye
A.C. Fine Test DustA.C. Fine Test Dust
Milled FlourMilled Flour
GranularActivated
GranularActivated
Asbestos
PollenPollen
Ionic Range Molecular RangeMacro Molecular RangeMicro Particle Range Macro Particle Range
Ultrafiltration
Nanofiltration Microfiltration
Media Filtration
0.001 0.01 0.1 1.0 10 100 1000
101 102 103 104 105 106 107
100 200 100010,00020,000 100,000 500,000
Cryptosporidium
Carbon
ST Microscope Scanning Electron Microscope Optical Microscope Visible To Naked Eye
Source: CH2M HILL Membrane Design Guide

Iron Co-Precipitation
•
Species Treated: Predominantly selenite•
Works best at pH of 4 to 6
•
Advantages: –
Ability to remove other metals and enhance solids removal
•
Disadvantages: –
Does not treat to low ppb levels of Se–
Does not remove selenate–
Requires polishing treatment in order to achieve low ppb Se–
Sludge production requires handling and disposal

Zero Valent Iron (ZVI)•
Powder, granular or fibrous•
Uses oxidation of Feo
to chemically reduce selenite and selenate to elemental selenium or iron selenide
which is then removed by solids separation processes
•
The resulting Fe2+
from the reaction is precipitated as a hydroxide by raising the pH and/or through further oxidation to Fe+3
•
Demonstrated Se Species Treated: selenite, selenate, selenocyanate
3Fe°
+ SeO42-
+ 8H+
→ 3Fe2+ + Se°
+ 4H2
O2Fe°
+ SeO32-
+ 6H+
→ 2Fe2+ + Se°
+ 3H2
O

Zero Valent Iron (continued)
•
Level of Demonstration:–
Bench-Scale: Refinery–
Pilot-Scale: Power Generation, Mining
•
Removal: <50 ppb Total Se•
Confounding Factors: Nitrate Competes with Se for Fe–
NO3-
+ 4Fe°
+ 10H+
→
4Fe2+
+ NH4+
+ 3H2
O•
Limitations: High chemical usage, waste disposal

Step 1: Operation
Water with SeO3
-2 and SeO4
-2
Water with Chlorides
Step 2: Acid regeneration
+
Sodium Chloride+ +
+
Ion ExchangeSeO4
-2
SeO3-2
Cl-
Cl-
Cl-
Cl- SeO4-2
SeO3-2
SeO4-2
SeO3-2
SeO4-2
SeO3-2
Cl-
Cl-
Cl-
Cl-
Water with SeO3
-2 and SeO4
-2

Ion Exchange
Source: Electric Power Research Institute
Anaerobic Microbial Reduction-Key Terminology Review
•
Biological Oxidation Reduction•
Electron Donor and Acceptors
•
Role of Key Constituents in water

Oxidation and Reduction
•
Oxidation -
Removal of electrons•
Reduction -
Addition of electrons
•
Oxidation and reduction must be balanced•
Electron Donor -
Material being oxidized
•
Electron Acceptor -
Material being reduced
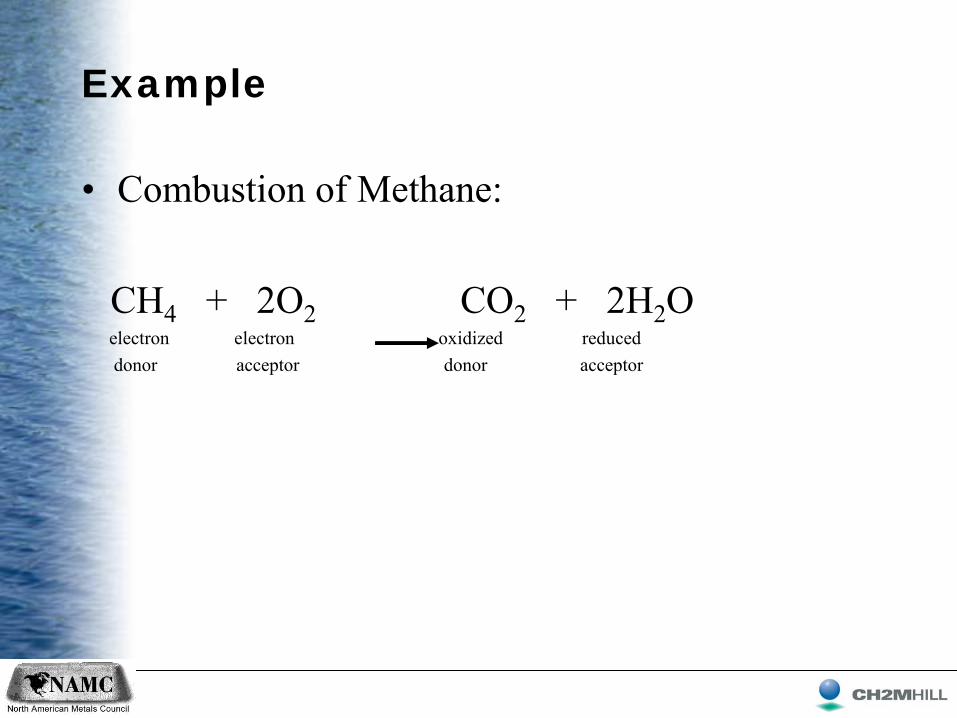
Example
•
Combustion of Methane:
CH4
+ 2O2 CO2
+ 2H2
Oelectron electron
oxidized reduceddonor acceptor donor acceptor

Key Wastewater Constituents
•
Electron donors (food for biomass)–
Organic Matter (ABMet®
Nutrient {e.g. molasses} }) or other simple carbon source
–
Measured and expressed as COD–
CO2
and biomass are the products
•
Electron acceptors–
Oxygen (aerobic environment)
•
Preferred acceptor•
Reduced product: H2 O

Key Wastewater Constituents
•
Electron acceptors (continued)–
Nitrate
•
Used only when oxygen is absent•
Used by many bacteria (denitrifying bacteria)
•
Preferred acceptor in absence of oxygen•
Reduced product: N2
–
Selenate and Selenite•
Used only when oxygen is absent
•
Used by a subset of denitrifying bacteria•
Selenate and Selenite reducers prefer to use nitrate
•
Reduced product: Se (insoluble)

Key Wastewater Constituents
•
Electron acceptors (continued)–
Sulfate
•
Used only when oxygen is absent•
Used mainly when nitrate is absent
•
Sulfate reducing bacteria do not use nitrate, selenate, or selenite
•
Sulfate reducers will compete for electron donor.•
Reduced product: S-2 a toxicant that can be controlled

Faculative Heterotrophs
•
Stressed oxygen and near neutral pHs•
Typical observed yields 0.1 to 0.3 kg VSS/kg COD removed
•
Varies by carbon substrate methanol lower than more complex carbohydrates
•
Carbon selection can limit performance•
Mesophilic
heterotrophs
operate best at between
15 and 36 degrees celsius•
Typical observed yields 0.4 to 0.8 kg TSS/kg oxyanion
(e.g. nitrate, selenate, perchlorate)
removed

Anaerobic Microbial Reduction of Selenium•
Bioreactor–
Suspended growth–
Fixed film•
Constructed Wetland•
Mesophilic
heterotrophs•
Requires–
Carbon source for microbes–
Anoxic conditions–
Selenate, selenocyanate, and selenite biochemically
reduced in reactor or wetland to elemental selenium or selenides
(e.g. dimethyl
selenide)–
Reactions driven by redox
conditions
–
Potential re-solubilization
of Se if ORP is positive
–
Residuals Management
Source: Electric Power Research Institute

Anaerobic Reduction- ABMet® System
SolidsRemoval/Cooling
Nutrient Tank
NutrientPump(s)
Feed Pump(s) ABMet Reactor 1 ABMet Reactor 2Second-Stage
Pump(s)Effluent
Pumps(s)
Effluent
Flush Storage
Spent Flush Storage& Settling
SolidsDisposal
Source: GE Water

Anaerobic Reduction- ABMet® System•
Selenium Removal: Demonstrated to remove Se to low ppb (<5 ppb) in pilot-scale and full-scale demonstrations
•
Level of Demonstration:–
Pilot-Scale: Mining, Agriculture–
Full-Scale: Power Generation
•
Limitations: –
Requires long hydraulic residence times (4-6 hrs)–
Low hydraulic residence times (1-2 gpm/square feet)–
Channeling will limit performance–
More prone to scale formation.–
Generation of H2
S possible, especially during periodic degassing operations
–
Polishing technology, requires pre-treatment for TSS removal

Fluidized Bed Reactor (FBR)•
Wastewater is passed through a granular solid medium (e.g., sand
or GAC) at high enough velocities to suspend the medium and cause it to behave as though it were a fluid
•
Seeded with heterotrophic facultative anaerobic/anoxic bacteria that are suited for nitrate and Se removal.
•
Results in better reaction kinetics thereby requiring lower residence time requirements and operating at much higher hydraulic loading
rates •
Will be a third the size and cost of a downflow
attached growth filter
•
Carbon substrate and phosphorus pumped into the FBR•
Oxygen absent in the biological reactor•
Nitrate in the water has been reduced to nitrogen gas•
Limitations: Not currently tested, 1st
pilot test going online in 2010•
Very common and successfully applied in very similar applications nitrate and perchlorates

FBR

Wetlands Selenium

Wetland Improvements – Subsurface Flow to Reduce Risk
•
More effective technology when Se and loadings are high, flow volumes are low.
•
Gravel beds that serve as the rooting medium for salt-tolerant emergent wetland plants (such as bulrush), with water flowing through the gravel.
•
Oxidation-reduction processes in the plant root zone (especially due to the interactions of the microbial community and the plant roots) remove Se uptake and volatilization.
Subsurface Flow (SSF) Constructed WetlandSubsurface Flow (SSF) Constructed WetlandAdjustableStand Pipe
DistributionPipe
Low Permeability Soil

Peat Based Vertical UpFlow Wetland, Oxnard CA

Vertical Flow Sustains Viable Native Brackish Habitat
Time 10 Months

Alternate Concept Subsurface Flow: Safety and O&M
EQ B
asin
Biological Process VF Wetland SSF
Wetland
VF Wetland SSF Wetland
VF Wetland SSF Wetland
SF Wetland
1 2 3
AshPond
Cell No.
SF Wetland

Vertical Upflow Wetlands
•
Introduce highest Se concentrations below-ground for greatest ecological safety
•
Parallel systems for operational redundancy
•
Gravel media with bulrush and/or common reed for ease of harvest
Dulles Airport De-Icing Biological Treatment Units
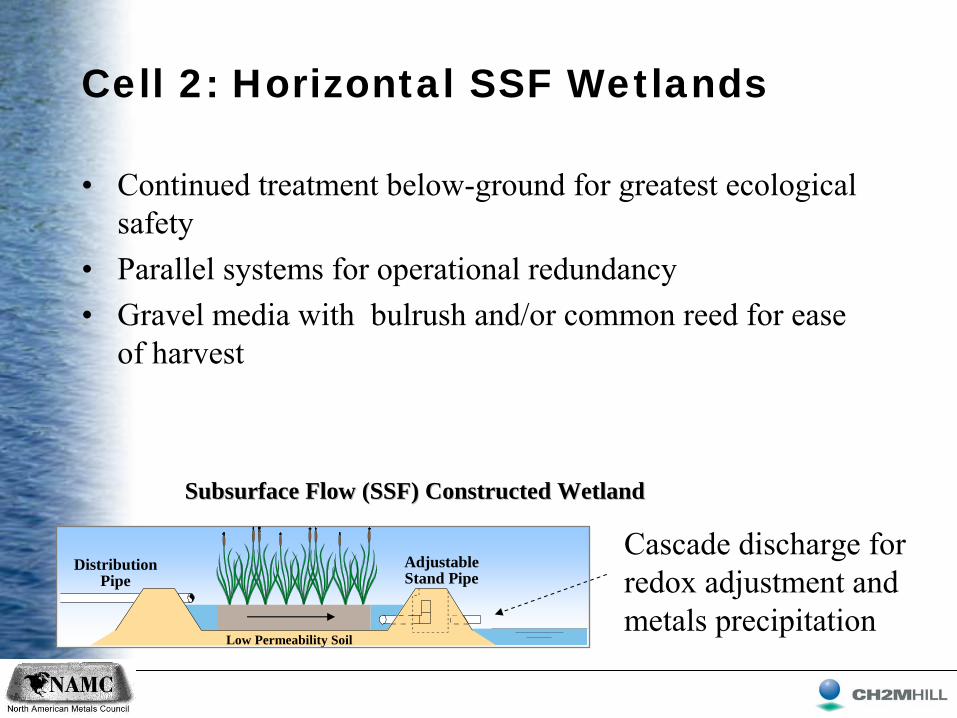
Cell 2: Horizontal SSF Wetlands
•
Continued treatment below-ground for greatest ecological safety
•
Parallel systems for operational redundancy•
Gravel media with bulrush and/or common reed for ease of harvest
Subsurface Flow (SSF) Constructed WetlandSubsurface Flow (SSF) Constructed Wetland
AdjustableStand Pipe
DistributionPipe
Low Permeability Soil
Cascade discharge for redox
adjustment and
metals precipitation

Cell 3: Surface Flow Wetland•
Aerobic system for final precipitation of low-
concentration metals
•
Parallel systems for operational redundancy
•
Se-free wildlife habitat demonstrates environmental protection

Pilot Testing- Wetlands
•
Technology confirmation Essential
•
Conduct pilot study of preferred flow regime
•
Use Testing to develop long-
term O&M plan for wetlands and modify final design accordingly.
•
Use testing to evaluate alternative design for subsurface flow wetland concept.

Constructed Wetland
•
Surface-Flow Wetlands: Modest selenium removal, require substrate addition to achieve low ppb Se removal
•
Subsurface Flow Wetlands-
Combine organic-rich substrate with anoxic conditions to create reducing conditions for Se removal
•
Limitations: –
Require several acres of land
–
May leave contaminated water accessible to wildlife

Evaporation
•
Mechanical evaporator•
Evaporation with distillate recovery or crystallization
•
Atmospheric evaporation ponds•
Solar Gradient Ponds

Zero Liquid Discharge: Brine Concentrator
Source: Veolia
Water
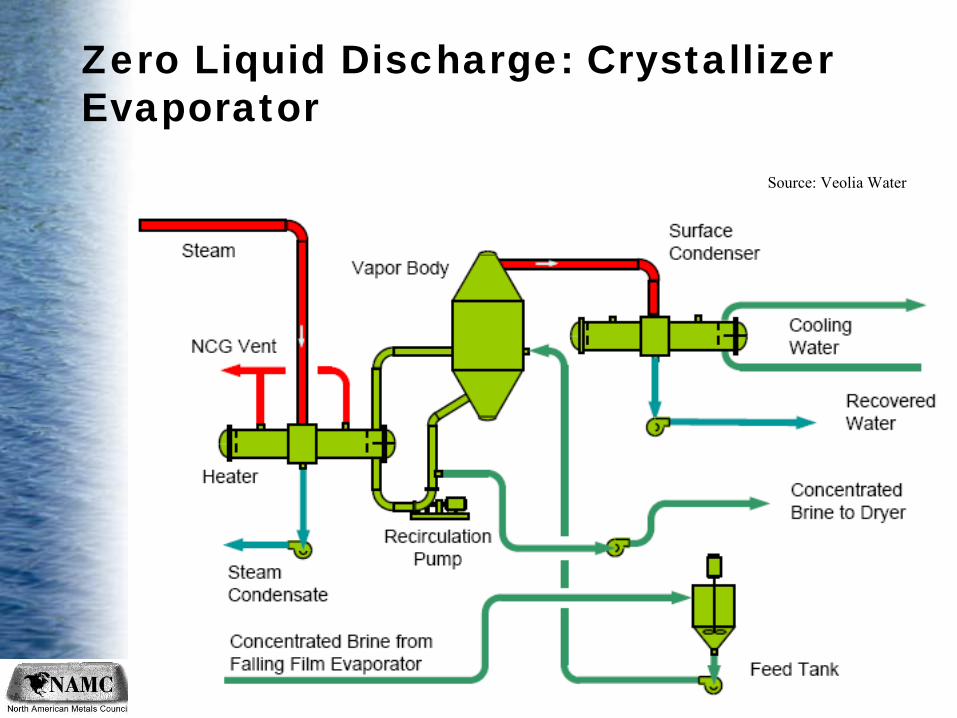
Zero Liquid Discharge: Crystallizer Evaporator
Source: Veolia
Water

Secondary Processing/Residuals Management
•
Further Treatment Required for Concentrated Membrane Reject and Ion Exchange Regenerant
•
Biological and Chemical Residuals Dewatering and Disposal
•
Evaporation Brine/Salt Cake Disposal•
Landfill–
Solids may need to be disposed as hazardous waste–
Se is a D010 characteristic hazardous waste

Full-Scale Industry-Specific Approaches to Selenium Treatment: Power Generation•
Most plants treat for solids removal, others for metals removal-
get some Se removal with these technologies
•
Only small % of plants have Se treatment•
Those that do have multi-stage treatment
Settling Ponds, 55%Chemical
Precipitation, 32%
Anoxic/Anaerobic Biological, 4%
Passive Treatment, 2%
Other Handling, 8%
Source: US Environmental Protection Agency, 2009

Industry-Specific Approaches to Selenium Treatment: Oil & Gas

Overview of Case Studies Within Review•
Power Generation (total of 10 cases)–
Iron co-precipitation: 6 sites, full-scale–
ABMet®: 2 sites, full-scale–
Free Surface Wetlands: 2 sites, full-scale–
Vertical Flow Wetland: 1 site, pilot-scale•
Mining and Agriculture–
Reverse Osmosis: 1 site, full-scale–
Iron Co-precipitation: 1 site, full-scale–
Zero Valent
Iron: 1 site, pilot-scale–
Catalyzed Iron Cementation: 1 site, pilot-scale–
Zero Valent
Iron + Microbial Reduction: 1 site, pilot-scale•
Oil and Gas–
Iron Co-precipitation: 1 site, full-scale–
Constructed Wetland: 1 site, full-scale

Case Studies for Power Generation: Lessons Learned
•
Physical/Chemical Treatment–
Solids Separation removes particulates only–
Selenate is not removed by conventional iron precipitation: ferric chloride and ferrous chloride used
–
Need to oxidize selenocyanate to selenite•
There are few long-term full-scale available technologies for Se
reduction
–
Solids separation required–
Constructed wetlands-
not currently optimized to achieve low ppb Se removal
–
Anoxic/anaerobic biological-
two plants went online 2008, total of 5 FGD water plants to be in construction/operations by 2010
•
ABMet®

Case Studies for Mining and Agriculture•
Prevention vs. Treatment–
Various practices available to minimize or prevent water contact with rock or overburden soils containing Se
•
Control Source–
e.g. Permeable reactive barrier or biobarrier
•
Treatment–
Most solutions in developmental stage, either pilot-scale or bench-scale for low ppb Se removal
Source: Powell and Associates

Case Studies for Oil and Gas: Lessons Learned
•
Characterize source of Se and determine whether it is present as particulate or dissolved, selenite, selenate, selenocyanate, other
•
Source Treatment vs. End of Pipe Treatment•
Multi-Staged Treatment may be needed to achieve low ppb Se

Cost of Treatment•
Important to understand the difference between direct and indirect costs
•
Total Installed Cost Typically Best•
Vary by location
•
Consider Life Cycle Costs
Note: Adapted from SALTON SEA Ecosystem Management Plant Draft Report, appendix B (February 2005). The treatment cost includes capital, reagent, operation and maintenance, waste handling, and power
Process Total Treatment Cost ($/AF)
ABMet® 98 to 391
Lime 326 to 1,629
Filtration 978 to 2,607
Reverse Osmosis 1,140 to 2,933
Wetlands <650
Ion Exchange 490 to 978
Chemical Precipitation 326 to 1,629
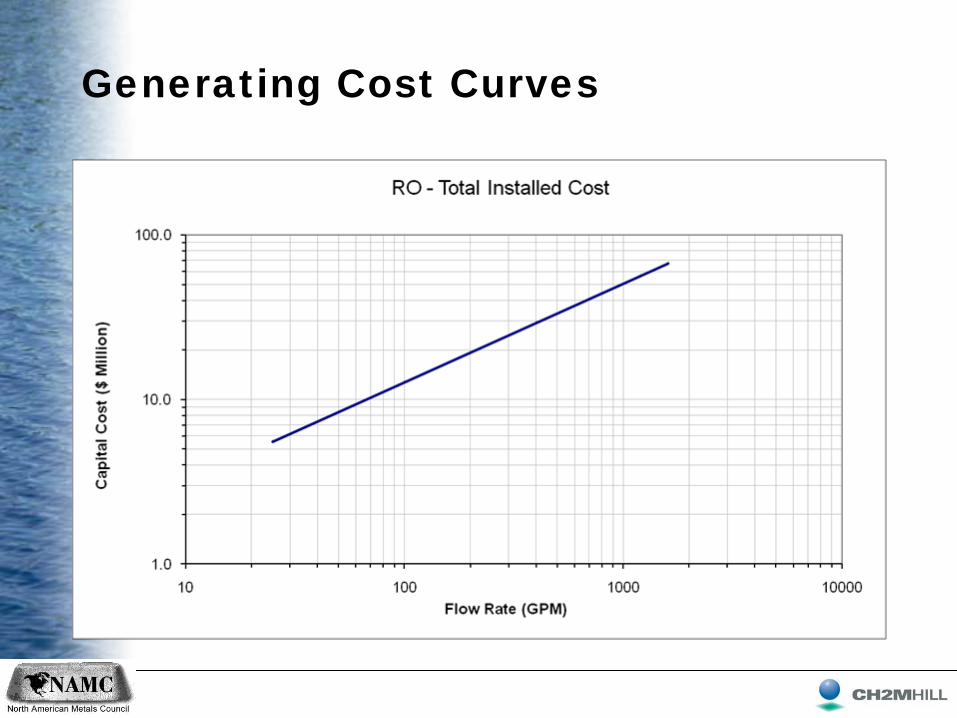
Generating Cost Curves

Conclusions•
Achieving low Se level for some industrial dischargers is very challenging
•
Selection of the technology is highly dependent on the speciation of Se
•
Very few technologies capable of achieving low levels are fully demonstrated in the field or have been in operation for extended periods of time
•
Information exchange among and within industries is needed to advance technologies for Se removal
•
There is no “one-size fits all to treatment”: Significant variation exists even within each industry sector, sometimes within the same facility
•
Matrix characteristics impact the application of treatment technologies -
Performance must be validated on a case-
by-
case basis•
Need to Consider Process Engineering Experiences with System Configurations and Application of the Science

Knowledge… Commitment... Integrity… at Your Service
Review of Available Technologies for the Removal of Selenium from Water
Discussion: Representative Case Studies
North American Metals CouncilSelenium Work Group
November 24, 200911:00 to 11:45 a.m.

Representative Case Studies
• Case Studies are based on three industry sectors:– Power Generation– Mining and Agriculture– Oil and Gas
• Review is focused on examples of full-scale and pilot- scale (including scaled-up to full-scale) treatment technologies for Se removal in water
• Based on examples of technologies applied to sites in the United States and Canada
• A representative set of case studies from the Review is presented for discussion

Case Studies: Power Generation Industry Sector
• Physical/Chemical– Iron co-precipitation (full-scale)
• ferrous chloride• ferric chloride
– Enhanced Iron Cementation (pilot-scale)
• Biological Treatment– ABMet® (full-scale)– Passive Treatment
• Surface Flow Wetland (full-scale)• Vertical Flow Wetland (subsurface) (pilot-scale)

Case Studies: Iron Co-PrecipitationPolymer
Equalization
Organosulfide
M M
Filter
Secondary Clarifier
Filter Press
M
M
Desaturation
Primary Clarifier
Lime
Sludge Tank
M
M
Ferric Chloride Acid

Case Studies: Iron Co-Precipitation, continued• Six case studies using iron co-precipitation presented in Review• All facilities are operating above the range typically optimal for Se removal (pH
4 to 6) to remove most other metals, generally operate above pH = 8– One facility performed pilot test to optimize Se removal using iron co-precipitation and
found optimal removal at pH = 5• Observations from data
– Facilities that operate with lime addition followed by clarification followed by iron addition tended to re-solubilize selenite through clarification
– Facilities that operate with lime addition and iron addition in the same reactor prior to clarification did not see this issue
– Facility with lowest operating pH exhibited highest Se removal (pH 6.5)• Influent Se: Ranged between 350 ppb to 19,000 ppb among six sites• Se Removal: 28% to 85% removal• Effluent Se: Between 50 ppb to 3,000 ppb• Flow Ranges: 30 usgpm to 500 usgpm• Limitations:
– Not able to treat to low ppb for Se– Sludge production– Site using ferrous chloride reported periodic issues with solids dewatering
• Costs: $15 (2000) to $30 (2009) MM; Operating Costs $0.5MM to $2 MM/year

Case Study: Biological Treatment Using ABMet®
Source: Electric Power Research Institute

ABMet Systems Installed at Power Plants
Site PG3
Site PG2
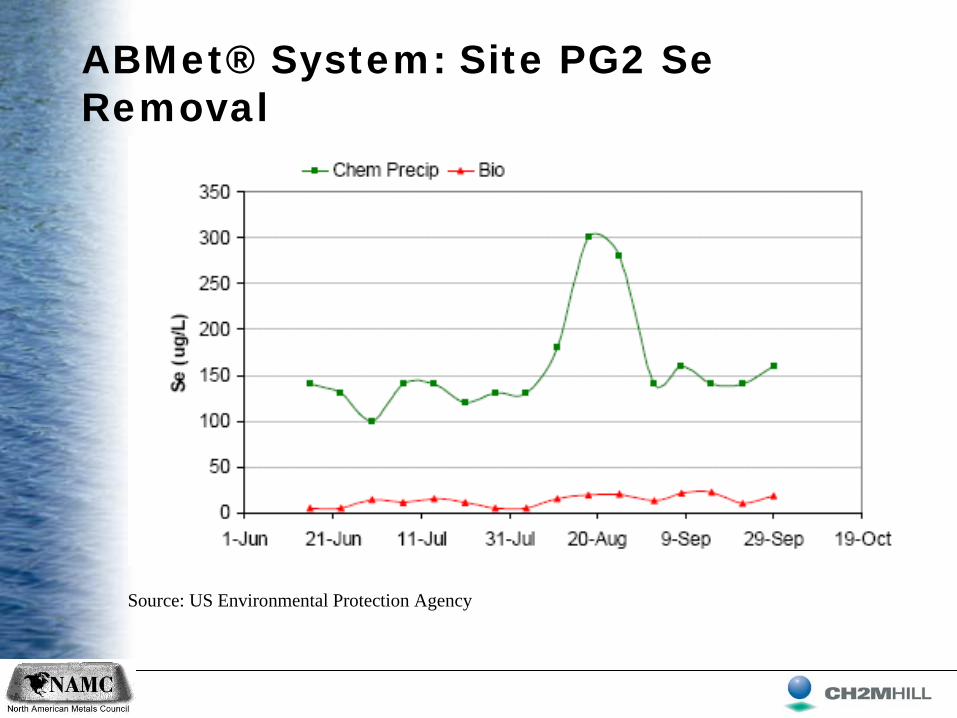
ABMet® System: Site PG2 Se Removal
Source: US Environmental Protection Agency

ABMet® System: Site PG3 Se Removal
0
200
400
600
800
1000
1200
1400
Inlet A Train B Train C Train D Train
Sample Stream
[Se]
ug/
LParticulate Se
Dissolved Se

Case Study: Biological Treatment Using ABMet®
• Se Removal: – Both Sites PG2 and PG3 show removal of Se to low ppb
to meet effluent limitations– PG2 showed consistent Se removal below detection limit
(<10 ppb)• Considerations:
– Requires pre-treatment • Settling Pond- if large acreage is available• Physical/chemical treatment plant
• Space Requirements: – Site PG2: 2.5 acres for physical/chemical and biological
systems• Costs: Contact GE

Case Study: Vertical Flow Wetland (Pilot-Scale)
• Description: Organic-rich substrate is used to generate reducing conditions (fresh mushroom compost)
• Location: Coal-Fired Power Plant, FGD Water Treatment after Solids Separation to remove particulate Se
• Se Removal:– Influent total Se concentration (average) = 206 ppb – Influent to the pilot study was mainly comprised of selenite to selenate ratios of 2:1 or greater – Achieved an average 85% removal to average 30 ppb – Selenate and effectively removed
• Flow: 0.4 usgpm• Test Length: 10 months• Limitations: Influent is relatively low concentration Se compared to other FGD water
Source: Electric Power Research Institute

Case Study: Enhanced Iron Cementation (Pilot-Scale)• Description:
– Pilot-scale system consisted iron cementation reactor/recycle and the pH adjustment tank
– Iron powder was fed into the iron reactor
• Se Removal– Flow: 0.4 usgpm– Influent: 4,300 ppb– Maximum removal occurred
at a reaction time of 150 minutes and pH of 4.5, which resulted in an effluent Se concentration of 159 ppb
Source: Electric Power Research Institute

Case Studies: Mining and Agriculture Industry Sector• Chemical Precipitation
– Ferric sulfate/barium chloride– Ferric sulfate/copper sulfate catalyst– Ferrihydrite adsorption– Iron cementation
• Reverse Osmosis • Evaporative Ponds• Biological
– Active Microbial Reduction and ZVI– Passive Biological Treatment (with and without ZVI)– Constructed Wetland

Case Study: Reverse Osmosis
• Description: Chemical Precipitation• Location• Se Removal• Flow• Test Length

Case Study: Passive Biological Treatment (Pilot-Scale), CRO mine, Alberta, Canada
Toe of Waste dump
Leyland pond
Se0Reduction SeO3
2-
SeO42-
Pilot BCR
Bacteria, organic media

Case Study: Passive Biological Treatment (Pilot-Scale), CRO mine, Alberta, Canada
Average Influent: 190 ppbAverage Effluent: 70 ppb

Case Study: Passive Biological Treatment (Pilot-Scale)• Description: Biological Se reduction
using agricultural waste and other natural materials as nutrient supply
– Single solid-phase passive biochemical reactor cell
– Bioreactors consisted of varying portions of sawdust, hay, wood chips, limestone, zero valent iron, cow manure
• Location: Treating seleniferous groundwater from a groundwater interception trench at a sand and gravel operation in Colorado River in western Grand Junction, CO
• Se Removal: – Average Influent: 34 ppb– Average Effluent: 5 ppb– Up to 98% removal of total Se on a
consistent basis• Flow: 2 to 24 usgpm• Test Length: 12 months
Source: Golder Associates, Inc.

Case Studies: Oil and Gas Industry Sector
• Iron Co-Precipitation• Constructed Wetland• Pilot-Scale Studies for Following Technologies
at Refineries:– Zero Valent Iron– Iron Co-precipitation– Electrocoagulation & Microfiltration

Case Study: Constructed Wetland at Chevron Richmond, CA• Description: Full-scale wetland at the Chevron Refinery adjacent to
the San Francisco Bay, California• Removal:
– Influent: receives flows of 1,000 usgpm containing 10-30 ppb (predominantly selenite)
– Biological volatilization may have accounted for as much as 10-30% of the Se removed
– Effluent concentrations below 5 ppb• Footprint: 90-acre• Limitations:
– Provides wildlife habitat which has led to concerns with health effects of Se on birds susceptible to Se
– Chevron modified part of wetland to deter bird use in inflow cell; last cell modified to encourage wildlife, which resulted in decreased Se in bird eggs
• Costs: Not available