review of competition in the south african ... of competition in the south african health system...
TRANSCRIPT
REVIEW OF COMPETITION IN THE
SOUTH AFRICAN HEALTH SYSTEM
Produced for the Competition
Commission
FINAL
Prof Alex van den Heever
Chair of Social Security
Graduate School of Public and Development Management
University of the Witwatersrand
19 JUNE 2012
CONTENTS
PART A ........................................................................................................................................... 5
BACKGROUND AND CONTEXT ........................................................................................ 5
PART B ........................................................................................................................................... 7
LITERATURE REVIEW ............................................................................................................ 7
Mexico ................................................................................................................................... 19
Brazil ...................................................................................................................................... 20
Peru ........................................................................................................................................ 20
Conclusions .......................................................................................................................... 22
PART C ......................................................................................................................................... 24
DOMESTIC REVIEW............................................................................................................... 24
Formalization of a health system from 1910 ................................................................... 25
The private system and medical schemes ......................................................................... 26
The Regulation of Tariffs and Payments: 1968 to 1986 ................................................ 27
The “Free Market” Reforms: 1984 to 1989 ..................................................................... 28
The period 1990 to 1994 .................................................................................................... 31
The period of scheme deregulation 1994 to 2000 .......................................................... 32
The period of medical re-regulation from 2000 to the present .................................... 37
Overview ............................................................................................................................... 48
Medical schemes and health insurance ............................................................................. 48
Third-party administrators and managed care intermediaries ....................................... 49
Medical scheme advisors (brokers) ................................................................................... 49
Hospitals ............................................................................................................................... 49
General Practitioners and Specialists ................................................................................ 50
Medicines .............................................................................................................................. 50
Medical products (medical consumables and devices) ................................................... 51
Market structure interventions that could improve competition ................................. 54
Competition concerns falling within the ambit of the Competition Commission .... 54
Market structure interventions that could improve competition ................................. 56
Competition concerns falling within the ambit of the Competition Commission .... 57
Market structure interventions that could improve competition ................................. 59
Competition concerns falling within the ambit of the Competition Commission .... 59
Market structure interventions that could improve competition ................................. 60
Competition concerns falling within the ambit of the Competition Act .................... 60
Market structure interventions that could improve competition ................................. 69
ii
Competition concerns falling within the ambit of the Competition Commission .... 70
Market structure interventions that could improve competition ................................. 77
Competition concerns falling within the ambit of the Competition Commission .... 78
Market structure interventions that could improve competition ................................. 79
Competition concerns falling within the ambit of the Competition Commission .... 80
General practitioners ........................................................................................................... 81
Specialists .............................................................................................................................. 84
Market structure interventions that could improve competition ................................. 89
Competition concerns with doctors GPs and specialists ............................................... 90
PART D ......................................................................................................................................... 92
FINDINGS AND RECOMMENDATIONS ........................................................................ 92
Overview ............................................................................................................................... 93
Strategic approach ............................................................................................................... 93
Consumers ............................................................................................................................ 93
Agents .................................................................................................................................... 94
Intermediate product providers ......................................................................................... 95
Final product providers ...................................................................................................... 96
Medical schemes and medical scheme intermediaries .................................................... 98
Hospitals ............................................................................................................................... 99
Doctors (GPs and specialists) ......................................................................................... 100
Medicines ........................................................................................................................... 101
Medical products (other than medicines) ...................................................................... 101
Reports: .............................................................................................................................. 102
Data sources: ..................................................................................................................... 103
iii
TABLES
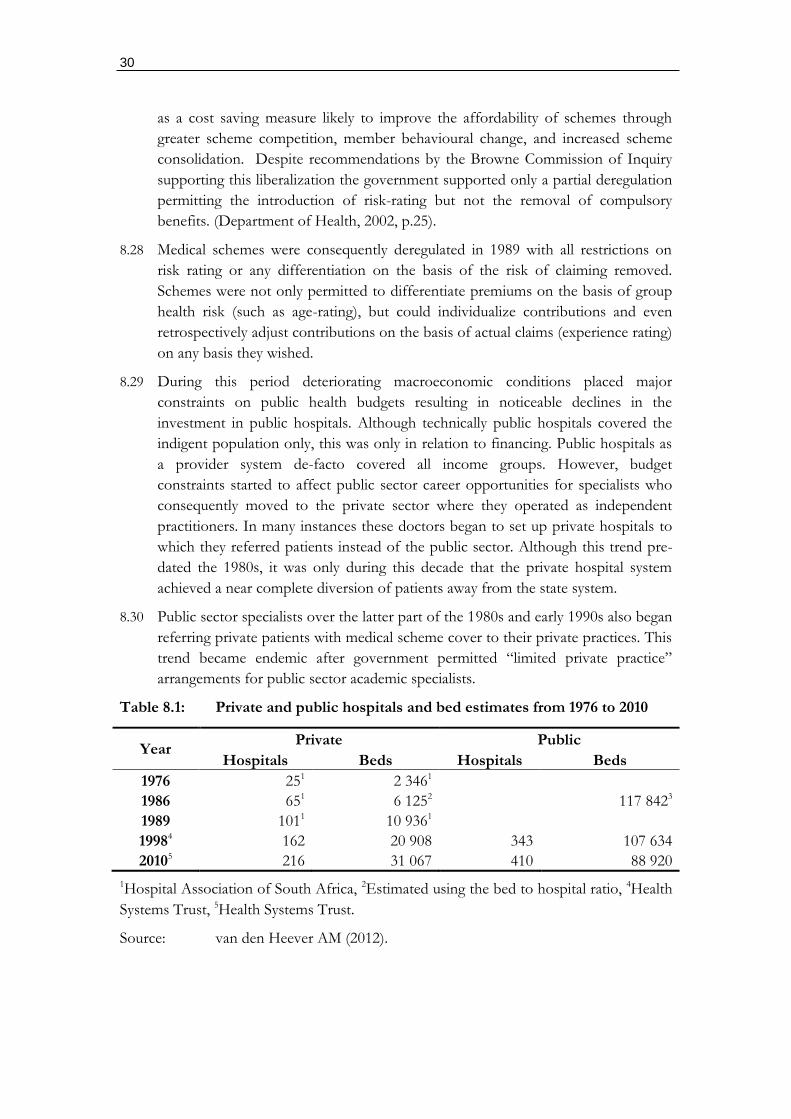
Table 8.1: Private and public hospitals and bed estimates from 1976 to 2010 .......... 30
Table 8.2: Changes in national hospital market concentration based on acute beds, from
1996 to 2010 .............................................................................................................. 37
Table 8.3: Real per capita cross contribution income, medical claims costs, and non-
health expenses for all registered medical schemes from 2000 to 2010 ........... 39
Table 8.4: Medical scheme real per capita claim cost changes from 1993 to 2010
compared to GDP expressed on a common index with 1993 = 100 ............... 42
Table 15.1: Regression results for the period 1996 to 2010: Dependent variable =
Hospital Costs (real, pabpa), Independent variable = HHI ............................... 62
Table 15.2: HHI index Calculations by Geographical Market in South Africa from
1996 to 2012 (including proposed merger) ........................................................... 66
FIGURES
Figure 5.1: Patient versus payer driven health insurance markets ......................................... 15
Figure 6.1: An EsSalud facility .................................................................................................... 21
Figure 8.1: Acute hospital beds in South Africa 1976 to 2010: public and private sector . 31
Figure 8.2: Beneficiary changes from 1990 to 2010, distinguishing open from closed
(restricted membership) schemes ........................................................................... 33
Figure 8.3: Non health expenditure in medical schemes from 1974 to 2010 expressed as a
percentage of Gross Contribution Income ........................................................... 33
Figure 8.4: Medical scheme gross contribution income per average beneficiary per annum,
2010 prices (Rands) ................................................................................................... 40
Figure 8.5: Medical scheme gross contribution income per average beneficiary per annum,
2010 prices (Rands): 5-year changes from 1994 to 2010 (percentage) .............. 40
Figure 8.6: Medical scheme per capita claims (2010 prices) from 1981 to 2010 ................. 42
Figure 8.7: Medical scheme real claim cost changes from 1993 to 2010 (pabpa) compared
to GDP expressed on a common index with 1993 = 100 .................................. 44
Figure 8.8: Index changes in real medical schemes expenditure on hospital and non-
hospital claims compared to GDP 1994-2010 (1993 = 100) .............................. 44
Figure 9.1: Inter-relationships within the private health system and the areas of significant
vulnerability ................................................................................................................ 46
Figure 14.1: Capitation agreements and reinsurance contracts compared ..................... 58
Figure 15.1: Scatter plot of HHI against real medical scheme hospital costs (pabpa)
from 1996 to 2012 .................................................................................................... 62
Figure 15.2: International comparison of MRI scanners, availability per 1 million
people, as of 2004 ..................................................................................................... 64
iv
Figure 15.3: International comparison of CT scanners, availability per 1 million
people, as of 2004 ..................................................................................................... 64
Figure 15.4: Index changes in the Producer Price Index (PPI) for medical products,
the average age of medical scheme beneficiaries, and private hospital costs
(pabpa) over a period from 1996 to 2010 .............................................................. 65
Figure 15.5: Medical claims (pabpa) in constant prices compared to real GDP
(expenditure and per capita expenditure) expressed as an index, with 1994 =
100 67
Figure 15.6: Distribution of medical schemes claims from 1994 to 2010 ...................... 67
Figure 18.1: Real cost pabpa for hospitals, specialists, and general practitioners for the
period 1981 to 2010 (2010 prices) .......................................................................... 82
Figure 18.2: Real cost pabpa for general practitioners differentiating between fee for
service and capitation arrangements for the period 1981 to 2010 (2010 prices)
82
Figure 18.3: Primary care capitation in South Africa ......................................................... 83
BOXES
Box 6.1: Experience of the Peruvian Health System ........................................................... 21
Box 8.1: The Sourthern Healthcare Joint Venture and Sanlam attempt to negotiate
provider contracts in the face of opposition from private hospitals and
specialists .................................................................................................................... 35
Box 16.1: Total product strategies by pharmaceutical originators ....................................... 73
Box 18.1: Rules to the Health Professions Act governing the conduct of medical
practitioners ............................................................................................................... 85
Box 18.2: Life Hospital Group approach to achieving doctor loyalty ................................ 87
Box 18.3: Objections to a ceiling on doctor shares in private hospitals by independent
hospital group NHN ................................................................................................ 87

5
PART A
BACKGROUND AND CONTEXT
6
1. BACKGROUND
1.1 The private health system in South Africa has raised competition concerns for
much of the past decade with hospital and specialist costs showing dramatic
increases which cannot be justified on economic grounds.
1.2 As the private health system serves over 8 million people (17% of the population)
it plays a substantial social protection role for income earners. However, the cost
increases are raising questions about the sustainability of this role and whether
public alternatives need to be considered.
1.3 This report provides a high-level market review of the private health system in
South Africa. Its purpose is to identify and prioritize areas for a more in-depth
market review to be carried out by the Competition Commission.
1.4 The report should be understood exclusively as a guide to the various aspects of
the market with relevance to competition. The evaluations or proposals should not
be regarded as definitive and are presented with the expectation that there will be
further investigation by the Commission before rendering any findings.
1.5 The information compiled in the report comes from various sources and processes
that needed to be rapidly compiled to assist the Commission. Where possible
relevant documents are referred to which can assist anyone interested in more in-
depth work.
1.6 With more time it would have been possible to be more definitive in a number of
areas. Nevertheless, it is hoped that sufficient information is provided to at least
guide how to approach an investigation into an industry as complex as the private
health system.
2. APPROACH
2.1 The report is divided into four sections, with the first (Part A) providing some
general context to the report, the second (Part B) covering a brief literature review
of health sector market and competition issues, the third (Part C) reviewing the
domestic context with both an historical and sectoral review, and the fourth (Part
D) offering strategic findings and recommendations.
2.2 The domestic review in Part C is designed to provide a flavor of the functioning
of the private health market with an emphasis on systemic considerations.
2.3 The findings and recommendations in Part D offer points of departure for the
Competition Commission to consider a deeper market review. These are divided
into two parts. The first offers a set of strategic competition findings and indicative
remedies regarding the private health system, while the second makes specific
recommendations on focus areas for a market review.
7
PART B
LITERATURE REVIEW
“The truth is that the public domain has no monopoly on virtue, the private sector no monopoly on vice. Public institutions are not run only by knights; private firms are not run only by knaves. Users are not pawns, but autonomous individuals who have the right to both voice and choice. The key is to understand the complexity of individual motivations and to design incentive systems accordingly.” (Le Grand, 2007, p.62)
8
3. ECONOMICS OF HEALTH CARE
3.1 Healthcare markets are well known to suffer from failures on both the demand and
supply side that can both harm access to coverage and drive up costs beyond what
a properly functioning market would permit. These include:
3.2 On the funding side:
3.2.1 Information asymmetries between an insurer and the insured:
An insurance applicant is often unable to understand the quality of the
insurance sold to them; and
An insurer does not know the health status of the insurance applicant.
3.2.2 Moral hazard concerns for insurers:
Insurance applicants have an incentive to apply for insurance only
when sick and leave after treatment; and
Insured individuals facing no or limited point-of-service costs have an
incentive to consume health care goods and services without limit.
3.3 On the supply side:
3.3.1 Patients cannot shop around for services and compare prices and service
quality, i.e. the search costs are high;
3.3.2 Patients face fundamental information asymmetries:
They do not know what to buy;
They do not know what they are buying;
They do not know the value-for-money of what they’ve received;
3.3.3 Moral hazard concerns are systemic as doctors are able to benefit
financially from their own advice.
3.4 Health insurance providers respond to moral hazard by insurance applicants by
risk-rating and risk-selection (refusing coverage). Healthcare providers respond by
providing more services, introducing technology at levels that are not needed, and
charging more over time. This conduct is not necessarily explicitly malicious and
can emerge unconsciously as the accumulation of many decentralized decisions
responding to a combination of professional and economic incentives.
3.5 Seen together market failures in unregulated private health markets will inevitably
converge on sub-optimal social and economic solutions. As a consequence health
markets are universally (structurally) regulated in one form or another. Residual
market failures persist where regulation is incomplete or compliance with
regulation inadequately enforced.
3.6 Incomplete regulation and enforcement may be the result of poor information on
the implications of various forms of market conduct which limit the grounds for
action by public authorities in democratic societies. A general review is therefore
9
provided here of findings regarding various aspects of competition and private
health markets.
4. FUNDERS
4.1 Health systems are diverse with significant differences in the organization of
funding and provision. Many health systems rely on non-competing funding
arrangements irrespective of whether they involve private funders and providers, as
in Germany, the Netherlands, and Belgium or public funders, such as the United
Kingdom, Canada, South Korea, and Taiwan. Whereas the public funding models
often rely on global budgets as a form of expenditure constraint, the multi-funder1
environments indirectly limit expenditure through controlling contribution
increases and regulating prices.
4.2 South Korea and Taiwan however fund private services on a fee-for-service basis
which limits their ability to control costs on a global budget basis. They
consequently ration indirectly through increased co-payments.
4.3 The United States (US) is an example of competing funders of private services, at
least for those families falling outside their two social insurance arrangements,
Medicare (for those over the age of 65) and Medicaid (for those falling below a
means test). However, each state regulates insurance differently. While some states
prohibit risk-rating and risk-selection, others allow it. No states have mandatory
minimum benefits and consequently product competition is extensive making it
next to impossible for consumers to prospectively determine the competing value
for money of different offerings. There are also substantial access differences,
depending upon whether you join an insurer through a group arrangement (such as
an employer) or as an individual (when self-employed or working for a small
employer).
4.4 Although the US provides interesting case studies for an analysis of insurer
competition, its market is so weakly regulated that it’s hard to exclude confounding
factors in empirical analyses. For instance, price increases and quality reductions
resulting from provider concentration may be masked by competition failures on
the funder side.
4.5 The evolution of so-called managed care in the US was at one point regarded as a
market-based solution to rising costs. However, there appears to have been no
systemic effects on costs despite geographically confined instances of cost
improvement. Nevertheless, some of the innovations to manage provider costs
have been adopted more effectively by countries with far greater regulation on the
funding side. For instance, the near universal acceptance of the Diagnostic Related
Group (DRG) approach to reimbursing hospitals has been adopted in most
1 Competing insurers, and empoyer-based occupational funds.
10
OECD countries irrespective of whether they are funding public or private
providers.
4.6 Trends in healthcare financing suggest the following range of funding approaches
for services:
4.6.1 General tax payer funded health services using global budget allocation
with the following variants:
Government funds finance dedicated non-competing public providers;
Government funds finance dedicated non-competing public providers
and some private providers on a selective contracting basis;
Government funds finance/reimburse competing public providers
with some private providers funded on a selective contracting basis;
and
Government funds finance/reimburse competing public and private
providers with some residual selective contracting.
4.6.2 Mandatory single-payer national health insurance (e.g. Taiwan and South
Korea) which funds private providers which could incorporate:
Fee-for-service reimbursement of non-competing private providers
(the current model in these countries);
Contracted reimbursement of competing private providers.
4.6.3 Mandatory multi-payer private insurance with the following variants:
Competing insurers that reimburse private providers;
Non-competing insurers with regulated contribution increases that
reimburse private providers (Germany, Netherlands, and Belgium);
and
Non-competing insurers that fund their own dedicated providers (e.g.
Mexico).
4.7 In all instances where global budgets and regulated contribution increases are
applied, governments are compelled to negotiate the consequences with providers
in one way or another. These negotiations can include the rationing of supply, and
supply prices. On the whole, however, most mature health systems (apart from the
US) do not rely on competing funders to manage health costs as they appear to
systemically lack the ability to do so, even when the incentives are present.
However, no clear examples exist of countries that have tried to establish the
conditions for such competition to work. Most experiments focus therefore on
making providers rather than funders compete.
4.8 Within developing countries the experience of multi-fund arrangements is as mixed
as the performance of state systems with very few adopting a regulatory regime
sufficient to deal with the fairly well-understood market failures. For instance Chile
established a system which involved choices between public and private funders
11
and providers. All workers must pay at least 7% of their income to either a state
insurance scheme, which has dedicated providers, or one of 15 private schemes.
There is, however, no regulation to prevent discrimination based on health status
and a minimalist prudential regulator.
"The Superindency has no power to monitor and evaluate the capacity of the ISAPREs
[private health insurers] to act as cost-effective purchasers of care for their members.
Furthermore, the consumer movement in Chile is in its infancy, and consumer protection from
benefit packages of poor value [of which there are around 5000] is therefore practically absent."
(Maynard et al, 2002, p.121)
5. PROVIDERS
5.1 Despite inadequate empirical examples of competitive funder markets, various
country-level experiments are being investigated to introduce market mechanisms
into heavily controlled public healthcare markets. Approaches focus on moving
beyond the archaic reliance on the altruistic incentives of doctors to provide the
most reasonable care available for their patients.
5.2 Problems with incentives are seen as important in both non-competing public and
private markets. As there is technically no limit to the healthcare goods and
services that can be provided to an individual, some mixture of public and private
choice aided by appropriately incentivized agents is seen as a way forward with
many experiments occurring in different settings. This is seen as important to
distinguish between cost containment and efficiency improvements.
5.3 Efficiency improvements can be understood on several levels:
5.3.1 Operational or technical efficiencies, which emphasize the efficient use of
inputs in relation to outcomes at any given level of technology; and
5.3.2 Allocative efficiencies, which emphasize the maximization of social
outcomes between alternative social interventions (i.e. some interventions
offer a generally lower rate of return than others).
5.4 Making such choices in markets where strategic purchasing decisions are
centralized is complex and invariably second-best from a consumer choice
perspective. They also require decisions that weight the best interests of a group
over individuals. Determining the best mix of social and individual choice is
invariably a policy decision of government and private insurance arrangements (i.e.
pooled arrangements). However, whereas the former must account for the public
interest the latter need only consider commercial considerations. Outside of pooled
arrangements, families must determine their preferences based on their own
household budget constraints which includes access to extended family support.
5.5 Despite the interest in market-based solutions to both public and privately funded
markets the empirical evidence on the effects of competition on provider
performance is ambiguous due in part to difficulties in establishing causality.
(Cooper, 2012, p.3). Recent reforms in the English part of the National Health
Service (NHS) do provide some opportunity to examine these effects. In 2006
publicly funded patients were permitted to choose their hospitals, with funding
12
following the patient. Research on the effects provides some basis for
understanding the effects on hospital incentives and behaviour.
5.6 On a review of the literature Cooper (2012) concludes that the introduction of
provider competition in the English NHS has been a success leading to reduced
death rates, improvements in hospital quality, management and productivity with
no harm to equity. The factors contributing to the success are seen as the
combination of centralization and decentralization.
"In many ways, it was the centralized environment in England that allowed the government to
succeed with their market-based reforms. It was the centralization that created an environment
where policy-makers could build an edifice of other policies to support competition in the NHS.
The competition supporting policies included central policies that rewarded hospitals running
surpluses, efforts to publish information on providers' performance on a centrally run website, and
rewarding general practitioners to serve as patients' agents and assist them making choices. This is
a lesson from England that should not be lost." (Cooper, 2012, p.4)
5.7 When motivating for the reforms the government argued that "hospital competition in
a market with fixed prices would catalyze providers to become more efficient, more responsive to
patients and improve the quality of care hospitals delivered." (Cooper, 2012, p.7)
5.8 For these reforms to work the following conditions had to be satisfied (Cooper,
2012, pp.9-12):
5.8.1 "Hospital staff, including senior management, must be responsive to financial
incentives" which was achieved by having autonomous public hospitals
accountable for financial viability, compete for patients.
5.8.2 "Patients must be interested in making choices" which becomes important when
local hospitals fail to address queues or quality. "Evidence from the London
Patient Choice Pilots suggests that hospital cleanliness and hospital waiting times were
the two most influential factors over whether or not patients went to a non-local
provider…" (Cooper, 2012, p.11)
5.8.3 "Patients must have alternative providers that they can access" which was achieved
by allowing private providers to offer services to public patients.
5.8.4 "There must be information in the market to inform patients' and purchasers' choices"
which was achieved by providing public information on services, using
GPs to act as agents of care (affecting 40% of patients), while own
experiences and advice from friends and family were also important.
5.8.5 "Patients must be responsive to quality signals". It was found that sicker (older
patients and those with co-morbidities) and lower-income patients were
very responsive to quality and waiting times respectively after the reforms.
5.9 Cooper (2012) stresses that the NHS reforms reflect that competition works when
supported by concurrent policies which are often not present in other settings (such as
the US). Importantly, studies conducted in the initial phases of payer-driven
provider competition in the UK indicate a drop in quality most probably due to the
absence of quality signals. (Propper et al, 2004, p.1267). This serves to illustrate that
13
competition will only occur on factors that are transparent and where consumers
are willing and able to make alternative choices based on these factors. Whatever
remains hidden cannot influence decisions.
"This suggests that it may have been a mistake to delay the publication of quality signal until
some 10 years after the introduction of a market meant to rely on them." (Propper et al,
2004, p.1267)
5.10 Whereas the NHS experience reveals that providers will respond positively to
competition on non-price factors, as prices are regulated centrally, an important
question is whether provider price competition reveals positive results. Gaynor
(2012, p.13) concludes after reviewing a large number of studies from the US that
"hospital consolidation raises prices, and by nontrivial amounts. Consolidated hospitals that are
able to charge higher prices due to enhanced market power are able to do on an ongoing basis,
making this a permanent rather than a transitory problem."
5.11 An important distinction exists between NHS public hospitals and their private
counterparts. Although the NHS hospitals are publicly owned, they are managed as
autonomous entities and made to compete against each other. Amalgamated private
hospitals, by way of contrast, cease to compete.
5.12 Mergers however do offer the possibility of efficiencies through scale economies.
There is no coherent evidence that mergers produce cost savings from increased
economies that are passed on to patients. (Gaynor, 2012, p.14)
5.13 The gains from vertical integration are also unclear (Gaynor, 2012, p.14):
"Vertical integration between hospitals and physicians or insurers and providers can in principle
provide efficiencies by aligning incentives, allowing for better coordination of care and joint
investments which enhance efficiency or the quality of care. At the same time, integration can
potentially harm competition by foreclosing rivals from access to key inputs. An integrated
system which has locked up all orthopedists in town, for example, may make it difficult to
impossible for another hospital to offer orthopedic services or a freestanding ambulatory surgery
center to the market and compete on orthopedic services. For example, physicians who had
previously been in competition all become members of the same firm once they integrate with a
hospital system (or an insurer)."
"Certain types of vertical relations in health care have been the subject of significant antitrust
scrutiny exclusive dealing between physician practices and hospitals (usually for specialized
services, e.g., radiology, anesthesiology, or pathology), and most-favored-nations clauses between
insurers and providers, which require the provider to give the insurer a rate as low as it gives to
any buyer …"
5.14 An important mechanism to achieve hospital and provider competition is selective
contracting as noted by Gaynor (2012, p.22):
"Selective contracting by private payers is a mechanism which helps to create an environment
where competition among providers is possible. If payers contract with every provider in the
market, then they have little bargaining power. Policies that enhance the ability of payers to
selectively contract with providers are important, but they will only be effective if there is sufficient
choice among providers."
14
5.15 Gaynor (2012, p.15) also reaches some clear conclusions on hospital competition:
5.15.1 Hospital competition leads to "lower prices, and to higher quality when prices are
fixed by administrative fiat."
5.15.2 "The research does not find evidence of efficiencies due to mergers."
5.15.3 "The evidence thus far is supportive of competition improving quality when prices are set
administratively. For this to happen hospitals have to have an incentive to try to attract
more patients and patients, or someone choosing on their behalf, has to be able to observe
and respond to hospital differences in quality."
5.15.4 "When price is market determined, the evidence also supports competition reducing
prices. This is important, but is less clear what the impacts are on quality. As stated
above, hospitals must have strong incentives to try to attract more patients, and patients
(or someone choosing them), must observe prices and respond."
5.15.5 "Thus there are important conditions for competition to work. The market must not be
so concentrated that hospitals don't have to work to attract patients. Hospital payment
must provide them with strong incentives to attract patients. There must be sufficient
information in the market that it is possible to observe relevant differences across
hospitals (quality, price) and respond. Last, consumers have to be responsive to quality
or price in order to drive hospitals to compete. This may be through their own direct
choices, or with a 3rd party playing a role in assisting choice."
5.16 Arguments opposing the standard economic view that prices are lower and quality
better in less concentrated markets has been proposed in US-based merger cases
where the courts accepted evidence that more concentrated markets lower prices in the case
of hospitals2. (Dranove et al, 1993, p.179). In such arguments the weak or perverse
effects of competition on hospital markets is also seen as an argument for
centralized purchasers and dramatic state intervention which rely on the market
failure arguments outlined in section 3.
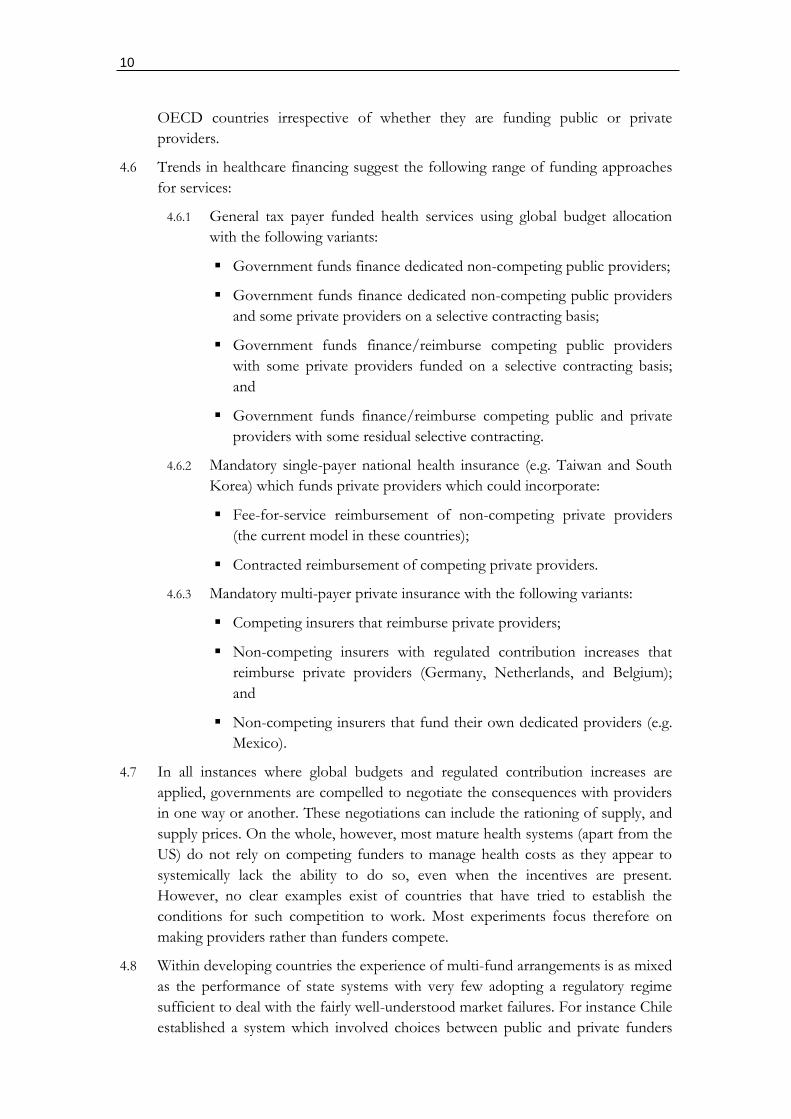
5.17 However, Dranove et al (1993) argue strongly that "the effects of healthcare competition
on prices must take into account the market context in which such competition occurs." A
distinction is made between "patient-driven" and "payer-driven" markets, with the
former subject to market failure and the latter demonstrating the expected
economic relationship between prices and market concentration.
"…under payer-driven competition, the price/concentration relationship for hospitals may be
expected to conform to the standard I/O paradigm. Thus we find that margins are lower in
markets where concentration is lower. … While our analysis is nominally about California, we
believe that it is readily generalized to the entire nation. Since California led the way in relaxing
its insurance laws [to allow selective contracting] most other states have followed suit. On the one
hand, rapid growth of selective contracting has followed in many states, suggesting that payer-
driven competition may become a national norm. On the other hand, political opposition to
2 United States vs. Carilion Health System and Roanoke Valley Hospital.
15
selective contracting is building in some states, and payers face growing restrictions." (Dranove
at al, 1993, pp.201-202)
"… our findings have direct implications for antitrust policy. It is evident that the degree of
concentration in hospital markets can be a significant factor in determining the level of prices.
Hence mergers that will significantly increase overall market concentration or concentration in
the high-tech end of the market may result in price increases. Moreover, in markets where payer-
driven competition is not yet present, mergers may preclude future price reductions by
discouraging the entry of HMOs and PPOs. Given current price trends in the growth of HMOs
and especially PPOs, permitting mergers in such markets could prove to be shortsighted."
(Dranove at al, 1993, p.202)
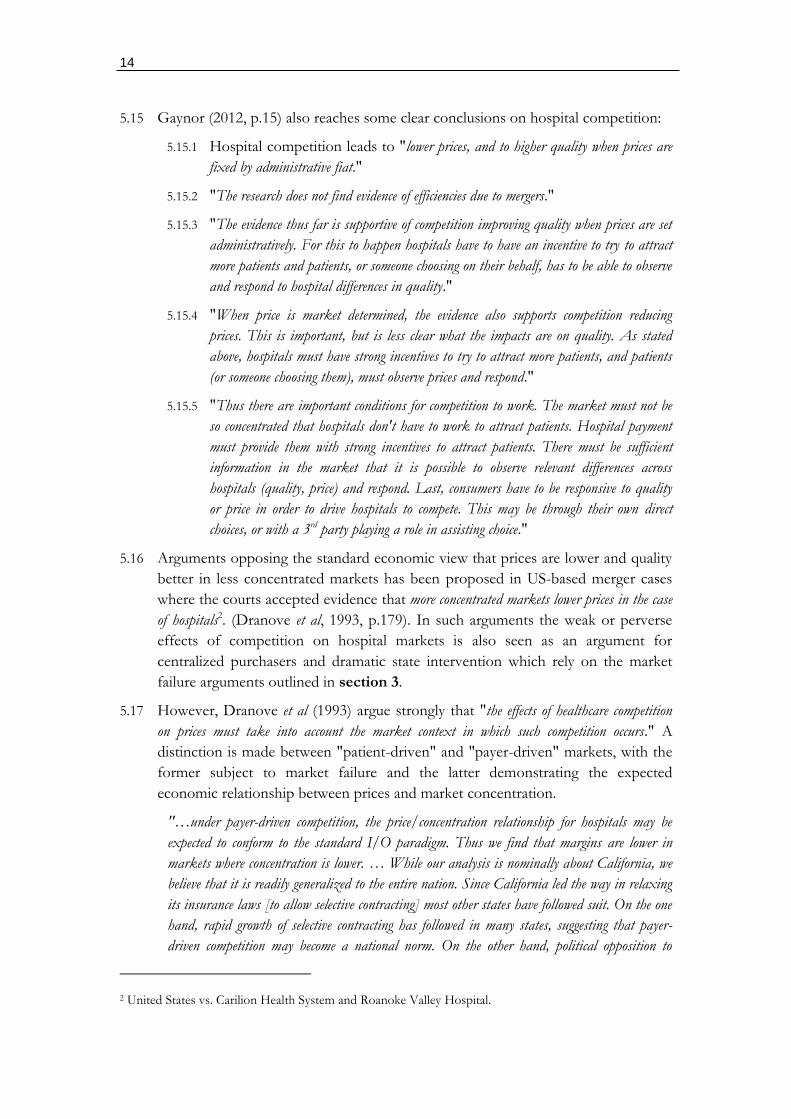
Figure 5.1: Patient versus payer driven health insurance markets
5.18 Payer-driven markets exist where the funder (health insurer and purchaser) take
direct responsibility for provider arrangements with consumers choosing the
funder/insurer rather than the provider. Consumers choose funder/insurers based
on the cost and quality of the health care providers. Patient-driven health insurance
markets are characterized by passive insurers focusing narrowly on the
reimbursement of medical expenses incurred. Consumers choose funders/insurers
simply on the cost of the insurance and the benefits covered. Patient-driven
insurance markets can also exist with central state purchasers (as in South Korea
and Taiwan) where simple fee-for-service reimbursement, a characteristic of
patient-driven markets, is prevalent. (Figure 5.1)
5.19 Market structure has furthermore been raised in the emerging private hospital and
insurance markets in the UK with similar conclusions emerging from the Office of
Fair Trading (OFT, 2011) to US-based studies.
16
"The PH [private hospital] market appears to be concentrated at the national level. At the
local level there appear to be areas of high concentration, such as areas where there is no
alternative fascia PH facility within 30 minute drive time of a PH facility (solus PH facilities),
and some local markets with 'must have' PH facilities." (OFT, 2011, p.95)
"The existence of solus and 'must have' PH facilities means that PMI [private medical
insurance] providers are dependent on the PH providers that own these facilities in order to
provide nationwide coverage for their policyholders." (OFT, 2011, p.95)
"The size of the larger PMI providers appears to result in at least a degree of buyer power in
that PH providers are, to some extent, dependent on these larger PMI providers for the viability
of their facilities. However, there may be limits on the PMI providers' ability to exercise their
buyer power for two main reasons. Firstly, buyer power may be constrained by the need for PMI
providers to purchase PH in most local markets, including areas with solus and 'must have'
facilities as described above. Secondly, since in most cases GPs rather than PMI providers
recommend the consultants, and consultants often determine patient's choice of PH facility, the
PMI providers have limited ability currently to direct patients to different PH facilities.
Therefore, as the buyer power of the PMI providers appears not to be countervailing, the larger
PH providers may have a degree of market power." (OFT, 2011, p.95)
"In conclusion, the OFT provisionally considers the test in section 131 of the Enterprise Act
2002 is met, that there are reasonable grounds to suspect that there are features of the market
for PH which prevent, restrict or distort competition. … The OFT has identified features of the
market as information asymmetries, concentration and barriers to entry. It is the OFT's
provisional view that these features, either individually or in combination, restrict, prevent or
distort competition. … For these reasons described in paragraphs 10.4 to 10.14 above, the
OFT has provisionally decided to exercise its discretion to refer this market to the CC." (OFT,
2011, p.130)
5.20 Melnick et al (1992, pp.229-232) supporting the market structure findings of
Cooper (2012), Gaynor (2012), and Dranove et al (1993) found similar results in a
study of network contracts with the large not-for-profit private health insurer Blue-
Cross:
5.20.1 "…prices paid to hospitals in the Blue-Cross of California PPO network, after
controlling for hospital product differences, are strongly influenced by the competitive
structure of the hospital market."
5.20.2 "Hospitals located in less competitive areas are able to secure higher prices."
5.20.3 "The estimated value of the coefficient for the HHI is 0.11-0.13."
5.20.4 "Hospitals that serve a larger share of the Blue-Cross market in their area are in
general able to negotiate higher prices while those serving a larger share of Blue-Cross
patients in their market and located in less competitive markets are able to negotiate
even higher prices."
5.20.5 "In our data, the payor has on average only 2.6% of patient days in its network
hospitals, with a maximum of only 8.9%. Despite this low level, it appears that the
payor is able to gain some price concessions from network hospitals as its importance to
17
them increases. It is important to note that this finding is tentative since our measure is
endogenous."
5.20.6 "… consolidating a payor's business in fewer hospitals produces offsetting price effects.
The consolidation
5.20.7 increases the importance of the PPO [preferred provider organization] to the hospital,
enabling the PPO to extract bigger price discounts. At the same time, however, the
payor becomes more dependent on those hospitals and must eventually pay them higher
rates."
5.20.8 "High occupancy hospitals in markets with little excess capacity receive much higher
prices than expected. … the results show how important the availability of excess
capacity is to the PPO in maintaining a credible threat to move patients elsewhere.
When this spare capacity becomes too small, the negotiated price paid by the PPO
increases dramatically."
5.20.9 "These results show that actual hospital prices are lower in more competitive markets.
The policies encouraging selective contracting have proven effective in transforming the
structure of the private insurance industry and, in turn, producing changes in the nature
of hospital competition. … The study also shows that this pressure is fragile and in need
of protection. Hospitals tend to operate in markets that are relatively concentrated at
least from the perspective of the overall economy. A relatively small number of mergers in
key markets would shift bargaining power and lead to increased prices."
5.21 Consistent with findings that concentration increases prices, Krishnan (2001) finds
that DRG (diagnostic related grouper) prices are also higher in merging compared
to non-merging hospitals. This indicates that DRGs as a method of contracting are
also influenced by hospital market power.3
3 It is often argued in South Africa that the presence of DRG contracts contain costs. However, these contracts are as susceptible to price increases related to provider market power as any other form of reimbursement.
18
6. DEVELOPING COUNTRY EXPERIENCES
6.1 Competition as a mechanism for improving efficiency in developing country health
systems appears as a minor focus of policy. In part, this may result from the policy
imperatives underpinning expanded access to health care as a basic human right
and where markets are seen to reduce this access. Health system reforms
consequently prioritise the elimination of markets rather than attempting to make
markets socially inclusive. Industrial country approaches, such as those
underpinning the establishment of the original versions of the NHS in the UK,
were central to such ideological perspectives.
6.2 Emerging factors at the level of ideas and practical experience are however starting
to influence policy within low- to upper-income developing countries.
6.3 At the level of ideas, borrowed thinking from high-income countries is changing as
the UK itself inserts market mechanism and competition into the NHS. The
conventional wisdom that good healthcare can only be delivered through the
elimination of all commercial imperatives no longer the default policy position. A
coherent mix of strategic policy together with properly incentivized decentralized
delivery agents is seen as inherently superior to command and control
administrations.
6.4 At the practical level, developing countries, from low- to upper-middle-income
countries, invariably face multi-tier health systems. That is, contributory health
systems (which includes a mix of social, employer-based, industry-based, and out-
of-pocket systems) with access based on some form of payment (whether a pre-
payment/premium or some form or a user fee/co-payment) coexist with
subsidized systems funded by general taxes or some other redistributive transfer.
Mixed systems involve a multiplicity of public and private funding and service
provision. Developing countries consequently face market-related concerns even
where they may have tried to suppress or ignore healthcare markets. However,
conceptual approaches to managing these markets are not at an advanced stage
with most attention given to their introduction rather than managing them
effectively.
6.5 As developing countries often face structural constraints to increased funding for
general tax-funded publicly delivered systems, market-based arrangements are seen
as important ways to mobilize additional revenue rather than as a mechanism to
achieve operational efficiencies (i.e. the rationale for industrial country market
reforms). Contributory health systems effectively top-up tax-funded arrangements.
Whereas the latter are constrained by the political limits to redistributive spending,
the former involve an explicit benefit for the contributor, increasing their
willingness to pay. Developing countries have consequently concerned themselves
more with the emergence of market-based systems than with their efficiency. There
is consequently no substantial literature on the imperfections of these markets and on how
competition is optimized at all levels of the resulting system.
19
Mexico
6.6 Mexico reflects all the above contradictions. Prior to recent health reforms initiated
in 2006, the health system is characterized by a mix of sub-systems serving
different sectors of the roughly 100 million population. Two sub-systems
dominate: publicly funded Ministry of Health (MOH) services (hospitals and
clinics) are available for unemployed and informal sector workers offered at the
state (provincial) level; and contributory social insurance offered through the
Mexican Institute of Social Security (IMSS) and various occupational funds. Social
insurance funds, whether public or private, are funded through a payroll tax which
is subsidized by the government.
6.7 While the public sector functions as a typical government system with no market-
related aspects, the contributory (insurance) system equally involves no provider
competition.
"…although these institutions are described as social insurance, this is somewhat misleading.
Each one functions more like a miniature health service. Within each institution, there is no
guaranteed package of services, and affiliates must use clinics operated by their insurance fund,
meaning there is no competition among providers." (Lakin, 2010, p.317)
"For those not covered by social security (about half the Mexican population in 2000, mainly
informal-sector workers, the unemployed, etc.), services were provided by the numerous clinics and
hospitals of the Ministry of Health (MOH). The MOH was run as a health service, in which
there were no premiums, no guaranteed package of services, and no contracting. The service was
decentralized in the 1980s and 1990s, so that Mexican states had control over the MOH
infrastructure and workers in their territory. The MOH suffered from several deficiencies,
however, in common with systems throughout the developing world. Services were limited,
frequently unavailable, and, contrary to the spirit of a national health service, often required out-
of-pocket payments (user fees) at the point of service. Both these payments, and those made to
private-sector providers that were relied on when the public sector failed, sometimes drove
Mexican households into poverty. An estimated 55 percent of health expenditure in 2000 was
out-of-pocket, and between 2 and 4 million Mexicans per year fell into poverty as a result of this
spending …" (Lakin, 2010, p.318)
6.8 The Mexican health system is consequently seen as failing both to mobilize
sufficient funding (i.e. an allocative efficiency problem), and to operate efficiently
(i.e. and operational efficiency problem). Reforms proposed in 2000, borrowing
heavily from UK reforms) consequently sought to introduce provider competition
into both the MOH and social insurance systems, as well as to create an additional
subsidized contributory arm for those inadequately covered in any other part of the
system. Although the reforms were successful in mobilizing some additional
revenue for the system, material resistance from unions and states, who were not in
favour of provider competition, undermined the competition-related reforms. The
reforms required the implementation of a separation of purchaser and provider
where providers must compete for the funds of the purchaser.
"… to achieve a true separation of functions, purchasers must be independent from local political
pressure, they must have true choices when it comes to contracting. Neither of these conditions
20
holds in many parts of Mexico. One reason for this is that, after the health system was
decentralized in the 1980s and 1990s, the federal government's ability to shield purchasers from
local politicians is rather low. Some states in Mexico are still run as patrimonial and even
authoritarian regimes, where local purchasers answer directly to the governor, and it is impossible
to establish true autonomy for efficient contracting … At the same time, while these purchasers
can theoretically contract with any institution they would like, there is little provider competition
in many parts of Mexico. In addition, there has been little success at creating the conditions for
contracting with other public-sector institutions like the IMSS, and local provider unions would
make it very difficult for purchasers to contract with anyone else even if there were other options."
(Lakin, 2010, p.346)
Brazil
6.9 As with Mexico, Brazil's health system is made up of a general tax-funded public
health system (the Sistema Unico de Saude or "SUS") and supplementary health
insurance falling within the supervision of a regulator (the Agencia Nacional de
Saude Suplementar or "ANS"). (OECD, 2011e, p.2)
6.10 Unlike Mexico, however, competition concerns are confined to the supplementary
system which is funded through private insurers. Private insurance contracts are by
law required to guarantee the individual constitutional right to health care access in
part by offering certain guaranteed benefits including ambulatory and hospital care.
(OECD, 2011e, p.3)
6.11 Although the private markets have experienced certain systemic trends, such as
insurer and hospital mergers (OECD, 2011e, pp.4-5), no policy response or
analysis appears to have occurred in Brazil.
Peru
6.12 Although Peru also has a mixed system it differs from both Mexico and Brazil in
not having a conventional public health system. Instead it offers a form of public
insurance (Comprehensive Health Insurance or "CHI") for the poor and extremely
poor, covering roughly 45.4% of the total population. This insurance however only
offers coverage in public facilities delivered by the MOH. (OECD, 2012i, p.3)
6.13 Another 19.2% of the population is covered through mandatory health insurance
(or EsSalud) for salaried employees. The EsSalud has its own system of dedicated
facilities which do not appear to compete.
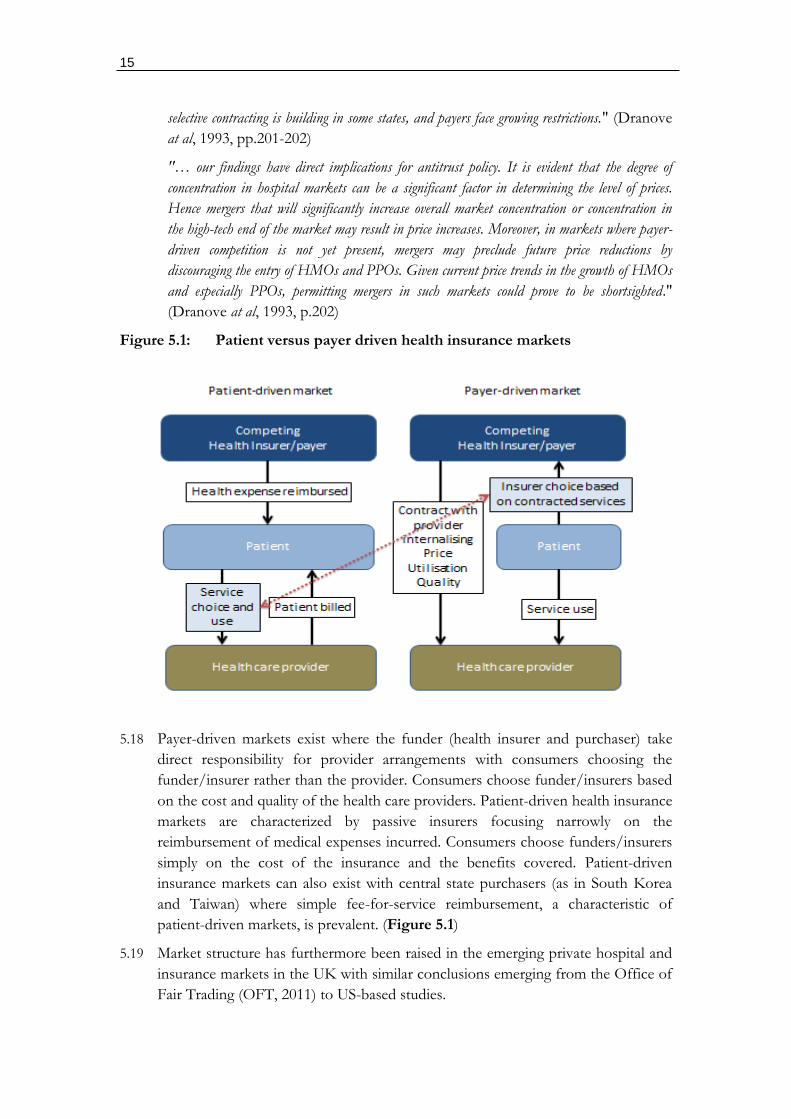
21
Figure 6.1: An EsSalud facility
Source: Downloaded from http://peruzo.wordpress.com/2011/11/16/peruvian-
health-system/ (17 June 2012).
6.14 This EsSalud system allows contributors to select a private insurer, referred to as a
Health Provider Organisation (HPO) as an alternative. HPOs are vertically
integrated private insurers with their own facilities. However, only 0.3% of the
population is covered by an HPO and only 1.2% by private insurance. The low
levels of private insurance together with a very substantial proportion of the
population (at 32.9%) without access to any healthcare (OECD, 2012i, p.3) are
indicative of the countries low income (see box 6.1 for an experience of the
Peruvian health system).
Box 6.1: Experience of the Peruvian Health System
"There I was, facing 35 young journalists from all over Peru, some of whom had traveled three days by
bus, and there was no guest speaker. Well, I did have a speaker. It’s just that at the moment he was
being given three shots (one for typhoid, just in case!) and IV fluids to treat his severe dehydration. This
was truly a lesson in improvisation, as well as a glimpse at the medical system of Peru. I’ve been here for
over a year now, working with journalists throughout the country, and so far I’ve been fortunate enough
not to need any kind of medical care.
Since I had to deal with the workshop, two journalists from Lima rushed Guerra to a local “posta
médica,” or a first-aid station. These “postas” are non-profit, private centers where people can get basic
care. Guerra was simply too sick to be taken to a real hospital, so this was the best and closest option.
Our workshop was taking place in Villa El Salvador, a poor, chaotic, populous urban area south of
Lima. What I didn’t know was the “posta médica” was basically a BYOMS - Bring Your Own
Medicine and Supplies. When Guerra arrived, he had to provide his own needles, his own IV fluid, his
own antibiotics, even his own toilet paper! Luckily, editor Erick Ortiz from Villa TV 45 who was with
him, knew his way around, and was able to buy what was needed.
22
These are the small things many take for granted when they receive urgent care, but it brings up a lot of
questions about the state of public health in Peru: What if you have to go there alone? What if you don’t
have the money to buy the items needed? What if you can’t find what’s required? I’m sure these expenses
place a huge burden on the poor when they have to get medical care. Considering half of all Peruvians live
in poverty, it’s no wonder the government began laying the groundwork in 2010 for universal health
insurance coverage."
Source: Cuevas H. Photographer’s Medical Crisis Sheds Light on Peru’s Health System:
downloaded from http://www.icfj.org/node/42755 (17 June 2012).
6.15 Very little consideration is given to competition issues in Peru. Although in part
this may derive from the highly rationed availability of services in a fiscally
constrained economy, it may also reflect capacity constraints in moving toward the
implementation of regulated managed markets, whether in the public or private
space. The private sector is only beginning to emerge, but within a largely
unregulated context with a priority focus on the small high-income market.
Although competition problems will invariably occur in the private space, there is
no evidence that the government sees this as a policy concern at present. For the
near future Peru will no doubt emphasize access to existing systems without trying
to alter their efficiencies through competition.
Conclusions
6.16 Developing countries reveal a mix of experiences due in part to varying incomes
and the extent to which market approaches are seen as potentially important in
improving access to health care. Access can be improved firstly by mobilizing
financial resources to supplement fiscally constrained and often inefficiently run
public services; and secondly through operational efficiencies resulting from
provider competition. Problems with provider competition have largely not
materialized due to the limited size of these markets. Of the countries reviewed
only Mexico had any form of strategy to use competition to enhance operational
efficiencies in its non-competing public and social insurance health care delivery
systems.
7. CONCLUSIONS
7.1 Competition has become central to many industrialized (high-income) country
health policy strategies. However, competition is effective within provider markets
when certain conditions are satisfied. Competition occurs only over those variables
that are apparent to decision-makers, and where the decision-makers are either the
final consumers themselves or agents acting on their behalf (such as GPs and
payers). Where these conditions are adequately met competition decreases cost and
increases quality. Similar results are found in price regulated markets, such as the
NHS in the UK, and private insurance markets in the US where insurers are
permitted to selectively contract with providers.
7.2 An essential pre-requisite for any form of provider competition to be successful is
the introduction of payer-driven (rather than patient-driven) purchasing through
23
either public or private funders. The payer acting as the patient's agent
compensates for the information asymmetry leading to market failure (higher costs
and lower quality). Placing the payer in this position however requires
consideration of the strategic regulatory framework. Payers must be able to:
negotiate terms with providers; selectively contract; access relevant information on
price and cost; access relevant information on quality; direct care; and design the
patient pathway.
7.3 Consumers should have the right to choose their funder based on all relevant
information to generate the appropriate funder incentives. Where some public
institution is the funder, incentives will be skewed if an accountability system
incorporating the served population is lacking. If the funder incentives are lacking
it is impossible for any pressure can be placed on providers to function efficiently
regardless market structure. However, once in place, funders must be able to
exercise informed choice and to be able to support informed decision-making by
patients. Where provider markets are concentrated, however, such choices cannot
be exercised with substantial evidence showing the harmful effects of this of cost
and quality. Simply put, it is possible for healthcare markets to operate pro-
competitively. However, both market context (funder system, GP agency, and
market transparency on cost and quality) and market structure (levels of
concentration) matter enormously.

24
PART C
DOMESTIC REVIEW
25
8. HISTORICAL OVERVIEW
Formalization of a health system from 19104
8.1 The emergence of a private health system in South Africa was never an event and
occurred over a very long period, beginning prior to the establishment of the
Union of South Africa in 1910. The De Beers Consolidated Mines Ltd Benefit
Fund was the first medical scheme established in 1889. (Department of Health,
2002, p.18). At the time the Union was established no coordinated health system
existed with a centralized authority to supervise health policy implemented roughly
10 years later in response to the devastating influenza epidemic (Ginwala, 1981).
8.2 In terms of the Public Health Act No. 36 of 1919 a national authority was
established responsible for policy, with delivery decentralized/devolved to
provincial and local authority levels. Given the imperatives of the day, government
took primary responsibility for infectious (communicable) diseases, with
responsibility at the local level. Non-communicable diseases were addressed
through pauper relief at provincial hospitals and district surgeons. Healthcare was
largely a private responsibility for the majority of the population. (Ginwala, 1981).
8.3 Private hospitals emerged at this stage and were divided into for profit and not-for-
profit. Not-for-profit hospitals were divided into philanthropic institutions and
those with statutory functions/obligations. Private hospitals with statutory
functions included Mine and Indian Immigration Bureau Hospitals. The pre-Union
Natal government in fact raised a special (or what would now be referred to as a
hypothecated or earmarked tax) from employers of Indians and paid into a fund
administered by the Indian Immigration Bureau. These funds were utilised to
establish and administer special hospitals for the Indian population. (Ginwala,
1982).
8.4 The Union legislature in 1911 passed the Native Labour Regulation Act which
required gold and other mining companies to provide for “native” employees
(Ginwala, 1982):
Hygienic housing;
Adequate diet; and
Hospitals.
8.5 The legislation did not however impose a tax of any form, and merely established
an obligation to provide. However, no equivalent legislation was established for
non-mining activities. In rural areas mission hospitals emerged where local
authorities were incapable of providing or funding healthcare services. (Ginwala,
1982).
4 This section is based on work prepared by the author for the Taylor Committee of Inquiry (2002) and ultimately incorporated in Department of Health Consultation documents emanating from the Inquiry (Department of Health, 2002).
26
8.6 Following the findings of the Gluckman Commission amendments to the Public
Health Act of 1946 clearly demarcated the functions of the Central Government
and the Provinces. General hospital services became the explicit responsibility of
provinces while healthcare was to be extended through community health centres.
A degree of financial responsibility for ambulatory care outside of hospitals was
accepted by the national government, with a refund approach adopted where such
services were established. However, the full funding of this obligation was never
fully resolved. (Ginwala, 1982).
8.7 The National Health Act of 1977 further defined the roles and responsibilities of
the national sphere of government relative to provinces and local authorities. This
framework remained largely unchanged, apart from the confusing framework that
emerged with the homeland system and the Tricameral parliament, until the
implementation of the National Health Act of 2003, which further clarified some
of the roles and responsibilities of government.
8.8 The history of the South African health system has seen government largely regard
healthcare as a private responsibility, apart from communicable diseases (which
have major externalities), apart from responsibility for the poor (through direct
provision) or mineworkers (through regulation). For this reason public services
were never developed for the general population, with income earning groups
required to pay for the use of public hospital services (a minimal fee was also
required from non-hospital-based publicly provided primary care services)5.
The private system and medical schemes
8.9 The private sector largely evolved in a policy vacuum, with government focused on
general tax-funded health services for the non-paying population. As income
earners had to pay for both public and private sector services, what would
ultimately be framed in legislation as medical schemes became an important
parallel funding vehicle to the state. As medical schemes pre-dated the
development of the public health system, their evolution as a coherent system of
funding care emerged as a response to the need for insurance in the absence of
access to free public services for income earners and their dependents.
8.10 By 1940 around 48 employer-based (or occupational) medical schemes existed.
These increased significantly in number after the Second World War necessitating
the development of some form of coordination and supervision resulting in the
establishment of the Advisory Council for Medical Fund Societies in 1950. No
regulatory framework was established, however, and the Council’s role was largely
to represent the interests of schemes in negotiations with the Medical Association
of South Africa (SAMA) on fees. (Department of Health, 2002, p.18).
5 Primary care fees were not at the level of cost recovery and took the form of a co-payment. Hospital tariffs were however (theoretically) determined at a cost-recovery level.
27
8.11 Regulation of medical schemes occurred for the first time through the Friendly
Societies Act implemented in 1956. Regulation was however limited to registration
and some prudential requirements. Consistent with the findings of two
commissions of inquiry the need for an expanded regulatory framework was
accepted and implemented in 1967 through the Medical Schemes Act No. 72 of
1967 which took over the functions of medical scheme regulation from the
Friendly Societies Act. (Department of Health, 2002, pp.20-22).
8.12 The intentions of the Medical Schemes Act were (Hansard, 1967, from
Department of Health, 2002, p.21-22):
“To invent an insurance type of scheme to distribute the costs of medical expenses over a period
of years”;
“To retain the costs of medical expenses at a low level”; and
“To co-ordinate and control the functioning of medical benefit and medical aid funds and to
develop and propagate these schemes”.
8.13 The Medical Schemes Act established the Central Council for Medical Schemes,
the functions of which were to (Department of Health, 2002, p.22):
“Control, promote, encourage and co-ordinate the establishment, development and functioning
of medical schemes”;
“Investigate complaints and settle disputes in relation to the affairs of registered medical
schemes”; and
“Perform such other functions as may be prescribed”.
8.14 The appointment, by the Minister of Health, of a Registrar of Medical Schemes to
perform duties assigned by the Minister or the Secretary for Health was also
provided for. (Department of Health, 2002, p.22).
The Regulation of Tariffs and Payments: 1968 to 1986
8.15 The period from 1968 into the mid-1980s medical schemes predominantly
reimbursed private professional fees and tariffs charged by public hospitals,
promulgated in provincial ordinances, to people falling outside a means test.
Professional fees for specialists and general practitioners therefore represented the
most important expense of schemes, and annual negotiations were consequently
quite heated. As the reimbursement of medical expenses represented the benefits
offered by a scheme, the annual centrally determined tariff schedule was referred to
as a “scale of benefits” (SOB).
8.16 As the SOB reflected the reimbursement schedule of all medical schemes
disagreement over annual changes resulted in some professionals choosing to opt
out of the SOB. Where health professionals opted out and charged in excess of the
SOB schemes reimbursed only up to the benefit level leaving the residual for the
account of the member. As claims were managed through paper-based invoices,
schemes adjusted to the opt out (contracted out) doctors by guaranteeing
reimbursement only where invoices were consistent with the SOB (contracted in).
28
8.17 A Remuneration Committee was set up in terms of the Amendment Act, No. 95 of
1969, to investigate the tariff of fees at least every two years. This amendment
sought to establish an arbitration mechanism to avoid further doctors opting out
of the scale of benefits as this was regarded as damaging to doctor/patient
relationships. (Department of Health, 2002, p.22).
8.18 The Remuneration Committee was however ultimately not supported by doctors.
It was alleged that the Act was seeking to control the medical profession and that
the framework was prejudiced the interests of doctors and dentists. By 1978 the
Dental Society and the Medical Association were no longer prepared to cooperate
with the Remuneration Committee. Consideration was then given to limiting the
free choice of doctors to contract out. Publication of draft legislation to this effect
however resulted in a further 1,600 medical practitioners contracting out. By this
time 3,941 out of 14,000 medical practitioners had already contracted out.
(Department of Health, 2002, pp.22-23).
8.19 To resolve this conflict the Amendment Act No. 51 of 1978 abolished the
Remuneration Committee and the Commission that made recommendations to the
Council on fees. Provision was instead made for the Medical and Dental Council
to set fees on condition that it avoided further contracting-out. The threat was that
if not successful the Minister would step in to regulate the framework for
contracting-out. (Department of Health, 2002, pp.23).
8.20 To further the differentiation between contracted in and out doctors the
Amendment Act, No. 42 of 1980, allowed contracted-in doctors to submit
accounts directly to schemes. This was a constant source of conflict between
medical practitioners and government where in the previous dispensation accounts
needed to submitted through members. This latter approach caused extensive
delays and reduced the advantage for contracted-in doctors of guaranteed payment.
(Department of Health, 2002, pp.23).
8.21 The Amendment Act, No. 59 of 1984, however eliminated the distinction between
contracting-in and contracting-out for doctors and dentists. From that period on
any profession or supplier of a service was permitted to set their own fees through
their statutory control bodies. The Representative Association of Medical Schemes
(RAMS), the statutory association of medical schemes, was also permitted to set a
SOB after consultation with supplier representatives. If fees equal to or less than
the fees indicated on the SOB were charged the scheme was required to pay the
health professional directly. (Department of Health, 2002, pp.23).
The “Free Market” Reforms: 1984 to 1989
8.22 Although medical schemes, due to their close links to employers, were not-for-
profit, a commercial arm to the system evolved through the outsourced
administration services provided to schemes. As the occupational scheme model
makes sense only for large employers, smaller employers found it easier to contract
with schemes able to take on many employers. Whereas the occupational schemes
had a natural sponsor in the form of the employer, schemes serving multiple
employers had no natural sponsor other than commercial administrators.
29
Commercial administrators therefore began to set up multi-employer schemes
which they could not legally own. The commercial return derived from the
administration fees that were charged to the resulting scheme.
8.23 During the 1980s multi-employer schemes became more prevalent. Although de-
facto non-profit, their behavior was commercial in nature. To overcome the risk
that the scheme trustees and principal officer, both required by law, complied with
the required commercial imperatives the administrator made all the appointments
and employed the principal officer. Multi-employer schemes did not however
compete for individual members. Instead this became the focus of smaller open
schemes and insurance products with the latter explicitly for-profit.
8.24 The regulatory framework for schemes was tailored around occupational medical
schemes following the governance model of trusts (as with pension funds) and
incorporated many protections for members and beneficiaries. Trustees supervised
the funds on behalf of specified beneficiaries. As with trusts, schemes were
required to apply for registration with a registrar and to file rules that needed to
comply with legislated provisions. Key amongst these was a limitation on the right
of schemes to vary contributions on the basis of health status or the risk of
claiming benefits, often referred to as “risk-rating”. Occupational schemes
however only varied contributions on the basis of income, with higher income
groups required to pay more. In many cases they went so far as to positively
discriminate in favour of older members (who on average are higher claimers) who
would pay lower contributions than active members.
8.25 Schemes were also required to cover certain required benefits, expressed as a
percentage of the SOB. In most cases this was 100%.
8.26 The emerging commercial multiple-employer schemes however began to lobby for
more liberalization of the market. They were limited in their commercial activities
by two legal constraints. Firstly, their inability to risk rate created financial
uncertainty for schemes unable to predict the risk profile of the employers they
were taking on. Taking on employers with poor risk profiles would consequently
result in across-the-board contribution increases for all contracting employers.
Secondly, the requirement to offer mandatory minimum benefits eliminated their
ability to differentiate benefit offerings for alternative target groups. They
consequently began to lobby for legislative change the Browne Commission of
Inquiry (1986) which largely accepted the commercial case:
“Greater flexibility in contribution rate determination should be allowed, enabling schemes to
charge different contribution rates for different classes of risk. Provision could also be made for
allowing different levels of benefit to be chosen by groups or individuals to satisfy their needs.
This will encourage merging of small schemes with larger ones, resulting in increased
administrative efficiency. In some cases significant cost savings could be achieved if the member
paid small claims himself and was only allowed to claim from the scheme after a specific
amount had been paid by himself.”
8.27 The Browne Commission saw the introduction of risk-rating and cost-sharing with
members (co-payments, through the elimination of mandatory minimum benefits)
30
as a cost saving measure likely to improve the affordability of schemes through
greater scheme competition, member behavioural change, and increased scheme
consolidation. Despite recommendations by the Browne Commission of Inquiry
supporting this liberalization the government supported only a partial deregulation
permitting the introduction of risk-rating but not the removal of compulsory
benefits. (Department of Health, 2002, p.25).
8.28 Medical schemes were consequently deregulated in 1989 with all restrictions on
risk rating or any differentiation on the basis of the risk of claiming removed.
Schemes were not only permitted to differentiate premiums on the basis of group
health risk (such as age-rating), but could individualize contributions and even
retrospectively adjust contributions on the basis of actual claims (experience rating)
on any basis they wished.
8.29 During this period deteriorating macroeconomic conditions placed major
constraints on public health budgets resulting in noticeable declines in the
investment in public hospitals. Although technically public hospitals covered the
indigent population only, this was only in relation to financing. Public hospitals as
a provider system de-facto covered all income groups. However, budget
constraints started to affect public sector career opportunities for specialists who
consequently moved to the private sector where they operated as independent
practitioners. In many instances these doctors began to set up private hospitals to
which they referred patients instead of the public sector. Although this trend pre-
dated the 1980s, it was only during this decade that the private hospital system
achieved a near complete diversion of patients away from the state system.
8.30 Public sector specialists over the latter part of the 1980s and early 1990s also began
referring private patients with medical scheme cover to their private practices. This
trend became endemic after government permitted “limited private practice”
arrangements for public sector academic specialists.
Table 8.1: Private and public hospitals and bed estimates from 1976 to 2010
Year Private Public
Hospitals Beds Hospitals Beds
1976 251 2 3461 1986 651 6 1252
117 8423
1989 1011 10 9361 19984 162 20 908 343 107 634
20105 216 31 067 410 88 920
1Hospital Association of South Africa, 2Estimated using the bed to hospital ratio, 4Health
Systems Trust, 5Health Systems Trust.
Source: van den Heever AM (2012).
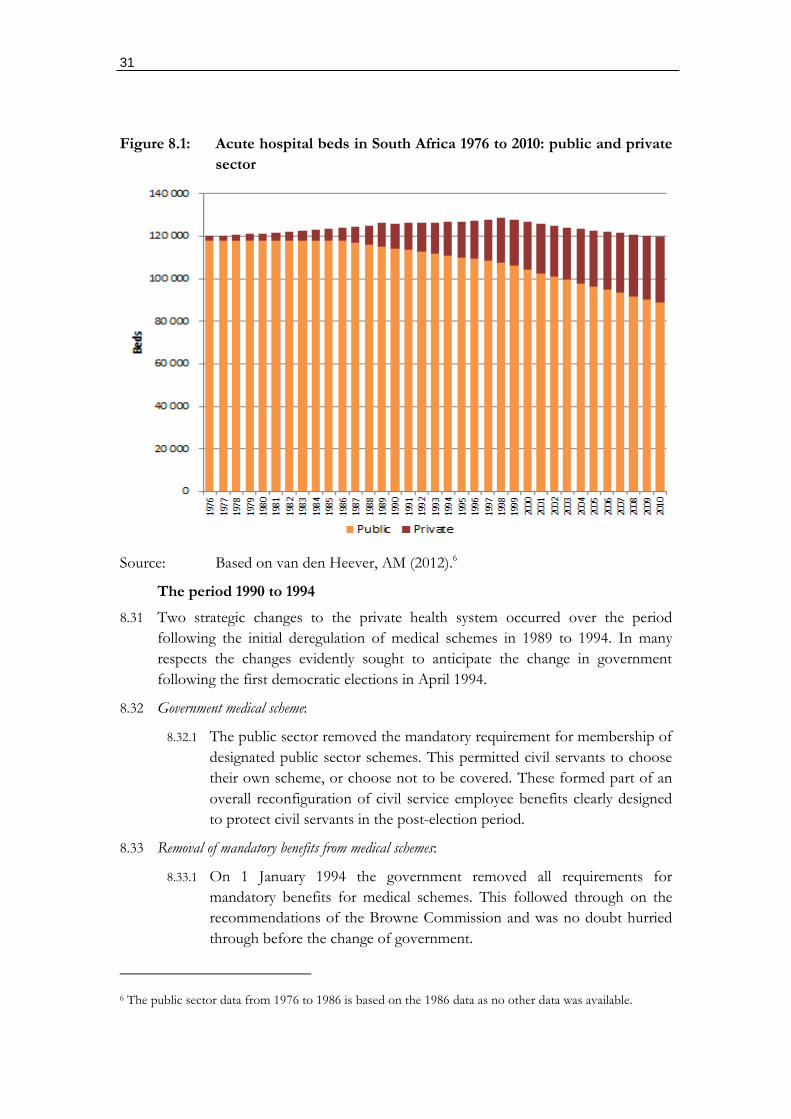
31
Figure 8.1: Acute hospital beds in South Africa 1976 to 2010: public and private
sector
Source: Based on van den Heever, AM (2012).6
The period 1990 to 1994
8.31 Two strategic changes to the private health system occurred over the period
following the initial deregulation of medical schemes in 1989 to 1994. In many
respects the changes evidently sought to anticipate the change in government
following the first democratic elections in April 1994.
8.32 Government medical scheme:
8.32.1 The public sector removed the mandatory requirement for membership of
designated public sector schemes. This permitted civil servants to choose
their own scheme, or choose not to be covered. These formed part of an
overall reconfiguration of civil service employee benefits clearly designed
to protect civil servants in the post-election period.
8.33 Removal of mandatory benefits from medical schemes:
8.33.1 On 1 January 1994 the government removed all requirements for
mandatory benefits for medical schemes. This followed through on the
recommendations of the Browne Commission and was no doubt hurried
through before the change of government.
6 The public sector data from 1976 to 1986 is based on the 1986 data as no other data was available.
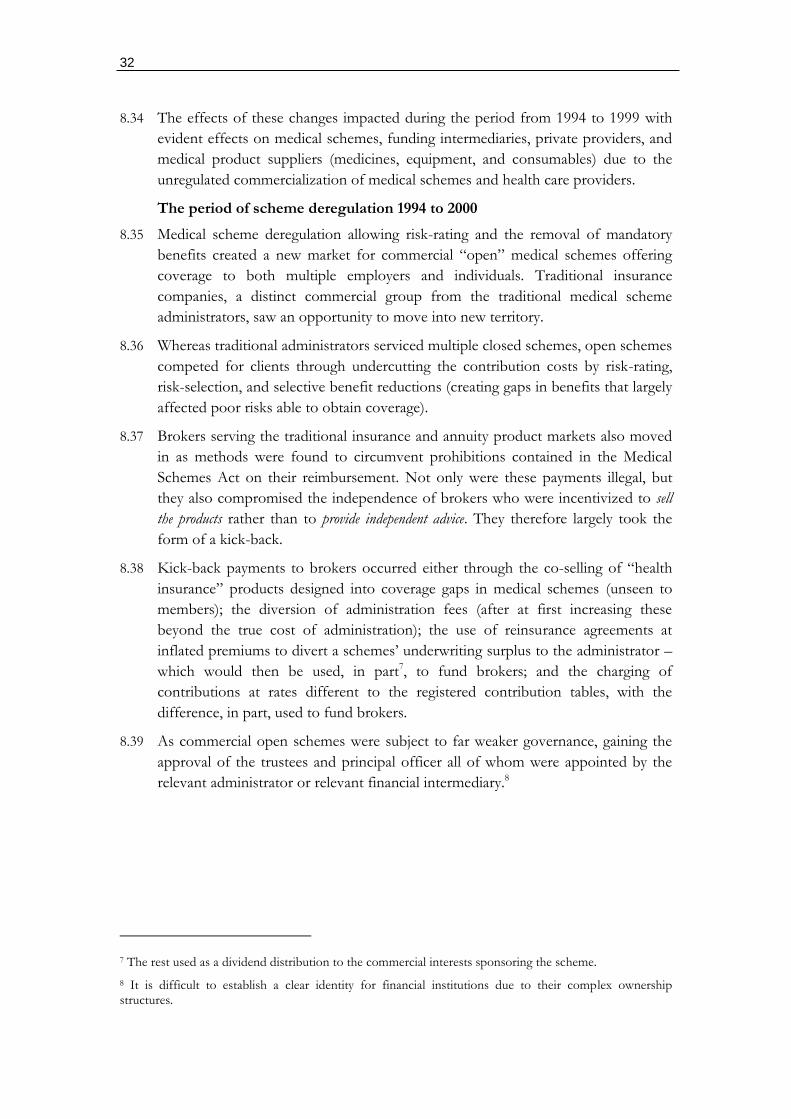
32
8.34 The effects of these changes impacted during the period from 1994 to 1999 with
evident effects on medical schemes, funding intermediaries, private providers, and
medical product suppliers (medicines, equipment, and consumables) due to the
unregulated commercialization of medical schemes and health care providers.
The period of scheme deregulation 1994 to 2000
8.35 Medical scheme deregulation allowing risk-rating and the removal of mandatory
benefits created a new market for commercial “open” medical schemes offering
coverage to both multiple employers and individuals. Traditional insurance
companies, a distinct commercial group from the traditional medical scheme
administrators, saw an opportunity to move into new territory.
8.36 Whereas traditional administrators serviced multiple closed schemes, open schemes
competed for clients through undercutting the contribution costs by risk-rating,
risk-selection, and selective benefit reductions (creating gaps in benefits that largely
affected poor risks able to obtain coverage).
8.37 Brokers serving the traditional insurance and annuity product markets also moved
in as methods were found to circumvent prohibitions contained in the Medical
Schemes Act on their reimbursement. Not only were these payments illegal, but
they also compromised the independence of brokers who were incentivized to sell
the products rather than to provide independent advice. They therefore largely took the
form of a kick-back.
8.38 Kick-back payments to brokers occurred either through the co-selling of “health
insurance” products designed into coverage gaps in medical schemes (unseen to
members); the diversion of administration fees (after at first increasing these
beyond the true cost of administration); the use of reinsurance agreements at
inflated premiums to divert a schemes’ underwriting surplus to the administrator –
which would then be used, in part7, to fund brokers; and the charging of
contributions at rates different to the registered contribution tables, with the
difference, in part, used to fund brokers.
8.39 As commercial open schemes were subject to far weaker governance, gaining the
approval of the trustees and principal officer all of whom were appointed by the
relevant administrator or relevant financial intermediary.8
7 The rest used as a dividend distribution to the commercial interests sponsoring the scheme.
8 It is difficult to establish a clear identity for financial institutions due to their complex ownership structures.
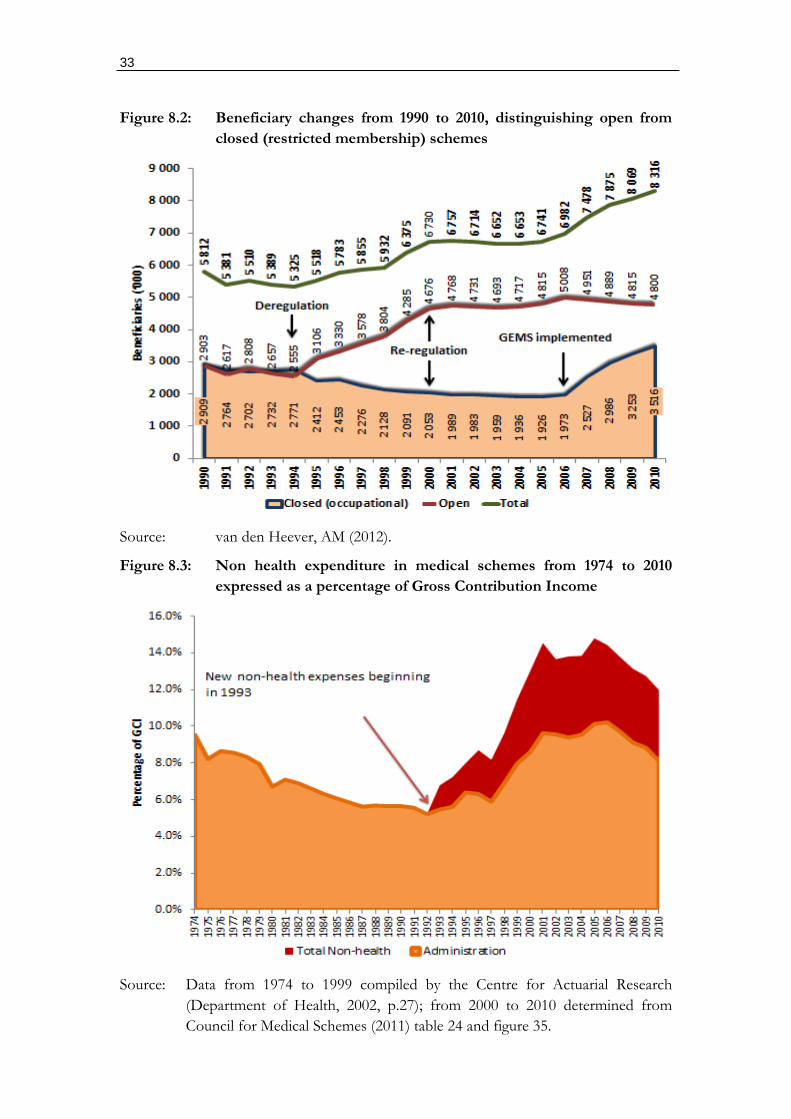
33
Figure 8.2: Beneficiary changes from 1990 to 2010, distinguishing open from
closed (restricted membership) schemes
Source: van den Heever, AM (2012).
Figure 8.3: Non health expenditure in medical schemes from 1974 to 2010
expressed as a percentage of Gross Contribution Income
Source: Data from 1974 to 1999 compiled by the Centre for Actuarial Research
(Department of Health, 2002, p.27); from 2000 to 2010 determined from
Council for Medical Schemes (2011) table 24 and figure 35.
34
8.40 The deregulation of 1994 consequently unleashed substantial commercial forces
which rapidly saw brokers advising employers to close their occupational schemes
and join an open (commercial) scheme. A resulting shift of members occurred
exactly at the point of deregulation (see figure 8.2) with roughly 2 million
beneficiaries added to open commercial schemes over the period 1994 to 1999.
8.41 This movement reflected implicit competition between administrator types; i.e.
those serving the traditional occupational (closed) scheme market and those
sponsoring and operating commercial multi-employer or individual (open)
schemes. However, business was shifting from the leaner and better priced
administrators to far more expensive administrators operating de-facto for-profit
schemes. Employers were often persuaded that open schemes were cheaper
because they could substantially (and unfairly) reduce their liabilities in relation to
expensive pensioner groups. From 1994 therefore the introduction of commercial
competing schemes was associated with administration cost increases and the
padding of scheme operating expenses (see figure 8.3).
8.42 Although commercial open schemes were competing for business on the headline
cost of medical scheme coverage, they were never competing on the true cost of
coverage. As perceived costs could be reduced by excluding poor risks from cover
open schemes could look cheaper despite higher administration fees, the illegal
extraction of profit, and kick-back payments to brokers in the form of
commissions. The information asymmetry between employers and individual
members on the one hand and medical schemes on the other permitted medical
schemes to over-price relative to the coverage they were now offering.
8.43 Competing schemes did not have market power relative to employers and
therefore could not increase contribution rates excessively. They could however
take advantage of product complexity to extract an excessive margin from an
opaque benefit reduction. It is important to note that the benefit reduction
included the elimination of effective life-cycle risk pooling, which would not be
understood by contributors/beneficiaries until they reached the age of retirement.
8.44 The information asymmetry also reduced incentives on competing schemes to
encourage more efficient costs on the part of service providers. As the additional
investments required to effectively manage health care provider costs would have
reduced profit margins on administration, schemes preferred simple fee-for-service
reimbursement and the associated unsophisticated (and cheap administratively)
annual fee negotiations. As a consequence, benefit and contribution costs rose
precipitously during the 1990s and into the early 2000s (see figure 8.4 for the
contribution cost trend). A result that contradicted the cost-reduction and
efficiency motivations for the deregulation outlined in the Browne Commission
(see par 8.26).

35
Box 8.1: The Sourthern Healthcare Joint Venture and Sanlam attempt to negotiate
provider contracts in the face of opposition from private hospitals and
specialists
Source: “Private Hospitals Fight for Survival”, Managed Care Review, published in the
South African Medical Journal, March 1997.
8.45 Scheme competition on the basis of actual service-provider costs was also risky, as
the simple insurance models prevalent within the commercial insurance market
lacked the sophistication to embark on such long-term strategies. The required
information systems, provider supervision, and contracting capability involved high
36
up-front investments for an unknown return. Schemes were also vulnerable to a
backlash from providers, particularly specialists which could result in serious
reputational damage. Commercial players such as Sanlam and the Southern
Healthcare Joint Venture (SHC) with Anglo American failed dramatically during
the latter part of the 1990s due to both provider reaction and the failure to
implement new expensive information systems (see box 8.1). Both consequently
lost business to schemes continuing to adopt the standard insurance approach and
ultimately closed down.
8.46 The close cooperation between independent hospitals, which formed the majority
of hospitals during most of the 1990s, was coordinated horizontally through the
National Hospital Network (NHN) and specialist groups, and was central to the
collapse of these attempts to establish selective contracting arrangements. As the hospital
market was not concentrated at this point (as this occurred around 2000)
preventing selective contracts by schemes required horizontal collusion between
specialists and hospitals which should have been prohibited on competition
grounds.
8.47 The collusion amongst hospitals through NHN during the 1990s has been
substituted for the permitted collusion during the post 2000 period through
hospital mergers by the three main groups (Netcare, Medi-Clinic, and Life
(previously Afrox)). Prior to the market consolidation the main hospital groups
(then Medi-Clinic and Afrox) actually saw opportunity from selective contracts, as
can be determined from their willingness to enter into these arrangements (see box
8.1). After 2000, however, the three main hospital groups impose the same
conditions on attempts to establish networks as NHN demonstrates in box 8.1, i.e.
all or nothing conditions.
“We have succeeded in sticking together and have refused to sign unless this issue of accepting
all the hospitals in the NHN have been accepted.”
8.48 The “all or nothing” requirement however effectively destroys any value that could
be achieved from a network arrangement. Networks need to be limited (not wide)
to extract a price reduction for the direction of patient volumes to specific
facilities. As these contracts would have exposed inefficient excess hospital
capacity, which relies for survival on schemes’ exposure to unavoidable over-
servicing in the fee-for-service environment, NHN hospitals with their specialist
owners would have been forced to rationalize. Importantly, other competing
medical schemes would have been forced to adopt the strategies of SHC and
Sanlam or lose members to schemes offering better coverage at a lower price.
Their failure consequently took the pressure off other medical schemes and
providers preferring the administratively simple but very inefficient fee-for-service
environment.
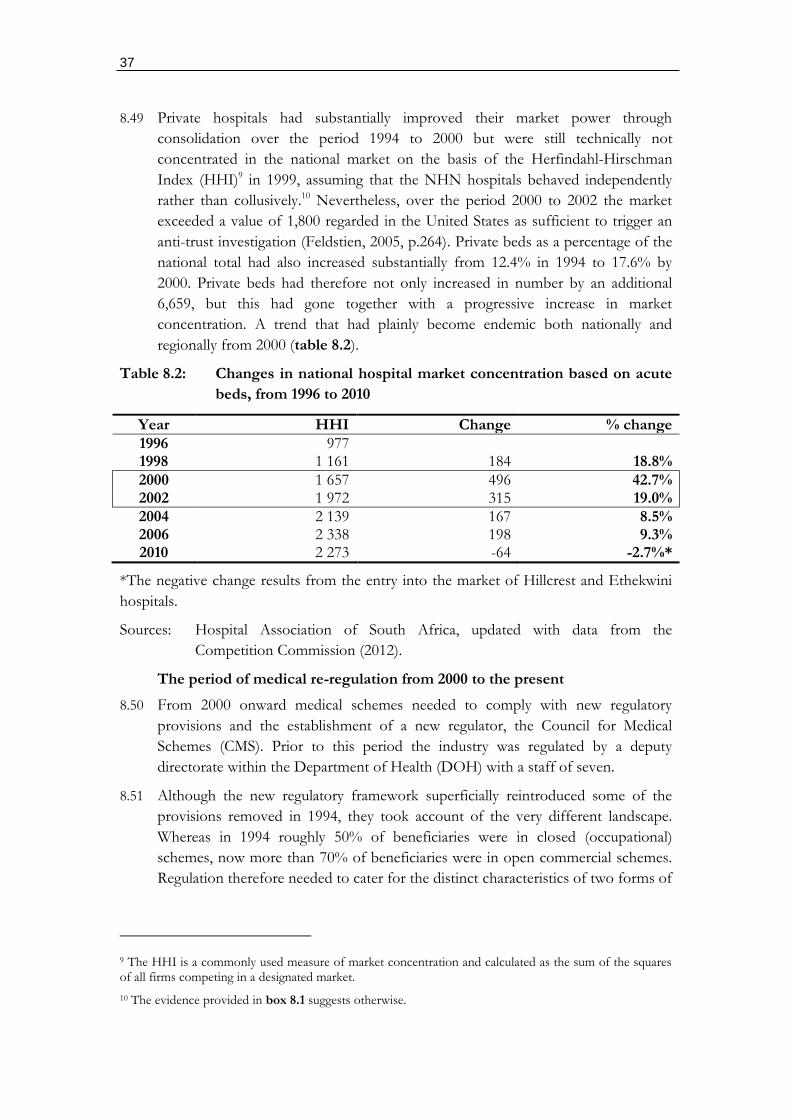
37
8.49 Private hospitals had substantially improved their market power through
consolidation over the period 1994 to 2000 but were still technically not
concentrated in the national market on the basis of the Herfindahl-Hirschman
Index (HHI)9 in 1999, assuming that the NHN hospitals behaved independently
rather than collusively.10 Nevertheless, over the period 2000 to 2002 the market
exceeded a value of 1,800 regarded in the United States as sufficient to trigger an
anti-trust investigation (Feldstien, 2005, p.264). Private beds as a percentage of the
national total had also increased substantially from 12.4% in 1994 to 17.6% by
2000. Private beds had therefore not only increased in number by an additional
6,659, but this had gone together with a progressive increase in market
concentration. A trend that had plainly become endemic both nationally and
regionally from 2000 (table 8.2).
Table 8.2: Changes in national hospital market concentration based on acute
beds, from 1996 to 2010
Year HHI Change % change
1996 977 1998 1 161 184 18.8%
2000 1 657 496 42.7% 2002 1 972 315 19.0%
2004 2 139 167 8.5% 2006 2 338 198 9.3% 2010 2 273 -64 -2.7%*
*The negative change results from the entry into the market of Hillcrest and Ethekwini
hospitals.
Sources: Hospital Association of South Africa, updated with data from the
Competition Commission (2012).
The period of medical re-regulation from 2000 to the present
8.50 From 2000 onward medical schemes needed to comply with new regulatory
provisions and the establishment of a new regulator, the Council for Medical
Schemes (CMS). Prior to this period the industry was regulated by a deputy
directorate within the Department of Health (DOH) with a staff of seven.
8.51 Although the new regulatory framework superficially reintroduced some of the
provisions removed in 1994, they took account of the very different landscape.
Whereas in 1994 roughly 50% of beneficiaries were in closed (occupational)
schemes, now more than 70% of beneficiaries were in open commercial schemes.
Regulation therefore needed to cater for the distinct characteristics of two forms of
9 The HHI is a commonly used measure of market concentration and calculated as the sum of the squares of all firms competing in a designated market.
10 The evidence provided in box 8.1 suggests otherwise.
38
scheme, one commercial and the other non-commercial, with the former now
considerable in size and importance.
8.52 The regulatory framework furthermore sought to take advantage of the dynamic
characteristics of the market to optimize health-related social protection for
income earners. Whereas the Browne Commission recommendations, which were
ultimately implemented in their entirety in 1994, gave the market (and more
particularly the commercial interests of commercial schemes) greater weight than
social protection, the revised framework prioritized social protection without
undermining commercial viability. The evidence furthermore demonstrated that
the Browne Commission assumptions on the market effects of their
recommendations were wrong, as medical scheme competition, which was based
on risk-rating and risk-selection, drove healthcare costs up rather than down (see
figure 8.4).
8.53 The new framework therefore incorporated the following strategic elements
relevant to market behavior:
8.53.1 Community rating: Which prohibited the setting of contributions on the
basis of health status.
8.53.2 Mandatory minimum benefits: Which focused on catastrophic health events,
including elective, non-elective and chronic care.
8.53.3 Open enrollment: Which removed the discretion from any open (commercial
scheme) to select which risk groups could join. From 2000 no scheme
could therefore risk-select.
8.53.4 Mandatory reserve levels of 25%: Which compelled schemes to hold a
minimum of 25% of gross contribution income (GCI) as a financial
reserve. Schemes were given a five-year period from 2000 to achieve the
required reserve. This required that all schemes existing at 1 January 2000
needed to achieve a 25% solvency margin by 2004.
8.53.5 Regulation of brokers: The grey market for advisory services was legitimized,
but subject to a regulatory framework which required registration,
accreditation, and capped fees. Schemes were also compelled to report on
broker fees and administrators prohibited from directly or indirectly
paying their fees.
8.53.6 Governance changes: Both board members and principal officers needed to be
separated from administrators and/or any entity contracting with the
scheme.
8.53.7 Establishment of only two forms of scheme: Two forms of scheme were
permitted, restricted membership and open schemes. The former required
permission from the registrar to exist and could not be constituted merely
to exclude poor risk groups or individuals. The latter was the default state
for any scheme and no differentiation was made for schemes targeting
employers or individuals. This meant that any person could join any open
scheme, either through their employer or as an individual.
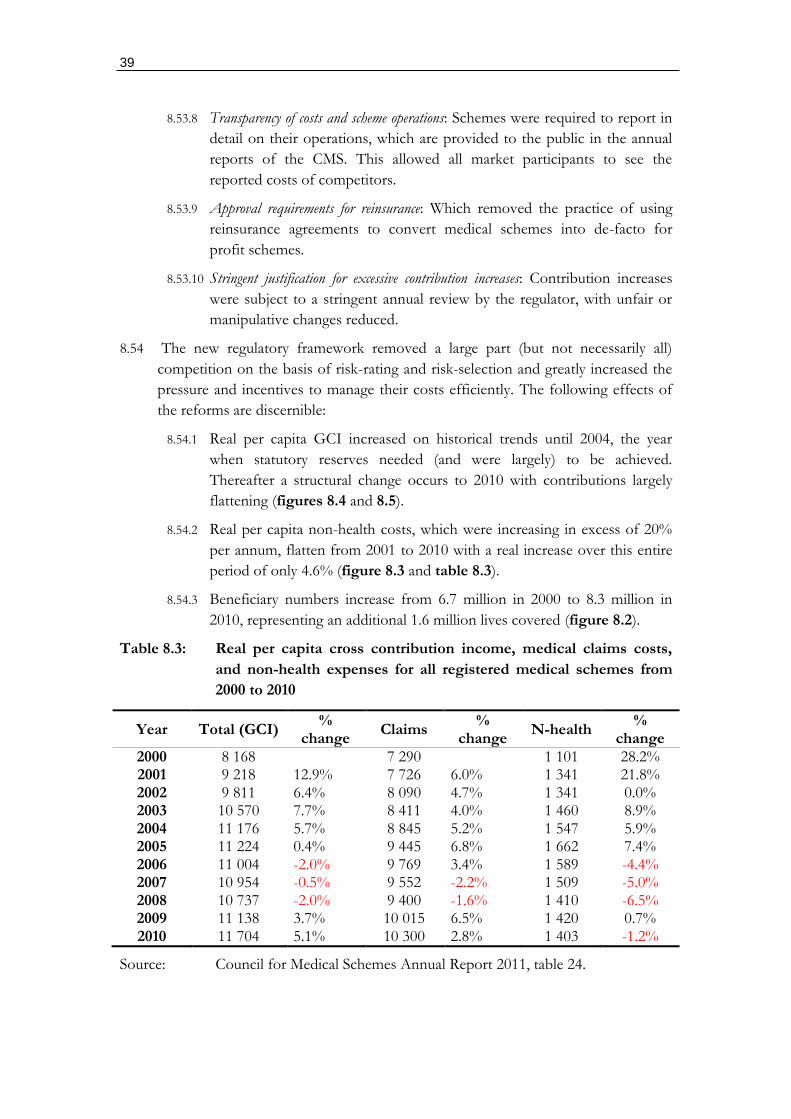
39
8.53.8 Transparency of costs and scheme operations: Schemes were required to report in
detail on their operations, which are provided to the public in the annual
reports of the CMS. This allowed all market participants to see the
reported costs of competitors.
8.53.9 Approval requirements for reinsurance: Which removed the practice of using
reinsurance agreements to convert medical schemes into de-facto for
profit schemes.
8.53.10 Stringent justification for excessive contribution increases: Contribution increases
were subject to a stringent annual review by the regulator, with unfair or
manipulative changes reduced.
8.54 The new regulatory framework removed a large part (but not necessarily all)
competition on the basis of risk-rating and risk-selection and greatly increased the
pressure and incentives to manage their costs efficiently. The following effects of
the reforms are discernible:
8.54.1 Real per capita GCI increased on historical trends until 2004, the year
when statutory reserves needed (and were largely) to be achieved.
Thereafter a structural change occurs to 2010 with contributions largely
flattening (figures 8.4 and 8.5).
8.54.2 Real per capita non-health costs, which were increasing in excess of 20%
per annum, flatten from 2001 to 2010 with a real increase over this entire
period of only 4.6% (figure 8.3 and table 8.3).
8.54.3 Beneficiary numbers increase from 6.7 million in 2000 to 8.3 million in
2010, representing an additional 1.6 million lives covered (figure 8.2).
Table 8.3: Real per capita cross contribution income, medical claims costs,
and non-health expenses for all registered medical schemes from
2000 to 2010
Year Total (GCI) %
change Claims
% change
N-health %
change
2000 8 168 7 290 1 101 28.2% 2001 9 218 12.9% 7 726 6.0% 1 341 21.8% 2002 9 811 6.4% 8 090 4.7% 1 341 0.0% 2003 10 570 7.7% 8 411 4.0% 1 460 8.9% 2004 11 176 5.7% 8 845 5.2% 1 547 5.9% 2005 11 224 0.4% 9 445 6.8% 1 662 7.4% 2006 11 004 -2.0% 9 769 3.4% 1 589 -4.4% 2007 10 954 -0.5% 9 552 -2.2% 1 509 -5.0% 2008 10 737 -2.0% 9 400 -1.6% 1 410 -6.5% 2009 11 138 3.7% 10 015 6.5% 1 420 0.7% 2010 11 704 5.1% 10 300 2.8% 1 403 -1.2%
Source: Council for Medical Schemes Annual Report 2011, table 24.
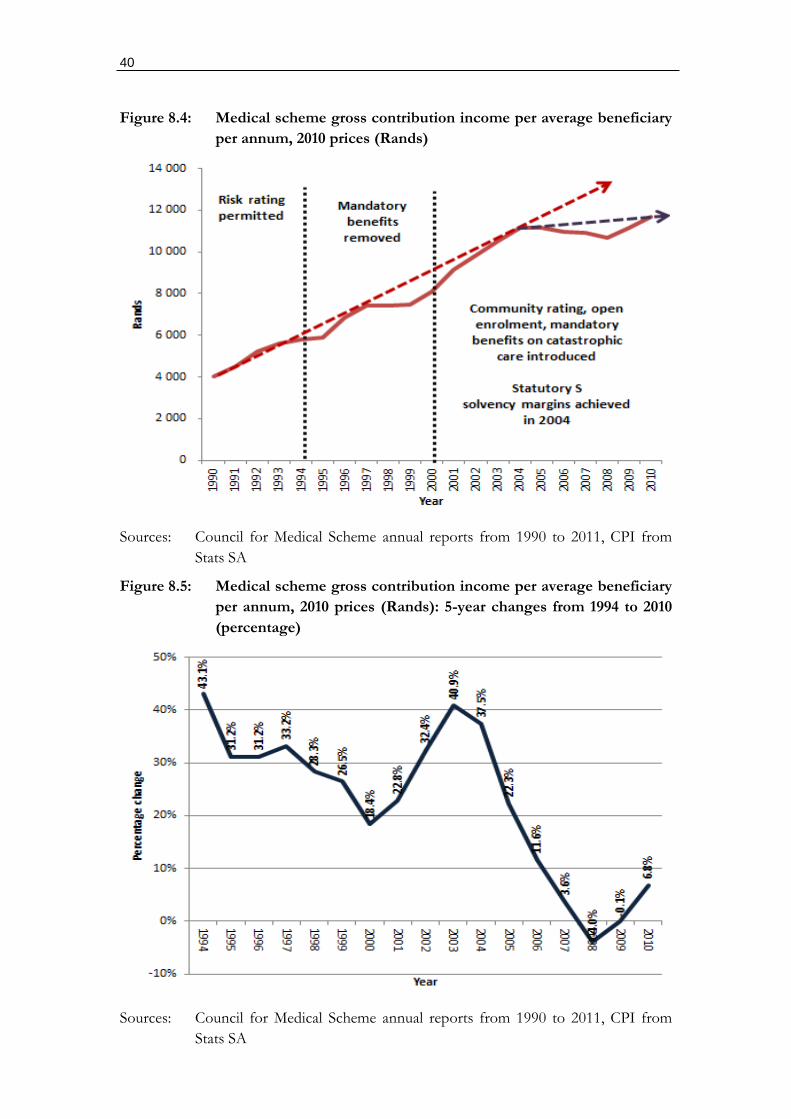
40
Figure 8.4: Medical scheme gross contribution income per average beneficiary
per annum, 2010 prices (Rands)
Sources: Council for Medical Scheme annual reports from 1990 to 2011, CPI from
Stats SA
Figure 8.5: Medical scheme gross contribution income per average beneficiary
per annum, 2010 prices (Rands): 5-year changes from 1994 to 2010
(percentage)
Sources: Council for Medical Scheme annual reports from 1990 to 2011, CPI from
Stats SA
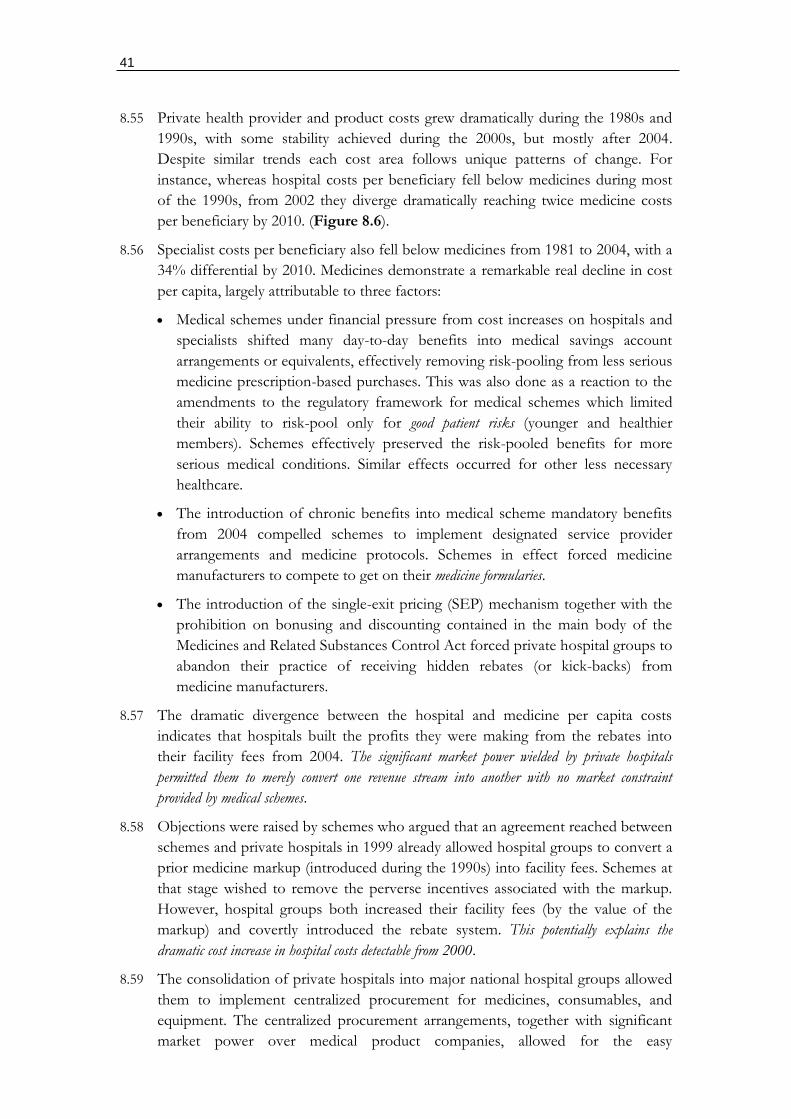
41
8.55 Private health provider and product costs grew dramatically during the 1980s and
1990s, with some stability achieved during the 2000s, but mostly after 2004.
Despite similar trends each cost area follows unique patterns of change. For
instance, whereas hospital costs per beneficiary fell below medicines during most
of the 1990s, from 2002 they diverge dramatically reaching twice medicine costs
per beneficiary by 2010. (Figure 8.6).
8.56 Specialist costs per beneficiary also fell below medicines from 1981 to 2004, with a
34% differential by 2010. Medicines demonstrate a remarkable real decline in cost
per capita, largely attributable to three factors:
Medical schemes under financial pressure from cost increases on hospitals and
specialists shifted many day-to-day benefits into medical savings account
arrangements or equivalents, effectively removing risk-pooling from less serious
medicine prescription-based purchases. This was also done as a reaction to the
amendments to the regulatory framework for medical schemes which limited
their ability to risk-pool only for good patient risks (younger and healthier
members). Schemes effectively preserved the risk-pooled benefits for more
serious medical conditions. Similar effects occurred for other less necessary
healthcare.
The introduction of chronic benefits into medical scheme mandatory benefits
from 2004 compelled schemes to implement designated service provider
arrangements and medicine protocols. Schemes in effect forced medicine
manufacturers to compete to get on their medicine formularies.
The introduction of the single-exit pricing (SEP) mechanism together with the
prohibition on bonusing and discounting contained in the main body of the
Medicines and Related Substances Control Act forced private hospital groups to
abandon their practice of receiving hidden rebates (or kick-backs) from
medicine manufacturers.
8.57 The dramatic divergence between the hospital and medicine per capita costs
indicates that hospitals built the profits they were making from the rebates into
their facility fees from 2004. The significant market power wielded by private hospitals
permitted them to merely convert one revenue stream into another with no market constraint
provided by medical schemes.
8.58 Objections were raised by schemes who argued that an agreement reached between
schemes and private hospitals in 1999 already allowed hospital groups to convert a
prior medicine markup (introduced during the 1990s) into facility fees. Schemes at
that stage wished to remove the perverse incentives associated with the markup.
However, hospital groups both increased their facility fees (by the value of the
markup) and covertly introduced the rebate system. This potentially explains the
dramatic cost increase in hospital costs detectable from 2000.
8.59 The consolidation of private hospitals into major national hospital groups allowed
them to implement centralized procurement for medicines, consumables, and
equipment. The centralized procurement arrangements, together with significant
market power over medical product companies, allowed for the easy
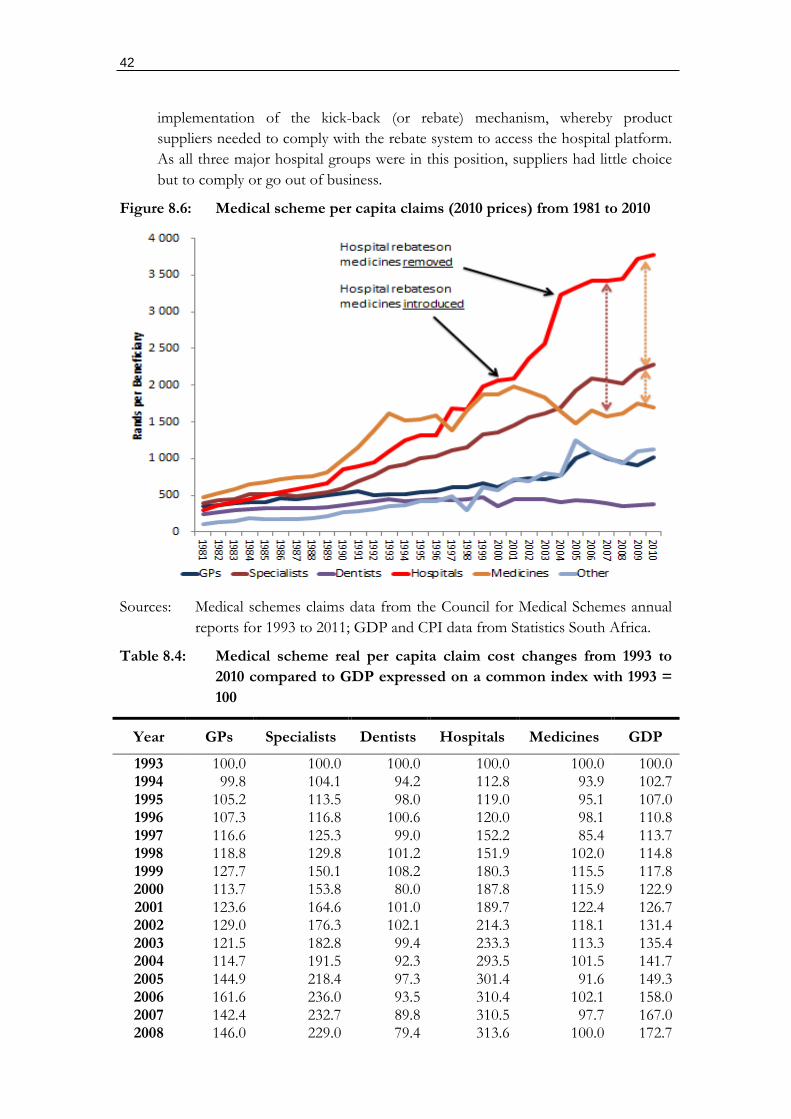
42
implementation of the kick-back (or rebate) mechanism, whereby product
suppliers needed to comply with the rebate system to access the hospital platform.
As all three major hospital groups were in this position, suppliers had little choice
but to comply or go out of business.
Figure 8.6: Medical scheme per capita claims (2010 prices) from 1981 to 2010
Sources: Medical schemes claims data from the Council for Medical Schemes annual
reports for 1993 to 2011; GDP and CPI data from Statistics South Africa.
Table 8.4: Medical scheme real per capita claim cost changes from 1993 to
2010 compared to GDP expressed on a common index with 1993 =
100
Year GPs Specialists Dentists Hospitals Medicines GDP
1993 100.0 100.0 100.0 100.0 100.0 100.0 1994 99.8 104.1 94.2 112.8 93.9 102.7 1995 105.2 113.5 98.0 119.0 95.1 107.0 1996 107.3 116.8 100.6 120.0 98.1 110.8 1997 116.6 125.3 99.0 152.2 85.4 113.7 1998 118.8 129.8 101.2 151.9 102.0 114.8 1999 127.7 150.1 108.2 180.3 115.5 117.8 2000 113.7 153.8 80.0 187.8 115.9 122.9 2001 123.6 164.6 101.0 189.7 122.4 126.7 2002 129.0 176.3 102.1 214.3 118.1 131.4 2003 121.5 182.8 99.4 233.3 113.3 135.4 2004 114.7 191.5 92.3 293.5 101.5 141.7 2005 144.9 218.4 97.3 301.4 91.6 149.3 2006 161.6 236.0 93.5 310.4 102.1 158.0 2007 142.4 232.7 89.8 310.5 97.7 167.0 2008 146.0 229.0 79.4 313.6 100.0 172.7
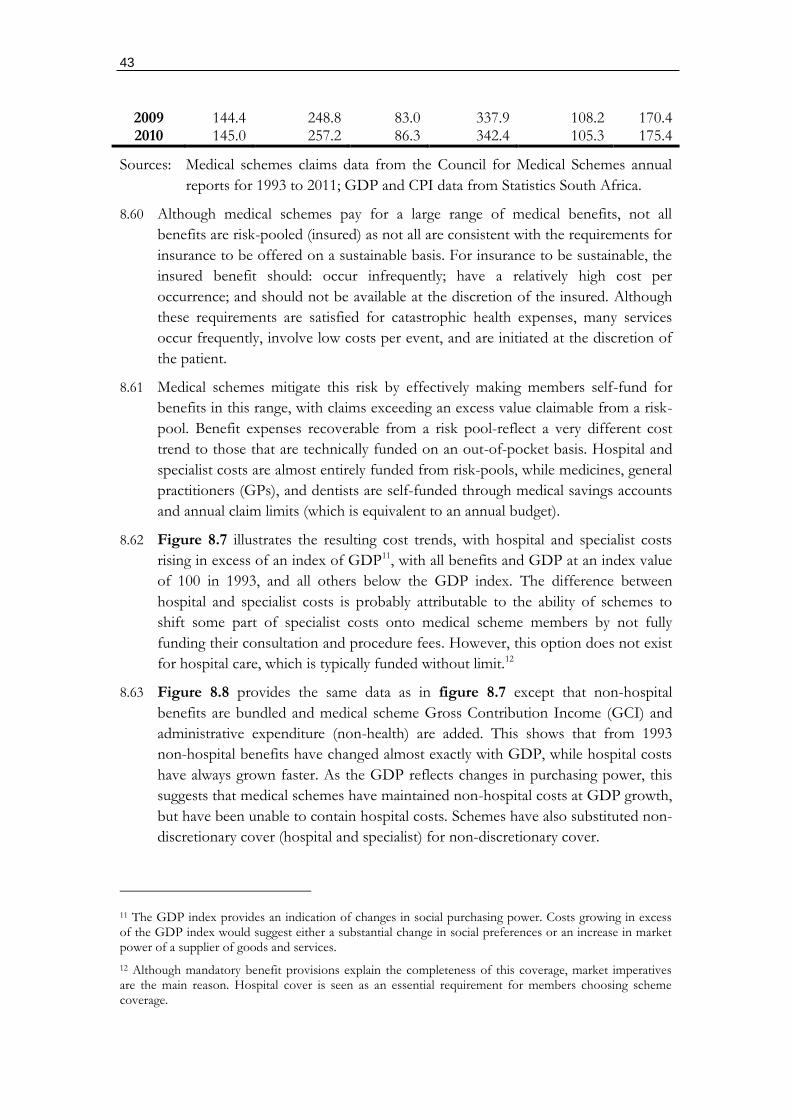
43
2009 144.4 248.8 83.0 337.9 108.2 170.4 2010 145.0 257.2 86.3 342.4 105.3 175.4
Sources: Medical schemes claims data from the Council for Medical Schemes annual
reports for 1993 to 2011; GDP and CPI data from Statistics South Africa.
8.60 Although medical schemes pay for a large range of medical benefits, not all
benefits are risk-pooled (insured) as not all are consistent with the requirements for
insurance to be offered on a sustainable basis. For insurance to be sustainable, the
insured benefit should: occur infrequently; have a relatively high cost per
occurrence; and should not be available at the discretion of the insured. Although
these requirements are satisfied for catastrophic health expenses, many services
occur frequently, involve low costs per event, and are initiated at the discretion of
the patient.
8.61 Medical schemes mitigate this risk by effectively making members self-fund for
benefits in this range, with claims exceeding an excess value claimable from a risk-
pool. Benefit expenses recoverable from a risk pool-reflect a very different cost
trend to those that are technically funded on an out-of-pocket basis. Hospital and
specialist costs are almost entirely funded from risk-pools, while medicines, general
practitioners (GPs), and dentists are self-funded through medical savings accounts
and annual claim limits (which is equivalent to an annual budget).
8.62 Figure 8.7 illustrates the resulting cost trends, with hospital and specialist costs
rising in excess of an index of GDP11, with all benefits and GDP at an index value
of 100 in 1993, and all others below the GDP index. The difference between
hospital and specialist costs is probably attributable to the ability of schemes to
shift some part of specialist costs onto medical scheme members by not fully
funding their consultation and procedure fees. However, this option does not exist
for hospital care, which is typically funded without limit.12
8.63 Figure 8.8 provides the same data as in figure 8.7 except that non-hospital
benefits are bundled and medical scheme Gross Contribution Income (GCI) and
administrative expenditure (non-health) are added. This shows that from 1993
non-hospital benefits have changed almost exactly with GDP, while hospital costs
have always grown faster. As the GDP reflects changes in purchasing power, this
suggests that medical schemes have maintained non-hospital costs at GDP growth,
but have been unable to contain hospital costs. Schemes have also substituted non-
discretionary cover (hospital and specialist) for non-discretionary cover.
11 The GDP index provides an indication of changes in social purchasing power. Costs growing in excess of the GDP index would suggest either a substantial change in social preferences or an increase in market power of a supplier of goods and services.
12 Although mandatory benefit provisions explain the completeness of this coverage, market imperatives are the main reason. Hospital cover is seen as an essential requirement for members choosing scheme coverage.
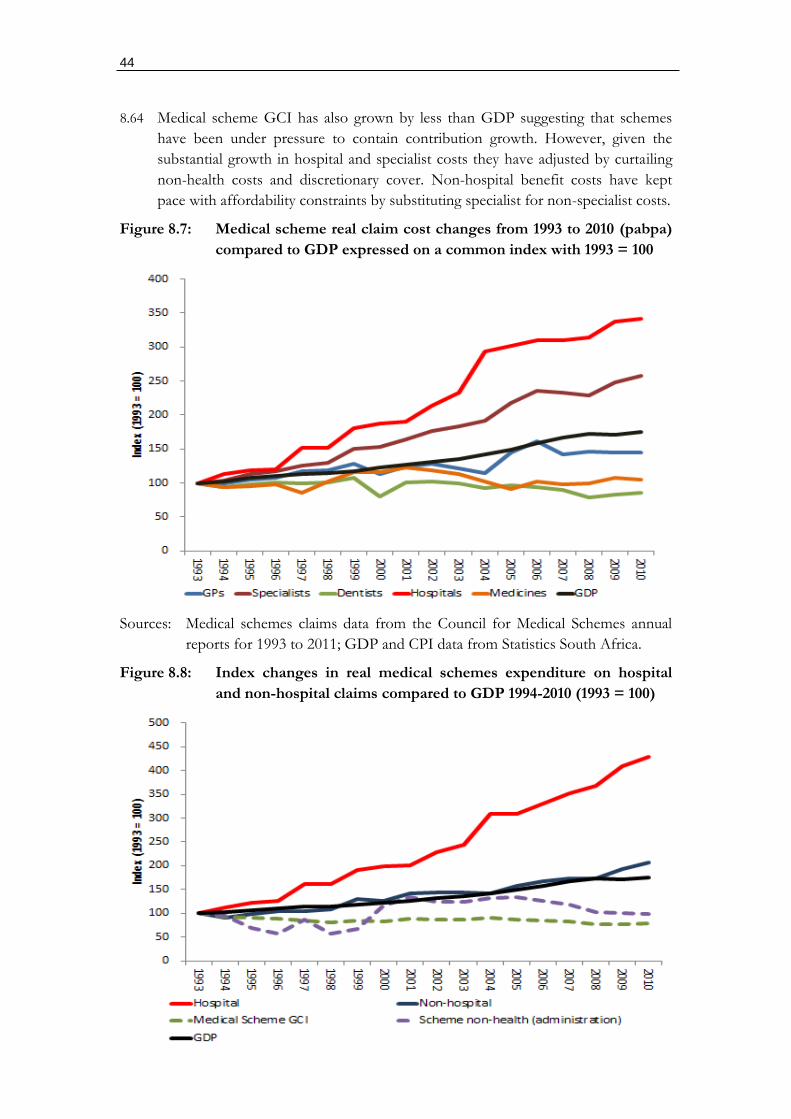
44
8.64 Medical scheme GCI has also grown by less than GDP suggesting that schemes
have been under pressure to contain contribution growth. However, given the
substantial growth in hospital and specialist costs they have adjusted by curtailing
non-health costs and discretionary cover. Non-hospital benefit costs have kept
pace with affordability constraints by substituting specialist for non-specialist costs.
Figure 8.7: Medical scheme real claim cost changes from 1993 to 2010 (pabpa)
compared to GDP expressed on a common index with 1993 = 100
Sources: Medical schemes claims data from the Council for Medical Schemes annual
reports for 1993 to 2011; GDP and CPI data from Statistics South Africa.
Figure 8.8: Index changes in real medical schemes expenditure on hospital
and non-hospital claims compared to GDP 1994-2010 (1993 = 100)
45
Sources: Medical schemes claims data from the Council for Medical Schemes annual
reports for 1993 to 2011; GDP and CPI data from Statistics South Africa.
8.65 A pivotal development occurring during the post 2000 period has been the
implementation of the Government Employees Medical Scheme (GEMS). This
reversed the 1993 government decision to liberalize the medical scheme
participation of public sector employees and their families. Given the scale of the
intervention Government chose to implement GEMS on an incremental basis,
with all new civil servants incentivized to enroll onto the scheme from 2006, with
incentives provided for the rest to either switch from an open scheme or to join.
GEMS has grown rapidly from 0 enrollees in 2006 to 1.7 million at present. At its
(inevitable) maximum the scheme will exceed 3 million beneficiaries.
8.66 GEMS has grown from two sources. New low-income members who were never
on a scheme before and existing open medical schemes (those that predominantly
target individual members). Large- and medium-sized schemes targeting corporate
membership are largely unaffected. However, smaller open schemes have seen
their beneficiaries age rapidly with many having to liquidate or amalgamate. GEMS
has consequently caused a general consolidation of medical schemes, with only two
(Discovery and GEMS) now covering just more than 50% of all beneficiaries.
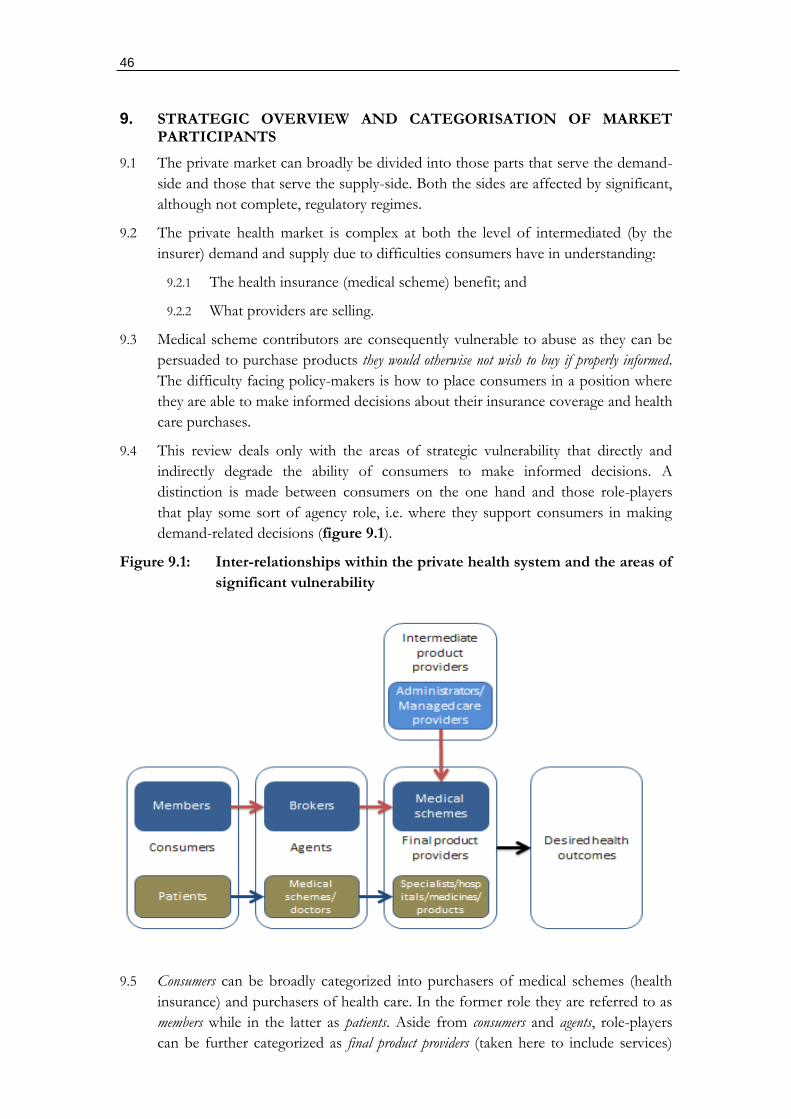
46
9. STRATEGIC OVERVIEW AND CATEGORISATION OF MARKET PARTICIPANTS
9.1 The private market can broadly be divided into those parts that serve the demand-
side and those that serve the supply-side. Both the sides are affected by significant,
although not complete, regulatory regimes.
9.2 The private health market is complex at both the level of intermediated (by the
insurer) demand and supply due to difficulties consumers have in understanding:
9.2.1 The health insurance (medical scheme) benefit; and
9.2.2 What providers are selling.
9.3 Medical scheme contributors are consequently vulnerable to abuse as they can be
persuaded to purchase products they would otherwise not wish to buy if properly informed.
The difficulty facing policy-makers is how to place consumers in a position where
they are able to make informed decisions about their insurance coverage and health
care purchases.
9.4 This review deals only with the areas of strategic vulnerability that directly and
indirectly degrade the ability of consumers to make informed decisions. A
distinction is made between consumers on the one hand and those role-players
that play some sort of agency role, i.e. where they support consumers in making
demand-related decisions (figure 9.1).
Figure 9.1: Inter-relationships within the private health system and the areas of
significant vulnerability
9.5 Consumers can be broadly categorized into purchasers of medical schemes (health
insurance) and purchasers of health care. In the former role they are referred to as
members while in the latter as patients. Aside from consumers and agents, role-players
can be further categorized as final product providers (taken here to include services)
47
where some final product is sold to consumers, and intermediate product providers that
sell goods and services to final product suppliers.
9.6 Agents include pure agents, in the form of medical scheme brokers, and those that
also provide products, such as medical schemes (in relation to patients) and
doctors. Where a role-player is both an agent and a product provider a moral
hazard problem arises where the independence of the advice can be compromised.
This is a particular concern with doctors. Medical schemes, however, have
incentives to support cost-efficient access to healthcare provided there are no conflicts of
interest between parties advising schemes and healthcare service providers.
9.7 Intermediate product providers are most relevant on the funder side, with contracted
services provided to medical schemes through administrators and managed care
providers. Provided there is no conflict of interest with office bearers of schemes
or health care product providers, intermediate product providers should support
medical schemes in achieving their aims.
9.8 The review that follows examines each major role-player in accordance with the
above functions and includes:
9.8.1 Agents:
Funders: brokers, and medical schemes (open and restricted); and
Health care providers: GPs and specialists.
9.8.2 Final product providers:
Funders: medical schemes; and
Health care providers: GPs, specialists, hospitals, medical products.
9.8.3 Intermediate product providers:
Funders: medical scheme administrators, and managed care
intermediaries.
48
10. PRODUCT MARKETS
Overview
10.1 The most important market participants responsible for the majority of product
offerings in the private health market are: health funders (medical schemes and to a
lesser extent health insurance); third-party administrators and managed care
intermediaries; brokers in the form of medical scheme advisors; hospitals; general
practitioners and specialists; medicines; and non-medicine medical products.
10.2 It can be argued that the final product purchased by consumers of healthcare is
improved health status, for which the various health products are merely inputs.
The specific mix of health products required to achieve improved health outcomes
varies in accordance with the relevant health condition resulting in reduced health
status, and the prevailing technology available to diagnose and treat the condition.
10.3 New approaches to diagnosis and treatment could significantly alter the
configuration of inputs required to alter health status and rapidly render some
inputs redundant. Alternative treatment regimens with similar outcomes could also
involve very different inputs, for instance surgery could substitute for alternative
medical management.
10.4 The complexity of the health system combined with the individualization of
treatment on a massive scale makes it impractical to use health outcomes
(improved health status) as a “product”, even if this is what consumers are seeking.
Instead consumers purchase certain products as an indirect means to this end,
despite never being entirely sure whether these indirect purchases can or will
achieve this objective.
10.5 Health insurance, in the form of medical schemes, are therefore purchased to
protect access to health professionals and related services and products. Purchases
of health products are therefore indirectly purchased on behalf of consumers by
health insurers with direct purchases occurring only where there are gaps in
insurance or where a consumer is not covered by insurance. This indirect
purchasing of health products is central to market behavior in the system, with
operational efficiencies determined by the market position and behavioural
incentives of schemes.
Medical schemes and health insurance
10.6 The market for the product health insurance is framed by legislation, with medical
schemes regulated as the pre-eminent vehicle. Although health insurance regulated
through the Short- and Long-Term Insurance Acts is possible, their role as
substitutes is minimized.
10.7 Medical schemes can take the form of open (commercial) medical schemes or
closed (restricted) schemes, with the latter sponsored largely by employers or
industries. Although technically closed schemes do not compete, they represent a
market constraint on open schemes as they can be established at the discretion of a
collective bargaining agreement.
49
10.8 Closed schemes can be established if open schemes are perceived as too expensive
or unresponsive. The implementation of the GEMS, which has greatly reduced the
number of open schemes, is an example.
10.9 Market entry is also relatively straightforward from regulatory perspective, with any
sponsor able to register a scheme with the CMS if basic regulatory requirements
are satisfied. Specialist expertise to support a start-up is available on an outsourced
basis to relevant parties. Barriers largely exist for open-scheme start-ups due to:
10.9.1 Access to capital;
10.9.2 Systemic risk faced by small risk pools (which creates a need for
reinsurance);
10.9.3 Branding disadvantages relative to established players;
10.9.4 Marketing disadvantages resulting from the payment of kickbacks to
brokers by established players limiting access to broker channels;
10.9.5 Healthcare cost disadvantages, with small players unable to exercise any
leverage in relation to healthcare providers; and
10.9.6 Administrator allegiances, where existing administrators prefer to back one
horse in the open scheme setting.
Third-party administrators and managed care intermediaries
10.10 The product provided by third-party administrators and managed care companies
is the outsourced management of medical scheme operations. As these functions can be
provided by schemes on an insourced basis, competitors include other third-party
administrators and schemes. Any medical scheme, whether open or closed, can
choose at any point to insource or outsource its administration and managed care.
10.11 As knowledge of scheme administration is well established in South Africa,
administrators will face competition even where a consolidation of administrators
occurs.
Medical scheme advisors (brokers)
10.12 Medical scheme advisors exist in large numbers with low barriers to entry. They are
also well distributed nationally.
Hospitals
10.13 Hospital products are quite diverse and theoretically could be broken down into a
vast range of discipline-related services (oncology, obstetrics and gynaecology,
etc.), support services (pharmacy, outpatients, radiology, pathology, etc.). A
pragmatic approach has been to focus only on acute beds as a proxy for the
product. This is however only valid for markets where there is no selective
contracting (i.e. no hospital competition) and depend on fee-for-service as the
primary modality for reimbursement. By way of contrast, markets subject to
selective contracting should involve the cherry-picking of hospitals and specific
services within a hospital (to the exclusion of others). Under these conditions more
50
specific product markets for hospital services and potential substitutes would be
required.
10.14 Hospital-based services could face competition in the following instances:
10.14.1 Public sector services: but these are of insufficient quality at present to act a
market constraint (but represent an important opportunity over time);
10.14.2 Day hospital services: which have all largely been bought out by the three
major hospital groups;
10.14.3 Specialist outpatient procedures and clinical centres: which are limited at present as
specialists are too closely affiliated with hospitals to compete with them;
and
10.14.4 Medical schemes: although able to establish their own medical centres and
hospitals fail to do so potentially because of the commercial imperatives of
administrators which differ from those of the schemes they administer.
10.15 Within South Africa selective contracting is very limited with funder (medical
scheme) purchasing largely taking the form of fee-for-service or near fee-for-
service reimbursement (so-called alternative reimbursement). Contracts between
funders and providers are national, even where regional arrangements are
negotiated.
10.16 Regional contracting may however emerge as a new phase in the constantly
evolving private health system as medical schemes are placed under significant
financial pressure to innovate in this regard. However, such opportunities may be
foreclosed by continued hospital consolidation.
General Practitioners and Specialists
10.17 The product provided by doctors, both GPs and specialists, are diagnoses,
medicine prescriptions, medicine dispensing, the administration of medical
procedures, referrals for further examination or treatment by specialists, and
referrals for hospital-based treatment.
10.18 Significant overlaps exist in the scopes of practice of GPs and specialists as well as
other health professionals (e.g. registered nurses). A GP can also expand their
scope of practice to include many procedures carried out by a specialist.
Conversely, without expanding their scope of practice, based on the basic training
of a doctor, any specialist can provide services typically provided by a GP.
10.19 Costs could be reduced within a health system where a GP substitutes for services
provided by a specialist, particularly where these are provided on an outpatient
basis. Conversely costs could be increased where higher charging specialists treat
patients with minor ailments and/or have incentives to refer patients for hospital-
based treatment.
Medicines
10.20 Medicines involve multiple products of which some have competition and others
no competition. They can be purchased on a pre-paid basis (through
insurance/medical schemes) or on an out-of-pocket basis. Stringent registration
51
requirements and patent protection can severely limit competition on a product-
specific basis. Market entry on a product-specific basis is difficult as this requires
the pre-existence of highly specialized companies (government-sponsored or
private) able to innovate at risk. New medicines often require considerable research
and testing (such as clinical trials) before they can be registered and sold anywhere
in the world. However, the true efficacy of medicines is often the subject of much
controversy with poor registration practices by regulators often resulting in the sale
of very expensive medicines which have little or no effect on patients.
Medical products (medical consumables and devices)
10.21 Medical products other than medicines are numerous and have many substitutes.
Competition is world-wide and registration is not always required. Barriers to
market entry are low and products can be subjected to considerable competition.
Within South Africa interference in these markets occurs through any intermediary
able to make purchasing decisions on behalf of consumers, such as hospitals,
medical scheme administrators, and managed care companies. Without such
interference no competition problems would be quite limited.
52
11. MEDICAL SCHEMES – OPEN
11.1 Open medical schemes constitute 57.7% of all medical scheme beneficiaries, down
from around 70% in 2000. The reduction is entirely due to the implementation of
GEMS, which, although restricted, in many respects behaves like a commercial
medical scheme.
11.2 Commercial open medical schemes do not all behave the same. Broadly they can
be divided into the following:
Model 1: Strong schemes with contractors (for administration and managed care
services) who must bid for business.
Model 2: Weak schemes where the contractors have largely captured the scheme.
Consequently there is no bidding for scheme business unless a service is needed
by the administrator.
11.3 Open schemes can also be divided into those that target employers and those that
focus on individuals. Although the law makes no distinction between the two and
individuals and employers can select any open scheme, market behavior is very
different between the two. With the difference largely found in the use of the
broker market.
11.4 Open medical schemes, whether model 1 or 2, are vulnerable to broker incentives
as they drive demand. Schemes focusing on employer-based business deal with
brokers contracted by employers (employer brokers) to advise them generally on
employee benefits. Schemes targeting the individual market depend on many
broker practices (financial advisors) that service individuals (individual brokers).
11.5 Brokers advising employers technically become the gatekeepers to all financial
service providers doing business through employers. Medical schemes (and more
particularly their administrators) consequently try hard to influence the decisions of
employer brokers, which can, and often does, extend to kickbacks.
11.6 Individual brokers are often coordinated by “channel brokers” to act as an
intermediary between broker practices and the scheme administrator. Although
there is some practical value to channel brokers, they are often set up as a kick-
back mechanism within the individual market structured so as to circumvent
statutory caps on broker fees. Member movement can consequently be driven by
the kickbacks to brokers rather than the preferences and choices of members.
11.7 Kick-backs inter-alia take the following forms:
Co-selling of gap health insurance: As insurance products are not regulated through
the Medical Schemes Act separate commissions can be paid where such
products are sold. Schemes often deliberately design coverage gaps in their
benefits to create a market for gap insurance. Brokers consequently try to sell
both the scheme and the gap product.
Co-selling of scheme related products: For instance wellness programmes are sold on
commission and can be used to top up commissions in excess of the regulated
capped fees.
53
Up-front fees: One-off lump-sum payments are often provided when a new
member is brought to a scheme. Where a member leaves quite soon thereafter,
schemes often try to claw-back part of the fee. Such lump sums have been
outlawed by the Medical Schemes Act, but are often still paid through other
arrangements.
Allocation of broker notes: Schemes often allocate brokers to members where they
have not selected a broker. This usually occurs without the member being
aware. The broker consequently receives a stream of income in respect of a
member that never uses their services or is even aware of their existence. Such
allocations are done to reward brokers for bringing in lots of business. In other
instances they involve fraud, with officials in the scheme sharing in the stream
of income.
11.8 Model 1 schemes effectively drive competition amongst contractors in the
environment and can change administrator and managed care provider fairly
regularly. Because the administrators are vulnerable in this market they often
become involved in paying kickbacks to scheme trustees and other office-bearers
to retain or steal business. Despite this, their relative vulnerability typically results
in fairly low administration fees. Where corruption is severe, however, non-market-
related administration fees are likely.
11.9 Model 2 schemes are entirely administrator-driven and they largely control the
decisions of trustees and office bearers of the scheme. Because such administrators
have no need to compete for business their administration fees are likely to be
substantially in excess of their true cost. Such administrators are also the
gatekeepers for any business done with the scheme and also commercially involved
in co-selling financial products (life insurance, annuities, disability cover, etc.) to
leverage off the special knowledge they have of their member’s health status.
11.10 Once mandatory benefits were removed in 1994 open medical schemes were free
to construct benefit plans (options) as they saw fit. The resulting complexity
reduced the ability of ordinary members to evaluate the value-for-money of
competing schemes and their options. Although some mandatory benefits were
reintroduced from 2000, they were not as comprehensive as before. Product
complexity is consequently prevalent. Brokers are therefore required to assist in
overcoming this complexity. However, as most brokers are conflicted in their relationships
with schemes, product complexity merely lowers transparency within the market and exposes
members to manipulation by the product suppliers (a situation which also exists with all other
financial products).
11.11 The intimate relationship between open medical schemes and brokers is the central
competition issue facing schemes. Product complexity requires some mechanism
to aid members in choosing between schemes and options. However, the market-
related mechanism, brokers, has been entirely captured by schemes/administrators.
Consequently, members are unable to make rational and informed choices.
Schemes consequently mainly compete through kickbacks to brokers rather than
better and more efficient benefit offering.
54
11.12 A significant reduction in product complexity is possible if schemes were forced to compete over a
common and transparently reflected benefit package. Such an outcome is however rendered
impossible by the fact that scheme contributions are effected not only by the benefit package but
also by their demographics.
11.13 For a common benefit package to exist, a system of risk-equalization is required to
standardize the pricing of different scheme demographics. Risk-equalization
involves the transfer of funds from schemes with risk profiles below the market
average for a specified benefit package to those above the national average. Such a
mechanism places all schemes ex ante in same financial position relative to a
specified benefit package. Price differences between schemes would now only reflect efficiencies
in the management of the benefit package.
11.14 In a market that seeks to encourage new scheme entrants prices for a common
package could also vary by the size of the risk pool. A problem which however
cannot be mitigated by risk-equalization alone. A system of statutory reinsurance
would however eliminate risk pool size as a problem and allow multiple risk pools
(schemes) to compete on an even playing field.
Market structure interventions that could improve competition
11.15 The interventions required to improve the market performance of schemes
include:
11.15.1 Governance interventions to prevent administrator capture of trustees and
schemes;
11.15.2 The division of brokers into: those performing an advisory function,
which requires complete independence from schemes; and those
marketing a particular scheme, which need not be independent;
11.15.3 The simplification of benefits to improve product transparency and value-
for-money comparisons, which should include the implementation of a
standardized benefit package which members can understand;
11.15.4 The introduction of risk-equalization to compel schemes to price compete
on the cost of a common package of coverage; and
11.15.5 The introduction of a system of statutory reinsurance over-and-above risk-
equalization to allow small schemes to compete with large schemes.
Competition concerns falling within the ambit of the Competition Commission
11.16 Areas where competition problems exist that may require investigation by the
competition authorities:
11.16.1 Where medical schemes limit competition for third-party contractors
(managed care companies and products) due to the gatekeeper influence
of third-party administrators; and
11.16.2 Where schemes limit competition for third-party contracts of any form to
preferred bidders with conflicted relationships with scheme office-bearers

55
(this is not strictly speaking a competition problem as it involves
fraudulent conduct).
11.16.3 Where schemes collude with brokers in exchange for financial reward to:
Force scheme members to have brokers;
Provide advice to members on the value-for-money of a scheme; and
Prevent members from selecting their own brokers (which is made
possible by the control schemes have over the allocation of contracts).
11.16.4 Where schemes limit independent broker access to their scheme by
refusing to give them contracts. This also allows schemes to exercise
market power over brokers and the advice they offer.
56
12. MEDICAL SCHEMES – RESTRICTED MEMBERSHIP
12.1 Restricted membership schemes, due to the proximity to specific employers, have a
natural incentive to manage their schemes efficiently. Consequently the
outsourcing of administration to commercial administrators is done on a tender
basis which results in lower administration and managed care costs than in open
schemes.
12.2 Although restricted medical schemes are not commercial in nature, the choices
made by employers and their employees act as a market constraint on open
schemes. Employers/employees could choose to close a restricted scheme and opt
for an open scheme, or a range of schemes. Alternatively they could set up their
own schemes rather than use an open option.
12.3 The option for an employer or industry to establish their own scheme should
always remain to prevent open schemes from becoming the only option available.
However, employers rely almost entirely on the assistance of their employee
benefit advisors (employer brokers) to set up such an arrangement. As employer
brokers have little financial incentive (due to the more lucrative commissions paid
by open schemes) to provide such advice, many employers will not make use of
this option.
12.4 The establishment of an industry or employer scheme often makes sense where a
large group of potential beneficiaries exists. For instance, it made sense for
government to establish GEMS because of the size of the workforce. It also could,
for instance, make sense for all universities, mining houses, or motor-vehicle
manufacturers to establish their own dedicated schemes. The main constraint is the
coordinating mechanism and general absence of a clear sponsor. However, were
the employer brokers to operate independently of schemes it is possible they
would play an important intermediary role in realizing these options.
12.5 One of the factors leading to the closure of some fairly large restricted
membership schemes, as with open schemes, has been their demographic make-up
(in particular the ratio of old to young beneficiaries). Were the system of risk-
equalization and reinsurance to be introduced in relation to a common benefit
package, however, restricted schemes would be able to remain, or to be introduced,
regardless of their size or demographic profile.
Market structure interventions that could improve competition
12.6 Interventions required to improve competition therefore include:
12.6.1 The removal of conflicts of interest between employer brokers and
medical schemes to encourage support for restricted membership schemes
when an employer can plainly benefit;
12.6.2 The inclusion of restricted membership schemes in a system of mandatory
risk-equalization and reinsurance in relation to a statutorily determined
industry-wide and easy to understand common package of benefits.

57
Competition concerns falling within the ambit of the Competition Commission
12.7 No specific competition problems exist that require investigation by the
competition authorities.
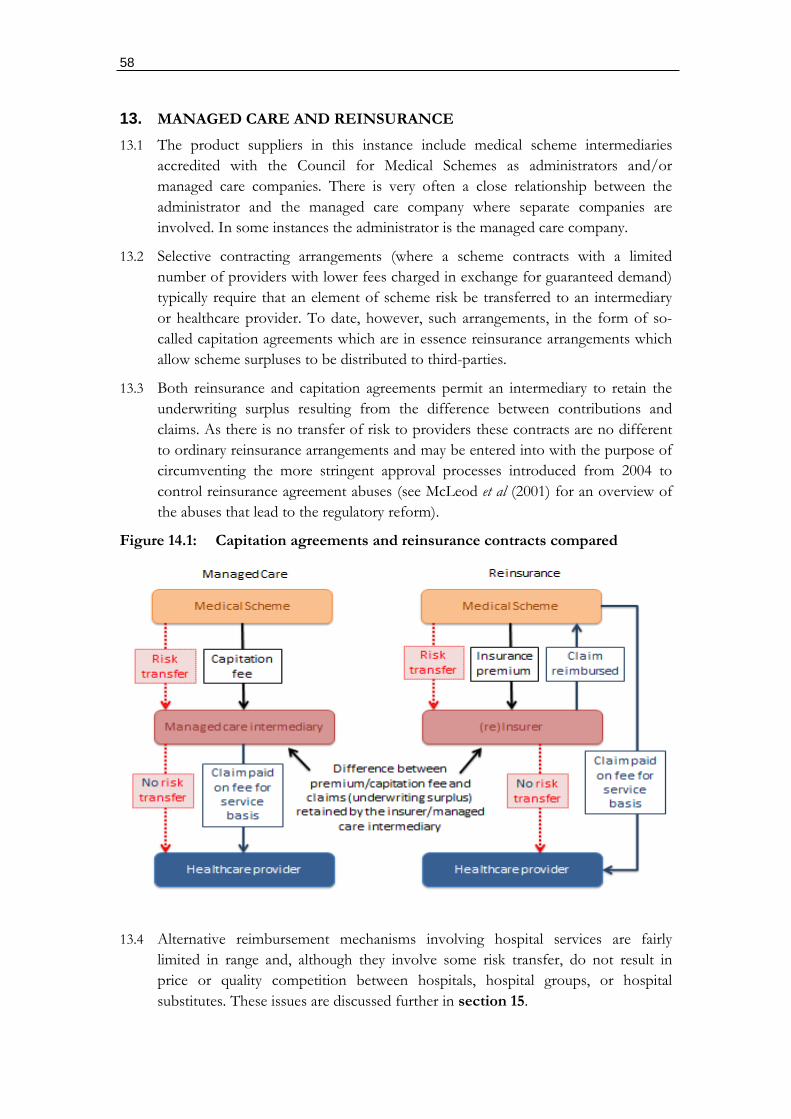
58
13. MANAGED CARE AND REINSURANCE
13.1 The product suppliers in this instance include medical scheme intermediaries
accredited with the Council for Medical Schemes as administrators and/or
managed care companies. There is very often a close relationship between the
administrator and the managed care company where separate companies are
involved. In some instances the administrator is the managed care company.
13.2 Selective contracting arrangements (where a scheme contracts with a limited
number of providers with lower fees charged in exchange for guaranteed demand)
typically require that an element of scheme risk be transferred to an intermediary
or healthcare provider. To date, however, such arrangements, in the form of so-
called capitation agreements which are in essence reinsurance arrangements which
allow scheme surpluses to be distributed to third-parties.
13.3 Both reinsurance and capitation agreements permit an intermediary to retain the
underwriting surplus resulting from the difference between contributions and
claims. As there is no transfer of risk to providers these contracts are no different
to ordinary reinsurance arrangements and may be entered into with the purpose of
circumventing the more stringent approval processes introduced from 2004 to
control reinsurance agreement abuses (see McLeod et al (2001) for an overview of
the abuses that lead to the regulatory reform).
Figure 14.1: Capitation agreements and reinsurance contracts compared
13.4 Alternative reimbursement mechanisms involving hospital services are fairly
limited in range and, although they involve some risk transfer, do not result in
price or quality competition between hospitals, hospital groups, or hospital
substitutes. These issues are discussed further in section 15.
59
Market structure interventions that could improve competition
13.5 Required interventions to improve the workings of the market:
13.5.1 A statutory reinsurance arrangement should be established for all schemes,
funded by a mandatory contribution from all schemes to improve market
entry for competing open schemes;
13.5.2 All agreements involving a transfer of risk to an entity outside of the
scheme should comply with performance guidelines and be reviewed and
approved by the regulator to remove collusive arrangements with
providers; and
13.5.3 Scheme-related interventions dealing with their governance and the
independence of brokers are required to encourage the proper use of
managed care interventions and all outsourced arrangements.
Competition concerns falling within the ambit of the Competition Commission
13.6 The Competition Commission should consider investigating the extent to which
there is vertical collusion between specific intermediaries contracted to medical
schemes and a healthcare service or product providers which may have the
purpose of driving up the costs of medical schemes. This can take the form of the
quasi capitation agreements or any related risk transfer agreement.
60
14. INSURANCE PRODUCTS
14.1 As medical schemes are regulated health insurance providers it is possible for
parallel insurance products to be created through vehicles regulated as short- and
long-term insurance in South Africa. Standard insurance operators are limited to
prudential and conduct related regulation. There is no product supervision and
risk-rating and risk-selection are permitted, i.e. there is no rights-based social
protection regime in place.
14.2 Medical schemes by way of contrast are regulated to achieve social protection
objectives through the market. For this to work legislation limits the factors upon
which competition can occur. However, regulatory arbitrage must be avoided that
permits commercial players have financial incentives to leverage off the less
regulated products to undermine the environment offering stronger social
protection.
14.3 For health insurance markets to operate efficiently they need to limit competition
on the following:
Product offerings: which if permitted will confuse consumers who are unable to
assess the value-for-money of an insurance product; and
Health status: which if permitted, systematically excludes groups and individuals
from sustainable cover and reduces the incentives of schemes to compete on
provider costs.
14.4 As discussed in section 10, this requires that health insurance products compete
on price for a common risk-equalized and reinsured benefit package. Even where
the complete framework is not in place, all instances where competition is not
permitted in relation to health status (i.e. where risk-rating and risk-selection are
prohibited and minimum benefits mandated), pro-competitive results support
social protection objectives.
Market structure interventions that could improve competition
14.5 Parallel commercial insurance products (to regulated medical schemes), with
certain minor exceptions, need to be prohibited. Products that wish to compete
with medical schemes should register as medical schemes.
Competition concerns falling within the ambit of the Competition Act
14.6 There are no specific concerns.
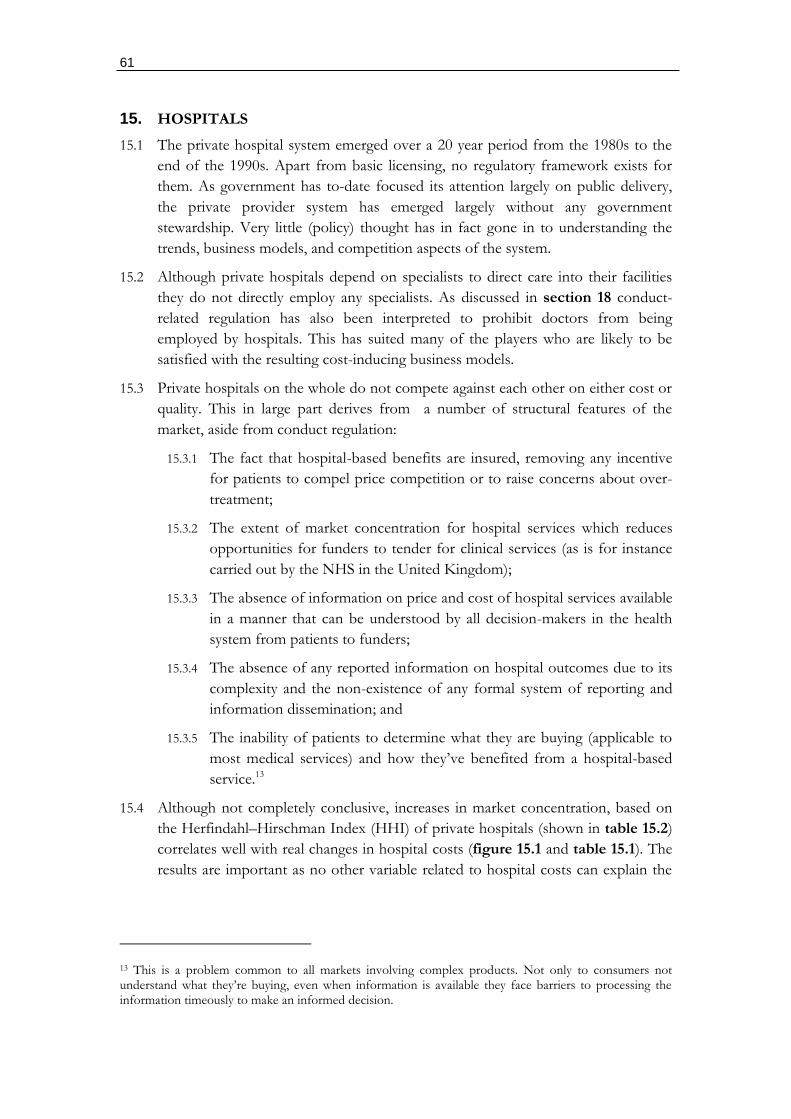
61
15. HOSPITALS
15.1 The private hospital system emerged over a 20 year period from the 1980s to the
end of the 1990s. Apart from basic licensing, no regulatory framework exists for
them. As government has to-date focused its attention largely on public delivery,
the private provider system has emerged largely without any government
stewardship. Very little (policy) thought has in fact gone in to understanding the
trends, business models, and competition aspects of the system.
15.2 Although private hospitals depend on specialists to direct care into their facilities
they do not directly employ any specialists. As discussed in section 18 conduct-
related regulation has also been interpreted to prohibit doctors from being
employed by hospitals. This has suited many of the players who are likely to be
satisfied with the resulting cost-inducing business models.
15.3 Private hospitals on the whole do not compete against each other on either cost or
quality. This in large part derives from a number of structural features of the
market, aside from conduct regulation:
15.3.1 The fact that hospital-based benefits are insured, removing any incentive
for patients to compel price competition or to raise concerns about over-
treatment;
15.3.2 The extent of market concentration for hospital services which reduces
opportunities for funders to tender for clinical services (as is for instance
carried out by the NHS in the United Kingdom);
15.3.3 The absence of information on price and cost of hospital services available
in a manner that can be understood by all decision-makers in the health
system from patients to funders;
15.3.4 The absence of any reported information on hospital outcomes due to its
complexity and the non-existence of any formal system of reporting and
information dissemination; and
15.3.5 The inability of patients to determine what they are buying (applicable to
most medical services) and how they’ve benefited from a hospital-based
service.13
15.4 Although not completely conclusive, increases in market concentration, based on
the Herfindahl–Hirschman Index (HHI) of private hospitals (shown in table 15.2)
correlates well with real changes in hospital costs (figure 15.1 and table 15.1). The
results are important as no other variable related to hospital costs can explain the
13 This is a problem common to all markets involving complex products. Not only to consumers not understand what they’re buying, even when information is available they face barriers to processing the information timeously to make an informed decision.
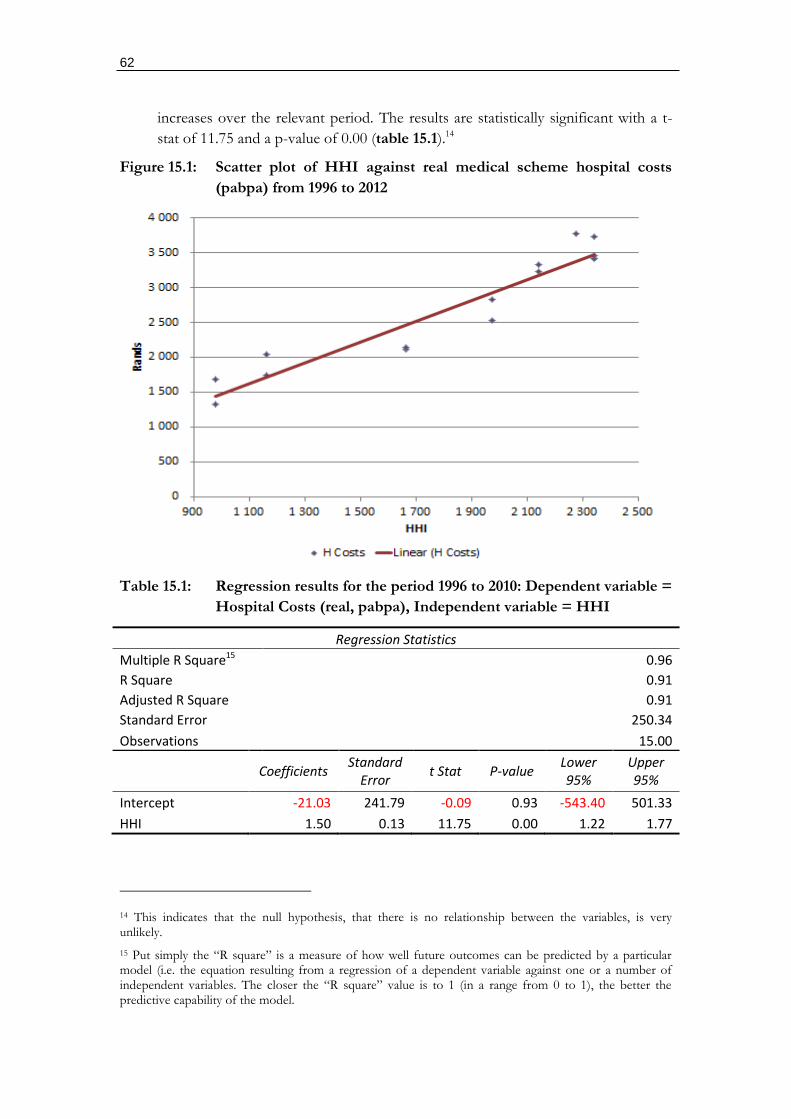
62
increases over the relevant period. The results are statistically significant with a t-
stat of 11.75 and a p-value of 0.00 (table 15.1).14
Figure 15.1: Scatter plot of HHI against real medical scheme hospital costs
(pabpa) from 1996 to 2012
Table 15.1: Regression results for the period 1996 to 2010: Dependent variable =
Hospital Costs (real, pabpa), Independent variable = HHI
Regression Statistics
Multiple R Square15 0.96
R Square 0.91
Adjusted R Square 0.91
Standard Error 250.34
Observations 15.00
Coefficients
Standard Error
t Stat P-value Lower 95%
Upper 95%
Intercept -21.03 241.79 -0.09 0.93 -543.40 501.33
HHI 1.50 0.13 11.75 0.00 1.22 1.77
14 This indicates that the null hypothesis, that there is no relationship between the variables, is very unlikely.
15 Put simply the “R square” is a measure of how well future outcomes can be predicted by a particular model (i.e. the equation resulting from a regression of a dependent variable against one or a number of independent variables. The closer the “R square” value is to 1 (in a range from 0 to 1), the better the predictive capability of the model.
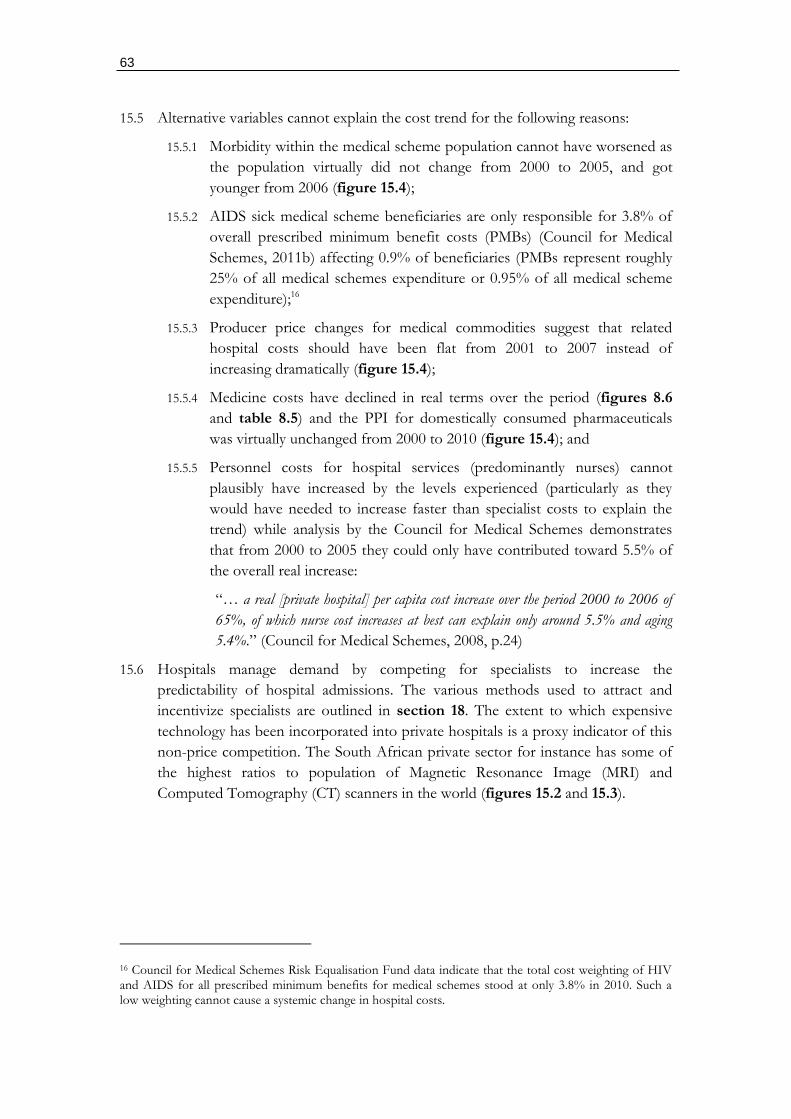
63
15.5 Alternative variables cannot explain the cost trend for the following reasons:
15.5.1 Morbidity within the medical scheme population cannot have worsened as
the population virtually did not change from 2000 to 2005, and got
younger from 2006 (figure 15.4);
15.5.2 AIDS sick medical scheme beneficiaries are only responsible for 3.8% of
overall prescribed minimum benefit costs (PMBs) (Council for Medical
Schemes, 2011b) affecting 0.9% of beneficiaries (PMBs represent roughly
25% of all medical schemes expenditure or 0.95% of all medical scheme
expenditure);16
15.5.3 Producer price changes for medical commodities suggest that related
hospital costs should have been flat from 2001 to 2007 instead of
increasing dramatically (figure 15.4);
15.5.4 Medicine costs have declined in real terms over the period (figures 8.6
and table 8.5) and the PPI for domestically consumed pharmaceuticals
was virtually unchanged from 2000 to 2010 (figure 15.4); and
15.5.5 Personnel costs for hospital services (predominantly nurses) cannot
plausibly have increased by the levels experienced (particularly as they
would have needed to increase faster than specialist costs to explain the
trend) while analysis by the Council for Medical Schemes demonstrates
that from 2000 to 2005 they could only have contributed toward 5.5% of
the overall real increase:
“… a real [private hospital] per capita cost increase over the period 2000 to 2006 of
65%, of which nurse cost increases at best can explain only around 5.5% and aging
5.4%.” (Council for Medical Schemes, 2008, p.24)
15.6 Hospitals manage demand by competing for specialists to increase the
predictability of hospital admissions. The various methods used to attract and
incentivize specialists are outlined in section 18. The extent to which expensive
technology has been incorporated into private hospitals is a proxy indicator of this
non-price competition. The South African private sector for instance has some of
the highest ratios to population of Magnetic Resonance Image (MRI) and
Computed Tomography (CT) scanners in the world (figures 15.2 and 15.3).
16 Council for Medical Schemes Risk Equalisation Fund data indicate that the total cost weighting of HIV and AIDS for all prescribed minimum benefits for medical schemes stood at only 3.8% in 2010. Such a low weighting cannot cause a systemic change in hospital costs.
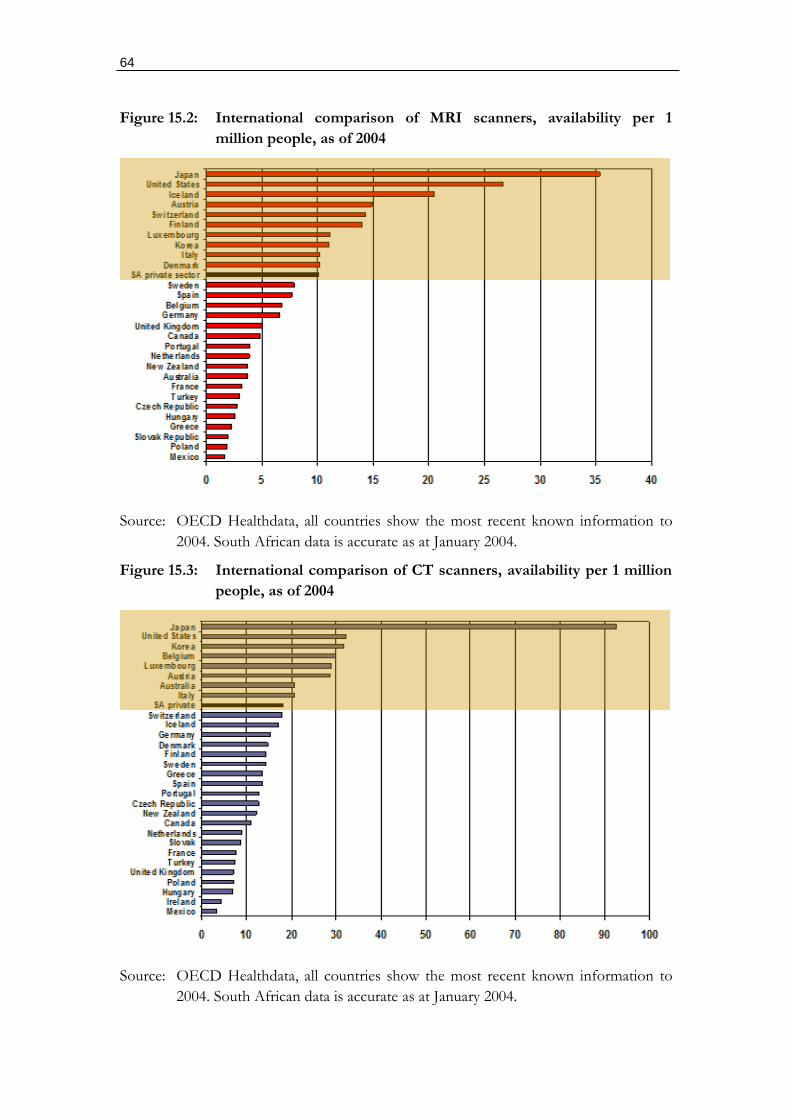
64
Figure 15.2: International comparison of MRI scanners, availability per 1
million people, as of 2004
Source: OECD Healthdata, all countries show the most recent known information to
2004. South African data is accurate as at January 2004.
Figure 15.3: International comparison of CT scanners, availability per 1 million
people, as of 2004
Source: OECD Healthdata, all countries show the most recent known information to
2004. South African data is accurate as at January 2004.
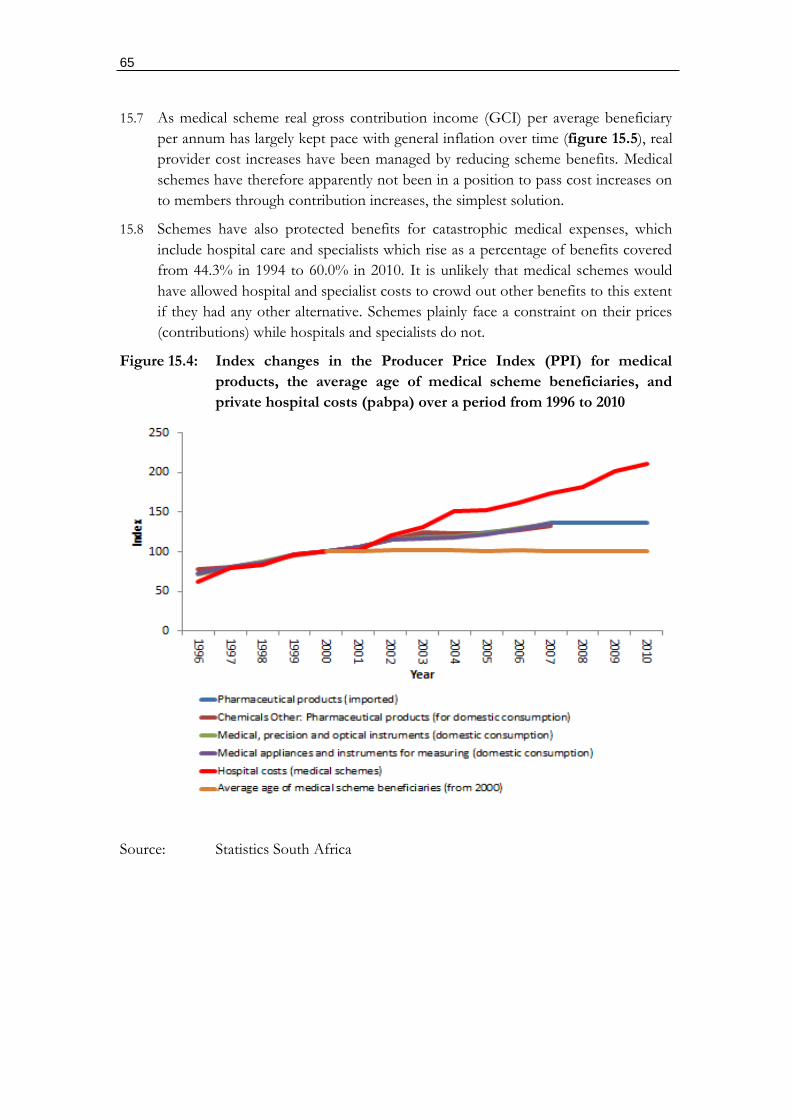
65
15.7 As medical scheme real gross contribution income (GCI) per average beneficiary
per annum has largely kept pace with general inflation over time (figure 15.5), real
provider cost increases have been managed by reducing scheme benefits. Medical
schemes have therefore apparently not been in a position to pass cost increases on
to members through contribution increases, the simplest solution.
15.8 Schemes have also protected benefits for catastrophic medical expenses, which
include hospital care and specialists which rise as a percentage of benefits covered
from 44.3% in 1994 to 60.0% in 2010. It is unlikely that medical schemes would
have allowed hospital and specialist costs to crowd out other benefits to this extent
if they had any other alternative. Schemes plainly face a constraint on their prices
(contributions) while hospitals and specialists do not.
Figure 15.4: Index changes in the Producer Price Index (PPI) for medical
products, the average age of medical scheme beneficiaries, and
private hospital costs (pabpa) over a period from 1996 to 2010
Source: Statistics South Africa
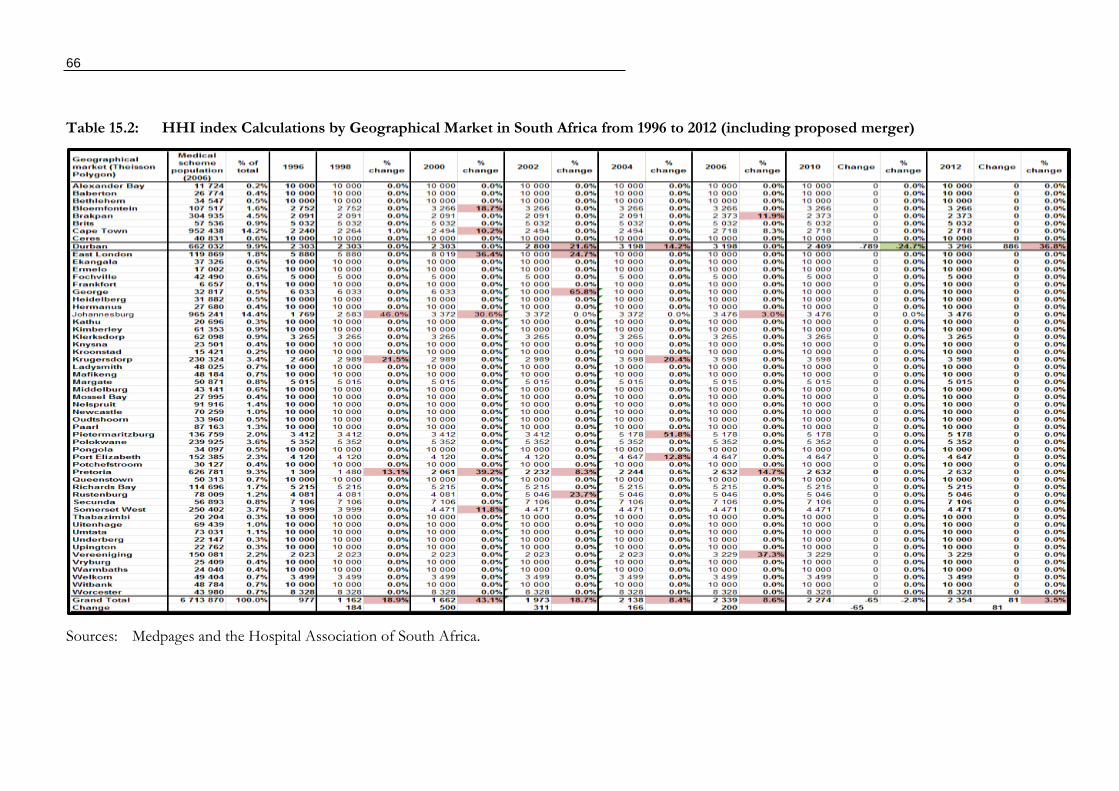
66
Table 15.2: HHI index Calculations by Geographical Market in South Africa from 1996 to 2012 (including proposed merger)
Sources: Medpages and the Hospital Association of South Africa.
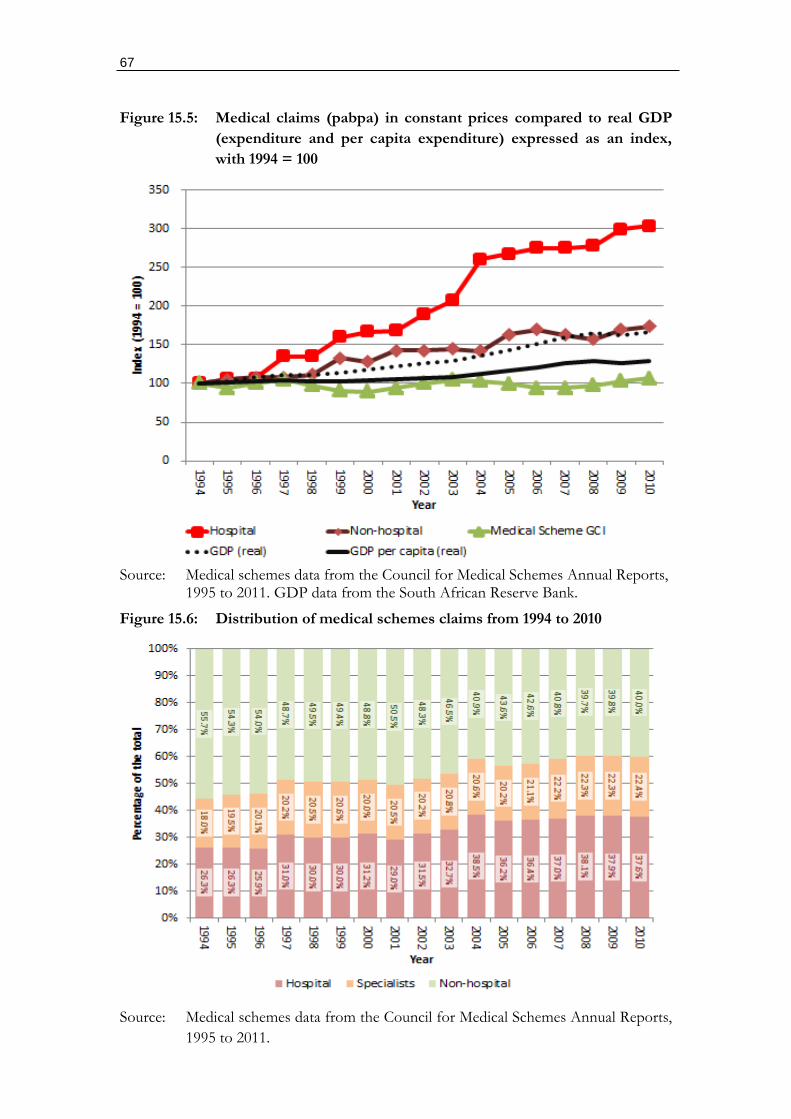
67
Figure 15.5: Medical claims (pabpa) in constant prices compared to real GDP
(expenditure and per capita expenditure) expressed as an index,
with 1994 = 100
Source: Medical schemes data from the Council for Medical Schemes Annual Reports,
1995 to 2011. GDP data from the South African Reserve Bank.
Figure 15.6: Distribution of medical schemes claims from 1994 to 2010
Source: Medical schemes data from the Council for Medical Schemes Annual Reports,
1995 to 2011.
68
15.9 Based on the above private hospital costs do not appear to be explained by
conventional drivers of cost. Only two factors materially drive cost:
15.9.1 Changes in hospital-based charges; and
15.9.2 Changes in utilization.
15.10 Hospital-based charge increases cannot be explained by conventional cost drivers,
such as salary cost increases. Changes in utilization have also occurred despite the
medical scheme population getting younger and HIV and AIDS responsible for
approximately 0.95% of medical scheme spend.
15.11 Changes in utilization are susceptible to influence by both doctors and hospitals
with a variety of mechanisms available. Which mechanism is applied within each
hospital or hospital group may depend on local circumstances. The following are
all possibilities:
15.11.1 Over-stating theatre times on invoices to medical schemes;
15.11.2 Loading year-on-year facility fee increases on those areas where medical
schemes are least able to manage unitization (theatre fees, which are
charged by the minute; and ICU and High Care);
15.11.3 The strategic over-investment by hospitals in specific equipment which are
susceptible to high utilization by specialists;
15.11.4 Tacit agreements with doctors that they will admit patients to ICU and
High Care in circumstances where this is not always required (for instance
post-operatively as a routine decision rather than where clinically
indicated);
15.11.5 Implicit cooperation with doctors that they will retain patients in hospital
for longer periods than necessary;17
15.11.6 Admitting patients for routine tests which could be performed on an out-
patient basis (e.g. MRI scans, followed sequentially by blood tests, with the
patient retained as an inpatient until all results are through);
15.11.7 The careful structuring of specialist consultation and procedure codes to
encourage hospital referrals;
15.11.8 Placing pressure on specialists to increase their use of hospital resources in
exchange for hospital privileges;
15.11.9 Rewarding specialists directly or indirectly for increased hospital referrals;
15.11.10 Providing specialists with a financial stake in a hospital or hospital group
to encourage hospital referrals; and
17 Due to the fact that many specialists effectively share in the profits of a hospital. Where no explicit profit sharing exists specialists may feel their hospital privileges may be at risk if they don’t please the hospital by over-servicing.
69
15.11.11 Offering financial packages to specialists that discourage their entering
into contracts with medical schemes to reduce unnecessary hospital
referrals.
15.12 The only reasonable conclusion possible is that hospital cost increases reflect
deliberate strategies made possible by the absence of competition. Medical schemes
have little option but to agree to the following:
15.12.1 Annual tariff and fee increases in excess of general inflation;
15.12.2 Reimbursement mechanisms that accommodate utilization increases;
15.12.3 Reimbursement mechanisms that accommodate the over-supply of
equipment and diagnostic procedures; and
15.12.4 Fees that are structurally higher than the underlying fixed and variable
costs of the hospitals.
Market structure interventions that could improve competition
15.13 Given the central role played by private hospitals today, and the degree of market
consolidation already completed, a number of intervention areas could be
considered:
15.13.1 Government needs to restructure the criteria and approaches used to
allocate private hospital licenses with consideration given to the following:
Conduct requirements included in the license: which prohibit the abuse of the
hospital platform through: the extraction of payments from product
suppliers for them to access the hospital platform; restricting access to
product and medicine suppliers on unfair grounds; restricting hospital
privileges to doctors (GPs or specialists) on unfair grounds; and
regulating18 financial relationships between hospitals and doctors;
Prohibiting the allocation of new licenses to hospital groups with
excessive pre-existing shares of the market;
Requiring a minimum number of independent not-for-profit hospitals
in designated catchment areas based on a minimum medical scheme
population size (for instance 30%); and
Requiring a minimum number of independent hospitals in
combination with not-for-profit independent hospitals in designated
catchment areas based on a minimum medical scheme population size
(for instance 65% of all acute beds).
15.13.2 Centralized negotiation of all fee-for-service tariffs under the supervision
of an independent health care price regulator needs to be considered to
18 Which requires that the regulators themselves are independent of the regulated parties. This is not the case at present in many regulators.
70
remove the market power imbalances that exist in the negotiating of these
fees.
15.13.3 Consideration should be given to the complete separation of markets for
hospital supplies, medicines, and hospital hotel services.
15.13.4 All risk-transfer agreements between medical schemes and hospitals need
to be properly supervised by the Council for Medical Schemes, with all
agreements subject to pre-approval by the regulator (as is presently the
case with reinsurance agreements).
15.13.5 Consideration should be given to the establishment of a minimum of at
least one public sector hospital competitor, required to comply with set
registration criteria, in designated catchment areas based on a minimum
medical scheme population size.
15.13.6 There needs to be proper supervision and control of public sector
specialists operating practices from private hospital platforms. This should
remove some of the abuse of public resources as well as eliminating some
improper billing of medical schemes.
15.13.7 Full disclosure should be required of all financial relationships between
hospitals and specialists. This should go in conjunction with the
prohibition of any relationship that could result in a financial conflict of
interest between the specialist and a hospital or hospital groups.
15.13.8 The prohibition on doctor employment in hospitals needs to be removed.
15.13.9 An explicit prohibition, with appropriate penalties, should be implemented
on any threats, whether direct or indirect, by any hospital or hospital
groups against a medical scheme seeking to: selectively contract with any
closed group of hospitals; selectively contract with any GPs or specialists;
and selectively contract with any supplier of hospital products.
15.13.10 An explicit prohibition, with appropriate penalties, should be applied
where any threats are made, whether direct or indirect, by a hospital group
against any GPs or specialists wishing to selectively contract with any
medical scheme.
Competition concerns falling within the ambit of the Competition Commission
15.14 Significant competition concerns arise that require investigation by the
Competition Commission:
15.14.1 Hospital groups limit the development of selective contracting
arrangements to low-income network arrangements.
15.14.2 The relationship between doctors (GPs and specialists) needs to be
carefully examined, with information collected on:
Shareholding arrangements by doctors in hospitals and their
consequences;
71
Contractual arrangements between hospitals and specialists;
Explicit and implicit requirements placed by hospitals on specialists;
Market power over specialists and the manner in which the allocation
of privileges to access the hospital platform may be used to exert
market power over specialists; and
Quantitative analyses of doctor behavior by hospital group.
15.14.3 Pre- and post-merger analyses could be performed on all hospital mergers
from 2000 using medical schemes claims information from large schemes
and multiple schemes where necessary.
15.14.4 The relationships between hospitals and pathology companies and
practices.
15.14.5 The relationship between hospitals and radiological practices and all
associated equipment and equipment supplies. This should consider the
conduct of both the hospitals and the specialist practices.
15.14.6 The relationship between hospitals and anesthetists.
15.14.7 The medicine and medical product rebate arrangements need to be fully
investigated as these involved collusively negotiated price increases
between hospitals, hospital groups and medicine and medical product
suppliers. The process by which hospitals converted the various resulting
profit streams into facility fee increases should also be fully investigated
with a specific focus on the 2004 and 2009 tariff negotiations.
15.14.8 Possible vertical collusion between hospital groups and medical scheme
intermediaries (managed care companies and administrators) to drive up
hospital charges for schemes.
72
16. MEDICINES
16.1 The market for medicines is complex with a large number of players involved in
manufacturing, distribution, retail sales, and dispensing. Final consumers include
government for state services, medical scheme members, and over-the-counter
sales. These three areas of purchase are quite distinct and can be characterized as:
government procurement, insured purchases, and out-of-pocket purchases.
16.2 Medicines themselves are also highly regulated in ways that affect market structure
and conduct. Medicines require registration to be sold. A process, governed
presently by the Medicines Control Council (MCC), which approves products on
the basis of efficacy, the quality of the production facility, and determines
scheduling.
16.3 Medicines are allocated to specific schedules (see list below) according to the
degree of control required in their use. Schedules 0 to 2 fall into an out-of-pocket
market while schedules 3 to 6 require a doctor’s prescription. Schedules 7 and 8,
which include dangerous substances, are not controlled for medical use and are not
relevant for this discussion.
Schedule 0 = Sold in any shop
Schedule 1 = Sold by pharmacists
Schedule 2 = Sold by pharmacist and sale record
Schedule 3 = Prescription, repeated 6 months
Schedule 4 = Prescription, repeated 6 months
Schedule 5 = Prescription, repeats stipulated
Schedule 6 = Prescription, therapeutic narcotics
Schedule 7 = Controlled substances
Schedule 8 = Strictly controlled substances
(Medicines and Related Substances Control Act, section 22A)
16.4 The mechanism of medicine registration, required to protect the public from
quackery, however limits competition within a national boundary. As registration is
tied to the production facilities designated by the manufacturer, it is not possible
for cheaper versions of the same product sold elsewhere (internationally) to
compete locally. It is therefore possible for medicine manufacturers to price
discriminate between countries.
16.5 The market for medicines is also divided into those products under patent
protection and those that are freely competing. Products under patent often reflect
new technological innovations and may involve better therapeutic outcomes than
existing medication and treatment.
16.6 The degree to which a new medicine improves upon existing treatments
determines the extent to which it needs to compete on price. On the whole
medicines under patent may be regarded as having superior outcomes to existing
73
treatments and are therefore introduced at far higher prices as they lack
competition. When a patent is exhausted rival manufacturers are able to produce
generics with the resulting competition able to bring prices down.
16.7 Patent protection periods have however been increasing from 15 years in the 1980s
to 20 years at present (with a capability often to extend for a further five years).
Countries where medicine development and manufacturing is strategically
important, such as the US, France and the UK, have sought to place pressure on
low- and middle-income countries to accept such patent periods. However, patent
periods can also be extended by registering patents for every conceivable aspect of
a product during the development and marketing phase (box 16.1).
Box 16.1: Total product strategies by pharmaceutical originators
“Pharmaceutical originators practice “total product strategies” or “lifecycle maximization” by seeking to
obtain as many patents as possible during the development and marketing cycle, and to extend them for
new uses of established products, or to add on to the time-lag between patent grant and public health
approval.
Originators erect “picket fences” or families of dozens of patents around a single product covering
numerous aspects of the product such as:
basic composition, including new or alternative compounds;
method of treatment, including new use of known compounds, different
dosing, and therapies in combination with other drugs;
synthetic production;
formulation and drug delivery;
prodrugs releasing active ingredient;
substances resulting from metabolism in body;
different crystalline or hydrated structures;
gene-markers showing response to drug therapy;
even devices such as patches for administering the drug.”
European Generic Medicines Association, http://www.egagenerics.com/gen-
phrmapatents.htm. [Downloaded 6 May 2012]
“Applying for a patent on a new formulation of an already existing medicine is a tactic commonly used
by pharmaceutical companies to retain their patent monopoly after the expiry of their initial 20 year
patent period. This tactic is referred to as ‘ever-greening’. By amending its law, South Africa could
prevent the ever-greening of medicine patents by heightening the standards of patentability to exclude new
forms and formulations of existing medicines from patentability.”
Fix the Patent Period Campaign by the Treatment Action Campaign,
http://www.fixthepatentlaws.org/?p=92. [Downloaded 6 May 2012]
74
16.8 Medicines of any schedule can be prescribed by a doctor, making them central to
marketing initiatives of manufacturers. Medicines that are prescribed are typically
covered by a medical scheme, and involve reduced out-of-pocket expenses.
Consequently, medical scheme beneficiaries often derive financial advantage from
getting medicines prescribed, even with schedules 0 to 2. Marketing medicines
directly to potential patients, prohibited in the past, has little value as patients
typically don’t choose the medicines they use when prescribed. Demand is heavily
dependent on the advice provided by doctors.
16.9 Historically manufacturers have gone to great lengths to get doctors to drive
demand for their products. In many cases financial inducements of one form or
another have been used. As with the rebate mechanism used for private hospitals,
they all come down to kickback arrangements which can take almost any form.
Kickback arrangements are product specific. However, doctors have typically
charged dispensing fees in the form of generalized percentage-based markups on
any medicine they prescribe and dispense from their own medicine stocks.
16.10 Doctors can therefore be rewarded for prescribing specified medicines, regardless
of whether or not they dispense, or through the charging of a dispensing fee. The
former merely requires that proof be provided of the prescription. The latter does
not, and involves the provision of the drug at a discount to a published list price
(referred to historically as the “Blue Book” price). List prices are now electronically
provided to medical scheme administrators and related intermediaries.
16.11 Medical doctors operating through “independent” practitioner associations (IPAs)
have also in some instances implemented formularies (lists of preferred medicines)
which they agree to use as a group. Medicine manufacturers are then required to
pay a kickback to get their medicines included on the formulary.
16.12 Managed care companies, closely tied to administrators (or the administrator itself),
also set up formularies and are in a position to make similar demands on
manufacturers. Administrators and managed care companies with (arguably)
captured medical schemes (see section 10) do not need to be cost-efficient and can
use these kickbacks to supplement their fees.
16.13 Both the kickbacks and dispensing on the basis of a markup undermine the
independence of doctors and provide financial incentives for them to:
Prescribe more expensive medicines where the markup is a percentage of the
list price regardless of cheaper equivalents; and
Prescribe higher volumes of medicines than are needed.
16.14 The effect of the above is to:
Remove price competition for equivalent products; and
Increase the demand for all medicines in excess of need.
16.15 Although not as influential as doctors, pharmacists are also in a position to
influence some demand for medicines. For instance they can: modify prescriptions
to provide cheaper therapeutic equivalents (substitute medicines); and advise
75
consumers on schedules 1 and 2. For higher schedules they can influence choices
by biased stocking through excluding some medicines from the shelves, i.e. limiting
choice at the point of sale.
16.16 Pharmacists’ choices can also be influenced by direct and indirect incentives. For
instance pharmacists have traditionally charged a percentage-based markup on all
prescription-based transactions. However, the markup structure provides no
incentive to modify prescriptions to provide cheaper substitutes, or to remove
unnecessary medication (which can be done by contacting the doctor).
16.17 In recent years, certain medical scheme intermediaries managing the medicine
relationship with pharmacies, which is a form of clearing house function, imposed
charges on pharmacists. Pharmacists unwilling to pay the fees are threatened with
the removal from electronic billing. As pharmacies without an electronic interface
would lose all their medical schemes business (as members want their invoices paid
by the scheme at point of service in the pharmacy) this was a significant threat.
Pharmacists consequently had little option but to pay the fee and pass the charge
on to medical scheme members as an out-of-pocket charge per prescription. In this
way, certain medical schemes, by way of agreement with the intermediary, were
able to pass a scheme's administrative costs onto members as an out-of-pocket
payment charged by pharmacists.
16.18 The imposition of these charges onto pharmacists represents a potential abuse of
market power by medical scheme intermediaries.
16.19 A further dimension involves logistics suppliers. These functions were historically
provided by wholesalers who purchased the medicines from manufacturers and
then supplied them to retailers and service points when ordered. Over the past 15
years manufacturers have developed alternative distribution models, with some
supplying directly to pharmacists, clinicians, and hospitals on the basis of contracts
with logistics service providers. There is some scope for manufacturers to
incentivize logistics service providers to manipulate supplies to undermine the
availability competing medicines.
16.20 A further practice of originator medicine manufacturers is to use public sympathy
to force both governments and health insurers to cover newly developed medicines
entering the market at very high prices. In such instances the legal fees of a patient
able to benefit from the medicine is sponsored by the manufacturer. However,
were schemes and governments to cover all new products at their market-entry
price, regardless of their efficacy, an unaffordable open-ended financial liability
would be created resulting in harm to coverage. Governments and insurers always
need to be able to ration and exercise some constraint to moderate manufacturer
price demands.
16.21 Insurers and governments consequently respond to the pricing strategies arising
from the patent mechanism by limiting coverage until prices are reduced. To
counter this, medicine manufacturers, aside from sponsored litigation, also finance
patient associations that emerge around specific, mostly intractable, medical
conditions. Such groups can serve as a front to a manufacturers marketing
76
campaign. The basic rationale, from the perspective of the manufacturer, is to
force market access to pre-paid (insured or tax funded) coverage at the highest
possible price. If the manufacturer fails, they are confined to the out-of-pocket
market which is far less lucrative (particularly if the prices are high).
16.22 Access to pooled funding (insurance or government) should rationally be
constrained unless new products enter the market at prices bearing some
relationship to existing treatments. South Africa presently has no benchmarking
mechanism able to discipline the market conduct of manufacturers bringing new
medicines onto the market. A similar problem exists generally for new technology
(equipment, pathology, etc.).
16.23 From 2003/04 the Medicines and Related Substances Control Act, together with
associated regulations, implemented a number of measures to mitigate incentives
to over-prescribe and over-price medicines. Although not all of the required
measures have been implemented, market conduct has been significantly
influenced. The measures, which are applied exclusively to the private sector,
include:
16.23.1 A prohibition on the bonusing and discounting of medicines. This
eliminates any price discrimination within the domestic market. Its
purpose is to remove the indirect kickback mechanisms used to influence
the decisions of doctors, hospitals, and pharmacists.
16.23.2 The establishment of the transparent single-exit pricing (SEP) mechanism
whereby medicines: can have only one ex-manufacturer price; must
publish their prices publicly; can decrease prices freely; and cannot
increase prices beyond the price set at the initiation of the SEP and in
accordance with a general increase announced each year by the Minister of
Health.
16.23.3 The regulation of markups for dispensing doctors which: caps the amount;
minimizes the relationship between medicine cost and the fee (through
subjecting percentage-based markups to a Rand cap); and regulates the
annual change in the value of the Rand ceilings. No other administrative
fee of any kind can be charged by the doctor in respect of dispensing.
16.23.4 The regulation of dispensing fees for pharmacists which, as with
dispensing doctors: caps the amount; subjects percentage-based fees to a
Rand cap; and regulates the annual change in the ceilings.
16.23.5 Mandatory generic dispensing, whereby pharmacists are compelled to
recommend a lower-priced generic where a doctor’s prescription indicates
otherwise.
16.24 Not yet implemented, but considered part of required framework for regulating
medicine prices:
16.24.1 The outlawing of dispensing doctors, which has not occurred due to the
failure of the Department of Health to manage a system of dispensing
licenses and extensive lobbying.
77
16.24.2 The implementation of a regulatory framework for setting logistics fees,
which are presently incorporated into the SEP.
16.24.3 International benchmarking, which would require that manufacturers set
their SEP at the value of the same medicine in the lowest priced setting
within a pre-determined basket of benchmark countries. This reform has
been in the pipeline since 2006 but has faced stiff lobbies to hold it back.
If implemented it would reduce originator medicine costs by around
25%.19
16.24.4 The practice of registering multiple medicines at different dosages and
delivery mechanisms to price discriminate (by circumventing the SEP
framework) has not been effectively achieved.
16.24.5 No mechanism exists to vet the value-for-money of new medicines
entering the market for the first time. Such a mechanism would need to
serve as a guide to coverage decisions of medical schemes. It should also
be used to determine which medicines are included as prescribed
minimum benefits or covered by government.
Market structure interventions that could improve competition
16.25 Medicines operate within a market structure that is already distorted both through
regulatory requirements to protect patients from abuse, and through collective
purchasing arrangements (government and medical schemes). Pro-market
outcomes are consequently dependent on the configuration of rules that best
respond to underlying and unavoidable “distortions”. In principle they need to:
16.25.1 Eliminate abuse by agents responsible for advising on the use of medicines
which takes the form of:
Kickbacks required or offered from manufacturers (to individual
practitioners (particularly dispensing doctors), IPAs, and pharmacists);
Markups on medicines; and
Generally, any instance where a medical practitioner can benefit
financially from a product they prescribe and/or dispense (e.g. vertical
ownership arrangements).
16.25.2 Eliminate the abuse by hospitals, which are able to use their position in the
market to require kickbacks for products to be utilized through their
platform.
16.25.3 Prevent medical scheme administrators and associated intermediaries
(managed care companies and clearing house arrangements20) from
19 Based on discussions with senior members of the national DOH.
20 Also referred to as "pharmaceutical benefit management" companies or PBMs.
78
combining with hospitals, doctors, and pharmacists to obtain the same
kickbacks as the providers.
16.25.4 Remove international price discrimination resulting from the registration
process, and forcing medicine manufacturers to compete globally.
16.25.5 Eliminate the manipulation of medicine supply for the purpose of
preventing price competition through logistics services.
16.25.6 Ensure that patent rights are not abused.
16.25.7 Ensure that medicines outside their patent period are subject to full and
free competition.
Competition concerns falling within the ambit of the Competition Commission
16.26 Aspects of the market that involve competition concerns and require investigation
by the Competition Commission include:
16.26.1 The relationship between domestically located manufacturers, which are
subsidiaries of large multinational companies, needs to be investigated for
a form of retail price maintenance. Floor prices are determined for
domestic manufacturers internationally which are unlikely to bear any
relationship to their true cost. Transfer pricing is also very likely in
achieving the same effect where product ingredients are important from a
parent company.
16.26.2 All instances where there is vertical collusion between pharmaceutical
manufacturers and any other part of the supply chain (typically involving
some form of profit share arrangement or kick-back) designed to increase
prices:
Manufacturers and logistics service providers;
Manufacturers and pharmacists;
Manufacturers and doctors (GPs and specialists); and
Manufacturers and hospital groups (relates to the rebate systems and
related kick-back arrangements).
16.26.3 The apparent conduct of certain medicine-related intermediaries in
colluding with certain some administrators to require payments from
pharmacists to receive their electronic intermediation (ultimately passed on
as out-of-pocket charges to medical scheme members).
79
17. MEDICAL PRODUCTS (MEDICAL CONSUMABLES AND DEVICES)
17.1 Medical consumables and devices include products used by hospitals, such as
surgical consumables, and equipment of various forms used primarily, but not
exclusively, in hospital-based settings. Hospitals play the most important role for
these products which are paid for either through the general hospital tariffs or
purchased on an itemized basis using an ex-manufacturer (list) price.
17.2 Where a product is included in a tariff, such as a ward fee (which is charged on a
per diem21 basis) or theatre charge (which is charged by the minute), medical
schemes effectively pay a bundled fee for a hospital service. Items included in the
bundled fee are referred to as “non-chargeable” as they are not charged for
separately. Consumables and devices charged for separately are ordered by the
hospital, but paid for by the medical scheme as they are used.
17.3 Where a product is reimbursed through some bundled charge, such as a per-diem,
the hospital has an incentive to minimize the supplier cost of the item. However,
there is no incentive to pass efficiencies on to the medical scheme or patient.
17.4 Where the item is separately paid for, however, the hospital has no incentive to
minimize the cost. However, they do have an incentive to set up a kick-back
mechanism where product suppliers effectively have to pay to access the hospital
platform. During most of the 2000s (beginning around 1999) to the present private
hospital groups have operated such arrangements, identical to arrangements for
medicines, with the cost of the kick-back effectively passed on to medical scheme
members. Although some of these kickbacks were converted into facility-based
tariffs from 2008, the practice is not policed and may be continuing (see section
15).
Market structure interventions that could improve competition
17.5 Optimizing the markets for medical consumables and devices largely involve
bringing the final purchasers and the product suppliers together to negotiate what
ends up on the hospital platform. The hospitals, and more especially the hospital
groups, are the primary source of inefficiency in this market. They have no interest
in making or passing on efficiencies. Solutions (tentative) involve:
17.5.1 Central negotiations between schemes and product suppliers on a no-
balance billing price;
17.5.2 The implementation of the framework similar to the SEP mechanism used
for medicines;
17.5.3 A prohibition on hospitals making any profit margin on medical products;
and
21 Bundled fee charged on a daily basis.
80
17.5.4 A prohibition on hospitals restricting products from their platforms based
on kick-backs (also discussed in section 15).
Competition concerns falling within the ambit of the Competition Commission
17.6 Competition concerns that could benefit from an investigation by the Competition
Commission include:
17.6.1 Vertical collusion between product suppliers and:
Hospitals and hospital groups;
Doctor groups; and
Medical scheme intermediaries (managed care companies and
administrators).
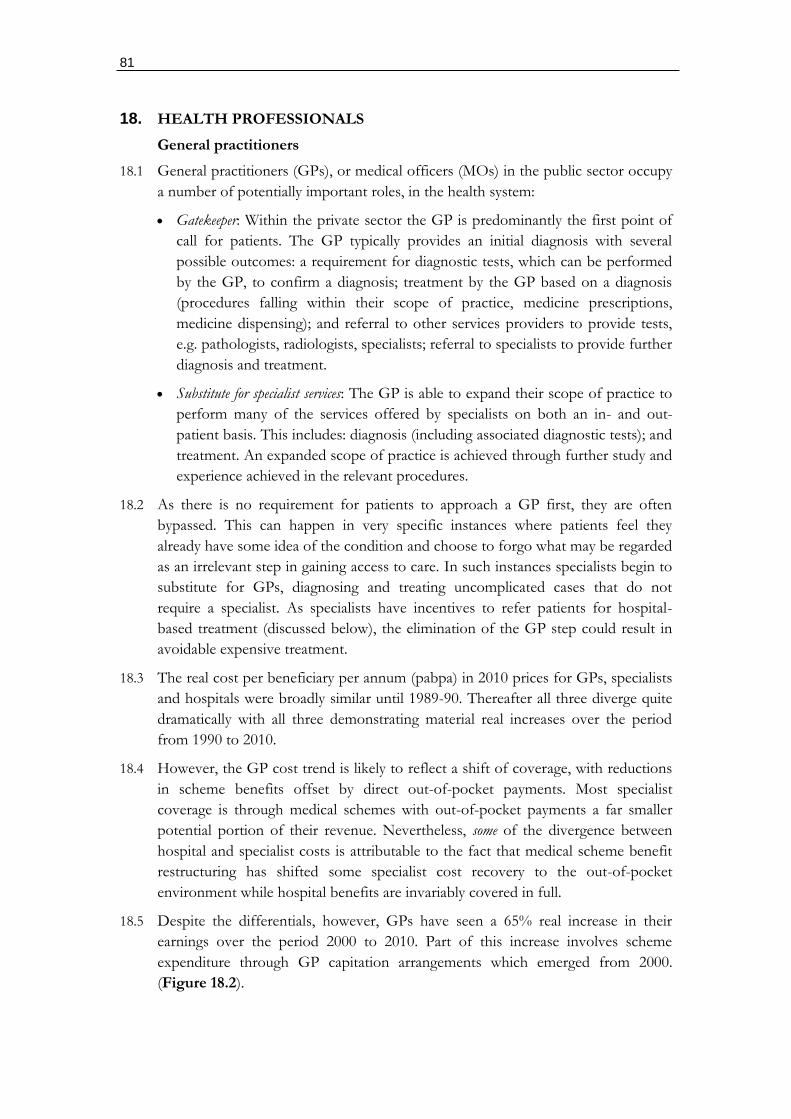
81
18. HEALTH PROFESSIONALS
General practitioners
18.1 General practitioners (GPs), or medical officers (MOs) in the public sector occupy
a number of potentially important roles, in the health system:
Gatekeeper: Within the private sector the GP is predominantly the first point of
call for patients. The GP typically provides an initial diagnosis with several
possible outcomes: a requirement for diagnostic tests, which can be performed
by the GP, to confirm a diagnosis; treatment by the GP based on a diagnosis
(procedures falling within their scope of practice, medicine prescriptions,
medicine dispensing); and referral to other services providers to provide tests,
e.g. pathologists, radiologists, specialists; referral to specialists to provide further
diagnosis and treatment.
Substitute for specialist services: The GP is able to expand their scope of practice to
perform many of the services offered by specialists on both an in- and out-
patient basis. This includes: diagnosis (including associated diagnostic tests); and
treatment. An expanded scope of practice is achieved through further study and
experience achieved in the relevant procedures.
18.2 As there is no requirement for patients to approach a GP first, they are often
bypassed. This can happen in very specific instances where patients feel they
already have some idea of the condition and choose to forgo what may be regarded
as an irrelevant step in gaining access to care. In such instances specialists begin to
substitute for GPs, diagnosing and treating uncomplicated cases that do not
require a specialist. As specialists have incentives to refer patients for hospital-
based treatment (discussed below), the elimination of the GP step could result in
avoidable expensive treatment.
18.3 The real cost per beneficiary per annum (pabpa) in 2010 prices for GPs, specialists
and hospitals were broadly similar until 1989-90. Thereafter all three diverge quite
dramatically with all three demonstrating material real increases over the period
from 1990 to 2010.
18.4 However, the GP cost trend is likely to reflect a shift of coverage, with reductions
in scheme benefits offset by direct out-of-pocket payments. Most specialist
coverage is through medical schemes with out-of-pocket payments a far smaller
potential portion of their revenue. Nevertheless, some of the divergence between
hospital and specialist costs is attributable to the fact that medical scheme benefit
restructuring has shifted some specialist cost recovery to the out-of-pocket
environment while hospital benefits are invariably covered in full.
18.5 Despite the differentials, however, GPs have seen a 65% real increase in their
earnings over the period 2000 to 2010. Part of this increase involves scheme
expenditure through GP capitation arrangements which emerged from 2000.
(Figure 18.2).
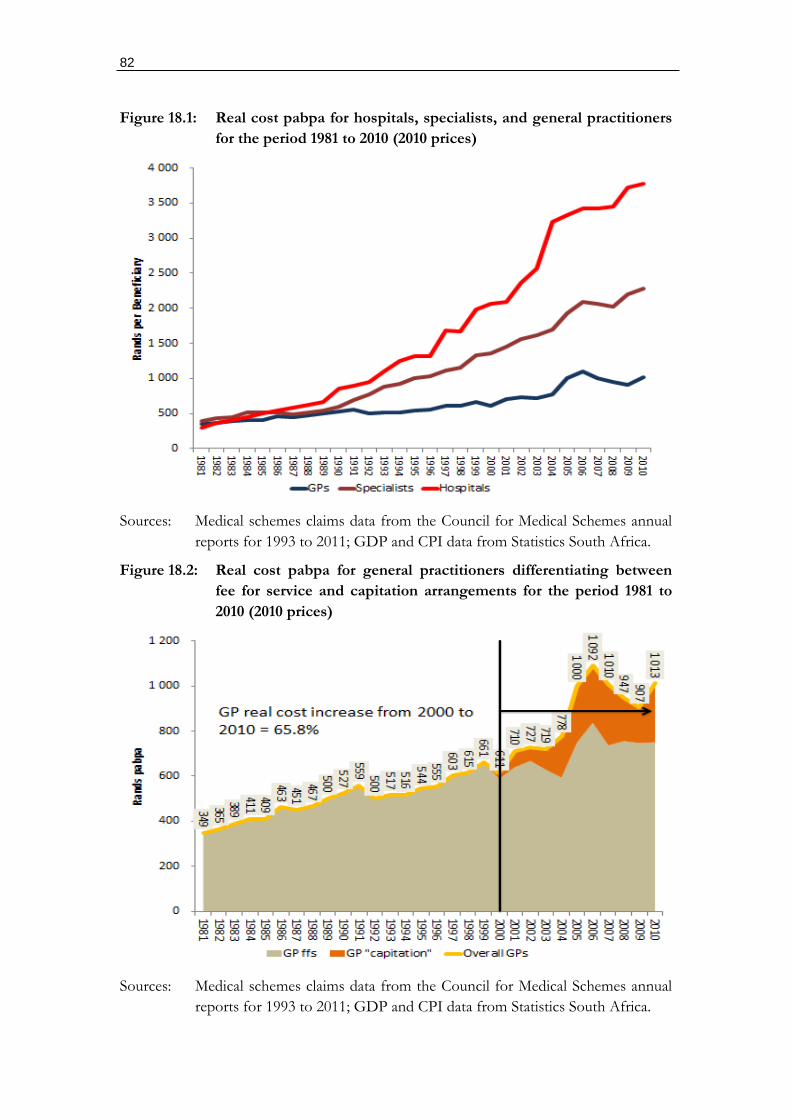
82
Figure 18.1: Real cost pabpa for hospitals, specialists, and general practitioners
for the period 1981 to 2010 (2010 prices)
Sources: Medical schemes claims data from the Council for Medical Schemes annual
reports for 1993 to 2011; GDP and CPI data from Statistics South Africa.
Figure 18.2: Real cost pabpa for general practitioners differentiating between
fee for service and capitation arrangements for the period 1981 to
2010 (2010 prices)
Sources: Medical schemes claims data from the Council for Medical Schemes annual
reports for 1993 to 2011; GDP and CPI data from Statistics South Africa.
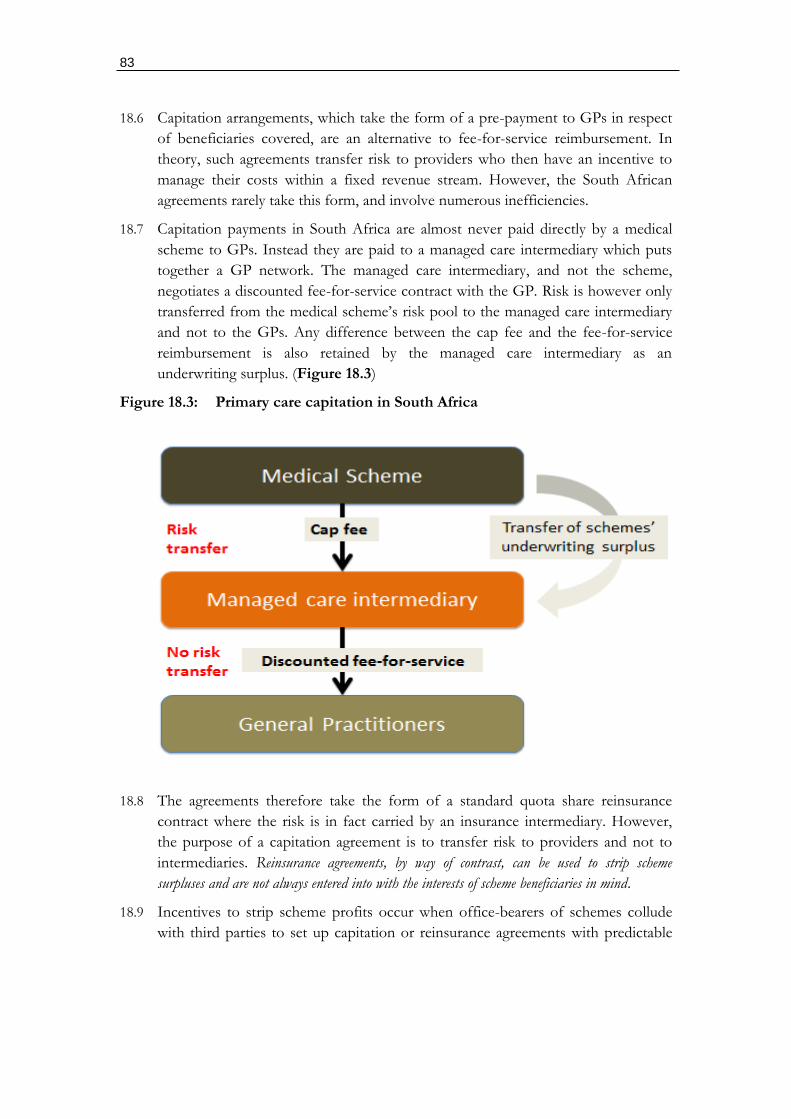
83
18.6 Capitation arrangements, which take the form of a pre-payment to GPs in respect
of beneficiaries covered, are an alternative to fee-for-service reimbursement. In
theory, such agreements transfer risk to providers who then have an incentive to
manage their costs within a fixed revenue stream. However, the South African
agreements rarely take this form, and involve numerous inefficiencies.
18.7 Capitation payments in South Africa are almost never paid directly by a medical
scheme to GPs. Instead they are paid to a managed care intermediary which puts
together a GP network. The managed care intermediary, and not the scheme,
negotiates a discounted fee-for-service contract with the GP. Risk is however only
transferred from the medical scheme’s risk pool to the managed care intermediary
and not to the GPs. Any difference between the cap fee and the fee-for-service
reimbursement is also retained by the managed care intermediary as an
underwriting surplus. (Figure 18.3)
Figure 18.3: Primary care capitation in South Africa
18.8 The agreements therefore take the form of a standard quota share reinsurance
contract where the risk is in fact carried by an insurance intermediary. However,
the purpose of a capitation agreement is to transfer risk to providers and not to
intermediaries. Reinsurance agreements, by way of contrast, can be used to strip scheme
surpluses and are not always entered into with the interests of scheme beneficiaries in mind.
18.9 Incentives to strip scheme profits occur when office-bearers of schemes collude
with third parties to set up capitation or reinsurance agreements with predictable
84
profit margins built in. In some cases the role of the managed care intermediary is
taken on by the medical scheme’s own administrator.
18.10 Reinsurance agreements were strictly regulated from 2004.22 Since 2004 there has
therefore been some attempts by schemes to use capitation and other risk-transfer
agreements to replace the more regulated reinsurance contracts. The notable
increase in primary care capitation agreements from 2004 suggests that these
contracts are not necessarily entered into to manage scheme costs.
18.11 Summary of issues:
18.11.1 The role of the GP as the gatekeeper has deteriorated with patients
bypassing and going directly to specialists. As specialists both charge more
and have incentives to direct patients into hospital, costs are not managed
effectively. GPs are in fact capable of doing much of what specialists
presently take on.
18.11.2 Costs associated with GPs have not declined, and have risen substantially
in real terms since 2000 (65.8%). Despite this, many costs have been
shifted into the out-of-pocket market disguising the true increases
imposed on members. This has been exacerbated by potentially illegal gap
cover insurance which validates this market conduct by insuring the
dramatic fee hikes.
18.11.3 Capitation agreements, which should be used to change the incentives of
GPs are potentially only being used to strip scheme surpluses as risk is
only transferred to an intermediary. The potential for improper
relationships between scheme office bearers and intermediaries is high and
probable.
Specialists
18.12 The proximity to hospital services makes specialists unique in the private health
system. Although technically independent of hospitals a strong alignment of
financial incentives exist which compromise their impartiality when recommending
further diagnostic investigations and treatment (see section 15).
18.13 Historically private hospitals were set up by specialists who consequently benefited
both from charges as specialists and profits from hospitals. This model has varied
to some degree with the emergence of corporate hospital groups. However, these
corporate arrangements maintain strong links to specialists through joint hospital
shareholding and equity holdings in companies that own the hospitals. In addition
hospitals provide discounted rooms, practice management support, overseas trips,
etc.
22 In terms of amendments to section 20 of the Medical Schemes Act No.131 of 1998. The amendments required supervision by the Council for Medical Schemes in approving reinsurance agreements.
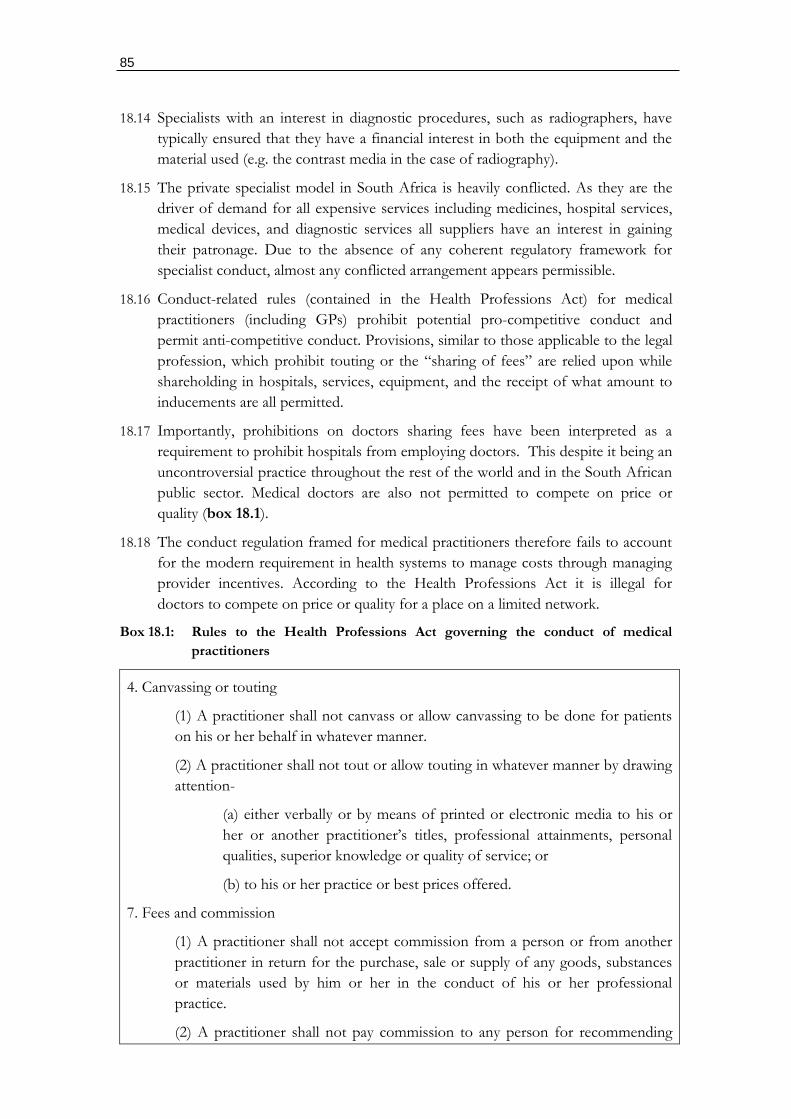
85
18.14 Specialists with an interest in diagnostic procedures, such as radiographers, have
typically ensured that they have a financial interest in both the equipment and the
material used (e.g. the contrast media in the case of radiography).
18.15 The private specialist model in South Africa is heavily conflicted. As they are the
driver of demand for all expensive services including medicines, hospital services,
medical devices, and diagnostic services all suppliers have an interest in gaining
their patronage. Due to the absence of any coherent regulatory framework for
specialist conduct, almost any conflicted arrangement appears permissible.
18.16 Conduct-related rules (contained in the Health Professions Act) for medical
practitioners (including GPs) prohibit potential pro-competitive conduct and
permit anti-competitive conduct. Provisions, similar to those applicable to the legal
profession, which prohibit touting or the “sharing of fees” are relied upon while
shareholding in hospitals, services, equipment, and the receipt of what amount to
inducements are all permitted.
18.17 Importantly, prohibitions on doctors sharing fees have been interpreted as a
requirement to prohibit hospitals from employing doctors. This despite it being an
uncontroversial practice throughout the rest of the world and in the South African
public sector. Medical doctors are also not permitted to compete on price or
quality (box 18.1).
18.18 The conduct regulation framed for medical practitioners therefore fails to account
for the modern requirement in health systems to manage costs through managing
provider incentives. According to the Health Professions Act it is illegal for
doctors to compete on price or quality for a place on a limited network.
Box 18.1: Rules to the Health Professions Act governing the conduct of medical
practitioners
4. Canvassing or touting
(1) A practitioner shall not canvass or allow canvassing to be done for patients
on his or her behalf in whatever manner.
(2) A practitioner shall not tout or allow touting in whatever manner by drawing
attention-
(a) either verbally or by means of printed or electronic media to his or
her or another practitioner’s titles, professional attainments, personal
qualities, superior knowledge or quality of service; or
(b) to his or her practice or best prices offered.
7. Fees and commission
(1) A practitioner shall not accept commission from a person or from another
practitioner in return for the purchase, sale or supply of any goods, substances
or materials used by him or her in the conduct of his or her professional
practice.
(2) A practitioner shall not pay commission to any person for recommending
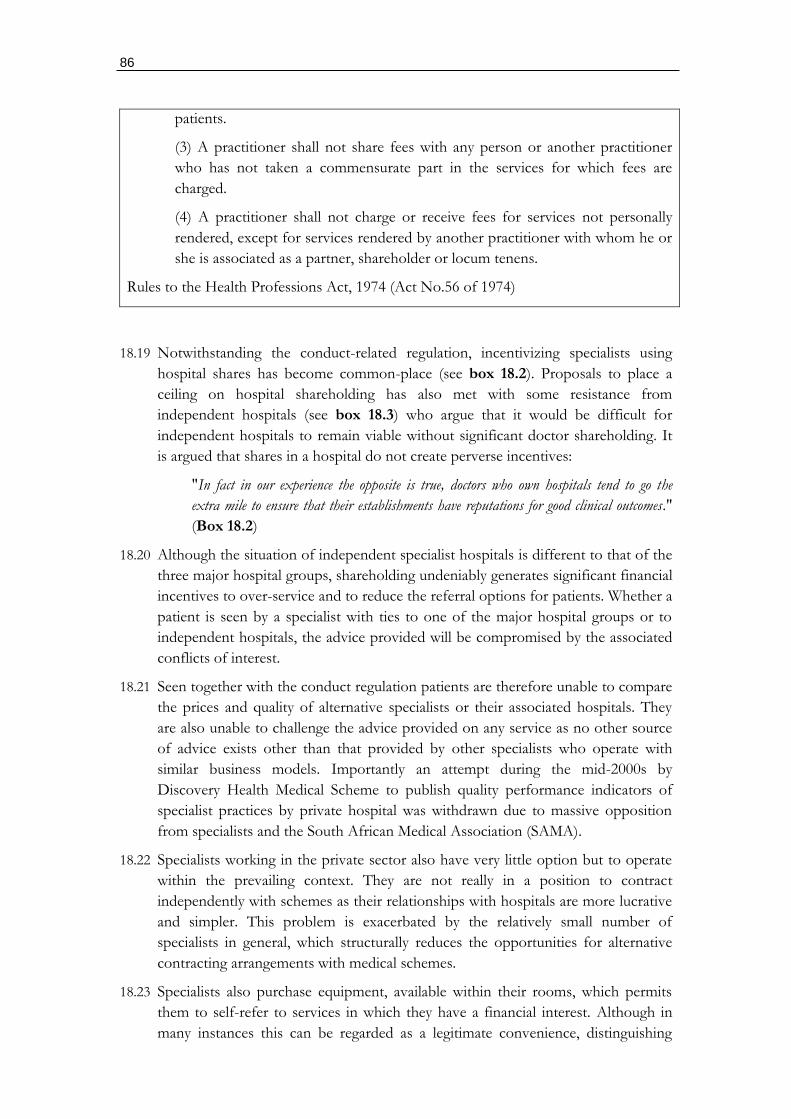
86
patients.
(3) A practitioner shall not share fees with any person or another practitioner
who has not taken a commensurate part in the services for which fees are
charged.
(4) A practitioner shall not charge or receive fees for services not personally
rendered, except for services rendered by another practitioner with whom he or
she is associated as a partner, shareholder or locum tenens.
Rules to the Health Professions Act, 1974 (Act No.56 of 1974)
18.19 Notwithstanding the conduct-related regulation, incentivizing specialists using
hospital shares has become common-place (see box 18.2). Proposals to place a
ceiling on hospital shareholding has also met with some resistance from
independent hospitals (see box 18.3) who argue that it would be difficult for
independent hospitals to remain viable without significant doctor shareholding. It
is argued that shares in a hospital do not create perverse incentives:
"In fact in our experience the opposite is true, doctors who own hospitals tend to go the
extra mile to ensure that their establishments have reputations for good clinical outcomes."
(Box 18.2)
18.20 Although the situation of independent specialist hospitals is different to that of the
three major hospital groups, shareholding undeniably generates significant financial
incentives to over-service and to reduce the referral options for patients. Whether a
patient is seen by a specialist with ties to one of the major hospital groups or to
independent hospitals, the advice provided will be compromised by the associated
conflicts of interest.
18.21 Seen together with the conduct regulation patients are therefore unable to compare
the prices and quality of alternative specialists or their associated hospitals. They
are also unable to challenge the advice provided on any service as no other source
of advice exists other than that provided by other specialists who operate with
similar business models. Importantly an attempt during the mid-2000s by
Discovery Health Medical Scheme to publish quality performance indicators of
specialist practices by private hospital was withdrawn due to massive opposition
from specialists and the South African Medical Association (SAMA).
18.22 Specialists working in the private sector also have very little option but to operate
within the prevailing context. They are not really in a position to contract
independently with schemes as their relationships with hospitals are more lucrative
and simpler. This problem is exacerbated by the relatively small number of
specialists in general, which structurally reduces the opportunities for alternative
contracting arrangements with medical schemes.
18.23 Specialists also purchase equipment, available within their rooms, which permits
them to self-refer to services in which they have a financial interest. Although in
many instances this can be regarded as a legitimate convenience, distinguishing
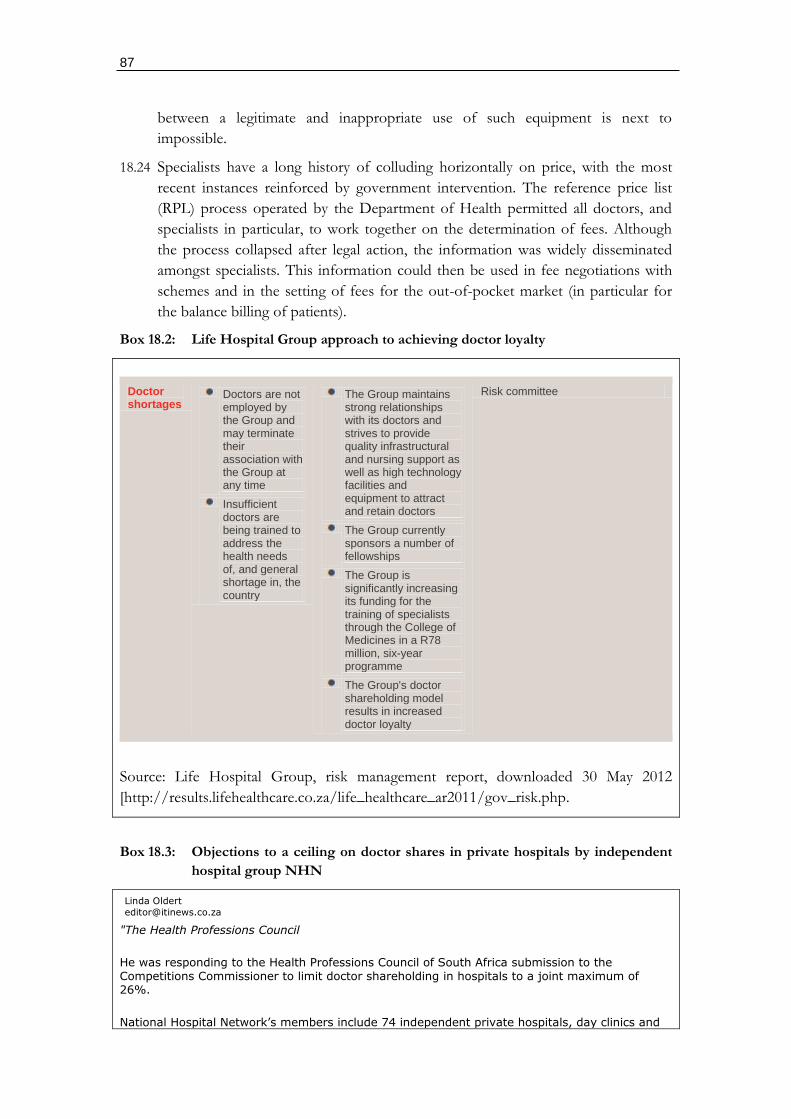
87
between a legitimate and inappropriate use of such equipment is next to
impossible.
18.24 Specialists have a long history of colluding horizontally on price, with the most
recent instances reinforced by government intervention. The reference price list
(RPL) process operated by the Department of Health permitted all doctors, and
specialists in particular, to work together on the determination of fees. Although
the process collapsed after legal action, the information was widely disseminated
amongst specialists. This information could then be used in fee negotiations with
schemes and in the setting of fees for the out-of-pocket market (in particular for
the balance billing of patients).
Box 18.2: Life Hospital Group approach to achieving doctor loyalty
Doctor shortages
Doctors are not employed by the Group and may terminate their association with the Group at any time
Insufficient doctors are being trained to address the health needs of, and general shortage in, the country
The Group maintains strong relationships with its doctors and strives to provide quality infrastructural and nursing support as well as high technology facilities and equipment to attract and retain doctors
The Group currently sponsors a number of fellowships
The Group is significantly increasing its funding for the training of specialists through the College of Medicines in a R78 million, six-year programme
The Group's doctor shareholding model results in increased doctor loyalty
Risk committee
Source: Life Hospital Group, risk management report, downloaded 30 May 2012
[http://results.lifehealthcare.co.za/life_healthcare_ar2011/gov_risk.php.
Box 18.3: Objections to a ceiling on doctor shares in private hospitals by independent
hospital group NHN
Linda Oldert
"The Health Professions Council
He was responding to the Health Professions Council of South Africa submission to the Competitions Commissioner to limit doctor shareholding in hospitals to a joint maximum of 26%.
National Hospital Network’s members include 74 independent private hospitals, day clinics and
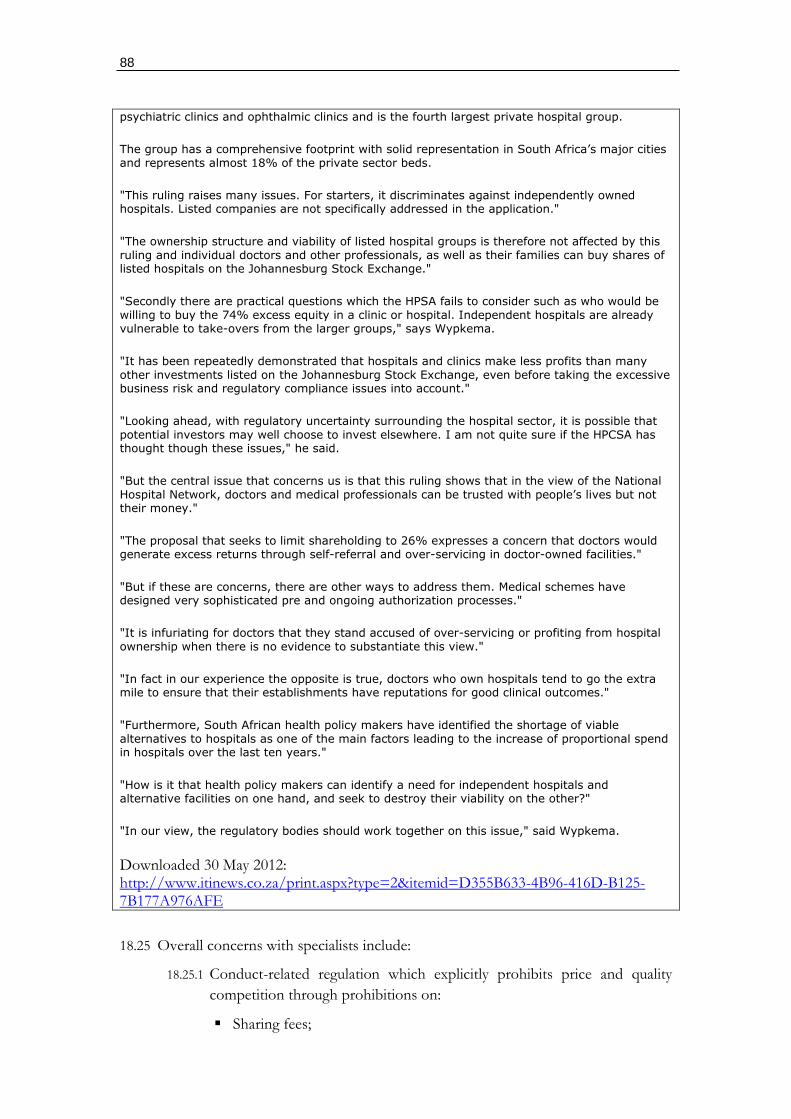
88
psychiatric clinics and ophthalmic clinics and is the fourth largest private hospital group.
The group has a comprehensive footprint with solid representation in South Africa’s major cities and represents almost 18% of the private sector beds.
"This ruling raises many issues. For starters, it discriminates against independently owned hospitals. Listed companies are not specifically addressed in the application."
"The ownership structure and viability of listed hospital groups is therefore not affected by this ruling and individual doctors and other professionals, as well as their families can buy shares of listed hospitals on the Johannesburg Stock Exchange."
"Secondly there are practical questions which the HPSA fails to consider such as who would be willing to buy the 74% excess equity in a clinic or hospital. Independent hospitals are already vulnerable to take-overs from the larger groups," says Wypkema.
"It has been repeatedly demonstrated that hospitals and clinics make less profits than many other investments listed on the Johannesburg Stock Exchange, even before taking the excessive business risk and regulatory compliance issues into account."
"Looking ahead, with regulatory uncertainty surrounding the hospital sector, it is possible that potential investors may well choose to invest elsewhere. I am not quite sure if the HPCSA has thought though these issues," he said.
"But the central issue that concerns us is that this ruling shows that in the view of the National Hospital Network, doctors and medical professionals can be trusted with people’s lives but not their money."
"The proposal that seeks to limit shareholding to 26% expresses a concern that doctors would generate excess returns through self-referral and over-servicing in doctor-owned facilities."
"But if these are concerns, there are other ways to address them. Medical schemes have designed very sophisticated pre and ongoing authorization processes."
"It is infuriating for doctors that they stand accused of over-servicing or profiting from hospital ownership when there is no evidence to substantiate this view."
"In fact in our experience the opposite is true, doctors who own hospitals tend to go the extra mile to ensure that their establishments have reputations for good clinical outcomes."
"Furthermore, South African health policy makers have identified the shortage of viable alternatives to hospitals as one of the main factors leading to the increase of proportional spend in hospitals over the last ten years."
"How is it that health policy makers can identify a need for independent hospitals and alternative facilities on one hand, and seek to destroy their viability on the other?"
"In our view, the regulatory bodies should work together on this issue," said Wypkema.
Downloaded 30 May 2012: http://www.itinews.co.za/print.aspx?type=2&itemid=D355B633-4B96-416D-B125-7B177A976AFE
18.25 Overall concerns with specialists include:
18.25.1 Conduct-related regulation which explicitly prohibits price and quality
competition through prohibitions on:
Sharing fees;
89
Price competition;
Quality competition;
The production of information on price and quality; and
The employment of doctors by hospitals (which is how the Health
Professions Council interprets the prohibition on fees).
18.25.2 The lack of transparency which prevents patients from making informed
choices regarding both price and quality.
18.25.3 Conflicts of interest between specialists and hospitals which:
Encourage the provision of conflicted advice;
Encourage excessive hospital admissions;
Encourage excessive utilization of hospital services;
Encourage over-investment by hospitals in new technology at high
prices;
Encourage cost-inefficient utilization of diagnostic services,
procedures and equipment;
Discourage the production of information on the value-add of
services, including health outcomes; and
Discourage alternative contracting options to fee-for-service.
18.25.4 The structurally reduced opportunities for alternatives to fee-for-service
contracting are also potentially related to:
The small overall number of specialists; and
The high concentration of hospital groups.
Market structure interventions that could improve competition
18.26 The gatekeeper role of the GP could be assured through a statutory requirement
that medical schemes cannot reimburse any medical expense of a patient where
they’ve bypassed the GP.
18.27 Capitation agreements need to be regulated in the same way as reinsurance
agreements with a number of specific requirements:
Independent review of contracts;
Approval of contracts by the Registrar of Medical Schemes;
Capitation payments prohibited to a managed care intermediary, with the
intermediary only able to earn an administration fee while claims are reimbursed
directly to the GP; and
Capitation payments permissible to GP practices in terms of a contract lodged
with the regulator and transparent reporting.
18.28 Potential opportunities to address deficiencies in the specialist market include:
90
18.28.1 Implementing a prohibition on any profit-sharing financial relationship
between specialists and:
Medical products;
Medicines;
Diagnostic services (apart from pathologists who should only be used
on referral);
Equipment (where it is clearly inappropriate);
Medical supplies (as in the case of contrast media used in radiological
services such as MRIs); and
Hospital services.
18.28.2 Where profit-sharing arrangements are unavoidable, an effective system of
disclosure is required which informs both regulators and patients of
conflicted arrangements.
18.28.3 Implementing reporting requirements for the purposes of quality
assurance (noting that the Medical Schemes Act already requires the
provision of diagnostic information with every invoice), which should be
publicly available.
18.28.4 Requiring the open publication of competing prices by specialists.
18.28.5 Enforcing the prohibition of horizontal collusion by specialists.
18.28.6 Implementing a centralized compulsory and regulated negotiation
platform for all fees charged on a fee-for-service basis.
18.28.7 A prohibition on scheme reimbursement for any patient seen by a
specialist not legitimately referred by a GP (which would create demand
uncertainty for specialists).
18.28.8 A requirement for full disclosure by specialists to an appropriate regulator
(not the Health Professions Council) of all contractual arrangements with
private hospitals and related facilities.
Competition concerns with doctors GPs and specialists
18.29 Specific competition concerns that could benefit from investigation by the
Competition Commission include:
18.29.1 Horizontal collusion in the determination of fees since 2003. Despite the
rulings by the competition authorities regarding horizontal price collusion
in 2003, collusion has persisted in various forms. These include:
Price communication on all aspects of price across specialist disciplines
(includes billing rules, codes, relative values used in the construction of
fees, rand conversions, and annual scheme negotiations);
Price negotiations with individual medical schemes involving all
specialists in an association;
91
Price communications in maintaining SAMA tariff schedules; and
Price communications when discussing the reference price list (RPL)
with the Department of Health;
18.29.2 Horizontal collusion amongst GPs (in the form of independent
practitioner associations) to demand kickbacks from medicine
manufacturers before letting their medicines form part of their
formularies. These arrangements actually take the form of horizontal and
vertical collusion to drive up medicine prices.
18.29.3 Vertical collusion between IPAs and medical scheme intermediaries
(managed care companies and administrators) to drive up prices charged
to schemes using “capitation” agreements. In some cases the IPA is the
intermediary.

92
PART D
FINDINGS AND RECOMMENDATIONS
93
19. FINDINGS ON GENERAL COMPETITION
Overview
19.1 This section provides strategic findings on the major competition issues facing the
private health system together with indicative remedies. This serves as a backdrop to
the illustrative review recommendations provided in section 20. The indicative
remedies provide some idea of how certain competition problems could be
addressed through regulatory interventions and should aid the development of an
approach to the market review and the determination of the terms of reference.
Strategic approach
19.2 Although medical scheme contribution costs are not rising significantly, certain
healthcare provider costs are. Their increases appear systemic, structural and not
always susceptible to piecemeal interventions (although these should nevertheless
be pursued where appropriate).
19.3 The private health system in South Africa is considerable in size and complexity,
but nevertheless sustainable and functional. Concerns primarily involve improved
risk-pooling, benefit prioritization, and cost. This report suggests that the private
health system is best evaluated through consideration of the roles played by the
various actors along the following lines (figure 9.1):
19.3.1 Consumers: divided into medical scheme members and patients;
19.3.2 Agents: distinguishing between those advising on medical scheme coverage
and those advising on health care services;
19.3.3 Intermediate product providers: which primarily focuses on medical scheme
administrators and managed care intermediaries that provide support to
medical schemes; and
19.3.4 Final product providers: including those providing medical scheme benefits
and health care services.
19.4 This strategic approach is consistent with the review in section 5 where the
context within which provider competition occurs, referred to as purchaser-driven
health care, is emphasized. This approach seeks to address the weaknesses of
patient-driven health care which is susceptible to market failure resulting from
information asymmetries.
Consumers
19.5 Market complexity undermines the normal decision-making by consumers both in
relation to:
19.5.1 Health insurance: where choosing medical scheme coverage is complicated
by an applicant’s ability to understand ex ante the quality of the coverage
they’re purchasing and the quality of the services they’re gaining access to.
19.5.2 Health care: where patients are generally unable to discern ex ante or even ex
post what they’ve purchased as health services and the difference it made to
health status.
94
19.6 This market complexity inevitably gives rise to agency roles performed by
commercial actors.
Agents
19.7 The following commercial participants are discernible in the private health market:
19.7.1 Brokers, who are meant to advise applicants on the best options for
obtaining access to medical schemes;
19.7.2 Medical schemes, who are in a position to contract with healthcare providers
to ensure both cost-efficiency and service quality; and
19.7.3 Medical doctors, in the form of GPs and specialists who provide all the
critical advice on accessing health services and products.
19.8 For an agent to fulfill their role effectively they need to be free of any conflicts of
interest in the advice provided. However, all the role-players acting as agents are materially
conflicted:
19.8.1 Brokers: no distinction is made between marketing and advice with
consumers unable to determine or influence market conduct in this
respect. Brokers are reimbursed by product providers and also receive
inducements to drive membership growth for open schemes.
19.8.2 Medical schemes: although beginning to act as agents in contracting for care,
have to date played a minimal role in dealing effectively with cost-
efficiency and quality. This is most likely a consequence of the strong
influence of medical scheme administrators in driving decisions within
schemes rather than the schemes themselves. Administrators potentially
have reduced incentives to enter into complicated agreements with
providers, as this could impact on their profit margins.
19.8.3 General practitioners: are vulnerable to influence by product suppliers
(mainly medicines but also hospital services) through incentive schemes.
However, the proper role as agent, that of the gatekeeper for all referrals,
has been undermined substantially through patients bypassing GPs with
the permission of their schemes.
19.8.4 Specialists: are actively pursued by hospitals and hospital groups due to their
pivotal role in driving the demand for all hospital-based services.
Inducements of various forms exist with the implicit quid-pro-quo that inter-
alia hospital admissions will be forthcoming. Inducements include hospital
shareholding, generous privileges, subsidized rental of rooms, and the
provision of equipment.
19.9 The fact that all the agents operating in the private health system are materially
conflicted suggests the following likely consequences, all of which are detectable in
the market:
19.9.1 Brokers do not properly advise medical scheme applicants on the true
qualities of alternative medical schemes, reducing the need for schemes to
respond to informed purchasers. Furthermore, those schemes able to pay
95
the largest financial inducement to a brokers will get more members
without needing to demonstrate the value-for-money of the their benefits
and service quality.
19.9.2 As medical schemes do not need to compete on the cost or quality of their
coverage or the quality of the healthcare services funded, the potential role
of the scheme as an agent in dealing with health care providers is
compromised. This is very evident in the case if potentially illegal gap
cover insurance arrangements which drive up provider costs.
19.9.3 The absence of a GP gatekeeper increases the market-related importance
of specialists, particularly in relation to expensive technology and hospital
services. The financial reward structure for the dispensing of medicines
however potentially compromises the independence of GPs as does the
existence of possible inducements offered by pharmaceutical
manufacturers.
19.9.4 Specialists are potentially driving the increased demand for hospital
services and any technology they choose to invest in. The cost increases
applicable both to professional fees and hospital services are most
plausibly driven by the compromised financial incentives of specialists.
19.10 Strategic interventions could focus on removing conflicts of interest related to the
agents in the system such as:
19.10.1 The removal of commission-based funding of brokers and its replacement
by fee-based remuneration by members and employers;
19.10.2 The strict separation of brokers into those providing advice and those
selling (marketing) products for medical schemes;
19.10.3 The deepening of medical scheme governance provisions to locate the
commercial imperative driving scheme decisions within the scheme and
not in the medical scheme administrator;
19.10.4 Requiring that medical schemes not reimburse any professional fees
charged by a specialist where the patient has not been referred by a GP
(except for good reason);
19.10.5 Removing the practice of doctors (GPs and specialists) dispensing
medicines, apart from instances where patient access to retail pharmacies
is inadequate; and
19.10.6 Establishing a prohibition on any conflict of interest between a specialist
(and a GP) and referral services such as hospital-based services (as
discussed in sections 15 and 18).
Intermediate product providers
19.11 Third-party administrators and managed care intermediaries are contractors to
schemes and often (but not in every instance) drive scheme decisions based on
their own commercial interests. As a consequence, contractual arrangements
entered into by schemes may add little value. Risk-transfer agreements (i.e. a form
96
of insurance contract) which should reduce scheme exposure and induce more
cost-efficient behaviour by health care providers may instead be used to transfer
surpluses from schemes to third-parties.
19.12 At essence, problems with intermediate product providers for schemes derive from
possible flaws in the governance of schemes, where scheme office bearers have
financial interests in the intermediate product providers. Governance reforms
consequently could consider:
19.12.1 The establishment of strong internal scheme executive structures separate
from the intermediaries.
19.12.2 The implementation of new standards for scheme trustees:
Compliance with stringent and explicit fit-and-proper criteria;
More stringent requirements for the appointment and removal of
board members, including but not limited to the regulation of election
processes; and
Appropriate minimum training requirements of board members.
19.12.3 Requirements for regulatory supervision and review of all risk-transfer
agreements entered into between a scheme and any third-party.
Final product providers
19.13 Medical schemes presently lack sufficient incentives to manage both the cost and
quality of benefits. In part, this derives from the fact that brokers are conflicted,
but also from the fact that schemes can still compete on their demographic profile
(which is extreme in the case of gap insurance products). Locating the incentive to
manage costs and service quality within the scheme requires that demographic
factors be removed from competition in respect of a standard set of benefits. This
requires the following:
19.13.1 The introduction of statutory risk-equalization based on prospective
criteria, and statutory reinsurance for catastrophic expenses.
19.13.2 The implementation of an expanded and simplified set of mandatory
minimum benefits to which risk-equalization and reinsurance is applied.
19.13.3 The standardization of benefits, both mandatory (i.e. essential minimum
benefits) and supplementary, to scheme members to improve transparency
and price competition.
19.13.4 The elimination of parallel risk rated health insurance markets for benefits
indemnified by medical schemes.
19.13.5 The restructuring of the means test for access to public hospital services
by, removing the point-of-service means test while mandating medical
scheme participation for those above the tax threshold – while requiring
that medical schemes pay for all public hospitals services (which
encourages competition between public and private hospitals over time).
97
19.14 Many of the problems associated with healthcare service providers relate to
conduct resulting from perverse incentives and market power imbalances (hospitals
and medicines). However, the indirect nature of purchasing health services is a
potentially significant contributor to cost and market imperfections and as market
participants imperfectly intermediate the complex relationship between product
prices, household budget constraints, and household preferences. Interventions
could include:
19.14.1 Centralized negotiations on all fee-for-service prices between
representatives of consumers, schemes and final product suppliers (all
health professionals, all medical products suppliers, all hospital based
services).
19.14.2 The statutory removal of all barriers to selective contracting arrangements
between schemes and healthcare providers (which logically should not be
negotiated centrally).
19.14.3 The removal of any constraint to hospitals employing doctors.
19.15 Market entry for all key final product providers could be protected:
19.15.1 The barriers to entry for new schemes are relative low, at present, but
consolidation of the administrator market needs to be countered.
Consideration needs to be given to new scheme types: such as industry
schemes; and even partial for-profit schemes (which are more able to
internalize scheme incentives at the level of the scheme and to raise capital
more effectively).
19.15.2 Hospital licensing should be streamlined with transparent criteria
established for automatic licensing where satisfied. Licensing procedures
should however be restrictive where market diversity is required. Licensing
procedures should be designed to promote ownership diversity in
populous regions.
19.15.3 Public sector competitors should be introduced in all areas with significant
medical scheme catchment populations.
19.15.4 Foreign doctor (GPs and specialists) registrations should be streamlined.
98
20. FINDINGS – AREAS FOR A MARKET REVIEW
Medical schemes and medical scheme intermediaries
20.1 For provider markets to work efficiently, consistent with a shift to the purchaser-driven approaches
discussed in section 5, funder markets need to be able to act as agents on behalf of patients.
Without this shift markets remain patient-driven and inevitably exposed to market failure. To be
purchaser-driven medical schemes need to be properly incentivized to contract efficiently with health
care providers. Preliminary information suggests that the medical schemes market lacks the
regulatory framework to become purchaser-driven. Without correcting these imbalances, reforms
focusing on provider market structure may limit their effectiveness.
20.2 Central weaknesses in the funding context potentially include:
Localized (scheme-level) supervision through the existing governance model is
weak and reinforces the existence of a third-party administrator model that
undermines the role of the scheme as an agent of members and patients.
Conflicted brokers reduce the market power of consumers to choose a scheme
based on criteria such as: the quality of their coverage; the ability to cost-
effectively manage costs (without reducing benefits); and the fair treatment of
beneficiaries regardless of health status.
Product competition encourages product complexity, reducing the ability of
consumers to judge the value for money of competing products. This reduces
scheme competition on the price and quality of coverage.
Competition on demographic criteria (i.e. discrimination against the old and
sick) by schemes reduces their incentive to manage provider costs as they can
discount contributions merely by discriminating against poor risks.
20.3 Recommendation:
The relevance and importance of a purchaser-driven health insurance market in
South Africa should be clearly established.
The conditions required to achieve a purchaser-driven health insurance market
should be clearly established.
The gaps in achieving a purchaser-driven health insurance market should be
clearly established.
20.4 Areas that could be investigated:
Scheme governance models;
Regulation of scheme contributions and benefits;
Regulation of scheme intermediaries;
Regulation of brokers;
Regulation of managed care; and
Obstacles to selective contracting with providers.
99
Hospitals
20.5 Available information suggests that hospital concentration has increased costs with a possible
related reduction in quality of care. As a growing empirical consensus exists internationally that
market structure is central to the achievement of pro-competitive outcomes for private hospital
markets, the continued approval of new hospital mergers in a concentrated market is a concern. In
part, the equivocal response from government and public authorities results from uncertainty about
the true facts on the ground. Despite the very substantial annual cost of private hospital care and
expensive merger applications, competition studies are merger specific and extremely limited in
scope and accuracy. There is nevertheless a strong basis for a definitive market review covering both
structure and conduct.
20.6 Recommendation:
A comprehensive market review of the South African private hospital market
should be performed with the scope incorporating all relevant aspects of market
structure and market conduct.
A systematic review of all mergers approved over the past 15 years should be
performed, with an emphasis placed on those which international empirical
analysis suggests would increase costs and reduce quality. The mergers should
be assessed against the claims made by the merging parties as to the expected
effect of the merger. It should also test the theories of harm proposed by
interveners.
The relationship between hospitals and doctors should be fully investigated,
with disclosure sought of all incentive-based arrangements likely to bias
treatment in favour excessive hospital utilization. This evaluation should seek to
reach definitive findings on the ability of hospitals to influence the use of
hospital services.
The relationship between four related services and hospitals should also be
prioritized for analysis based on the direct cost of the related services and the
cost of the hospital services they drive:
Emergency transport services, including all methods of contracting
and pricing with schemes;
Pathology practices;
Radiology practices and equipment; and
Anaesthetists.
The price negotiations from 1990 (to capture the transition from a statutory
tariff schedule to a reference list) to the present should be reviewed for their
effect on prices and hospital utilization. This should evaluate the impact of
alternative government and Competition Commission decisions on price
setting, cost, and utilization (assuming that it is found that hospitals can
influence demand).
Vertical collusion between private hospitals and suppliers of medicines, medical
devices, and medical consumables should be investigated from 1998 to the
100
present for their influence on supplier final prices and demand. This should
identify whether any breaches of the Competition Act have in fact occurred.
Vertical collusion between medical scheme intermediaries (third-party
administrators and managed care companies) should be investigated to
determine their true purpose. This evaluation should cover the period 1998 to
the present.
The segmentation of the market by income should be investigated to determine
if this amounts to a restrictive practice. This should examine whether explicit
strategies have been pursued by hospital groups to eliminate selective
contracting for higher-income groups. The review should cover: merger
strategies; the conduct of medical scheme negotiations; and role and related
market power of specialists exercised through the hospital platform.
Doctors (GPs and specialists)
20.7 GPs and specialists have inverted their roles in the South African health system with the former
no longer playing the pivotal gatekeeper role. Specialists are now often seeing patients that should
be seen and treated by a GP with implications for cost and hospital admissions. GPs can in fact
play a central role in directing patients to care based on quality and cost-effectiveness criteria. The
GP is able to provide information which patients find difficult to process including where best to
refer. Re-directing the role of the GP in private care is central to shifting from inefficient patient-
directed to purchaser-directed care. Provided GPs are not conflicted, have access to relevant
information (on cost and quality), they can generate competition between specialist practices and
hospitals. However, doctors are regulated through outdated "ethical" rules which prevent the
publication of any information relevant to competition. These rules are also interpreted to prohibit
the employment of doctors by health facilities of any kind. Despite this, doctors are free to enter
into conflicted relationships of all forms with facilities and product suppliers. Doctors also collude
horizontally in the determination of medical scheme tariffs, out-of-pocket charges, and negotiated
medical scheme contracts.
20.8 Recommendations:
As one of the pre-requisites for purchaser-driven health markets is the
requirement for GPs to function as a gatekeeper for patient treatment, the
requirements for achieving this role through regulation needs to be investigated.
Horizontal collusion between GPs through IPAs, and specialists through their
associations, and all doctors through the South African Medical Association
needs to be examined to understand how markets have been organized and
foreclosed to date. The purpose of this review should be to identify appropriate
interventions to better regulate the conduct of doctors.
The relationship between the reference price list (RPL) process and price
collusion should be reviewed. This review should furthermore consider more
appropriate approaches for setting fee-for-service tariffs applicable to:
Medical scheme reimbursement;
Allowable balance-billing;
101
Billing rules;
New standardized procedure codes;
Differentiation of professional fees according to experience and
qualification; and
Annual price adjustments.
Vertical collusion between GPs and pharmaceutical manufacturers to drive up
medicine prices should be investigated.
Capitation agreements between certain IPAs and medical scheme intermediaries
should be investigated to evaluate the extent to which these have been used to
drive up costs for medical scheme members.
Medicines
20.9 The market for medicines although subject to numerous market failures is not the driver of private
hospital increases. Although much remains to be done, there is presently a legislated process to
address medicine pricing.
20.10 Recommendations:
No investigation of the market for medicines are required at this stage except
for those related to reviews of scheme intermediaries, hospitals, and doctors.
Medical products (other than medicines)
20.11 Medical products (medical devices, surgicals, and consumables) used on the hospital platform are
most susceptible to competition concerns through vertical collusion between hospitals and medical
product providers. As schemes are typically billed on the basis of some form of list price, collusion
typically takes the form of an agreement between hospitals and the product supplier to inflate a
price, with the margin shared. Such arrangements are now also becoming possible with medical
scheme intermediaries.
20.12 Recommendations:
Vertical collusion between hospitals and medical product suppliers should be
fully investigated.
Potential vertical collusion between medical scheme intermediaries and medical
product suppliers should be fully investigated.
102
REFERENCES
Reports:
Cooper, Z. Gibbons, S. Jones, S. McGuire, A. Does Hospital Competition Improve Efficiency?
An Analysis of the Recent Market-Based Reforms to the English NHS: Centre for Economic
Performance, London School of Economics and Social Science, CEP Discussion Paper
No 988, June 2010.
Council for Medical Schemes. Evaluation of Medical Schemes’ Cost Increases: Findings and
Recommendations: Policy Brief 1, March 2008.
Council for Medical Schemes. The analysis of REF shadow returns 2010: 2011a.
Council for Medical Schemes. Annual Report 2011: 2011b.
Department of Health. Inquiry into various Social Security Aspects of the South African Health
System: based on the health subcommittee findings of the Committee of Inquiry into a
Comprehensive System of Social Security, 2002.
Department of Justice, Federal Trade Commission. Statements of Antitrust Enforcement
Policy: 1996.
Department of Justice, Federal Trade Commission. Statements of Antitrust Enforcement Policy
Regarding Accountable Care Organizations Participating in the Medicare Shared Savings Program:
2011.
Dranove, D. White, W.D. "Price and Concentration in Hospital Markets, The Switch
from Patient-driven to Payer-Driven Competition": in The Journal of Law and Economics,
vol. XXXVI, April 1993, pp.179-204.
Dulleck, U. Kerschbamer, R. "On Doctors, Mechanics, and Computer Specialists", The
Economics of Credence Goods: Journal of Economic Literature, Vol. XLIV, March 2006, pp.
5-42.
Feldstien, P.J. “The Market for Hospital Services”: Chapter 11 in Health Care Economics,
6th edition, Thomas Delmar learning, 2005, pp.258-295.
Final Report of the Commission of Inquiry into Health Services, 1986, RP 67/1986. (Brown
Commission).
Ginwala, K.N. Health Legislation in South Africa, Master’s Thesis, University of Natal, 1981.
Le Grand, J. The Other Invisible Hand, delivering public services through choice and competition:
ISBN-13: 978-0-691-12936-5, 2007.
McLeod, H.D. Slattery, P.G. van den Heever, A.M. “The Use and Abuse of Reinsurance
in Medical Schemes”. Presented at the Actuarial Society of South Africa annual
convention, October 2000. Published in the South African Actuarial Journal. Vol. 1, 2001.
National Treasury. Budget Review 2010. 2010.
National Treasury. Budget Review 2012. 2012.
Organisation for Economic Co-operation and Development. Working Party No.2 on
Competition and Regulation:
103
American Bar Association. Competition in Hospital Services - BIAC: 13 February
2012, 2012a.
Cooper Z. Competition in Hospital Services: 13 February 2012, 2012b.
Gaynor, M. Competition in Hospital Services; 13 February 2012, 2012c.
Competition in Hospital Services – Background Paper: 13 February 2012,
2012d.
Competition in Hospital Services – Brazil: 13 February 2012, 2012e.
Competition in Hospital Services - Germany: 13 February 2012, 2012f.
Competition in Hospital Services – Japan: 13 February 2012, 2012g.
Competition in Hospital Services – Netherlands: 13 February 2012, 2012h.
Competition in Hospital Services – Peru: 13 February 2012, 2012i.
Competition in Hospital Services – Sweden: 13 February 2012, 2012j.
Competition in Hospital Services – United States: 13 February 2012, 2012k.
Dranove, D. Shanley, M. “Price and Concentration in Hospital Markets: The Switch
from Patient-Driven to Payer-Driven Competition”: The Journal of Law & Economics, vol.
XXXVI, April 1993, pp179-204.
Krishnan, R. “Market Restructuring and Pricing in the Hospital Industry”: Journal of
Health Economics, vol.20, 2001, pp.213-237.
Lakin, JM. "The End of Insurance? Mexico's Seguro Popular, 2001-2007". Journal of
Health Politics, Policy and Law, Vol 35, No.3, June 2010, pp.315-352.
Maynard, A. Dixon, A. "Private health insurance and medical savings accounts: theory
and experience: in Funding health care: options for Europe, eds. Mossialos, E. Dixon, A.
Figueras, J. Kutzin, J. European Observatory on Health Care Systems Series, ISBN 0 335
20924 6, 2002, pp.109-127.
Melnick, G.A. Zwanziger, J. Bamezai, A. Pattison, R. “The effects of Market Structure
and Bargaining on Hospital Prices”: Journal of Health Economics, vol.11, 1992, pp.217-233.
Propper, C. Burgess, S. Green, K. "Does competition between hospitals improve the
quality of care? Hospital death rates and the NHS internal market": Journal of Public
Economics, Vol.88, 2004, pp.1247-1272.
Office of Fair Trading. Report on the market study and proposed decision to make a market
investigation reference: December 2011.
Serbaroli, F.J. “Merged Hospitals, Networks Under Increased Antitrust Scrutiny”: New
York Law Journal, vol.229, No.56, 25 March 2003.
Van den Heever, AM. “The role of insurance in the achievement of universal coverage
within a developing country context: South Africa as a case study”: BMC Public
Health/International Symposium on Universal Health Coverage, forthcoming, 2012.
Data sources:
104
Medical scheme general data:
Council for Medical Schemes. Annual reports for the periods 1994 – 2011.
1994-2011.
The reports provide data based on the audited financial statements of all
medical schemes in South Africa. Individual reports do not provide a time
series, and the costs reported annually are therefore used to construct a time
series. The following data is used in the analysis:
Gross contribution income;
Beneficiaries;
Claims costs: hospitals, non-hospital;
Non-health costs: administration, managed care, brokers, other.
Medical schemes unit costs:
Trauma-related emergencies: large medical scheme 100% sample (confidential).
Road Accident Fund claims: Confidential: large medical scheme 100% sample
(confidential).
Overall expenditure for a sample of scheme options: large medical scheme
100% sample (confidential).
Statistics South Africa:
Consumer price indices:
http://www.statssa.gov.za/timeseriesdata/excel_format.asp.
(downloaded 27 March 2012).
Consumer Price Index (Base 2000=100) terminated December 2008
Consumer Price Index (COICOP) from January 2008 (Base
2008=100) (201202).
Consumer Price Index Reclassified (COICOP) from 2002 to 2008
(Base 2008 = 100).
General Household Survey. 2006.
Gross domestic product data:
http://www.statssa.gov.za/timeseriesdata/excel_format.asp.
(downloaded 27 March 2012).