review of housing requirements for stratford- on-avon ... review of... · review of housing...
TRANSCRIPT
The world’s leading sustainability consultancy
Review of Housing Requirements for Stratford-on-Avon District Council Final Report April 2013 www.erm.com
ED.4.3.4

FINAL REPORT
Stratford-on-Avon District Council
Review of Housing Requirements for Stratford-on-Avon District Council
April 2013
Prepared by ERM
For and on behalf of Environmental Resources Management Approved by: Ian Gilder
Signed: Position: Technical Director Date: 17th April 2013
This report has been prepared by Environmental Resources Management the trading name of Environmental Resources Management Limited, with all reasonable skill, care and diligence within the terms of the Contract with the client, incorporating our General Terms and Conditions of Business and taking account of the resources devoted to it by agreement with the client. We disclaim any responsibility to the client and others in respect of any matters outside the scope of the above. This report is confidential to the client and we accept no responsibility of whatsoever nature to third parties to whom this report, or any part thereof, is made known. Any such party relies on the report at their own risk.

ENVIRONMENTAL RESOURCES MANAGEMENT STRATFORD-ON-AVON DISTRICT COUNCIL
1
CONTENTS
EXECUTIVE SUMMARY 3
1 INTRODUCTION 11
BACKGROUND AND PURPOSE OF REVIEW 11 STRUCTURE OF THE REPORT 11
2 DEVELOPMENT OF HOUSING REQUIREMENT FIGURES FOR STRATFORD-ON-AVON DISTRICT SINCE 2001 13
WARWICKSHIRE STRUCTURE PLAN, THE WEST MIDLANDS REGIONAL SPATIAL
STRATEGY AND STRATFORD LOCAL PLAN REVIEW 13 WEST MIDLANDS RSS REVIEW 13 DRAFT CORE STRATEGY (FEBRUARY 2012) 14 DRAFT CORE STRATEGY CONSULTATION, PEGASUS EVIDENCE (MARCH 2012) 14 SHOTTERY APPEAL 15
3 NATIONAL PLANNING POLICY FRAMEWORK APPROACH TO HOUSING REQUIREMENTS 17
RELEVANT PROVISIONS OF THE NPPF 17 NEED AND DEMAND 18
4 DEMOGRAPHIC ASSESSMENTS OF HOUSING REQUIREMENTS 21
DEMOGRAPHIC MODELS 21 KEY FIXED MODEL ASSUMPTIONS 25 NET IN-MIGRATION SCENARIOS 26 COMPARISON OF PROJECTIONS FROM THE MODELS 29 SELECTING A PLAUSIBLE NET IN-MIGRATION RATE 30 AFFORDABLE HOUSING REQUIREMENT 32
5 EMPLOYMENT-BASED ASSESSMENTS OF HOUSING REQUIREMENTS 35
PRINCIPLES 35 JOB FORECASTS 35 COMMUTING ASSUMPTIONS 38 RELATING RESIDENT LABOUR FORCE CHANGE TO DWELLING NUMBER REQUIREMENTS
40 PROJECTED RESIDENT WORKFORCE AS A BASIS FOR ASSESSING HOUSING
REQUIREMENTS 41
6 REGIONAL STRATEGY ASSESSMENTS OF HOUSING REQUIREMENTS 43
ENVIRONMENTAL RESOURCES MANAGEMENT STRATFORD-ON-AVON DISTRICT COUNCIL
2
7 POSSIBLE CAPACITY LIMITS ON MEETING HOUSING REQUIREMENTS45
LAND AVAILABILITY 45 TOURISM ECONOMY 45
8 EMPLOYMENT AND HOUSING REQUIREMENTS 47
9 CONCLUSIONS AND RECOMMENDATIONS 51

ENVIRONMENTAL RESOURCES MANAGEMENT STRATFORD-ON-AVON DISTRICT COUNCIL
3
EXECUTIVE SUMMARY
PURPOSE OF REVIEW
Environmental Resources Management (ERM) was commissioned by Stratford-on-Avon District Council (SoADC) in January 2013 to (i) review the evidence previously prepared relating to housing need and demand in Stratford District (SoAD) (ii) identify any inconsistencies or gaps, and (iii) propose any other suitable approaches or models for determining the SoAD housing requirements for the local plan period, from 2008 to 2028. NPPF REQUIREMENTS
The National Planning Policy Framework (NPPF) requires each Local Planning Authority (LPA) to identify the scale of housing that the local population is likely to need over its Local Plan period which meets household and population projections, taking account of migration and demographic change. Having assessed its area’s full housing requirements on an ‘objective’ basis, a LPA may then consider whether there are reasons for not aiming to incorporate all of them in its Local Plan. Such reasons may include lack of physical capacity or potential harm to the principles and policies of the NPPF. DEMOGRAPHIC APPROACH
The models
The demographic projection method used in the GL Hearn Housing Policy Options Study (HPOS) and its Update followed recognised procedures and is appropriate as a tool for assessing the impact of natural population change and different levels of net in-migration on future housing requirements. An alternative model, the Chelmer Model, used by consultees on the Draft Core Strategy, is similar in structure but some of its key assumptions are now out of date and appear to exaggerate housing requirements.
Assumptions
The outputs from any demographic model depend on the input assumptions. The reliability of those outputs as a guide to future housing requirements thus depends on the validity of these assumptions and their expected stability through time. Projections need to take account of the latest available data in setting their assumptions although results may well vary from year to year as the assumptions are updated.

ENVIRONMENTAL RESOURCES MANAGEMENT STRATFORD-ON-AVON DISTRICT COUNCIL
4
The HPOS Update incorporates in its assumptions the most recent data on all fixed input variables and thereby provides the best tool available for exploring the impact of natural population change and different levels of net in-migration on future housing requirements. The HPOS Update model’s outputs in terms of population, households and dwelling requirements for different scenarios exhibit essentially linear relationships because its assumptions are constant between the scenarios for which it is run. The model projects a need for 2,500 net additional dwellings over the period 2008 to 2028, to accommodate natural increase and changes in the household structure of the existing population. All housing requirements beyond this figure will be generated by net in-migrants at a rate of approximately one dwelling per 6.7 net in-migrants per year.
In-migration trends
Assumptions on likely future levels of net in-migration to SoAD can only reasonably be assessed on the basis of past levels of total net in-migration, which are available on an annual basis for at least ten years up to 2009-10. The pattern of in-migration over this ten year period shows no clear trend, but rather an increase from lower levels of 600 to 800 persons p.a. in the early 2000s to a peak of over 1500 p.a. in the mid 2000s, decreasing to well below 1,000 p.a. in the late 2000s. A moratorium on planning permissions was adopted by Stratford District Council in 2006 and lifted in 2011. Net dwelling completions and net in-migrant numbers, which had peaked in 2005-6 were already decreasing when the moratorium was introduced. In the four years after the introduction of the moratorium the number of dwellings completed was only 63% of the number under construction or committed in 2006. The economic crisis and downturn were the most likely causes of the reduction in housing completions and in-migrant numbers from 2007 and the moratorium should not be seen as having created a build-up of unmet demand for housing. There is a range of possible ways of interpreting the in-migration data to derive a robust assumption on future net in-migration. The choice of assumption is critical to the resulting level of housing requirements. For example, applying net in-migration rates of 500, 1,000 and 1,500 persons per year to the HPOS Update model would generate total housing requirements for SoAD of around 6,000, 9,000 and 12,500 dwellings respectively. The net in-migration assumptions adopted in projections explicitly aimed at modelling the continuation of recent migration trends range between 880 per year (Chelmer Model five year figure) and 963 per year (HPOS Update 10 year figure). Net in-migration figures for the most recent five and ten year periods are both below 1,000 persons per year and the figures for individual years rose above that level only in the four years, 2004 to 2008. A figure of 1,000 net in-migrants per year would therefore be a robust assumption to adopt in projecting housing requirements over the medium to long term.

ENVIRONMENTAL RESOURCES MANAGEMENT STRATFORD-ON-AVON DISTRICT COUNCIL
5
Affordable housing and total housing requirements The Stratford-on-Avon Strategic Housing Market Assessment (SHMA) (Jan 2013) estimates a total requirement for households in need of affordable housing, including backlog, of around 1,800 net additional dwellings over the five year period 2012 and 2017, an average of 366 per annum. However, the NPPF’s definition of affordable housing excludes the private rented sector whereas, in practice, a significant portion of households in need are housed in this sector, which the SHMA estimates could release accommodation for around 1,200 households in need of affordable housing over the five year period. Estimates of affordable housing need should therefore not be seen as an overriding element in assessing total housing requirements in SoAD.
Conclusion on demographic approach There is a good case, on past evidence, to be made for adopting a figure of around 1,000 persons per year for net in-migration into SoAD as an assumption for medium to long term projections of future housing requirements. When added to the housing needed to cater for natural increase and changes in household structure, we estimate that this would correspond to a total housing requirement of around 9,000 dwellings, using the HPOS Update approach. For comparison, the 8,000 dwellings requirement proposed in the Draft Core Strategy corresponds to a net in-migration rate of 820 persons per year, which is significantly lower than the figure of 1,000 persons per year, which is derived from evidence of past trends.
LABOUR DEMAND APPROACH
Forecasting jobs
HPOS and its Update pursue an alternative approach to assessing housing requirements in SoAD which is to project the demands that may be placed on the district’s housing supply by job growth. These use independently produced job forecasts and estimate how many of these jobs might be taken by residents of the district. The two models used in HPOS and its Update to forecast job growth, the West Midlands Integrated Policy Model (IPM) and the Experian Regional Planning Service Model, are standard regional econometric models. These are highly sensitive to their input assumptions, especially on the prospects for the national economy, which are particularly difficult to forecast in the present uncertain economic conditions. They are also “policy off “and explicitly not intended for use in setting job growth targets for individual local authorities. The IPM forecasts, run in 2010, were found by GL Hearn to require substantial upward adjustment for the early years after comparison with emerging labour market data, casting further doubt on their value as long term projections. The Experian Model, run in 2012, indicated a much more positive economic prospect

ENVIRONMENTAL RESOURCES MANAGEMENT STRATFORD-ON-AVON DISTRICT COUNCIL
6
but this is partly driven by the unconstrained ONS population forecasts which assume a higher level of in-migration than past trends would suggest is reasonable. The differences between the two models’ views of the future illustrate the volatility of such forecasts. Allocating workers to Stratford
In the HPOS Reports, forecast jobs are allocated to SoAD residents according to the percentage of the jobs in any district taken by workers resident in SoAD as given in the 2001 Census. This assumption ignores important emerging trends such as the increase in home-based work, policy measures to reduce longer distance travel, life style changes favouring a shorter work journey especially on foot or by cycle, etc. It would not be appropriate to provide through housing allocations for the continuation of the 2001 commuting pattern over the long term. Although the HPOS scenarios set out plausible combinations of levels of in-migration, jobs, labour demand and housing, the provision of the ‘required’ number of new dwellings will not necessarily result in the level of job growth used to justify it. Even if jobs increase as forecast, different migration and commuting patterns are likely to emerge from those assumed in the models. For example, new dwellings projected to be required to house employed residents may in practice be occupied by retired households or taken up as second homes. It would be unwise to plan for levels of housing designed to correct projected ‘imbalances’ in the labour market since there is no way of ensuring that this would be the outcome. Conclusion on labour demand approach
For the reasons set out above, assessments which link total housing demand directly to forecasts of labour demand, including the ‘economic-driven’ projections in the HPOS and its Update, cannot be robustly defended. This is a conclusion reached by Inspectors elsewhere faced with similar ‘single relationship’ assessments of housing requirements. REGIONAL STRATEGY ASSESSMENTS OF HOUSING REQUIREMENTS
All of the Regional Spatial Strategies (RSSs) have now been revoked, the formal decision to revoke the WMRSS having been made on the 27 March 2013. However, although the WMRSS no longer carries weight as a formal basis for local planning, its evidence base and reasoning may still have validity where they have not been superseded. The process of revising the West Midlands RSS was halted before a fully revised version, including district housing targets, could be adopted. The Phase 2 Revision, which does present such figures, was never adopted but has been through an Examination and the Panel’s report was published in Sept 2009.
ENVIRONMENTAL RESOURCES MANAGEMENT STRATFORD-ON-AVON DISTRICT COUNCIL
7
Housing targets in the RSS were agreed through a process of coordinated negotiation between local authorities by which a regionally assessed housing requirement was allocated to those places where it would bring the most benefits or incur the least costs. The Panel Report accepted the RSS policy of urban renaissance of the Main Urban Areas supported by housing restraint in the shire areas like Stratford. It concluded that the housing requirement for SoAD for the period 2006 to 2026 should be 7,500 dwellings, with further study recommended of an additional 2,500 to 3,000 dwellings during the 2021-26 period, which would bring the total to between 10,000 and 10,500 dwellings. There could only be a case for seeking to rely on the RSS policy approach as a justification for adopting the RSS housing requirement figures, if the other LPAs in the region were seeking to support that approach by adopting the figures recommended for them by the Panel. However, two of the key MUA authorities, Birmingham and Coventry, are not seeking to base their Local Plan housing numbers on the RSS principle of accommodating substantial housing to support the vision of an urban renaissance. In the absence of any comprehensive agreement between the main urban and the shire authorities to adopt the RSS figures, the policy position of the RSS is no longer relevant to the setting of SoAD’s housing requirement. POSSIBLE CAPACITY LIMITS ON HOUSING REQUIREMENTS AS A BASIS FOR POLICY
Land Availability
The NPPF accepts that there may be situations in which a lack of physical capacity may prevent an LPA from meeting the whole of its assessed housing need but this could be justified only if there were severe development constraints such as a tightly constrained administrative boundary, flood risk or extensive national conservation designations. It is difficult to argue that such constraints place clear limits on potential housing development in SoAD. The Strategic Housing Land Availability Assessment Update (Feb 2013) assesses potential housing supply for 2008 to 2028 at around 8,700 dwellings. However, this cannot be treated as an absolute limit as opportunities for new urban extensions or settlements, for example, have not yet been fully explored. Tourism Economy and Environmental Character
Stratford DC, at the Shottery Appeal, argued the need to limit housing development in order to preserve the special character of the district, given its role in supporting the tourism economy. In our view, this case can carry very little weight as the essential link of causation between housing, ‘environmental character’ and the tourism economy cannot be clearly demonstrated.

ENVIRONMENTAL RESOURCES MANAGEMENT STRATFORD-ON-AVON DISTRICT COUNCIL
8
EMPLOYMENT AND HOUSING REQUIREMENTS
The NPPF requires that housing provision should not be set at a level which would impede sustainable growth so the implications of housing numbers for the employment situation in Stratford need to be examined. SoAD does not necessarily need to provide substantial additional new housing in order to generate or attract new jobs. The labour demand arising from future job increases could be met by reductions in out commuting, higher levels of commuting into the district from neighbouring authorities, or most probably a combination of these two. There is a good case for encouraging additional higher order jobs in the District, partly to maintain employment levels in the face of ongoing job losses in the engineering and other sectors, without providing for a commensurate level of in-migration. OVERALL CONCLUSIONS
We have assessed the adequacy of the evidence base for setting Local Plan housing requirements. The HPOS Update incorporates in its assumptions the most recent data and its underlying projection method provides a good tool for exploring the impact of natural population change and different levels of net in-migration on future housing requirements. However, its recommendations depend too heavily on unreliable economic projections. The Chelmer Model output is out of date and uses some doubtful assumptions, such that the results should be set aside. Despite the sound planning logic that underpinned the RSS, there is no longer a sufficient consensus among the key urban authorities in the West Midlands for reliance to be placed on the policy approach set out in the RSS Review. ‘Economic-driven’ projections of housing requirements based on job forecasts do not offer a reliable approach to assessing housing requirements in the district. Reliance cannot be placed on either a land availability argument or on the risk to the tourism economy or character of the District as justifications for setting housing requirements. To meet the provisions of the NPPF, a sustainable housing requirement figure for SoAD should be based on an informed view of recent and likely future in-migration. A figure of 1,000 net in-migrants per year would be a robust assumption to adopt in projecting housing requirements over the medium to long term. When added to the housing needed to cater for natural increase and changes in household structure, this would equate to a housing requirement of around 9,000 dwellings over the period 2008 to 2028. However, in setting the housing requirement in the Local Plan, SoADC must present a coherent policy position, which takes account of its ‘sustainable economic development strategy’, which seeks to increase the local retention of highly skilled labour and facilitate growth in the local economy. It would therefore be appropriate to ensure sufficient housing provision to at least maintain the current number of employed residents over the period to 2028.

ENVIRONMENTAL RESOURCES MANAGEMENT STRATFORD-ON-AVON DISTRICT COUNCIL
9
In our view, in order that the Local Plan can be found to be ‘sound’, SoADC should set a housing requirement of between 9,500 and 10,000 dwellings for the local plan period. There is a good case for not setting a figure higher than this at a time when the net job growth outlook is still very uncertain and there would be a risk of further unbalancing the population of the district by attracting a high proportion of retired in-migrants and out commuters. On the other hand, a figure lower than this range would be open to the criticism that it would not be aiming to meet the full objectively assessed need for housing in the district.

ENVIRONMENTAL RESOURCES MANAGEMENT STRATFORD-ON-AVON DISTRICT COUNCIL
11
1 INTRODUCTION
BACKGROUND AND PURPOSE OF THE REVIEW
1.1 Stratford-on-Avon District Council (SoADC) has commissioned a number of studies looking at the Stratford District (SoAD) housing requirements and published a Draft Core Strategy in February 2012 based on one of the projections produced in the principal one of these, the Housing Provision Options Study (HPOS), produced by GL Hearn in June 2011. It has since commissioned an update to the Strategic Housing Market Assessment (SMHA Update, GL Hearn, July 2012) and an update to the original Housing Provision Options Study (ongoing).
1.2 While the Council’s preferred option has received much public support, various parties have objected to the housing requirement selected as the basis of the Draft Core Strategy, in particular the volume house builders. The Secretary of State, in his determination of the Shottery Appeal in October 2012, has pointed to a higher housing requirement, based on the evidence at that appeal.
1.3 Environmental Resources Management (ERM) was commissioned by SoADC in January 2013 to (i) review the evidence previously prepared relating to housing need and demand in Stratford District (ii) identify any inconsistencies or gaps, and (iii) propose any other suitable approaches or models for determining the SoAD housing requirements.
1.4 This is the Final Report of that Review. STRUCTURE OF THE REPORT
1.5 Following this Introduction, the report contains the following sections: Section 2: Development of housing requirement figures for Stratford since 2001 Section 3: National Planning Policy Framework (NPPF) approach to housing
requirements Section 4: Demographic assessments of housing requirements Section 5: Employment-based assessments of housing requirements Section 6: Regional Strategy assessments of housing requirements Section 7: Possible capacity limits on meeting housing requirements


ENVIRONMENTAL RESOURCES MANAGEMENT STRATFORD-ON-AVON DISTRICT COUNCIL
13
2 DEVELOPMENT OF HOUSING REQUIREMENT FIGURES FOR STRATFORD-ON-AVON DISTRICT SINCE 2001
WARWICKSHIRE STRUCTURE PLAN, THE WEST MIDLANDS REGIONAL SPATIAL
STRATEGY AND STRATFORD LOCAL PLAN REVIEW
2.1 The Warwickshire Structure Plan (2001) set a requirement for SoAD of 547 dwellings p.a. for 1996 to 2011. The first West Midlands Regional Spatial Strategy (RSS) (2004) set a lower total housing requirement for Warwickshire (no district-level figures), decreasing over time, for 2001 to 2021. The strategic aim was to restrict housing in the shire areas so as to concentrate housing and jobs in the West Midlands Main Urban Area, encouraging regeneration there.
2.2 The SoAD Local Plan Review (2006) set a requirement of 475 dwellings p.a. for SoAD for the period 1996-2011, being SoAD’s percentage share of the Structure Plan Warwickshire total applied to the lower RSS county total. However, of the dwellings thus required to be built from 2001 to 2011, most had already been built between 2001-2006, leaving a residual requirement of 1464 up to 2011. Consequently, the Local Plan included a policy for a moratorium on most planning permissions, in order to keep house building down to RSS levels. Details of its application were contained in an SoADC SPD on ‘Managing Housing Supply’ (2007). This was applied until 2011. WEST MIDLANDS RSS REVIEW
2.3 The RSS Review continued the regeneration approach of the first RSS and produced a Preferred Option which further reduced the figure for SoAD under its Draft Phase 2 Revision (2007) to 280 dwellings p.a. for the period 2006 to 2026. This figure contrasted strongly with CLG’s 2004-based household projections, raising concerns about whether SoADC would be adequately meeting housing need in its area. Nathaniel Lichfield and Partners (2008), reviewing the figures for the Government Office for the West Midlands (GOWM), proposed 502 dwellings p.a. for SoAD. When the CLG 2006-based projections came out, the Cambridge Centre for Housing and Planning Research were commissioned by GOWM to review the RSS housing numbers (2009). They found a demand for 680 dwellings p.a. for SoAD, not including backlog of demand in the existing stock.
ENVIRONMENTAL RESOURCES MANAGEMENT STRATFORD-ON-AVON DISTRICT COUNCIL
14
2.4 The RSS Review Panel Report (Sept 2009) noted that the gap between the housing figure in the Draft Phase 2 Revision and the various figures for need or demand was greater than almost anywhere else in the region. The Panel considered increasing the housing requirement for SoAD but accepted arguments based on the small size of its main town and the need to preserve its character to support tourism. The Panel nevertheless proposed increasing the earlier draft RSS figure to 375 dwellings p.a. (and also recommended consideration of an additional 125 to 150 dwellings p.a. above that figure for the period 2021-26). The SoAD Consultation Draft Core Strategy (2010) took the 375 dwellings p.a. on board, as it was required to do, at that time.
2.5 When Government announced the imminent revocation of the RSSs, SoADC sought an alternative justification for its housing figures and commissioned the Housing Provision Options Study (HPOS) from GL Hearn (2011). This recommended a figure of 11-12,000 dwellings over the period 2008 to 2028 (550 to 600 dwellings p.a.). However, among the scenarios it examined was a low in-migration option which implied a total of 8,000 dwellings and the Council selected this figure for inclusion in the Draft Core Strategy (Feb 2012). The main scenarios have since been re-examined based on updated assumptions by GL Hearn in the 2013 SHMA Update and the 2013 HPOS Update. DRAFT CORE STRATEGY (FEBRUARY 2012)
2.6 SoADC published a Draft Core Strategy for consultation in February 2012. The policy on housing numbers, Policy CS 16, has three main elements of particular relevance to the present study: 1. Approximately 8,000 dwellings will be provided in the whole district during the
period 2008-2028 (average 400 dwellings p.a.); 2. Additional housing in the main town, Stratford-on-Avon, will be limited to 560
dwellings, in estates of less than 100 homes; and 3. Most new housing will be dispersed to designated rural centres and villages,
with estate size limited to 2% of the existing housing stock in a settlement. DRAFT CORE STRATEGY CONSULTATION, PEGASUS EVIDENCE (MARCH 2012)
2.7 One of the most comprehensive sets of comments on the housing requirements in the Draft Core Strategy was submitted by Pegasus Planning Group on behalf of developers. They argued that the Draft Core Strategy’s 8,000 dwelling total was not justified because: 1. it is based on 75% of the ten year internal migration trend, which was already
15% below the five year trend used by ONS in their Sub-national projections; 2. no arrangements have been made for other authorities to take the surplus
demand due to in-migration;
ENVIRONMENTAL RESOURCES MANAGEMENT STRATFORD-ON-AVON DISTRICT COUNCIL
15
3. the dwelling figure implies a reduction in labour supply in the district which would be inconsistent with the Community Strategy and NPPF objectives to support employment growth; and
4. No justification was given for restraining growth to levels below demand.
2.8 Pegasus developed a set of scenarios similar to those of HPOS, but using the Chelmer Model. They concluded that the housing figure should be increased from 8,000 to at least 11,777, in order to accommodate the lowest projected migration trends. They summarise the undesirable social and economic consequences of restricting housing below demand levels as being: 1. declining population due to reduced population of child-bearing age; 2. fewer people of working age to contribute to the economy; 3. mismatch between jobs and labour force may lead businesses to move out 4. increased commuting into the district; and 5. lack of services and infrastructure to support growing elderly population. SHOTTERY APPEAL
2.9 In September 2011, SoADC refused planning permission for a mixed use development including 800 dwellings at Shottery in Stratford-on-Avon. The application went to appeal and the Inspector recommended in his report, in July 2012, that the appeal be allowed, a recommendation that was endorsed by the Secretary of State in October 2012. One of the key elements in the case against the Council was that SoADC’s claimed five year housing land supply was not based on the full objectively assessed need for housing in the district as required by the NPPF.
2.10 The appellant argued that the reduced net in-migration housing requirement option from HPOS (8,000 dw) chosen by the Council would not meet fully assessed housing demand. Furthermore, the NPPF proposes in such cases that the unmet demand be met through joint working with other authorities, but there was no evidence that this had been done.
2.11 The Council argued that it had selected the reduced net in-migration option from among those presented in the HPOS as this would have the least environmental impact and do most to preserve the character of the area. The Council also argued that the HPOS took insufficient account of the potential detrimental impact of higher development levels on tourism, a key sector of the local economy.
2.12 A pressure group, formed to oppose the proposed development, Residents against Shottery Expansion (RASE), made a number of points on housing numbers, including: 1. that low net in-migration is not unlikely in the coming post-recession period.
Between 1994 and 1999, another post recession period, net in-migration had averaged 520 persons p.a;

ENVIRONMENTAL RESOURCES MANAGEMENT STRATFORD-ON-AVON DISTRICT COUNCIL
16
2. the Chelmer projections used by the appellant are purely trend based and take no account of the council’s specific aim of reducing net in-migration;
3. HPOS was not provided with adequate information on critical infrastructure constraints, which are acute in SoAD;
4. demand is likely to be low for some time during the economic recovery and neighbouring districts with lower house prices are likely to attract SoAD’s ‘displaced demand’; and
5. an ageing population may not reduce economic activity as much as HPOS assumes, due to extensions to retirement age and jobs required to serve that ageing population.
2.13 The Inspector reached the following conclusions on housing numbers:
1. there was no evidence presented on how ‘displaced’ demand is to be addressed; 2. the HPOS study is a properly prepared independent assessment based on more
recent evidence than was used in the RSS Review Panel Report; and 3. based on the evidence presented, a housing requirement of 11,000 to 12,000
dwellings would accord more closely with the full, objectively assessed needs assessment required by the NPPF than the Council’s figure of 8,000 dwellings.

ENVIRONMENTAL RESOURCES MANAGEMENT STRATFORD-ON-AVON DISTRICT COUNCIL
17
3 NATIONAL PLANNING POLICY FRAMEWORK APPROACH TO HOUSING REQUIREMENTS
RELEVANT PROVISIONS OF THE NPPF
3.1 Arguments about appropriate levels of housing to include in Local Plans must now be made within the context of the National Planning Policy Framework (NPPF). There are four key elements to the NPPF’s expectations on housing requirements:
1. ‘Local planning authorities should use their evidence base to ensure that their Local Plan meets the full, objectively assessed needs for market and affordable housing in the housing market area, as far as is consistent with the policies set out in this Framework.’ (Para 47)
2. ‘They should prepare a Strategic Housing Market Assessment to assess their full housing needs, working with neighbouring authorities where HMAs cross administrative boundaries. The Strategic Housing Market Assessment should identify the scale and mix of housing and the range of tenures that the local population is likely to need over the plan period which meets household and population projections, taking account of migration and demographic change’ and ‘caters for housing demand and the scale of housing supply necessary to meet this demand.’ (Para 159)
3. ‘Joint working should enable local planning authorities to work together to meet development requirements which cannot wholly be met within their own areas – for instance, because of a lack of physical capacity or because to do so would cause significant harm to the principles and policies of this Framework.’ (Para 179)
4. ‘ Every effort should be made objectively to identify and then meet the housing, business and other development needs of an area, and respond positively to wider opportunities for growth.’ (Para 17). A general point made in the NPPF, although not specifically aimed at housing provision is that ‘Planning should operate to encourage and not act as an impediment to sustainable growth. Therefore significant weight should be placed on the need to support economic growth through the planning system.’ (Para 19)
3.2 The NPPF does not explicitly set out how housing requirements should be assessed.
However, the reference to meeting household and population projections implies that Local Plans are expected to follow a trend-based approach. The starting point is that each area should, on the whole, aim to meet the housing needs it generates. In principle, therefore, all needs should be met. However, if an area is subject to constraints that make it impractical or undesirable to meet all of its ‘own’ need or demand there is scope for bilateral agreements with neighbouring authorities to share any shortfall, if this would bring mutual benefits.
ENVIRONMENTAL RESOURCES MANAGEMENT STRATFORD-ON-AVON DISTRICT COUNCIL
18
3.3 This ‘bottom up’ approach is in contrast to the policy-based approach which was followed by the Regional Spatial Strategies, which are in the process of being revoked. In these, the distribution of new housing was seen as a way of achieving efficiency and equity objectives identified at a regional level. Housing targets were agreed through a process of coordinated negotiation between local authorities such that a regionally assessed housing requirement would be allocated to those places where it would bring the most benefits (e.g. supporting regeneration or substantial proposed job growth) or incur the least costs (in terms of environment, infrastructure, etc).
3.4 Under the NPPF, the principle is very clear that an LPA is expected to assess its area’s total housing requirements on an ‘objective’ basis and only then to consider whether there are reasons for not aiming to incorporate them in its Local Plans. This two stage principle is well supported by Inspectors examining submitted Core Strategies, although not in all cases. See the Inspector’s Report (IR) on South Oxfordshire Core Strategy, October 2012, for example.
3.5 If the LPA sees reasons for not meeting the full needs, it should make efforts to reach agreement with neighbouring authorities to meet the shortfall. However, in several cases where submitted Local Plans have clearly not met any objective assessment of their ‘full requirements’, the Inspectors have not called attention to any need to reach agreement with other LPAs on how to deal with the shortfall. Nor is it clear what should happen if such agreement cannot be reached.
3.6 The requirement in Para 47 for housing needs to be assessed in relation to the “housing market area” raises the question of what is the most appropriate housing market area to adopt. Housing market areas do not have precise boundaries and often do not match to Districts. A Joint South Warwickshire Housing Market Assessment covering Stratford-on-Avon and Warwick Districts was prepared in 2006 and partially updated in a SHMA Review in 2009. This two district combination broadly reflects the area covered by the Warwick and Stratford-upon-Avon Travel to Work area defined by ONS. An Updated SHMA for Stratford-on-Avon District alone was produced in Jan 2013 by GL Hearn. We understand that a new assessment for the wider Coventry housing market area is being commissioned, which will provide a wider sub-regional context for considering housing market demand.
NEED AND DEMAND
3.7 The NPPF lacks clarity in its use of the terms ‘need’ and ‘demand’ in relation to housing. That said, paragraphs 47 and 159 clearly show that Local Plans are expected to provide for both need and demand for housing. Housing need is conventionally defined as housing required to ensure that all households live in accommodation that meets certain standards. In practice it is reasonable to treat the properly assessed requirement for affordable housing as representing the scale of housing need in an area.

ENVIRONMENTAL RESOURCES MANAGEMENT STRATFORD-ON-AVON DISTRICT COUNCIL
19
3.8 Housing demand, on the other hand, refers to the quantity of housing which households are willing and able to pay for. This is the market housing element of the NPPF housing requirement. While it may be relatively straightforward to assess the scale of housing need, once the relevant standards have been agreed, it is far more difficult to pin down the scale of housing demand for market housing that may arise in an area.
3.9 As noted above, Para 179 of the NPPF proposes that local planning authorities should work jointly to ensure that development requirements which cannot reasonably be accommodated within their district are met elsewhere. In various parts of the evidence base (eg. HPOS, Pegasus, Shottery Appeal Inspector’s Report) there are references to ‘displaced demand’ referring to any shortfall against the assessed ‘full housing requirement’. While it would be appropriate to seek to arrange housing provision to meet clearly defined local need in neighbouring districts, this approach is questionable in relation to total demand. The in-migrants who generate much of ‘displaced demand’ are households currently living anywhere in the country who end up choosing SoAD if there is housing available there at a price they are willing to pay.
3.10 The factors which influence the level of demand for housing in an area are mixed and complex. Some relate to the behaviour, circumstances and opportunities of the would-be incomers. Others relate to the characteristics and dynamics of the receiving district. Key factors are: 1. attractiveness of the area as a place to live 2. house prices in the area 3. potential for job growth in the area.
3.11 Households who choose to or wish to move into an area have other choices available. They therefore constitute potential demand for more than one location. The above factors must therefore be seen in relative terms, measured against the characteristics of alternative locations, particularly those elsewhere within the wider housing market area, which, in the case of SoAD, will include all or parts of the neighbouring districts. Thus, the demand for housing in SoAD will be particularly affected by the future level of housing provision, house prices and jobs in an adjoining district such as Warwick. Conversely, the level of housing provided in SoAD will affect its attractiveness to households in districts in the more heavily urbanised parts of the West Midlands conurbation which are subject to net out-migration.
3.12 Clearly, there will be numerous ways of deriving a figure for total housing demand, with no clear basis for considering one more reliable than another. There are nevertheless some widely recognised and accepted approaches to assessing future trends in household numbers and the housing that would be required to accommodate them, some of which are discussed in the following sections.


ENVIRONMENTAL RESOURCES MANAGEMENT STRATFORD-ON-AVON DISTRICT COUNCIL
21
4 DEMOGRAPHIC ASSESSMENTS OF HOUSING REQUIREMENTS
DEMOGRAPHIC MODELS
4.1 The conventional approach to assessing housing requirements in an area is to make projections of future levels of population and households resulting from natural change (births and deaths) and migration. This section critically examines the assumptions behind the demographic projections of housing requirements which have been used or referred to in the evidence base for the Draft Core Strategy: 1. the ONS Sub-National Population Projections (SNPP) and associated CLG Sub-
National Household Projections (SNHP); 2. GL Hearn’s demographic projections contained in the HPOS and its Update;
and 3. the Chelmer Model, used by Pegasus, consultants to developer consultees on
the Draft Core Strategy.
4.2 The aim is to establish whether any of the outputs from these models can be taken to represent an objective assessment of full housing need for SoAD, as required by the NPPF.
4.3 All three models operate in essentially the same way. Each adopts a set of fixed parameters or relationships, comprising the starting population and its structure, to which fertility and mortality rates, headship rates, in-migrant population structure, and employment rates are applied. The sources of the assumptions for these parameters as used in the HPOS and in the Chelmer projections are given in Table 4.1. The key input variable, i.e. the one that generates variations in outputs for different scenarios within each model, is net in-migration. The main outputs are: population, households, labour force and housing requirements. (i) ONS/DCLG Sub National Models
4.4 The ONS produces biennial projections of population at local authority level built on the base of their latest annual mid-year population estimates. These Sub National Population Projections (SNPPs) provide annual population figures over a 25 year period. DCLG converts these into Sub National Household Projections (SNHPs). SNPPs and SNHPs are both available with base year 2008. SNPPs (but not SNHPs) are also available with base year 2010. Interim SNPPs giving annual figures for a ten year period only are, exceptionally, available for the base year 2011, so as to incorporate data from the 2011 Census.
ENVIRONMENTAL RESOURCES MANAGEMENT STRATFORD-ON-AVON DISTRICT COUNCIL
22
Table 4.1 Fixed assumptions between projections used in each Model
Constants between projections
HPOS HPOS Update Chelmer Model
Base population and age-sex structure in SoAD, 2008
ONS 2008-based SNPP 2011 Census back-projected
ONS Mid-year population estimate for 2008
Total population in 2008 118,705 119,762 117,948 Age specific fertility rates in SA
ONS 2010-based assumptions SNPP
ONS 2010-based assumptions SNPP
ONS 2008-based assumptions SNPP
Total Fertility Rate ONS 2008-based assumptions applied to SoAD data = 1.9 constant
ONS 2010-based assumptions applied to SoAD data = 2.03 to1.87 over time
Not given
Ratio of male to female births in SA
National assumptions = 1.05
Same as HPOS? Not given
Death rates in SA ONS 2008-based life tables applied to SA
ONS 2010-based life tables applied to SA
ONS 2008-based assumptions SNPP
Life expectancy 2028 m = 84.9; f = 87.9 m = 83.1; f = 86.3 Not given Age-sex structure of in-migrants and out-migrants in SA
ONS 2008-based assumptions
ONS 2011-based assumptions
ONS 2008-based assumptions
Employment rates by age and sex
2001 census, adjusted to 2010 APS and state pension age changes
2001 census, adjusted to 2011 APS and state pension age changes
2001 Census and national Labour Force projections
Total employment rate(ages 16-64)
80.0% 80.4% Not given
Headship rates by age group in A
CLG 2008-based SHPP Between2008-based SHPP and Census trends
CLG 2008-based SHPP
Average household size 2028(outcome)
2.10 to 2.15 2.20 to 2.23 2.1 to 2.16
Vacancy rate in existing stock
2008 level unchanged 2008 level unchanged 2001 Census: 4.4%
Vacancy rate in new stock
2.5% 2.5% 2001 Census: 4.4%
Source: HPOS, HPOS Update and Pegasus Submission to Draft Core Strategy Consultation Note: items in italics are outcomes based on the input constants
4.5 The SNPPs and SNHPs are intended to indicate the possible size and structure of the future population of English local authorities, based on the continuation of recent demographic trends. They make assumptions on future fertility, mortality, headship rates and, most significantly, migration levels based usually on trends over a five-year period. The projections are very useful as a reference, as they are constrained to national totals and produce a consistent set of projections across the country. However, they are not suitable for direct use in assessing housing requirements for Local Plan purposes. This is because, as their accompanying notes explain: ‘they take no account of local development policy, economic factors or capacity of areas to accommodate population. Their aim is simply to provide an indication of future population size and structure should the assumptions used be realised’.
ENVIRONMENTAL RESOURCES MANAGEMENT STRATFORD-ON-AVON DISTRICT COUNCIL
23
(ii) HPOS Models
4.6 The demographic projections in the HPOS and its Update follow the same steps as the SNPP and the SNHP. Most of their fixed assumptions (see Table 4.1) are taken from the latest ONS and DCLG projections, subject to minor variations to respond to local circumstances in SoAD. These and their projection procedures are clearly set out and justified in the reports. The HPOS is based largely on assumptions derived from the ONS/DCLG 2008-based population and household projections while the HPOS Update uses assumptions from more up-to-date data sources including the 2011 Census, ONS 2010-based population projections to 2035, and Interim 2011-based projections to 2021.
4.7 It is important to appreciate that although the HPOS models are built up from numerous steps and assumptions, because these are constant between the migration-based scenarios for which the model is run, the outputs in terms of population, households and dwelling requirements for different scenarios exhibit essentially linear relationships. This can be seen in Figures 4.1 and 4.2, which illustrate, in graph form, the way that housing requirements vary with population under the ten projections from HPOS and the eight projections from the HPOS Update respectively.
4.8 As well as demonstrating the linearity of the outputs, the two Figures also show the impact of the revised assumptions used in the Update on the essential relationship between population and housing requirements. Under the HPOS assumptions, the equation in Figure 4.1 shows that the housing requirement in additional dwellings can be calculated by applying a multiplier of 0.44 to the population increase and adding 5,000 (which is the number of dwellings required to keep the population constant). Under the Update, because of the changes in the fixed parameters used, especially headship rates, the multiplier is reduced to 0.39 and the constant is reduced to 3,900. It should be emphasised that these equations, which are implicit in the relationships inside the model runs, were derived by ERM and were not used by GL Hearn to generate their outputs. (iii) Chelmer Model
4.9 Pegasus Planning Group submitted comments on the Draft Core Strategy housing requirement for SoAD in which they presented an alternative set of demographic projections produced by the Chelmer Population and Housing Model. This is a widely used model which is broadly similar in structure to the SNPP and SNHP models. As used by Pegasus, its key input constants are mainly derived from the ONS 2008-based projections (see Table 4.1) so they are broadly similar to those adopted in the HPOS. However, in two cases, headship rates and vacancy rates, they show significant variation from HPOS assumptions, as discussed below. Several of the assumptions used in running the Chelmer Model have been superseded by the more recent data mentioned above.

ENVIRONMENTAL RESOURCES MANAGEMENT STRATFORD-ON-AVON DISTRICT COUNCIL
24
Figure 4.1 Housing requirement by change in population from HPOS projections
Source: ERM, derived from HPOS
Figure 4.2 Housing requirement by change in population from HPOS Update projections
Source: ERM, derived from HPOS
4.10 The linearity of the relationships between outputs in the HPOS model applies
equally to the outputs of the Chelmer Model. Figure 4.3, which illustrates how housing requirements vary with population, shows that the multiplier, at 0.40, is similar to the 0.39 multiplier derived from the HPOS Update, but the constant is higher: 5,800 compared with 3,900 in the HPOS Update.
ENVIRONMENTAL RESOURCES MANAGEMENT STRATFORD-ON-AVON DISTRICT COUNCIL
25
Figure 4.3 Housing requirement by change in population from Chelmer Model
Source: ERM, derived from Pegasus Submission to Draft Core Strategy Consultation on behalf of Cala Homes (Midlands) Ltd
KEY FIXED MODEL ASSUMPTIONS
4.11 The projection of natural increase in population is relatively straightforward, as much of the future population is already present and clearly justified assumptions on birth and death rates are available from ONS. However, assumptions on headship rates and vacancy rates, which are used in converting population to households and dwellings, vary significantly between the models.
(i) Headship rates/household size
4.12 There is a long-standing trend towards decreasing average household size in the UK, due to individuals remaining single longer, couples splitting and the elderly living longer. Thus even if the existing population level were to remain constant, additional housing would still be required to accommodate it in future. The demographic models do not apply average household size assumptions to convert population into future households, however, but adopt assumptions on future household representative rates (commonly known as headship rates) for different age groups in order to estimate numbers of heads of household. Average household size is an outcome not an input and varies by scenario. It can nevertheless usefully summarise the impact of the particular set of headship rates adopted.
ENVIRONMENTAL RESOURCES MANAGEMENT STRATFORD-ON-AVON DISTRICT COUNCIL
26
4.13 The average household sizes from the Chelmer Model output, based on headship rates from the ONS 2008-based projections, are lower than those for the equivalent projections in the HPOS and the Update. In the HPOS Update, GL Hearn draw attention to evidence from the 2011 census that household size has been decreasing more slowly than had been envisaged in the 2008-based projections. This is therefore an area in which the Chelmer Model may tend to overestimate trend-based housing demand compared with the HPOS model, generating around 3% more households than the HPOS model would for the same net additional population. (ii) Vacancy rate
4.14 The HPOS and Update implicitly assume no change in the vacancy rate in the existing stock between 2008 and 2028 and assume a rate of 2.5% in the new stock over that period to allow for typical turnover in the new dwelling stock1. The Chelmer Model, on the other hand, assumes that the 2001 vacancy rate of 4.4% will apply throughout both the existing stock and new dwellings up to 2028. As a result it generates housing requirements at least 2% higher than would be generated by the HPOS model for the same number of net additional households.
4.15 According to the SHMA Update, second homes represented some 1.5% of the total housing stock in 2007 and it seems probable that Pegasus have included an allowance for this category of housing within the vacancy rate which was applied to future housing. NET IN-MIGRATION SCENARIOS
4.16 The input assumptions on net in-migration drive the projections from the demographic models. In all cases they are based on past trends but there are various ways of measuring the past rate of in-migration and interpreting its trend and it is not possible to be definitive about which rate offers the most reliable indication of how demand from potential in-migration may develop in future. ONS states that it uses the most recent five year period to establish the trends for its forecasts but GL Hearn argue that this may not give a representative trend for long term forecasts. Furthermore, projections based on five year trends are more subject to erratic swings from year to year as they are rolled forward.
4.17 The base data on net in-migration into SoAD over the past ten years or so is set out in Table 4.2. The first column (taken from Figure 2.4 of the HPOS Update) shows the latest set of improved figures from ONS, with the exception of the figure for 2010/11, which is GL Hearn’s own estimate as ONS have not yet published a total net migration figure for that year. The next two columns show the earlier sets of figures from ONS used in HPOS and by Pegasus.
1 The Draft Core Strategy states that at April 2011 there were 1,329 vacant dwellings in the district, out of a total of 54,200 dwellings
in December 2011 as given in the 2011 Annual Monitoring Report, giving a 2011 vacancy rate of 2.5%.

ENVIRONMENTAL RESOURCES MANAGEMENT STRATFORD-ON-AVON DISTRICT COUNCIL
27
Table 4.2 Net in-migration to SoAD and dwelling completions, 1997 to 2011
Year Net in-migration to SoAD given in: Net dwelling completions
Pop capacity of dwelling completions
ONS/HPOS Update
HPOS Pegasus
1997-8 1000
1998-9 -500
1999-2000 600
2000-1 1100 1100
2001-2 800 800 800 472 1068
2002-3 800 800 800 436 986
2003-4 600 600 600 602 1362
2004-5 1500 1500 1500 806 1823
2005-6 1934 1500 1500 649 1468
2006-7 1744 1700 1700 454 1027
2007-8 1075 800 800 401 907
2008-9 250 200 200 196 443
2009-10 631 200 240 543
2010-11 (300) (a) 109 247
10 yr total 9634 9600 9200 4365 9874
5yr total 4000 5700 4400 1400 3167
p.a. 10 yr 963 960 920 437 987
p.a. 5 yr 800 1140 880 280 633 Source: ONS, SoADC and ERM
Note: (a) ONS figure for internal migration alone is 800, but, as the international component of
total migration turned from positive to negative for Stratford District in 2009/10, GL Hearn assume this downward trend in international migration has continued.
4.18 The pattern of in-migration was variable over the period shown but clearly rose to a higher peak during the period 2004 to 2007. It is therefore difficult to detect a clear trend or representative level to project into the future. The table illustrates how different average rates can be derived by choosing averages over different periods and starting in different years. In general, however, and for the present, the ten year average is more stable between data sets than the five year average.
4.19 Table 4.2 also shows net dwelling completions over the period 2001 to 2011 and their estimated contribution to population, assuming an average vacancy rate of 2.5% and household size of 2.32 (the HPOS Update assumption for 2008). As might be expected, over the ten year period as a whole there is a close relationship between total population capacity of new dwellings (9,874) and total net in-migration (9,634), also reflected by the peaking of both in the middle years of the 2000s.

ENVIRONMENTAL RESOURCES MANAGEMENT STRATFORD-ON-AVON DISTRICT COUNCIL
28
4.20 There is a strong element of circularity in using past trends in in-migration to represent the expected level of demand for housing in the future. The past in-migration levels which are projected forward were also dependent on the amount of new housing that was available to accommodate the incoming population during the reference period. If new provision is tied to this level, it could be used again in future to justify continuing to provide the same level of new housing provision. It is important to consider whether there were any significant supply constraints on meeting demand during the reference period for assessing trends, particularly as a moratorium on planning permissions was imposed by SoADC between 2006 and 2011.
4.21 Figure 4.4 graphs the figures in Table 4.2 showing net in-migrants and net dwelling completions over the period 2000 to 2011. The moratorium was adopted by SoADC in November 2006 and was lifted in April 2011. The Figure shows that net dwelling completions had peaked in 2004-5 and net in-migrant numbers had peaked in 2005-6. Both were already decreasing when the moratorium was introduced in 2006. Furthermore the ‘Managing Housing Supply’ SPD, which introduced the moratorium, indicated that 490 dwellings were under construction at the end of March 2006 and a further 1013 dwellings had permission but had not yet commenced construction at that date (allowing for 15% of dwellings on unallocated sites that were assumed would not be built). In the four years after the introduction of the moratorium, around 950 dwellings were completed, compared with the potential of 1500 committed at March 2006.
4.22 The moratorium is therefore unlikely to have had any significant role in bringing about the drop in either completions or in-migrants during the last years of the 2000s. The economic crisis and downturn from 2007 onwards are a much more likely cause. The moratorium therefore should not be seen as having generated a build-up of unmet demand for housing that will need to be made good in future. (2)
(2) The Inspector for the Bath and North East Somerset Core Strategy (June 2012), in his Preliminary Conclusions, argued that “ignoring past shortfalls will progressively depress the housing requirement, creating a self-fulfilling justification for less housing
growth to be planned than is required”. However, he was referring to an earlier failure to meet Local Plan delivery targets. In the case of SoADC, the moratorium was imposed because of an earlier over-provision in relation to Local Plan targets.

ENVIRONMENTAL RESOURCES MANAGEMENT STRATFORD-ON-AVON DISTRICT COUNCIL
29
Figure 4.4 Net migrants to SoAD and net dwelling completions, 2001 to 2011
Source: ONS, SoADC and ERM
COMPARISON OF PROJECTIONS FROM THE MODELS
4.23 The main outputs from the HPOS, HPOS Update, and Chelmer Model runs based on varying migration levels are set out in Annex 1. They include projections showing the number of dwellings that would be required to house the population of SoAD under a zero net migration scenario, i.e. with natural increase only. This situation represents the starting point to which housing for net in-migrants under other scenarios has to be added. Of the three, the Chelmer Model shows the highest requirement for this scenario, 4,900 dwellings, while the equivalent HPOS and HPOS Update projections require 1880 and 2500 dwellings respectively. This significant discrepancy is mainly due to the headship rates used in the Chelmer Model, which result in an average household size of 2.07 in 2028 under this scenario, compared with 2.10 under HPOS and 2.14 under the HPOS Update.
4.24 Each model also includes a housing requirement to accommodate a ‘trend-based’ migration scenario, based on past rates of migration over a recent five or ten year period. The net in-migration rates adopted and the housing requirements resulting are shown in Table 4.3, together with the rate used in the scenario closest to the Draft Core Strategy proposed housing requirement of 8,000 dwellings. Although the Chelmer Model adopted the lowest in-migration rate of the three, its housing requirement was still the highest, due to the impact of its lower household size assumptions on both the zero net-migration population component and the net in-migrants.
Table 4.3 Net in-migration assumptions and resulting housing requirements under ‘trend-based’ scenarios and Draft Core Strategy
Model Number of years
Period Persons p.a. Housing requirement
HPOS 10 1999 to 2009 960 10,350
HPOS Update 10 2001 to 2011 963 8,989
Chelmer Model 5 2005 to 2010 880 11,777

ENVIRONMENTAL RESOURCES MANAGEMENT STRATFORD-ON-AVON DISTRICT COUNCIL
30
Model Number of years
Period Persons p.a. Housing requirement
Draft Core Strategy (i) 720 8,230
Source: HPOS, HPOS Update, and Pegasus Submission to Draft Core Strategy Consultation Note (i) DCS housing requirement derived from HPOS output for lower net in-migration projection
4.25 Overall, we conclude that the Chelmer projections are not an appropriate basis for
setting housing requirements, as they do not take account of the most recently available assumptions and in any case tend to inflate the housing demand under any scenario. We consider the HPOS Update projections to be a more appropriate basis for exploring the impact of net in-migration levels on future housing demand than the original HPOS, because these adopt the most recent available assumptions on migration rates and headship rates.
SELECTING A REASONABLE NET IN-MIGRATION RATE
4.26 It is sensible to look at the migration assumptions used by ONS in the SNPPs as these are intended to provide a ‘policy off’ reference case. ONS state that they normally assume that net in-migration will continue according to a trend derived from experience over the previous five years. This does not appear to have been the case with SoAD, however, according to the data in Table 4.2, as the SNPP show figures consistently higher than a five year reference period would suggest.
4.27 The Components of Change table from the 2008-based SNPP projections shows net in-migration rates starting at 1,100 p.a. in 2008 and increasing to 1,400 p.a. by 2028, (averaging 1,325 persons per annum). This is approximately equivalent to the five year rate to 2008 from the figures in Table 4.2. However, the average rate of 1400 p.a used in the 2010-based SNPPs is not based on the figures for the five year period to 2010, which would have been around 1100. ONS clearly considered these migration assumptions were too high as the Interim 2011-based SNPP projections adopt a lower net in-migration rate, starting at 1,100 p.a. in 2012 and increasing to 1,400 p.a. by 2021, when the projection ends (averaging 1,250 persons per annum). There are as yet no ONS 2011-based projections of population beyond 2021, nor any DCLG 2010-based projections of households.
4.28 Given that there is no clear basis for the in-migration assumptions used by ONS and they are higher than the data would appear to justify, we consider it would be more appropriate to choose an assumption based directly on the available evidence in Table 4.2. For their main trend-based projection in HPOS (PROJ 1), GL Hearn chose to adopt a ten year net in-migration rate (960 p.a. between 1999 and 2009) rather than a five year rate (1140 p.a. between 2004 and 2009) as figures in the latter period appeared to them untypical of the longer term trend. In the equivalent projection in the HPOS Update (PROJ 2), GL Hearn also adopted a ten year rate: 963 p.a. between 2001 and 2011. In this case a five year rate would have been lower, at 800 p.a.

ENVIRONMENTAL RESOURCES MANAGEMENT STRATFORD-ON-AVON DISTRICT COUNCIL
31
4.29 There can be no ‘correct’ answer to the question of which in-migration figure to adopt in projecting housing requirements using a demographic model approach. Average figures for the most recent five and ten year periods are both below 1,000 persons p.a. and the figures for individual years rose above that level only in the four years 2004 to 2008. It would, in our view, be sensible to adopt a figure of around 1,000 persons p.a. as a robust assumption for medium to long term projections.
4.30 Table 4.4 shows the output from the three HPOS Update projections for which a specific migration level was specified: zero net migration, trend-based migration (963 p.a.), and ONS SNPP-linked (1307 p.a.). Figure 4.5 graphs the housing requirements from these projections against the net in-migration figures. Although the number of points on the graph is very small, the linearity of the model’s outputs for all its projections was adequately demonstrated by the relationship between housing and population (which incorporates net in-migration assumptions) illustrated in Figure 4.2.
Table 4.4 Output from HPOS Update migration-based projections
Scenario Projection Net migration
Pop Hhlds Dw Hhld size
Zero net migration PROJ 5 0 -3687 2564 2500 2.14
Trend-based (10 yr migration)
PROJ 2 963 p.a. 13214 8770 8989 2.20
Based on ONS SNPP 2010/11
PROJ 1 1,307 p.a. (average)
19178 11013 11288 2.22
Source: HPOS
Figure 4.5 Net additional dwellings by net in-migrants p.a., from HPOS Update
Source: ERM, derived from HPOS Update
ENVIRONMENTAL RESOURCES MANAGEMENT STRATFORD-ON-AVON DISTRICT COUNCIL
32
4.31 The Figure shows that the housing requirement implicit in the model’s assumptions can be calculated by applying a multiplier of 6.7 to the net in-migrant number and adding a constant of 2,500, which represents the number of dwellings required to maintain the existing population with no net migration. For a net in-migrant total of 1,000 per year, this gives a total housing requirement of 9,200. A reverse calculation shows that the Draft Core Strategy’s 8,000 dwellings, a scenario which was not examined in the HPOS Update itself, would be associated with a net in-migration figure of 820 per year. AFFORDABLE HOUSING REQUIREMENT
4.32 Affordable housing comprises one element of the ‘the full, objectively assessed needs for market and affordable housing’ which are required to be met under Para 47 of the NPPF. Affordable housing need is assessed in terms of any backlog arising from households inadequately housed in the existing stock, together with new need arising from existing and additional households during the next five year period. It involves estimating the amount of affordable accommodation required, which may be in either the existing stock or new stock.
4.33 The Stratford-on-Avon SHMA Update (Jan 2013) estimates that the total affordable housing need between 2012 and 2017 totals 3,301 households, comprising a backlog of 351 households, 2,074 newly forming households, and 876 existing households falling into need. Of the total, 1,470 are expected to be housed in existing affordable housing becoming available during the period, giving a total net requirement for households in need of additional affordable housing of 1,831 dwellings, an average of 366 per annum. If this requirement had all to be met in the form of new affordable housing, as defined in the NPPF, this would constitute a very high and almost certainly unachievable percentage of all housing to be built during the five year period, under all the supply scenarios currently under consideration. However, the SHMA points out that in practice a significant portion of households in need are housed in the private rented sector, supported by Local Housing Allowance. It estimates that this sector could release accommodation for some 1,192 households in need over the five year period.
4.34 As no element of the private rented sector is included within the NPPF’s definition of affordable housing, the SHMA does not include this sector in its estimate of available supply to meet affordable housing need. However, the DCLG Guidance on preparing a SHMA (2007) clearly expects the private sector contribution to be taken into account in setting policies on affordable housing. The SHMA Update indicates that the actual demand for properly defined affordable housing is likely to be far lower than the 1,831 total estimated and concludes that ‘the housing needs analysis per se does not provide a strong basis for considering overall future housing requirements’.
4.35 We agree with this statement and take the view that estimates of affordable housing need should not be used as an overriding element in assessing total housing requirements in SoAD. It should also be borne in mind that affordable housing

ENVIRONMENTAL RESOURCES MANAGEMENT STRATFORD-ON-AVON DISTRICT COUNCIL
33
need is only assessed for a five year period and not for the whole local plan period from 2008 to 2028.


ENVIRONMENTAL RESOURCES MANAGEMENT STRATFORD-ON-AVON DISTRICT COUNCIL
35
5 EMPLOYMENT-BASED ASSESSMENTS OF HOUSING REQUIREMENTS
PRINCIPLES
5.1 An alternative approach to assessing housing requirements on the basis of potential trends in in-migration is to consider the demands that may be placed on the district’s housing supply by economic development. Job growth in and around SoAD may be held to generate a demand for labour, some of which may be most appropriately met within the district and thus potentially place additional demands on the district’s housing stock. The HPOS and Update pursue this approach as an extension to their demographic model, through their ‘economic driven population projections’.
5.2 There is a further implication that if a Local Plan does not provide fully for such housing, the district may not achieve its full economic potential. It thus may fail to meet the NPPF’s expectation that planning should ‘encourage and not act as an impediment to sustainable growth’ and that ‘significant weight should be placed on the need to support economic growth through the planning system’ (Para 19).
5.3 In order to assess the potential labour force and hence level of housing that might be required, the HPOS and Update draw on independently produced forecasts of jobs for the West Midlands districts and estimate how many of these might be taken up by the resident workforce in SoAD. We need to examine the methodology and assumptions of the models which produce these forecasts and consider to what extent their outputs of job forecasts and labour demand are reliable and appropriate for deriving estimates of housing requirements. There are four key questions: 1. do these models represent realistic assessments of potential future job numbers
in SoAD and nearby districts? 2. are the assumptions on allocating the workforce for these jobs to residence in
SoAD appropriate? 3. are the assumptions on converting labour demand to households appropriate? 4. should the resident labour force projected in this way be considered part of
SoAD’s ‘full housing need’? JOB FORECASTS
5.4 The HPOS uses the output from two econometric models of the West Midlands economy: the West Midlands Integrated Policy Model (IPM) prepared for the WMRA by Cambridge Econometrics, and Experian’s Regional Planning Service Model. These models aim to project the future level of economic activity in an area or region based on the structure of the economy at the start date and the prospects for growth or decline in its constituent sectors, given core national or regional macro-economic forecasts of aggregate output, expenditure, income and employment. They then convert the level of economic activity in the various sectors into jobs. The resulting numbers and distributions of jobs under any particular
ENVIRONMENTAL RESOURCES MANAGEMENT STRATFORD-ON-AVON DISTRICT COUNCIL
36
scenario are taken to represent a plausible pattern of jobs given the input assumptions. It should be borne in mind, however, that these are ‘policy off’ models, in that the projections of job numbers take no account of the capacity of the districts to accommodate the job numbers or labour force required to man them. IPM Model
5.5 The IPM Model was originally designed to handle the interactions between economy, demography and housing in the West Midlands and thus to derive a ‘balance’ of housing and jobs that would tie in with its econometric forecasts. However, the 2010 model run used in the HPOS and HPOS Update was a baseline projection which generated job numbers only. It was based on Cambridge Econometrics' views on the prospects for the various local areas in the West Midlands, including SoAD. This typically reflected the employment change of the previous decade for each sector and local area. The outcome for all local areas in the West Midlands was constrained to Cambridge Econometrics' views on prospects for the region as a whole. We have ascertained that the baseline projection does not incorporate any assumptions about the future scale and distribution of population, which might have led to a higher than justified projection of the population-related component of job growth.
5.6 The IPM job projections were produced by a model run in 2010. We have not had access to the specific macro-economic and sectorial assumptions underlying them. The model generates job numbers at five year intervals from 2008 to 2028. It shows a decrease in employment in SoAD and the other West Midlands Authorities over the period from 2008 to 2013 and a modest increase over the remainder of the period to 2028. However, the forecast job numbers in 2028 do not recover to 2008 levels, indicating a 1,950 job decrease over the whole period.
5.7 GL Hearn considered that the forecast reduction in labour demand for SoAD of over 5,000 jobs between 2008 and 2013 did not tally with data on the actual labour market situation in SoAD, which suggested that employment levels were holding up better than expected during the early years of the recession. They therefore made a significant adjustment to the IPM job forecast, reducing the job loss in the 2008 to 2013 period from around 5400 to 1000, while retaining the job increase figures for the following fifteen year period to 2028, totalling 3,500. This gives a total job increase over the period 2008 to 2028 of 2,500, compared with a decrease of nearly 2,000 in the original IPM projections.
5.8 In our view, the need for this significant adjustment draws into question the validity of the IPM job forecasts for the longer term. It is not possible to tell to what extent the model’s forecast job growth rates from 2013 onwards were coloured by a view from 2010 of how deep the recession was likely to be. Cambridge Econometrics’ long term view of economic prospects appears to have been built on assumptions about the rate of recovery from that recession as much as on any assessment of long term growth potential.

ENVIRONMENTAL RESOURCES MANAGEMENT STRATFORD-ON-AVON DISTRICT COUNCIL
37
Experian Model
5.9 The Experian Model works on broadly similar principles to the IPM as far as job forecasts are concerned. It uses a version of the National Institute of Social and Economic Research’s national model to provide a core macroeconomic forecast of the UK economy. This is then split into industries, sub-sectors and regions, with output forecasts for these converted into forecast employment by sector, using wage forecasts. However, unlike the IPM, the Experian Model at the local level is also driven by population projections. The unconstrained ONS population projections for each district are fed into the model and drive the employment and output figures at district level. If the ONS projections were to be considered unreasonably high, their use in this way to derive housing requirements to support the job numbers could lead to some extent to a self-fulfilling prophesy.
5.10 The job numbers from the Experian Model are from a model run in November 2012. This shows a gradual increase in job numbers over each five year period from 2008 to 2028. The total increase over the whole period is 6,200, half of which is projected to occur between 2013 and 2018. The Experian Model clearly shows a more positive prospect for long term job growth in SoAD than the IPM, which was run two years earlier. However, it is difficult to know how much of this is due to differences in the two model’s methodologies and assumptions and how much to a more optimistic outlook.
5.11 GL Hearn assessed the reasonableness of the Experian SoAD forecast by comparing the GVA forecasts it embodies for SoAD with those modelled by Experian for Warwickshire, the West Midlands and the UK. They found that the levels of GVA growth in SoAD over the various stages of the plan period are broadly compatible with those for the West Midlands. However, this result was likely to arise given that the GVA forecasts are being taken from the same model, using many of the same input assumptions. The Experian projections would be more convincingly validated if they were to be compared with forecasts derived from an alternative widely recognised source. For example, the rate of job growth of 5.1% between 2012 and 2018 forecast for SoAD by Experian may be compared with the rate of employment growth nationally of 3.4% for the same period given in the latest ‘Economic and Fiscal Outlook’ report of the Office for Budget Responsibility (March 2013). Conclusions on job forecasts
5.12 The HPOS Update recommends that the housing requirement for SoAD for the 2008 to 2028 plan period should be set at between 11,000 and 13,000 dwellings, which are the housing numbers derived from the job forecasts of the IPM and Experian models respectively. Using either of these as a basis for setting long term housing requirements in the Local Plan would require a high level of confidence in the forecasts, as representing the level of jobs likely to be realised in SoAD. It is important to bear in mind the general limitations of such econometric models as direct guides to policy:
ENVIRONMENTAL RESOURCES MANAGEMENT STRATFORD-ON-AVON DISTRICT COUNCIL
38
1. they are not intended to be used to set targets to be met by policy; 2. they are ‘policy off’ and therefore assume into existence the capacity to
accommodate the jobs and their workforce; and 3. the output from these models is wholly dependent on their input assumptions,
changing any of which may change the output significantly.
5.13 We consider that the size of the disparity between the two sets of job forecasts presented in the HPOS Update is a matter of concern, which indicates how volatile such forecasts are, especially in the current economic climate. We therefore seriously doubt the wisdom of using either forecast in setting and justifying the recommended housing numbers in the report. This view has been endorsed in recent Inspectors’ reports on Core Strategies, as set out in the example below. In the recent Inspector’s Report on the Winchester District Plan (Feb 2013), which was found to be ‘sound’, the Inspector commented on a number of proposals for higher housing numbers which ‘rely on a specific level of future job growth being required’. He continued: ‘they are essentially based on the premise that the only way of meeting that job growth over the plan period is through increased in-migration that would require extra housing’. The Inspector went on to state that ‘demographic based projections, largely based on ONS and DCLG methods,... are less dependent on job forecasts and labour force projections that are inherently difficult to produce and affected by many uncertainties in the longer term’.
5.14 GL Hearn are also clear about weaknesses of this approach to assessing housing requirements. In Para 2.34 of the HPOS Update, they ‘advise that the employment-based projections are treated with some caution, not least because of the dynamic nature of labour markets which cross administrative boundaries, the multiple assumptions which are necessary to inform the modelling and the accuracy of employment forecasts, particularly at the current time. The recent double-dip recession and uncertainty regarding the nature and pace of recovery effect the error margin associated with any long-term forecasting’.
COMMUTING ASSUMPTIONS
5.15 Once the forecast distribution of jobs among districts has been adopted, the next step in the HPOS and its Update was to estimate how many of these jobs are likely to be taken up by residents of SoAD, based on likely levels of commuting between districts. The thinking is that the workforces of different districts show varying ‘propensities to commute’. In the case of SoAD, for example, the regional workforce, particularly in certain occupations which procure incomes allowing the choice, may consider it a more desirable place of residence than other places closer to where job opportunities are available, leading to a preference for living there and commuting to work elsewhere. These ‘propensities’ are then assumed to remain stable over time.
5.16 In the HPOS Reports, the propensity to commute is assumed to be represented by the percentage of the jobs in any district taken by workers resident in SoAD in 2001, as indicated by the 2001 Census. For example, in 2001 SoAD residents took up 64%
ENVIRONMENTAL RESOURCES MANAGEMENT STRATFORD-ON-AVON DISTRICT COUNCIL
39
of the jobs in SoAD, 9.4% of those in Warwick, 5% of those in Redditch etc. These percentages are then assumed to remain stable over the period from 2001 to 2028 and are thus applied to the numbers of jobs in the relevant districts forecast by the econometric models (IPM/Experian), to generate estimates of the demands placed by those districts on the workforce living in SoAD. For example, a forecast net increase of 2,000 jobs in SoAD would generate a demand for 64% of the additional workers (i.e. 1,280) to live in SoAD, the remaining 720 additional workers being assumed to commute into SoAD from outside the district. Similarly, a forecast net increase of 2,000 jobs in Warwick would generate a demand for 188 additional workers living in SoAD.
5.17 It should be noted that while the percentage of local jobs taken by the local workforce is assumed to remain constant, the percentage of the local workforce who take local jobs will vary according to the relative rates of increase in jobs and workforce and the relative rates of increase of jobs in different districts.
5.18 The assumption on constant commuting rates to jobs in each district at 2001 levels raises two sets of questions. First, how stable is the commuting pattern which existed in 2001? The tables on journey to work from the 2011 Census are not due to be released until later in 2013, so the validity of the 2001-based assumptions for the present day cannot yet be tested thoroughly, although, using data from the 2008 Annual Population Survey, GL Hearn found evidence of little change to 2001 commuting patterns by that date (HPOS Para 5.12).
5.19 Secondly, would it be appropriate to provide through housing allocations for the continuation of such a commuting pattern over the long term even if it turned out to be still valid today? A number of factors may alter commuting patterns in the future. These include the increase in home-based work, policy measures to reduce longer distance travel, life style changes favouring a shorter work journey especially on foot or by cycle, etc. It is more sustainable to co-locate jobs and workforce as far as possible in order to minimise the need for long journeys to work (NPPF Para 37). To provide housing in order to maintain SoAD residents’ 2001 share of the workforce of external districts would seem to ignore and potentially undermine this objective.
5.20 The use of the 2001 commuting pattern, as explored in HPOS and its Update, to determine the required resident labour force in SoAD and thereby calculate the district’s total housing requirements involves applying a set of historic fixed ratios to a job distribution forecast. It treats non job-related migration as a fixed residual whereas it has in fact its own dynamics. This practice has been strongly criticised by the Inspector’s Report on the Bath and North East Somerset Core Strategy, as noted below.

ENVIRONMENTAL RESOURCES MANAGEMENT STRATFORD-ON-AVON DISTRICT COUNCIL
40
The Inspector examining the Bath and North East Somerset (BANES) Core Strategy, in his ‘Preliminary Conclusions’ (June 2012) strongly criticised that authority’s approach to assessing its housing requirement on the basis of an assumed constant relationship between housing and employment growth. Although the method followed by BANES was not the same as that followed in the HPOS economic-driven projections, several of the Inspector’s criticisms are equally applicable. He did not accept that it was reasonable to give overriding primacy to a linear link between homes and jobs in determining housing requirements, especially in a district which is ‘an attractive place to live and attracts people who are not economically active’. He was particularly concerned that the multiplier used was a fixed ratio that did not actively consider the non-job-related element of housing demand. He found it ‘difficult to see why the ratio between such past trends should be a sound model for the appropriate relationship between jobs and housing over the long term, given the undoubted changes to the economy that have and will take place to 2026’.
RELATING RESIDENT LABOUR FORCE CHANGE TO DWELLING NUMBER REQUIREMENTS
5.21 In order to convert the local labour force into total dwelling number requirements, GL Hearn adjusted the population structure from their demographic projections to derive numbers of persons of working age that would generate the relevant job numbers for each economic-driven projection. This involves effectively applying linear relationships between total population, population of employment age and population in employment) to explore the implications of different job forecasts on population and hence households and housing. An example of these relationships from HPOS is shown in Figure 5.1. This shows change in housing requirement graphed against change in employed persons for all the projections in the HPOS Update, the result being a linear relationship by which the housing requirement equals around 0.68 times the change in employed persons plus 9,450 (the net additional dwellings required to house a population that will keep employment constant at 2008 levels).
ENVIRONMENTAL RESOURCES MANAGEMENT STRATFORD-ON-AVON DISTRICT COUNCIL
41
Figure 5.1 Housing requirement by change in employed residents
Source: ERM, derived from HPOS Update
PROJECTED RESIDENT WORKFORCE AS A BASIS FOR ASSESSING HOUSING
REQUIREMENTS
5.22 The fundamental question is whether the job forecasts and commuting assumptions
used in HPOS and the Update to demonstrate the employment implications of the various housing projections offer a justifiable basis for determining policy on the location of new housing. In other words are the workers allocated to SoAD necessarily a part of ‘full housing need’? Clearly workers who are needed to take up any net additional jobs in any district must be housed somewhere in the region but it is not self-evident that net new jobs outside SoAD generate a particular level of demand for labour that needs to be satisfied by the provision of the equivalent level of additional housing in SoAD. Nor can it be assumed that the other district council areas to which workers commute from SoAD will plan for, or provide, the number of jobs forecast in SoADC’s job forecasts.
5.23 The IPM/Experian models seek to simulate plausible levels and distributions of jobs in the region and the GL Hearn reports convert these into a plausible number of workers living in SoAD. The various population and housing scenarios explored in the Hearn and Pegasus Reports set out combinations of levels of in-migration, labour demand and housing provision which appear to function well together because they maintain the relationships embodied in their models’ various input assumptions. This does not mean that if their particular combinations of dwelling numbers and job numbers were to arise in practice that the socio-economic system would necessarily function in the way envisaged in the scenario. Neither is it the case that the provision of the ‘required’ number of new dwellings will necessarily result in the level of job growth forecast, on which that number was based.

ENVIRONMENTAL RESOURCES MANAGEMENT STRATFORD-ON-AVON DISTRICT COUNCIL
42
5.24 The GL Hearn studies recognise that there are various ways in which the same distribution of housing and jobs may function, especially by bringing into play different patterns of migration and commuting from those envisaged in the models. Some of the other patterns that may arise may not have desirable implications for the sustainable development objectives in the district. New dwellings, envisaged in the GL Hearn projections as housing 64% of the workforce required to man net additional jobs in SoAD and as well as a range of fixed percentages in external districts, may in practice be occupied by further households in the retired age group or may feed the take up of further second homes in the district. It would be unwise to plan for high levels of housing in order to correct projected ‘imbalances’ in the labour market, since there is no way of ensuring this would be the outcome.
5.25 Another reason why a ‘balanced’ set of forecasts in one district may not in practice play out as envisaged is that the commuting and migration patterns between nearby districts interlock. The balance within one district depends on a balance being achieved between districts. The Local Plans for the other districts will need to make provision for housing and jobs in a way that complies with the distributions projected for SoAD. This level of coordination, however, is unlikely to be achieved by LPAs which are developing their Local Plans for different periods and on different timescales, and choosing the scale of their housing and employment allocations according to findings from their own evidence bases3. The NPPF’s ‘duty to cooperate’ may go some way to bringing Local Plans for neighbouring areas into line with each other, but this is unlikely to be stretched to the regional level at which a wider balance can more properly be aimed for.
5.26 Our conclusions are that, for all of the reasons set out above, the ‘economic-driven’ projections in the HPOS and its Update do not offer a reliable approach to assessing housing requirements in the district.
3 The Warwick Local Plan Preferred Option (May 2012) sets housing provision at 10,800 dwellings between 2011 and 2029, compared with a total requirement of 11,900 estimated in the district’s SHMA (March 2012). The Bromsgrove Draft Core Strategy 2 (January 2011) sets housing provision at 4,000 dwellings between 2006 and 2021, compared with a total requirement of 7,350 estimated in the district’s SHMA (October 2008).

ENVIRONMENTAL RESOURCES MANAGEMENT STRATFORD-ON-AVON DISTRICT COUNCIL
43
6 REGIONAL STRATEGY ASSESSMENTS OF HOUSING REQUIREMENTS
6.1 In Section 3, we contrasted the NPPF trend-based approach to assessing housing requirements with the policy-based approach followed by the Regional Spatial Strategies (RSSs) by which housing targets were agreed through a process of coordinated negotiation among local authorities. The West Midlands Regional Spatial Strategy (WMRSS) proposed a basic housing requirement figure below what is likely to be the ‘objectively assessed housing need’ for SoAD.
6.2 All of the RSSs have now been revoked, the formal decision to revoke the WMRSS having been made on the 27 March 2013. However, although the WMRSS no longer carries weight as a formal basis for local planning, its evidence base and reasoning may still have validity where they have not been superseded.
6.3 In the West Midlands, the RSS context is complicated by the fact that the process of revising the strategy was halted before a fully revised version, including district housing targets, could be adopted. The Phase 2 Revision, which does present such figures, although not adopted, nevertheless went through an examination and the Panel’s report on it was published in Sept 2009.
6.4 The West Midlands RSS developed a strategy to reverse the continuing decline of the region’s Main Urban Areas (MUAs) by a new emphasis on urban renaissance, focussing development and regeneration in the MUAs and stemming the loss of population and jobs to the shire areas by limiting development there. The RSS Preferred Option included a housing requirement for SoAD of 5,600 dwellings for the period 2006 to 2026. This was contrasted in the Panel Report with figures of demand and need for the district from various sources ranging from 9,500 to 14,400 dwellings.
6.5 The Panel Report concluded that the figure for SoAD should be increased from 5,600 to 7,500 dwellings over the period, and further study should be undertaken in the context of a Core Strategy Review on the potential provision of an additional 2,500 to 3,000 dwellings during the 2021-26 period. Had this additional housing requirement been adopted, the total RSS housing figure for SoAD for the whole period 2006 to 2026 would have increased to between 10,000 and 10,500.
6.6 The Panel Report proposed the following housing figures for the period 2006 to 2026 for planning areas in the MUAs of the West Midlands: 1. Birmingham - 57,500 dwellings 2. Black Country - 63,000 dwellings 3. Solihull - 10,500 dwellings 4. Coventry - 33,500 dwellings (of which 3,500 in each of Nuneaton and Bedworth,
and Warwick)
ENVIRONMENTAL RESOURCES MANAGEMENT STRATFORD-ON-AVON DISTRICT COUNCIL
44
6.7 Of these MUAs, only Birmingham and Solihull are significant sources of in-migration to SoAD, the type of migration flow the RSS housing policies are aimed at stemming, with 170 and 120 net in-migrants respectively in the years to June 2010 and 2011, according to ONS internal migration data. The net in-migrants from Coventry to SoAD were only 40 in both years.
6.8 Reliance could only be placed on the RSS policy approach as a justification for adopting the RSS housing requirement figures for SoAD, if the other LPAs in the region were seeking to support that approach by adopting the figures recommended for them by the Panel. So far, of the four MUAs, only the Black Country has an adopted Core Strategy and this provides for the number of dwellings required by the WMRSS. Solihull also appears likely to include housing figures around the RSS level in its Local Plan. Its Submission Local Plan (Sept 2012), currently under examination, sets a housing requirement of 11,018 for the period 2006-28 and endorses the ‘long term urban renaissance strategy developed through the Regional Spatial Strategy’.
6.9 However, two of the key MUA authorities, Birmingham and Coventry, are not seeking to base their Local Plan housing numbers on the RSS principle of accommodating substantial housing to support the vision of an urban renaissance. Birmingham City Council has recently been consulting on Options for its Development Plan for the period 2011 to 31. This is seeking accommodation for 80,000 new households but has so far identified capacity for only 50,000 dwellings within the City boundary. Coventry’s Proposed Submission Core Strategy (July 2012) set its housing requirement at 11,373 dwellings, well below the 26,500 sought within the City boundary in the RSS Phase 2 Revision. This plan was recently withdrawn after the Inspector found that the ‘duty to cooperate’ with neighbouring authorities had not been properly complied with.
6.10 In the absence of any comprehensive agreement among the main urban and the shire authorities to adopt the RSS figures, the policy position of the RSS is no longer relevant to the setting of SoAD’s housing requirement.
ENVIRONMENTAL RESOURCES MANAGEMENT STRATFORD-ON-AVON DISTRICT COUNCIL
45
7 POSSIBLE CAPACITY LIMITS ON MEETING HOUSING REQUIREMENTS
LAND AVAILABILITY
7.1 The NPPF accepts that there may be situations in which a lack of physical capacity to accommodate housing may prevent an LPA from meeting the whole of its assessed housing need (Para 179). The types of development constraints recognised by the NPPF include tight administrative boundaries, flood risk, land instability, contamination and subsidence, or major conservation designations including National Parks, Areas of Outstanding Natural Beauty and European Protected Sites. Only an authority like Eastbourne, with much of its area is subject to high flood risk or to strong environmental designations, can successfully argue a case based on a shortfall in housing land availability (Eastbourne Core Strategy, IR October 2012).
7.2 It is difficult to argue that development constraints in SoAD, where only a small area in the south of the district falls within an Area of Outstanding Natural Beauty, place clear limits on the scale of potential housing development in the district. The Strategic Housing Land Availability Assessment (SHLAA) (2009) has recently been updated (Feb 2013) to give an assessment of the potential housing supply for the period 2008 to 2028.
7.3 The SHLAA Update shows a total capacity of some 8,700 potential dwellings comprising completions to 2013 (927 dwellings), planning permissions (1783 dwellings), a windfall estimate for the period 2019 to 28 (650 dwellings), and sites which are available, suitable and achievable (5,350 dwellings), although the latter may not necessarily be well distributed between settlements. However, the previous SHLAA identified capacity for a further 9,000 dwellings on sites where policy modification would be required. The possibility that, if required, further development opportunities could be identified, for example, for an urban extension or a new settlement, cannot be ruled out absolutely. TOURISM ECONOMY AND ENVIRONMENTAL CHARACTER
7.4 SoADC, at the Shottery Appeal, argued that in recommending a housing figure in the 11,000 to 12,000 range in the HPOS, GL Hearn had not taken sufficient account of the economic value of tourism to the district and pressed the need to limit housing development in order to preserve the special character of the district, given its role in supporting the tourism economy. The Inspector, backed by the Secretary of State, concluded on this point that while there might be some degree of adverse effect on tourist numbers, ‘a potential harmful economic outcome has not been sufficiently established or quantified for this to be given other than very limited weight’.
7.5 Tourism is very important to SoAD’s economy. The Stratford-on-Avon Destination Tourism Strategy 2011-2015 states that the district attracts 4.9 million visitors a year with a total annual tourism spend of £335 million, of which £198.6 million are

ENVIRONMENTAL RESOURCES MANAGEMENT STRATFORD-ON-AVON DISTRICT COUNCIL
46
generated by overnight visits and £136.7 million by irregular day trips. Tourism provides around 6,300 direct tourism related jobs and an additional 1,700 indirect and induced jobs. The vast majority of current tourism activity is concentrated in the town of Stratford-upon-Avon, although the Draft Core Strategy, under Policy CS 24, sought to disperse new attractions throughout the district.
7.6 The case for limiting housing development in the district below the estimated ‘full objectively assessed’ demand level in order to protect/enhance the tourism economy is not strong. It would involve demonstrating that further increments of housing development beyond the Draft Core Strategy figure of 8,000 dwellings would be likely to have a sufficiently detrimental impact on the character of the district to threaten significantly the scale and further potential of tourism. This causal link is extremely difficult to demonstrate, especially given Stratford-upon-Avon’s primacy in the district as a ‘destination’ and the extent of day visitor as against longer stay income. It is worth noting that we have not found a tourism/character case argued in other districts, even those such as Cornwall, which enjoy a strong tourism economy, based on a high quality environment.

ENVIRONMENTAL RESOURCES MANAGEMENT STRATFORD-ON-AVON DISTRICT COUNCIL
47
8 EMPLOYMENT AND HOUSING REQUIREMENTS
8.1 Para 19 of the NPPF states that: ‘Planning should operate to encourage and not act as an impediment to sustainable growth. Therefore significant weight should be placed on the need to support economic growth through the planning system’. It therefore needs to be demonstrated that any suggested level of new housing provision would not act as an impediment to sustainable growth, so we need to consider the implications of housing provision for the employment situation in SoAD. The extent to which higher housing provision options would ‘support the economy’ was one of the factors emphasised by GL Hearn in making their recommendations on housing numbers in the HPOS Sustainability Assessment and was reiterated by Pegasus in their consultation response to the Draft Core Strategy.
8.2 We have confirmed that the HPOS Update represents a plausible model of how population in SoAD would be likely to change as a result of natural change combined with varying levels of in-migration. The outcomes in terms of the age structure of the total population are therefore also valid. HPOS and its Update apply assumptions on age specific employment rates to the age structure of the total population to calculate the likely number of economically active people. GL Hearn have examined recent trends in the total employment rate (the proportion of residents aged 16 to 64 in employment) over the past decade. After standing at around 80% for much of the 2000s, the rate decreased from 2010 to around 75% in 2011/12. They expect a recovery and the HPOS Update assumes the rate will be back at around 80% by 2028. This is a reasonable assumption which sets a control for the age-related employment rates adopted.
8.3 Natural change is towards an ageing population in SoAD, so the number of resident workers would be expected to decrease if there were to be no further incoming people of working age. The HPOS Update shows, in PROJ 5, the zero net in-migration scenario, that the working population would be expected to decrease by around 10,000 (from a 2008 starting figure of 62,300), while the total population would decrease by nearly 4,000. Because of decreasing household size, provision of 2,500 additional dwellings would still be required.
8.4 Under the NPPF, provision needs to be made to accommodate housing demand arising from net in-migration, as discussed in Section 4. We suggested, in Section 4, that a net in-migration figure of 1,000 per annum would be a robust assumption, derived from in-migration levels in recent years, and this would imply housing provision of around 9,000 net additional dwellings (including 2,500 dwellings to maintain the existing population, as noted in Para 4.31). This seems likely to lead to a small decrease in resident worker numbers compared with the 2008 level, as the output from HPOS Update PROJ 6, the zero employment growth scenario, generates a requirement for 9,450 dwellings.

ENVIRONMENTAL RESOURCES MANAGEMENT STRATFORD-ON-AVON DISTRICT COUNCIL
48
8.5 SoAD does not necessarily need to provide additional new housing above 9,500
dwellings in order to generate or attract new jobs. Rather, as GL Hearn point out in Para 5.13 of the HPOS, further job increases in the district could give rise to higher levels of commuting into the district from neighbouring authorities or reductions in out-commuting, or most probably a combination of the two. This view is supported by the Inspector in the Winchester Local Plan who stated that ‘new jobs do not necessarily have to be filled by in migrants, given alternative sources such as lower local unemployment, later retirement and increased activity rates, including amongst the elderly/recently retired, as well as improved skills and training’ (Winchester City Council District Local Plan, IR July 2012).
8.6 Over the past decade, as job numbers in SoAD have increased from around 60,000 in 2001 to over 68,000 in 2010 (according to NOMIS) there has been a changeover from net out-commuting to net in-commuting. The 2001 Census showed net commuting out of SoAD of nearly 4,000. There is no direct data on commuting levels since then and the commuting tables from the 2011 Census are not due to appear until later this year. However, the NOMIS Official Labour Market Statistics show the number of jobs has exceeded the number of residents in employment at least since 2005, indicating net in-commuting rising from around 8,000 in 2005 to around 12,000 in 2007 and 2008, but returning to 8,000 in 2010, the latest year for which these data are available.
8.7 The net in- or out-commuting flow is not the most significant measure of commuting as it is the resultant of much larger in and out flows. For example, in 2001, the net out-commuting figure of 3,750 was equivalent to only 17% of the 22,600 total out-commuters. At present and until the commuting data from the 2011 Census are released we have no clear information on the total flows of commuters into and out of the district. In any case it needs to be borne in mind that the district does not form a well-defined journey to work catchment. Much of the commuting in and out is over relatively short distances across the borders of neighbouring districts. A high level of “self sufficiency” in jobs may not be an optimum arrangement and therefore not an objective worth striving for.
8.8 As noted in the Draft Core Strategy: ‘Generally, those commuting out of the District to work are more highly skilled than those commuting into the area. This is more likely to reflect the high levels of skills in the resident population than a deficit in highly skilled jobs within the District’. The Council has a sustainable Business and Enterprise Strategy (2012) which aims to enable SoADC ‘to become a place where business and enterprise can flourish’. The Draft Core Strategy (Para 9.7.15) sees opportunities for investment by the high technology sector given the district’s accessible location and considers that encouraging new jobs in this sector would “help to address the loss of traditional employment, reduce the amount of out-commuting and maintain the District’s economic competitiveness”.
8.9 Thus there is a good case for encouraging additional high order jobs without at the same time encouraging significant further in-migration. A housing requirement figure of 9,500 to 10,000 net additional dwellings would be sufficient to maintain the current number of employed residents over the period to 2028 and thus be seen to

ENVIRONMENTAL RESOURCES MANAGEMENT STRATFORD-ON-AVON DISTRICT COUNCIL
49
be in line with the Council’s sustainable Business and Enterprise Strategy. There is a good case for not setting the figure higher than this at a time when the net job growth outlook is still very uncertain and there would be the risk of further unbalancing the population of the district by attracting a high proportion of retired in-migrants and out commuters.

ENVIRONMENTAL RESOURCES MANAGEMENT STRATFORD-ON-AVON DISTRICT COUNCIL
51
9 CONCLUSIONS AND RECOMMENDATIONS
9.1 We have assessed the adequacy of the evidence base for setting Local Plan housing requirements. The HPOS Update incorporates in its assumptions the most recent data and its underlying projection method provides a good tool for exploring the impact of natural population change and different levels of net in-migration on future housing requirements. However, its recommendations depend too heavily on unreliable economic projections. The Chelmer Model output is out of date and uses some doubtful assumptions so the results obtained by Pegasus can be set aside.
9.2 Despite the sound planning logic that underpinned the RSS, there is no longer a sufficient consensus among the key urban authorities in the West Midlands for reliance to be placed on the policy approach set out the RSS Review.
9.3 ‘Economic-driven’ projections of housing requirements mainly based on job
forecasts do not offer a reliable approach to assessing housing requirements in the district. Reliance cannot be placed on either a land availability argument nor on the risk to the tourism economy or character of the District as justifications for setting housing requirements.
9.4 To meet the provisions of the NPPF, a sustainable housing requirement figure for SoAD should be based on an informed view of recent and likely future in-migration. A figure of 1,000 net in-migrants per year would be a robust assumption to adopt in projecting housing requirements over the medium to long term. When added to the housing needed to cater for natural increase and changes in household structure, this would equate to a housing requirement of around 9,000 dwellings over the period 2008 to 2028.
9.5 However, in setting the housing requirement in the Local Plan, SoADC must present a coherent policy position, which takes account of the Council’s sustainable Business and Enterprise Strategy, which seeks to increase the local retention of highly skilled labour and facilitate growth in the local economy. It would therefore be appropriate to ensure sufficient housing provision to at least maintain the current number of employed residents over the period to 2028.
9.6 In our view, in order that the Local Plan can be found to be ‘sound’, SoADC should set a housing requirement of between 9,500 and 10,000 dwellings for the Local Plan period. There is a good case for not setting the figure higher than this at a time when the net job growth outlook is still very uncertain and there would be a risk of further unbalancing the population of the district by attracting a high proportion of retired in-migrants and out commuters. On the other hand, a figure lower than this range would be open to the criticism that it would not be aiming to meet the full objectively assessed need for housing in the district.


Annex 1
Main Outputs From Migration Related Model Runs

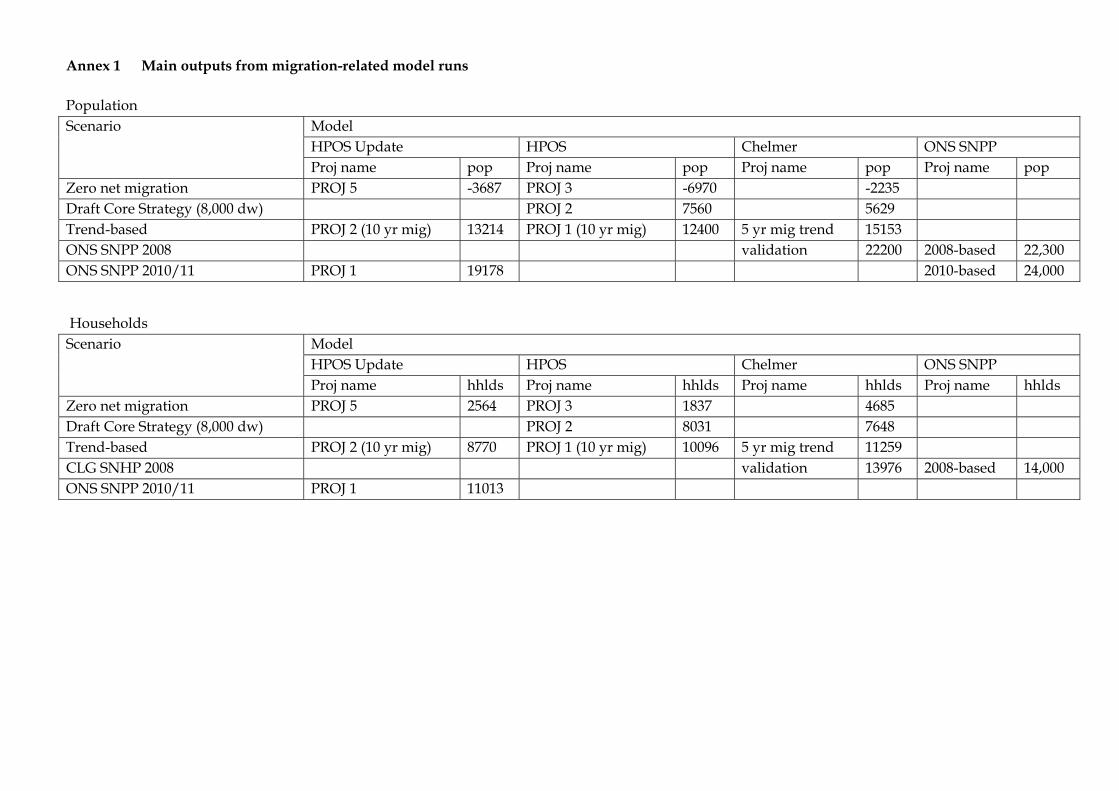
Annex 1 Main outputs from migration-related model runs Population Scenario Model
HPOS Update HPOS Chelmer ONS SNPP Proj name pop Proj name pop Proj name pop Proj name pop
Zero net migration PROJ 5 -3687 PROJ 3 -6970 -2235 Draft Core Strategy (8,000 dw) PROJ 2 7560 5629 Trend-based PROJ 2 (10 yr mig) 13214 PROJ 1 (10 yr mig) 12400 5 yr mig trend 15153 ONS SNPP 2008 validation 22200 2008-based 22,300 ONS SNPP 2010/11 PROJ 1 19178 2010-based 24,000 Households Scenario Model
HPOS Update HPOS Chelmer ONS SNPP Proj name hhlds Proj name hhlds Proj name hhlds Proj name hhlds
Zero net migration PROJ 5 2564 PROJ 3 1837 4685 Draft Core Strategy (8,000 dw) PROJ 2 8031 7648 Trend-based PROJ 2 (10 yr mig) 8770 PROJ 1 (10 yr mig) 10096 5 yr mig trend 11259 CLG SNHP 2008 validation 13976 2008-based 14,000 ONS SNPP 2010/11 PROJ 1 11013

Dwellings Scenario Model
HPOS Update HPOS Chelmer ONS SNPP Proj name dw Proj name dw Proj name dw Proj name hhlds
Zero net migration PROJ 5 2500 PROJ 3 1880 4900 Draft Core Strategy (8,000 dw) PROJ 2 8230 8000 Trend-based PROJ 2 (10 yr mig) 8989 PROJ 1 (10 yr mig) 10350 5 yr mig trend 11777 CLG SNHP 2008 validation 14619 2008-based 14,359 ONS SNPP 2010/11 PROJ 1 11288 Household size Scenario Model
HPOS Update HPOS Chelmer ONS SNPP Proj name dw Proj name dw Proj name dw Proj name hhlds
Zero net migration PROJ 5 2.14 PROJ 3 2.10 2.07 Draft Core Strategy (8,000 dw) PROJ 2 2.13 2.10 Trend-based PROJ 2 (10 yr mig) 2.20 PROJ 1 (10 yr mig) 2.13 5 yr mig trend 2.14 CLG SNHP 2008 validation 2.16 2008-based 2.16 ONS SNPP/SNHP PROJ 1 2.22


ERM consulting services worldwide www.erm.com
ERM has over 140 offices across the following countries worldwide
Argentina New Zealand Australia Panama Belgium Peru Brazil Poland Canada Portugal China Puerto Rico Colombia Romania France Russia Germany Singapore Hong Kong South Africa Hungary Spain India Sweden Indonesia Taiwan Ireland Thailand Italy The Netherlands Japan United Arab Emirates Kazakhstan United Kingdom Korea United States Malaysia Vietnam Mexico www.erm.com