review of normal probability distribution · 2018-05-07 · qmis 220, by dr. m. zainal chap 6-3...
TRANSCRIPT

Business Statistics
Chapter 6
Review of Normal
Probability Distribution
Department of Quantitative Methods & Information Systems
Dr. Mohammad Zainal QMIS 220

QMIS 220, By Dr. M. Zainal Chap 6-2
Chapter Goals
After completing this chapter, you should be
able to:
Convert values from any normal distribution to a standardized z-score
Find probabilities using a normal distribution table
Apply the normal distribution to business problems

QMIS 220, By Dr. M. Zainal Chap 6-3
Probability Distributions
Continuous
Probability
Distributions
Binomial
Hypergeometric
Poisson
Probability
Distributions
Discrete
Probability
Distributions
Normal
Uniform
Exponential
Ch. 5 Ch. 6
Chap 6-4
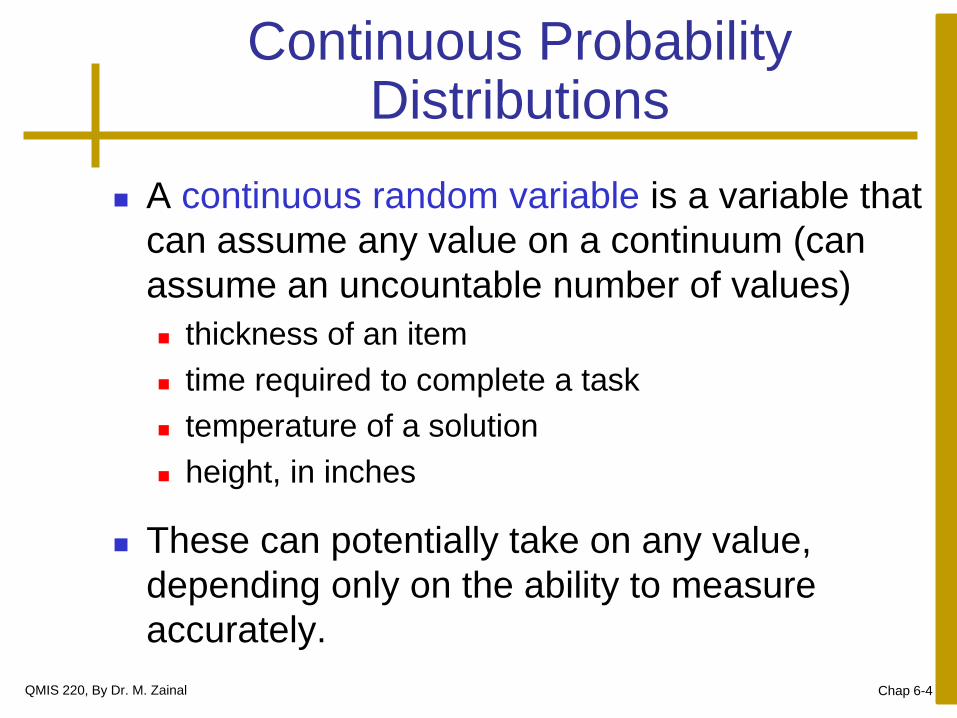
Continuous Probability Distributions
A continuous random variable is a variable that
can assume any value on a continuum (can
assume an uncountable number of values)
thickness of an item
time required to complete a task
temperature of a solution
height, in inches
These can potentially take on any value,
depending only on the ability to measure
accurately.
QMIS 220, By Dr. M. Zainal
QMIS 220, By Dr. M. Zainal Chap 6-5
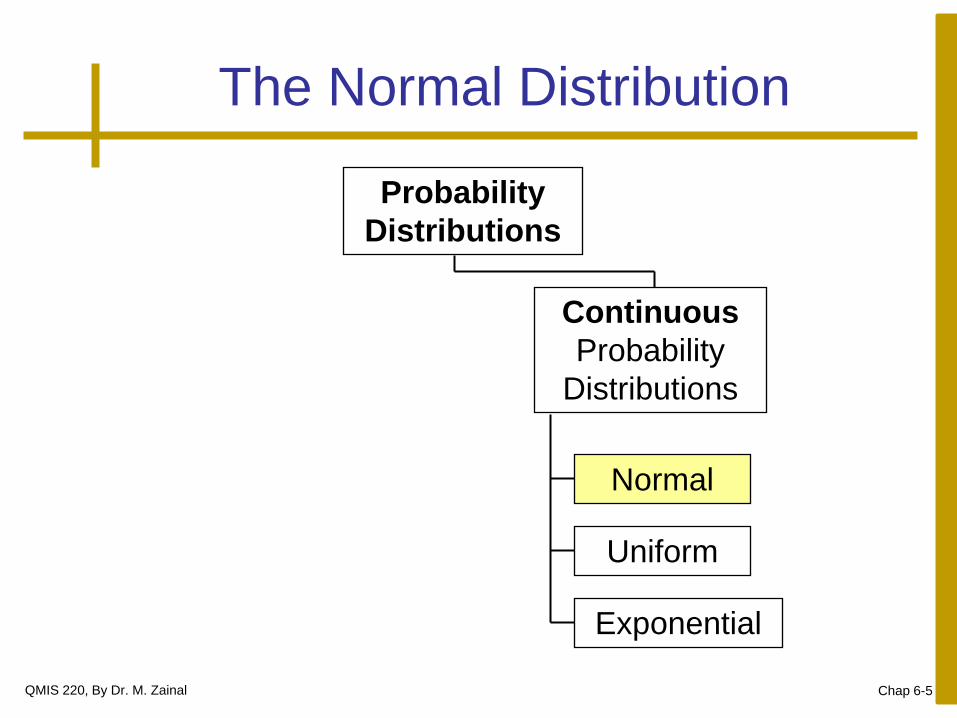
The Normal Distribution
Continuous
Probability
Distributions
Probability
Distributions
Normal
Uniform
Exponential

QMIS 220, By Dr. M. Zainal Chap 6-6
The Normal Distribution
‘Bell Shaped’
Symmetrical
Mean, Median and Mode are Equal
Location is determined by the mean, μ
Spread is determined by the standard deviation, σ
The random variable has an infinite theoretical range: + to
Mean
= Median
= Mode
x
f(x)
μ
σ
QMIS 220, By Dr. M. Zainal Chap 6-7
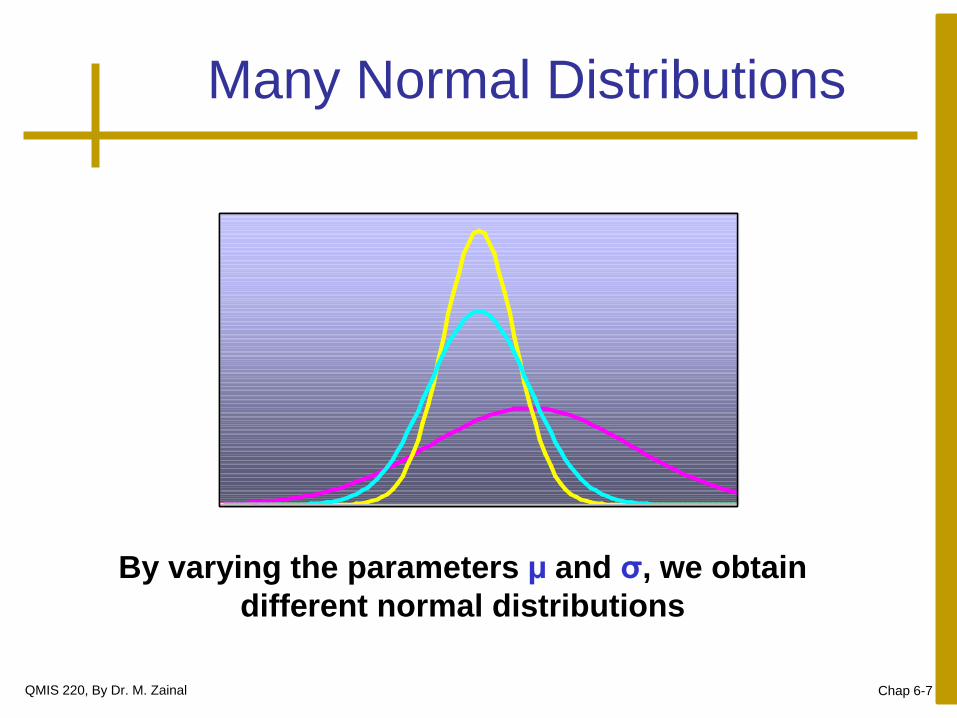
By varying the parameters μ and σ, we obtain
different normal distributions
Many Normal Distributions
QMIS 220, By Dr. M. Zainal Chap 6-8
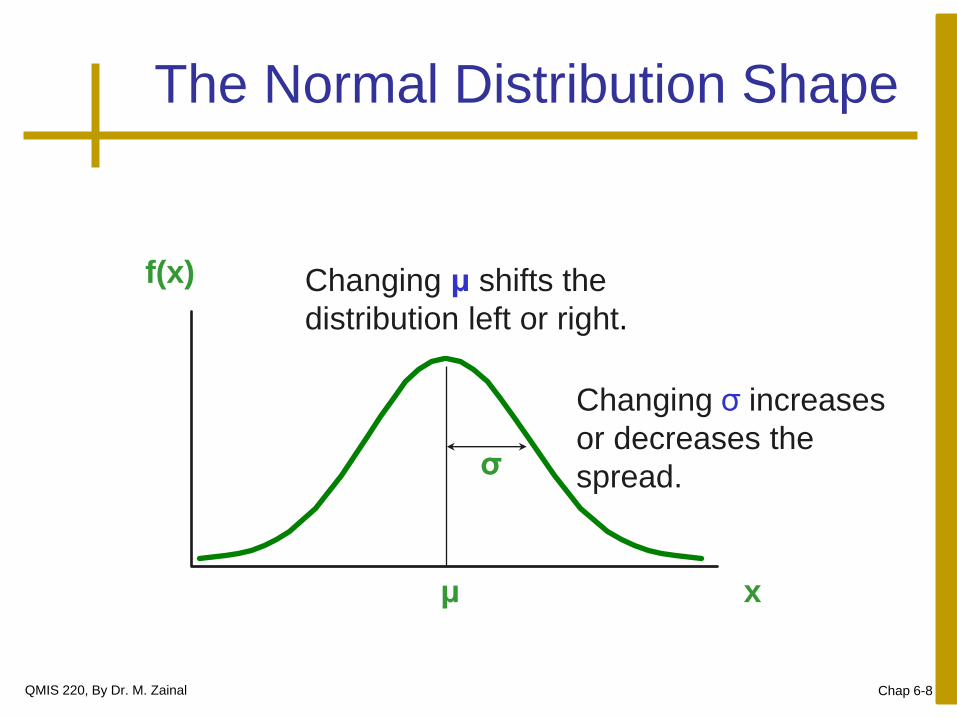
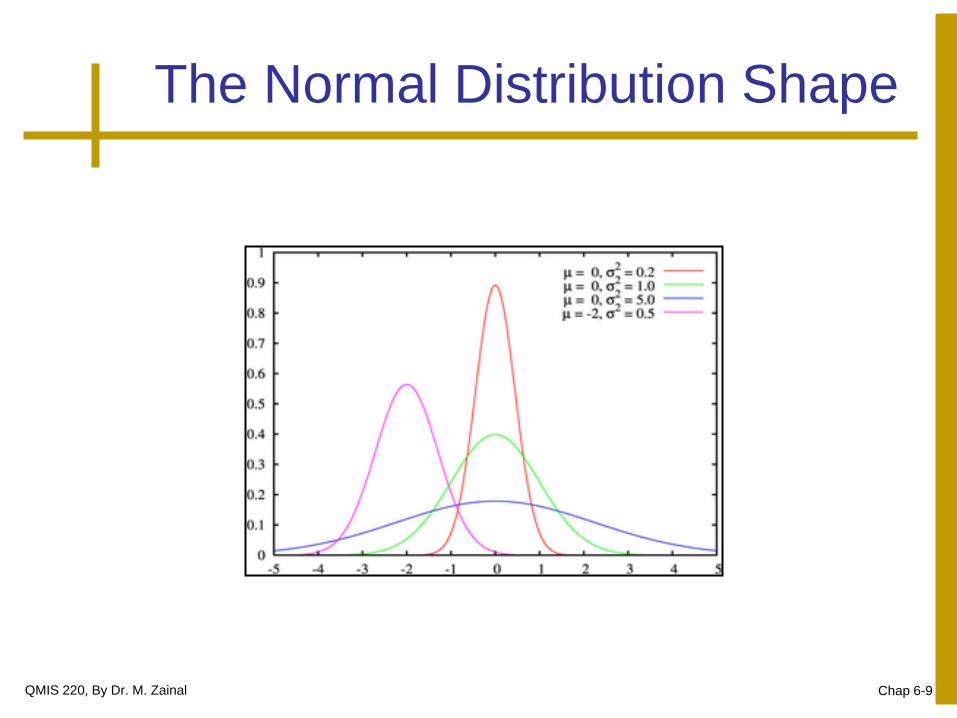
The Normal Distribution Shape
x
f(x)
μ
σ
Changing μ shifts the
distribution left or right.
Changing σ increases
or decreases the
spread.
QMIS 220, By Dr. M. Zainal Chap 6-9
The Normal Distribution Shape
QMIS 220, By Dr. M. Zainal Chap 6-10
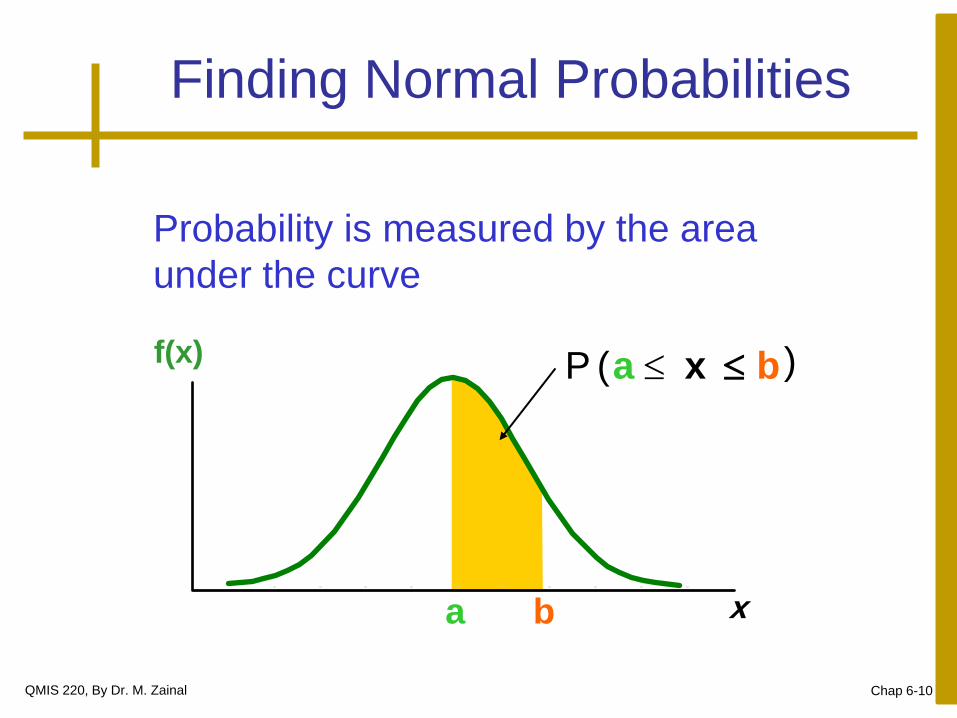
Finding Normal Probabilities
a b x
f(x) P a x b ( )
Probability is measured by the area
under the curve
QMIS 220, By Dr. M. Zainal Chap 6-11
f(x)
x μ
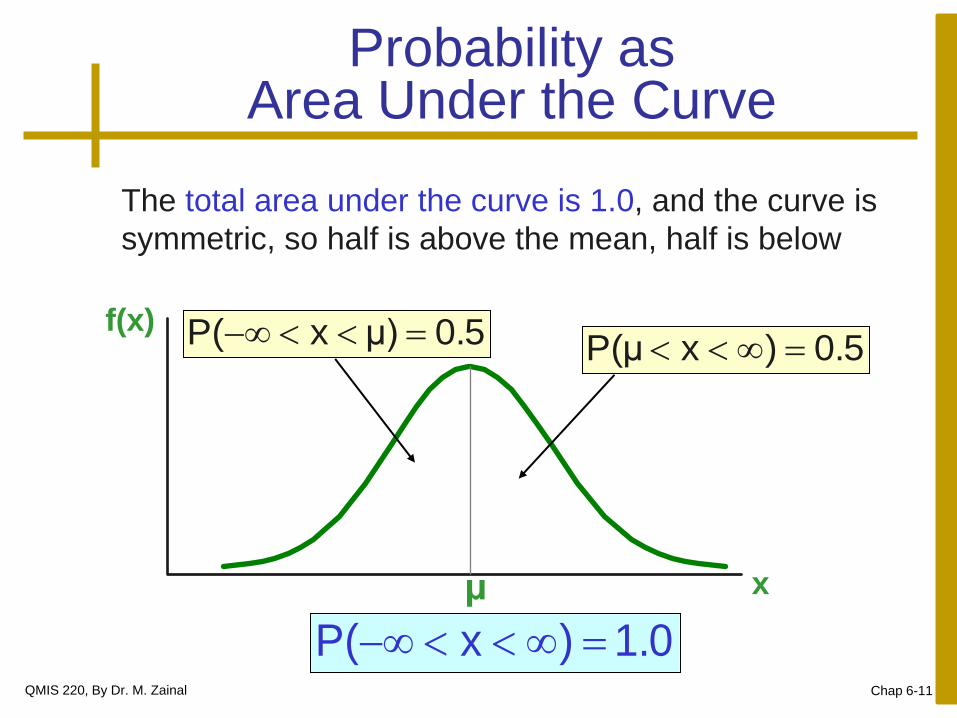
Probability as Area Under the Curve
0.5 0.5
The total area under the curve is 1.0, and the curve is
symmetric, so half is above the mean, half is below
1.0)xP(
0.5)xP(μ 0.5μ)xP(

QMIS 220, By Dr. M. Zainal Chap 6-12
Empirical Rules
μ ± 1σ encloses about
68% of x’s
f(x)
x μ μ+1σ μ1σ
What can we say about the distribution of values
around the mean? There are some general rules:
σ σ
68.26%

QMIS 220, By Dr. M. Zainal Chap 6-13
The Empirical Rule
μ ± 2σ covers about 95% of x’s
μ ± 3σ covers about 99.7% of x’s
x μ
2σ 2σ
x μ
3σ 3σ
95.44% 99.72%
(continued)
QMIS 220, By Dr. M. Zainal Chap 6-14
Importance of the Rule
If a value is about 3 or more standard
deviations away from the mean in a normal
distribution, then it is an outlier
The chance that a value that far or farther
away from the mean is highly unlikely, given
that particular mean and standard deviation

QMIS 220, By Dr. M. Zainal Chap 6-15
The Standard Normal Distribution
Also known as the “z” distribution
Mean is defined to be 0
Standard Deviation is 1
z
f(z)
0
1
Values above the mean have positive z-values,
values below the mean have negative z-values

QMIS 220, By Dr. M. Zainal Chap 6-16
The Standard Normal
Any normal distribution (with any mean and standard deviation combination) can be transformed into the standard normal distribution (z)
Need to transform x units into z units
σ
μxz
QMIS 220, By Dr. M. Zainal Chap 6-17
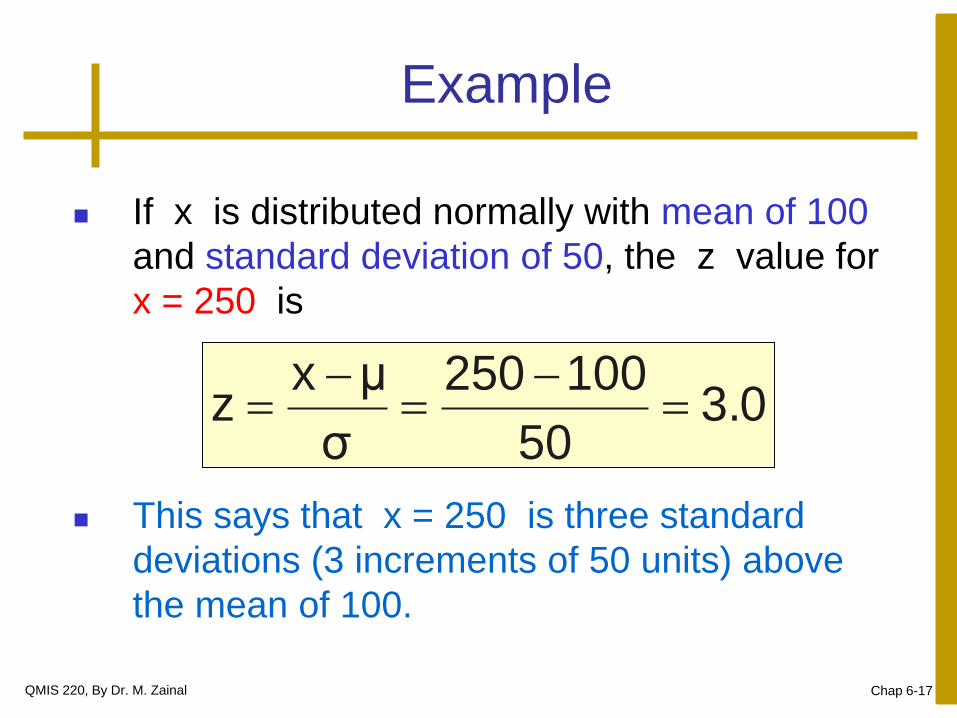
Example
If x is distributed normally with mean of 100
and standard deviation of 50, the z value for
x = 250 is
This says that x = 250 is three standard
deviations (3 increments of 50 units) above
the mean of 100.
3.050
100250
σ
μxz
QMIS 220, By Dr. M. Zainal Chap 6-18
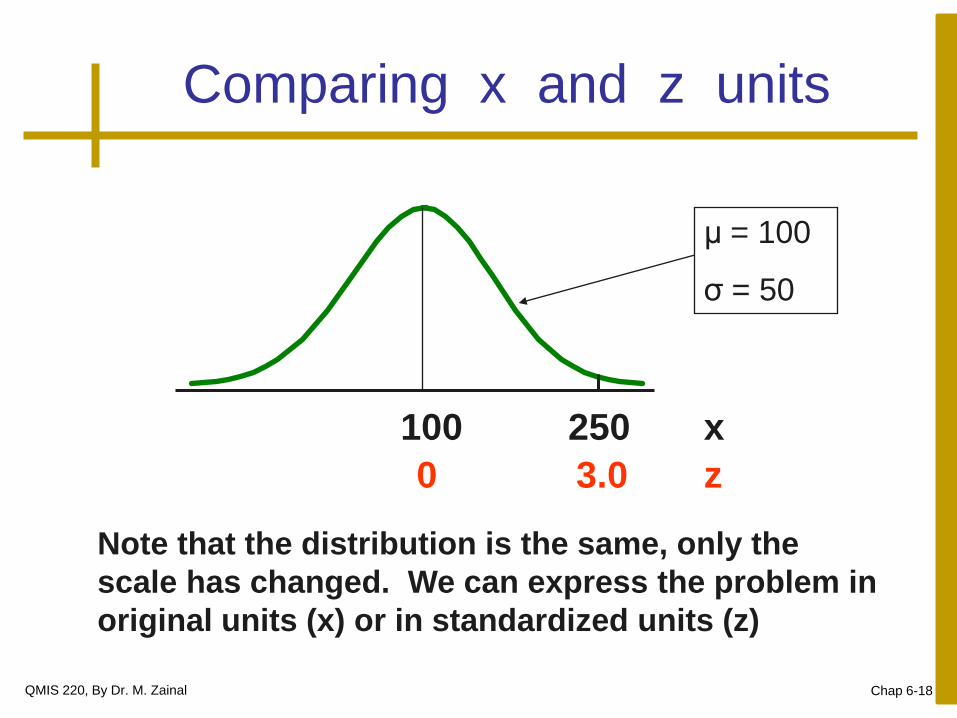
Comparing x and z units
z
100
3.0 0
250 x
Note that the distribution is the same, only the
scale has changed. We can express the problem in
original units (x) or in standardized units (z)
μ = 100
σ = 50
QMIS 220, By Dr. M. Zainal Chap 6-19
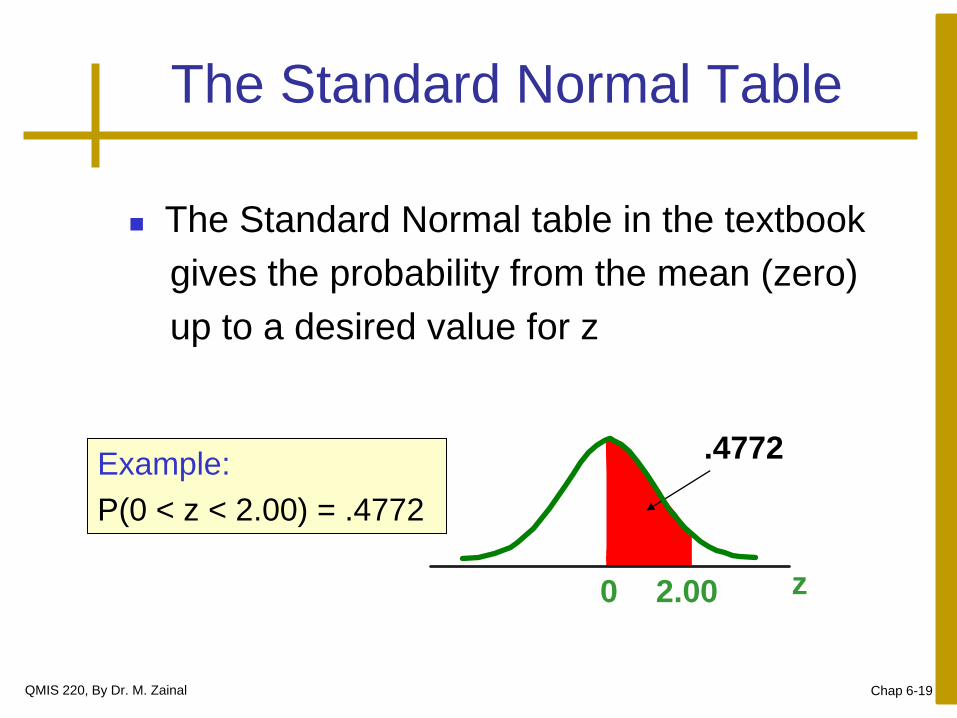
The Standard Normal Table
The Standard Normal table in the textbook
gives the probability from the mean (zero)
up to a desired value for z
z 0 2.00
.4772 Example:
P(0 < z < 2.00) = .4772
QMIS 220, By Dr. M. Zainal Chap 6-20
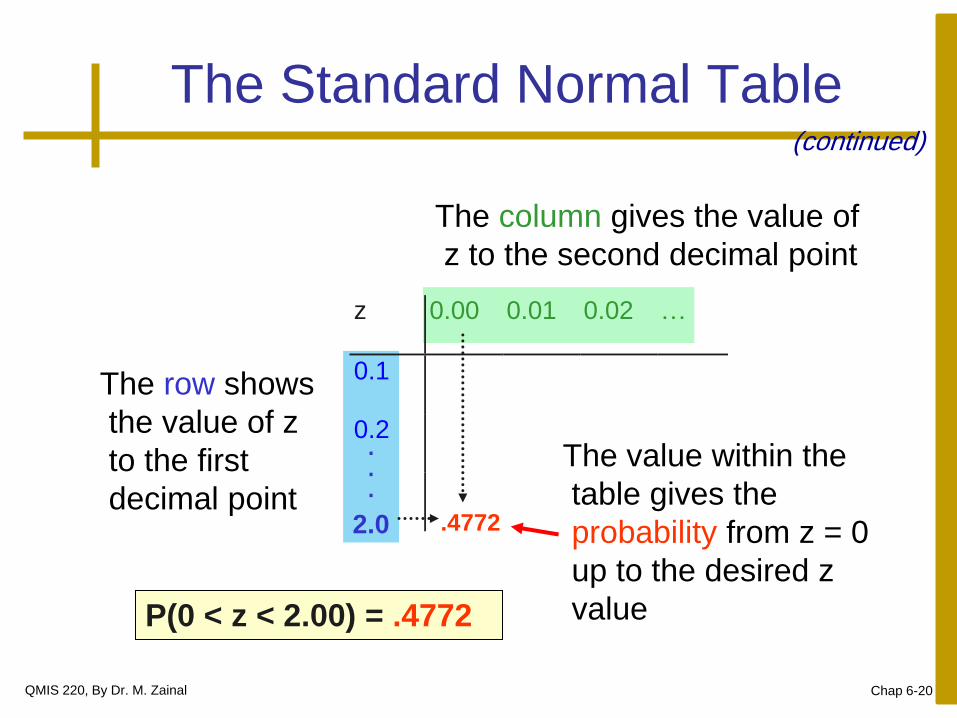
The Standard Normal Table
The value within the
table gives the
probability from z = 0
up to the desired z
value
z 0.00 0.01 0.02 …
0.1
0.2
.4772
2.0 P(0 < z < 2.00) = .4772
The row shows
the value of z
to the first
decimal point
The column gives the value of
z to the second decimal point
2.0
.
.
.
(continued)
QMIS 220, By Dr. M. Zainal Chap 6-21
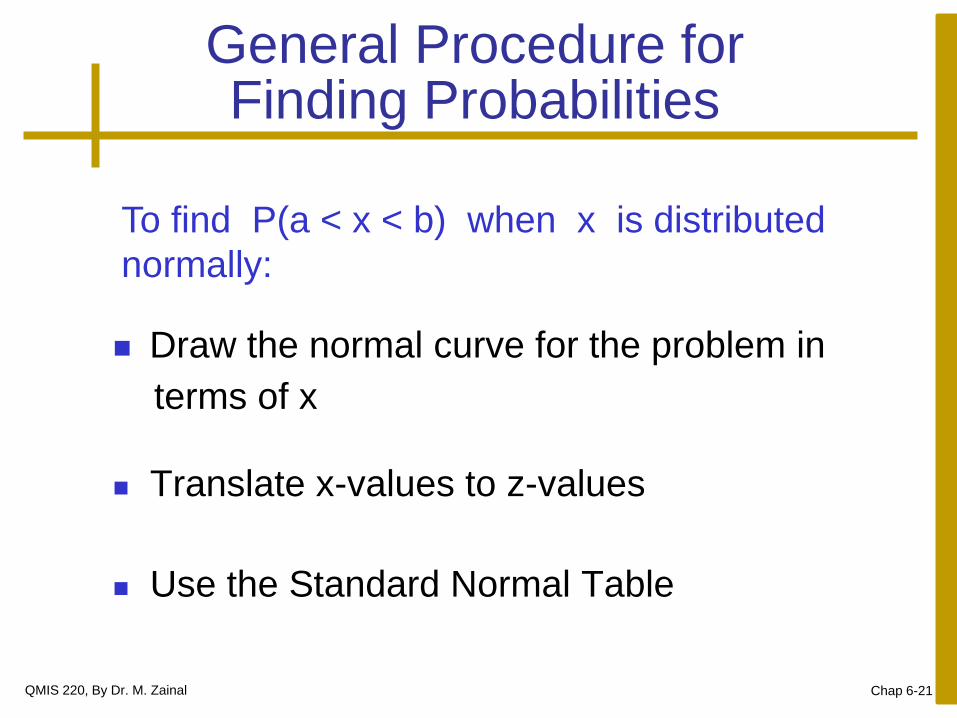
General Procedure for Finding Probabilities
Draw the normal curve for the problem in
terms of x
Translate x-values to z-values
Use the Standard Normal Table
To find P(a < x < b) when x is distributed
normally:
QMIS 220, By Dr. M. Zainal Chap 6-22
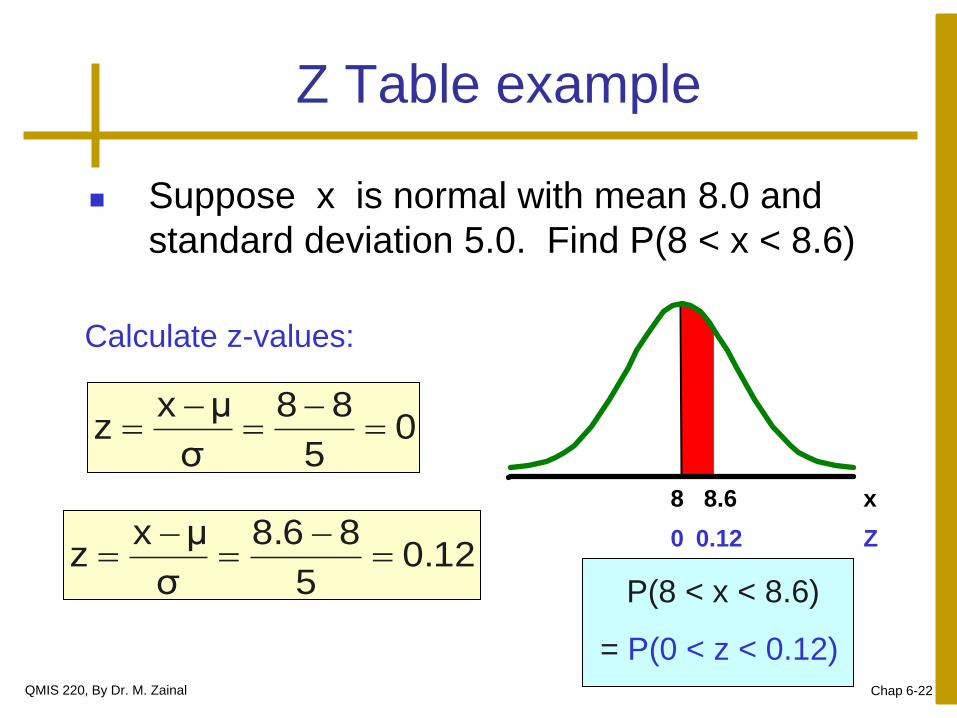
Z Table example
Suppose x is normal with mean 8.0 and
standard deviation 5.0. Find P(8 < x < 8.6)
P(8 < x < 8.6)
= P(0 < z < 0.12)
Z 0.12 0
x 8.6 8
05
88
σ
μxz
0.125
88.6
σ
μxz
Calculate z-values:
QMIS 220, By Dr. M. Zainal Chap 6-23
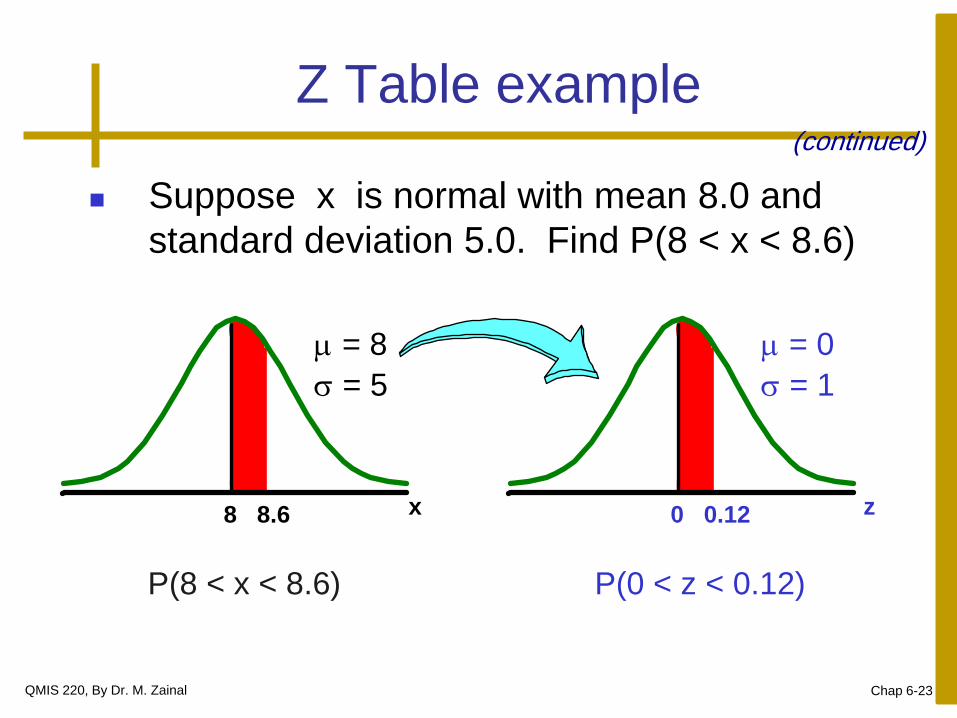
Z Table example
Suppose x is normal with mean 8.0 and
standard deviation 5.0. Find P(8 < x < 8.6)
P(0 < z < 0.12)
z 0.12 0 x 8.6 8
P(8 < x < 8.6)
= 8
= 5
= 0
= 1
(continued)

QMIS 220, By Dr. M. Zainal Chap 6-24
Z
0.12
z .00 .01
0.0 .0000 .0040 .0080
.0398 .0438
0.2 .0793 .0832 .0871
0.3 .1179 .1217 .1255
Solution: Finding P(0 < z < 0.12)
.0478 .02
0.1 .0478
Standard Normal Probability
Table (Portion)
0.00
= P(0 < z < 0.12)
P(8 < x < 8.6)
QMIS 220, By Dr. M. Zainal Chap 6-25
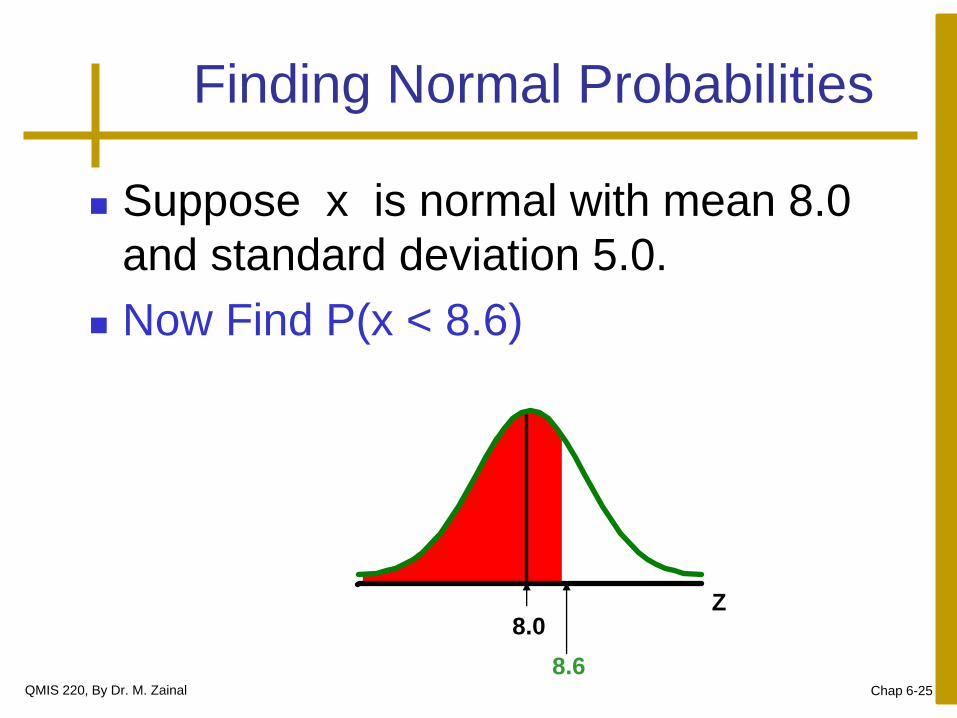
Finding Normal Probabilities
Suppose x is normal with mean 8.0
and standard deviation 5.0.
Now Find P(x < 8.6)
Z
8.6
8.0
QMIS 220, By Dr. M. Zainal Chap 6-26
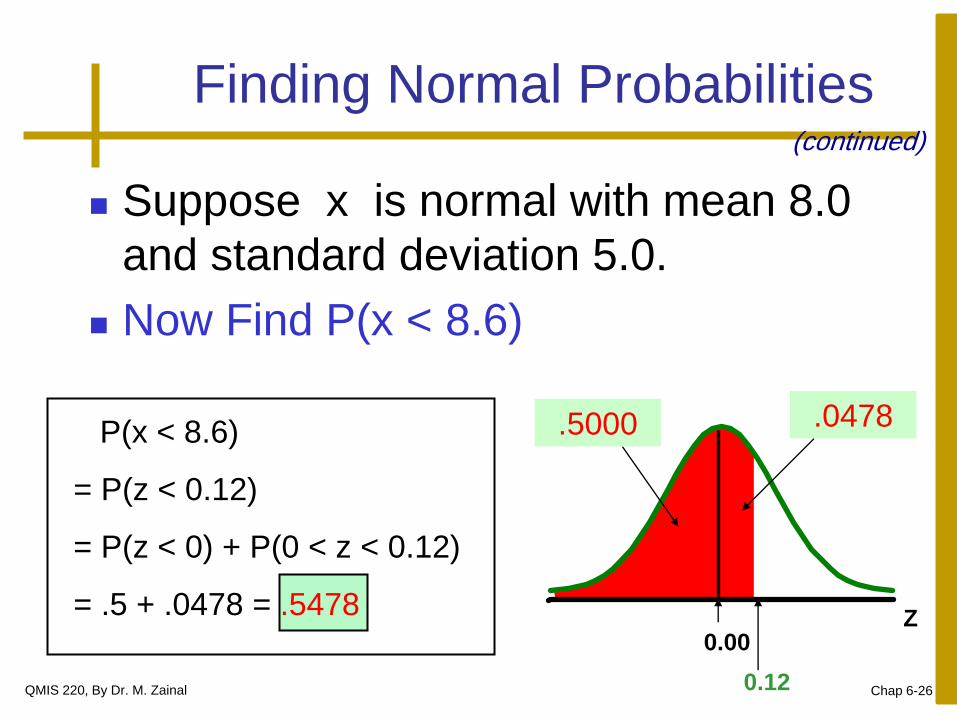
Finding Normal Probabilities
Suppose x is normal with mean 8.0
and standard deviation 5.0.
Now Find P(x < 8.6)
(continued)
Z
0.12
.0478
0.00
.5000 P(x < 8.6)
= P(z < 0.12)
= P(z < 0) + P(0 < z < 0.12)
= .5 + .0478 = .5478
QMIS 220, By Dr. M. Zainal Chap 6-27
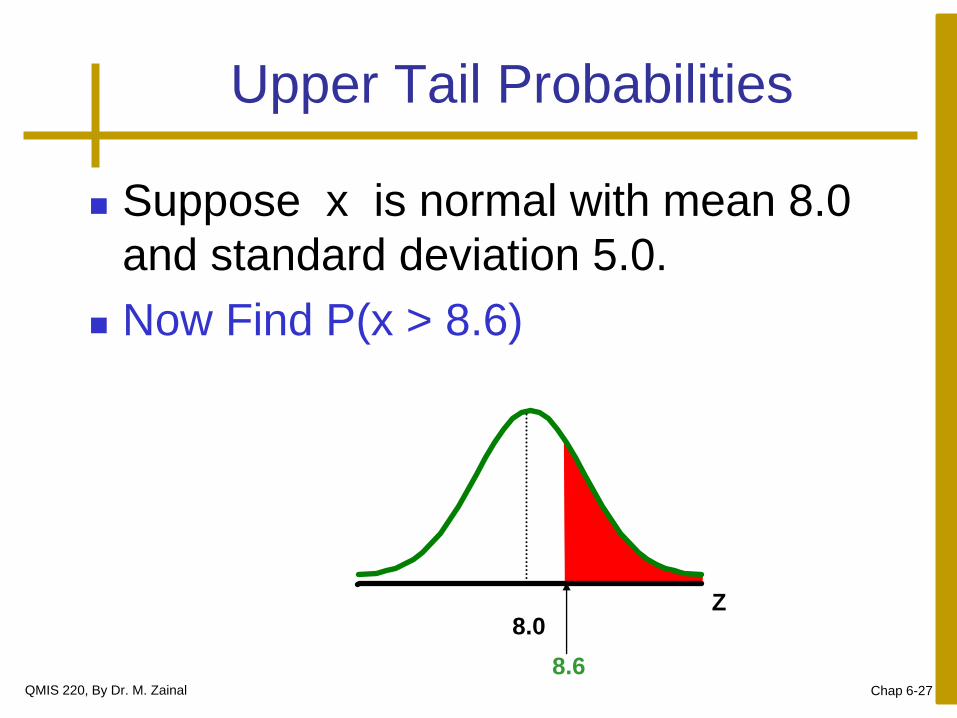
Upper Tail Probabilities
Suppose x is normal with mean 8.0
and standard deviation 5.0.
Now Find P(x > 8.6)
Z
8.6
8.0
QMIS 220, By Dr. M. Zainal Chap 6-28
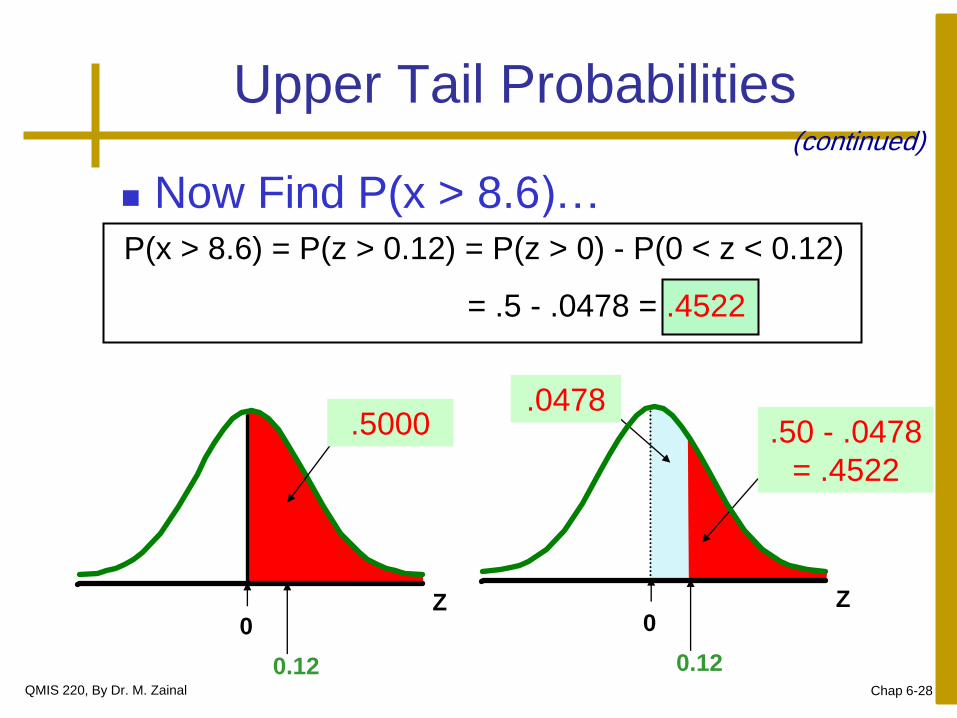
Now Find P(x > 8.6)…
(continued)
Z
0.12
0 Z
0.12
.0478
0
.5000 .50 - .0478
= .4522
P(x > 8.6) = P(z > 0.12) = P(z > 0) - P(0 < z < 0.12)
= .5 - .0478 = .4522
Upper Tail Probabilities
QMIS 220, By Dr. M. Zainal Chap 6-29
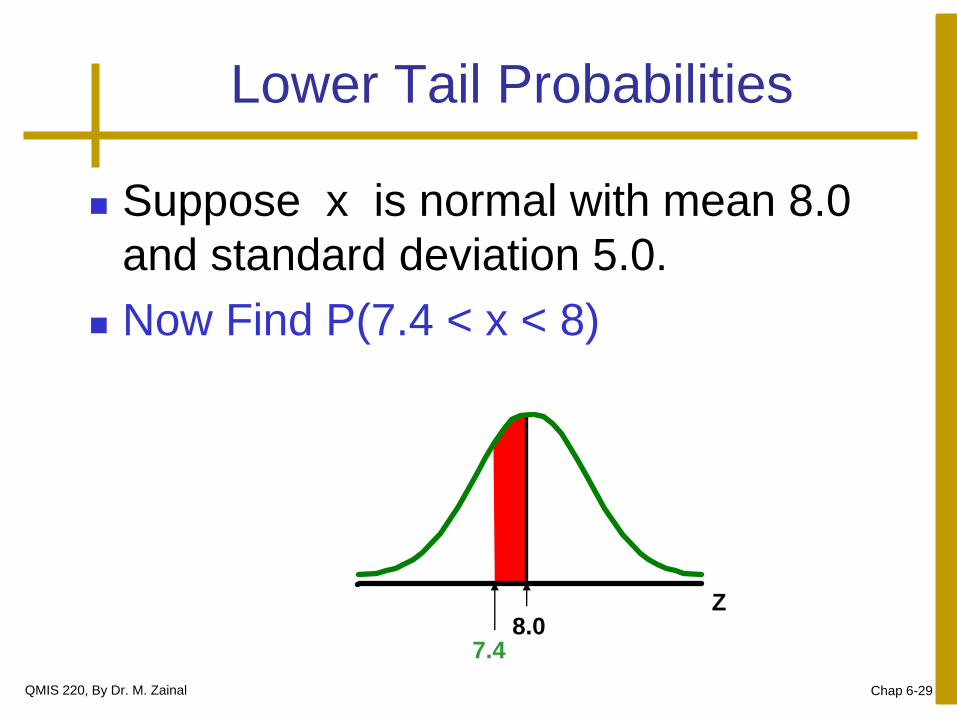
Lower Tail Probabilities
Suppose x is normal with mean 8.0
and standard deviation 5.0.
Now Find P(7.4 < x < 8)
Z
7.4 8.0
QMIS 220, By Dr. M. Zainal Chap 6-30
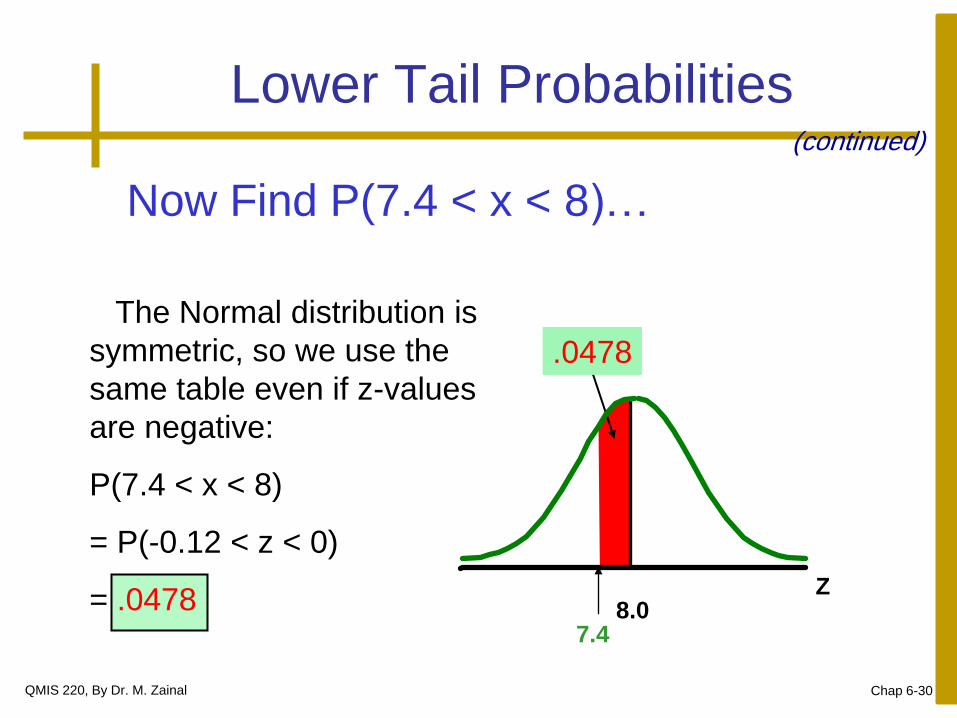
Lower Tail Probabilities
Now Find P(7.4 < x < 8)…
Z
7.4 8.0
The Normal distribution is
symmetric, so we use the
same table even if z-values
are negative:
P(7.4 < x < 8)
= P(-0.12 < z < 0)
= .0478
(continued)
.0478
QMIS 220, By Dr. M. Zainal Chap 6-31
Z Table example
Example: Find the area under the standard
normal curve between z = 0 to z = 1.95
Example: Find the area under the standard
normal curve between z = -2.17 to z = 0
QMIS 220, By Dr. M. Zainal Chap 6-32
Z Table example
Example: Find the following areas under the
standard normal curve.
a) Area to the right of z = 2.32
b) Area to the left of z = -1.54
QMIS 220, By Dr. M. Zainal Chap 6-33
Z Table example
Example: Find the following areas under the
standard normal curve.
a) P(1.19 < z < 2.12)
b) P(-1.56 < z < 2.31)
c) P(z > -.75)
QMIS 220, By Dr. M. Zainal Chap 6-34
Z Table example
Example: Find the following areas under the
standard normal curve.
a) P(0 < z < 5.65)
b) P( z < - 5.3)

QMIS 220, By Dr. M. Zainal Chap 6-35
Z Table example
Example: Let x be a continuous RV that has a
normal distribution with a mean 80 and a
standard deviation of 12. Find the following
probabilities
a) P(70 <x < 135)
b) P(x < 27)

QMIS 220, By Dr. M. Zainal Chap 6-36
Z Table example
Example: The assembly time for a racing car toy
follows a normal distribution with a mean of 55
minutes and a standard deviation of 4 minutes.
The factory closes at 5 PM every day. If one
worker starts assembling that car at 4 PM, what
is the probability that she will finish this job
before the company closes for the day?

QMIS 220, By Dr. M. Zainal Chap 6-37
Z Table example
Example: The lifetime of a calculator
manufactured by a company has a normal
distribution with a mean of 54 months and a
standard deviation of 8 months. The company
guarantees that any calculator that starts
malfunctioning within 36 months of the purchase
will be replaced by a new one. What percentage
of such calculators are expected to be
replaced?

QMIS 220, By Dr. M. Zainal Chap 6-38
Determining the z and x values
We reverse the procedure of finding the area
under the normal curve for a specific value of z
or x to finding a specific value of z or x for a
known area under the normal curve.
z 0.00 0.01 0.02 …
0.1
0.2
.4772 2.0
.
.
.
QMIS 220, By Dr. M. Zainal Chap 6-39
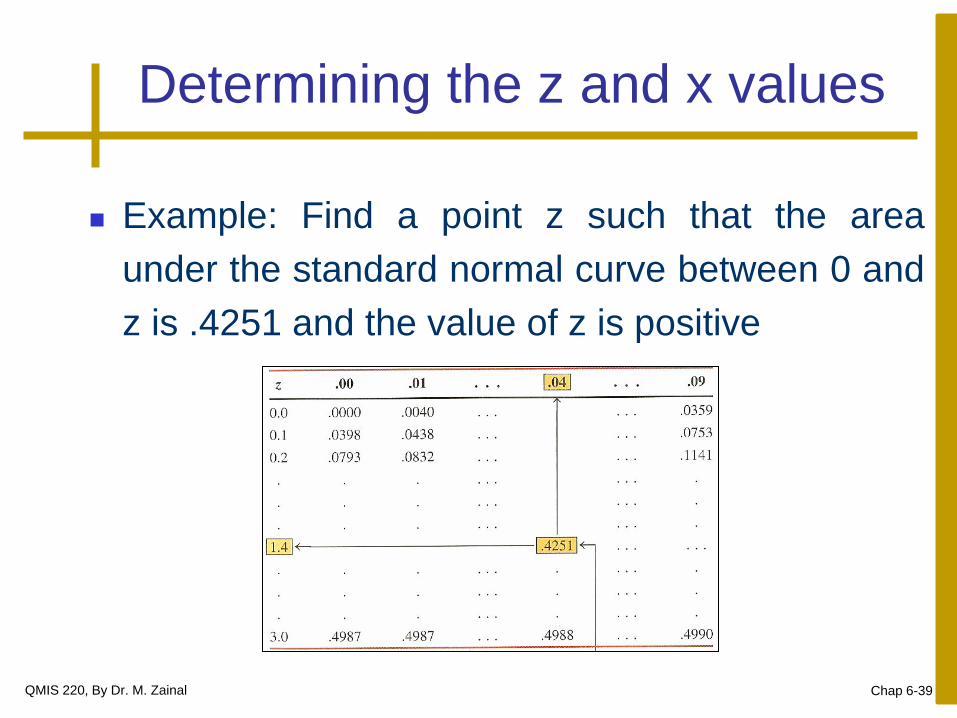
Determining the z and x values
Example: Find a point z such that the area
under the standard normal curve between 0 and
z is .4251 and the value of z is positive
QMIS 220, By Dr. M. Zainal Chap 6-40
Finding x for a normal dist.
To find an x value when an area under a normal
distribution curve is given, we do the following
Find the z value corresponding to that x value
from the standard normal curve.
Transform the z value to x by substituting the
values of , , and z in the following formula
x z +
QMIS 220, By Dr. M. Zainal Chap 6-41
Finding x for a normal dist.
Example: Most business schools require that
every applicant for admission to a graduate
degree program take the GMAT. Suppose the
GMAT scores of all students have a normal
distribution with a mean of 550 and a standard
deviation of 90. You are planning to take this
test. What should your score be in this test so
that only 10% of all the examinees score higher
than he does?
QMIS 220, By Dr. M. Zainal Chap 6-42
Finding x for a normal dist.
Example: Recall the calculators example, it is
known that the life of a calculator manufactured
by a factory has a normal distribution with a
mean of 54 months and a standard deviation of
8 months. What should the warranty period be
to replace a malfunctioning calculator if the
company does not want to replace more than
0.5 % of all the calculators sold?
Copyright
The materials of this presentation were mostly
taken from the PowerPoint files accompanied
Business Statistics: A Decision-Making Approach,
7e © 2008 Prentice-Hall, Inc.
Chap 6-43 QMIS 120, by Dr. M. Zainal