review of office of road safety mass media campaigns data/resear… · o media budget (with a...
TRANSCRIPT
1 | P a g e
Review of Office of Road Safety Mass Media Campaigns
Prepared by Enth Degree
June 5th 2014
(Revises 30th
May 2014)
Government of Western Australia
Department of the Premier and Cabinet

2 | P a g e
Contents
Section Pages
1. Executive Summary 1-10
2. The Value of New Campaign Production 11-18
The effectiveness of utilising other existing material (including interstate)
The potential application of existing material to a broader state-wide audience;
The potential impact on local production firms
The willingness and basis for other jurisdictions to share existing material.
3. The Level of Resources allocated to Campaigns 19-31
The expenditure allocated in other states towards road safety campaigns
The proportion of road safety advertising expenditure used in producing road safety campaigns in other states
The correlation to the level of expenditure on road safety advertising and the road toll per 100,00
Whether academic research supports the above correlation.
4. Performance Indicators used for campaigns 32-52
Analysis of pre and post-campaign research and the application of supporting academic research whereappropriate. Attention should be given to the following:o The brief; o Target market: Metropolitan and Regional - state-wide; o Objectives: x% reach, no of TARPS (Total Audience Rating Points) etc., message recall, no. or % reduction in
accidents/road toll;o Duration of Campaign; o Media Budget (with a comparison to expenditure in other states);o Media selection (including a comparison of the use of social media in other states and how it is used)o Production Budget Spend;o Media Buy: evaluate the effectiveness of the media plan – media selection – rate card comparison (invoiced)o Post-campaign effectiveness, including reporting effectiveness, reach of advertising, and frequency.
5. The Economic/Social Cost for and against Advertising 53-69
6. Should spending include education on road rules? 70-75
7. Appendix 76-117

3 | P a g e
1. Executive Summary
Enth Degree was appointed by the DPC to undertake a review of Western Australian Office of Road Safety (ORS) Mass Media campaigns.
Specifically, the project stipulated that Enth Degree review:
a) The value of new production compared to using existing advertising from other agenciesthroughout Australia;
b) The level of resources allocated to campaigns;c) The performance indicators used for campaigns;d) The economic/social cost for and against advertising; ande) Whether future campaign spending should include explicit education campaigns on emerging
and ongoing road use issues, such as keep left, how to merge, etc.
Our review identified the following:
a) The value of new production compared to using existing advertising from otheragencies throughout Australia
High production values, combined with creative messaging, guided by behaviour change
theories increase the chance of producing effective, memorable campaigns.
A feature of many road safety campaigns is their ability to build and sustain awareness with
relatively low levels of ongoing advertising pressure (e.g. prompted awareness of the May-
August campaign remained at 69% between May and August 2012 with around 40 TARPs (Target
Audience Rating Points) per week.
There is evidence that high quality road safety messages get remembered.
More creative executions around a consistent campaign theme reduces campaign wear out.
The potential “Catch 22” for smaller states is that higher relative production costs reduce their
ability to create and produce their own pool of creative executions, which increases the
likelihood of wear-out for their campaigns.
A review of current and relevant interstate road safety campaigns identified a range of
campaigns that, with minimal editing to remove interstate identification, and replace with WA
relevant livery etc. would be suitable for telecast in Western Australia.
It is estimated that annually ORS could save circa $390k if relevant TVCs were adapted for use in
WA.
Interstate jurisdictions have confirmed their willingness to provide this material to WA at no
charge, however talent fees beyond the borders negotiated would be the responsibility of ORS.
The impact on the local production industry would be minimal.
Recommendation
The adaption of relevant interstate TVCs will provide real savings to the ORS, of up to $390k per
annum.
Considering the impact of production costs on the available media budget, it is recommended that
ORS consider the adaption of interstate material for mass media campaigns, with savings to be
deployed in attaining continuity of media presence to assist in changing driver habits and attitudes.

4 | P a g e
b) The level of resources allocated to campaigns
A four year history of spend by medium has been assessed based on AC Nielsen (Adex) data.
Primary media for interstate jurisdictions is television and outdoor. TAC also invests heavily (26%
of budget) into online.
Calendar 2012 total media spend per 100,000 of population indicates ORS expenditure is below
the national average, and also when TAC is excluded (the high media investment of TAC skews
the national average).
Jurisdiction Spend '000s Spend per 100k pop Index to WA
NSW RMS/Transport for NSW $7,901 $95.47 87.20
VIC TAC $11,699 $200.76 183.38
Qld Transport and Main Roads $2,246 $46.29 42.28
SA Motor Accident Commission $3,805 $265.34 242.37
WA ORS $2,665 $109.52 100.00
TOTAL $28,316 $124.07 113.32
TOTAL EX TAC $16,617 $97.77 118
2012 State Media Spend Index to WA per 100k Population
A four year average shows that ORS expenditure is lower than the national average (ex TAC),
although skewed by a relatively lower spend in Queensland. (Please note that as 55% of the
Queensland population is rural, total regional spending, not captured by Adex, would most likely
contribute to an under reported total).
Jurisdiction Spend '000s Spend per 100k pop Index to WA
NSW RMS/Transport for NSW $8,391 $101.39 124.94
VIC TAC $11,361 $194.96 240.24
Qld Transport and Main Roads $2,931 $60.41 74.44
SA Motor Accident Commission $2,203 $153.64 189.33
WA ORS $1,975 $81.15 100.00
TOTAL $26,862 $117.69 145.03
TOTAL EX TAC $15,500 $91.20 112.38
2009 - 2012 Average Media Spend Index to WA per 100k Population
The average proportion of advertising expenditure used in producing ORS road safety campaigns
over the four years up to 2012 is approximately 33%. (Production totals as advised by ORS
include outdoor production and installation).
Jurisdiction Pop (000s) Pop Index WA Production ($000) WA Media Equiv (000s) Media, Prod Total Production Share
NSW RMS/Transport for NSW 8276.2 340 $968 $6,715 $7,683 12.6%
VIC TAC 5827.5 239 $968 $4,720 $5,688 17.0%
Qld Transport and Main Roads 4852.4 199 $968 $3,930 $4,898 19.8%
SA Motor Accident Commission 1434 59 $968 $1,165 $2,133 45.4%
WA Office of Road Safety 2433.4 100 $968 $1,975 $2,943 32.9%
Production costs are relatively stable across Australia, while the price of media is determined by
its reach potential. As media costs are lower in Western Australian than in the larger population
states, the proportion of budget allocated to production will therefore be higher in Western
Australia, by up to three times greater than in other mainland states (excluding SA).

5 | P a g e
This factor does lend weight to closer consideration of adapting interstate campaigns where we
have demonstrated that production savings can be up to 90%.
However a review of fatalities and media spend per 100,000 population does not readily
highlight a consistent cross market relationship with advertising spend and fatalities:
2009 2010 2011 2012 2009-2012
NSW Fatalities 6.4 5.6 5.0 5.0 5.5
Spend $67.02 $127.12 $115.93 $95.47 $101.39
Fatality Index YoY 100.0 88.2 88.9 100.1 86.3
Spend Index Yoy 100.0 189.7 91.2 82.4 151.3
VIC Fatalities 5.4 5.2 5.1 5.0 5.2
Spend $168.32 $229.33 $181.43 $200.76 $194.96
Fatality Index YoY 100.0 97.9 98.1 96.5 96.7
Spend Index Yoy 100.0 136.2 79.1 110.7 115.8
QLD Fatalities 7.6 5.6 6.0 6.1 6.3
Spend $71.12 $65.33 $58.90 $46.29 $60.41
Fatality Index YoY 100.0 74.05 106.07 101.90 83.2
Spend Index Yoy 100.0 91.86 90.16 78.59 84.9
SA Fatalities 7.4 7.2 6.3 5.7 6.6
Spend n/a $87.73 $259.34 $265.34 204.14
Fatality Index YoY n/a 100.0 86.5 90.4 78.2
Spend Index Yoy n/a 100.0 295.6 102.3 232.7
WA Fatalities 8.4 8.3 7.5 7.3 7.9
Spend $32.01 $97.19 $85.89 $109.48 $81.14
Fatality Index YoY 100.0 98.6 89.9 98.2 93.6
Spend Index Yoy 100.0 303.6 88.4 127.5 127.5
Fatalities/Spend per 100,000 population
However, in all markets, fatalities per 100,000 population has declined, whereas media spend
has trended upwards (with the exception of Queensland where spend has declined).
In our experience, the comparison between media expenditure and most marketing measures is
relatively weak. In a long term anti-tobacco marketing program, a reduction in a Quit campaign
budget of 20% in a particular year would be unlikely to result in a lift in smoking prevalence.
Similarly, a lift of 50% in a year would not result in an immediately recognisable decline.
A new brand entering a market to compete with established brands will invest
disproportionately more than its short term share of market objectives. It would not be
expected that that brand’s share of sales would match its increased share of advertising in that
year or the year after.
Inherent social and demographic conditions contribute to vehicle crashes from one geographic
region to another.
An alternative approach to comparing road safety advertising expenditure from state to state is
to compare the rate of improvement in road safety metrics from year to year, and from one
state to another.
In the document “Preliminary Fatal and Critical Injuries on Western Australian Roads– 2013
Summary”, a graph is provided that compares the fatality rates per 100,000 persons in WA
versus all of Australia.
The rate of decline for “All of Australia” has reduced since 2011. The WA rate of decline has
been greater than the Australian rate since the implementation of “Towards Zero’ in 2008.
(These observations are consistent with the trend identified in the 2011 Meta-analysis.)

6 | P a g e
We concluded that a comparison in the rate of decline from state to state would mean
comparing states as if they were in the same state of maturity in the longevity of road safety
campaigns when in fact they are not.
The second highest weighted factor from the Meta-analysis was campaigns of durations over
200 days (67%).
Most NSW campaigns would comply because of that state’s tendency to have lower weekly TV
TARP weights and more active weeks supported by year-round Regional Outdoor focused on
speeding and occasionally fatigue campaigns.
AC Nielsen data detailing weight of television activity for other states in 2013 expressed as
Target Audience Rating Points (TARPs) shows:
Jurisdiction Active Weeks Days Total TARPs Ave Week TARPs
NSW - RMS 29 203 2300 79
VIC - TAC 52 365 6990 134
QLD- TMR 39 273 3206 82
SA - MAC 44 308 8091 184
A review of the WA speed behaviour, or “Enjoy the Ride” media campaigns indicate a total of 20
active weeks, or 140 days scheduled across 20 active weeks from October 2011 – April 2012.
This was scheduled in tandem with enforcement messages.
Recommendation
An evaluation of available research does not support a consistent cross market correlation between
advertising spend and road toll per 100,000 head of population.
However (with the exception of Queensland), it can be observed that a continually declining road
toll is accompanied by a trend of increased media expenditure.
To understand the impact of ORS Road Safety messages on audience behaviour it will require re-
instatement of on-going tracking. Research has not been undertaken since 2012.
We recommend the ORS consider the implementation of continuous tracking for quantitative
interpretation of major road safety campaign initiatives.
The depth, frequency and range of initiatives will obviously determine final cost, however, assuming
quantitative tracking of three major campaigns, ORS should consider a budget reserve of circa $150k.

7 | P a g e
With regard to digital and social media investment our research indicates that an estimated 20+%
of major campaigns targeting men under 40 would now be allocated to digital and social media .
Recommendation
Because of the recent exponential growth of the impact of social media, combined with the need for
a body of on-going tracking over time, we are not surprised that there is nothing in the Academic
literature that we have sighted that provides evidence of the efficacy of social media in reducing
road crashes.
What is certain is that digital media forms have eroded the reach capacity of traditional media
forms, television in particular. This erosion is greatest against young males, the ORS core target,
where television activity is fragmented by digital alternatives, catch up television and video-pre-rolls.
A review of Speeding activity for 2012/2013 identifies that digital/social media allocation
represented approximately 17% of total expenditure (“Enjoy the Ride” and “Enforcement “combined).
This appears to be in line with our estimated digital spends in other jurisdictions
However it is not appropriate, nor the responsibility of this document, to recommend what
proportion of budgets should be allocated to social and digital media for Road Safety messages.
Within the section “Performance Indicators Used for Campaigns”, the report identifies that up until
2012, there has not been a requirement of the Media Agency to provide detailed documented
rationales for media strategy recommendations. Instead, this “was done in a forum/meeting with
ORS and ####### and creative agency discussions” (ORS).
It is imperative that the Media Agency is provided a detailed, non-prescriptive brief to which they
should respond with a highly documented, detailed, articulate and substantiated media strategy
recommendation for all media forms considered, digital or otherwise.
c). Performance indicators used for campaigns
Within this section we reviewed the “ Enjoy the Ride” media plan for 2011/2012, however in the absence of a detailed strategy document we offer generic observations that may have been considered and dismissed within the strategy development meetings held between ORS, the Creative Agency and the media planner.
We did review systems, operations and reporting for the period 2012/2013 and 2013/2014, as this represented the most recent modus operandi. A review of earlier (i.e. pre 2012) would potentially lead us to evaluate systems and practices that had progressed from that date, hence our inclusion of these observations.
The Client Brief: The ORS media briefs reviewed are not detailed, and prescriptive.
The Media Agency Response: The Media Agency strategic media rationale responses, where
provided are very basic and do not project any level of strategic thinking, rather they simply
provide a description of the plan without any qualifying rationale for the media selected and

8 | P a g e
weights applied. Please note these were not prepared or provided in a written form prior to
2012.
Television Post Analysis: The Media Agency reports are essentially a “dashboard” of campaign
weight achieved, and too basic to be of any real value to ORS.
Campaign Buying - Cost and Audience Delivery Efficiency: A review of Media Agency’s buying
performance against cost per TARP and quality of programming identified inconsistencies
between bursts of activity, networks and stations within each network.
Recommendations
ORS briefing documents and the Media Agency response are not representative of best practice and
require realignment.
A rigorous briefing and detailed strategy rationale recommendation and review must be
implemented for all future campaigns to ensure that the strategies employed for ORS media
spending represent the optimum allocation of budget resources.
Timing of budget approvals may require revision to allow this.
The Media Agency is to be directed to develop a post analysis dashboard that provides transparency
of delivery against both communication and cost objectives, a complete breakdown of value added
components, and identify learning to be applied for future media campaign development to optimise
return on media investment.
Buying inconsistencies between networks and individual buys reflect a necessity for The Media
Agency to:
1. Monitor ongoing CPT performance of the media buy, and address potential cost inefficiencies
before they occur.
2. Track audience performance of selected programming to ensure it is, and continues to be,
targeted toward the primary target audience.
All agencies have software that tracks performance of buys against audience delivery trends, thereby
enabling the Agency to amend placement and/or negotiate bonus activity to ensure that campaigns
are telecast at the planned and bought weekly weight.
d) The economic/social cost for and against advertising
The Transport Accident Commission is a Victorian Government-owned organisation set up to pay
for treatment and benefits for people injured in transport accidents, promote road safety and
improve Victoria’s trauma system.
Its Main Media per capita investment in Road Safety is the highest in Australia as per the
following chart:

9 | P a g e
State Population Road Safety Spend Spend Per Capita
NEW SOUTH WALES 7,218,500 $8,931,000 $1.24
VICTORIA 5,537,900 $11,361,000 $2.05
QUEENSLAND 4,476,700 $2,931,000 $0.65
SOUTH AUSTRALIA 1,639,600 $2,203,000 $1.34
WESTERN AUSTRALIA 2,353,400 $1,975,000 $0.84
TOTAL 21,226,100 $27,401,000 $1.29
* Source: AC Nielsed Adex/ABS
Road Safety Spend per Capita 2009-2012 (Ave)*
TAC return on investment in road safety promotion is measured by the reduction in claims.
With a commercial incentive to reduce road accident injuries it has applied significant resources
over many years to understand what works in road safety advertising and why.
Its continued commitment to mass media social marketing is consistent with an organisation
that has determined that there is a commercially viable ROI from road safety promotion.
There is strong correlation between crash reductions and campaigns of 200+ day’s duration.
Our observations from the most recent media plans for the WA ORS Speeding and Drink-driving
media plans are that they are constructed in a way that would not allow the WA ORS to have
high levels of confidence in their ability to reduce crashes. There is an absence of any meaningful
Drink-driving or Speeding TV advertising pressure against those most at risk (Regional WA
residents). Advertising in Perth is infrequent leaving many more weeks without cover than with.
Multi-media impact is only really meaningful when each channel used has the ability to generate
relatively high levels of recognition on its own.
Regional Outdoor’s inclusion on ORS schedules is consistent with the findings from the Phillips
et all Meta-analysis pointing to the weight of influence of roadside messaging.
The Phillips et all 2011 Meta-analysis’ observations were strongly influenced by campaigns
addressing speeding and drink driving, campaigns lasting over 200 days and campaigns using
road side messaging.
Fatality or serious injury reductions of 9% can’t be presumed for other campaigns, nor for
campaigns that are short-lived and don’t achieve wide exposure over several media.
We believe that a calculation as to the ROI of road safety advertising needs to be modified from
year to year depending on the presence of those factors that carried the most weight in the
source Meta-analysis.
Recommendation
Our research has identified evidence that there is both an economic and social benefit to road safety
advertising.
We have detailed that the TAC allocates almost twice the spend per capita on road safety compared
to other markets. Its return on investment is a reduction in claims. They have determined that there
is a commercially viable ROI from road safety advertising.
We have cited other examples and advocates of the positive role adverting plays in social marketing
(Prof Simon Chapman – anti-tobacco, Prof Melanie Wakefield –Cancer Council)
10 | P a g e
However, success of social marketing campaigns requires adherence to a number of basic marketing
principles, including but not limited to:
Messages are based on sound research and target testing
High exposure
Sufficient advertising pressure
Maintain pressure over time
Use multiple channels
Conduct rigorous independent assessment of outcomes
Commitment to these principles is essential to maximise impact of ORS media budgets and assist in
contributing toward the achievement of the Toward Zero objectives.
e) Should future campaign spending include explicit education campaigns on
emerging and ongoing road use issues, such as keep left, how to merge, etc.?
In their 2004 Meta-analysis review of road safety campaigns (Cameron, Delany et al); the first
listed conclusion addressed this subject: “Campaigns with a persuasive orientation, and those
that use emotional rather than rational appeals, tend to have a greater effect on the relevant
measure of effect. In contrast, information based and educative campaigns have been
associated with less effective campaigns.”
Campaigns on issues such as keep left, safe distances between vehicles and how to merge etc.,
fall into this group of campaigns that had a lesser effect.
Recommendation
Our findings support continued focus on a relatively small number of large and severe problems
which have been proven to be amenable to improvement through behavioural change campaigns.
11 | P a g e
1. The Value of New Campaign Production compared to using existing
material from other Agencies throughout Australia

12 | P a g e
The Value of New Campaign Production compared to using existing material
from other Agencies throughout Australia
The effectiveness of utilising other existing material (including interstate advertisements) and its
appropriateness for key road safety issues within this state;
The potential application of existing material to a broader state-wide audience;
The potential impact on local production firms; and
The willingness and basis for other jurisdictions to share existing material.
The effectiveness of utilising other existing material (including interstate advertisements) and its
appropriateness for key road safety issues within this state
In a 2011 address Professor Melanie Wakefield from the Centre for Behavioural Research in Cancer
shared with attendees to the International Society for Behavioural Nutrition and Physical Activity
(ISBNPA) Symposium a summary of the findings from her recently published review of mass media
campaigns to change health behaviours. Professor Wakefield has a long association with Cancer
Prevention.
In her presentation she said that:
“Messages require careful development and pre-testing with target audiences.”
“Sharing and recycling is desirable, but pre-test locally to be sure.”
“Efficiency – greater role for recycling/adapting existing high performance ads for use in
other countries – Maximise the funding directed to broadcasting of ads, instead of making
them from scratch.”
Even with effective ads, her experience was that “Media campaigns have relatively short-term
effects on behaviour and so require ongoing investment”. Among other things, her conclusions
supported the need to maximise funds into the broadcast rather than the production of messages.
Successful Emotional Appeal Advertising is More Expensive to Produce
After a review of Mass Media Campaigns for Road Safety (led by Professor Max Cameron of Monash
University) undertaken in 2004, one of the main conclusions was that “campaigns with a persuasive

13 | P a g e
orientation and that use emotional rather than rational appeals, tend to have a greater effect on the
relevant measure of effect.”
Most of the campaigns that have been included in advertising effectiveness reviews have used
emotional appeal, and effective emotional-oriented advertising is relatively expensive to produce. In
a paper (updated report July 2013) on the effectiveness of road safety advertising by the Centre for
Accident Research & Road Safety (CARRS) – Queensland University of Technology, the estimated
median cost for TV advertisements for “real” documentary style advertising was circa $450,000. It
was further estimated that the Victorian TAC has made extensive use of emotional appeal
advertising typically and invests between $250,000 and $450,000 per commercial on TV advertising
production with the variation in cost (determined by complexity of content and message).
In a 2011 Meta-analysis (Phillips, Ulleberg Vaa) of the relationship between mass media advertising
and reductions in fatal and serious injury crashes, the results of 119 campaigns from a wide range of
jurisdictions, calculated that there is a 9% reduction in accidents that can be confidently attributed
only to the contribution of road safety advertising. This was a similar conclusion to those of two
previous Meta-analyses (Delhomme, 1999; Elliot, 1993). Elliot (1993) evaluated campaigns targeting
drink-driving, pedestrian safety and seat-belt use. This study concluded that the evaluated
campaigns contributed a 7.5% reduction in measured outcomes. Delhomme’s (1999) review of the
evaluations of road safety campaigns with themes related only to driver behaviour concluded that
there was an average 8.5% reduction in crashes during the operation of a campaign.
Crash reductions as a result of road safety campaigns of 7.5%, 8.5% and 9%, while significant were
much lower than some earlier studies. Statistically significant low alcohol hour crash reductions for
the 1990 Victorian “Don’t fool yourself – speed kills” campaign were 24% in Melbourne, and 21% in
rural towns. The earlier studies were at a time when there was a much smaller body of road safety
advertising research available, and when serious accidents per 100,000 population were much
higher than they are today.
When reviewing these findings it needs to be kept in mind that:
Unsuccessful campaigns are probably less likely to be published than successful
campaigns; and
Generally the crash incident analyses reviewed periods prior to advertising pressure,
with those during and immediately after campaign activity.
It follows that it can’t be assumed that these reductions are permanent, as it could be argued that
measures taken immediately after advertising flights would only be representative of ongoing
reductions if the advertising was ongoing.
Having reviewed a broad range of Road Safety TV advertisements in this project, the striking
observation is their consistently high TV production values.
High production values combined with creative messaging, guided by behaviour change theories
increases the chances of producing effective, memorable campaigns.

14 | P a g e
Successful Campaigns Need High Quality, Creative and Meaningful Advertising
Because mass market social marketing campaigns achieve change gradually and consistently, most
campaigns are regularly tracked, making it possible to relate advertising impact to non-crash
campaign measures like unaided and prompted recall. With relatively modest levels of campaign
pressure, high levels of post campaign advertising awareness is common.
These high prompted campaign measures are evident in the Office of Road Safety’s own tracking
reports: 68% prompted TV awareness - Drink Driving “OK is not OK” July 2012 (Metrix consulting),
57%-62% - Drink Driving “You Deserve It”, 65%-78% - Seat Belts “Sash”.
High awareness levels are also evident in other campaigns from other jurisdictions. For the Victorian
TAC; 89% prompted awareness among motor cycle riders – Motorcycle Safety “Motorcycle
Reconstruction” TVC (Wallis Research Wave 4, 2013), 73% - Motorcycle Safety “The Ride” TVC
(Wallis Wave 5, 2013).
In NSW in 2012, 80% of drivers surveyed recalled seeing the advertising for the new Drink Driving
“What’s your plan B?” campaign (NSW Centre for Road Safety). Ongoing tracking of the long running
NSW speeding campaign “Don’t Rush”, has 80% prompted recall of “Multiple Choices” and
“Testimonials” campaign materials. (NSW Centre for Road Safety). The 2007 “Pinkie” speeding
campaign targeting young male drivers achieved 97% recognition (Watsford/TNS 2008), and 95%
among the general population.
The 2012 Drink Driving “Think before you drink. Think twice before you drive” for the Queensland
Department of Transport and Main Roads, achieved 67% prompted awareness for their “Reflections
– anxious and uncertain” TV/Online video campaign among all drivers, and 88% among drivers who
admit to drinking and driving.
The evidence is that high quality road safety TV advertising gets remembered.
A feature of many of Road Safety campaigns is their ability to build and sustain awareness with
relatively low, yet meaningful levels of ongoing advertising pressure. Prompted Awareness of the
WA Seat belts “Sash” remained at 69% between May and August 2012 with around 40 TARPs/week.
Quality TVC’s are More Memorable and Can Allow Reduced Weekly TV Expenditure
The varying abilities of individual commercials to be recalled, was dealt with in some detail in the
2004 (Cameron, Delaney et al) “Review of Mass Media Campaigns in Road Safety”. This paper
introduced a concept known as Adstock; an enhanced function of TARPs which integrates the impact
of recent advertising with the retained awareness of past advertising. While this concept was
developed for brand advertising, it calculates the decay rate of any TV commercials. When the half-
life of an ad is calculated, media planners can provide evidence-based recommendations on how
little advertising pressure is required to sustain awareness, or how much additional pressure is
needed to increase it etc. The Adstock notion has also been used in other Mass Media Social
Marketing campaigns to extend the periods of influence of anti-tobacco, melanoma and breast
cancer screening. The clear implication of the Cameron et al findings is that more memorable ads
require fewer TARPs.
15 | P a g e
In summary, calculations of reductions in serious road crashes attributable to Road Safety
campaigns indicates they require high quality advertising, usually requiring bigger production
budgets, but that the cost for the higher production quality pays out because of the additional
media coverage being more affordable due to the lower media weight required.
The Need for an Increased Budget for Greater Advertising Activity
The realisation of crash reductions cannot be assumed without high quality campaign material, and
that comes at a cost. Nor can crash reductions be assumed without regular media advertising
pressure. High quality ads tend to have a reduced decay half-life, which can stretch a media
campaign’s period of influence, without increasing media costs as they have greater impact at lower
weights than otherwise would be required .
An important consideration for a relatively small jurisdiction like Western Australia is that while
media costs are scalable in proportion to an interstate market’s population, campaign development
and production costs are not. Any campaign developed exclusively for Western Australia will
struggle to match the achievements of larger states where the production cost will have a much
lower handicapping of its broadcast and longevity.
This is discussed further within the section “Level of Resources Allocated to Campaigns, wherein it is
detailed that due to lower media costs, the proportion of production spend in Western Australia will
be up to three times greater than in other mainland states (excluding SA).
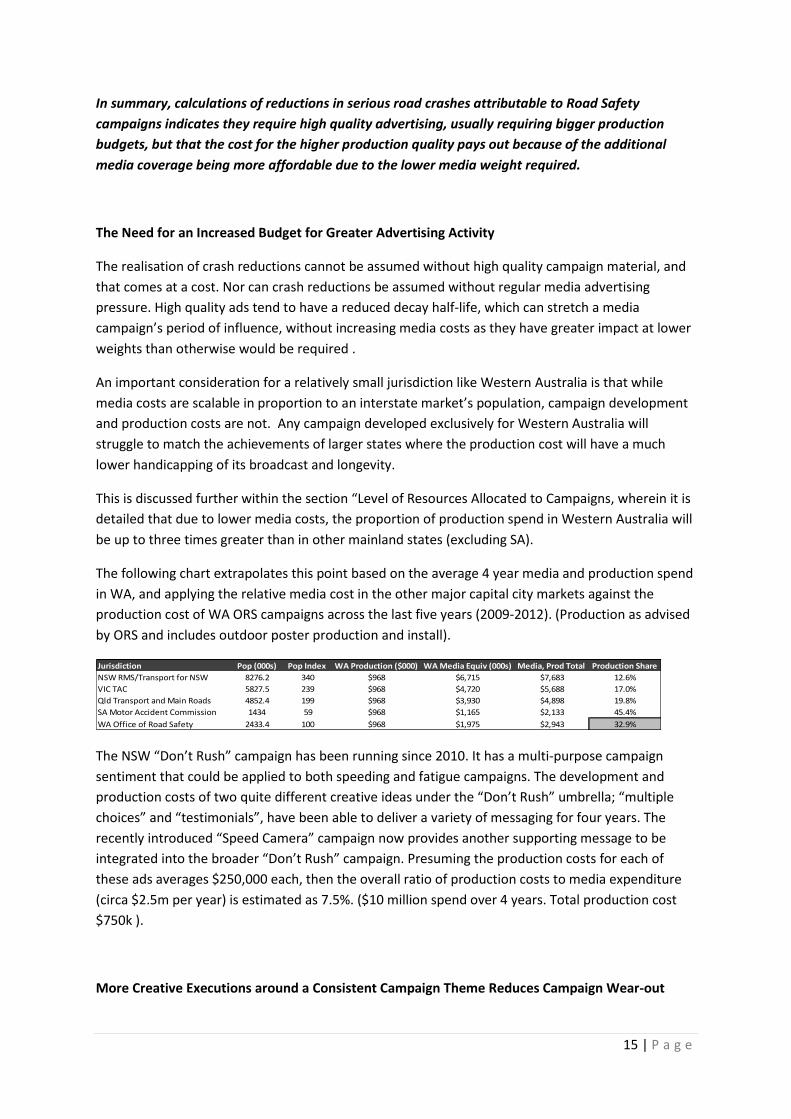
The following chart extrapolates this point based on the average 4 year media and production spend
in WA, and applying the relative media cost in the other major capital city markets against the
production cost of WA ORS campaigns across the last five years (2009-2012). (Production as advised
by ORS and includes outdoor poster production and install).
Jurisdiction Pop (000s) Pop Index WA Production ($000) WA Media Equiv (000s) Media, Prod Total Production Share
NSW RMS/Transport for NSW 8276.2 340 $968 $6,715 $7,683 12.6%
VIC TAC 5827.5 239 $968 $4,720 $5,688 17.0%
Qld Transport and Main Roads 4852.4 199 $968 $3,930 $4,898 19.8%
SA Motor Accident Commission 1434 59 $968 $1,165 $2,133 45.4%
WA Office of Road Safety 2433.4 100 $968 $1,975 $2,943 32.9%
The NSW “Don’t Rush” campaign has been running since 2010. It has a multi-purpose campaign
sentiment that could be applied to both speeding and fatigue campaigns. The development and
production costs of two quite different creative ideas under the “Don’t Rush” umbrella; “multiple
choices” and “testimonials”, have been able to deliver a variety of messaging for four years. The
recently introduced “Speed Camera” campaign now provides another supporting message to be
integrated into the broader “Don’t Rush” campaign. Presuming the production costs for each of
these ads averages $250,000 each, then the overall ratio of production costs to media expenditure
(circa $2.5m per year) is estimated as 7.5%. ($10 million spend over 4 years. Total production cost
$750k ).
More Creative Executions around a Consistent Campaign Theme Reduces Campaign Wear-out

16 | P a g e
The ability to support the same campaign theme “Don’t Rush” with very different but aligned
creative executions reduces wear-out. This was the conclusion from a paper – Advertising wear-out
in the Transport Accident Commission and road safety campaigns (Fry 1996). Fry concluded that “the
large impact of the individual advertisements have, coupled with the strategy of rotating different
creative executions, made it difficult to identify strong statistical evidence of wear-out.”
There has been no road safety campaign tracking in Western Australia since early 2012. Without
campaign tracking research, advertising wear-out would go undetected, and the risk of investing
precious media funds behind worn out creative material increases.
The potential “Catch 22” for smaller states is that higher relative production costs reduce their
ability to create and produce their own pool of creative executions, which increases the likelihood of
wear-out for their campaigns.
With a third of the media budget of NSW, the creation and production of advertising for Western
Australia, rather than recycling or repurposing successful advertising from other jurisdictions, is a
much less affordable proposition.
The potential application of existing material to a broader state-wide audience
To address this requirement of the project we requested that interstate jurisdictions provide access
to their recent campaign materials. In all cases we were referred to their individual websites from
which we accessed their most recent campaigns for the key road safety issues that impact WA road
safety, i.e.
1. Speed
2. Drink Driving
3. Safer Vehicles
4. Restraint
5. Distraction/Fatigue
We then reviewed each of these campaigns to identify the potential for use in Western Australia.
We concentrated our efforts on television material as this is the highest cost production element of
each campaign, and generally the source of elements for other media e.g. online, print, outdoor.
In order to understand the relevance of each TVC for telecast in Western Australia, the content of
each TVC was categorised as “Generic”, “Adaptable” or “Heavily State Biased”.
A listing of those TVCs is included in appendix 1.
In summary, we identified the following TVCs that could be edited at minimal cost for telecast in
WA:

17 | P a g e
Issue NSW Vic SA Qld Tas TOTAL
Speed 1 1 1 1 1 5
Drink Driving 1 1 1 2 1 6
Safer Vehicles 0 1 0 0 0 1
Restraint 1 0 0 1 0 2
Distraction/Fatigue 3 1 3 1 0 8
TOTAL 6 4 5 5 2 22
Our contracted Director/Producer then reviewed each TVC to identify the likely costs involved to
edit each of the TVCs to obviate any state bias and ensure each TVC would be effective in resonating
with the WA audience. That assessment, detailed by state, follows.
Summary of production costs and savings edit those TVCs from interstate jurisdictions
STATE Issue Title Max Cost to Produce Max Revision Cost Savings Average Saving %
NSW Speed Don't Rush $227,000 $23,000 $204,000 90%
Drink Driving Plan B $374,000 $26,000 $348,000 93%
Restraint Clip Every Trip $200,000 $5,000 $195,000 98%
Fatigue Don't trust your tired self - Metropolitan $200,000 $6,000 $194,000 97%
Don't trust your tired self - Regional $200,000 $6,000 $194,000 97%
Distraction Get your hand off it $200,000 $2,000 $198,000 99%
VICTORIA Speed Wipe off 5 $400,000 $6,000 $394,000 99%
Drink Drive Bloody Idiot $300,000 $2,000 $298,000 99%
Safer Vehicles How safe is your car? $200,000 $2,000 $198,000 99%
Distraction Safer P Platers $200,000 $2,000 $198,000 99%
SOUTH AUSTRALIA Speed Creepers $180,000 $6,000 $174,000 97%
Drink Driving Just over $180,000 $16,000 $164,000 91%
Distraction Mobile Phone - Call/Email/Twitter (Series) $500,000 $15,000 $485,000 97%
QUEENSLAND Speed Slow Down Nightmare $200,000 $3,000 $197,000 99%
Drink Driving Police Presence Police Presence/Anxious and Uncertain series $400,000 $32,000 $368,000 92%
Restraint Better Buckle Up $350,000 $12,000 $338,000 97%
Distraction/Fatigue Kids/Mobile Phone/Fatigue Series $350,000 $22,000 $328,000 94%
TASMANIA Speed Speak Up $200,000 $1,000 $199,000 100%
Drink Driving How to be a Real Mate $200,000 $1,000 $199,000 100%
$5,061,000 $188,000 $4,873,000 96%
$266,368 $9,895 $256,474 96%
TOTAL
AVERAGE TVC COST- 19 TVCs (includes series as one item)
INTERSTATE PRODUCTION COSTS AND ESTIMATED EDIT COSTSS
The potential impact on local production firms
From a financial perspective adaption of interstate campaigns would provide savings to the West Australian Government. For the period 2009/10 to 20011/12, the annual average campaign production expenditure for WA ORS is as follows:
Mass Media Campaign Production ThreeYear Ave. 2011/2012 2010/2011 2009/2010
Speeding Behaviour Community Education 219,667$ 294,000$ 350,000$ 15,000$
Speeding Enforcement Community Communication and Education 122,500$ 267,500$ 100,000$ -$
Restraints Community Education 145,000$ 185,000$ -$ 250,000$
Drink Driving Behaviour Community Education 333,333$ 350,000$ 300,000$ 350,000$
Drink Driving Enforcement Community Education 30,400$ 91,200$ -$ -$
Distraction Community Education 116,667$ 150,000$ 200,000$ -$
Total 967,567$ 1,337,700$ 950,000$ 615,000$
Production Allocation - Mass Education Campaigns

18 | P a g e
Included within these totals are:
Outdoor production costs (printing and installation) circa $250k
Community Materials circa $10k
Digital Creation and Development ($20k license cost)
Excluding the above, approximately $688k is allocated to TVC production per annum
We identified earlier that the average edit costs of adapting suitable interstate material is approximately 4%.
Worst case scenario is a saving of 90%. Applying this saving to the three year average production cost of $688k would realise a saving to the WA Government of approximately $620k per annum.
This figure excludes talent fees. In the absence of interstate jurisdictions’ talent contracts it is not
possible to estimate additional cost for telecast in WA
o ORS has estimated this may be as high as $230k. This cannot be confirmed or disputed.
o If the full impost of the talent fee projection is applied (unlikely), ORS would still realise a
production saving of circa $390k.
The adoption and adaption of interstate material will enable ORS to maximise funds into the
broadcast rather than the production of messages.
With regard to the impact on Perth/WA based production companies, Yellow Pages lists over 70 television production companies located in Perth. If we limit our scope to 10, then the impost on the average company would be gross < $65k. ($620k/10). Therefore impact on the local production industry would be minimal.
The willingness and basis for other jurisdictions to share existing material
In our discussions with the jurisdictions, there is a willingness to share existing material. Any
amendments of course would be at the expense of ORS. The costs to amend material have been
detailed. These are as advised by a Director/Producer.
Recommendation
The adaption of relevant interstate TVCs will provide real savings to the ORS, of up to $390k per
annum.
This saving could be reinvested in media time and space to achieve more effective continuity of ORS
road safety messaging to WA drivers.

19 | P a g e
2. The Level of Resources Allocated to Campaigns

20 | P a g e
The Level of Resources Allocated to Campaigns
The expenditure allocated in other states towards road safety campaigns in the Mass Media;
The expenditure allocated in other states on digital advertising for road safety campaigns inother states;
The expenditure allocated in other states towards road safety campaigns in the socialmedia;
The proportion of road safety advertising expenditure used in producing road safetycampaigns in other states compared to Western Australia and the percentage of the totalexpenditure in media placement for such campaigns in each of those states;
The correlation to the level of expenditure on road safety advertising and the road toll per100,000 in each state; and
Whether academic research supports the above correlation.
The expenditure allocated in other states towards road safety campaigns in the Mass Media
The following expenditure figures were sourced from AC Nielsen Adex data, an independent third
party monitoring service that estimates media spend.
Adex does not have access to actual client rates, therefore value is based on a generic rate card
from which discounts relative to the client’s estimated total expenditure in each medium are
applied. Further it excludes regional radio and regional press, programme syndicators, suburban
press and fails to capture accurate online investment figures (including social). These figures are
therefore a guide only.
We have been advised that these figures are under-estimated by approximately 50%.
While we recognise the significance of this under-reporting, we believe the Adex data does provide
measurement of individual jurisdictions from a comparable base for those mediums that are
measured.
Within Appendix 3 we provide a summary of spend by jurisdiction, by calendar year for the period
2009-2013 inclusive.
For 2012 total allocation by medium as measured by Adex is as follows.
JURISDICTION Share TOTAL MET TV REG TV MET PRESS REG PRESS MAGS MET RADIO ONLINE CINEMA OUTDOOR
NSW RMS/Transport for NSW Total $7,901 $1,865 $1,151 $135 $35 $26 $628 $267 $377 $3,417
Share 100% 24% 15% 2% 0% 0% 8% 3% 5% 43%
VIC TAC Total $11,699 $3,640 $578 $224 $391 $214 $852 $3,069 $160 $2,571
Share 100% 31% 5% 2% 3% 2% 7% 26% 1% 22%
Qld Transport and Main Roads Total $2,246 $700 $385 $37 $119 $0 $40 $31 $0 $934
Share 100% 31% 17% 2% 5% 0% 2% 1% 0% 42%
SA Motor Accident Commission Total $3,805 $2,226 $0 $93 $0 $0 $809 $41 $267 $369
Share 100% 59% 0% 2% 0% 0% 21% 1% 7% 10%
WA Office of Road Safety Total $2,664 $1,211 $437 $191 $0 $0 $234 $20 $84 $487
Share 100% 45% 16% 7% 0% 0% 9% 1% 3% 18%
Total Total $28,315 $9,642 $2,551 $680 $545 $240 $2,563 $3,428 $888 $7,778
Share 100% 34% 9% 2% 2% 1% 9% 12% 3% 27%
Road Safety Media Expenditure 2012. Source AC Nielsen Adex Data

21 | P a g e
Usage by medium fluctuates by jurisdiction from year to year, however for 2012 we observe
television and outdoor as the most dominant media in all jurisdictions.
This is not a surprising strategy as television provides an emotive appeal to drivers to change their
driving behaviour, while outdoor provides visual reinforcement of this appeal reaching the target
audience while driving.
It is only the TAC who has invested significantly in online activity, an important observation when we
consider the changing media consumption habits of young males, the core ORS target.
These media spend figures need to be reviewed relative to market size to provide a realistic
comparison of spend between markets. The following chart extrapolates media spend per 100,000
head of population for the period 2012:
Jurisdiction Spend '000s Spend per 100k pop Index to WA
NSW RMS/Transport for NSW $7,901 $95.47 87.20
VIC TAC $11,699 $200.76 183.38
Qld Transport and Main Roads $2,246 $46.29 42.28
SA Motor Accident Commission $3,805 $265.34 242.37
WA ORS $2,665 $109.52 100.00
TOTAL $28,316 $124.07 113.32
TOTAL EX TAC $16,617 $97.77 118
2012 State Media Spend Index to WA per 100k Population
The consistently high spend of TAC skews the national average, hence we have viewed the
proportion of spend per 100,000 population on both a national basis, and excluding TAC. In 2012
Adex spend indicates the national average spend on road safety media is 13.3% greater than that
allocated in WA by ORS. When TAC is excluded, the national average reflects an 18% higher spend
per 100,000 population than ORS. However for this year, the index varies wildly by state.
One year cannot be observed in isolation, as Government budget allocation per market can fluctuate
significantly from year to year, (as can be observed in Appendix 3).
The following chart details the four year average for 2009-2012 spend per 100,000 population per
jurisdiction and indexes this against the ORS allocation.
On this basis we can observe that ORS expenditure is lower than the national average (ex TAC),
although skewed by a relatively lower spend in Queensland. (Please note that as 55% of the
Queensland population is rural, regional spending, not captured by Adex, would most likely
contribute an to under reported total).
Jurisdiction Spend '000s Spend per 100k pop Index to WA
NSW RMS/Transport for NSW $8,391 $101.39 124.94
VIC TAC $11,361 $194.96 240.24
Qld Transport and Main Roads $2,931 $60.41 74.44
SA Motor Accident Commission $2,203 $153.64 189.33
WA ORS $1,975 $81.15 100.00
TOTAL $26,862 $117.69 145.03
TOTAL EX TAC $15,500 $91.20 112.38
2009 - 2012 Average Media Spend Index to WA per 100k Population

22 | P a g e
Review of the proportion of road safety advertising expenditure used in producing road safety
campaigns in other states compared to Western Australia and the percentage of the total
expenditure in media placement for such campaigns in each of those states
None of the interstate jurisdictions has provided the production expenditure information requested,
hence we are unable to provide DPC with a direct comparison of the proportion of costs allocated to
media and production.
It needs to be recognised that while production costs are relatively stable across Australia, the price
of media is determined by its reach potential, and therefore as media costs are lower in Western
Australian than in the larger population states, the production costs will be similar. The proportion
of budget allocated to production will therefore be higher in Western Australia.
On the following chart we extrapolate this point based on the average 2009-2012 media and
production spend in WA, and applying the relative media cost in the other major capital city markets
against the production cost of WA ORS. (Production totals as advised by ORS include outdoor
printing and install).
Jurisdiction Pop (000s) Pop Index WA Production ($000) WA Media Equiv (000s) Media, Prod Total Production Share
NSW RMS/Transport for NSW 8276.2 340 $968 $6,715 $7,683 12.6%
VIC TAC 5827.5 239 $968 $4,720 $5,688 17.0%
Qld Transport and Main Roads 4852.4 199 $968 $3,930 $4,898 19.8%
SA Motor Accident Commission 1434 59 $968 $1,165 $2,133 45.4%
WA Office of Road Safety 2433.4 100 $968 $1,975 $2,943 32.9%
The above table reflects that due to the lower media costs, the proportion of production spend in
Western Australia will be up to 2.6 times greater than in other mainland states (excluding SA).
This factor does lend weight to closer consideration of adapting interstate campaigns where we
have demonstrated that production savings can be greater than 90%.
The correlation to the level of expenditure on road safety advertising and the road toll per 100,000
in each state.
The following fatality data for the period 2009 – 2012 was sourced from the Australian Government
website, with fatalities per 100,000 population extrapolated from state population data sourced
from the Australian Bureau of statistics.
As stated earlier, media spend figures are based on estimates as provided by Adex, and we recognise
that these may be approximately half of actual spend. It is the relativity between the figures that is
in consideration.
In all markets fatalities per 100,000 population has declined, while media spending is trending
upwards (except in Queensland).

23 | P a g e
We are not surprised to find there is no direct correlation between cross market spend and fatalities
per 100,000 population.
Each state has its own specific circumstances, determined by urban rural population splits, distances
between major cities and towns, condition of roads etc.
In our experience, the comparison between media expenditure and most marketing measures is
relatively weak. In a long term anti-tobacco marketing program, a reduction in a Quit campaign
budget of 20% in a particular year would be unlikely to result in a lift in smoking prevalence.
Similarly, a lift of 50% in a year would not result in an immediately recognisable decline. A new
brand entering a market to compete with established brands will invest disproportionately more
than its short term share of market objectives. It would not be expected that that brand’s share of
sales would match its increased share of advertising in that year or the year after.
New systems of media expenditure measurement have been introduced in recent years, but they all
have gaps. One notable gap is the exclusion in most measures of the expenditure directed to
catalogues. According to the 2011 ABS Census catalogues reach over 18 million Australians a week. It
is a $1.5 billion dollar business; around half the value of FTA TV, but it is only included in the annual
PWC Media Outlook report which measures high level trends, but not category or advertiser details.
Consequently, any analysis trying to make sense of the relationship between advertising activity and
share of sales for Supermarket brands would be fairly pointless if it didn’t have a way of accounting
for the proven in store traffic-driving influence of catalogues.
As stated earlier Adex provides detailed category and client expenditure data on most large media
channels, but it excludes PayTV ($450m PA), Regional Radio, Regional Press, Program syndicators,
Suburban press, Trade magazines and much of the Online Investment.
Without detailed media expenditures from jurisdictions in other states, this report leans heavily on
Adex data for interstate media expenditure comparisons.
2009 2010 2011 2012 2009-2012
NSW Fatalities 6.4 5.6 5.0 5.0 5.5
Spend $67.02 $127.12 $115.93 $95.47 $101.39
Fatality Index YoY 100.0 88.2 88.9 100.1 86.3
Spend Index Yoy 100.0 189.7 91.2 82.4 151.3
VIC Fatalities 5.4 5.2 5.1 5.0 5.2
Spend $168.32 $229.33 $181.43 $200.76 $194.96
Fatality Index YoY 100.0 97.9 98.1 96.5 96.7
Spend Index Yoy 100.0 136.2 79.1 110.7 115.8
QLD Fatalities 7.6 5.6 6.0 6.1 6.3
Spend $71.12 $65.33 $58.90 $46.29 $60.41
Fatality Index YoY 100.0 74.05 106.07 101.90 83.2
Spend Index Yoy 100.0 91.86 90.16 78.59 84.9
SA Fatalities 7.4 7.2 6.3 5.7 6.6
Spend n/a $87.73 $259.34 $265.34 204.14
Fatality Index YoY n/a 100.0 86.5 90.4 78.2
Spend Index Yoy n/a 100.0 295.6 102.3 232.7
WA Fatalities 8.4 8.3 7.5 7.3 7.9
Spend $32.01 $97.19 $85.89 $109.48 $81.14
Fatality Index YoY 100.0 98.6 89.9 98.2 93.6
Spend Index Yoy 100.0 303.6 88.4 127.5 127.5
Fatalities/Spend per 100,000 population

24 | P a g e
The Significant Differences in Inherent Geo-demographic Profiles from State to State
A significant variable in Road crashes is the portion of a state’s population residing in regional, rural
and remote areas. A bigger percentage of young people in regional Australia have a driver’s license
(Roy Morgan Perth versus Regional WA). A bigger portion of young people in regional Australia
regularly consume alcohol (Roy Morgan) than in the metropolitan areas. Young drivers in regional
markets are more likely to have recently visited a hotel or licensed club than in metropolitan areas.
Trip lengths in regional markets are longer, and average speeds are higher. There is a much higher
proportion of drivers from a Middle Eastern, South Asian or South East Asian cultural background in
metropolitan areas and they tend to have different customs in regard to alcohol than Australians
with an Anglo-Celtic or Indigenous heritage. The latter are over-represented in regional populations.
A Higher Concentration of Lower Socio-economic Segments in Regional Markets
Finally, the target segments most at risk for many problems addressed via mass media social
marketing campaigns are people in the lower socio-economic groups, and they too are a bigger
proportion of regional populations. Drivers from lower SES groups drive older vehicles which may
influence vehicle road worthiness. Also, in our experience, the appreciation of the implied social
contract of road courtesy and user inter-dependence is lower among those with lower education
and socio-economic status, as are levels of concern for legal consequences and perceptions of the
likelihood of getting caught in enforcement programs.
It follows that jurisdictions with large proportions of their population in highly urbanised
environments (like ACT) tend to have lower fatalities per 100,000 persons than those with portions
of residents in remote and very remote communities (like the Northern Territory and Western
Australia). These social factors are likely to have a greater weight of influence on road crashes than
advertising.
Given that little can be done about the inherent social and demographic conditions which contribute
to vehicle crashes from one geographic region to another, the report considered an alternative
approach to comparing road safety advertising expenditure from state to state. The report
investigated the possibility of comparing the rate of improvement in road safety metrics from year
to year, and from one state to another.
In their 2011 Meta-analysis of 119 Road Safety campaigns Phillips/Ulleberg/Vaa gave an overall
estimate that road safety campaigns coincided with an average 9% reduction in serious accidents.
They noted a tendency for campaigns to be less effective over time, especially in jurisdictions that
have had a long history of road safety marketing investment.
In the document “Preliminary Fatal and Critical Injuries on Western Australian Roads – 2013
Summary”, a graph compares the fatality rates per 100,000 persons in WA versus all of Australia.

25 | P a g e
Evident from that graph is that the rate of decline for “All of Australia” has reduced since 2011. It
also shows that the WA rate of decline has been greater than the Australian rate since the
implementation of “Towards Zero” in 2008. These observations are consistent with the trend
identified in the 2011 Meta-analysis.
We concluded that a comparison in the rate of decline from state to state would mean comparing
states as if they were in the same state of maturity in the longevity of road safety campaigns
when, in fact, they are not.
The Need for Research
The management consultant Peter Drucker once said that “what gets measured, gets managed”.
It is the nature of most media advertising campaigns that progress is gradual. Some desired
behaviours can be instantly obvious like calls to a Quit line. However, calls to the Quit line rapidly
decline once the advertising pressure ceases, but this won’t mean that the campaign has stopped
working. Measures of those intending to quit, can remain high well after a campaign.
What can’t be gauged without ongoing tracking are the more subtle changes such as sentiment,
attitudes, scale of awareness, which campaign elements most effectively achieve recognition,
consideration, commitment or clarity. Nor is it possible to know relative message strength,
persuasiveness, wear-out or self-reported behaviour. Success usually requires small, consistent but
gradual positive shifts on a relatively small range of measures.
Road Safety campaigns in NSW and Victoria are tracked via quantitative surveys. Elsewhere in this
report there are quotes regarding the results of Queensland road safety campaigns which indicate
that at least campaigns for the major issues are subjected to post-campaign surveys. As part of the
briefing material by the ORS, we received copies of survey reports for Western Australian campaigns

26 | P a g e
in the up to and including 2012. We were told that these were discontinued. Without it, it would be
hard to see how evidence-based improvements can be achieved.
Since at least 2002 road safety campaigns in NSW have been tracked. The old NSW Roads and Traffic
Authority requested tenders, and made long-term research partner appointments for continuous
tracking (12 waves per year). This provided a constant read on major campaigns for speeding, drink
driving, seat belts and fatigue. It also allowed for regular surveys for smaller or regionally specific
campaigns such as Mobile distraction, speed cameras, Heavy vehicle point to point, School safety
zones, Motor cycle safety, Enhanced enforcement blitzes, and Double demerit periods. While this
system has its critics, because it leans heavily on standardised questions, it is generally regarded as
cost effective.
Costs for quantitative surveys vary considerably, and in our experience can range from around
$8,000 to $60,000 depending on the length of the questionnaire, the sample size (typically 400-800),
the ease of recruitment, the necessity to weight the count, the importance of difficult to recruit
target audiences; like those in very remote communities or those from a non-English speaking
background.
High end surveys begin broad and might cover sentiment to a wide range of areas for which states
are responsible. These compare the ranking of issues from time to time. After an extended dry
period in NSW and Victoria, water security might be spontaneously nominated as a high concern, at
other times it might be road safety, law and order, public education or health care.
At the next level might be attitudes/support for road safety initiatives; enforcement, speed limits,
speed camera detection, fines, use of mobile phones etc.
Then typically questions will test for top of mind awareness of any recent road safety advertising,
before presenting campaign materials to respondents to see whether they recognise them. This will
show/play recent advertising material and measure recognition by copy version or individual
channel, or combination of channels.
Most surveys probe for advertising diagnostics; how effectively are different campaign elements
working, are they clear, believable, distinctive, persuasive etc.? Finally, they will ask respondents
about the impact of the messages on their attitudes, intentions or actual behaviour.
Survey findings will be presented in face to face presentations highlighting statistically significant
shifts in measures, differences in responses in sub-groups, interpretations and implications on future
campaigns.
At the $8,000 end of the spectrum will be shorter surveys, piggy-backing existing panels, unweighted
for gender, specific age breakdowns, social grade or ethnicity. These tend to be restricted to a
comparatively narrow field of questioning, and check for headline measures like awareness of the
issue, advertising recognition, diagnostics, agreement with a small range of attitude statements
regarding effectiveness and consideration. For this cost the questionnaire would have been largely
constructed by the client, with minimum input by the survey company. Nor is it likely that there
would be a detailed face-to-face presentation of the findings, but the client would be provided the
raw tabulation for internal review and analysis.

27 | P a g e
Recommendation
An evaluation of available research does not support a direct correlation between advertising spend
and road toll per 100,000 population.
However with the exception of Queensland, it can be observed that a continually declining road toll is
accompanied by a trend of increased media expenditure.
To understand the impact of ORS Road Safety messages on audience behaviour will require on-going
tracking. Research has not been undertaken since 2012.
We recommend the ORS consider the implementation of continuous tracking for quantitative
interpretation of major road safety campaign initiatives.
The depth, frequency and range of initiatives will obviously determine final cost, however, assuming
quantitative tracking of three major campaigns, ORS should consider a budget reserve of circa $150k.
Other Considerations
The 2011 Meta-analysis estimated the statistical weight to a range of factors in accident prevention.
Metro versus Regional Funds Allocation
The report explored the relative importance of expenditure in Regional areas from one state to
another. As Road Safety campaigns are more effective in Regional areas, such a comparison would
show if this is reflected in Regional vs. Metro funds allocation.
From the Adex data we added Regional TV, Regional Press and Outdoor. Outdoor expenditure is not
divided into Metropolitan and Regional, however we know that in NSW and WA most of the outdoor
exposure is on roadside signage on Country Roads. In Victoria the TAC is also a Metropolitan
Outdoor advertiser, so the Victorian expenditure may overstate the Regional share. On this analysis
the states most strongly aligned in funding disproportionate Regional exposure are WA, NSW and
VIC.

28 | P a g e
Campaign Longevity
The second highest weighted factor from the Meta-analysis was campaigns of durations over 200
days (67%).
Most NSW campaigns would comply because of that state’s tendency to have lower weekly TV TARP
weights and more active weeks supported by year-round Regional Outdoor focused on speeding and
occasionally fatigue campaigns.
AC Nielsen data detailing weight of television activity for other states in 2013 expressed as Target
Audience Rating Points (TARPs) shows:
Jurisdiction Active Weeks Days Total TARPs Ave Week TARPs
NSW - RMS 29 203 2300 79
VIC - TAC 52 365 6990 134
QLD- TMR 39 273 3206 82
SA - MAC 44 308 8091 184
A review of the WA speeding and drink drive media campaigns indicate that 200+ day exposure
might apply to Regional Outdoor but not in the TV or radio campaigns for either Speeding or Drink
Driving.
Accompanying Enforcement Activity
Another highly weighted factor was campaigns supported by enforcement. Without the cooperation
of other states we aren’t able to make an assessment of this from state to state.
Road-side Message Delivery
In the Phillips et al Meta-analysis, campaigns that used Television, Radio or Newspaper had a higher
weight of contribution to success, but the report pointed out that those campaigns also dominated
the sample, so no conclusions could be drawn on their contribution. However it was possible to
identify that campaigns using roadside advertising represented over one third of all campaigns.
0%
10%
20%
30%
40%
50%
60%
Rgnl NSW Rgnl VIC Rgnl QLD Rgnl SA Rgnl WA
Road Safety Media Investment in Regional Markets% of State Budget 2011-2013
% of drivers % of investment

29 | P a g e
Major road safety campaigns seeking to establish the balance between exposure to those media that
can persuade and alter attitudes (like TV), and those that can do this while also impacting short term
driving behaviour (Radio and Outdoor) are commonly used in combination for themes like speeding,
drink driving and driver fatigue. In our experience, in post campaign tracking, TV is the most
recognised of the media used, Outdoor the next, Radio next and recognition of Online elements falls
well behind with media like in-venue and convenience advertising.
Digital and Social Media Expenditure
The Victorian TAC and more recently Transport for NSW campaigns have been employing larger
online budgets. 23% of the TAC’s expenditure between 2011 and 2013 was in Online. However, as
no other states provided detail of recent campaigns, we have again needed to look for informed
observations elsewhere.
Expenditure in Social Media is not measured by any syndicated advertising expenditure providers.
Social Media channels are those digital options that allow the interaction between the message
recipient and the sender. Popular platforms are Facebook, YouTube, Twitter, LinkedIn etc.
In a media plan, social media expenditure sits within the Online or Digital media section with paid
online display advertising, paid search and digital video. Online media progressively grew from 5% to
16% placed through Australia’s major media buying groups in the period 2007 to 2012 (Source SMI).
However, social media expenditure is not captured in that 16% figure. The reason is that most of an
advertiser’s expenditure on social media is spent on services rather than delivery.
General media investment trends show 45% of media billings placed through major media agencies
is placed in TV, between 10% and 15% of TV budgets are typically allocated to Digital TV (Catch-up
TV, YouTube and video placement site aggregators ) when targeting under 40 demographics.

30 | P a g e
We believe it would be sage to presume that in most states between 10% and 15% of budgets for
road safety campaigns for Drink Driving, Speeding and Mobile Distraction are invested in digital
video. As these three road safety issues are priorities for most states, they receive a
disproportionate share of funds, so it is likely that digital video is now being allocated an amount
equal to between 8% and 10% of Road Safety TV budgets. Viewers of these videos across a range of
sites are able to click through to a campaign landing page for more campaign-related information. In
NSW viewers of the Plan B online video were taken to a site where they could access public
transport timetables and other transport alternatives to driving home from a drinking occasion.
The fees for digital media services tend to be higher than those for offline media. Digital media
strategy fees are around 10% of digital budget, as are other media agency fees related to digital
media.
As a result of higher agency service fees, a lower portion of online media budgets are spent on
message delivery.
Service fees for the creative, production and management of social media campaigns require an
even greater percentage of the budget; so much so that a campaign with a large social media
component would allocate around 35% of the total digital budget to social media, and of that
around two thirds of the funds would be allocated to content creation, social media competitions,
production and social media management, and only about one third to delivery.
We don’t have details of the Transport for NSW “Get your hands off it” campaign, nor the TAC
“Town called Speed” campaign, but a review of the materials associated with these activities is a
good illustration of why such a large portion of social media funds is spent on idea development and
execution.
Consequently we believe that it would be safe to presume 20+% of major campaigns targeting men
under 40 would be allocated to digital and social media.
Recommendation
Because of the recent exponential growth of the impact of social media, combined with the need for
a body of on-going tracking over time, we are not surprised that there is nothing in the Academic
literature that we have sighted that provides evidence of the efficacy of social media in reducing
road crashes
Transport for NSW advised they are leery of the “direct” use of social media to connect with drivers.
Their “Speeding Pledge” social media campaign was met with hostile negativity. Their preference is
to connect with drivers in more indirect but “friendly” vehicles, e.g. NRMA
What is certain is that digital media forms have eroded the reach capacity of traditional media
forms, television in particular. This erosion is greatest against young males, the ORS core target,
where television activity is fragmented by digital alternatives, catch up television and video-pre-rolls.
It is not appropriate, nor the responsibility of this document, to identify what proportion of budgets
should be allocated to social and digital media for Road Safety messages.

31 | P a g e
This can only be determined by a review of the specific objectives of each campaign and the strategic
rationale for social media inclusion, and how this media form (along with other media components)
will contribute to the achievement of campaign objectives.
Within the section “Performance Indicators Used for Campaigns”, the report identifies that up until
2012, there has not been a requirement of the Media Agency to provide detailed documented
rationales for media strategy recommendations. Instead, this “was done in a forum/meeting with
ORS and ####### and creative agency discussions” (ORS).
It is imperative that the Media Agency is provided a detailed, non-prescriptive brief to which they
should respond with a highly documented, detailed, articulate and substantiated media strategy
recommendation for all media forms considered.

32 | P a g e
4. Performance indicators used for campaigns

33 | P a g e
Performance indicators used for campaigns
Analysis of pre and post-campaign research and the application of supporting academic research where appropriate. Attention should be given to the following:
The brief;
Target market: Metropolitan and Regional - state-wide;
Objectives: x% reach, no of TARPS (Total Audience Rating Points) etc., message recall, no. or% reduction in accidents/road toll;
Duration of Campaign;
Media Budget (with a comparison to expenditure in other states);
Media selection (including a comparison of the use of social media in other states and how itis used);
Production Budget Spend;
Media Buy: evaluate the effectiveness of the media plan – media selection – rate cardcomparison (invoiced); and
Post-campaign effectiveness, including reporting effectiveness, reach of advertising, andfrequency.
Introduction
Interstate jurisdictions did not supply the necessary data to compare schedules, message recall,
social media usage etc. We have therefore focussed on Office of Road Safety output, and applied
research as provided by ORS or sourced from ORS website, and other relevant data available in the
public domain.
Within this section we review the briefing process, the media agency’s response to the brief and the
resultant media plan, and post campaign reporting.
We also review documentation pertaining to the 2011/2012 “Enjoy the Ride” speeding community
education campaign
Please note that our review also can only rely on what is published and provided by ORS. We
understand that in developing media strategies, a series of meetings and undocumented
conversations would change the shape of recommendations and subsequent plans.
We have therefore reviewed the media plan developed for 2011/2012 in light of the research
released by Synovate in November 2011, which reviewed the launch of the “Enjoy the Ride”
campaign for the period March- August 2011
“Enjoy the Ride” Media Planning
A summary of the 2011 launch, and the prompted awareness scores achieved for the plan is as
follows:

34 | P a g e
Medium Length Cost Weeks Weekly Weight TARPs/Spots/ Imp 000s Awareness (Prompted) Population 18 plus (000s) Awareness 18+ Thousands CPA 000s
Met TV 180 83,665$ 2 25 50
30 208,751$ 10 100 1040
292,416$
Reg TV 180 8,253$ 2 12 24
30 41,073$ 10 100 1040
49,326$
M Radio 30 95,565$ 11 35 390 13 1448 188.24 508$
R Radio 30 51,740$ 10 15 150 22 489 107.58 481$
Online Various 50,000$ 20 233.9 4678 12 1937 232.44 215$
Outdoor Met Supersite 47,444$ 16 29 464 16 1448 231.68 205$
Outdoor Reg Supersite 76,092$ 17 1.3 22 35 489 171.15 445$
Buses Megasides 24,056$ 4 n/a n/a 7 489 34.23 703$
40 489 195.6 252$
Schedule /Awareness Summary March - July 2011
34 1448 492.32 594$
While we have projected a “Cost per Prompted Awareness 000s (CPA 000s), this should be viewed as
a guide only, as it is widely accepted that media awareness will often skew toward television as the
most dominant medium. This skew may under report the impact of other media and therefore
devalue their contribution to total awareness of this campaign.
Further it does not address the inherent strengths or impact of individual mediums. Obviously a 3
minute television TVC will have a vastly greater impact than an online banner ad. (The impact of the
3 minutes television spot has not been reported individually, however it should be recognised that
exposure was minimal in the launch phase i.e. <5% campaign weight, despite a cost share of >26%).
The percentage of people who recall seeing or hearing at least one component of the campaign is
47%. What can be readily appreciated from the above is that, not surprisingly, television generated
the greatest awareness, followed by outdoor and radio.
Billboard awareness in regional areas of 35% is high due to the coverage of 29 sites across regional
centres. Buses had the least recall, and the highest relative cost.
With 12% of spend, online enjoyed a surprisingly strong recall. It should be noted that the online
expenditure reported above excludes social media activity, where up to $200k was allocated
annually to generate campaign buzz in Facebook, Twitter, forums etc. Assuming allocation of
approximately $80k across the research period, this would increase the CPA 000’s to $559, a cost
comparable to that of television.
How did the above outcome influence the media Agency’s 2011/2102 planning for the second phase
of the campaign?
The 2011/2012 Plan
The Media Planner has adopted the same media mix for the second phase on “Enjoy the Ride”, with
the notable exclusion of bus activity, which considering the cost and contribution to awareness
levels, is a fiscally responsible move.
While the media used has remained relatively unchanged, the scheduling strategy has not. The 2011
launch schedule adopted a continuity approach to scheduling, with radio and providing a bridge
between television flights.
35 | P a g e
This is not the case in 2011/2012 where two flights of activity are scheduled. However we recognize
that speed enforcement is scheduled between these two bursts of advertising lending continuity
to the anti- speed message.
It is always presumptuous to comment on the structure of a media plan as doubtless is was
developed in collaboration with the ORS and the Creative Agency, however, a review of the plan and
2011 research outcomes lead us to the following observations.
Television
We recognise that the Media Planner has adopted similar weights to those of the successful
2011 launch, however, given the restriction of activity to 6 weeks we question the level of
exposure of the 3 minute version which consumed over 43% of the budget for just 90 TARPs.
A realignment of funds between lengths would afford up to a further 10 weeks exposure of
the 30 second spot
Radio
Activity could have been scheduled during inactive television weeks for both Enjoy the Ride
and Enforcement to provide extended continuity of the speeding message.
Online
Similar budgets to those allocated to the successful 2011 launch were scheduled, however,
rather than reprising a continuity schedule, online display funds have been concentrated
across a two month period.
Social media activity was maintained at a level of approximately $200k per annum.
In combination with online display, digital activity is allocated an estimated 17% of total
speeding budget (combined “Enforcement” and “Enjoy the Ride” expenditure.
We suggest the above changes could have enhanced the impact of the schedule. However, there
may well be strategically sound justification for the planning decisions taken. When schedules are
reviewed in retrospect, it underlines the absolute necessity that the Media Planning Agency should
provide ORS with a highly detailed rationale for the planning decisions taken, even if these are the
bi-product of collaboration between the ORS, Creative Partners and the Media Planning Agency.
Generic Strategy and Implementation Observations
We review systems, operations and reporting for the period 2012/2013 and 2013/2014, as this
represented the most recent modus operandi. A review of earlier (i.e. pre 2012) would potentially
lead us to evaluate systems and practices that had progressed from that date, hence our inclusion
of these observations.
Within this section we detail a number of observations that pertain to the calibre of brief and agency
response, and how they compare to best industry practice.
Specifically we reviewed:
1. The Client Brief

36 | P a g e
2. The Media Agency Response/Media Rationale
3. Post Analysis Reporting
1. The Client Brief
The overall impression of the media briefs reviewed is that they lack detail and are highly
prescriptive.
It is the responsibility of the media agency to challenge and tease additional detail to enable the
development of a well-considered and insightful strategy. It would appear from the Media Agency
responses we have reviewed that this is not the case.
Common Elements of the ORS Media Briefs are:
Main Objective
The Issue
Recent Statistics
Campaign Objective
Target Audience
Strategy
Timeline
Benefits
Draft Budget
While these are the basic elements of any communication brief, these areas should be populated
with more specific detail such as:
Target audience: Is mostly general “Primary: 17-39 year old male drivers. Secondary General
Driving Community of 17-59 drivers”.
Within this abroad age sector there are target subsets that would have a significant impact
on channel planning. What is the male to female ratio? How do fatalities/serious injury
statistics vary between age subsets e.g. 17-24, 25-39 etc.?
Geographic Considerations: Rarely is there reference to the relative importance of regional
versus metropolitan coverage. It is not possible for the media agency to identify relative
importance of each media opportunity in the absence of this data.
Campaign Objectives: Are often not quantifiable, thereby negating any measure of
campaign success. E.g. “Educate the Western Australian community about the benefits of
slowing down of education...rather than threatening the public about consequences “. What
are the current levels? What increase is targeted? Are education levels uniform across the
state?

37 | P a g e
Hard measures will require a greater level of rigor and market analysis from the media
agency to ensure they have reviewed and considered all relevant influences prior to
developing the media strategy recommendation.
Draft Budget: Again we understand that a budget breakdown is required to secure budget
approval, however as presented it suggests that the media strategy has been determined
prior to significant Media Agency involvement. Does the agency have the ability to add or
eliminate media once the budget is approved?
2. The Media Agency Response - The Media Rationale
The Media Agency rationales reviewed are very basic and do not project any level of strategic
thinking, rather they simply provide a description of the plan (generally as dictated by the brief)
without any qualifying rationale for the media selected and weights applied.
In fact the rationale appears to be a template, with evidence of “cut and pasting” between previous
campaigns.
An example of this can be seen in “Speed Behaviour” Jan-June 2014. Following the recommendation
to select Nine as the sole station to run this campaign, the document recommends that “TV is
planned across three stations delivering a reach of 60%-65% with a frequency of 5. Thirty sec TV only
– due to budget only Metro TV will be included.” This is the same wording that appears on the Dec
2013-April 2014 rationale. In this case the plan does recommend a three station buy.
Similarly, when detailing the “Target Audience” for the above rationale, wording is identical: “While
the core target for Road Safety campaign is Males 18-44, we would include media channels that
provide the widest reach to the greater community - People 18-54 years”.
A basic checklist Enth Degree applies to review media strategies/rationales, and our observation of
the ORS Media Planners is as follows:
1. Investigation of target audience beyond simple demography
Has the agency identified and/or considered the segmentation of the campaign target?
Have they considered the habits, attitudes and motivators of each sub segment?
How will these insights impact media planning? Why?
Clearly from the example detailed above, the agency delivers limited input in the review of
target profiles and their media habits.
2. Apparent use of Tools/Resources/Market Data
It is our experience that media buying agencies claim to have developed or purchased a
veritable armoury of planning tools. In the right hands they will enhance the calibre of the
strategy.

38 | P a g e
Is there evidence that these tools have been employed to develop the strategy? What
additional data have they identified? Does the output harness the benefits of these tools and
resources?
The ORS media rationales we have received do not reflect usage of any strategic planning
tools in the development of media recommendations
3. Consumer and market insights
Has the agency identified unique insights through existing and or bespoke research?
While the Media Planner’s response format does reference “INSIGHT”, these are basic
planning statements and are devoid of strategic insight.
4. Demonstration of how these insights effect strategy
How has the agency employed these insights? Have they effectively leveraged impact? (We
often see agencies claiming an insight that has not been harnessed in the media strategy and
is an opportunity lost to the advertiser).
Not applicable to the Media Agency’s current responses (see above)
5. Use of awareness tracking research where available
One of the most valuable tools a media agency can employ is client tracking research? How
has this been employed to influence the strategy?
While we appreciate that campaign tracking is limited, there is no evidence that the Media
Planner has reviewed or employed any learning from historical research.
6. Acknowledgement of competitive activity
Has the plan considered the impact of other activity likely to be scheduled within a similar
time frame that could enhance or detract from the efficacy of the campaign? For example,
what other Government campaigns are planned to reach the same target group? When have
competitors historically scheduled activity? What media do they use? How does this influence
the strategy or plan?
There is no reference to other Government or ORS campaigns that are scheduled for a
common period, or if they could impede or enhance the efficacy of the recommendation.
(However this is anecdotally addressed during the campaign review and approval process).
7. Rationale for market selection and weights
While Government campaigns generally target the entire state, are there geographic hot
spots that require up-weighting? Why? How will this be achieved?
Generally the Media Planner does not reference geographic priorities and/or opportunities
apart from “due to budget only metro TV will be included”.

39 | P a g e
8. Inclusion of innovative solutions where appropriate
Are their non-traditional media opportunities that will lend disproportionately high impact to
the campaign? Has the agency identified first in market opportunities? Can new media
opportunities be developed to efficiently reach a tightly focussed target group?
Not evident in the material reviewed to date.
9. Articulation of communication goals
What is the desired reach and effective frequency range for the campaign? What evidence is
there to indicate that this is the most effective weight and scheduling strategy?
It appears that the agency plans on what is affordable, with little to no rationale provided or
documented for the recommended weight (TARP/Reach/Effective Frequency) or shape
(continuity/flighting, etc.) of the plan.
10. Rationale for media selection
While this seems an obvious inclusion, what we look for here is a well-considered allocation
of budget to individual media. In today’s highly fragmented media marketplace we often see
plans that attempt to include a multitude of media options to cover all bases, when in fact
the weight of each is too low to be impactful. How has the agency determined the media
recommended and how does each contribute to achieving the campaign objectives?
Our observation is that the ORS Media Planner replicates the brief as delivered by ORS with
minimal additional consideration. No rationale is evident as to how or why expenditure is
allocated between media.
.
11. Strategy leverage of creative idea
Media should not be planned in isolation of the creative strategy. Has the agency
collaborated with the creative Agency to develop media plans (and equally to assist where
required in the development of the creative strategy?) How has the media agency harnessed
the creative strategy to amplify impact of in the media vehicles recommended?
Not documented.
12. Evidence of original thought
Throughout the development of the Media Strategy and Plan, has the media agency
demonstrated a degree of creativity that provides additional impetus to the plan beyond the
traditional solution?

40 | P a g e
We see no evidence that the ORS Media Planner has injected creative thinking into the
development of media strategies, but appear to take the path of least resistance which is to
replicate the client brief.
Our exposure to the ORS Media Planner output indicates that they have not applied best practice
media strategy development for ORS.
Please note that the above observations relate to the media rationale documents supplied for
2013/2014 campaigns.
We requested the equivalent documents from ORS for 2012/2013 campaigns, but were advised that
the Media Agency did not provided media strategy rationales for campaigns as “this all occurred
verbally”. The Media Agency eventually did provide 2012/13 Media Rationales for Regional
Restraints and Speed and Drink Driving, however, as they are written in past tense, they appear to
have been constructed as a post campaign rationalisation. See Appendix 4
Enth Degree Recommendation
ORS briefing documents and the Media Agency response are not representative of best practice
and require a significant realignment with industry best practice.
A rigorous briefing and detailed strategy rationale recommendation and review must be
implemented for all future campaigns to ensure that the strategies employed for ORS media
spending represent the optimum allocation of budget resources.
3. Television Post Analysis and Reporting
Enth Degree has reviewed the post analysis documentation provided by the ORS Media Planners for
2011/2012 “Enjoy the Ride” post analysis within appendix.
This is the same format used for all campaign television reports post analysis. (See example
Appendix 4.)
The report, essentially a “dashboard” of campaign weight achieved, is too basic to be of any real
value to ORS.
While the campaign tracks planned versus achieved TARPs, (plus the corresponding reach build
across the duration of the campaign) and added value, that is the limit of the report.
The documentation does not identify the reach goals established for the campaign. We acknowledge
that TARPs are the basic building blocks of television activity, however delivery against effective
reach goals should also be included as a measure of campaign buying effectiveness
An example sighted Speed Behaviour (w/c 28/10/12 – 12/5/13) we noted significant (+67%/-24%)
fluctuations in weekly TARP achievement versus the goal in metropolitan markets. This translates to
a total over delivery of 11%, which is generally acceptable. However, there is no explanation as to

41 | P a g e
why the over-delivery occurred, nor are recommendations included for strategies to be applied to
future buying to avoid over-delivery and capture savings for re-investment to improve effectiveness
Enth Degree Recommendation
The Media Agency is to be directed to develop a post analysis dashboard that provides
transparency of delivery against both communication and cost objectives, a complete breakdown
of value added components, and identify learning to be applied for future media campaign
development to optimise return on media investment.
Drink Driving 2013/2014
To illustrate the previous generic observations we have included the 2013/2014 Drink Driving
campaign brief and the Media Agency response to identify the opportunities for improvement.
Our intention was to evaluate 2011/2012 “Enjoy the Ride” media strategy documentation,
however we were advised by ORS no written media strategy rationale is available because … “when
this planning took place, it was done in a forum/meeting with ORS and the Media Agency and
creative agency discussions and there isn’t document as such, it was only in the coming years that we
requested such documents/presentations to occur”.
We therefore are forced to rely on more recent activity to illustrate current practice and the
remedy required to ensure the delivery of best practice Media Planner output.
The ORS Brief
Government Communication Unit – Application for Approval Office of Road Safety – Drink Driving Enforcement Community Education Campaign 2013-14 Communication Brief (14 October 2013)
To reduce road trauma on our roads, the West Australian Government endorsed the Towards Zero strategy in 2008 which if fully implemented, is projected to save 11,000 people from being killed or seriously injured on WA roads by 2020.
Towards Zero adopts a safe system approach to improving road safety by continuing to expect and
encourage safer road use behaviours while building increasing protection into the road transport
system through safe speeds, safe vehicles, and safe roads and roadsides.
Drink Driving Enforcement Community Education is a component of Business Case Three: Impaired Driving Crashes as one of six road safety priority areas in 2013/2014.
The Drink Driving Enforcement Community Education Campaign 2013/14 is funded from the Road Trauma Trust Account following Road Safety Council recommendation and Ministerial approval.

42 | P a g e
Main Objective:
The 2013/14 Drink Driving Enforcement Community Education Campaign aims to contribute to reducing the number of people killed and seriously injured on WA roads due to drink driving.
The Issue:
Despite recent trends showing improvement in alcohol-related crashes, almost 1 in 5 fatal crashes attended by WA Police in 2012 involved a driver with a Blood Alcohol Concentration (BAC) equal to or greater than 0.05g/100ml. Of these crashes, the highest proportions of drivers/riders with illegal BACs were males in the 40 to 49 and 30 to 39 year age group followed by younger men aged 25 to 29. Alcohol-related fatal crashes cost the Western Australian community in excess of $235 millioneach year. International research shows that the effects of police enforcement in reducing road trauma are strengthened when supported by community education. Publicly communicating the message of increased enforcement can contribute to a higher subjective likelihood of being caught and a decrease in the occurrence of drink driving.
Campaign Objectives:
Implementing community education which seeks to influence the behaviour of road users is a critical component of the Towards Zero strategy. By placing a strong focus on drink driving enforcement community education we can remind road users of the risks associated with drinking and driving and the potential of being detected, which will contribute to preventing death and serious injury on our roads.
Given the information above it is proposed that the Drink Driving Enforcement Community Education Campaign for 2013/14 focus on:
Raising the awareness of the risks associated with drink driving.
Support drink driving enforcement activities by WA Police by creating the perception that ifyou drink and drive, you will be caught.
Target Group: WA drivers aged 17-39
Strategy:
To continue to promote the risks associated with drink driving a combination of strategies are proposed. These strategies are designed to work collaboratively; with mass media providing the audience with a key message that if you drink and drive, you will be caught.
Enth Degree Comment Within “The Issue” segment above, it is stated that highest proportions of drivers/riders with illegal BACs were males in the 40 to 49 and 30 to 39 year age groups followed by younger men aged 25 to 29. Should the target age group be extended to capture the major offenders?
What is the breakdown of fatalities/serious injury in metropolitan markets and rural communities. What are the ethnicity issues to consider, and/or different strategies for other campaigns with the same target ?

43 | P a g e
We will also encourage them to visit the ORS online space, where comprehensive and relevant information will be provided in an engaging manner.
The following components are proposed for 2013-14:
• Information, design and layout of the Drink Driving campaign pages on the Office of RoadSafety website will be enhanced in order to create a more engaging and streamlined onlinepresence.
• New digital initiatives (apps and/or games) will be developed to further support thecampaign.
• Television commercial, radio ads and metro bus shelters will be developed for 2013-14.
• A bulk purchase regional radio package. To extend our campaign effectiveness and supportthe components proposed above for the Drink Driving Enforcement Community EducationCampaign 2013-14, a 52 week radio package is proposed. This component due to itsduration is extremely cost-effective.
• 32 regional outdoor billboard package will be further scheduled to complement thecampaign (GCU approval number is GCU/059).
• WA Transport Magazine advertising of 4 insertions a year – a joint venture between Office ofRoad Safety, Main Roads Heavy Vehicle Operations and Mines & Petroleum (DangerousGoods).
Timeline:
As mentioned above, the regional radio package will run for a period of 52 weeks upon approval. All remaining components will run in phases from October 2013 to June 2014.
Benefits:
The 52 week regional radio package provides a saving of over $50,000 as it is a bulk purchase.
Enth Degree ObservationThis is an unusually prescriptive media briefing. We recognise that this is an application forapproval of funds and therefore this level of detail would be required. A Review of theMedias Planners’ media rationale is that this is approached as a directive, or alternatelythey do not challenge or investigate the brief delivered by ORS.
Enth Degree Comment Historic Road toll by month and other relevant statistics, e.g. drink driving infringements to be detailed to identify key periods for consideration

44 | P a g e
It is estimated that prevention of a single death on WA roads could save the West Australian Government $7.2million. With alcohol a factor in 19% of fatal crashes in 2012 any reduction would provide the State with considerable benefits.
Draft Budget:
Draft breakdown of projected production costs (estimate) Description Estimate
TV, Radio & Metro Bus Shelters 120,000
Total $120,000
Draft breakdown of projected media expenditure (estimate)
Description Estimate
TV, Radio, Metro Shelters 270,000
Indigenous Road Safety 20,000
Total $290,000
Draft breakdown of other Marketing expenditure (estimate)
Description Estimate
Website enhancements 45,000
Digital applications 80,000
Total $125,000
Total Budget $535,000
Enth Degree Comment As this form is compiled prior to briefing and/or a response from the media agency, how
were budgets allocated by medium?

45 | P a g e
THE MEDIA PLANNERS’ RESPONSE
Media Rationale
PRODUCT: Drink Driving Enforcement
DATE: Dec 2013
BUDGET: $290K
TIMING: Dec 2013-April 2014
ACCOMPANIES PLAN: GCU/213 approved
OBJECTIVE:
This campaign is designed to promote the Drink Driving Enforcement campaign – this is most relevant over the key holiday periods (Christmas, New Year, Easter, and Australia Day)
TARGET AUDIENCE: Whilst the core target for Road Safety campaign is Males 18-44, we would include media channels that provide the widest audience reach to the greater community – People 18-54 years.
INSIGHT: Campaign activity is driven by Reach. Channel selection provides the widest reach, using the current creative assets that are available: TV and Radio only. As per GCU approval we removed Digital and Outdoor. ########## and ####### TV are mandatory channels – these deals had already been approved by ORS and are included on the media plan.
Enth Degree Observation The response lacks a compelling rationale for the selection of people 18-54 years as the target for this campaign
While we applaud the Media Planner’s questioning of the target group, in the absence of any obvious research, there is no reason to effectively underweight spend against the core target.
Enth Degree Comment These are not insights but planning comments. What is the role of each medium? How has the Agency determined allocation by medium? What is the reach and effective frequency target? How was this determined?
We understand that ####### TV is the cornerstone of indigenous communications as its justification as a mandatory inclusion.
However we question whether The Media Planner has considered the impact of the ########## “mandatory” inclusion. At $80k, could this budget have been allocated more effectively, e.g. regional television? The majority of the radio package ($40k) is placed on local community channels. Regional television may be a preferable option, however this is not explored by The Media Planner.

46 | P a g e
ACTIVATION:
Television is the lead channel. First burst of TV is leading into Christmas TV is planned across three stations delivering a planned reach of 60-65% with a frequency of 5.
30 second TV only – due to budget only Metro TV will be included
60% minimum peak presence
Activity carries through to early Jan including Australia Day
Note due to the very late approval the TV activity would be securing the best availability at the time of booking. This is likely to impact on the final Reach and Frequency delivery given TV viewing is typically lower over this period and the higher performing areas such as News, etc. are not available.
Enth Degree Comment How was the reach target established? What is the relevance of the frequency of 5?
What is the planned reach goal for the Easter flight, where TARP levels planned are 37% below that of Christmas?
The Agency could have drawn upon Metrix Consulting Research into post campaign awareness conducted in 2012 to assist in establishing relevant campaign weights.
Enth Degree identified this research on the ORS website, conducted in July, which tracked prompted and unprompted awareness of the Easter flight of the “You Deserve It” (Drink Driving Enforcement) campaign. The research showed that at a two week flight of activity (April 2-15) of 253 TARPs achieved prompted awareness of 60%, which peaked at 62% 4 weeks post campaign.
The flight planned for 2014 total 204 TARPs, a reduction of approximately 20% cannot expect to achieve the same impact as in 2012. What is the rationale for lowering weight?
Given that the Christmas flight at 325 TARPs was planned to reach 62.3% of the target, it is highly unlikely to achieve the prompted levels of Easter 2012 of 60%.
We would expect that the Media Planners’ rationale addresses the results of previous campaign research when planning. The rationale provided does not indicate this to be the case.
Enth Degree Comment How is the target audience distributed across the state? Geographic priority should be developed following an examination of the preponderance of Drink Driving issues in metropolitan and regional markets.
Enth Degree Comment Why?
Enth Degree Comment What is the likely reduction of reach and frequency against goal? What strategies have been developed to minimise impact of booking media late?

47 | P a g e
Second wave of TV planned for Easter – planned not yet bought. Media Planner to provide recommendation on incorporating the remaining funds with speeding to secure an AFLA package on Channel 7.
Radio – to provide the best reach scenario a combination radio station buy is planned using the existing 15 seconds spot.
Radio is planned for the three important dates: lead up to Christmas, Australia Day and Easter.
Combined planned reach for People 18-54 is 65-70% with a frequency of 5.9.
Media plan was to also include all fees and Talent rollover costs. Given this pushed us slightly over budget the short fall would be accounted for across another line of business.
Enth Degree Comment Will extended booking lead time afford economies that can be used to assist in arresting potential pre-Christmas shortfall due to short booking lead time?
Enth Degree Comment What stations are selected? Does station selection reflect skew toward to the primary target audience? What zones and days are scheduled and why?

48 | P a g e
4. Media Buying Performance
On the following pages we review the calibre of peak night (6:00pm-10:30pm Sunday-Saturday)
television media buying performance. Approximately 80% of television budgets are allocated to this
zone
This has been reviewed for two key measures:
a. Cost Per TARP
b. Performance Against Station Average
These two measures are inextricably linked, and are impacted by booking lead times. E.g. the greater
the lead time, the greater the opportunity to optimise performance and economies due to access to
all station inventory. As lead times shorten, access to cost efficient and high rating inventory
diminishes, thereby impacting the calibre of the buy.
1. Cost Per TARP (CPT)
Here we compare the CPT (Target Audience Rating Point) to the WA Government discounted the
zone average. On the following pages the light blue column indicates the CPT achieved versus station
peak night zone average. An index above 100 indicates that the CPT paid is greater than station
average. Desired index is 100 or below.
Enth Degree benchmark is CPT delivery that is a minimum 10% below station average, i.e. an index
of 90 or below to ensure that the Agency is securing airtime that is cost effective.
2. Performance Against Station Average
Low CPT results can be readily achieved by the purchase of airtime that is lowest in demand, e.g. low
rating properties and /or back end of the week where demand is lowest. Our benchmark is a spot
average that is equal to or better than station zone average. This determines that the buyer has
focussed placement against those programmes skewed toward the target audience.
On the following pages the pink column indexes the peak night average rating achieved versus
station zone average. An index above 100 indicates a delivery better than station average, thereby
indicating that the Agency has focussed the buy toward the target demographic. The higher the
index the better.
This measure, in concert with CPT determines the overall calibre of the buy.
On the following pages we review television buying performance against these criteria for:
a. Drink Driving
i. Enforcement - December 2013
ii. Behaviour - November 2012 -May 2013
b. Speeding
i. Enforcement - November – April 2013

49 | P a g e
Drink Driving
Campaign:
Period:
Audience:
Network No. of Spots Total TARPS Expenditure Cost Per TARPZone Ave CPT at
WA Govt Discount CPT V Station Ave
Bought TARP
Average
Station Zone
Average
Bought/Zone
Ave Index
TVW7 17 45 $18,919 $420.42 $447.16 94 2.6 2.8 95
7TWO 14 6.2 $1,505 $242.74 $630.84 38 0.4 0.2 221
7MATE 30 35.4 $4,005 $113.14 $309.06 37 1.2 0.8 148
Seven Network 61 86.6 $24,429 $359.10 $435.83 82 1.9 1.8 105
STW9 14 28.4 $15,446 $543.87 $503.67 108 2.0 2.4 85
Go! 0 0 $0 n/a $299.40 0 0.0 0.8 n/a
GEM 0 0 $0 n/a $236.18 0 0.0 0.5 n/a
Nine Network 14 28.4 $15,446 $543.87 $503.67 108 2.0 2.4 85
TEN 9 16.4 $7,728 $471.22 $364.52 129 1.8 2.6 70
ELEVEN 5 8.1 $1,297 $160.12 $580.34 28 1.6 0.5 324
ONE 14 11.9 $2,076 $174.45 $233.51 75 0.9 0.5 170
Ten 28 36.4 $11,101 $379.37 $365.23 104 1.5 1.4 101
Weighted Market Ave 103 151.4 50976 $419.50 $441.01 95 1.8 1.8 99
Campaign:
Period:
Audience:
Network No. of Spots Total TARPS Expenditure Cost Per TARPZone Ave CPT at
WA Govt Discount CPT V Station Ave
Bought TARP
Average
Station Zone
Average
Bought/Zone
Ave Index
TVW7 8 27.6 $16,543 $599.38 $616.14 97 3.5 3.4 101
7TWO 0 0 $0 $0.00 $583.55 0 0.0 0.3 0
7MATE 4 3.4 $1,852 $544.71 $590.72 92 0.9 0.6 142
Seven Network 12 31 $18,395 $593.88 $613.58 97 3.2 3.1 102
STW9 5 17.9 13254 $740.45 $871.04 85 3.6 2 179
Go! 5 5.9 2243 $380.17 $476.59 80 1.2 1 n/a
GEM 0 0 $0 $0.00 $409.02 0 0.0 0.6 n/a
Nine Network 10 23.8 $15,497 $688.30 $813.95 85 2.7 1.5 179
TEN 5 14.1 8583 $608.72 $620.60 98 2.8 2.6 108
ELEVEN 3 1.5 802 $534.67 $390.06 137 0.5 0.7 71
ONE 3 0.4 294 $735.00 $227.90 323 0.1 0.7 19
Ten 11 16 $9,679 $606.42 $589.57 103 2.5 2.4 107
Weighted Market Ave 33 70.8 43571 $630.25 $679.51 93 2.9 2.4 120
Campaign:
Period:
Audience:
Network No. of Spots Total TARPS Expenditure Cost Per TARPZone Ave CPT at
WA Govt Discount CPT V Station Ave
Bought TARP
Average
Station Zone
Average
Bought/Zone
Ave Index
TVW7 3 13.8 $7,794 $564.78 $499.41 113 4.6 3.5 131
7TWO 9 2.1 $1,020 $485.71 $559.20 87 0.2 0.3 78
7MATE 13 8.3 $3,663 $441.33 $338.74 130 0.6 0.9 71
Seven Network 25 24.2 $12,477 $515.58 $457.13 113 2.9 2.3 123
STW9 9 19.5 $10,646 $545.95 $439.23 124 2.2 2.5 87
Go! $0.00 $274.98 0 0.0 0.9 n/a
GEM $0.00 $266.80 0 0.0 0.5 n/a
Nine Network 9 19.5 $10,646 $545.95 $439.23 124 2.2 2.5 87
TEN 6 17.3 $10,994 $635.49 $637.10 100 2.9 2.5 115
ELEVEN 3 3.1 $374 $120.65 $353.63 34 1.0 0.6 172
ONE 8 9 $790 $87.78 $180.51 49 1.1 0.7 161
Ten 17 29.4 $12,158 $413.54 $598.71 69 2.2 1.7 123
Weighted Market Ave 51 73.1 35281 $489.58 $500.52 98 2.4 2.1 112
Campaign:
Period:
Audience:
Network No. of Spots Total TARPS Expenditure Cost Per TARPZone Ave CPT at
WA Govt Discount CPT V Station Ave
Bought TARP
Average
Station Zone
Average
Bought/Zone
Ave Index
TVW7 14 52.5 $35,311 $672.59 $544.07 124 3.8 4.1 91
7TWO 0 0 $0 $0.00 $1,061.95 0 0.0 0.2 0
7MATE 7 11.4 $2,436 $213.68 $213.28 100 1.6 1.7 96
Seven Network 21 63.9 $37,747 $642.97 $522.73 123 3.4 3.7 92
STW9 5 12.8 $9,325 $728.52 $584.18 125 2.6 2.7 95
Go! 2 1 $708 $708.00 $509.94 139 0.5 0.7 n/a
GEM 0 0 $0 $0.00 $289.54 0 0.0 0.6 n/a
Nine Network 7 13.8 $10,033 $727.07 $578.94 126 2.4 2.5 95
TEN 4 3.5 $4,082 $1,166.29 $547.07 213 0.9 3.1 28
ELEVEN 4 2.4 $518 $215.83 $484.11 45 0.6 0.5 120
ONE 6 5.8 $674 $116.21 $187.44 62 1.0 0.7 138
Ten 14 11.7 $5,274 $938.74 $494.93 190 0.9 1.4 63
Weighted Market Ave 42 89.4 53054 $688.28 $530.59 130 2.9 3.2 91
Drink Driving Enforcement
w/c 1.12.13 - w/c 29.12.13
Males 18-39 years
Males 18-39 years
Drink Driving Behaviour
w/c 7.4.13 - w/c 26.5.13
Males 18-39 years
Drink Driving Behaviour
w/c 18.11.12 - w/c 9.12.12
Males 18-39 years
Drink Driving Behaviour
w/c 27.1.13 - w/c 17.2.13

50 | P a g e
Speeding
Campaign:
Period:
Audience:
Network No. of Spots Total TARPS Expenditure Cost Per TARPZone Ave CPT at
WA Govt Discount CPT V Station Ave
Bought TARP
Average
Station Zone
Average
Bought/Zone
Ave Index
TVW7 5 15.2 $16,150 $1,062.50 $792.01 134 3.0 3.8 80
7TWO 12 3.8 $2,569 $676.05 $671.80 101 0.0 0.3 0
7MATE 3 3.8 $2,812 $740.00 $600.09 123 1.3 1 127
Seven Network 20 22.8 $21,531 $974.27 $752.60 129 2.2 2.8 81
STW9 7 15.5 $13,518 $872.13 $736.77 118 2.2 2.2 101
Go! 0 0 $0 $0.00 $468.12 0 0.0 0.8 n/a
GEM 0 0 $0 $0.00 $385.53 0 0.0 0.6 n/a
Nine Network 7 15.5 $13,518 $872.13 $736.77 118 2.2 2.2 101
TEN 4 5.7 $9,536 $1,672.98 $1,233.14 136 1.4 1.4 102
ELEVEN 3 3.4 $1,063 $312.65 $527.08 59 1.1 0.8 142
ONE 0 0 $0 $0.00 $248.03 0 0.0 0.6 0
Ten 7 9.1 $10,599 $1,536.55 $1,162.33 132 1.3 1.2 112
Weighted Market Ave 34 47.4 $45,648 $1,074.58 $843.05 127 2.1 2.3 91
Campaign:
Period:
Audience:
Network No. of Spots Total TARPS Expenditure Cost Per TARPZone Ave CPT at
WA Govt Discount CPT V Station Ave
Bought TARP
Average
Station Zone
Average
Bought/Zone
Ave Index
TVW7 3 5.1 $4,541 $890.39 $706.38 126 1.7 1.9 89
7TWO 12 1.3 $1,651 $1,270.00 $746.00 170 0.0 0.2 0
7MATE 6 7.3 $1,635 $223.97 $351.31 64 1.2 0.7 174
Seven Network 21 13.7 $7,827 $831.26 $640.56 130 1.3 1.1 117
STW9 8 9.9 $15,633 $1,579.09 $754.35 209 1.2 1.8 69
Go! 0 0 $0 $0.00 $458.84 0 0.0 0.7 n/a
GEM 0 0 $0 $0.00 $498.68 0 0.0 0.5 n/a
Nine Network 8 9.9 $15,633 $1,579.09 $754.35 209 1.2 1.8 69
TEN 7 18.7 $5,039 $269.47 $521.33 52 2.7 1.9 141
ELEVEN 4 1.4 $847 $605.00 $823.68 73 0.4 0.5 70
ONE 6 3.2 $575 $179.69 $219.78 82 0.5 0.6 89
Ten 17 23.3 $6,461 $305.46 $534.13 57 2.2 1.6 137
Weighted Market Ave 46 46.9 $29,921 $1,108.44 $677.03 164 1.7 1.5 115
Campaign:
Period:
Audience:
Network No. of Spots Total TARPS Expenditure Cost Per TARPZone Ave CPT at
WA Govt Discount CPT V Station Ave
Bought TARP
Average
Station Zone
Average
Bought/Zone
Ave Index
TVW7 10 21.9 $15,289 $698.13 $802.44 87 2.2 1.9 115
7TWO 14 5.1 $2,338 $0.00 $257.16 0 0.0 0.7 0
7MATE 11 14.8 $3,050 $206.08 $319.29 65 1.3 1 135
Seven Network 35 41.8 $20,677 $546.61 $669.52 82 1.6 1.4 113
STW9 16 33.2 $12,445 $374.85 $400.78 94 2.1 2.5 83
Go! 15 6.1 $3,622 $593.77 $202.59 0 0.4 0.8 n/a
GEM 0 0 $0 $0.00 $204.16 0 0.0 0.5 n/a
Nine Network 31 39.3 $16,067 $424.20 $356.10 119 1.8 2.2 81
TEN 8 17.6 $9,167 $520.85 $530.05 98 2.2 1.9 116
ELEVEN 5 1.1 $1,367 $1,242.73 $517.70 240 0.2 0.6 37
ONE 9 9.8 $1,389 $141.73 $158.66 89 1.1 0.7 156
Ten 22 28.5 $11,923 $559.45 $485.37 115 1.7 1.4 121
Weighted Market Ave 88 109.6 $48,667 $509.34 $520.93 98 1.7 1.7 100
Campaign:
Period:
Audience:
Network No. of Spots Total TARPS Expenditure Cost Per TARPZone Ave CPT at
WA Govt Discount CPT V Station Ave
Bought TARP
Average
Station Zone
Average
Bought/Zone
Ave Index
TVW7 9 62.4 $16,412 $263.01 $439.42 60 6.9 5.2 133
7TWO 1 0 $164 $0.00 $553.80 0 0.0 0.3 0
7MATE 2 3.8 $1,198 $315.26 $457.95 69 1.9 0.9 211
Seven Network 12 66.2 $17,774 $264.11 $441.72 60 6.6 5.0 134
STW9 7 10.2 $10,711 $1,050.10 $572.69 183 1.5 2.3 63
Go! 1 0.1 $720 $7,200.00 $335.99 0 0.1 0.8 n/a
GEM 0 0 $0 $0.00 $305.72 0 0.0 0.5 n/a
Nine Network 8 10.3 $11,431 $1,437.46 $557.78 258 1.4 2.3 63
TEN 7 21 $9,648 $459.43 $699.07 66 3.0 1.8 167
ELEVEN 2 0 $394 $0.00 $667.00 0 0.0 0.5 0
ONE 3 1.2 $348 $290.00 $164.67 176 0.4 0.7 57
Ten 12 22.2 $10,390 $436.33 $679.96 64 2.9 1.7 164
Weighted Market Ave 32 98.7 $39,595 $648.04 $537.74 121 5.3 4.0 133
Males 18-39 years
Males 18-39 years
Speed Enforcement
w/c 4.11.12 - w/c 18.11.12
Males 18-39 years
w/c 2.12.12 - w/c 23.12.12
Speed Enforcement
Males 18-39 years
Speed Enforcement
w/c 30.12.12 - w/c 27.1.13
Speed Enforcement
w/c 10.2.13 - w/c 24.2.13

51 | P a g e
Speeding (Continued)
Campaign:
Period:
Audience:
Network No. of Spots Total TARPS Expenditure Cost Per TARPZone Ave CPT at
WA Govt Discount CPT V Station Ave
Bought TARP
Average
Station Zone
Average
Bought/Zone
Ave Index
TVW7 7 17.4 $13,436 $772.18 $675.64 114 2.5 3.4 73
7TWO 0 0 $0 $0.00 $997.55 0 0.0 0.2 0
7MATE 6 5 $2,794 $558.80 $411.80 136 0.8 1 83
Seven Network 13 22.4 $16,230 $735.45 $630.22 117 2.1 2.9 74
STW9 10 26.3 $13,522 $514.14 $492.13 104 2.6 2.3 114
Go! 0 0 $0 $0.00 $415.57 0 0.0 0.7 n/a
GEM 0 0 $0 $0.00 $399.85 0 0.0 0.4 n/a
Nine Network 10 26.3 $13,522 $514.14 $492.13 104 2.6 2.3 114
TEN 6 13.1 $9,623 $734.58 $769.10 96 2.2 1.7 128
ELEVEN 4 0 $770 $0.00 $930.60 0 0.0 0.4 0
ONE 4 2.3 $419 $182.17 $205.59 89 0.6 0.6 96
Ten 14 15.4 $10,812 $660.86 $758.76 87 1.9 1.5 127
Weighted Market Ave 37 64.1 $40,564 $641.80 $618.45 104 2.3 2.3 99
Campaign:
Period:
Audience:
Network No. of Spots Total TARPS Expenditure Cost Per TARPZone Ave CPT at
WA Govt Discount CPT V Station Ave
Bought TARP
Average
Station Zone
Average
Bought/Zone
Ave Index
TVW7 5 20.3 $13,810 $680.30 $737.05 92 4.1 3.5 116
7TWO 10 4.4 $2,421 $0.00 $609.68 0 0.0 0.3 0
7MATE 1 0 $0 $0.00 $474.99 0 0.0 1.3 0
Seven Network 16 24.7 $16,231 $578.82 $718.05 81 3.3 2.9 114
STW9 8 13.8 $15,765 $1,142.39 $603.43 189 1.7 2.3 75
Go! 1 2 $411 $205.50 $289.65 0 2.0 1 n/a
GEM 0 0 $0 $0.00 $294.87 0 0.0 0.6 n/a
Nine Network 9 15.8 $16,176 $1,118.59 $595.46 188 1.8 2.1 82
TEN 6 12.6 $6,220 $493.65 $640.79 77 2.1 2 105
ELEVEN 4 0.6 $1,034 $1,723.33 $900.24 191 0.2 0.4 38
ONE 15 12.5 $1,594 $127.52 $234.17 54 0.8 0.5 167
Ten 25 25.7 $8,848 $571.39 $597.86 96 1.4 1.2 117
Weighted Market Ave 50 66.2 $41,255 $786.82 $644.21 122 2.2 2.1 107
Campaign:
Period:
Audience:
Network No. of Spots Total TARPS Expenditure Cost Per TARPZone Ave CPT at
WA Govt Discount CPT V Station Ave
Bought TARP
Average
Station Zone
Average
Bought/Zone
Ave Index
TVW7 4 12.6 $9,485 $752.78 $727.40 103 3.2 3.6 88
7TWO 6 5.4 $1,350 $250.00 $459.94 54 0.0 0.4 0
7MATE 1 0 $0 $0.00 $421.31 0 0.0 1.1 0
Seven Network 11 18 $10,835 $601.94 $694.07 87 2.2 2.6 84
STW9 8 20.6 $12,890 $625.73 $613.52 102 2.6 2.1 123
Go! 3 2.2 $1,007 $457.73 $340.98 0 0.7 0.8 n/a
GEM 0 0 $0 $0.00 $255.37 0 0.0 0.7 n/a
Nine Network 11 22.8 $13,897 $609.52 $593.78 103 2.3 1.9 123
TEN 5 16.3 $4,425 $271.47 $444.58 61 3.3 3.2 102
ELEVEN 3 2.6 $1,644 $632.31 $662.44 95 0.9 0.5 173
ONE 9 3.1 $1,271 $410.00 $427.75 96 0.3 0.3 115
Ten 17 22 $7,340 $333.64 $490.46 68 2.6 2.5 104
Weighted Market Ave 39 62.8 $32,072 $570.75 $604.01 94 2.4 2.3 103
w/c 10.3.13 - w/c 24.3.13
Speed Enforcement
w/c 7.4.13 - w/c 21.4.13
Males 18-39 years
Males 18-39 years
Males 18-39 years
Speed Enforcement
w/c 5.5.13 - w/c 19.5.13
Speed Enforcement
Media Buying Observations
Drink Driving Buying Performance
Inconsistency best describes the Agency’s performance against both CPT and ratings performance
versus station average benchmarks. Performance fluctuates between bursts of activity, networks
and station within each network.
We have summarised the above outcomes to identify overall performance against these measures,

52 | P a g e
Drink Driving Males 18-39 years
Network No. of Spots Total TARPS Expenditure Cost Per TARPZone Ave CPT at
WA Govt Discount CPT V Station Ave
Bought TARP
Average
Station Zone
Average
Bought/Zone
Ave Index
w/c 1.12.13 - w/c 29.12.13* 103 151.4 $50,976 $419.50 $441.01 95 1.8 1.8 99
w/c 18.11.12 - w/c 9.12.12 33 70.8 $43,571 $630.25 $679.51 93 2.9 2.4 120
w/c 27.1.13 - w/c 17.2.13 51 73.1 $35,281 $489.58 $500.52 98 2.4 2.1 112
w/c 7.4.13 - w/c 26.5.13 42 89.4 $53,054 $688.28 $530.59 130 2.9 3.2 91
2012/2013 Summary 126 233.3 $131,906 $615.96 $571.74 108 2.7 2.6 104
Drink Drive Behaviour* 2012.13 TV Placement Sunday, Monday, Saturday
Drink Drive Enforcement 2013.14 Placement Sunday - Saturday
December 2013 Drink Drive Enforcement
The Agency achieved station average placement, however, this was purchased at a cost index of 95,
marginally below the WA Government station zone average cost per TARP.
A closer review of station by station performance indicates that only the Seven Network delivered an
economical result for ORS, with a cost index of 82 and placement index of 105.
The result on the Nine Network is reversed, with a cost index of 108 and placement index of 85.
The Ten Network, the most cost efficient of the three networks, achieved near “average” results
against both measures. When we consider the zone average cost per TARP, and station zone average
advantages of Ten, we would have expected a higher level of investment on this Network, at the
expense of Nine, to optimise campaign efficiency.
2012/2013 Drink Driving Behaviour
Again performance was inconsistent when reviewed by Network and by burst of activity.
In contrast to the December 2013 campaign reviewed above, Nine was the strongest performer
against the cost and placement indices, although this station is premium priced for the target
demographic analysed (Males 18-39 years).
The February 2013 market summary disguises a premium cost index (124) for a below station
average index of 87 on Nine. It is the efficient performance of Ten against both measures that has
contained the market outcome.
The April/May flight performed below benchmark expectation on all stations against both cost and
placement measures.
Speeding
This was a week on week off low weight TARP strategy, and as such we would expect fluctuations in
CPT and audience delivery from week to week, especially considering the volatility of the ratings
performance of target group.

53 | P a g e
Campaign:
Network No. of Spots Total TARPS Expenditure Cost Per TARPZone Ave CPT at
WA Govt Discount CPT V Station Ave
Bought TARP
Average
Station Zone
Average
Bought/Zone
Ave Index
47.4 $45,648 $1,074.58 $843.05 127 2.1 2.3 91
46.9 $29,921 $1,108.44 $677.03 164 1.7 1.5 115
109.6 $48,667 $509.34 $520.93 98 1.7 1.7 100
98.7 $39,595 $648.04 $537.74 121 5.3 4.0 133
64.1 $40,564 $641.80 $618.45 104 2.3 2.3 99
66.2 $41,255 $786.82 $644.21 122 2.2 2.1 107
62.8 $32,072 $570.75 $604.01 94 2.4 2.3 103
Speed Enforcement
w/c 5.5.13 - w/c 19.5.13
w/c 4.11.12 - w/c 18.11.12
w/c 2.12.12 - w/c 23.12.12
w/c 30.12.12 - w/c 27.1.13
w/c 10.2.13 - w/c 24.2.13
w/c 10.3.13 - w/c 24.3.13
w/c 7.4.13 - w/c 21.4.13
The summary of results presented above highlight the fluctuations between flights.
A review of individual station performance identifies the following:
Nov /Dec 2012 – CPT was at a significant cost premium across all Networks. For the November
week, weighted average audience delivery was below station average, despite this cost premium.
February 2013 - A strong performance on Seven and Ten across both measures is negated by the
under-performance on Nine, where placement in low rating properties inflated the cost per TARP
delivery.
April 2013 – Again a poor performance of the properties purchased on Nine negated the strong
achievements on Seven and Ten.
Enth Degree Recommendation
Buying inconsistencies between networks and individual buys reflect a necessity for The Media
Agency to:
1. Monitor ongoing CPT performance of the media buy, and address potential cost inefficiencies
before they occur.
3. Track audience performance of selected programming to ensure it is, and continues to be,
targeted toward the primary target audience.
All agencies have software that tracks performance of buys against audience delivery trends, thereby
enabling the Agency to amend placement and/or negotiate bonus activity to ensure that campaigns
are telecast at the planned and bought weekly weight.
The review of the previous campaigns measured by Enth Degree do not indicate that rigorous
ongoing buying analyses are undertaken prior to telecast of the ORS’s major media investment.

54 | P a g e
Other Media Buying Observations
##########
We are in receipt of the ########## agreement signed by The Media Agency behalf of ORS. Enth
Degree is not in a position to evaluate the arrangement as individual stations and applicable
rates for each are not detailed within the 13/14 Letter of Agreement.
We understand that this is a 52 week agreement covering regional WA stations.
We recommend that a full cost analysis be undertaken to identify value of this arrangement and
comparative opportunities to reach regional WA.
In particular the Agency should review:
Sportsday WA: This Sponsorship includes “co-naming rights”. Is this exclusively for ORS, ordoes “co-naming” infer that this is a shared sponsorship?
Terms for 12 month agreement, totalling $160k is payable in full by 15th February 2014. Thisis not standard procedure for media charging. It is standard operating procedure for themedia to charge monthly, payable 45 days post the end of each calendar month.
Bonus inclusion (totalling 3 x 30 sec per week) is “subject to availability”. This should be re-negotiated as a guaranteed inclusion.
How is the agreement monitored? We would expect statutory declarations and detailedinvoicing to substantiate proof of appearance.
4 x September Club Tickets to the 2014 Grand Final. Are these allocated as prizes? How arethey distributed?
Enth Degree Observation
Did the Media Agency consider the options that this budget would afford in regional WA? We
estimate that this budget if allocated to regional television, would secure approximately 45 weeks of
television at 75 TARPs per week which would provide a far greater emotive context and issue
awareness than radio.

55 | P a g e
5. The economic/social cost for and against advertising

56 | P a g e
The economic/social cost for and against advertising
Introduction
The Transport Accident Commission is a Victorian Government-owned organisation set up to pay for
treatment and benefits for people injured in transport accidents, promote road safety and improve
Victoria’s trauma system.
Its Main Media per capita investment in Road Safety is the highest in Australia.
State Population Road Safety Spend Spend Per Capita
NEW SOUTH WALES 7,218,500 $8,931,000 $1.24
VICTORIA 5,537,900 $11,361,000 $2.05
QUEENSLAND 4,476,700 $2,931,000 $0.65
SOUTH AUSTRALIA 1,639,600 $2,203,000 $1.34
WESTERN AUSTRALIA 2,353,400 $1,975,000 $0.84
TOTAL 21,226,100 $27,401,000 $1.29
* Source: AC Nielsed Adex/ABS
Road Safety Spend per Capita 2009-2012 (Ave)*
Its return on investment in road safety promotion is the reduction in claims. With a commercial
incentive to reduce road accident injuries it has applied significant resources over many years to
understand what works in road safety advertising and why. Its continued commitment to mass
media social marketing is consistent with an organisation that has determined that there is a
commercially viable ROI from road safety promotion.
Professor Simon Chapman is a Professor of Public Health at the University of Sydney. He has been a
vocal critic of big tobacco, and at the vanguard of efforts to reduce cigarette smoking in Australia. He
has been an advocate for the ban on tobacco advertising, laws banning smoking in the workplace, in
restaurants, hotels and clubs and is a strong supporter of mass media promotion to reduce smoking
prevalence in Australia. As examples of successful public health campaigns he credits the 1980’s
Grim Reaper campaign, combined with harm reduction policies, as the reason the threatened
heterosexual HIV epidemic was prevented from materialising. He cites the achievement of all-time
lows in cervical cancer as an example of how long term mass media health promotion and education
of health professionals, can be successful in disease prevention.
Professor Melanie Wakefield is a Director at the Centre for Behavioural Research in Cancer. She is
also a Principal Research Fellow of the Australian National Health and Medical Research Council. Her
expertise is the development and evaluation of population-based cancer prevention programs
including mass media campaigns in tobacco control, skin cancer prevention and cancer screening.
Her organisation works closely with the Cancer Council Victoria and provides advice regarding cancer
prevention policies and media campaigns at state, national and international levels. She has been
the recipient of the American Cancer Society’s Luther L. Terry Award 2012 for Outstanding Research
Contribution in Tobacco Control. She is a strong endorsee of the role mass media social marketing
campaigns play in the reduction of preventable diseases.
Max Cameron is a Professor in the Monash University Accident Research Centre where he has
worked since 1990. He holds degrees in statistics and was awarded a Ph.D. for his thesis on methods

57 | P a g e
of evaluation of road trauma countermeasures. He is a consultant to the Western Australian
Government and his Monash University Accident Research Centre provided input into the
development of the new Western Australian road safety strategy “Towards Zero” 2008-2020. This
strategy was based on the concept of a “Safe System Matrix” which aimed to focus resources on a
relatively small number of large and severe problems. The dimensions in the Safe System Matrix are
safe roads, safe roadsides, safe travel speeds, safe vehicles and safe road use.
Within the “Towards Zero” strategy, Safe Road use involves the creation of a series of education,
promotion and publicity campaigns targeting problem types amenable to improvement through
behaviour change programs including drink-driving, speeding, driver fatigue etc.
We are conscious of criticism of mass media marketing which acknowledge that while there are
successful campaigns, there are also many unsuccessful campaigns. This prompts them to question
the overall efficacy of this kind of public investment.
Our perspective is that social marketing campaigns are no different from marketing activities
generally. Practitioners that understand their target audience well, grasp the principle foundations
of successful promotion, develop their communications based on evidence-based research, codify
communication guidelines, and hire experienced personnel to develop and execute strategies, have
substantially greater odds of success than those who don’t.
Western Australia has committed to a long term road safety strategy with an implied contract of
shared responsibility. Across a range of engineering, legal, technological and enforcement programs
it will deliver in accordance with the Safe System Matrix, but it requires road users to share in that
responsibility, and it has identified road safety communications as the means of ensuring road users
support the need for road safety, and can be confident that they will be safe on Western Australian
roads if they comply with the laws.
This section of the report is not about whether road safety promotion can be effective, because
there are ample persuasively articulated, peer reviewed papers by learned academics that provide
compelling evidence that they have and can work. Nor does it pretend to be capable of econometric
modelling or calculating the ROI and point of pay-back for road safety advertising.
There will be a return on investment, and we doubt that it is currently as high as suggested in some
of the documentation we reviewed. While we acknowledge that road trauma has a social cost,
nothing from this review sheds light onto how that might be measured. It is a given that people
deserve to be able to live a life free of pain, free to move about the community, and that their family
is not burdened with the premature death of a loved one, or the long term care of someone
seriously injured in a preventable road crash.
We concur with the comments in a recent document published by the Queensland Centre of
Accident Research & Road Safety (CARRS), Road Safety Advertising “State of the Road” - A fact sheet
of the Centre for Accident Research & Road Safety – Queensland: “Most in the road safety arena
view that road safety advertising is most effective when coupled with, and designed to support
enforcement activities. In Australia, the use of paid advertising as a component in road safety
campaigns is widely accepted by safety authorities; the debate having shifted from whether or not
advertising can be effective, to what type of advertising is more or less effective.”

58 | P a g e
In this section we review the principles in effective mass market social change advertising and
provide our observations as to the extent to which those principles are being applied in the material
we reviewed.
Behaviour Change Theory
In a 2004 Review of Mass Media Advertising Campaigns for Road Safety prepared by Amanda
Delaney, Bella Lough, Michael Whelan and Max Cameron, reviewed not only mass media campaigns
for road safety but also anti-cancer campaigns. The authors of this paper were associated with the
Monash University Accident Research Centre. The paper supported the view that behaviour change
campaigns can not only be effective in meeting the behaviour change objectives, but can also be a
cost effective way of reducing the costs that would have reasonably been expected, had the
targeted behaviour change not occurred.
This paper reviewed the underlying theories relating to behaviour change, why they impact attitudes
and behaviour, and observed that the more successful campaigns used these theories to guide
campaign development.
The paper focused on “Protection Motivation Theory” (Rogers 1983) and “Extended Parallel Process
Model” (Witte 1994).
“Protection Motivation Theory” deals with self-protection and the four main influences:
1. Perceived severity,
2. Perceived probability,
3. The efficacy of the recommended prevention measure,
4. The perceived self-efficacy – a person’s perception of their own ability to take the
recommended preventative behaviour.
Protection motivation is determined by:
An appraisal of the threat:
i.e. The chance of getting caught speeding;
The severity of the threat, such as fine or loss of license etc.
An appraisal of how to cope:
How effective the required behaviour might be,
Their ability to do it,
The cost of changing to the required behaviour.
“Extended Parallel Process Model” deals with fear motivation.

59 | P a g e
Fear-based campaigns must:
Induce a moderately high level of fear,
Induce a higher level of self efficacy and response efficacy.
The theory is that when an individual perceives that the severity/ susceptibility are high, and that
they are able to take the mitigating action, they are likely to act to control the danger.
While not mentioned in the 2004 Cameron et al paper, creative practitioners experienced in social
marketing campaigns like Paul Fishlock (Behaviour Change Partners) are also guided by the theories
of Dr. Albert Bandura Social Foundations of Thought and Action (1986). Emerging from his theory is
that there are certain steps in behaviour modelling such as:
Attention – If you are going to learn anything, you have to be paying attention,
Retention – You must be able to remember what you paid attention to,
Reproduction – You have to be able to translate images or descriptions into behaviour,
Motivation – You are still not going to do something if you are not motivated
From a broader social marketing, and more specific road safety point of view, the application of the
principles in these theories/models is that before recipients of the message will change their
behaviour, they need to conclude that:
Not changing is a worse option that changing,
For them, change is possible,
For them, change will be worth it.
A Summary of the Key Guidelines for Behaviour Change Marketing
In a 2011 address to the ISBNPA conference “Influencing Health Behaviours for Good Using Mass
Media” Professor Melany Wakefield outlined the key observations following her recent literature
review of some 400 studies. Her observations shared many similar themes to those covered in the
2004 Cameron et al review mentioned earlier. She acknowledged that not all campaigns work.
There was strong positive evidence in the areas of tobacco, condom use, HIV prevention, vaccination
and road safety.
There was not the same evidence of success for important social issues like drug use and alcohol
abuse.
There was mixed evidence in other social marketing campaigns.
Her main observations were that success was more likely when campaigns:

60 | P a g e
1. Promoted one-off or episodic behaviour (vaccination, screening)
2. Complement concurrent changes in available services (breast screen) and policy (RBT)
3. Base message content on sound research of the target group
4. Test messages during campaign development
5. Used negative emotion messages, as they are more successful as measured by recall and
main message out-take
6. Were active – effects are time limited
7. Obtain high population exposure
8. Have sufficient advertising pressure
9. Maintain pressure over time
10. Use multiple channels
11. Conduct rigorous independent assessment of outcomes and seek peer-reviewed publication
She observed that good ads:
Work well against many population segments,
Eliminate the need to create specific ads tailored to smaller sub-groups,
Are efficient, as successful ads can be recycled/adapted for use in other states or countries.
We have used Professor Wakefield’s observations as the foundation for the perspective that we
have developed through the process of conducting this review.
1. Promote One-off or Episodic Behaviour
We interpret this to mean that campaigns with a single focus will be more effective than those of a
less specific nature. A message that reminds drivers to slow down in school zones, is more likely to
be successful than a message that encourages drivers to be more alert to pedestrians when driving.
We were provided communication briefs for the 2013-14. It was not clear from the briefs what
specific behaviour is being targeted. The strategy articulated in the speeding communication brief
was:
“To continue to promote the risks associated with speeding, a combination of strategies are
proposed. These strategies are designed to work collaboratively; with mass media providing the
audience with a key message, and encourage them to visit the ORS online space, where
comprehensive and relevant information will be provided in an engaging manner.”
There was nothing in the brief that provided evidence of how the “Enjoy the ride” campaign was
progressing on achieving its objectives, what its key message is and how that is resonating with
drivers, how it has impacted drivers’ claimed speeding behaviour or why it was felt that it required

61 | P a g e
drivers, after seeing the ad, to go to the online space to receive messages in a more comprehensive,
relevant and engaging way.
2. Complement Concurrent Changes in Services and Policy
In meta-analysis of the effect of road safety campaigns (Ross Owen Phillips/Pal Ulleberg/Truls Vaa -
January 2011), they examined the weight of effect on a range of variables across 119 results from 67
studies. They found that a strong statistical weight (77%) was from campaigns accompanied by
enforcement. What is significant about these road safety categories is that they are behaviours that
can be relatively effectively monitored and policed. This may have contributed to their conclusions
that among the results reviewed, the strongest effect on road safety campaign success was for drink-
driving and speeding campaigns.
This is consistent with Professor Wakefield’s observations.
3. Base Message Content on Sound Research of the Target Group & Test Messages During
Campaign Development
We noted that the major speeding campaign is the continuation of the 2011“Enjoy the ride”
campaign. Nothing in the materials we were provided covered the rationale for the selection of this
campaign, whether it was tested against at risk drivers during its development, or what its
achievements have been.
In the case of drink-driving we note that on the website there are two different campaigns; “Ok is
not ok” and “You deserve it”. One approach uses humour (I’m OK moments versus a not OK decision
to drive after drinking), and the other juxtaposes alcohol occasions deserving of celebration, with
consequences of exceeding the BAL, and deserving of punishment.
There was nothing provided in the materials as to what the objectives of these different
advertisements are, how they were developed, what testing was done and what their measured
achievements have been.
4 & 5. Use Negative Emotion Messages
In recent times a view is emerging among some responsible for social marketing that a more positive
approach may be more effective in targeting young males than fear based emotional campaigns. In
their 2010 paper “Fear Patterns: A New Approach to Designing Road Safety Advertisements”, John
Rossiter and Jennifer Algie published their research on fear arousal and relief felt by an audience
during the viewing of a road safety advertisement. In these experiments respondents viewed
advertisements using a continuous measurement dial procedure, physically dialling up when they
felt a fear response and dialling down when they felt relieved of the fear. While their paper did not
conclude that emotional fear-based advertising is ineffective, they contended that advertisements
which provide partial fear-relief patterns were preferable to those that leave viewers shocked and in
a fearful state.
In their publication “A fact sheet on Road Safety Advertising” the Queensland Centre For Accident
Research and Road Safety (CARRS-Q), the themes and headline observations were similar to those
previously covered by Cameron et al and Wakefield. This document suggests that threats of physical

62 | P a g e
injury or death appeal less to young males, and that social threats like loss of license or social stigma
attached to it, may be more effective.
The NSW Speed campaign “Speed. No one thinks big of you” or sometimes referred to as the
“Pinkie” campaign is an example of a campaign targeting young male drivers where the depicted
deterrent for the driver is social stigma rather than risk of injury or speeding fines.
That emotional fear-based campaigns are not effective against young males is not consistent with
the demographic patterns of the decline in smoking in NSW between June 2007 (22% prevalence)
and June 2012 (13%), for Men 18-24 (Smoke factory-made cigarettes – Roy Morgan Research
Centre). The decline in smoking for men 18-24 was greater than for any other major demographic
during a period where fear-based advertising was a consistent feature in NSW anti-tobacco
advertising campaigns.
The 2011 Phillips et al Meta-analysis suggested that “effects associated with campaigns described as
having both emotional and rational elements in their approach are stronger than those with purely
rational elements.” However there were few campaigns with content that could be described as
purely emotional in approach, so no meta-analysis of their effects was possible. We presume that
campaigns with strong fear arousal would have fallen into this purely emotional segment.
We note that in the major campaign materials residing on the WA ORS website, there is a mix of
positive and negative approaches to messaging. “Enjoy the ride”, “OK is Not OK” and “You’re worth
holding onto” take a positive approach and “You deserve it” ends on a negative.
Despite Professor Wakefield’s view that negative approaches tend to be more effective in terms of
awareness and clarity of message etc., the road safety community appears less strident in their
positive versus negative approaches, and campaigns like “Pinky” and the most recent NSW drink-
driving campaign “What’s your Plan B?” are considered successful despite their light-hearted
approach.
6. Effects Are Noticeable When Active But Are Time Limited
In her 2011 address to the ISBNPA conference Professor Wakefield illustrated how weekly pap test
volumes lifted during advertising weeks and declined soon after. This is consistent with the findings
published in the Evaluation Report following the first phase of the National Tobacco Campaign
“Every cigarette is doing you damage” (1997) which showed how calls to the Quit line fell in the
weeks following advertising pressure only to lift again when media ran again.
No other states provided any material to us that was not already publicly available, so we can’t cite
examples of short term effect from other road safety campaigns. However, we have sat through
numerous post campaign tracking presentations for other social marketing programs, and Professor
Wakefield’s observations about the limited influence of media campaigns in driving specific
behaviour align with our own. We have observed calls to make appointments for a bi-annual
mammogram decline after advertising pressure stops, as do visits to a GP to have a pap test decline
when cervical screening advertising pressure stops.

63 | P a g e
We have reviewed media plans for Speeding – “Enjoy the ride”. A feature of the 2011 March –
August launch plan is the consistency of exposure with relatively modest levels of weekly weight for
TV, radio, outdoor and online across the period
Over that entire period, 47% of Western Australian drivers were exposed to some form of
communication.
The continuity of exposure of this campaign was not replicated within the 2011/2012 campaign
where television and radio were scheduled concurrently, and outdoor activity was limited.
Further, the message was limited to two bursts of activity (Dec 2011/Jan 20123 and March/April
2012). However we do recognize that “Enjoy the Ride” was alternated with enforcement messaging.
However, with a limited budget, the 2012-13 plan addressed consistency of exposure, again with
modest levels of weekly weight for TV and radio for the seven months spanning November 2012
through May 2013.
7. Campaigns Should Obtain High Population Exposure.
In 2012-13 there could be high confidence that the media campaigns achieved high population
exposure.
In her 2011 ISBNPA address Professor Wakefield spoke of the greater likelihood of negative
approach campaigns to be recalled and the desired messages being correctly absorbed.
We downloaded three advertising tracking reports (Metrix Consulting) from 2012 for the WA Office
of Road Safety. They were for seat belts, drink-driving “OK is Not OK”, and drink-driving “You
Deserve It”. We understand that campaign tracking has now been discontinued.
For Drink-driving the prompted awareness scores were around 60% following advertising flights with
around 250 TARP’s of TV pressure. Presuming a high proportion of Peak night programming in the
2012 schedules, 250 TARP’s would achieve around 75% reach of Western Australian drivers. 75% is
high population exposure. If 60% could recall recently seeing these commercials, then around 80% of
those who could have recently seen it, could recall these ads. This is a good result.
The Sash seatbelt TV campaign which only ran in Regional and Remote areas was supported with
extraordinarily high ad pressure (1,935 TARP’s) over the first two months of the campaign.
Population exposure (reach) would have exceeded 90%. Prompted awareness of the TV spot peaked
at 78% of drivers.
Referring back to the Albert Bandura behaviour change model, for this campaign, campaign
managers could be confident that they satisfied most of the steps.
Attention 87% (78%/90%) of the respondents who could have been exposed to the
Sash TVC, recognised it.
Retention 87% remembered what they had paid attention to.

64 | P a g e
Motivation 39% of non-wearers surveyed were somewhat or much more likely to wear
a seatbelt after watching the ad, and 57% said that they were somewhat or
much more likely to tell someone else in the car to put their seatbelt on.
Reproduction The percent of drivers who claim to wear a seatbelt 100% of the time before
the car starts, rose from around 76% before the campaign to around 83%
after.
Aside from Free to Air TV, the ad was carried on YouTube and Facebook. 2% of respondents recalled
seeing it on YouTube and 2% on Facebook. Without details of the Online campaign, when it ran, and
how much was invested, it is not possible to know whether these low scores are because online
channels did not deliver the reach, or if they did deliver reach but didn’t gain attention.
What is certain is that had the campaign only been placed in digital video channels, it could not
possibly have obtained high population exposure, to achieve its high levels of attention, retention
and motivation.
On any assessment, there could be a high degree of confidence that this campaign was given every
chance of being successful, because it obtained high population exposure. The same can’t be said for
the speeding and drink-driving plans we reviewed for 2013-14.

65 | P a g e
8. Campaigns Should Have Sufficient Advertising Pressure
Media campaign pressure is usually expressed in terms of TARPs (Target Audience Rating Points).
One TARP is the equivalent of reaching 1% of the target audience once. If a campaign reaches 25% of
the target audience an average of 3 times it delivers 75 TARP’s. If it delivers 75% of the target
audience and average of 10 times it delivers 750 TARP’s. Experienced marketing managers use
TARP’s as a measure of relativity and would immediately know relate to 750 TARP’s having ten times
the advertising pressure than 75 TARP’s. Because TARP’s is a calculation based on the percentage of
a jurisdiction’s population, comparisons can be made from one jurisdiction to another. It doesn’t
matter that NSW is a bigger state than Western Australia, the effect of 250 TARP’s placed on TV in
Sydney will have the same relative advertising pressure in Sydney, as 250 TARP’s placed in Perth TV
would have in Perth.
TARP’s are most commonly used in reference to TV campaign weights, but the concept can be
applied to any measured medium. If it can be demonstrated that a bus side campaign reached 60%
of the target audience, and that the average person who saw the campaign, saw it on average 5
times, then it will have delivered 300 TARPs.
In her address to the 2011 ISBNPA conference Professor Melanie Wakefield’s guideline based on her
tobacco experience was that TARP weights should range from 400 to 700 TARP’s per month.
In the tracking research for the WA ORS Drink-drive and seatbelt campaigns mentioned in the
previous section, both unprompted and prompted awareness scores were provided. In the report for
the “You deserve it” drink-driving campaign, unprompted awareness was 12% during the on-air
weeks. It declined to 10% for the two weeks after the advertising finished, then to 5% for the next
two weeks and 1% for the following two weeks. This is the normal rate of unprompted decay
associated with mass market campaigns.
In the same report, the prompted awareness scores held up longer. They were 60% during the two
active weeks, and while they declined during the post-activity period, they were still 55% after 6
weeks of no advertising support. This too is typical of the normal pattern of decline for prompted
awareness.
The difference between the two measures is significant. Unprompted awareness tends to be a
better predictor of behaviour. Professor Wakefield’s main experience is in anti-tobacco advertising,
and she will have observed that calls to the Quitline decline after advertising pressure stops; in other
words when unprompted recall levels drop. In the absence of any other advertising pressure, the
calls to the Quitline will remain low, until more weeks of TV advertising are purchased.
In the case of road safety, there is an abundance of evidence (more on this later) that serious
accidents decline during weeks of, and in the weeks immediately following advertising pressure. This
too would coincide with high levels of unprompted awareness.
Strong prompted awareness scores, once achieved, hold up for more weeks. Prompted awareness is
the key measure for most supermarket brands. While they would prefer high unprompted

66 | P a g e
awareness scores continually, they know that a shopper is prompted to recall what the brand does,
what it stands for, its personality etc. by seeing the product on the supermarket shelf. This similarly
applies to advertisers like KFC where imagery and messages conveyed in recent advertising can be
recalled as consumers drive by an outlet.
The 2012 Metrix Consulting post campaign tracking for the Regional seatbelt campaign
demonstrates how both unprompted and prompted awareness scores can be sustained by relatively
low levels of ongoing TV pressure. With an average of 40 TARP’s per week for the 9 weeks following
the intense launch phase of the campaign, unprompted recall dropped from a peak of 29% (at the
end of the launch phase) to an average of 17% for the following 9 weeks. Prompted recall levels also
declined, but not nearly as much; from a peak of 78% at the end of the launch phase to 69% at the
end of the 9 weeks of 40 TARP’s.
While we have not seen any social marketing research on the significance of unprompted and
prompted tracking scores, our experience is that recognition of regional outdoor campaign material
is normally high when it is easily recognised as part of a broader TV-based campaign. There is no
research that we’re aware of that explores how outdoor or roadside advertising works for road
safety campaigns. Whether it achieves strong recognition just because it delivers messages to drivers
when they are driving, or whether it immediately prompts some underlying feeling or sentiment
created by a TVC, is probably worthy of a study. Regardless, it is likely that having achieved a high
level of exposure for a TV campaign, a much lower cost reminder impression can be made via
roadside signage, which can reproduce the same behaviour as if the unprompted TV recall was still
high.
It is likely that the intensity of TV advertising pressure (400-700 TARP’s/month) that Professor
Wakefield associates with successful campaigns can be lower, if the periods without TV pressure can
be covered by roadside signage integrated into the campaign theme.
Between November 2012 and May 2013 the speeding campaign in Western Australia was averaging
around 200 TARP’s per month, and received a high share of the Regional Outdoor exposure. While
we received no campaign tracking for the speeding campaign, because it was a campaign that
achieved high population exposure, and had carried a consistent theme since 2011, it is likely to
have patterns of unprompted and prompted awareness similar to those for Drink-driving in the early
2012 tracking. This, combined with regional outdoor, would have created a strong likelihood of the
campaign successfully translating to the desired driving behaviour, presuming the “Enjoy the ride”
campaign successfully motivates drivers to slow down.
The same confidence can’t be presumed from the media plans we have seen for 2013-14. They lack
sufficient advertising pressure.

67 | P a g e
9. Maintain Media Pressure Over Time.
In their Meta-analysis of the effect of road safety campaigns (Ross Owen Phillips/Pal Ulleberg/Truls
Vaa -January 2011), they found a strong correlation between crash reductions and campaigns of
200+ days duration.
In their May 2004 “Review of Mass Media Campaigns In Road Safety” Cameron/Delaney et al noted
media inputs into several studies conducted in Victoria for the TAC. One was a paper “Advertising
Wearout in the Transport Accident Commission Road Safety Campaigns” (Fry, 1996), and the other
“Evaluation of Country Random Breath Testing and Publicity Program in Victoria, 1993-1994”
(Cameron, Diamantopoulou, Mullan, Dyte, Gantzer 1997).
Where most prior attempts to understand advertising’s impact on crashes used media expenditure
or TV TARP’s, these used a calculation called Adstock (a theory developed by Simon Broadbent
(Broadbent 1979). We are familiar with Adstock theory and believe that this or other calculations
that account for the combined effect of past and current advertising, could be key to increasing the
periods of advertising effectiveness for Road Safety Advertising for WA.
The main contributors to average weekly Adstock points are the measured half-life of the creative,
weekly TARP pressure and the number of active weeks, and while we were not provided specific
data on campaigns from other states, the data we were able to review shows flighting patterns that
are consistent with advertisements that produce low awareness decay (long half-lives). They feature
modest weekly TARP weights when on air, more weeks of advertising activity, and in NSW, more
long-term advertising pressure in Regional areas than Metropolitan.
Our observations from the most recent media plans for the WA ORS Speeding and Drink-driving
media plans are that they are constructed in a way that would not allow the WA ORS to have high
levels of confidence in their ability to reduce crashes. There is an absence of any meaningful Drink-
driving or Speeding TV advertising pressure against those most at risk (Regional WA residents).
Advertising in Perth is infrequent leaving many more weeks without cover than with.
The small expenditure in WA Regional areas for speeding is confined to 10 spots a week in
syndicated radio programs on RedFM serving remote areas, and a package of spots on TV and radio
stations targeting indigenous communities in remote and very remote locations. No meaningful
advertising presence can be presumed for the major Regional driving population in centres like
Albany, Bunbury, Bridgetown, Carnarvon, Esperance, Geraldton, Merredin, Kalgoorlie, Northam etc.
There may be some evidence of high population reach that was not included in the media
recommendations we reviewed, but the broadcast media campaigns in WA Regional markets have
the appearance of a gesture, rather than a robust media campaign to seriously address attitudes and
driving behaviour of those at greatest risk.

68 | P a g e
10. Use Multiple Media Channels.
There is a general tendency for those who are more likely to undertake the desired behaviour
depicted in advertising (buy a product, visit a store etc.) to recognise a campaign’s advertising
through more than one media channel. It is also true that users of a product or service are more
likely to notice advertising for that product or service than non-users. Whether desired behaviour is
because of multi-media impact, or whether those who are most likely to display the desired
behaviour relate to the messages more, and therefore are more likely to notice it, is unclear.
Nor is it clear from Professor Wakefield’s guidelines, why she believes that multiple media channels
are desirable.
What is evident from campaign tracking is that recognition of any element of a multi-media
campaign through any channel, is higher than the recognition of the highest individual channel. For
example it is not unusual to see recognition of any campaign material to be 70%, and recognition of
TV to be 60%, Outdoor 40%, Online 15% etc. As Professor Wakefield believes in the importance of
high population exposure, then as the combined reach of two media is greater than one, it follows
that so too would campaign recognition be higher via two media than one.
In road safety promotion we have already acknowledged the likely short-term behaviour influencing-
effect of roadside messages, when they are integrated with messages in other media. Additionally
the Phillips/Ulleberg/Vaa study Meta-analysis concluded that there was a stronger weight of
influence for campaigns using TV, radio and print, and independently a high weight of effect for
roadside messages.
The issue for road safety marketers is how many channels are ideal. At the foundation of the
considerations is the arithmetic. If most main media channels have an undistorted audience
distribution then reasonable guesstimates of their combined reach can be made. If 60% of the target
audience can recognise a TV ad, and 40% can recognise an outdoor poster for the same campaign,
then we could estimate that 24% recognise both the TV and outdoor, and if there are benefits of
message registration in two media versus one, then this benefit will only apply to 24%.
It follows that multi-media impact is only really meaningful when each channel used has the ability
to generate relatively high levels of recognition on its own.
Marketers must be careful that in trying to create an integrated multi-media campaign, that the
effort in the channels that normally do the heavy recognition lifting, aren’t so starved of funds that
they can’t achieve strong recognition in their own right. This would be a legitimate concern for the
2013-14 campaigns for speeding and drink-driving. We note that out of what appears to have been a
reduced drink-driving 2013-14 budget, $120,000 was planned for production, $45,000 for website
enhancements, $80,000 for Digital applications leaving just $290,000 for main media to be spread
across TV, radio, indigenous media and regional radio sponsorships.
These campaign budgets excluded Regional Outdoor. We note that there is solid media allocation to
Regional Outdoor, and that campaigns are rotated through this holding.

69 | P a g e
Regional Outdoor’s inclusion is consistent with the findings from the Phillips et al Meta-analysis
pointing to the weight of influence of roadside messaging.
Broadcast media are successful at generating campaign awareness and were also recognised by
Phillips et al to have a strong weight of influence. While Phillips et al did not attempt to explain why
roadside messaging weighed as heavily as it did, because it combines both the ability of rekindling
the key campaign sentiment, and as all of its impact is made against drivers while driving, it is the
ideal campaign support medium to influence short-term driving behaviour.
In our experience, the development of Regional Outdoor signage is a key priority, and it’s up-grading
is a long and continuous process. Road Safety marketers regularly review their outdoor locations to
align them with accident black spots, and ensure that the signs are correctly orientated (signs with
speeding messages are impacting drivers about to enter a 100,000ph zone rather than leaving one
etc). Quality suitable outdoor plant in regional areas is difficult to acquire and is often sought out by
other advertisers. The objective is to intersect as many country trips with roadside reminder
campaign messages as possible.
We were provided location maps and the costs of the WA ORS outdoor holding. The detail of each
panel’s orientation or individual site cards was not provided, so we can’t comment on its overall
quality. In other states, outdoor serves as a “blink-of-the-eye” reminder of the normative or desired
behaviour, and a similar role is presumed for WA. However, it could be argued that its effectiveness
is enhanced when the majority of those who are exposed to roadside messages, have also been
recently exposed to the campaign in another medium. For practical and affordability reasons that
other medium in Regional Western Australia needs to be TV, and the confidence that multi-media
impact is being achieved to combat speeding in Regional Western Australia could not be high, as
Regional WA is excluded from all but a token TV presence in the 2013-2014 Speeding campaign.
We note too that the WA Regional Outdoor schedule carries drink-driving messages. In our
experience drink-driving advertising is more heavily skewed towards Outdoor formats in urban
environments (street furniture, bus advertising, taxi backs etc) than on country roads. Regional
Outdoor themes are more likely to be speeding, driver fatigue, seatbelts and heavy vehicle
messages.
Despite a solid Regional Outdoor presence, it is unlikely that the multi-media plan combining TV,
radio, sponsorships, digital and Outdoor, could have achieved any meaningful multi-media
recognition.
11. Conduct Rigorous Independently Assessments of Outcomes.
We were advised that there has been no post campaign tracking since 2012.
We received no material that relates advertising activities to either crash data, speeding fines trends,
or infringements for not wearing seatbelts etc.
We received a copy of a document produced on 15.2.13 called “Impact on Road Safety Initiatives:
Summary of the Ten Years” prepared by Painted Dog Research. In the main this document is a

70 | P a g e
summary of improvements in road safety key measures since 2002. It shows that in 2002 there were
2,325 (Killed or Serious Injury crashes) KSI’s in Metro and 1,038 in Regional areas.
The ratio was 45 Regional KSI’s to 100 Metropolitan.
In 2010 the figures were 1,684 Metropolitan and 961 Regional KSI’s.
The ratio had increased to 57 Regional KSI’s per 100 Metropolitan.
Between the years 2002 to 2010 the Metropolitan KSI’s had declined by 28%.
The Regional KSI’s had declined by only 7%, and in two regions; Great Southern and Mid
West, they had increased by 17% and 14% respectively.
It is clear that the progress in Regional areas has been much slower.
This calls into question the recommendation in 2013-14 to make Metropolitan Perth the priority for
TV and radio coverage. Arguably the task is much more challenging in Regional WA.
The Painted Dog Research report goes on to estimate the number of deaths and serious injuries and
then extrapolates the cost savings attributable to these reductions. These savings are based on a
presumption that the reductions attributable to Road Safety advertising are 9% annually. The source
noted in the Painted Dog Research is a paper presented by Maurice Cammack at the 2010 ICWA
Road Safety Forum in 2010. This paper was not reviewed by us and was not one of the papers
presented at 2010 ICWA conference that is available to be down-loaded. We presume that the
source of the 9% reduction in the Maurice Cammack address was from one of the most commonly
quoted previous Meta-analyses which concluded similar reduction levels (Elliott 1993 - 7.5%
reduction), (Delhomme 1999 - 8.5%) and perhaps even Phillips et al in 2010 - 9% reduction).
The 2011 Meta-analysis of 119 campaigns published by Ross Owen Phillips, Pal Ulleberg and Truls
Vaa concluded that the weighted average effect of the campaigns included in the analysis, was a 9%
reduction in accidents.
However, an average 9% reduction in accidents was for crashes during and immediately following
road safety advertising activity. In our view, this crash reduction presumption can only reasonably be
applied to periods with advertising activity and the few weeks after. A year-long 9% crash reduction
attributable to advertising could only be presumed if there is evidence that right throughout the
year, most of the population will have had recent exposure to advertising messages. It is
unreasonable to assume a 9% crash reduction in situations where there is meaningful advertising
campaign pressure for only a few weeks a year, as there will be for both speeding and drink-driving
in the 2013-14 Financial Tear.
There was strong evidence from the Phillips et al Meta-analysis of crash reductions for campaigns
using emotional messaging for speeding and drink-driving messages, but they didn’t observe similar
strong correlations for other road safety messages. This would suggest that it would only be safe to
presume a 9% crash reduction correlation as they apply to speeding and drink-driving campaigns.
Campaigns for seat belts etc. would have fallen into a group of campaigns in the Meta-analysis,
where the same weight of effect was not conclusive.

71 | P a g e
Phillips et al also noted that the use of TV, radio, newspaper and road side messaging had a greater
weight of influence in reducing crashes. So a 9% blanket reduction can’t be presumed regardless of
the media selection.
The Phillips et al 2011 Meta-analysis’ observations were strongly influenced by campaigns
addressing speeding and drink driving, campaigns lasting over 200 days and campaigns using road
side messaging. Fatality or serious injury reductions of 9% can’t be presumed for other campaigns,
nor for campaigns that are short-lived and don’t achieve wide exposure over several media.
We believe that a calculation as to the ROI of road safety advertising needs to be modified from year
to year depending on the presence of those factors that carried the most weight in the source Meta-
analysis.
A review of the 2012-13 media plans is that they would largely satisfy most of the learnings from a
range of academic papers, but in our view, few would be evident in the 2013-14 campaign.

72 | P a g e
6. Should future campaign spending include education on road rules?

73 | P a g e
Should future campaign spending include explicit education campaigns on emerging and
ongoing road use issues, such as keep left, how to merge, etc?
In their 2004 Meta-analysis review of road safety campaigns (Cameron, Delany et al); the first listed
conclusion addressed this subject. “Campaigns with a persuasive orientation, and those that use
emotional rather than rational appeals, tend to have a greater effect on the relevant measure of
effect. In contrast, information based and educative campaigns have been associated with less
effective campaigns.”
We interpret this to mean that campaigns on issues such as keep left, safe distances between
vehicles and how to merge etc., fall into this group of campaigns that had a lesser effect.
From the materials reviewed for this project, there appear to be several road safety themes with
strong evidence that they can be effective. A recurring observation is that better traction appears
possible when the behaviours seeking modification lend themselves to other initiatives like changed
rules and enforcement. This may contribute to why speeding and drink driving campaigns weigh so
heavily in measured campaign effectiveness, while correlations for other campaigns like fatigue,
seatbelts, pedestrian safety etc. fall into the group where the weight of effects appears weaker.
At the foundation of the “Towards Zero” strategy is the recommendation to focus on a relatively
small number of large and severe problems which have been proven to be amenable to
improvement through behaviour change campaigns.
Target Audience Priorities.
Speeding and Drink-driving continue to be the priority road safety communication themes for the
Victorian TAC and Transport for NSW (formerly RTA). These jurisdictions have considerably lower
fatalities per 100,000 persons than Western Australia. They also have economies of scale, can afford
to invest more on new campaigns and pragmatically, probably have more financial scope for
experimentation. Without the bigger states’ economies of scale, it is perhaps more prudent for
Western Australia to remain focused on fewer, large road safety problems where the confidence of
the efficacy of mass media campaigns is greater.
Regardless of the jurisdiction, vehicle controllers in speeding and drink driving crashes right across
Australia are young males. The other important target audience consideration is greater risk of
serious crashes for those who live in Regional, Rural and Remote areas.
A campaign strategy that made its highest priority, those at greatest risk would be difficult to
challenge. A priority to target males under 30 in Regional WA would be consistent with this strategy.
Emerging media trends may make marketers (needing to reach this group), concerned that effective
media channels may be less relevant for today’s campaigns, and we think it is important in this
review to look at the evidence with regards to media usage trends.
Relevant Media Usage Trends

74 | P a g e
While the internet has expanded the suite of media generally available, it is not automatic that a lift
in usage of one medium, must be at the expense of another. As mobile technology makes it possible
to view/listen to most media formats on demand, it’s become easier to spend more time consuming
media generally.
Where once direct response TV marketers sought programs and timeslots with low viewer
involvement (so they would be prepared to leave the TV set and make a phone call), this is no longer
essential. Advertisers can now generate high website traffic in programs with high involvement and
viewing, because many TV viewers can; and do, watch TV with a smartphone or tablet at hand,
making an immediate response possible without the need to interrupt the TV viewing occasion.
Usage of the internet is generally high, and it is especially so for Men 17-29, but so is usage of the
media traditionally relied upon for Road Safety advertising:
75% of Men 17-29 in WA have seen outdoor advertising in past 7 days, (Roy Morgan Dec
2013). Outdoor’s reach ability is unaffected by changed trends in online or any other media.
87% listened to commercial radio in the past 7 days. (Roy Morgan Dec 2013).Commercial
radio formats targeting under 30 year old listeners are still popular and radio still effectively
reaches drivers while driving. (Roy Morgan Dec 2013).
79% in Perth, and 77% in Regional WA watch commercial TV on the average weekday, while
the daily use of the internet (via all devises) is 77% in Perth and 73% in Regional WA (Roy
Morgan Dec 2013).
When comparing media usage between Commercial TV viewing and Internet usage,
it needs to be kept in mind that “watching Commercial TV” is a very explicit media
usage definition. It excludes viewing to the non-commercial ABC channels. “Internet
usage” is far less explicit. People can use the internet all day; sending and receiving
emails, without needing to view a site that hosts advertising messages.
Relatively restricted categories of TV viewing parameters can still achieve high levels of recent usage
for Males 17-29. For example:
53% of Men 17-29 in Perth watched channel Seven in the past week, and 60% of those in
Regional WA watched the Seven regional affiliates (Roy Morgan Dec 2013).
43% of Men 17-29 in Perth and 49% in Regional WA watched at least one of either 7Mate,
GO! or Eleven in the last 7 days. (Roy Morgan Dec 2013). The introduction of these new FTA
channels has provided more viewing options, and greater scope for specific demographic
targeting.
55% of Men 17-29 in Regional WA watch the regular AFL season matches (exc. Finals). (Roy
Morgan Dec 2013).
TV Still Performs Well in Post Campaign Tracking

75 | P a g e
There has been no WA road safety campaign tracking since early 2012, but we note that the highest
measure of relevance (56%) for the “Okay is not Okay” TVC was for 17 to 24 year olds. This is despite
that they are less likely to be heavy TV viewers than most other target groups. We note too that
most other major road safety campaigns in other jurisdictions targeting young males continue to
produce a TV campaign which encapsulates the main campaign idea. The NSW 2012 “What’s Your
Plan B” campaign is a case in point.
While no other states were prepared to provide us any campaign tracking data that is not publicly
available, in our experience, the observations about TV’s high awareness scores evident in the
Western Australian 2012 Metrix Consulting post campaign tracking, is typical of TV’s measured
achievements in other social marketing campaigns in other jurisdictions. TV still does most of the
heavy lifting when it comes to campaign awareness. Recognition of campaign materials used in
other media, including online (which these days receives relatively high funding), is still low.
Digital & Social Media
Setting aside online’s activation benefits (click through to campaign websites etc.), its lower cost per
thousand impressions, its sharper targeting possibilities and its superior ability to control frequency
of delivery, there is relatively little publicly available research regarding the contribution of digital
and social media to serious crash reductions.
The term social media is broad and encompasses most channels that can facilitate two way
communications. Commercial advertisers tend to measure social media in terms of customer
engagement, sales to fans versus the general public, loyalty and repurchasing measures for those
who “Like” a brand, and measures of customer engagement.
Successful social media practitioners manage conversations with customers in much the same way
as would customer-facing sales people or those in a call centre. Marketers seeking behaviour change
for the public good tend to be Governments, it takes time to develop, debate, review and approve
social media policies. By the time the guidelines about who is authorised to speak for the
organisation, and what they are authorised to say etc., commercial enterprises have learnt through
trial and error. It is perhaps due to the type of organisations Governments are, that they might be
slower than brands and commercial operators to have successful case studies for review.
Several high profile social marketing campaigns have achieved impressive social media metrics. The
examples below are typical of those that have captured the attention of the marketing community.
The NSW RTA “Speeding. No one thinks big of you” video achieved over 500,000 views on
YouTube (Watson 2008). These views were to the 45” TVC that was seeded on YouTube, but
also appeared in FTA TV and in Cinema.
TAC change the town name from Speed to Speed Kills achieved its aim of more than 30,000
Facebook Likes.
Melbourne Metro Trains “Dumb ways to die” animated content video and accompanying
jingle, achieved over 39 million YouTube views (McCann).

76 | P a g e
Transport for NSW “Get your hand off it” mobile distraction campaign, achieved over
600,000 views to its music video on YouTube (NSW Centre for Road Safety). This too
required the pre-production and seeding of a music video.
WA Office of Road Safety – Speeding “Enjoy the ride” achieved over 400,000 YouTube views
(WA ORS).
We found no analysis of any of these Social Media initiatives with the kind of rigour that would
satisfy a peer review process for an academic paper. What little literature that exists, lists results in
terms of their achievement of broadcast metrics (YouTube hits/Facebook Likes), and such measures
are relatively easily obtained. Measurement to isolate their impact on road crashes would be very
challenging.
A fuller assessment of the impact of these Social Media examples might involve an investigation as
to what portion of the hits or Likes were achieved within the marketer’s jurisdiction? How does the
volume of views compare with the audience that might have been achieved in another way? How
many of the target audience within the jurisdiction have been reached by the campaign? How was
their attitude to the safety or health issue affected by their exposure? How robust are the measures
of success?
The “dumb ways to die” initiative is said to have contributed to a short term 20% reduction in “risky
behaviour compared to annual figures”, but without an understanding of the methodology,
measured behaviour at level crossings and train stations, or solid data on the long term impact on
deaths and injuries attributable to the activity, the road safety community will be left wondering
about Social Media’s potential contribution to road safety measures.
Relative to social marketing campaigns in traditional media, it may take time to accumulate enough
campaigns with sizeable digital and social media budgets to amass enough data from which to draw
statistically robust conclusions. Our observation is that social media and digital communications are
more likely to be focused on messages supporting the main campaign. The NSW “Don’t rush”
campaign directs drivers to its Facebook page to take “the slowdown pledge”. It has used online
videos featuring Dr Brian Owler (the Sydney neurosurgeon featured in the “Don’t rush”
commercials), Hazem El Masri (retired NRL player) ,and Nathan Bracken and Brett Lee (NSW
cricketers), to direct viewers to take “the slowdown pledge”. It has over 6,000 Facebook likes.
We suspect that part of the problem with measuring the impact of Social Media is its difficulty to
achieve the scale required to relate the activity to road crash or speeding infringement data. While
500,000 YouTube views of the NSW Speeding “Pinkie” – “No one thinks big of you campaign” is
significant, there have been around 800,000 young men fall within the Males 17-24 demographic
within NSW since “Pinkie” was loaded onto YouTube since June 2007. Even if 70% of the total
YouTube views were from Australia, and 70% of Australian views were by NSW drivers, and if 70% of
those were Male, and if 70% of those were aged 17-24, (very likely over-estimates on all counts),
then this will have achieved less than 120,000 YouTube views against the defined target group. That
is the equivalent of around 15 TV TARP’s over seven years. The effects of media outcomes with such
little scale can’t be detected.

77 | P a g e
The odds of success are greater when campaigns achieve scale and are for road safety themes
proven to be amenable to interruptive advertising in media that can achieve high levels of audience
exposure and message recall.
Recommendation
Our research has identified evidence that there is both an economic and social benefit to road safety
advertising.
Specifically we have detailed that the TAC allocates almost twice the spend per capita on road safety
compared to other markets. Its return on investment is a reduction in claims. They have determined
that there is a commercially viable ROI from road safety advertising.
We have cited other examples and advocates of the positive role adverting plays in social marketing
(Prof Simon Chapman – anti-tobacco, Prof Melanie Wakefield –Cancer Council)
However success of social marketing campaigns requires adherence to a number of basis marketing
principles, including but not limited to:
Messages are based on sound research and target testing
High exposure
Sufficient advertising pressure
Maintain pressure over time
Use multiple channels
Conduct rigorous independent assessment of outcomes
Our observation is that due to budget contraction ORS activity has not been able to consistently
commit to these principles.
Yet, commitment to these principles is essential to maximise impact of ORS media budgets and assist
in contributing toward the achievement of the Toward Zero objectives.

78 | P a g e
7. Appendices

79 | P a g e
Appendix 1 – Potential Application of Existing Material to a broader state-
wide audience
Director/Producer’s Explanatory Notes
All commercials have been reviewed using low resolution ‘YouTube’ files.
Observations and recommendations have therefore been undertaken without the opportunity to view the actual quality and subtle nuances that high-resolution pictures would afford.
There are number methods of revising/editing the scenes required to remove/amend non WA scenes. We have recommended the methodology that we know will deliver the high standard required.
If any of these campaigns are considered for revision, we would request that high resolution copies of these ads be sourced so that a detailed assessment of the material can be achieved.
When requesting material/assets from interstate jurisdictions, ORS should request:
The editing project (the files that created the edited master)
The edited master
Clean sub masters – the master without graphics layer
Selected, graded wild reels so that WA editors can access each scene and extend ormanipulate it
Graphics information – type font/face information if type is to be changed
An “M&E” mix – Music and effects audio mix which will allow revision of sound trackmore easily. The M&E separates music and sound effects on to two discreet tracks
WA would be wise to ask for the “audio project” if available
Voice over talent information so that if the voice over is being used in WA, the talentwill need to be paid for that market
Music track information so that WA can seek music licensing for their territory
Any stock footage or purchased scenes that will need to be licensed to WA territory
Any 3D or 2D elements with ‘alpha channel’ to allow re-editing if needed
If not stated, all of the end graphics will need to be reproduced. In most cases this can be completed at the time of editing and should be achievable and included in the cost of mastering the new WA version of the TVC.
The TVC’s will also need to be resubmitted for CAD acceptance.

80 | P a g e
NEW SOUTH WALES CAMPAIGNS
Speed – Don’t Rush
Two items need to be checked before running in WA.
Paramedic uniform may not be consistent with WA uniform. The badging could be replaced frame by
frame with tracking 2D images.
Allow 6-8 hours of 2D to replace: (Allow $3,000-$5000 including editing).
Speed camera may need to be replaced if not consistent with WA equipment.

81 | P a g e
If only the camera head is being replaced then allow 6-8 hours of 3D to build the new head digitally
and compositing the new image over the old one (allow $5,000- $8,000 including editing).
If the camera on the pole is replaced with say a tripod-mounted camera then we would need to
receive a clean “sub master” without the end super. This is a copy of the master with no supers. The
existing pole mounted camera would have to be “painted out” and the new camera would have to
be drawn in 3D and inserted into the picture. The end super will need to be re-inserted after all 3D
work was completed (allow $8,000-10,000 including editing).
Summary of Estimated Cost to Edit to Suitable WA Format
Approximately $16,000 - $23,000 (plus talent).
Estimated Cost to Produce Similar Spot in WA
Approximately $200,000-$250,000.
Saving to WA Government if interstate jurisdiction creative adapted for local Use
Approximately $177,000-$227,000.
Drink Driving - Plan B
Taxi light may not be consistent with WA taxi livery. Requires 3D taxi light to be created and
composited over existing footage (also reflections need to be adjusted on roof and on bonnet –
although it may be deemed not required given the amount of distortion on both these planes). The
talent being recognizable means that the digital renovation of the taxi sign is the only option unless
you cast a very good look-a-like talent and reshoot (allow $5,000-$8,000 including editing).

82 | P a g e
Given the distinct look of WA trains and stations, it may be cheaper to re-shoot this scene than
altering existing footage. This station scene can easily be reshot using a look-a-like as talent as we
never get a good look at his face. Adding the “plan B” graphics to the station platform and the train
will also be a lot easier/cheaper.
Graphics: static 2D for the wall sign and tracked 2D graphic for the train sign (allow $2,500-$3,000).
Shooting would be a 10 hour day with minimal crew and no location fees or train expenses: (note in
this 10 hour day you would be able to achieve this station scene and the tow RBT scenes to revise
this commercial - see next)
Director/producer $4,000.00
D.O.P $2,000.00
Camera gear $3,500.00
Gaffer $650.00
Gaffer truck $250.00
Grip $650.00
Grip truck $250.00
lighting allowance $1,500.00
Talent $300.00
Safety & permits $800.00
Total: $13,900.00
Margin @ 15% $2,085.00
Nett Total: $15,985.00
GST: $1,598.50
Grand total: $17,583.50

83 | P a g e

84 | P a g e
These coasters can be easily re-shot using WA versions on the same 10 hour shoot mentioned
above. Allow $300 for coasters to be produced.
Summary of Estimated Cost to Edit to Suitable WA Format
Approximately $26,000
Estimated Cost to Produce Similar Spot in WA
Approximately $350,000-$400,000
Saving to WA Government if interstate jurisdiction creative adapted for local Use
Approximately $324,000-$374,000
Restraint - Clip Every Trip
WA will need to ask for a clean sub master (copy of master without any graphics) so that WA can add
their end supers.
Summary of Estimated Cost to Edit to Suitable WA Format
Approximately <$5,000,
Estimated Cost to Produce Similar Spot in WA
Approximately $150,000-$200,000
Saving to WA Government if interstate jurisdiction creative adapted for local use
Approximately $145,000-$195,000

85 | P a g e
Fatigue - Don’t trust your tired self (Metropolitan)
Number plates are the issue in this spot. If dominant cars plates are re-inserted with WA plates then
the other plates probably won’t need attention.
Allow for 2D graphics with tracking (allow $5,000-$6,000)
Summary of Estimated Cost to Edit to Suitable WA Format
Approximately $6,000
Estimated Cost to Produce Similar Spot in WA
Approximately $150,000k-$200,000k
Saving to WA Government if interstate jurisdiction creative adapted for local use
Approximately $144,000-$194,000

86 | P a g e
Fatigue - Don’t trust your tired self (Regional)
Same estimate as metropolitan.
Allow for 2D graphics with tracking. (Allow $5,000-$6,000)
Summary of Estimated Cost to Edit to Suitable WA Format
Approximately $6,000
Estimated Cost to Produce Similar Spot in WA
Approximately $150,000-$200,000
Saving to WA Government if interstate jurisdiction creative adapted for local use
Approximately $144,000-$194,000
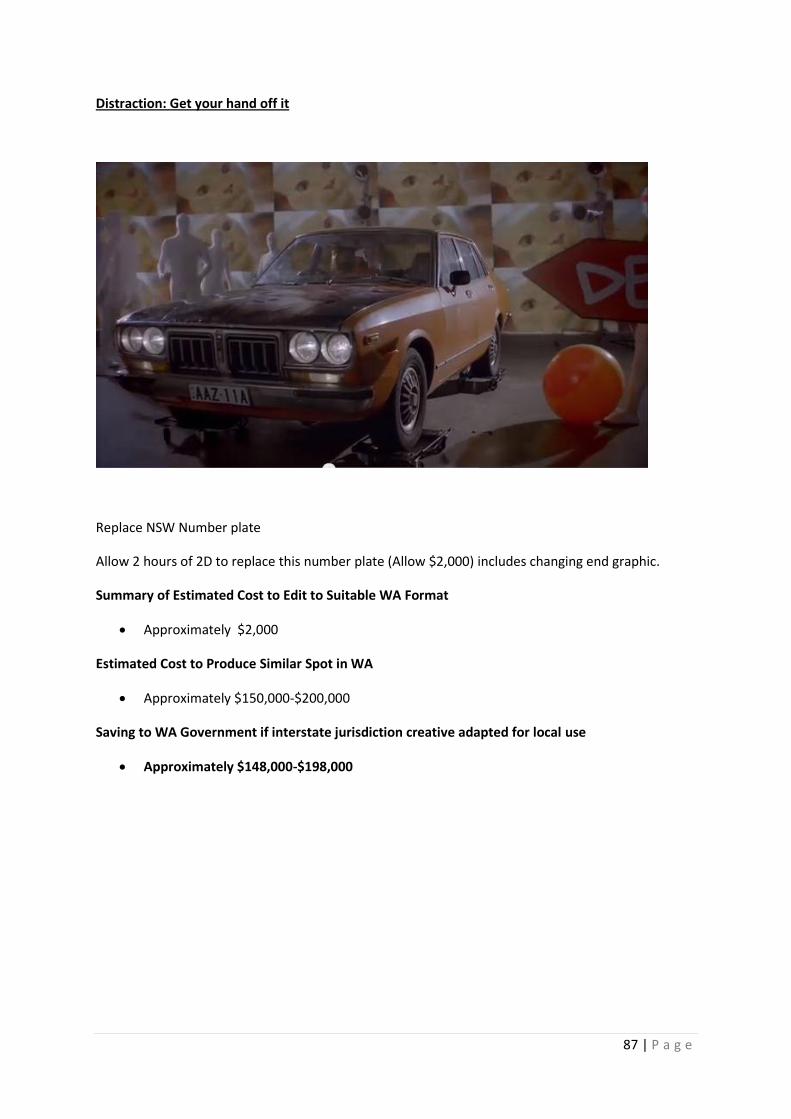
87 | P a g e
Distraction: Get your hand off it
Replace NSW Number plate
Allow 2 hours of 2D to replace this number plate (Allow $2,000) includes changing end graphic.
Summary of Estimated Cost to Edit to Suitable WA Format
Approximately $2,000
Estimated Cost to Produce Similar Spot in WA
Approximately $150,000-$200,000
Saving to WA Government if interstate jurisdiction creative adapted for local use
Approximately $148,000-$198,000

88 | P a g e
VICTORIAN CAMPAIGNS
Speed: Wipe off 5
Campaign excluded as is an AFL focussed content, featuring only Victorian clubs/players
Speed: Pictures of You
Replace fire hydrants and bus timetables if not consistent with WA infrastructure.
(Allow $5,000-$6,000) includes editing and changing end graphic
Summary of Estimated Cost to Edit to Suitable WA Format
Approximately $6,000
Estimated Cost to Produce Similar Spot in WA
Approximately $350,000-$400,000
Saving to WA Government if interstate jurisdiction creative adapted for local use
Approximately $344,000-$394,000

89 | P a g e
Drink Driving: Bloody Idiot
The police, fireman/emergency services uniforms may not be acceptable.
Given the darkness of the scene, it is possible that some blurring in post-production would deal with
any inconsistencies. (Allow $1,500-$2,500)
Summary of Estimated Cost to Edit to Suitable WA Format
Approximately $2,000
Estimated Cost to Produce Similar Spot in WA
Approximately $250,000-$300,000
Saving to WA Government if interstate jurisdiction creative adapted for local use
Approximately $248,000-$298,000

90 | P a g e
Safer Vehicles: How Safe is Your Car?
This scene requires accessing the clean shot and adding the ‘hand’ graphic and the web site address.
Both of these items are simple to add in an edit suite. (Allow $1,500-$2,000).

91 | P a g e
The two end graphics can be revised in edit suite. (Allow $1,500-$2,500)
The adaption of this campaign will not be relevant if a similar website is not planned for WA.
However we have included due to relevance of road safety issue.
Summary of Estimated Cost to Edit to Suitable WA Format
Approximately $2,000. James O’Lachlan talent costs to be investigated
Estimated Cost to Produce Similar Spot in WA
Approximately $150,000-$200,000
Saving to WA Government if interstate jurisdiction creative adapted for local use
Approximately $148,000-$198,000

92 | P a g e
Distraction: Safer P Plater
As the web address web will require change, the background animated graphic needs to be supplied
without the web site graphic. If this clean animation is supplied then adding the new web site
graphic would be achieved in a simple edit suite. (Allow $1,000-$1,500)
Summary of Estimated Cost to Edit to Suitable WA Format
Approximately $2,000.
Estimated Cost to Produce Similar Spot in WA
Approximately $150,000-$200,000
Saving to WA Government if interstate jurisdiction creative adapted for local use
Approximately $148,000-$198,000

93 | P a g e
SOUTH AUSTRALIAN CAMPAIGNS
Speed: Creepers Campaign
2D replacement of signs using tracking program. (Allow $1,000-$2,000)
Taxi and ambulance may need attention. It may only require some blurring of specific livery (allow
$1,000-$2,000).
If 2D retouching is needed, allow $2000-3000.
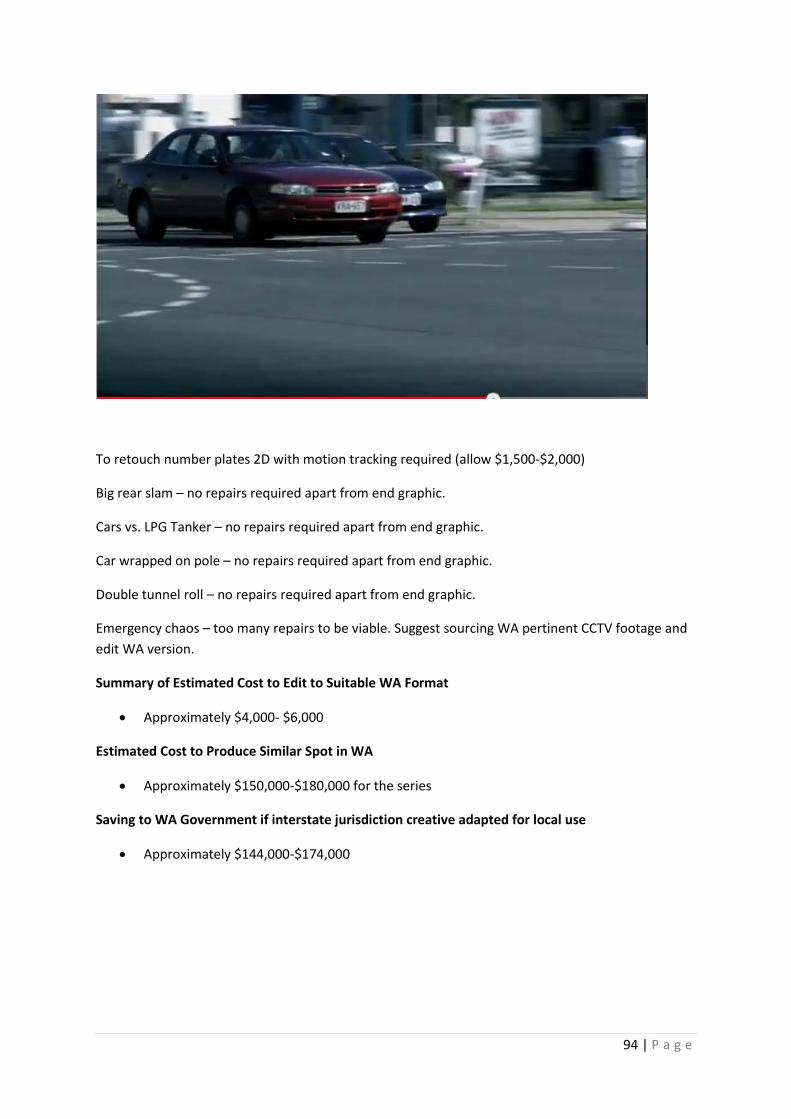
94 | P a g e
To retouch number plates 2D with motion tracking required (allow $1,500-$2,000)
Big rear slam – no repairs required apart from end graphic.
Cars vs. LPG Tanker – no repairs required apart from end graphic.
Car wrapped on pole – no repairs required apart from end graphic.
Double tunnel roll – no repairs required apart from end graphic.
Emergency chaos – too many repairs to be viable. Suggest sourcing WA pertinent CCTV footage and
edit WA version.
Summary of Estimated Cost to Edit to Suitable WA Format
Approximately $4,000- $6,000
Estimated Cost to Produce Similar Spot in WA
Approximately $150,000-$180,000 for the series
Saving to WA Government if interstate jurisdiction creative adapted for local use
Approximately $144,000-$174,000

95 | P a g e
Drink Driving: Just over, just don’t drive (Version 1)
Need to determine whether this breathalyser type is correct for WA. Use 3D animation will be
required to amend if required (allow $8,000-$10,000)
Police uniforms in background are probably blurred enough to be used without repair. Recommend
rotoscoping foreground character and adding more blurring to background to disguise police
uniforms. (Allow $3,000-$5,000)
Summary of Estimated Cost to Edit to Suitable WA Format
Approximately $11,000 - $16,000.
Estimated Cost to Produce Similar Spot in WA
Approximately $130,000-$180,000
Saving to WA Government if interstate jurisdiction creative adapted for local use
$114,000-$164,000
Drink Driving: Just over, just don’t drive (Version 2)
Only end graphic requires replacement.

96 | P a g e
Distraction: Mobile phone – Call
Number plate repair (if required). 2D tracking (allow $2000-$3,000).
Number plate repair if required. 2D without tracking (allow $1,000-$1,500).
Summary of Estimated Cost to Edit to Suitable WA Format
Approximately $3,000-$4,500

97 | P a g e
Mobile phone – Email
Number plate repair (if required). 2D and tracking (allow $1000-$1,500).
Number plate repair (if required). 2D and tracking will be required (allow $1,000-$1,500).
Summary of Estimated Cost to Edit to Suitable WA Format
Approximately $2,000-$3,000

98 | P a g e
Distraction: Mobile Phone - Twitter
The red and white crossing pole may not be consistent with WA regulations. To remove it frame by
frame painting out would be required (allow $5,000-$8,000).
Mobile Phone 60 second combination TVC has most of these scenes so these repaired scenes would
automatically be able to be inserted at only the cost of editing.
Summary of Estimated Cost to Edit to Suitable WA Format
Approximately $5,000-$8,000
MOBILE PHONE DISTRACTION SERIES – Call/Text/Twitter
Summary of Estimated Cost to Edit Series to Suitable WA Format
$10,000-$15,000
Estimated Cost to Produce Series in WA
Approximately $450,000-$500,000
Saving to WA Government if interstate jurisdiction creative adapted for local use:
$435,000-$485,000

99 | P a g e
QUEENSLAND CAMPAIGNS
Speed: Better slow down nightmare
End graphic to be replaced. Editing only (allow $500-$1,000).
Summary of Estimated Cost to Edit to Suitable WA Format
Approximately $2,000-$3,000
Estimated Cost to Produce Similar Spot in WA
Approximately $150,000-$200,000
Saving to WA Government if interstate jurisdiction creative adapted for local use:
Approximately $147,000-$197,000
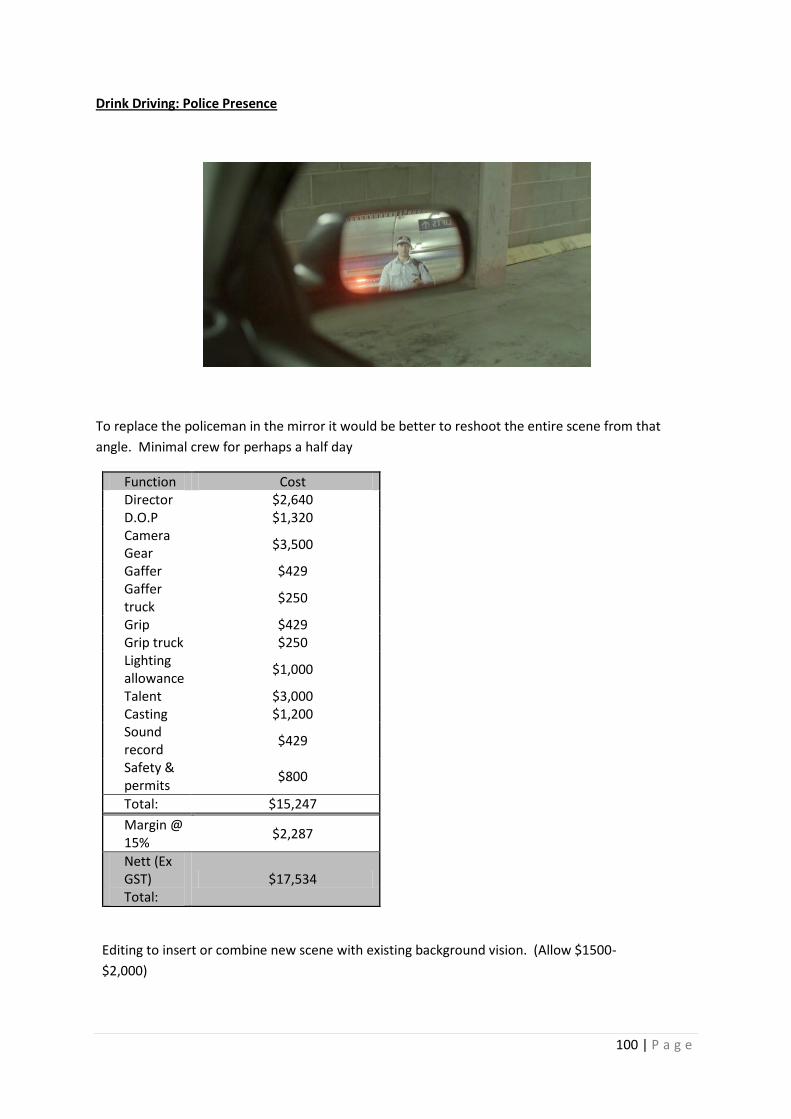
100 | P a g e
Drink Driving: Police Presence
To replace the policeman in the mirror it would be better to reshoot the entire scene from that
angle. Minimal crew for perhaps a half day
Function Cost Director $2,640 D.O.P $1,320 Camera Gear
$3,500
Gaffer $429 Gaffer truck
$250
Grip $429 Grip truck $250 Lighting allowance
$1,000
Talent $3,000 Casting $1,200 Sound record
$429
Safety & permits
$800
Total: $15,247
Margin @ 15%
$2,287
Nett (Ex GST) Total:
$17,534
Editing to insert or combine new scene with existing background vision. (Allow $1500-
$2,000)

101 | P a g e
Summary of Estimated Cost to Edit to Suitable WA Format (Police Presence)
Approximately $20,000
Summary of Estimated Cost to Edit to Suitable WA Format (Anxious and Uncertain)
Approximately $12,000
Summary of Estimated Cost to Edit Series to Suitable WA Format (Series)
Approximately $32,000
Estimated Cost to Produce Similar Series in WA
Approximately $350,000-$400,000
Saving to WA Government if interstate jurisdiction creative adapted series for local use:
$328,000-$378,000
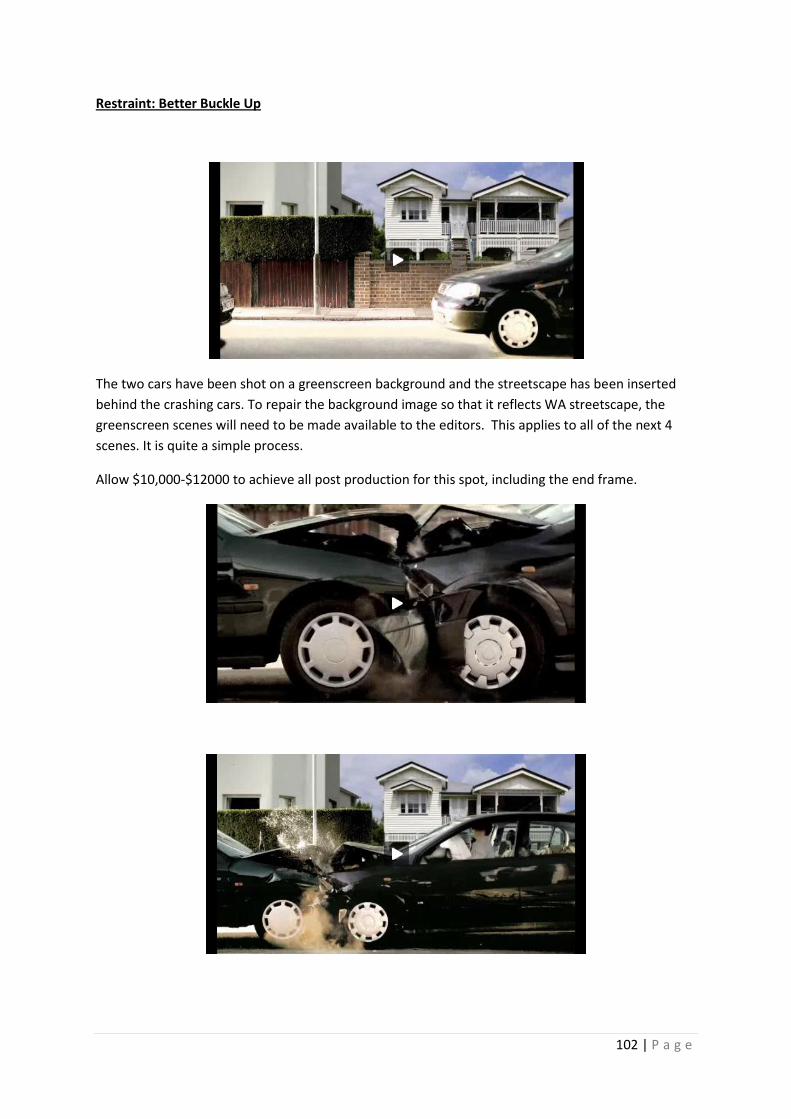
102 | P a g e
Restraint: Better Buckle Up
The two cars have been shot on a greenscreen background and the streetscape has been inserted
behind the crashing cars. To repair the background image so that it reflects WA streetscape, the
greenscreen scenes will need to be made available to the editors. This applies to all of the next 4
scenes. It is quite a simple process.
Allow $10,000-$12000 to achieve all post production for this spot, including the end frame.

103 | P a g e
The end frame needs to be repaired with appropriate logos.
Summary of Estimated Cost to Edit to Suitable WA Format
Approximately $12,000
Estimated Cost to Produce Similar Spot in WA
Approximately $300,000-$350,000
Saving to WA Government if interstate jurisdiction creative adapted for local use:
$288,000-$338,000

104 | P a g e
Distraction/Fatigue: Multiple Executions
a) Kids: no repairs required
b) Mobile phone
Remove red phone box in bottom right corner – frame by frame painting out (allow $500-$1,000)
Pedestrian crossing markings may not comply with WA regulations. Frame by frame painting out
would be the only way to repair this – (allow between $5,000 and $10,000 depending on the extent
of paint-out work).
Music: repairs to number plates if deemed necessary.
2D with tracking or blurring (allow $3,000 - $5,000).
105 | P a g e
c) Driver fatigue (60/30/15sec)
Clean super-less end shot so WA ORS can add relevant message and logo.
(Allow $1,000-$1,500 to add 3 new end scenes with revised supers).
Summary of Estimated Cost to Edit to Suitable WA Format
Approximately $6,000
Summary of Estimated Cost to Edit Series to Suitable WA Format
Approximately $22,000
Estimated Cost to Produce Similar Series in WA
Approximately $300,000-$350,000
Saving to WA Government if interstate jurisdiction creative adapted for local use:
Approximately $278,000- $328,000
106 | P a g e
TASMANIAN CAMPAIGNS
Speeding: Speak up
End tag required – simple edit (allow $500-$1,000).
Cost of Production $150,000-$200,000
Drink Driving: How to be a real mate
End tag required – simple edit (allow $500-$1,000).
Summary of Estimated Cost to Edit to Suitable WA Format
Approximately $1,000
Estimated Cost to Produce Similar Spot in WA
Approximately $175,000-$200,000
Saving to WA Government if interstate jurisdiction creative adapted for local use:
$174,000-$199,000

107 | P a g e
Appendix 2- Current Interstate Reviewed TVCs

108 | P a g e
CORE ISSUE CAMPAIGN TITLE GENERIC Cat 1 ADAPTABLE Cat 2 HEAVY STATE BIAS Cat 3 LINK
NSW
SPEED Don't Rush http://roadsafety.transport.nsw.gov.au/campaigns/dont_rush/index.html
DRINK DRIVING Plan B http://roadsafety.transport.nsw.gov.au/campaigns/planb.html
RESTRAINT Clip Every Trip http://roadsafety.transport.nsw.gov.au/campaigns/clipeverytrip.html
DISTRACTION/FATIGUE Not Drunk, Not Speeding, Just
Tired (Don't Trust Your Tired
Self)
http://roadsafety.transport.nsw.gov.au/campaigns/donttrustyourtiredself.html
Get Your Hand Off It http://roadsafety.transport.nsw.gov.au/campaigns/getyourhandoffit.html
VICTORIA
SPEED Wipe Off 5 http://www.tac.vic.gov.au/road-safety/tac-campaigns/tac-latest-campaigns#wipe-off-5
Pictures of You (3 mins) http://www.tac.vic.gov.au/road-safety/tac-campaigns/tac-latest-campaigns#pictures-of-you
DRINK/DRUG DRIVING The Party's Over http://www.tac.vic.gov.au/road-safety/tac-campaigns/tac-latest-campaigns#thepartysover
Another Bloody Idiot http://www.tac.vic.gov.au/road-safety/tac-campaigns/tac-latest-campaigns#another-bloody-idiot-tv-ad
SAFER VEHICLES How Safe is Your Car? http://www.tac.vic.gov.au/road-safety/tac-campaigns/tac-latest-campaigns#james
DISTRACTION/FATIGUE Blind http://www.tac.vic.gov.au/road-safety/tac-campaigns/tac-latest-campaigns
Safer P Plater - Distraction http://www.tac.vic.gov.au/road-safety/tac-campaigns/tac-latest-campaigns#parental-campaign
SOUTH AUSTRALIA
SPEED Creepers http://www.youtube.com/watch?v=iiOh9LNpIok&list=PL9DC8B550A6C3CA36
DRINK/DRUG DRIVING Just a Bit Worried http://www.youtube.com/watch?v=aHdDxJ4HgSs
http://www.youtube.com/watch?v=KzkiO-rrleM
DISTRACTION/FATIGUE http://www.youtube.com/playlist?list=PLB4B4F1DF20A55A40
QUEENSLAND
SPEED Better Slow Down - Nightmare http://www.youtube.com/results?search_sort=video_date_uploaded&search_query=nightmare+road+safety+ad+qld
DRINK/DRUG DRIVING Think before you Drink - Think
Twice Before You Drive:
Reflections - Police Presence
http://www.tmr.qld.gov.au/Safety/Safety-campaigns/Anti-drink-driving-campaigns.aspx#recent
Think before you Drink - Think
Twice Before You Drive -
Reflections: Anxious and
Uncertain
RESTRAINT Better Buckle Up http://www.tmr.qld.gov.au/Safety/Safety-campaigns/Seatbelts.aspx
DISTRACTION/FATIGUE Distraction - Kids http://www.tmr.qld.gov.au/Safety/Safety-campaigns/Driver-distraction-campaigns.aspx#tv
Distraction - Handheld Mobile
Phones
http://www.tmr.qld.gov.au/Safety/Safety-campaigns/Driver-distraction-campaigns.aspx#tv
Distraction - Music http://www.tmr.qld.gov.au/Safety/Safety-campaigns/Driver-distraction-campaigns.aspx#tv
Distraction - Texting http://www.tmr.qld.gov.au/Safety/Safety-campaigns/Driver-distraction-campaigns.aspx#tv
Fatigue http://www.tmr.qld.gov.au/Safety/Safety-campaigns/Driving-tired-campaigns.aspx#current
TASMANIA
SPEED Speak up Against Speeding http://www.rsac.tas.gov.au/campaigns/speak-up-against-speedin/
DRINK/DRUG DRIVING Don't Risk It http://www.rsac.tas.gov.au/campaigns/why-you-shouldnt-risk-it/
How To Be a Real Mate http://www.rsac.tas.gov.au/campaigns/how-to-be-a-real-mat/
CURRENT STATE ROAD SAFETY CAMPAIGNS and THEIR VIABLITY FOR ADAPTATION TO WA OFFICE OF ROAD SAFETY

109 | P a g e
Appendix 3 – Media Expenditure by Jurisdiction
2009-2013

110 | P a g e
JURISDICTION Share TOTAL MET TV REG TV MET PRESS REG PRESS MAGS MET RADIO ONLINE CINEMA OUTDOOR
NSW RMS/Transport for NSW Total $6,478 $1,999 $1,120 $0 $71 $7 $229 $95 $296 $2,661
Share 100% 31% 17% 0% 1% 0% 4% 1% 5% 41%
VIC TAC Total $10,985 $3,420 $636 $377 $222 $25 $966 $2,495 $309 $2,535
Share 100% 31% 6% 3% 2% 0% 9% 23% 3% 23%
Qld Transport and Main Roads Total $1,182 $710 $398 $0 $37 $0 $0 $0 $0 $37
Share 100% 60% 34% 0% 3% 0% 0% 0% 0% 3%
SA Motor Accident Commission Total $3,140 $2,268 $0 $57 $0 $0 $273 $2 $173 $367
Share 100% 72% 0% 2% 0% 0% 9% 0% 6% 12%
WA Office of Road Safety Total $2,018 $812 $375 $54 $0 $0 $130 $67 $187 $393
Share 100% 40% 19% 3% 0% 0% 6% 3% 9% 19%
Total Total $23,803 $9,209 $2,529 $488 $330 $32 $1,598 $2,659 $965 $5,993
Share 100% 39% 11% 2% 1% 0% 7% 11% 4% 25%
JURISDICTION Share TOTAL MET TV REG TV MET PRESS REG PRESS MAGS MET RADIO ONLINE CINEMA OUTDOOR
NSW RMS/Transport for NSW Total $7,901 $1,865 $1,151 $135 $35 $26 $628 $267 $377 $3,417
Share 100% 24% 15% 2% 0% 0% 8% 3% 5% 43%
VIC TAC Total $11,699 $3,640 $578 $224 $391 $214 $852 $3,069 $160 $2,571
Share 100% 31% 5% 2% 3% 2% 7% 26% 1% 22%
Qld Transport and Main Roads Total $2,246 $700 $385 $37 $119 $0 $40 $31 $0 $934
Share 100% 31% 17% 2% 5% 0% 2% 1% 0% 42%
SA Motor Accident Commission Total $3,805 $2,226 $0 $93 $0 $0 $809 $41 $267 $369
Share 100% 59% 0% 2% 0% 0% 21% 1% 7% 10%
WA Office of Road Safety Total $2,664 $1,211 $437 $191 $0 $0 $234 $20 $84 $487
Share 100% 45% 16% 7% 0% 0% 9% 1% 3% 18%
Total Total $28,315 $9,642 $2,551 $680 $545 $240 $2,563 $3,428 $888 $7,778
Share 100% 34% 9% 2% 2% 1% 9% 12% 3% 27%
JURISDICTION Share TOTAL MET TV REG TV MET PRESS REG PRESS MAGS MET RADIO ONLINE CINEMA OUTDOOR
NSW RMS/Transport for NSW Total $9,595 $2,438 $1,467 $291 $199 $66 $646 $578 $72 $3,838
Share 100% 25% 15% 3% 2% 1% 7% 6% 1% 40%
VIC TAC Total $10,573 $3,131 $443 $212 $128 $27 $405 $3,628 $451 $2,148
Share 100% 30% 4% 2% 1% 0% 4% 34% 4% 20%
Qld Transport and Main Roads Total $2,858 $1,326 $711 $39 $450 $0 $49 $9 $0 $274
Share 100% 46% 25% 1% 16% 0% 2% 0% 0% 10%
SA Motor Accident Commission Total $3,719 $2,084 $0 $151 $0 $9 $820 $4 $135 $516
Share 100% 56% 0% 4% 0% 0% 22% 0% 4% 14%
WA Office of Road Safety Total $2,090 $1,038 $210 $121 $0 $7 $342 $29 $157 $186
Share 100% 50% 10% 6% 0% 0% 16% 1% 8% 9%
Total Total $28,835 $10,017 $2,831 $814 $777 $109 $2,262 $4,248 $815 $6,962
Share 100% 35% 10% 3% 3% 0% 8% 15% 3% 24%
Road Safety Media Expenditure 2013. Source AC Nielsen Adex Data
Road Safety Media Expenditure 2012. Source AC Nielsen Adex Data
Road Safety Media Expenditure 2011. Source AC Nielsen Adex Data

111 | P a g e
JURISDICTION Share TOTAL MET TV REG TV MET PRESS REG PRESS MAGS MET RADIO ONLINE CINEMA OUTDOOR
NSW RMS/Transport for NSW Total $10,521 $1,877 $643 $627 $303 $84 $659 $528 $113 $5,687
Share 100% 18% 6% 6% 3% 1% 6% 5% 1% 54%
VIC TAC Total $13,364 $3,537 $426 $933 $52 $24 $588 $5,031 $596 $2,177
Share 100% 26% 3% 7% 0% 0% 4% 38% 4% 16%
Qld Transport and Main Roads Total $3,170 $945 $486 $93 $487 $12 $8 $5 $0 $1,134
Share 100% 30% 15% 3% 15% 0% 0% 0% 0% 36%
SA Motor Accident Commission Total $1,258 $828 $0 $60 $0 $5 $248 $36 $13 $68
Share 100% 66% 0% 5% 0% 0% 20% 3% 1% 5%
WA Office of Road Safety Total $2,365 $1,000 $118 $264 $0 $63 $458 $106 $150 $206
Share 100% 42% 5% 11% 0% 3% 19% 4% 6% 9%
Total Total $30,678 $8,187 $1,673 $1,977 $842 $188 $1,961 $5,706 $872 $9,272
Share 100% 27% 5% 6% 3% 1% 6% 19% 3% 30%
JURISDICTION Share TOTAL MET TV REG TV MET PRESS REG PRESS MAGS MET RADIO ONLINE CINEMA OUTDOOR
NSW RMS/Transport for NSW Total $5,547 $2,177 $632 $333 $166 $48 $437 $93 $320 $1,341
Share 100% 39% 11% 6% 3% 1% 8% 2% 6% 24%
VIC TAC Total $9,809 $2,810 $396 $1,639 $87 $81 $1,132 $950 $704 $2,010
Share 100% 29% 4% 17% 1% 1% 12% 10% 7% 20%
Qld Transport and Main Roads Total $3,451 $1,197 $479 $49 $238 $13 $204 $4 $0 $1,267
Share 100% 35% 14% 1% 7% 0% 6% 0% 0% 37%
SA Motor Accident Commission Total $31 $0 $0 $0 $0 $0 $0 $31 $0 $0
Share 100% 0% 0% 0% 0% 0% 0% 100% 0% 0%
WA Office of Road Safety Total $779 $198 $23 $218 $0 $22 $210 $3 $46 $59
Share 100% 25% 3% 28% 0% 3% 27% 0% 6% 8%
Total Total $19,617 $6,382 $1,530 $2,239 $491 $164 $1,983 $1,081 $1,070 $4,677
Share 100% 33% 8% 11% 3% 1% 10% 6% 5% 24%
Road Safety Media Expenditure 2010. Source AC Nielsen Adex Data
Road Safety Media Expenditure 2009. Source AC Nielsen Adex Data

112 | P a g e
Jurisdiction Spend '000s Spend per 100k pop Index to WA
NSW RMS/Transport for NSW $7,901 $95.47 87.20
VIC TAC $11,699 $200.76 183.38
Qld Transport and Main Roads $2,246 $46.29 42.28
SA Motor Accident Commission $3,805 $265.34 242.37
WA ORS $2,665 $109.52 100.00
TOTAL $28,316 $124.07 113.32
TOTAL EX TAC $16,617 $97.77 118
Jurisdiction Spend '000s Spend per 100k pop Index to WA
NSW RMS/Transport for NSW $9,595 $115.93 134.98
VIC TAC $10,573 $181.43 211.24
Qld Transport and Main Roads $2,858 $58.90 68.58
SA Motor Accident Commission $3,719 $259.34 301.96
WA ORS $2,090 $85.89 100.00
TOTAL $28,835 $126.34 147.10
TOTAL EX TAC $18,262 $107.45 125.10
Jurisdiction Spend '000s Spend per 100k pop Index to WA
NSW RMS/Transport for NSW $10,521 $127.12 130.80
VIC TAC $13,364 $229.33 235.96
Qld Transport and Main Roads $3,170 $65.33 67.22
SA Motor Accident Commission $1,258 $87.73 90.26
WA ORS $2,365 $97.19 100.00
TOTAL $30,678 $134.41 138.30
TOTAL EX TAC $17,314 $101.87 104.82
Jurisdiction Spend '000s Spend per 100k pop Index to WA
NSW RMS/Transport for NSW $5,547 $67.02 209.36
VIC TAC $9,809 $168.32 525.80
Qld Transport and Main Roads $3,451 $71.12 222.16
SA Motor Accident Commission $31 $2.16 6.75
WA ORS $779 $32.01 100.00
TOTAL $19,617 $85.95 268.49
TOTAL EX TAC $9,808 $57.71 180.26
Jurisdiction Spend '000s Spend per 100k pop Index to WA
NSW RMS/Transport for NSW $8,391 $101.39 124.94
VIC TAC $11,361 $194.96 240.24
Qld Transport and Main Roads $2,931 $60.41 74.44
SA Motor Accident Commission $2,203 $153.64 189.33
WA ORS $1,975 $81.15 100.00
TOTAL $26,862 $117.69 145.03
TOTAL EX TAC $15,500 $91.20 112.38
2012 State Media Spend Index to WA per 100k Population
2011 State Media Spend Index to WA per 100k Population
2010 State Media Spend Index to WA per 100k Population
2009 State Media Spend Index to WA per 100k Population
2009 - 2012 Average Media Spend Index to WA per 100k Population

113 | P a g e
Appendix 4 – 2012/2013 Media Rationale Example

114 | P a g e
Media Rationale PRODUCT: Office of Road Safety: Regional Restraints TIMING: 2012/13 Campaign Strategy OBJECTIVE: Drivers not wearing a seatbelt remain a problem in Regional WA. This campaign activity is designed to highlight the problems and consequences of driver fatality due to not wearing a restraint. TARGET AUDIENCE: All people 17 – 59 in WA – both metro and regional. Where possible channel activity skewed to Males 17-39 MEDIA RATIONALE: Campaign activity is typically scheduled in the final quarter of the year post Easter; however a burst of activity was also scheduled in January to coincide with the peak travel periods across regional and remote destination in the state – not just by locals but by metropolitan people travelling into the regions. The channel selection included Regional Television, Regional Radio, Out of Home and Digital. TELEVISION This campaign used 30 second TV spots scheduled across the regional stations (GWN, WIN, 10West) and the regional split of the SBS signal. By using a combination station mix it enabled the reach to be maximised with the target audience and through the nature of TV, reach the broader community as a whole. A minimum of 70% of spots were scheduled in prime time. Given the skew of targeting to male audiences, AFL was engaged a property conduit. Both a package on GWN and a specially designed product “Off The Boot” on WIN TV was scheduled that included TV programming, and on ground materials. The TV weights were reasonably heavy – maximised to 200 per week and culminating in 2320 tarps for the campaign period. OFF THE BOOT SPONSORSHIP - WINTV Off The Boot is a half hour program designed to bring together Western Australian Football and was perfectly scheduled to follow in the success of The Footy Show on Thursday nights as well as the floating reply on Saturday afternoons on WINTV. As a local program Off The Boot highlighted football regional WA state-wide, encompassing country football from the Great Southern to Broome, the South West, Mid West and the Goldfields. Local Hosts Mark Readings, Tyson Beattie and football legend Karl Langdon presented Off The Boot consisting of 24 half hour programs beginning in April 2013, concluding with a finals spectacular. Football News of the Week featured in Off The Boot highlighting the best and the worst of weekend’s round of matches, great goals, amazing achievements, Umpires, Coaches, behind the scenes, the controversial and the news and information locals love. As naming right sponsor ORS received: Sponsorship of the programme for the season (opening and closing billboards) Signage presence on the presenter’s panel Live liners and ad libs within the broadcast by the presenters Football club segment of the week sponsorship No charge commercial airtime across the WIN TV network – value of $200K Association on all promotion material on TV, Radio and local press Other entitlements included a dedicated Facebook Page detailing all aspects of the program, offering additional sponsorship branding and of course a place where you could view previous episodes and the competitive Title Winners. This sponsorship allowed ORS to own a football property in regional WA – not only strengthening the TV activity overall but allowing for content development and a deeper engagement with locals in regional towns. RADIO 30 second radio was employed across all AM and FM bands in the regional areas. These spots worked concurrently with the television weeks January, May and June. The buying strategy was to target the main listening periods across the day – BMAD and placed evenly across the week. ONLINE Online was focussed to regional areas across the major publishers. Given the potential audiences for online are lower in these markets the audience base was widened to include all People 18+.

115 | P a g e
The publishers included: Google Display Network – bought on a CPC metric – targeting relevant key words and articles relating to road safety, fatalities and driver safety. Fairfax, Yahoo! And News Limited network publishers – bought on a CPM metric. Sites included Lifestyle, Health and Wellbeing –and general run of site placement for a broader audience reach. Click through rates were planned to industry averages. OUT OF HOME The master out of home contract allocated the sites for May and June to Restraints. Again working in line with other communications for this period and extending reach right across Regional WA. The media plan for Restraints campaign show the channel spend break out by week.
Media Rationale PRODUCT: Office of Road Safety: Speed and Drink Driving TIMING: 2012/13 Campaign Strategy OBJECTIVE: The Office of Road Safety’s Speed and Drink Driving campaigns are designed to highlight the consequences of not adhering to the legislated guidelines for these two driving principles. The Enforcement components of the campaign demonstrates being caught using excessive Speed or Drink Driving results in a zero tolerance policy by police and resulting punishment applied. The Behaviour component of the campaign is education based aimed to promote action at times when driver behaviour is more likely to be unacceptable – such as weekend period when socialising is paramount. TARGET AUDIENCE: All people 17 – 59 in WA – both metro and regional. Where possible channel activity skewed to Males 17-39 MEDIA RATIONALE: These two Enforcement campaigns were intrinsically linked as both demonstrated the consequences of not adhering to the road rules. Drink Driving used the phrase “You Deserve it” to emphasise drinking and driving deserved to be punished; whilst the Speeding message used the application of a “Post it note” to act as a reminder to stay within the limit. The Behaviour campaigns for Speed encouraged people to “slow down and enjoy the ride” whilst Drink Driving emphasised “ok is not ok” – to dispel the commonly thought myth that even after one or two drinks it is still acceptable to get behind the wheel. The media channels for all campaigns needed to be broad and consistent to ensure a wide capture of the target market. But they also needed to be scheduled frequently enough to continually emphasise these consequences and keep the message out take top of mind right throughout the year. The channel selection included Television, Radio, Out of Home, and for Drink Driving – selected print titles. ENFORCEMENT TELEVISION The TV campaign was tactically used for both Enforcement messages. All metro and regional stations were used and both campaigns were 30 seconds in length. A similar buying strategy for both markets was implemented. In any given week the tarps levels would be a minimum 70 – increasing to 100 tarps at periods on the calendar when relevant – i.e., Speeding for holiday travel times (Christmas / January) and Drink Driving over Easter periods. The buying strategy aimed to maximise the 1+ reach so that as many people as possible were exposed to the message. Due to the consistency of the scheduling a low frequency per week was not seen as an issue. The cumulative effect for tarps across both products was massive – over 2600 tarps for the year. Enforcement for each campaign topic was scheduled across alternating weeks – so that there was a week’s presence of Speed messaging followed by a week of Drink Driving. This culminated in 30 consecutive weeks of TV. However each message was flighted on various days in line with consumer actions. Enforcement activity was scheduled Tuesday to Friday. The messaging was scheduled in the lead up to the weekend when the target market is more receptive to message understanding and outtake. It was hoped by the time the weekend rolled around this message had been significantly reinforced to encourage better driver’ behaviour. In addition to general programming spot buying, Drink Driving campaigns also targeted two major sporting properties for the year: An AFL package on Channel Seven was run on games played Friday to Monday. Activity commenced in March and ran through to September. This allowed for the messaging to run into the new financial year to maintain a

116 | P a g e
longer Drink Driving message presence. Given the presence of beer sponsors in footy and the fact men like to drink beer whilst watching footy, this environment is contextually relevant. On Channel Nine and WINTV, a Cricket package was scheduled in the summer (November to February) for Enforcement. Given cricket matches are played across the week this property was sought more for the timing (summer/ Christmas/New Year) when people need to plan their journey. Cricket tends to be the watched sport for Aussies over summer and association via package entitled ORS to support and priority placement. BEHAVIOUR TELEVISION The Enjoy the Ride TVC message used a 60 and 30 second cut down version of the previous years’ 180 second campaign message. Given the expense incurred for scheduling longer length ads and the wear out factor in repeating them too often, the 60’s ran to a lower weight and the 30’s supported throughout. Timing for the Behaviour TV was in line with the seasonal timing for this message: Speeding was scheduled December and January with an increase in weight around Christmas and holiday period, again at Easter and a final burst in May around school holidays. Drink Driving was scheduled in alternative bursts November/December; end of Jan/Feb and post Easter (Anzac Day) and into May. Behaviour activity was scheduled Saturday to Monday. This is at a time when people are more perceptible to bad driving practices (behaviour) and in line with social behaviour, such as being out more, and thus more likely to drink, or speed getting to and from social occasions. Thus at the weekend the importance of highlighting the behaviour message was critical. Again all commercial stations in the metro and regional areas were engaged, and a relatively high tarp weight was employed over the three days of scheduling to maximise reach and frequency delivery. Cume tarp delivery exceeded 2100 tarps. SUPPORT CHANNELS SPEED BEHAVIOUR Radio 30 second radio was flighted in the same weeks of Behaviour TV. Male skew channels were selected and targeted a similar flighting pattern to TV – Saturday/Sunday/Monday scheduling. In the metro markets 96, 92.9, NOVA and 6PR were targeted with 46 spots aired per week. In regional areas all AM and FM bands were targeted state-wide using 10x30 sec per week. Cinema Given the captive audience environment cinema provides the 3 minute, Enjoy the Ride ad was utilised. The flighting pattern mirrored the week on TV and a strategy of targeting male genre film titles was implemented. Cinemas across the state were targeted. The target market visits the cinema on average once per month so the flighting pattern was considered light and minimised over use of the message in this larger environment. Over the summer month the outdoor cinema was scheduled at Burswood. This package included billboards as sponsors of the season. A large support schedule was secured to run alongside paid activity in the cinema complexes in 2013. Out of Home The January 7th to February 3rd period was allocated to Speed Behaviour. All posters in the contractual agreement were posted with the Enjoy the Ride message. DRINK DRIVING BEHAVIOUR Radio 15 second live read radio was flighted in the launch weeks of the Drink Driving Behaviour TV burst (November /December 2012) for this burst all commercial stations were used but the strategy of live read made for a more targeted approach. Activity ran Friday to Monday, in specific station sessions that resonated with eh Male skew audiences. Live reads created a sense of urgency and authenticity with the message. A second wave in April 2013 used recorded spots – again scheduled in line with the TV for a consistent approach. Spots ran Saturday to Monday across the core listening sessions of Breakfast, morning, afternoon & drive. Print Drum magazine and Xpress magazines were used to reach males in the music / venue setting. Junior page colour ads were run with a light weight to emphasise the Not OK message. Outdoor In 2012 the outdoor contract ran July to November and formed the basis for the Outdoor billboards contract. The sites were reinstalled in April in line with TV and Radio. Selected lifts in Perth CBD were also targeted in the lead up to Christmas.

117 | P a g e
SPEED ENFORCEMENT Radio In the metropolitan markets the campaign activity used was Traffic updates to promote the Speed Enforcement message. These 10 seconds messages run across all commercial stations providing a high reach for each on air week. Radio spots were scheduled in line with the TV – week on week off for a 30 week period. In the regional areas 15 second spots were schedule across BMAD sessions. Out of Home The outdoor contract took February and March 2013 periods to promote the Enforcement message. DRINK DRIVING ENFORCEMENT Radio 15 second radio was flighted in line with the on air TV weeks scheduled and used a similar Tuesday to Friday pattern. The sessions targeted included Breakfast, Morning Afternoon & Drive across 92.9, 96fm, NOVA and 6PR in line with the Male targeting listenership. Out of Home The outdoor contract ran in isolation for August – October 2012, December 2012 periods to promote the Enforcement message. It was supported by washroom advertising in venues across the state to reach male audiences. The media plans for all campaigns show the channel spend break out by week.

118 | P a g e
Appendix 5 – Post Analysis Example

119 | P a g e