review of operating results and financial …of+operating+results+and...review of operating results...
TRANSCRIPT

AFRICAN EXPORT-IMPORT BANK
BANQUE AFRICAINE D’IMPORT-EXPORT
(AFREXIMBANK)
REVIEW OF OPERATING RESULTS AND
FINANCIAL STATEMENTS FOR THE YEAR ENDED 31 DECEMBER 2016
Afreximbank March 2017
CHAPTER 5
MANAGEMENT’S DISCUSSION AND ANALYSIS OF THE FINANCIAL YEAR ENDED 31 DECEMBER, 2016
.
5.1 INTRODUCTION
The financial statements of the Bank include the Statement of Comprehensive Income, Statement of Financial Position, Statement of Changes in Shareholders’ Equity, Statement of Cash Flows and the accompanying notes. The following discussion should be read in conjunction with the Bank’s audited financial statements for the year ended 31 December 2016, paying particular attention to the factors that influenced the observed results.
5.2 STATEMENT OF COMPREHENSIVE INCOME
The results of the Bank’s operations were generally driven by two main factors:
(i) First was the Countercyclical Trade Liquidity Facility (COTRALF) approved by the Board of Directors in December 2015 and which was actively implemented in 2016. COTRALF is a 2-year emergency intervention instrument introduced by the Bank to enable its member countries to achieve an orderly adjustment to the commodity price and terrorism induced shocks that increased in intensity in Africa from later 2015. The direct goal of the Bank’s intervention was to enable beneficiaries avert potential trade debt payment defaults that would have been triggered by sharp declines in commodity prices. During the year the Bank disbursed an amount of US$ 6.45 billion (2015:US$ 1.2 billion) on a revolving basis with US$ 2.65 billion (2015 : nil ) repaid loans and a balance of US$ 5 billion (2015:US$ 1.2 billion) at year end. The facilities received very strong support from the Governments and Central Banks of beneficiary countries. The COTRALF facilities outstanding were 69% cash-backed in U.S. Dollars and 88% cash-backed in U.S. Dollars and other currencies and Treasury bills. Accordingly, they attracted commensurate (relatively low) margins. The effect was a shift in compression in margins as a trade-off for the very low risks the exposures represented.
(ii) The second factor was the challenging environment that prevailed across Africa and the financial markets which
CHAPTER 5/FIN/BOD/MB
Afreximbank March 2017
2
negatively impacted Other Comprehensive Income of the Bank (OCI) by way of sharp drop in property valuation as well as rising interest rates which impacted hedge valuations.
It is in the context of the foregoing that the Bank achieved a 32% increase in Net Income, from an amount of US$125.32 million in 2015 to US$165 million in 2016. The strong growth in Net Income was driven by a solid growth of 37% in net interest income, from US$ 198.78 million in 2015 to US$ 273.25 million in 2016. Interest earnings rose due to a strong growth of 67% in the loan book on the back of COTRALF. Although Net Fee and Commission Incomes were up slightly by 2% compared to 2015, the impressive growth in interest earnings and contained rise in operating expenses ensured the attainment of the Net Income reported.
Although Return on Average Asset (ROAA) and Return on Average Equity (ROAE) were slightly lower at respective levels of 11.41% (2015: 11.42%) and 1.75% (2015: 2.1%) in 2016, these figures were in line with budget and selected management preference for creating low risk assets under the difficult environment that prevailed. Most COTRALF facilities, which accounted for 49% of the loan portfolio, fell into this category. With regard to Other Comprehensive Income (OCI) which captures gains or losses not directly related to the Bank’s core operations, the outcome was a 16% decline from US$ 134.21 million in 2015 to US$ 113.3 million in 2016. The main reasons for this were:
(i) a revaluation loss amounting to US$ 18.65 million on the
Headquarters building in Cairo as a result of a marked depreciation of the Egyptian Pound (EGP) by 132% during the year. Notwithstanding, efforts are being made by Management to avoid this kind of exchange rate-induced volatility on the balance sheet of the Bank; and
(ii) a fair value loss amounting to US$ 33.09 million on the receive-fixed-pay-floating interest rate swaps upon valuation at year end. This was caused by an increase in market interest rates in 2016 compared to 2015. The swaps were entered into to convert fixed rate interest payments charged on bonds issued by the Bank into floating rate payments to avoid interest rate mis-match on the balance sheet.Most of the Banks’ loans were priced on floating rate basis. Although this was an unrealized loss in 2016, Management has taken steps to manage the potential impact in the coming year.
5.2.1 Net Interest Income and Margin
During the period under review the Bank achieved a 30% growth in interest and similar income, to close the period at US$ 484 million (2015:
CHAPTER 5/FIN/BOD/MB
Afreximbank March 2017
3
US$ 372 million) mainly as a result of growth in loans and advances balances which increased by US$4 billion from US$ 6.1 billion as at end of December 2015 to US$10.1 billion as at end of December 2016 mainly driven by growth in facilities under COTRALF which constituted 49% of the loan portfolio as at 31 December 2016, up from US$1.2 billion. Interest and similar expenses increased by 22% to US$ 211 million (2015: US$ 173 million). This increase was as a result of a 39% increase in interest bearing liabilites in 2016 to reach a level of US$ 6.141 billion (2015: US$ 4.413 billion). The increase enabled the Bank to fund the loan asset growth. Net interest margin declined to 2.7% in 2016 from 3.6% in 2015 mainly due to relatively lower margins earned on the cash-backed COTRALF in 2016. The Bank’s cost of funds also reduced due to improvements in the Bank’s efficiency in managing its treasury activities mainly through diversification of liabilites, especially harnessing deposits from African Central Banks. Although the net interest margin declined slightly, observed performance was in line with planned strategic targets. It also reflected a careful implementation of the Bank’s COTRALF which meant that interventions were backed by high quality collaterals.
5.2.2 Non-Interest Income
Net Fee and Commission Income increased by 2% to close the period ending 31 December 2016 at US$ 30.435 million (2015: US$ 29.802 million). The increase in fee and commission income in 2016 was mainly due to an increase in guarantee fees by 40% and commision from letters of credit confirmation by 197% reflecting good progress in the strategy of the Bank in the use of guarantees for capital management and leveraging purposes. Advisory fees income decreased by 2% due to lower value of advisory transactions concluded in 2016 compared to 2015. Fee and commission expenses increased by about 25% to US$ 5.86 million (2015: US$ 4.69 million) driven by growth in borrowing costs.
5.2.3 Operating Income
Operating income, which is the sum of Net Interest Income, Net Fees and Commissions Income and Other Operating Income increased by 32% in 2016 to US$ 305 million (2015: US$ 231 million). The increase is explained mainly by higher net interest income arising from growth in volume of loan assets.
5.2.4 Operating Expenses
Operating expenses increased by about 15% in 2016 during the year to reach US$ 55.79 million (2015: US$ 48.42 million). The growth was

CHAPTER 5/FIN/BOD/MB
Afreximbank March 2017
4
mainly driven by: (i) increase in staff costs by 22% mainly due to a 14% increase in staff numbers compared to 2015 coupled with related one-off recruitment expenses such as relocation costs; and (ii) an increase of 8% in general and administration costs due to increase in travel and meetings costs by 51% in 2016 on the back of the expenditure incurred in organizing the retreat for preparation of the Bank’s Fifth Strategic plan for years 2017 to 2021, the first Intra African Trade Seminar organized by the Bank in 2016, among others. 5.2.5 Cost Income Ratio
Figure 5.1 below, shows that the cost-income ratio recorded by the Bank decreased to 18.27%, from a level of 21% achieved in 2015. The improvement arose from higher operating income explained above and reflected effective cost controls and higher operating efficiency by the Bank during the year compared to industry average.
Fig 5.1 Afreximbank: Cost to income ratio: 2012-2016
5.2.6 Allowance For Impairment On Loans And Advances Allowance for impairment on Loans and Advances increased by 30% from US$ 63.4 million in 2015 to US$ 82.7 million in 2016 mainly as a result of higher loan impairment charges in 2016 compared to 2015. Impairment charges rose mainly due to a higher loan book and the impact of the operating environment that prevailed during 2016. The provision coverage ratio as at 31 December 2016 was at 133% (2015: 137%) which was well above 100% minimum threshold target. The
0
0.05
0.1
0.15
0.2
0.25
0.3
Percentage
Cost-Income Ratio Trend
2012 2013 2014 2015 2016
CHAPTER 5/FIN/BOD/MB
Afreximbank March 2017
5
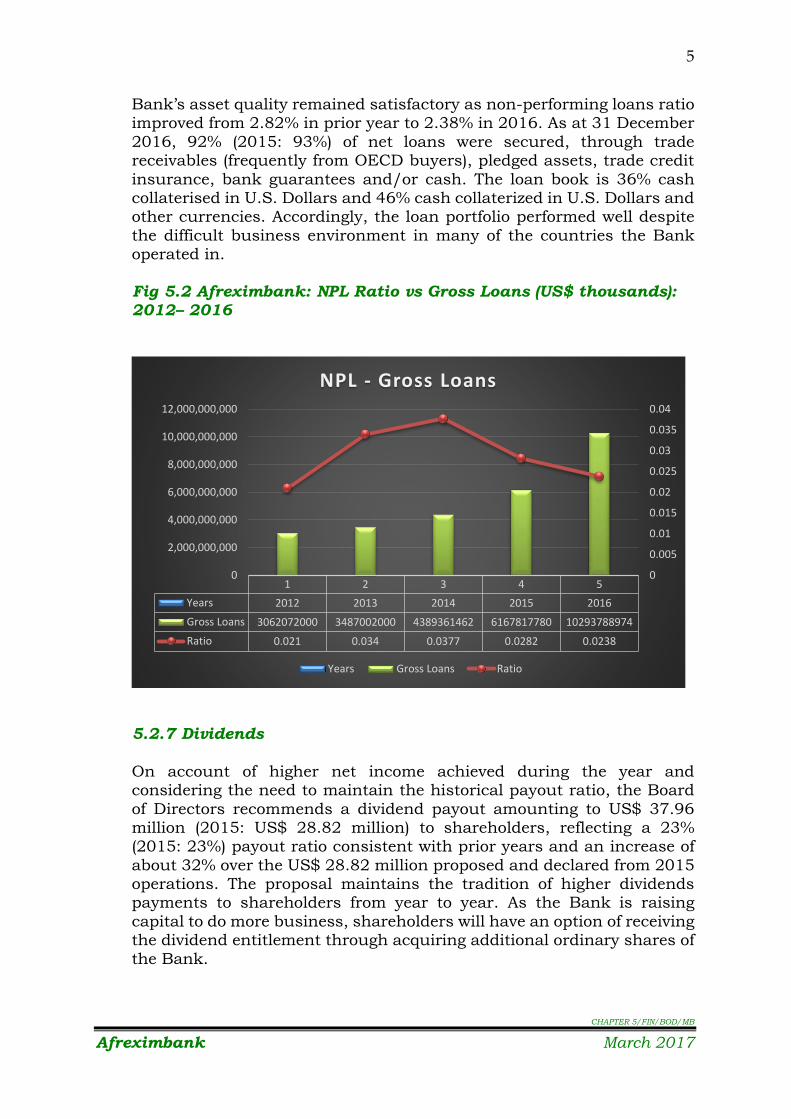
Bank’s asset quality remained satisfactory as non-performing loans ratio improved from 2.82% in prior year to 2.38% in 2016. As at 31 December 2016, 92% (2015: 93%) of net loans were secured, through trade receivables (frequently from OECD buyers), pledged assets, trade credit insurance, bank guarantees and/or cash. The loan book is 36% cash collaterised in U.S. Dollars and 46% cash collaterized in U.S. Dollars and other currencies. Accordingly, the loan portfolio performed well despite the difficult business environment in many of the countries the Bank operated in. Fig 5.2 Afreximbank: NPL Ratio vs Gross Loans (US$ thousands): 2012– 2016
5.2.7 Dividends
On account of higher net income achieved during the year and considering the need to maintain the historical payout ratio, the Board of Directors recommends a dividend payout amounting to US$ 37.96 million (2015: US$ 28.82 million) to shareholders, reflecting a 23% (2015: 23%) payout ratio consistent with prior years and an increase of about 32% over the US$ 28.82 million proposed and declared from 2015 operations. The proposal maintains the tradition of higher dividends payments to shareholders from year to year. As the Bank is raising capital to do more business, shareholders will have an option of receiving the dividend entitlement through acquiring additional ordinary shares of the Bank.
1 2 3 4 5Years 2012 2013 2014 2015 2016Gross Loans 3062072000 3487002000 4389361462 6167817780 10293788974Ratio 0.021 0.034 0.0377 0.0282 0.0238
0
0.005
0.01
0.015
0.02
0.025
0.03
0.035
0.04
0
2,000,000,000
4,000,000,000
6,000,000,000
8,000,000,000
10,000,000,000
12,000,000,000
NPL - Gross Loans
Years Gross Loans Ratio

CHAPTER 5/FIN/BOD/MB
Afreximbank March 2017
6
The Board, in making its recommendation on the level of ordinary dividends, took into consideration the objective of maintaining a growth trend in dividend payments amongst other considerations. The other factors considered included profit performance, need to retain earnings to support on-going business growth, capital adequacy, inflation, as well as the need to balance internal and external financing.
5.3 STATEMENT OF FINANCIAL POSITION
The statement of financial position of the Bank shows the position of the Bank’s assets and liabilities as well as its Net worth or Shareholders funds at the reporting date. A detailed discussion of these items with respect to 2016 is presented hereunder.
5.3.1 Assets
During the year under review, total assets of the Bank recorded an increase of about 64% to close the year on a solid performance at US$ 11.73 billion (2015: US$7.134 billion). An analysis of the Bank’s assets in 2016 shows that Loans and Advances at US$ 10.15 billion (2015:US$ 6.06 billion) contributed significantly to the total assets position of the bank at 87% (2015: 85%). Cash and deposits with other banks at US$ 1.27 billion (2015: US$ 824.1 million) accounted for about 11% (2015: 12%). The observed distribution was in line with 2016 forecasts and strategic plans as well as historical trends.
Fig 5.3 Afreximbank: Assets (US$ thousands): 2012– 2016
0
2000000
4000000
6000000
8000000
10000000
12000000
20122013
20142015
2016
Assets Trend Analysis
Property and equipment Loans and advances Cash and due from banks
Prepayments and accrued income Other assets

CHAPTER 5/FIN/BOD/MB
Afreximbank March 2017
7
Most of the loans are structured trade finance facilities, either funded directly by the Bank or within syndicates. A large proportion (49%) of the loan book were COTRALF and 36% cash-backed in U.S. Dollars. An analysis of the loan portfolio by beneficiary as at end of 2016 shows that corporates’ share of the portfolio including state owned enterprises was 26% (2015: 43%), financial institutions’ share was 72% (2015: 57%) of the portfolio and government’s share was 2% (2015: nil) of the portfolio. The Bank also provides the financial institutions with credit lines to support their trade finance business with local counterparties who cannot access financing from the Bank directly. The average maturity of loans remained in line with prior year position at 17 months (2015:17 months) as at end of 2016 given that the typical loans extended by the Bank are short term, self-liquidating trade finance facilities. The Bank continued to achieve a wider geographical diversification of the portfolio with the Bank operating in 26 (2015: 26) countries.
Cash accounted for about 11% (2015:12%) of the total assets and are placed mainly with investment grade rated banks. 5.3.2 Liabilities
Total liabilities of the Bank rose by about 72% year-on-year to US$ 10.10 billion (2015: US$ 5.87 billion) as at 31 December 2016. The main reason for the increase in total liabilities was the borrowing balance which rose by US$ 1.73 billion from US$ 4.41 billion in 2015 to US$ 6.14 billion in 2016. The increase in borrowings supported the growth of the loan book. A large proportion (39%) of the liabilities was accounted for by deposits from African Central Banks which rose from US$1.06 billion in prior year to US$3.92 billion as at end of 2016 as the Bank sought to further diversify its sources of funds and better manage funding costs. A break-down of the Bank’s liabilities in 2016 shows that borrowings (due to banks and debt securities) accounted for about 61% (2015: 75%) of total liabilities. Deposits and customer accounts accounted for about 37% (2015: 22%) of total liabilities.

CHAPTER 5/FIN/BOD/MB
Afreximbank March 2017
8
Fig 5.4 Afreximbank: Liabilities (US$ thousands): 2012 – 2016
Total borrowings’ major components were debt securities and syndicated loans. In terms of geographical distribution, the outstanding borrowings were spread across mainland Europe, UK, Asia, Middle East, Africa, North and South America.
A significant proportion of deposit accounts held with Afreximbank were mostly accounts used as structural elements in trade finance transactions. Most deposit accounts were held with Afreximbank until the client’s borrowing or outstanding amounts were fully paid. The deposits may be used to retire the loans. Customers who deposited funds in the Bank were mainly sovereigns, corporates and financial institutions.
5.3.3 Shareholders’ Funds The Bank’s Net worth (Shareholders’ Funds) rose by about 28% to US$ 1.63 billion, from US$ 1.27 billion in 2015 on the back of capital injections amounting to US$ 275.2 million and internal capital generated through higher profitability. Afreximbank is implementing a major equity mobilization plan so as to meet increasing loan demand from borrowers in line with current opportunities in Africa. The equity raise is targeted at existing shareholders and new shareholders, with the increase in capital raised, the Capital Adequacy Ratio ended the year at 23% well above the minimum of 20% set by the Board of Directors. Afreximbank’s callable capital as at 31 December 2016 amounted to US$ 567.7 million (2015: US$ 460.7 million). The Bank maintains the callable capital as an additional buffer in case of need. In late 2016, the Bank successfully
0
1000000
2000000
3000000
4000000
5000000
6000000
7000000
2012 2013 20142015
2016
Liabilities Trend Analysis
Borrowings Deposits & Customer Accounts Other Liabilities

CHAPTER 5/FIN/BOD/MB
Afreximbank March 2017
9
credit enhanced most of its callable capital thereby further improving their quality and effectiveness as a contingent capital.
CONCLUSION
The Bank’s financial results show that the Bank increased its interventions in support of the member countries, especially under the difficult environment that prevailed in 2016. The operations of the Bank were largely driven by the Countercyclical Trade Liquidity Facility (COTRALF) – an emergency intervention programme approved by the Board of Directors in December 2015 to support the Bank’s member countries to maintain trade flows under conditions of external payments difficulties occasioned by a major commodity price shock that prevailed in 2016. The implementation of COTRALF was backed by strong support from Central Banks of member countries which ensured high quality loan asset growth from US$6.06 billion in 2015 to US$10.15 billion in 2016. Margins narrowed somewhat due to quality of collateral that backed most of the loans growth. Other financial metrics were satisfactory and in line with strategic plan targets. The Bank forecasts further improvements on its operational and financial performance in 2017 building on sustainable growth foundation established in past years and by providing innovative solutions to its clients and member states in a challenging economic environment.

AFRICAN EXPORT-IMPORT BANK
BANQUE AFRICAINE D’IMPORT-EXPORT
(AFREXIMBANK)
FINANCIAL STATEMENTS FOR
THE YEAR ENDED 31 DECEMBER 2016


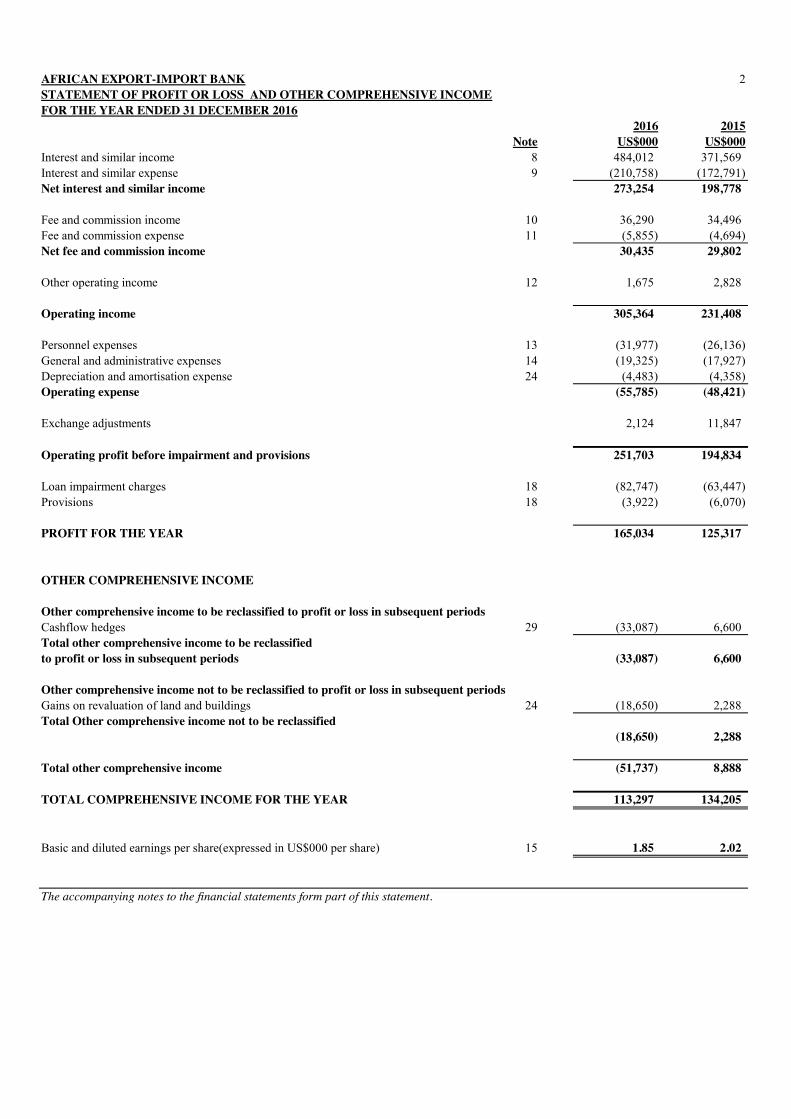
AFRICAN EXPORT-IMPORT BANK 2STATEMENT OF PROFIT OR LOSS AND OTHER COMPREHENSIVE INCOMEFOR THE YEAR ENDED 31 DECEMBER 2016
2016 2015Note US$000 US$000
Interest and similar income 8 484,012 371,569 Interest and similar expense 9 (210,758) (172,791) Net interest and similar income 273,254 198,778
Fee and commission income 10 36,290 34,496 Fee and commission expense 11 (5,855) (4,694) Net fee and commission income 30,435 29,802
Other operating income 12 1,675 2,828
Operating income 305,364 231,408
Personnel expenses 13 (31,977) (26,136) General and administrative expenses 14 (19,325) (17,927) Depreciation and amortisation expense 24 (4,483) (4,358) Operating expense (55,785) (48,421)
Exchange adjustments 2,124 11,847
Operating profit before impairment and provisions 251,703 194,834
Loan impairment charges 18 (82,747) (63,447) Provisions 18 (3,922) (6,070)
PROFIT FOR THE YEAR 165,034 125,317
OTHER COMPREHENSIVE INCOME
Other comprehensive income to be reclassified to profit or loss in subsequent periodsCashflow hedges 29 (33,087) 6,600 Total other comprehensive income to be reclassified to profit or loss in subsequent periods (33,087) 6,600
Other comprehensive income not to be reclassified to profit or loss in subsequent periodsGains on revaluation of land and buildings 24 (18,650) 2,288 Total Other comprehensive income not to be reclassified (18,650) 2,288
Total other comprehensive income (51,737) 8,888
TOTAL COMPREHENSIVE INCOME FOR THE YEAR 113,297 134,205
Basic and diluted earnings per share(expressed in US$000 per share) 15 1.85 2.02
The accompanying notes to the financial statements form part of this statement.

AFRICAN EXPORT-IMPORT BANK 3STATEMENT OF FINANCIAL POSITIONAS AT 31 DECEMBER 2016
2016 2015Note US$000 US$000
ASSETS
Cash and cash equivalents 16 1,269,080 824,092 Loans and advances to customers 17 10,148,202 6,061,316 Hedging derivatives instruments 5 8,792 23,652 Prepayments and accrued income 19 241,414 175,476 Financial investments - held to maturity 21 30,268 - Other assets 20 3,069 3,060 Property and equipment 24 25,280 45,941 Total assets 11,726,105 7,133,537
LIABILITIES
Due to banks 22 4,050,912 2,678,765 Debt securities in issue 23 2,090,972 1,734,272 Deposits and customer accounts 25 3,778,493 1,308,143 Hedging derivatives instruments 5 22,018 628 Other liabilities 26 157,342 145,020
Total liabilities 10,099,737 5,866,827
CAPITAL FUNDS
Share capital 27 378,488 307,152 Share premium 28 355,310 203,861 Warrants 32 98,716 46,316 Reserves 29 364,406 354,233 Retained earnings 30 429,448 355,147 Total capital funds 1,626,368 1,266,709
Total liabilities and capital funds 11,726,105 7,133,537
Dr. Benedict Okey OramahChairman of the Board of Directors
The accompanying notes to the financial statements form part of this statement

AFRICAN EXPORT-IMPORT BANK 4STATEMENT OF CHANGES IN EQUITYFOR THE YEAR ENDED 31 DECEMBER 2016
Share Capital Share Premium WarrantsGeneral Reserve
Asset Revaluation Reserve
Cashflow hedge reserve
Retained Earnings Total
(Note 27) (Note 28) (Note 32) (Note 29) (Note 29) (Note 29) (Note 30)US$000 US$000 US$000 US$000 US$000 US$000 US$000 US$000
Balance at 1 January 2016 307,152 203,861 46,316 302,744 31,878 19,611 355,147 1,266,709 Paid in capital during 2016 71,336 151,449 - - - - - 222,785 Issued during the year - - 98,716 - - - - 98,716 Profit of the year - - - - - - 165,034 165,034 Transfer to general reserve - - - 63,538 - - (63,538) - Depreciation transfer: buildings - - - - (1,628) - 1,628 - Warrants retirement - - (46,316) - - - - (46,316) Other comprehensive income - - - - (18,650) (33,087) - (51,737) Dividends for year 2015 (Note 31) - - - - - - (28,823) (28,823) Balance at 31 December 2016 378,488 355,310 98,716 366,282 11,600 (13,476) 429,448 1,626,368
Balance at 1 January 2015 185,572 56,847 77,328 254,497 31,070 13,011 300,744 919,069 Paid in capital during 2015 121,580 147,014 - - - - - 268,594 Issued during the year - - 46,316 - - - - 46,316 Profit of the year - - - - - - 125,317 125,317 Transfer to general reserve - - - 48,247 - - (48,247) - Depreciation transfer: buildings - - - - (1,480) - 1,480 - Warrants retirement - - (77,328) - - - - (77,328) Other comprehensive income - - - - 2,288 6,600 - 8,888 Dividends for year 2014 (Note 31) - - - - - - (24,147) (24,147) Balance at 31 December 2015 307,152 203,861 46,316 302,744 31,878 19,611 355,147 1,266,709
The accompanying notes to the financial statements form part of this statement

AFRICAN EXPORT-IMPORT BANK 5STATEMENT OF CASH FLOWSFOR THE YEAR ENDED 31 DECEMBER 2016
2016 2015Note US$000 US$000
CASHFLOW FROM OPERATING ACTIVITIES
Profit for the year 165,034 125,317
Adjustment for non-cash items:Depreciation of property and equipment 24 4,483 4,358 Allowance on impairment on loans and advances 18.1(b) 82,747 63,447 Provision on other assets 18.2(b) 1,074 2,187 Provision on accrued income 18.2(b) 2,542 3,286 Provision for leave pay 306 597 Gain on disposal of property and equipment (7) (40)
256,179 199,152 Changes in :Prepayments and accrued income (68,480) (79,467) Hedging derivatives instruments 3,163 25,546 Other assets (1,083) (3,362) Other liabilities 22,026 5,918 Deposits and customer accounts 2,470,350 6,332 Loans and advances to customers (4,199,901) (1,778,754) Net cash outflows from operating activities (1,517,745) (1,624,635)
CASH FLOWS FROM INVESTING ACTIVITIES
Purchases and additions to property and equipment 24 (2,472) (2,357) Proceeds from sale of property and equipment 7 40 Net cash outflows from investing activities (2,465) (2,317)
CASH FLOWS FROM FINANCING ACTIVITIES
Net cash from capital subscriptions and share premium 204,205 267,957 Proceeds from issue of warrants 32 98,716 46,316 Retirement of warrants 32 (46,316) (77,328) Dividends paid (20,254) (3,258) Proceeds from borrowed funds and debt securities 7,226,293 6,170,919 Repayment of borrowed funds and debt securities (5,497,446) (4,607,943) Net cash inflows from financing activities 1,965,198 1,796,663
Net increase in cash and cash equivalents 444,988 169,711 Cash and cash equivalents at 1 January 824,092 654,381
CASH AND CASH EQUIVALENTS AT 31 DECEMBER 16 1,269,080 824,092
The accompanying notes to the financial statements form part of this statement

AFRICAN EXPORT-IMPORT BANK 6NOTES TO THE FINANCIAL STATEMENTSFOR THE YEAR ENDED 31 DECEMBER 2016
1 GENERAL INFORMATION
2 SUMMARY OF SIGNIFICANT ACCOUNTING POLICIES
2.1 Basis of preparation
2.1.1 Initial application of new amendments to the existing Standards effective for current financial period.
• IFRS 14 “Regulatory Deferral Accounts” (effective for annual periods beginning on or after 1 January 2016) IFRS 14 is an optional standard that allows an entity, whose activities are subject to rate-regulation, to continue applying most of its existing accounting policies for regulatory deferral account balances upon its first-time adoption of IFRS. Entities that adopt IFRS 14 must present the regulatorydeferral accounts as separate line items on the statement of financial position and present movements in these account balances as separate line items in the statement of profit or loss and OCI. The standardrequires disclosure of the nature of, and risks associated with, the entity’s rate-regulation and the effects of that rate-regulation on its financial statements. Since the Bank is an existing IFRS preparer and is notinvolved in any rate-regulated activities, this standard does not apply.
The African Export-Import Bank (“the Bank”), headquartered in Cairo, Egypt, is a supranational institution, established on 27 October 1993. The Bank started lending operations on 30 September 1994. Theprincipal business of the Bank is the finance and facilitation of trade among African countries and between Africa and the rest of the world. The Bank’s headquarters is located at No. 72 (B) El Maahad ElEshteraky Street, Heliopolis, Cairo 11341, Egypt. In addition, the Bank has branches in Abuja (Nigeria), Harare (Zimbabwe), Abidjan (Cote D'Ivoire) and Nairobi (Kenya).
The accounting policies applied by the Bank have been approved by the Board of Directors of the Bank and in accordance with International Financial Reporting Standards (IFRS) promulgated by theInternational Accounting Standards Board. The major accounting policies adopted, which are consistent with those used in the previous financial year, except for the amendments to IFRS effective as of 1January 2016 as disclosed in note 2.1.1 below and applied by the Bank are summarized below.
The financial statements of the Bank have been prepared in accordance with International Financial Reporting Standards as issued by the International Accounting Standards Board (IASB).
The financial statements are prepared on a historical cost basis except for land and buildings and derivative financial instruments that have been measured at fair value and are presented in US Dollars inaccordance with the Bank’s Charter. The functional currency of the Bank is the US Dollar based on the fact that most of the activities of the Bank are conducted in US Dollar. The financial statements arepresented in US Dollars and all values are rounded to the nearest thousand (US$’000). The Bank has not applied any IFRS before their effective dates.
The preparation of financial statements complying with IFRS requires the use of certain critical accounting estimates. It also requires management to exercise its judgment in the process of applying the Bank’saccounting policies. The areas involving a higher degree of judgment or complexity, or areas where assumptions and estimates are significant to the financial statements are disclosed in note 6 below.
The following new amendments to the existing standards issued by the International Accounting Standards Board are effective for current financial period:
• Amendments to IFRS 11 “Joint Arrangements” - Accounting for Acquisitions of Interests in Joint Operations (effective for annual periods beginning on or after 1 January 2016) The amendments to IFRS11 require that a joint operator accounting for the acquisition of an interest in a joint operation, in which the activity of the joint operation constitutes a business, must apply the relevant IFRS 3 BusinessCombinations principles for business combination accounting. The amendments also clarify that a previously held interest in a joint operation is not remeasured on the acquisition of an additional interest in thesame joint operation if joint control is retained. In addition, a scope exclusion has been added to IFRS 11 to specify that the amendments do not apply when the parties sharing joint control, including thereporting entity, are under common control of the same ultimate controlling party. The amendments apply to both the acquisition of the initial interest in a joint operation and the acquisition of any additionalinterests in the same joint operation and are applied prospectively. These amendments do not have any impact on the bank as it does not have any interest in a joint operation

AFRICAN EXPORT-IMPORT BANK 7NOTES TO THE FINANCIAL STATEMENTSFOR THE YEAR ENDED 31 DECEMBER 2016
The adoption of these amendments to the existing standards and interpretations has not led to any changes in the Bank’s accounting policies.
• Amendments to IAS 27 “Separate Financial Statements” - Equity Method in Separate Financial Statements (effective for annual periods beginning on or after 1 January 2016) The amendments allowentities to use the equity method to account for investments in subsidiaries, joint ventures and associates in their separate financial statements. Entities already applying IFRS and electing to change to the equitymethod in their separate financial statements have to apply that change retrospectively. These amendments do not have any impact on the Bank’s financial statements.
• Amendments to various standards “Improvements to IFRSs (cycle 2012-2014)”- issued by IASB on 25 September 2014. Amendments to various standards and interpretations resulting from the annualimprovement project of IFRS (IFRS 5, IFRS 7, IAS 19 and IAS 34) primarily with a view to removing inconsistencies and clarifying wording. The revisions clarify the required accounting recognition in caseswhere free interpretation used to be permitted. Changes include new or revised requirements regarding: (i) changes in methods of disposal; (ii) servicing contracts; (iii) applicability of the offsetting disclosuresto condensed interim financial statements; (iv) discount rate: regional market issue; (v) disclosure of information 'elsewhere in the interim financial report'. The amendments are to be applied for annual reportingperiods beginning on or after 1 January 2016.
• Amendments to IFRS 10 “Consolidated Financial Statements”, IFRS 12 “Disclosure of Interests in Other Entities” and IAS 28 “Investments in Associates and Joint Ventures” - InvestmentEntities: Applying the Consolidation Exception (effective for annual periods beginning on or after 1 January 2016) The amendments address issues that have arisen in applying the investment entities exceptionunder IFRS 10. The amendments to IFRS 10 clarify that the exemption from presenting consolidated financial statements applies to a parent entity that is a subsidiary of an investment entity, when theinvestment entity measures all of its subsidiaries at fair value. Furthermore, the amendments to IFRS 10 clarify that only a subsidiary of an investment entity that is not an investment entity itself and thatprovides support services to the investment entity is consolidated. All other subsidiaries of an investment entity are measured at fair value. The amendments to IAS 28 allow the investor, when applying theequity method, to retain the fair value measurement applied by the investment entity associate or joint venture to its interests in subsidiaries. These amendments must be applied retrospectively, with earlyadoption permitted. The amendments do not have any impact on Bank’s financial statements.
• Amendments to IAS 16 “Property, Plant and Equipment” and IAS 38 “Intangible Assets” - Clarification of Acceptable Methods of Depreciation and Amortisation (effective for annual periods beginningon or after 1 January 2016) The amendments clarify the principle in IAS 16 Property, Plant and Equipment and IAS 38 Intangible Assets that revenue reflects a pattern of economic benefits that are generatedfrom operating a business (of which the asset is a part) rather than the economic benefits that are consumed through use of the asset. As a result, a revenue-based method cannot be used to depreciate property,plant and equipment and may only be used in very limited circumstances to amortise intangible assets. The amendments are applied prospectively and do not have any impact on the Bank, given that it has notused a revenue-based method to depreciate its non-current assets.
• Amendments to IAS 1 “Presentation of Financial Statements” - Disclosure Initiative (effective for annual periods beginning on or after 1 January 2016). The amendments to IAS 1 are designed to furtherencourage companies to apply professional judgement in determining what information to disclose in their financial statements. For example, the amendments make clear that materiality applies to the whole offinancial statements and that the inclusion of immaterial information can inhibit the usefulness of financial disclosures. Furthermore, the amendments clarify that companies should use professional judgement indetermining where and in what order information is presented in the financial disclosures. These amendments did not have significant impact on the Bank.

AFRICAN EXPORT-IMPORT BANK 8NOTES TO THE FINANCIAL STATEMENTSFOR THE YEAR ENDED 31 DECEMBER 2016
2.1.2 New Standards and amendments to existing standards in issue not yet adopted
• IFRS 16 “Leases” (effective for annual periods beginning on or after 1 January 2019).
Issued by IASB on 13 January 2016, the new standard requires lessees to account for all leases under a single on-balance sheet model (subject to certain exemptions) in a similar way to finance leases under IAS17. Lessees are to recognise a liability to pay rentals with a corresponding asset, and recognise interest expense and depreciation separately. The new standard includes two recognition exemptions for lessees –leases of ’low-value’ assets (e.g., personal computer) and short-term leases (i.e., leases with a lease term of 12 months or less). Reassessment of certain key considerations (e.g., lease term, variable rents basedon an index or rate, discount rate) by the lessee is required upon certain events. Lessor accounting is substantially the same as today’s lessor accounting, using IAS 17’s dual classification approach. Earlyapplication is permitted, but not before an entity applies IFRS 15.
• Amendments to IFRS 2 “Share-based Payment” - Classification and Measurement of Share-based Payment Transactions (effective for annual periods beginning on or after 1 January 2018).
The IASB issued amendments to IFRS 2 Share-based Payment that address three main areas: the effects of vesting conditions on the measurement of a cash-settled share-based payment transaction; the classification of a share-based payment transaction with net settlement features for withholding tax obligations; and accounting where a modification to the terms and conditions of a share-based payment transaction changes its classification from cash settled to equity settled.
On adoption, entities are required to apply the amendments without restating prior periods, but retrospective application is permitted if elected for all three amendments and other criteria are met.
• Amendments to IAS 7 “Statement of Cash Flows” - Disclosure Initiative (effective for annual periods beginning on or after 1 January 2017).
The amendments to IAS 7 Statement of Cash Flows are part of the IASB’s Disclosure Initiative and require an entity to provide disclosures that enable users of financial statements to evaluate changes in liabilities arising from financing activities, including both changes arising from cash flows and non-cash changes. On initial application of the amendment, entities are not required to provide comparative information for preceding periods.
• Amendments to IAS 40 “Investment Property” - Transfers of Investment Property (effective for annual periods beginning on or after1 January 2018).
The amendments clarify when an entity should transfer property, including property under construction or development into, or out of investment property. The amendments state that a change in use occurs when the property meets, or ceases to meet, the definition of investment property and there is evidence of the change in use. A mere change in management’s intentions for the use of a property does not provide evidence of a change in use.
• IFRIC Interpretation 22 “Foreign Currency” - Transactions and Advance Consideration (effective for annual periods beginning on or after 1 January 2018).
The interpretation clarifies that in determining the spot exchange rate to use on initial recognition of the related asset, expense or income (or part of it) on the derecognition of a non-monetary asset or non-monetary liability relating to advance consideration, the date of the transaction is the date on which an entity initially recognises the non-monetary asset or non-monetary liability arising from the advance consideration. If there are multiple payments or receipts in advance, then the entity must determine a date of the transactions for each payment or receipt of advance consideration.
• Amendments to IFRS 10 “Consolidated Financial Statements” and IAS 28 “Investments in Associates and Joint Ventures” - Sale or Contribution of Assets between an Investor and its Associate or JointVenture and further amendments (effective date was deferred indefinitely until the research project on the equity method has been concluded).
The amendments address the conflict between IFRS 10 and IAS 28 in dealing with the loss of control of a subsidiary that is sold or contributed to an associate or joint venture. The amendments clarify that thegain or loss resulting from the sale or contribution of assets that constitute a business, as defined in IFRS 3, between an investor and its associate or joint venture, is recognised in full. Any gain or loss resultingfrom the sale or contribution of assets that do not constitute a business, however, is recognised only to the extent of unrelated investors’ interests in the associate or joint venture.
At the date of authorisation of these financial statements the following new standards and amendments to existing standards were in issue, but not yet effective:
• IFRS 9 “Financial Instruments” (effective for annual periods beginning on or after 1 January 2018).
In July 2014, the IASB issued the final version of IFRS 9 “Financial Instruments” which reflects all phases of the financial instruments project and replaces IAS 39 Financial Instruments: Recognition andMeasurement and all previous versions of IFRS 9. IFRS 9 includes requirements for recognition and measurement, impairment, derecognition and general hedge accounting.
Classification and Measurement - IFRS 9 introduces new approach for the classification of financial assets, which is driven by cash flow characteristics and the business model in which an asset is held. Thissingle, principle-based approach replaces existing rule-based requirements under IAS 39. The new model also results in a single impairment model being applied to all financial instruments.
Impairment - IFRS 9 has introduced a new, expected-loss impairment model that will require more timely recognition of expected credit losses. Specifically, the new Standard requires entities to account forexpected credit losses from when financial instruments are first recognised and to recognise full lifetime expected losses on a more timely basis.
Hedge accounting - IFRS 9 introduces a substantially-reformed model for hedge accounting, with enhanced disclosures about risk management activity. The new model represents a significant overhaul ofhedge accounting that aligns the accounting treatment with risk management activities.
Own credit - IFRS 9 removes the volatility in profit or loss that was caused by changes in the credit risk of liabilities elected to be measured at fair value. This change in accounting means that gains caused bythe deterioration of an entity’s own credit risk on such liabilities are no longer recognised in profit or loss.
• IFRS 15 “Revenue from Contracts with Customers” and further amendments (effective for annual periods beginning on or after 1 January 2018).
IFRS 15 specifies how and when an IFRS reporter will recognise revenue as well as requiring such entities to provide users of financial statements with more informative, relevant disclosures. The standardsupersedes IAS 18 “Revenue”, IAS 11 “Construction Contracts” and a number of revenue-related interpretations. Application of the standard is mandatory for all IFRS reporters and it applies to nearly allcontracts with customers: the main exceptions are leases, financial instruments and insurance contracts. The core principle of the new Standard is for companies to recognise revenue to depict the transfer ofgoods or services to customers in amounts that reflect the consideration (that is, payment) to which the company expects to be entitled in exchange for those goods or services. The new Standard will also resultin enhanced disclosures about revenue, provide guidance for transactions that were not previously addressed comprehensively (for example, service revenue and contract modifications) and improve guidance formultiple-element arrangements.

AFRICAN EXPORT-IMPORT BANK 9NOTES TO THE FINANCIAL STATEMENTSFOR THE YEAR ENDED 31 DECEMBER 2016
2.2 Interest income and expense
2.3 Fees and commission income
2.4 Other operating income
2.5 Operating expenses
2.6 Foreign currencies
For all financial instruments measured at amortized cost and interest bearing financial instruments classified as available-for-sale financial instruments, interest income or expense is recognized at the effectiveinterest rate, which is the rate that exactly discounts estimated future cash payments or receipts through the expected life of the financial instrument or shorter period, where appropriate, to the net carryingamount of the financial asset or financial liability. The carrying amount of the financial asset or financial liability is adjusted if the Bank revises its estimates of payments or receipts. The adjusted carryingamount is calculated based on the original effective interest rate (EIR) and the change in carrying amount is recognized as interest income or expense.
Once the recorded value of a financial asset or a group of similar financial assets has been reduced due to an impairment loss, interest income continues to be recognized using the original effective interest rateapplied to the new carrying amount.
Unless included in the effective interest rate calculation, fees and commissions are generally recognized on an accrual basis when the service has been provided. Fees or component of fees that are performancelinked (e.g. investment banking advisory services including among other things evaluating financing options, debt restructuring, etc.) are recognized when the performance criteria are fulfilled in accordance withthe applicable terms of engagement.
The Bank has elected not to adopt these new standards and amendements to existing standards in advance of their effective dates.
Other operating income consists mainly of rental income which is accounted for on a straight-line basis over the lease terms on ongoing leases.
Operating expenses are recorded on accrual basis.
• Amendments to various standards “Improvements to IFRSs (cycle 2014-2016)” issued in December 2016. They include:- IFRS 1 “First-time Adoption of International Financial Reporting Standards” -Deletion of short-term exemptions for first-time adopters (effective from 1 January 2018).Short-term exemptions in paragraphs E3–E7 of IFRS 1 were deleted because they have now served their intended purpose.
- Clarification of the scope of the disclosure requirements in IFRS 12 (effective from 1 January 2017).The amendments clarify that the disclosure requirements in IFRS 12, other than those in paragraphs B10–B16, apply to an entity’s interest in a subsidiary, a joint venture or an associate (or a portion of its interest in a joint venture or an associate) that is classified (or included in a disposal group that is classified) as held for sale.
- Clarification that measuring investees at fair value through profit or loss is an investment-by investment choice (effective from 1 January 2018).The amendments clarifies that:o An entity that is a venture capital organisation, or other qualifying entity, may elect, at initial recognition on an investment-by-investment basis, to measure its investments in associates and joint ventures at fair value through profit or loss.o If an entity that is not itself an investment entity has an interest in an associate or joint venture that is an investment entity, the entity may, when applying the equity method, elect to retain the fair value measurement applied by that investment entity associate or joint venture to the investment entity associate’s or joint venture’s interests in subsidiaries. This election is made separately for each investment entity associate or joint venture, at the later of the date on which (a) the investment entity associate or joint venture is initially recognised; (b) the associate or joint venture becomes an investment entity; and (c) the investment entity associate or joint venture first becomes a parent.
Transactions in foreign currencies are initially recorded at their respective functional currency spot rate prevailing at the date of the transaction.
At the reporting date, balances of monetary assets and liabilities denominated in foreign currencies are translated at the exchange rates ruling at that date. Any gains or losses resulting from the translation arerecognized in profit or loss in the statement of profit or loss and comprehensive income.
Non-monetary items that are measured in terms of historical cost in a foreign currency are translated using the exchange rate as at the date of the initial transaction and are not subsequently restated. Non-monetary items measured at fair value in a foreign currency are translated using the exchange rates at the date when the fair value was determined. The gain or loss arising on translation of non-monetary itemsmeasured at fair value is treated in line with the recognition of gain or loss on change in fair value of the item (i.e. translation differences on items whose fair value gain or loss is recognized in othercomprehensive income or profit or loss are also recognized in other Comprehensive income or profit or loss, respectively).

AFRICAN EXPORT-IMPORT BANK 10NOTES TO THE FINANCIAL STATEMENTSFOR THE YEAR ENDED 31 DECEMBER 2016
2.7 Cash and cash equivalents
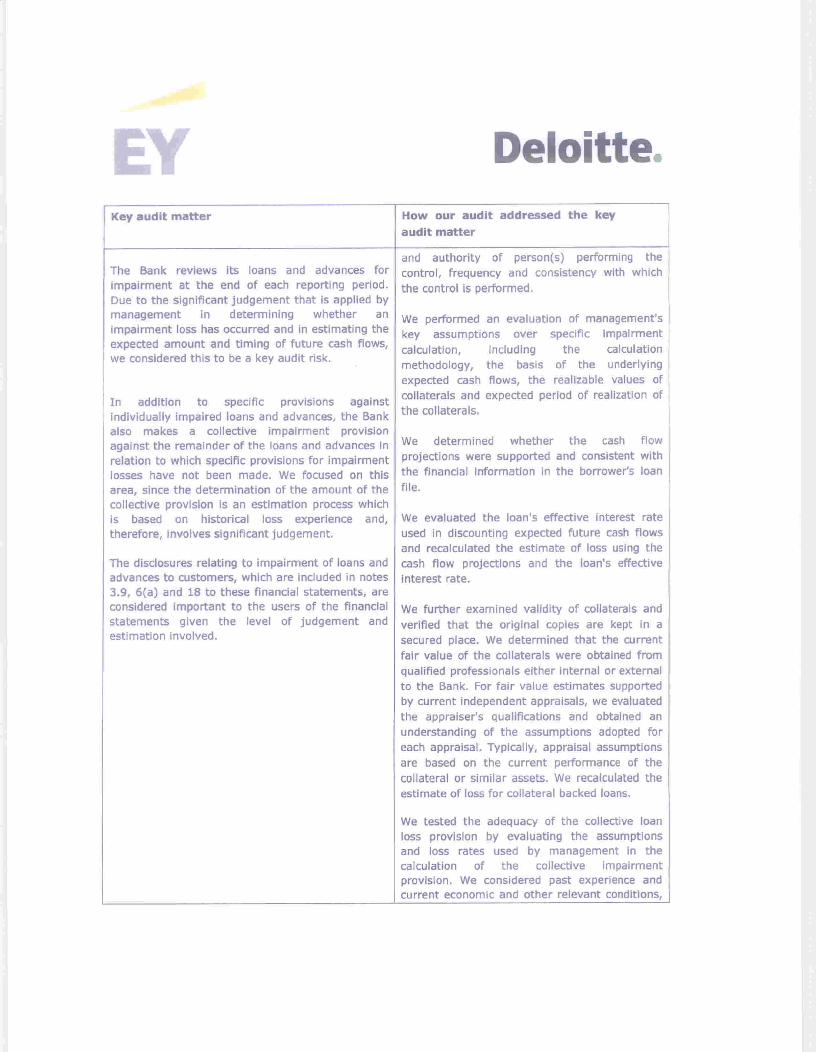
2.8 Impairment of loans and advances
In addition to specific provisions against individually significant loans and advances, the Bank also makes a collective impairment provision against loans and advances which although not specificallyidentified as requiring specific provisions, have a greater risk of default than when originally granted. The amount of provision is based on historical loss experience for loans.
When a loan is uncollectible, it is written off against the related provision for loan impairment. Such loans are written off after all the necessary procedures have been completed, including obtaining Board ofDirectors approval, and the amount of loss has been determined.
If, in a subsequent period the amount of the impairment loss decreases and the decrease can be related objectively to an event occurring after the impairment was recognized, the previously recognizedimpairment loss is reversed by adjusting the allowance account. The amount of the reversal is recognized as a reduction to loan impairment charges in profit or loss.
For the purposes of the statement of cash flows, cash and cash equivalents comprise cash in hand, due from banks, and deposits with other banks with less than three months’ maturity from the transaction date.Due from banks and deposits with other banks are carried at amortized cost as these balances earn interest.
The Bank assesses at each reporting date whether there is objective evidence that a loan is impaired (see note 6). Loans and advances are identified as impaired where there is reasonable doubt regarding thecollectability of principal or interest. Whenever a payment is 90 days past due, loans and advances are automatically placed on an impairment test. A loan is impaired and impairment losses are incurred only ifthere is objective evidence of impairment as a result of one or more events that occurred after the initial recognition of the loan (a loss event) and that loss event (or events) has an impact on the estimated futurecash flows of the loan that can be reliably estimated.
The estimated period between losses occurring and its identification is determined by management for each loan. In general, the periods used vary between three months and twelve months; in exceptional cases,longer periods are warranted.
The amount of loss is measured as the difference between the carrying amount of the loan and the present value of estimated future cash flows discounted at the loan's original effective interest rate determinedunder contract. The carrying amount of loans and advances are reduced through the use of an allowance account and the amount of the loss is recognized in profit or loss. Further details on estimates andassumptions used in impairment of loans and advances are shown in note 6.
The methodology and assumptions used for estimating future cash flows are reviewed regularly by the Bank to reduce any differences between loss estimates and actual loss experience.
AFRICAN EXPORT-IMPORT BANK 11NOTES TO THE FINANCIAL STATEMENTSFOR THE YEAR ENDED 31 DECEMBER 2016
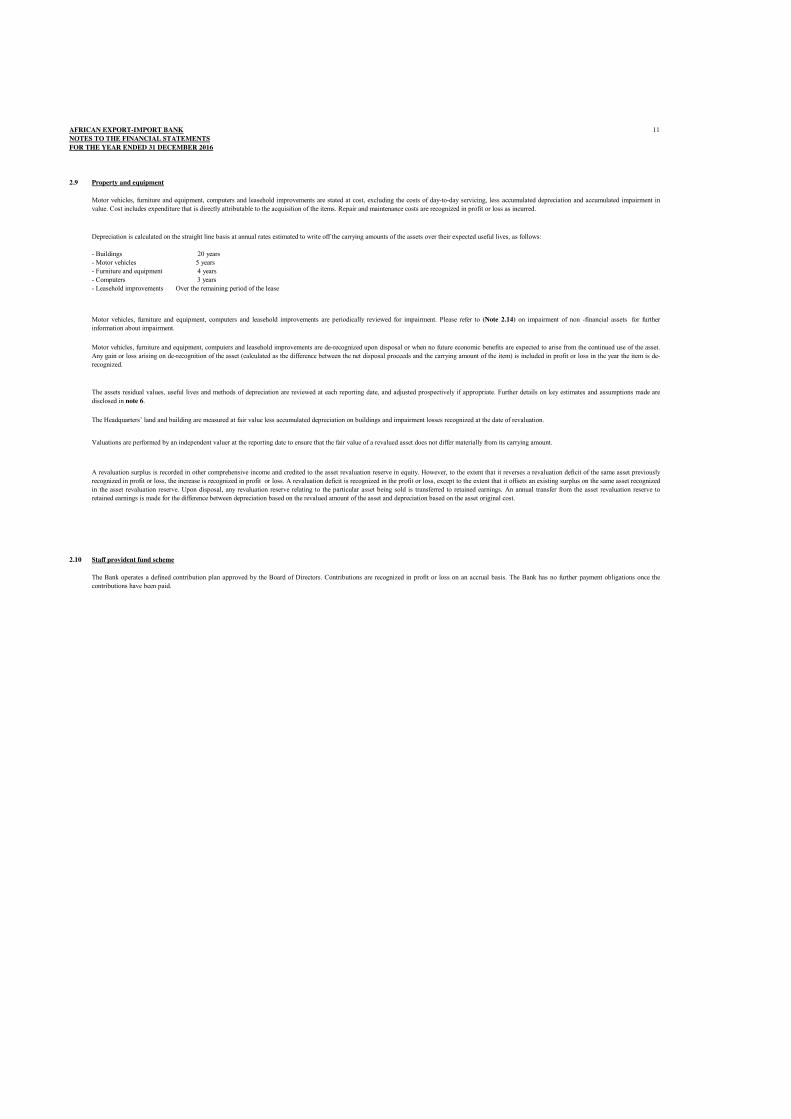
2.9 Property and equipment
2.10 Staff provident fund scheme
The assets residual values, useful lives and methods of depreciation are reviewed at each reporting date, and adjusted prospectively if appropriate. Further details on key estimates and assumptions made aredisclosed in note 6.
The Headquarters’ land and building are measured at fair value less accumulated depreciation on buildings and impairment losses recognized at the date of revaluation.
Motor vehicles, furniture and equipment, computers and leasehold improvements are de-recognized upon disposal or when no future economic benefits are expected to arise from the continued use of the asset.Any gain or loss arising on de-recognition of the asset (calculated as the difference between the net disposal proceeds and the carrying amount of the item) is included in profit or loss in the year the item is de-recognized.
Valuations are performed by an independent valuer at the reporting date to ensure that the fair value of a revalued asset does not differ materially from its carrying amount.
Motor vehicles, furniture and equipment, computers and leasehold improvements are stated at cost, excluding the costs of day-to-day servicing, less accumulated depreciation and accumulated impairment invalue. Cost includes expenditure that is directly attributable to the acquisition of the items. Repair and maintenance costs are recognized in profit or loss as incurred.
A revaluation surplus is recorded in other comprehensive income and credited to the asset revaluation reserve in equity. However, to the extent that it reverses a revaluation deficit of the same asset previouslyrecognized in profit or loss, the increase is recognized in profit or loss. A revaluation deficit is recognized in the profit or loss, except to the extent that it offsets an existing surplus on the same asset recognizedin the asset revaluation reserve. Upon disposal, any revaluation reserve relating to the particular asset being sold is transferred to retained earnings. An annual transfer from the asset revaluation reserve toretained earnings is made for the difference between depreciation based on the revalued amount of the asset and depreciation based on the asset original cost.
The Bank operates a defined contribution plan approved by the Board of Directors. Contributions are recognized in profit or loss on an accrual basis. The Bank has no further payment obligations once thecontributions have been paid.
Depreciation is calculated on the straight line basis at annual rates estimated to write off the carrying amounts of the assets over their expected useful lives, as follows:
- Buildings 20 years- Motor vehicles 5 years- Furniture and equipment 4 years- Computers 3 years- Leasehold improvements Over the remaining period of the lease
Motor vehicles, furniture and equipment, computers and leasehold improvements are periodically reviewed for impairment. Please refer to (Note 2.14) on impairment of non -financial assets for furtherinformation about impairment.

AFRICAN EXPORT-IMPORT BANK 12NOTES TO THE FINANCIAL STATEMENTSFOR THE YEAR ENDED 31 DECEMBER 2016
2.11 Financial instruments
i) Classification and measurement of financial assetsFinancial assets are classified, at initial recognition, as financial assets at fair value through profit or loss, loans and receivables, or as derivatives designated as hedging instruments in an effective hedge, asappropriate. All financial assets are recognized initially at fair value plus, in the case of financial assets not recorded at fair value through profit or loss, transaction costs that are attributable to the acquisition ofthe financial asset.
Loans and receivablesLoans and receivables including loans and advances to customers and cash and deposits with banks are non-derivative financial assets with fixed or determinable payments that are not quoted in an activemarket. They are initially recognized at fair value plus transaction costs and are de-recognized when the rights to receive cash flows from the financial assets have expired or where the Bank has transferredsubstantially all risks and rewards of ownership. Subsequently, loans and receivables are measured at amortized cost using the effective interest rate method less allowance for impairment, and are recognized onthe day on which they are drawn down by the borrower.
ii) De-recognition of financial assetsA financial asset (or, where applicable, a part of a financial asset is primarily derecognized (i.e. removed from the Bank’s statement of financial position) when:• The rights to receive cash flows from the asset have expired, or• The Bank has transferred its rights to receive cash flows from the asset or has assumed an obligation to pay the received cash flows in full without material delay to a third party under a ‘pass-through’arrangement; and either (a) the Bank has transferred substantially all the risks and rewards of the asset, or (b) the Bank has neither transferred nor retained substantially all the risks and rewards of the asset, buthas transferred control of the asset.
iii) Impairment of financial assetsThe Bank assesses at each reporting date whether there is objective evidence that a financial asset or a group of financial assets is impaired. A financial asset is deemed to be impaired if there is objectiveevidence of impairment that, as a result of one or more events that has occurred since the initial recognition of the asset (an incurred loss event) and that loss event has an impact on the estimated future cashflows of the financial asset that can be reliably estimated. Objective evidence of impairment could include; the Bank’s past experience of collecting payments, an increase in the number of delayed payments pastthe average credit period, delinquency, and initiation of bankruptcy proceedings as well as observable changes in economic conditions that correlate with default on receivables.
For certain categories of financial assets, such as loans and advances to customers, assets that are assessed not to be impaired individually are, in addition, assessed for impairment on a collective basis.Objective evidence of impairment for a portfolio of receivables could include the Bank’s past experience of collecting payments, an increase in the number of delayed payments in the portfolio past the period of90 days, as well as observable changes in economic conditions that correlate with default on receivables.
For financial assets carried at amortised cost, the amount of the impairment loss recognized is the difference between the asset’s carrying amount and the present value of estimated future cash flows, discountedat the financial asset’s original effective interest rate.
The carrying amount of the financial asset is reduced by the impairment loss directly for all financial assets with the exception of loans and advances, where the carrying amount is reduced through the use of anallowance account. When loans and advances are considered uncollectible, they are written off against the allowance account. Subsequent recoveries of amounts previously written off are credited to otherincome. Changes in the carrying amount of the allowance account are recognized in profit or loss.
Financial assets and financial liabilities are recognized when the Bank becomes a party to the contractual provisions of the instrument. The Bank’s financial instruments consist primarily of cash and depositswith banks, loans and advances to customers, amounts due to banks, derivative financial instruments, debt securities in issue and customer deposits. The Bank borrows funds to meet disbursements in foreigncurrency as part of its matching of assets and liabilities in order to manage foreign currency risks. The proceeds from loans repayments are used to repay the borrowings.

AFRICAN EXPORT-IMPORT BANK 13NOTES TO THE FINANCIAL STATEMENTSFOR THE YEAR ENDED 31 DECEMBER 2016
2.12 Provisions
2.13 Operating leases
ii) Bank as lessorLeases in which the Bank does not transfer substantially all the risks and benefits of ownership of an asset are classified as operating leases. The Bank has entered into operating lease agreements for leasing ofoffice space on its building. These leases have an average life of between two and five years, with renewal option included in the contracts.
i) Bank as lesseeLeases which do not transfer to the Bank substantially all the risks and benefits incidental to ownership of the leased item, are accounted for as operating leases. The Bank has entered into operating leaseagreements for leasing of office premises. These leases have an average life of between two and five years, with renewal option included in the contracts.
The total payments made under operating leases are charged to profit or loss on a straight-line basis over the period of the lease. When an operating lease is terminated before the lease period has expired, anypayment required to be made to the lessor by way of penalty is recognized as an expense in the period in which termination takes place.
vii) Offsetting of financial instrumentsFinancial assets and liabilities are offset and the net amount reported in the statement of financial position when there is a currently enforceable legal right to set off the recognised amounts and there is anintention to settle on a net basis or realise the asset and settle the liability simultaneously.
iv) Classification and measurement of Financial liabilities Financial liabilities within the scope of IAS 39 are classified as financial liabilities at fair value through profit or loss, loans and borrowings, or as derivatives designated as hedging instruments in an effectivehedge, as appropriate. The Bank determines the classification of its financial liabilities at initial recognition. The Bank has not designated any financial liabilities at fair value through profit or loss. All financialliabilities are recognized initially at fair value and, in the case of loans and borrowings, net of directly attributable transaction costs.
The Bank’s financial liabilities include amount due to banks, debt securities in issue and customer deposits which are initially measured at fair value, net of directly attributable transaction costs. Subsequently,they are measured at amortised cost.
v) Derivative financial instrumentsThe Bank enters into interest rate swaps and foreign exchange forward contracts to hedge its exposure to changes in the fair value and cash flows attributable to changes in market interest and exchange rates onits assets and liabilities. Derivatives are initially recognized at fair value at the date the derivative contract is entered into and are subsequently measured at their fair value at the end of each reporting period.The resulting gain or loss is recognized in profit or loss immediately. A derivative with a positive fair value is recognized as a financial asset; a derivative with a negative fair value is recognized as a financialliability. See Note 5 for further details.
vi) De-recognition of financial liabilitiesA financial liability is derecognized when the obligation under the liability is discharged or cancelled, or expires. When an existing financial liability is replaced by another from the same lender on substantiallydifferent terms, or the terms of an existing liability are substantially modified, such an exchange or modification is treated as the derecognition of the original liability and the recognition of a new liability. Thedifference in the respective carrying amounts is recognized in profit or loss.
Provisions are recognized when the Bank has a present legal or constructive obligation as a result of past events, for which it is probable that an outflow of economic benefits will be required to settle theobligation and a reliable estimate can be made of the amount of the obligation. Staff bonuses are recognized in profit or loss as an expense.
The estimated monetary liability for employees’ accrued annual leave and bonus entitlement at the reporting date is recognized as an expense accrual.
The determination of whether an arrangement is, or contains, a lease is based on the substance of the arrangement at inception date, whether fulfillment of the arrangement is dependent on the use of a specificasset or assets or the arrangement conveys a right to use the asset, even if that right is not explicitly specified in an arrangement.

AFRICAN EXPORT-IMPORT BANK 14NOTES TO THE FINANCIAL STATEMENTSFOR THE YEAR ENDED 31 DECEMBER 2016
2.14 Impairments of non-financial assets
2.15 Debt securiries in issue
2.16 Derivative financial instruments and hedge accounting
The Bank assesses, at each reporting date or more frequently, whether there is an indication that an asset may be impaired. If such indication exists, the Bank makes an estimate of the asset’s recoverableamount. Where the carrying amount of an asset exceeds its recoverable amount, the asset is considered impaired and is written down to its recoverable amount. Impairment losses are recognized in profit or lossin expense categories consistent with the function of the impaired asset, except for properties previously revalued with the revaluation taken to OCI. For such properties, the impairment is recognised in OCI upto the amount of any previous revaluation.
The recoverable amount is the greater of fair value less costs of disposal and value in use. In assessing value in use, the estimated future cash flows are discounted to their present value using a discount rate thatreflects current market assessments of the time value of money and the risks specific to the asset. In determining fair value less costs of disposal, recent market transactions are taken into account. If no suchtransactions can be identified, an appropriate valuation model is used. These calculations are corroborated by valuation multiples, quoted share prices for publicly traded companies or other available fair valueindicators.
For all assets, an assessment is made at each reporting date to determine whether there is an indication that previously recognized impairment losses no longer exist or have decreased. If such indication exists,the Bank estimates the asset’s recoverable amount. A previously recognized impairment loss is reversed only if there has been a change in the assumptions used to determine the asset’s recoverable amount sincethe last impairment loss was recognized. The reversal is limited so that the carrying amount of the asset does not exceed its recoverable amount, nor exceed the carrying amount that would have been determined,net of depreciation, had no impairment loss been recognized for the asset in prior years. The reversal of impairment losses is recognised in profit or loss unless the asset is carried at a revalued amount, in whichcase, the reversal is treated as a revaluation increase.Further details on key estimates and assumptions used are as shown in Note 6.
Debt securities in issue are one of the Bank’s sources of debt funding. Debt securities are initially measured at fair value plus incremental direct transaction costs, and subsequently measured at their amortizedcost using effective interest method.
The Bank makes use of derivative instruments to manage exposures to interest rate, foreign currency and credit risks, including exposures arising from highly probable forecast transactions and firmcommitments. In order to manage particular risks, the Bank applies hedge accounting for transactions which meet specified criteria.
At inception of the hedge relationship, the Bank formally documents the relationship between the hedged item and the hedging instrument, including the nature of the risk, the risk management objective andstrategy for undertaking the hedge and the method that will be used to assess the effectiveness of the hedging relationship at inception and on an ongoing basis.
At each hedge effectiveness assessment date, a hedge relationship must be expected to be highly effective on a prospective basis and demonstrate that it was effective (retrospective effectiveness) for thedesignated period in order to qualify for hedge accounting. A formal assessment is undertaken by comparing the hedging instrument’s effectiveness in offsetting the changes in fair value or cash flowsattributable to the hedged risk in the hedged item, both at inception and at each quarter end on an ongoing basis. A hedge is expected to be highly effective if the changes in fair value or cash flows attributableto the hedged risk during the period for which the hedge is designated were offset by the hedging instrument in a range of 80% to 125% and were expected to achieve such offset in future periods. Hedgeineffectiveness is recognized in the profit or loss in other income. For situations where the hedged item is a forecast transaction, the Bank also assesses whether the transaction is highly probable and presents anexposure to variations in cash flows that could ultimately affect the profit or loss.
AFRICAN EXPORT-IMPORT BANK 15NOTES TO THE FINANCIAL STATEMENTSFOR THE YEAR ENDED 31 DECEMBER 2016
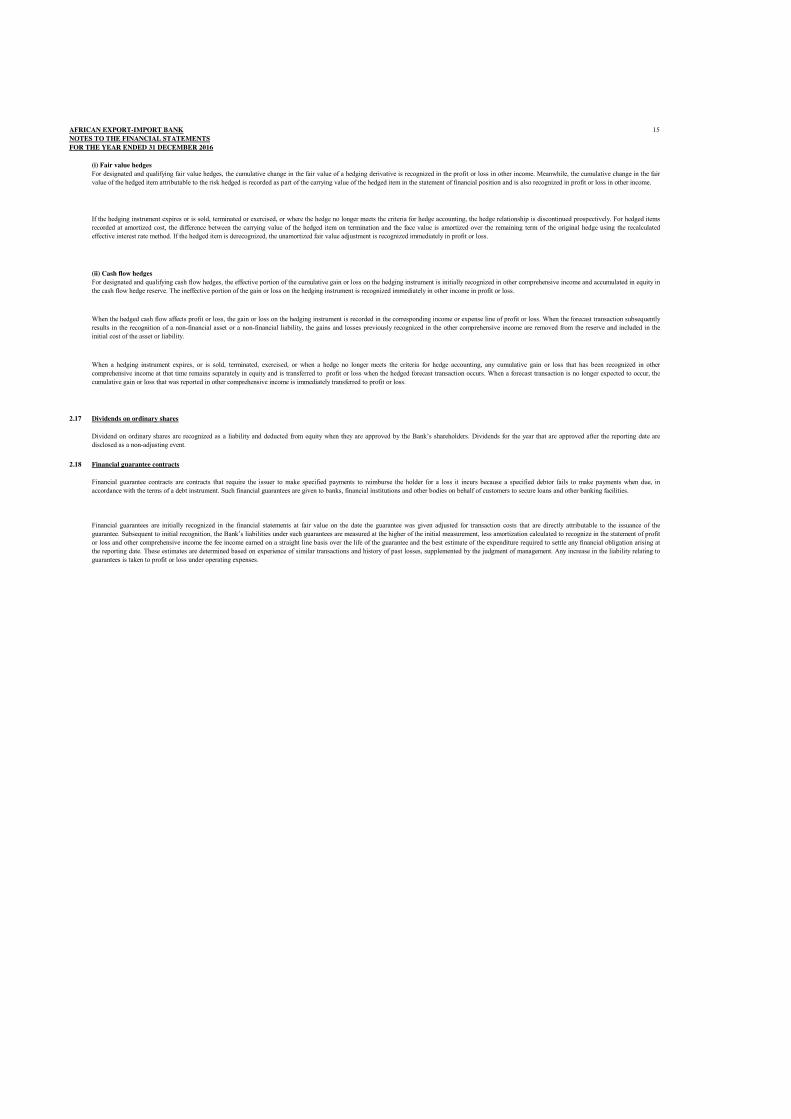
2.17 Dividends on ordinary shares
2.18 Financial guarantee contracts
(ii) Cash flow hedges For designated and qualifying cash flow hedges, the effective portion of the cumulative gain or loss on the hedging instrument is initially recognized in other comprehensive income and accumulated in equity inthe cash flow hedge reserve. The ineffective portion of the gain or loss on the hedging instrument is recognized immediately in other income in profit or loss.
When the hedged cash flow affects profit or loss, the gain or loss on the hedging instrument is recorded in the corresponding income or expense line of profit or loss. When the forecast transaction subsequentlyresults in the recognition of a non-financial asset or a non-financial liability, the gains and losses previously recognized in the other comprehensive income are removed from the reserve and included in theinitial cost of the asset or liability.
When a hedging instrument expires, or is sold, terminated, exercised, or when a hedge no longer meets the criteria for hedge accounting, any cumulative gain or loss that has been recognized in othercomprehensive income at that time remains separately in equity and is transferred to profit or loss when the hedged forecast transaction occurs. When a forecast transaction is no longer expected to occur, thecumulative gain or loss that was reported in other comprehensive income is immediately transferred to profit or loss.
Dividend on ordinary shares are recognized as a liability and deducted from equity when they are approved by the Bank’s shareholders. Dividends for the year that are approved after the reporting date aredisclosed as a non-adjusting event.
Financial guarantee contracts are contracts that require the issuer to make specified payments to reimburse the holder for a loss it incurs because a specified debtor fails to make payments when due, inaccordance with the terms of a debt instrument. Such financial guarantees are given to banks, financial institutions and other bodies on behalf of customers to secure loans and other banking facilities.
Financial guarantees are initially recognized in the financial statements at fair value on the date the guarantee was given adjusted for transaction costs that are directly attributable to the issuance of theguarantee. Subsequent to initial recognition, the Bank’s liabilities under such guarantees are measured at the higher of the initial measurement, less amortization calculated to recognize in the statement of profitor loss and other comprehensive income the fee income earned on a straight line basis over the life of the guarantee and the best estimate of the expenditure required to settle any financial obligation arising atthe reporting date. These estimates are determined based on experience of similar transactions and history of past losses, supplemented by the judgment of management. Any increase in the liability relating toguarantees is taken to profit or loss under operating expenses.
If the hedging instrument expires or is sold, terminated or exercised, or where the hedge no longer meets the criteria for hedge accounting, the hedge relationship is discontinued prospectively. For hedged itemsrecorded at amortized cost, the difference between the carrying value of the hedged item on termination and the face value is amortized over the remaining term of the original hedge using the recalculatedeffective interest rate method. If the hedged item is derecognized, the unamortized fair value adjustment is recognized immediately in profit or loss.
(i) Fair value hedgesFor designated and qualifying fair value hedges, the cumulative change in the fair value of a hedging derivative is recognized in the profit or loss in other income. Meanwhile, the cumulative change in the fairvalue of the hedged item attributable to the risk hedged is recorded as part of the carrying value of the hedged item in the statement of financial position and is also recognized in profit or loss in other income.

AFRICAN EXPORT-IMPORT BANK 16NOTES TO THE FINANCIAL STATEMENTSFOR THE YEAR ENDED 31 DECEMBER 2016
2.19 Fair value measurement
2.20 Warrants
2.21 Financial investments - held to maturity
3 FINANCIAL INSTRUMENTS AND RISK MANAGEMENT
3.1 Risk management
3.2 Risk management structure
3.3 Credit risk
The Bank is not regulated by any monetary and/or financial authority, but strives to comply with all international risk management standards and to operate in accordance with the best practices in the industry.
To conduct the Bank’s operations in a manner consistent with its charter and aims, objectives and expectations of its stakeholders, the Board of Directors has approved the Risk Management Policies andProcedures (RMPP). This document incorporates different risk management policies that were operating as stand-alone policies into an integrated document that takes an enterprise wide approach to riskmanagement.
The Bank identifies and controls the various operational risks inherent in its business. Operational risk is managed and mitigated by ensuring that there is appropriate infrastructure, controls, systems,procedures, and trained and competent people in place discharging the various functions.
The risk management governance structure comprises (i) Board of Directors, responsible for oversight and approval of risk policies; (ii) Board Executive Committee, responsible for credit approval abovemanagement’s authority levels; (iii) Management Risk and Strategy Committee, responsible for the risk policies review and implementation; and (iv) Risk Management Department, responsible for risk policiesdevelopment and monitoring.
Credit risk is the risk that a customer or counterparty of the Bank will be unable or unwilling to meet a commitment that it has entered into with the Bank. It arises from lending, trade finance, treasury and otheractivities undertaken by the Bank.
The Bank’s business involves taking on risks in a reasonable manner and managing them professionally. The core functions of the Bank’s risk management are to identify all key risks facing the Bank, measurethese risks, manage the risk positions and determine capital allocations. The Bank regularly reviews its risk management policies and systems to reflect changes in markets, products and best market practice.
Proceeds from the issuance of warrants, net of issue costs, are credited to share warrants account. Share warrants account is non-distributable and will be transferred to share capital and premium accounts uponthe exercise of warrants. Balance of share warrants in relation to the unexercised warrants at the expiry of the warrants period will be transferred to accumulated profits.
The Bank measures financial instruments, such as derivatives, and non-financial assets, such as land and buildings, at fair value at each reporting date. Also, fair values of financial instruments measured atamortised cost are disclosed in note 4.
Fair value is the price that would be received to sell an asset or paid to transfer a liability in an orderly transaction between market participants at the measurement date. The fair value measurement is based onthe presumption that the transaction to sell the asset or transfer the liability takes place either:• In the principal market for the asset or liability, or• In the absence of a principal market, in the most advantageous market for the asset or liability. The principal market or the most advantageous market must be accessible by the Bank.
A fair value measurement of a non-financial asset takes into account a market participant's ability to generate economic benefits by using the asset in its highest and best use or by selling it to another marketparticipant that would use the asset in its highest and best use.
The Bank uses valuation techniques that are appropriate in the circumstances and for which sufficient data are available to measure fair value, maximizing the use of relevant observable inputs and minimizingthe use of unobservable inputs.
All assets and liabilities for which fair value is measured or disclosed in the financial statements are categorized within the fair value hierarchy, described as follows, based on the lowest level input that issignificant to the fair value measurement as a whole: • Level 1 — Quoted (unadjusted) market prices in active markets for identical assets or liabilities• Level 2 — Valuation techniques for which the lowest level input that is significant to the fair value measurement is directly or indirectly observable• Level 3 — Valuation techniques for which the lowest level input that is significant to the fair value measurement is unobservableInformation on the Bank’s fair value hierarchy is provided in note 4.
Held-to-maturity financial investments are non–derivative financial assets with fixed or determinable payments and fixed maturities that the Bank has the intention and ability to hold to maturity. After initialmeasurement, held-to-maturity financial investments are subsequently measured at amortised cost using the EIR less impairment. Amortised cost is calculated by taking into account any discount or premium onacquisition and fees that are an integral part of the EIR. The amortisation is included in interest and similar income in the income statement. The losses arising from impairment of suchinvestments are recognised in the income statement within credit loss expense. If the Bank were to sell or reclassify more than an insignificant amount of held-to-maturity investments before maturity (other thanin certain specific circumstances), the entire category would be tainted and would have to be reclassified as available-for-sale. Furthermore, the Bank would be prohibited from classifying any financial asset asheld-to-maturity during the following two years.
The gross carrying amounts of cash and deposits with banks, loans and advances to customers and derivative financial instruments represent the maximum amount exposed to credit risk.

AFRICAN EXPORT-IMPORT BANK 17NOTES TO THE FINANCIAL STATEMENTSFOR THE YEAR ENDED 31 DECEMBER 2016
3.4 Concentration of credi risk
3.5 Credit risk management
3.6 Impairment and provisioning policies
Bank's rating
Loans & Impairment Loans & Impairment advances (%) allowance(%)
advances (%) allowance(%)
Low risk 44.5 6.1 34.2 9.4 Satisfactory risk 28.2 3.9 31.0 8.5 Fair risk 8.6 1.2 11.5 3.2 Watch list 9.1 1.3 7.7 2.1 Sub-standard risk 7.2 1.0 12.8 4.5 Doubtful and bad 2.4 86.5 2.8 72.3
100 100 100 100
The Bank deals with a variety of major banks and its loans and advances are structured and spread among a number of major industries, customers(dealing with sectors) and geographical areas (comprising group of countries). In addition, the Bank has procedures and policies in place to limit theamount of credit exposure to any counterparty and country. The Bank reviews, on a regular basis, the credit limits of counterparties and countries andtakes action accordingly to ensure that exposure limits are not exceeded.
The Bank assesses the probability of default of customer or counterparty using internal rating scale tailored to the various categories of counterparties.The rating scale has been developed internally and combines data analysis with credit officer judgment and is validated, where appropriate, bycomparison with externally available information. Customers of the Bank are segmented into seven rating classes. The Bank’s rating scale, which isshown below, reflects the range of default probabilities defined for each rating class. This means that, in principle, exposures migrate between classesas the assessment of their probability of default changes. The rating scale is kept under review and upgraded as necessary. The Bank regularlyvalidates the performance of the rating and their predictive power with regard to default events.
Bank’s Internal Ratings Scale
Bank’s rating grade Description of the rating 1 Low risk2 Satisfactory risk3 Fair risk4 Watch list5 Sub-Standard risk6 Doubtful and bad7 Loss
The impairment allowance shown in the statement of financial position is derived from each of the seven internal rating grades. However, theimpairment allowance is composed largely of the sixth grading above. The table below shows the percentage of the Bank’s loans and advances andthe associated impairment allowance for each of the internal rating categories.
2016 2015

AFRICAN EXPORT-IMPORT BANK 18NOTES TO THE FINANCIAL STATEMENTSFOR THE YEAR ENDED 31 DECEMBER 2016
3.6 Impairment and provisioning policies (continued)
3.7 Maximum exposure credit risk before collateral held or other credit enhancements
2016 2015US$000 US$000
Credit risk exposures relating to on-statement of financial position items are as follows:Due from banks 618,770 153,678 Loans and advances to customers 10,315,620 6,167,818 Hedging derivatives 8,792 23,652 Money market placements 650,235 670,342 Accrued income 201,022 143,867
Credit risk exposures relating to off-statement of financial position items are as follows:Letters of credit 245,070 76,312 Guarantees 500,375 437,854 Loan commitments and other credit related liabilities 453,478 236,118
12,993,362 7,909,641
3.8 Concentration risks of loans and advances to customers with credit risk exposure
a) Geographical sectors
2016 2015% US$000 % US$000
West Africa 43.7 4,509,508 48.1 2,969,210 North Africa 42.3 4,364,785 27.4 1,691,137 Regional 1.1 108,396 2.7 163,895 East Africa 4.3 441,939 8.0 492,841 Central Africa 1.3 137,290 1.8 111,238 Southern Africa 7.3 753,702 12.0 739,497 Total (Note 17) 100 10,315,620 100 6,167,818
The internal rating scale assists management to determine whether objective evidence of impairment exists under IAS 39, based on the followingcriteria set out by the Bank:• Delinquency in contractual payments of principal or interest;• Cash flow difficulties experienced by the borrower; • Breach of loan covenants or conditions;• Initiation of bankruptcy proceedings;• Deterioration of the borrower’s competitive position; and• Deterioration in the value of collateral.
The Bank’s policy requires the review of individual financial assets, facilities and commitments at least quarterly or more regularly when individualcircumstances require. Impairment allowances on individually assessed accounts are determined by an evaluation of the impairment at reporting dateon a case-by-case basis, and are applied to all individually significant accounts. The assessment normally encompasses collateral held (including re-confirmation of its enforceability) and the anticipated receipts for that individual account. Further details on key estimates and assumptions used aredetailed in note 6.
The above table represents a worst case scenario of credit risk exposure to the Bank at 31 December 2016 and 31 December 2015, without takingaccount of any collateral held or other credit enhancements attached. For on-statement of financial position assets, the exposures set out above arebased on gross carrying amounts.
The following table breaks down the Bank’s credit exposure at their gross amounts (without taking into account any collateral held or other creditsupport), as categorized by geographical region as at 31 December 2016 and 31 December 2015 of the Bank’s counterparties.

AFRICAN EXPORT-IMPORT BANK 19NOTES TO THE FINANCIAL STATEMENTSFOR THE YEAR ENDED 31 DECEMBER 2016
3.8.1 Concentration risks of loans and advances to customers with credit risk exposure (continued)b) Industry sectors
2016 2015% US$000 % US$000
Agriculture 4.0 412,335 5.7 349,490 Energy 15.8 1,633,969 22.4 1,382,639 Services 2.8 287,965 2.8 172,032 Metals and minerals 1.7 175,851 0.5 30,976 Transportation 3.1 318,696 7.7 475,951 Manufacturing 1.4 146,582 2.6 160,981 Telecommunications 2.7 275,039 4.6 283,321 Financial institutions 68.5 7,065,183 53.7 3,312,428 Total (Note 17) 100 10,315,620 100 6,167,818
3.9 Loans and advances
Loans and advances are summarised as follows:2016 2015
US$000 US$000Neither past due nor impaired 9,745,457 5,887,696 Past due but not impaired 324,953 106,324 Impaired 245,210 173,798 Gross loans and advances (Note 17) 10,315,620 6,167,818 Less: Allowance for impairment (Note 18) (167,418) (106,502) Net loans and advances 10,148,202 6,061,316
Individually impaired 144,372 80,472 Collective impairment 23,045 26,030 Total 167,418 106,502
(a) Loans and advances neither past due nor impaired
2016 2015US$000 US$000
GradeLow risk 4,587,982 2,066,252 Satisfactory risk 2,912,861 1,915,065 Fair risk 869,297 710,396 Watch list 917,851 467,305 Sub-Standard risk 457,466 728,678 Total 9,745,457 5,887,696
The following table breaks down the Bank’s credit exposure at their gross amounts (without taking into account any collateral held or other creditsupport), as categorized by industry sector as at 31 December 2016 and 31 December 2015 of the Bank’s counterparties.
The total impairment charge for loans and advances is US$ 82,747,000 (2015: US$ 63,447,000) of which US$ 85,731,000 (2015: US$ 55,821,000)represents the individually impaired loans and the remaining amount of US$ (2,984,000) (2015: US$ 7,626,000), represents the collectiveimpairment allowance. Further information of the impairment allowance for loans and advances to customers is provided in note 18.
The credit quality of the portfolio of gross amounts of loans and advances that were neither past due nor impaired can be assessed by reference to theinternal rating system adopted by the Bank as follows:

AFRICAN EXPORT-IMPORT BANK 20NOTES TO THE FINANCIAL STATEMENTSFOR THE YEAR ENDED 31 DECEMBER 2016
3.9 Loans and advances (cont'd)(b) Loans and advances past due but not impaired
2016 2015US$000 US$000
Past due up to 30 days 188,255 17,643 Past due 30-60 days 5,182 522 Past due 60-90 days 6,714 621 Past due over 90 days 124,802 87,538 Total 324,953 106,324
Fair value of collateral 714,934 235,516
(c) Loans and advances impaired2016 2015
US$000 US$000Impaired loans 245,210 173,798
Fair value of collateral 159,629 130,827
3.10 Market risk
3.10.1 Interest rate risk
Loans and advances that are past due are not considered impaired, unless other information is available to indicate the contrary. Gross amounts ofloans and advances to customers that were past due but not impaired were as follows:
Upon initial recognition of loans and advances, fair value of the collateral is based on valuation techniques commonly used for the correspondingassets. In subsequent periods, fair value is updated by reference to market prices, if available. There were no collaterals repossessed during the year.The collaterals held against these loans are in the form of cash cover, insurance, bank guarantees, mortgage bonds and charge over assets.
Interest rate movements affect the Bank’s profitability. Exposure to interest rate movements exists because the Bank has assets and liabilities onwhich interest rates either change from time to time (rate sensitive assets and liabilities) or, do not change (rate insensitive assets and liabilities).Exposure to interest rate movements arises when there is a mismatch between the rate sensitive assets and liabilities.
The Bank closely monitors interest rate movements and seeks to limit its exposure by managing the interest rate and maturity structure of assets andliabilities carried on the statement of financial position. Interest rate swaps are also used to manage interest rate risk.
Out of the total of $ 325 million past dues an amount of $ 175 million has been resolved subsequent to year end through an arrangement by a central bank in the affected country to swap the local currency to USD to resolve the foreign currency challenges that the clients were facing to ensure timely repayment.

AFRICAN EXPORT-IMPORT BANK 21NOTES TO THE FINANCIAL STATEMENTSFOR THE YEAR ENDED 31 DECEMBER 2016
3.10.1 Interest rate risk (continued)
As at 31 December 2016 Up to 3 3-6 6-12 Over Non interest 2016months months months 1 year bearing TotalUS$000 US$000 US$000 US$000 US$000 US$000
Financial assetsCash and due from banks 618,770 - - - 75 618,845 Deposits with other banks 650,235 - - - - 650,235 Loans and advances to customers 9,293,445 268,712 313,560 - - 9,875,717 Accrued income - - - - 198,174 198,174 Other assets - - - - 3,069 3,069 Total financial assets 10,562,450 268,712 313,560 - 201,318 11,346,040
Financial liabilitiesDue to banks 1,580,803 410,310 107,811 - - 2,098,924 Debt securities in issue 1,736,000 - - - - 1,736,000 Deposits and customer accounts 148,425 - - - - 148,425 Other liabilities - - - - 71,507 71,507 Total financial liabities 3,465,228 410,310 107,811 - 71,507 4,054,856
Total interest repricing gap 7,097,222 (141,598) 205,749 - - 7,161,374
Cumulative gap 7,097,222 6,955,625 7,161,374 7,161,374
As at 31 December 2015 Up to 3 3-6 6-12 Over Non interest 2015months months months 1 year bearing TotalUS$000 US$000 US$000 US$000 US$000 US$000
Financial assetsCash and due from banks 153,678 - - - 71 153,749 Deposits with other banks 670,342 - - - - 670,342 Loans and advances to customers 1,391,352 1,749,068 559,408 2,165,645 - 5,865,473 Prepayments and accrued income - - - - 140,581 140,581 Other assets - - - - 3,060 3,060 Total financial assets 2,215,372 1,749,068 559,408 2,165,645 143,711 6,833,205
Financial liabilitiesDue to banks 104,207 21,908 463,626 1,272,301 - 1,862,042 Debt securities in issue 1,615,000 - - - - 1,615,000 Deposits and customer accounts 303,112 - - - - 303,112 Other liabilities - - - - 83,583 83,583 Total financial liabities 2,022,319 21,908 463,626 1,272,301 83,583 3,863,737
Total interest repricing gap 193,053 1,727,160 95,782 893,344 - 2,909,339
Cumulative gap 193,053 1,920,214 2,015,995 2,909,339
The table below summarizes the Bank’s exposure to interest rate risks as at 31 December 2016. It includes the Bank’s financial instruments atcarrying amounts (non-derivatives), categorized by the period of contractual re-pricing.

AFRICAN EXPORT-IMPORT BANK 22NOTES TO THE FINANCIAL STATEMENTSFOR THE YEAR ENDED 31 DECEMBER 2016
3.11 Interest rate risk sensitivity analysis
Impact on Impact on Impact on Impact on Carrying profit or loss profit or loss Carrying profit or loss profit or loss
amount and equity and equity amount and equity and equity2016 2016 2016 2015 2015 2015
US$000 US$000 US$000 US$000 US$000 US$000
Changes in interest rates +37bp of US$1R (-)37bp of US$1R +37bp of US$1R (-)37bp of US$1R
Financial assetsCash due from banks 618,845 2,290 (2,290) 153,749 569 (569) Deposits with other banks 650,235 2,406 (2,406) 670,342 2,480 (2,480) Gross loans and advances to customers 9,875,717 36,540 (36,540) 5,865,473 21,702 (21,702) Impact from financial assets 11,144,796 41,236 (41,236) 6,689,564 24,751 (24,751)
Financial liabilitiesDue to banks 2,098,924 (7,766) 7,766 1,862,042 (6,890) 6,890 Debt securities in issue 1,736,000 (6,423) 6,423 1,615,000 (5,976) 5,976 Deposits and customer accounts 148,425 (549) 549 303,112 (1,122) 1,122 Impact from financial liabilities 3,983,349 (14,737) 14,737 3,780,154 (13,987) 13,987
Total increase/(decrease) on profit or loss and equity 7,161,447 26,498 (26,498) 2,909,411 10,764 (10,764)
3.12 Foreign exchange risk exposure
At 31 December 2016, if interest rates at that date had been 37 basis points higher with all other variables held constant, profit and reserves for theyear would have been US$ 26,498,000 (2015: US$ 10,764,000) higher, arising mainly as a result of the higher increase in interest income on loansthan the increase in interest expense on borrowings. If interest rates had been 37 basis points (2015: 37 basis points) lower, with all other variablesheld constant, profit would have been US$ 26,498,000 (2015: US$ 10,764,000) lower, arising mainly as a result of higher decrease in interestincome on loans than the decrease in interest expense on borrowing. The sensitivity is higher in 2016 than in 2015 due to increase in interest ratesensitive assets and liabilities.
The table below summarizes the impact on profit or loss and equity for each category of financial instruments held as at 31 December 2016 andcomparatives. It includes the Bank’s financial instruments at carrying amounts.
The Bank takes on exposure to the effects of fluctuations in the prevailing foreign currency exchange rates on its financial position and cash flows.Foreign exchange risk is managed by the Bank by matching assets and liabilities in respective currencies. The Bank also uses currency derivatives,especially forward foreign exchange contracts to hedge foreign exchange risk. Open currency positions are monitored regularly and appropriatehedging actions taken. Please refer to note 5 for further details on derivative financial instruments.

AFRICAN EXPORT-IMPORT BANK 23NOTES TO THE FINANCIAL STATEMENTSFOR THE YEAR ENDED 31 DECEMBER 2016
3.12 Foreign exchange risk exposure (continued)
Other Euro NGN Currencies Total
As at 31 December 2016 US$000 US$000 US$000 US$000
AssetsCash and due from banks 8,786 1,834 46 10,666 Loans and advances to customers 917,120 - - 917,120 Total financial assets 925,906 1,834 46 927,786
LiabilitiesDue to banks 764,060 - - 764,060 Debt securities in issue - - - - Deposits and customer accounts 16,254 2,685 - 18,939 Hedging derivatives 157,383 - - 157,383 Other liabilities 1,520 - - 1,520 Total financial liabilities 939,217 2,685 - 941,902
Net exposure on statement of financial position (13,311) (850) 46 (14,116)
Credit commitments & financial guarantees 288,342 - - 288,342
Other Euro NGN Currencies Total
As at 31 December 2015 US$000 US$000 US$000 US$000
AssetsCash and due from banks 31,547 4 483 32,034 Loans and advances to customers 752,314 - - 752,314 Total financial assets 783,861 4 483 784,348
LiabilitiesDue to banks 513,168 - - 513,168 Debt securities in issue - - - - Deposits and customer accounts 39,282 - - 39,282 Hedging derivatives 229,018 - - 229,018 Other liabilities 1,338 17 - 1,355 Total financial liabilities 782,806 17 - 782,823
Net exposure on statement of financial position 1,055 (13) 483 1,525
Credit commitments & financial guarantees 9,572 - - 9,572
The table below summarises the Bank exposure to foreign currency exchange rate risk as at 31 December 2016. Included in the table are the Bank’sfinancial instruments at carrying amounts, categorised by currency:
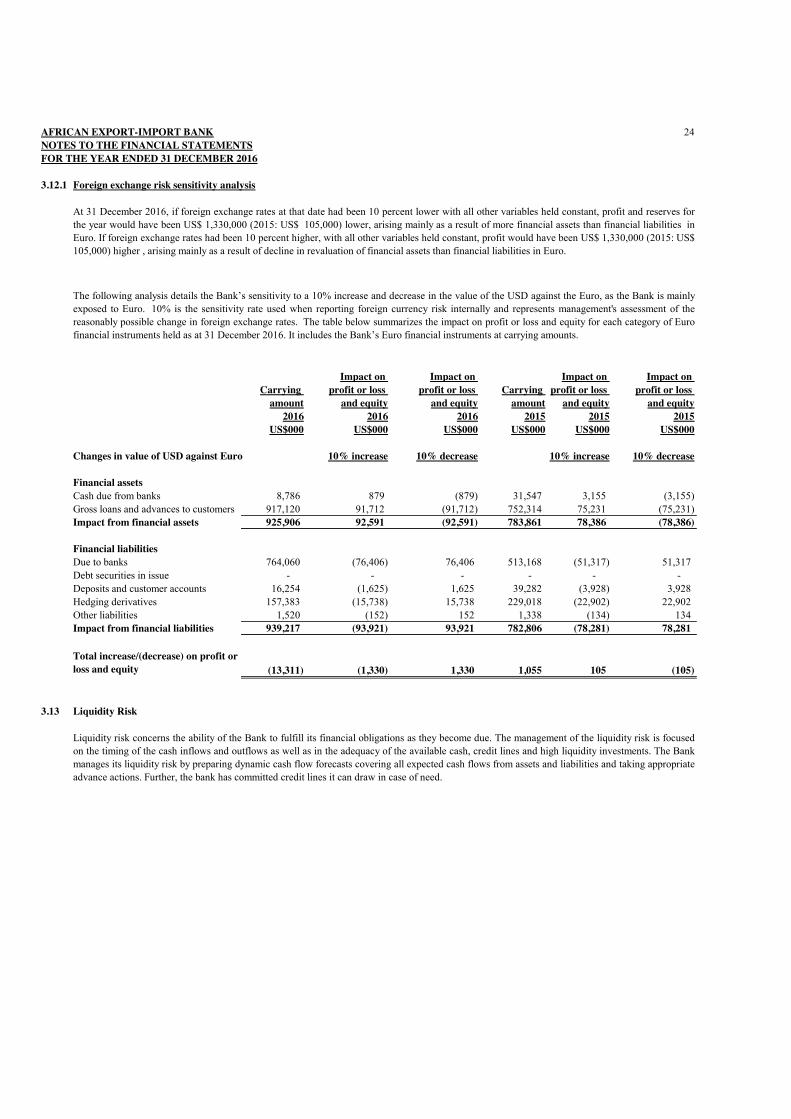
AFRICAN EXPORT-IMPORT BANK 24NOTES TO THE FINANCIAL STATEMENTSFOR THE YEAR ENDED 31 DECEMBER 2016
3.12.1 Foreign exchange risk sensitivity analysis
Impact on Impact on Impact on Impact on Carrying profit or loss profit or loss Carrying profit or loss profit or loss
amount and equity and equity amount and equity and equity2016 2016 2016 2015 2015 2015
US$000 US$000 US$000 US$000 US$000 US$000
Changes in value of USD against Euro 10% increase 10% decrease 10% increase 10% decrease
Financial assetsCash due from banks 8,786 879 (879) 31,547 3,155 (3,155) Gross loans and advances to customers 917,120 91,712 (91,712) 752,314 75,231 (75,231) Impact from financial assets 925,906 92,591 (92,591) 783,861 78,386 (78,386)
Financial liabilitiesDue to banks 764,060 (76,406) 76,406 513,168 (51,317) 51,317 Debt securities in issue - - - - - - Deposits and customer accounts 16,254 (1,625) 1,625 39,282 (3,928) 3,928 Hedging derivatives 157,383 (15,738) 15,738 229,018 (22,902) 22,902 Other liabilities 1,520 (152) 152 1,338 (134) 134 Impact from financial liabilities 939,217 (93,921) 93,921 782,806 (78,281) 78,281
Total increase/(decrease) on profit or loss and equity (13,311) (1,330) 1,330 1,055 105 (105)
3.13 Liquidity Risk
At 31 December 2016, if foreign exchange rates at that date had been 10 percent lower with all other variables held constant, profit and reserves forthe year would have been US$ 1,330,000 (2015: US$ 105,000) lower, arising mainly as a result of more financial assets than financial liabilities inEuro. If foreign exchange rates had been 10 percent higher, with all other variables held constant, profit would have been US$ 1,330,000 (2015: US$105,000) higher , arising mainly as a result of decline in revaluation of financial assets than financial liabilities in Euro.
The following analysis details the Bank’s sensitivity to a 10% increase and decrease in the value of the USD against the Euro, as the Bank is mainlyexposed to Euro. 10% is the sensitivity rate used when reporting foreign currency risk internally and represents management's assessment of thereasonably possible change in foreign exchange rates. The table below summarizes the impact on profit or loss and equity for each category of Eurofinancial instruments held as at 31 December 2016. It includes the Bank’s Euro financial instruments at carrying amounts.
Liquidity risk concerns the ability of the Bank to fulfill its financial obligations as they become due. The management of the liquidity risk is focusedon the timing of the cash inflows and outflows as well as in the adequacy of the available cash, credit lines and high liquidity investments. The Bankmanages its liquidity risk by preparing dynamic cash flow forecasts covering all expected cash flows from assets and liabilities and taking appropriateadvance actions. Further, the bank has committed credit lines it can draw in case of need.

AFRICAN EXPORT-IMPORT BANK 25NOTES TO THE FINANCIAL STATEMENTSFOR THE YEAR ENDED 31 DECEMBER 2016
3.13 Liquidity Risk (continued)
As at 31 December 2016 Up to 1 1-3 3-12 1-5 Over 5 2016month months months years years Total
US$000 US$000 US$000 US$000 US$000 US$000Financial assetsCash and due from banks 618,846 - - - - 618,846 Deposits with other banks 650,235 - - - - 650,235 Hedging derivatives - - 1,320 7,472 - 8,792 Loans and advances 1,292,167 335,401 5,561,745 3,056,551 77,606 10,323,469 Total assets 2,561,248 335,401 5,563,065 3,064,023 77,606 11,601,340
Financial liabilitiesDue to banks 89,694 338,640 1,636,757 1,926,054 228,884 4,220,028 Debt securities in issue - - - 2,125,112 - 2,125,112 Hedging derivatives 1,071 - - 20,947 - 22,018 Deposits and customer accounts 113,616 - 3,163,100 507,167 - 3,783,883 Total liabilities 204,382 338,640 4,799,857 4,579,280 228,884 10,151,041
Net liquidity gap 2,356,867 (3,239) 763,208 (1,515,257) (151,278) 1,450,300
Cumulative liquidity gap 2,356,867 2,353,628 3,116,836 1,601,579 1,450,300
As at 31 December 2015 Up to 1 1-3 3-12 1-5 Over 5 2015month months months years years Total
US$000 US$000 US$000 US$000 US$000 US$000Financial assetsCash and due from banks 153,750 - - - - 153,750 Deposits with other banks 670,342 - - - - 670,342 Hedging derivatives 640 2,297 8,914 11,801 - 23,652 Loans and advances 1,062,960 594,485 2,523,227 2,099,412 170,541 6,450,625 Total assets 1,887,692 596,782 2,532,141 2,111,213 170,541 7,298,369
Financial liabilitiesDue to banks 44,777 199,908 571,087 1,670,965 202,595 2,689,332 Debt securities in issue - 40,189 506,511 1,211,774 - 1,758,474 Hedging derivatives 628 - - - - 628 Deposits and customer accounts 308,144 - 1,000,685 - - 1,308,829 Total liabilities 353,549 240,097 2,078,283 2,882,739 202,595 5,757,263
Net liquidity gap 1,534,143 356,685 453,858 (771,526) (32,054) 1,541,106
Cumulative liquidity gap 1,534,143 1,890,828 2,344,687 1,573,161 1,541,106
The table below analyses the Bank’s financial assets and financial liabilities (including principal and interest) into relevant maturity grouping basedon the remaining period at the reporting date to the contractual maturity date as at 31 December 2016 and the amounts disclosed in the table are thecontractual undiscounted cash flows:

AFRICAN EXPORT-IMPORT BANK 26NOTES TO THE FINANCIAL STATEMENTSFOR THE YEAR ENDED 31 DECEMBER 2016
3.13 Liquidity Risk (continued)
Up to 1 1-3 3-12 1-5 Over 5month months months years years Total
US$000 US$000 US$000 US$000 US$000 US$000As at 31 December 2016Letters of credit - - 77,217 167,853 - 245,070 Financial guarantees 460 197,524 141,551 123,556 37,284 500,375 Total 460 197,524 218,768 291,409 37,284 745,445
As at 31 December 2015Letters of credit 1,529 5,651 6,891 62,241 - 76,312 Financial guarantees 460 - 119,363 280,747 37,284 437,854 Total 1,988 5,651 126,254 342,988 37,284 514,166
3.14 Capital management
The risk-weighted assets is measured by means of a hierarchy of seven risk weights classified according to its nature and reflecting an estimate ofcredit, market and other risks associated with each asset and counterparty. A similar treatment is adopted for off-statement of financial positionexposures.
The table below analyses the contractual expiry by maturity of the Bank’s contingent liabilities. For issued financial guarantees contract, themaximum amount of the guarantee is allocated to the earliest period in which the guarantee could be called.
The Bank’s objectives when managing capital, which is a broader concept than the equity on the face of statement of financial position, are:• To maintain a set minimum ratio of total capital to total risk weighted assets. The Bank’s minimum risk asset ratio is at least three per cent aboveminimum ratio prescribed from time to time by the Basel Committee on Banking Supervision;• To safeguard the Bank’s ability to continue as a going concern so that it can continue to provide returns to shareholders and benefits to otherstakeholders; and• To maintain a strong capital position necessary for its long term financial health, and to support the development of its business.
The Bank is not subject to capital requirements by a regulatory body such as a central bank or equivalent. However, management has established acapital management policy that is based on maintenance of certain capital adequacy ratio in line with Basel Committee requirements.
Capital adequacy is reviewed regularly by management using techniques based on the guidelines developed by Basel Committee.With effect from 1 January 2009, the Bank is complying with the provisions of the Basel II framework in respect of capital.

AFRICAN EXPORT-IMPORT BANK 27NOTES TO THE FINANCIAL STATEMENTSFOR THE YEAR ENDED 31 DECEMBER 2016
3.14 Capital management (continued)
2016 2015US$000 US$000
Capital adequacyShare capital 378,488 307,152 Share premium 355,310 203,861 Warrants 98,716 46,316 General reserves 366,282 302,744 Retained earnings 429,448 355,147 Total Tier 1 capital 1,628,244 1,215,220
Asset revaluation reserve 5,220 14,345 Collective impairment allowance 23,045 26,030 Total Tier 2 capital 28,265 40,375
Total capital base 1,656,509 1,255,595
Risk weighted assetsOn-statement of financial position 6,291,657 4,043,232 Off-statement of financial position 988,566 785,855 Total risk weighted assets 7,280,223 4,829,087
Basel capital adequacy ratio (Total capital base/Total risk weighted assets) 23% 26%
The table below summarizes the composition of capital and the ratio of the Bank’s capital for the year ended 31 December.
The increase of the capital in 2016 is primarily due to increase in profits and share capital subscriptions. The increase of risk weighted assets arisesmainly from the growth in guarantees value.

AFRICAN EXPORT-IMPORT BANK 28NOTES TO THE FINANCIAL STATEMENTSFOR THE YEAR ENDED 31 DECEMBER 2016
4 FAIR VALUE OF FINANCIAL ASSETS AND LIABILITIES
(a) Financial instruments not measured at fair value
2016 2015 2016 2015US$000 US$000 US$000 US$000
Financial assetsLoans and advances 10,148,202 6,061,316 10,327,704 6,172,646
Financial liabilitiesDue to banks 4,050,912 2,678,765 4,240,870 2,789,821 Debt securities in issue (gross) 2,100,000 1,740,000 2,132,246 1,746,354
(b) Financial instruments measured at fair value are disclosed in note 5.
Fair value hierarchy
Level 2 2016 2015US$000 US$000
AssetsInterest rate swap 7,472 19,611 Foreign exchange forward contracts 1,320 4,041
8,792 23,652 LiabilitiesInterest rate swap (20,947) - Foreign exchange forward contracts (1,071) (628)
(22,018) (628) (13,226) 23,024
Fair value is the price that would be received to sell an asset or paid to transfer a liability in an ordinary transaction between marketparticipants at the measurement date. The fair values of financial instruments not recognized on the statement of financial position are thesame figures appearing as contingent liabilities and commitments (see note 7).
The table below summarizes the carrying amounts and fair values of those financial assets and liabilities not presented on the Bank’s statement of financial position at their fair value:
Carrying amount Fair value
• Loans and advancesLoans and advances are net of charges for impairment. The estimated fair value of loans and advances represents the discounted amount ofestimated future cash flows expected to be received. Expected cash flows are discounted at current market rates to determine fair value.
IFRS 13 specifies a hierarchy of valuation techniques based on whether the inputs to those valuation techniques are observable orunobservable. Observable inputs reflect market data obtained from independent sources; unobservable inputs reflect the Bank’s marketassumptions. These two types of inputs have created the following fair value hierarchy:
• Level 1 – Quoted prices (unadjusted) in active markets for identical assets or liabilities. This level includes listed equity securities and debtinstruments on exchanges (for example, London Stock Exchange, Frankfurt Stock Exchange, New York Stock Exchange) and exchangetraded derivatives like futures (for example, Nasdaq, S&P 500).
• Level 2 – Inputs other than quoted prices included within Level 1 that are observable for the asset or liability, either directly (that is, asprices) or indirectly (that is, derived from prices). This level includes the majority of the OTC derivative contracts, traded loans and issuedstructured debt. The source of input parameters like LIBOR yield curve or counterparty credit risk is Bloomberg.
• Level 3 – Inputs for the asset or liability that are not based on observable market data. This level includes equity investments and debtinstruments with significant unobservable components. This hierarchy requires the use of observable market data when available. The Bankconsiders relevant and observable market prices in its valuations where possible.
(i) The table below shows the fair values of financial assets and liabilities measured at fair value at year-end.
• Financial LiabilitiesThe estimated fair value of due to banks and debt securities in issue represents the discounted amount of estimated future cash flows expectedto be paid. Expected cash outflows are discounted at current market rates to determine fair value.

AFRICAN EXPORT-IMPORT BANK 29NOTES TO THE FINANCIAL STATEMENTSFOR THE YEAR ENDED 31 DECEMBER 2016
4 FAIR VALUE OF FINANCIAL ASSETS AND LIABILITIES (CONTINUED)
Level 3 2016 2015US$000 US$000
Revalued property and equipmentLand and building 21,193 42,237
Level 2 2016 2015US$000 US$000
Financial assetsLoans and advances 10,327,704 6,172,646
Financial liabilitiesDue to banks 4,240,870 3,795,009 Debt securities in issue (gross) 2,132,246 1,746,354
6,373,116 5,541,363
Revalued property and equipment
2016 2015US$000 US$000
Valuation as at 1 January 42,237 41,717 Addition in the year 156 535 Total (loss) / gain recorded in other comprehensive income (18,650) 2,288 Accumulated depreciation eliminated on revaluation (2,550) (2,303) Valuation as at 31 December 21,193 42,237
Impact on fair value of level 3 non financial assets due to changes in key assumptions
Carrying amount
Effect of 10% change in
annual market rentals Carrying amount
Effect of 10% change in annual
market rentalsUS$000 US$000 US$000 US$000
Property and equipment 21,193 2,119 42,237 4,224
(iv) Movements in level 3 non financial assets measured at fair value
The following table shows a reconciliation of the opening and closing amounts of level 3 non-financial assets which are recorded at fair value:
Land and building
The following methods and assumptions were used to estimate the fair values:
• The Bank enters into derivative financial instruments with various counterparties, principally financial institutions with investment grade credit ratings. Derivatives valued using valuation techniques with market observable inputs are mainly interest rate swaps and foreign exchange forward contracts. The most frequently applied valuation techniques include forward pricing and swap models, using present value calculations. The models incorporate various inputs including the credit quality of counterparties, foreign exchange spot and forward rates, interest rate curves and forward rate curves. The changes in counterparty credit risk had no material effect on the hedge effectiveness assessment for derivatives designated in hedge relationships and other financial instruments recognized at fair value.
• Fair values of the Bank’s debt securities in issue and loans and advances are as disclosed in Note 4(a).• Methods and assumptions used in the valuation of land and building are detailed in Note 6.
The significant unobservable valuation input used in obtaining the value of the land and building was annual market rentals of similar properties. The table below shows the impact on the fair value of the land and building assuming that the annual market rentals increase or decrease by 10%. The positive and negative effects are approximately the same.
31-Dec-16 31-Dec-15
(iii) The table below shows the assets and liabilities for which fair values are disclosed.
(ii) The table below shows the fair values of non-financial assets measured at fair value at year-end.
Total gains or losses for the period are included in profit or loss as well as total gains relating financial instruments designated at fair valuedepending on the category of the related asset/ liability.

AFRICAN EXPORT-IMPORT BANK 30 NOTES TO THE FINANCIAL STATEMENTSFOR THE YEAR ENDED 31 DECEMBER 2016
5 DERIVATIVE FINANCIAL INSTRUMENTS
2016 2015US$000 US$000
AssetsDerivatives used as cash flow hedgesInterest rate swap 7,472 19,611 Derivatives used as fair value hedgesForeign exchange forward contracts 1,320 4,041
8,792 23,652 LiabilitiesDerivatives used as cashflow hedgesInterest rate swap (20,947) - Derivatives used as fair value hedgesForeign exchange forward contracts (1,071) (628)
(22,018) (628)
Interest rate derivative contracts2016 2015
US$000 US$000
Interest rate swap 1,675,000 1,575,000
2016 2015US$000 US$000
AssetsUp to one year - 7,814 One to five years 7,472 11,797
7,472 19,611 LiabilitiesUp to one year - - One to five years (20,947) -
(20,947) -
The time periods in which the discounted hedged cash flows are expected to occur and affect profit or loss are as follows:
No net gain or (loss) on cashflow hedges was reclassified to profit or loss during the year.
The Bank enters into interest rate swaps and foreign exchange forward contracts to hedge its exposure to changes in the fair value and cashflows attributable to changes in market interest and exchange rates on its assets and liabilities.
The table below shows the fair values of derivative financial instruments, recorded as assets or liabilities at year-end.
Swaps are contractual agreements between two parties to exchange streams of payments over time based on specified notional amounts, inrelation to movements in a specified underlying index such as interest rates, foreign currency rate or equity index.
Interest rate swaps relate to contracts taken out by the Bank with other financial institutions in which the Bank either receives or pays afloating rate of interest in return for paying or receiving, respectively, a fixed rate of interest. The payment flows are usually netted againsteach other, with the difference being paid by one party to the other.
In a foreign exchange swap, the Bank pays a specified amount in one currency and receives a specified amount in another currency. Foreignexchange swaps are settled gross.
The following shows the notional value of interest rate derivative contracts that the Bank held at 31 December:
The Bank entered into interest rate swap to hedge US$ 1,675 million (2015: US$ 1,575 million) received from the debt securities issued inJune 2013 and July 2014 and May 2016 with fixed interest rates. The swap exchanged fixed rate for floating rate on funding to matchfloating rates received on assets. In this respect a cash flow hedge loss (prior year gain) of US$ 33,087,000 (2015: US$ 6,600,000 ) aroseon the hedging instruments during the year.
AFRICAN EXPORT-IMPORT BANK 31 NOTES TO THE FINANCIAL STATEMENTSFOR THE YEAR ENDED 31 DECEMBER 2016
6 CRITICAL ACCOUNTING ESTIMATES AND JUDGEMENTS IN APPLYING ACCOUNTING POLICIES
The preparation of financial statements involves management estimates and assumptions that may affect the reported amounts of assets andliabilities within the next financial year. Estimates and judgments are continually evaluated based on historical experience and other factors,including expectations of future events that are believed to be reasonable under the circumstances.
The Bank reviews its loan portfolio regularly to assess whether a provision for impairment should be recorded in profit or loss. In particular,considerable judgment by management is required in the estimation of the amount and timing of future cash flows when determining the levelof provisions required. Such estimates are necessarily subjective based on assumptions about several factors involving varying degrees ofjudgment and uncertainty. Consequently, actual results may differ resulting in future changes to such provisions. Further details on thecarrying amount of loans and advances are set out in note 17. The key assumptions and estimates used are provided in note 2.8 and 3.6.
The fair value of financial instruments where no active market exists or where quoted prices are not otherwise available are determined byusing valuation techniques. In these cases, the fair values are estimated from observable data in respect of similar financial instruments. Wheremarket observable inputs are not available, they are estimated based on appropriate assumptions. Refer to note 4 for further information onfair value of financial assets and liabilities.
The Bank measures land and buildings at revalued amounts with changes in fair value being recognized in Other Comprehensive Income. TheBank engaged an independent valuation specialist to assess fair value as at 31 December 2016. Land and buildings were valued by referenceto market-based evidence, using comparable prices adjusted for specific market factors such as nature, location and condition of the property.The carrying amount at the reporting date is as set out in note 24.
Impairment exists when the carrying amount of an asset exceeds its recoverable amount. The recoverable amount is the greater of fair valueless costs of disposal and value in use. In assessing value in use, the estimated future cash flows are discounted to their present value using adiscount rate that reflects current market assessments of the time value of money and the risks specific to the asset. Impairment losses arerecognized in profit or loss. Refer to note 2.14 for further information.
(a) Impairment losses on loans and advances
(b) Fair value of financial instruments
(c) Revaluation of property, plant and equipment
(d) Impairment of non-financial assets
(e) Property, plant and equipment
Critical estimates are made by the Bank in determining depreciation rates for property and equipment. The rates used are set out in accounting policy (note 2.9) above. The assets residual values, useful lives and methods of depreciation are reviewed at each reporting date, and adjustedprospectively if appropriate. The carrying amount at the reporting date is as set out in note 24.

AFRICAN EXPORT-IMPORT BANKNOTES TO THE FINANCIAL STATEMENTS 32FOR THE YEAR ENDED 31 DECEMBER 2016
7 CONTINGENT LIABILITIES AND COMMITMENTS AND LEASE ARRANGEMENTS
7.1.1 Contingent liabilities2016 2015
US$000 US$000Letters of credit 245,070 76,312 Guarantees 500,375 437,854
745,445 514,166
7.1.2 Commitments
Credit lines and other commitments to lend
2016 2015US$000 US$000
Less than one year 333,010 90,092 More than one year 120,468 146,026
453,478 236,118
7.2 Lease arrangements
7.2.1 Operating lease commitments-Bank as lessee
2016 2015US$000 US$000
Less than one year 1,054 227 After one year but not later than five years - 8
1,054 235
7.2.2 Operating lease commitments-Bank as lessor
2016 2015US$000 US$000
Less than one year 210 1,650 After one year but not later than five years 151 -
361 1,650
The Bank has entered into operating lease agreements for leasing of office space on its building. These leases have an average life of betweentwo and five years, with renewal option included in the contracts. Where the Bank is the lessor, the future minimum lease payments under non-cancellable operating leases are as follows:
The credit risk associated with these transactions is considered minimal because the Bank receives letter of credit from sound parties. To limitcredit risk, the Bank deals exclusively with creditworthy counterparties.
The contractual amounts of the Bank’s commitments not recognized on the statement of financial position as at 31 December are indicatedbelow.
Included in administrative expenses is minimum lease payments recognised as an operating lease expense amounting to US$213,000 (2015 :US$220,000)
The Bank has entered into operating lease agreements for leasing of office premises. These leases have an average life of between two andfive years, with renewal option included in the contracts. Where the Bank is the lessee, the future minimum lease payments under non-cancellable operating leases are as follows:

AFRICAN EXPORT-IMPORT BANK 33NOTES TO THE FINANCIAL STATEMENTSFOR THE YEAR ENDED 31 DECEMBER 2016
8 INTEREST AND SIMILAR INCOME
2016 2015US$000 US$000
Loans and advances 468,960 328,481 Interest on derivative contracts 10,439 41,162 Interest on money market investments 4,613 1,926
484,012 371,569
9 INTEREST AND SIMILAR EXPENSE2016 2015
US$000 US$000
Due to banks 87,540 61,536 Debt securities in issue 91,936 110,517 Shareholder and customer deposits 31,282 738
210,758 172,791
10 FEES AND COMMISSION INCOME2016 2015
US$000 US$000Advisory fees 26,822 27,288 Commission on L/Cs 2,833 955 Guarantee fees 6,629 4,730 Structuring Fees 6 1,523
36,290 34,496
11 FEES AND COMMISSION EXPENSE2016 2015
US$000 US$000Bond issue fees 1,951 1,808 Legal and agency fees 1,064 828 Other fees paid 2,840 2,058
5,855 4,694
12 OTHER OPERATING INCOME2016 2015
US$000 US$000Rental income 1,135 1,175 Other income 540 1,651
1,675 2,828
13 PERSONNEL EXPENSESPersonnel expenses are made up as follows:
2016 2015US$000 US$000
Wages and salaries 20,136 15,233 Staff provident fund costs (Note 2.10) 1,863 1,521 Other employee benefits 9,978 9,382
31,977 26,136
Interest income accrued on impaired financial assets is US$ 568,279 (2015: US$7,606,260).

AFRICAN EXPORT-IMPORT BANK 34NOTES TO THE FINANCIAL STATEMENTSFOR THE YEAR ENDED 31 DECEMBER 2016
14 GENERAL AND ADMINISTRATIVE EXPENSEGeneral and administrative expenses are made up as follows:
2016 2015US$000 US$000
Operational missions and statutory meetings 7,667 5,072 Professional service fees 4,354 3,198 Communications 2,019 2,785 Office rent 213 220 Other general and administrative expenses 5,072 6,652
19,325 17,927 Professional services fees include US$ 100,000 (2015: US$97,000) in respect of external auditors' fees.
15 EARNINGS PER SHARE
2016 2015US$000 US$000
Net income attributable to equity holders of the bank 165,034 125,317
Weighted average number of ordinary shares in issue 89,173 62,002
Basic and diluted earnings per share (expressed in US$000 per share) 1.85 2.02
16 CASH AND DUE FROM BANKS2016 2015
US$000 US$000Cash in hand 75 72 Due from banks 618,770 153,678 Money market placements 650,235 670,342
1,269,080 824,092
17 LOANS AND ADVANCES TO CUSTOMERS2016 2015
US$000 US$000Loans and advances to customers 10,315,620 6,167,818 Less:Allowance for impairment (note 18.1) (167,418) (106,502) Net loans and advances 10,148,202 6,061,316
Current 7,189,313 4,180,672 Non-current 2,958,889 1,880,644
10,148,202 6,061,316
Diluted earnings per share are the same as basic earnings per share as the warrants which are dilutive potential ordinary shares were issued asat 31 December 2016, thus had no impact.
Earnings per share are calculated by dividing the net income attributable to equity holders of the Bank by the weighted average number of ordinary shares in issue during the year.
Net income attributable to equity holders of the Bank have been calculated on the basis of assuming that all the net income for the year is distributed.

AFRICAN EXPORT-IMPORT BANK 35NOTES TO THE FINANCIAL STATEMENTSFOR THE YEAR ENDED 31 DECEMBER 2016
18 ALLOWANCE FOR IMPAIRMENT ON LOANS AND ADVANCES AND PROVISIONS
18.1 Allowance for impairment on loans and advances
Reconciliation of allowance for impairment of loans and advances is as follows:
(a) Statement of Financial Position2016 2015
US$000 US$000Balance as at 1 January 106,502 43,352 Impairment charge for the year (note 18.1b) 82,747 63,447 Revaluation effect of provisions of loans in EURO (1,635) - Loans written off during the year as uncollectible (20,196) (297) Balance as at 31 December (note 17) 167,418 106,502
(b) Statement of Comprehensive Income
Individual impairment charge for the year 85,731 55,821 Collective impairment charge for the year (2,984) 7,626
82,747 63,447
18.2 Provisions
Reconciliation of provisions is as follows :
(a) Statement of Financial Position2016 2015
US$000 US$000
Balance as at 1 January 9,003 2,933 Impairment charge for the year (note 18.2b) 3,922 6,070 Written-off during the year (2,988) - Balance as at 31 December 9,937 9,003
(b) Statement of Comprehensive IncomeProvision on other assets 1,074 2,187 Provision on accrued income 2,542 3,286 Provision for leave pay 306 597
3,922 6,070
19 PREPAYMENTS AND ACCRUED INCOME2016 2015
US$000 US$000Accrued income 201,022 143,867 Other prepayments 43,240 34,895 Less: Provision on accrued income (2,848) (3,286)
241,414 175,476
20 OTHER ASSETS2016 2015
US$000 US$000Other receivables 4,240 3,449 Sundry debtors 4,404 4,112 Less: Provision on other assets (5,575) (4,501)
3,069 3,060
Other receivables above mainly relate to taxes recoverable from some member countries arising from payment of invoices inclusive of tax. In accordance with Article XIV of the agreement for Establishment of African Export Import Bank, the Bank is exempt from all taxation and custom duties (note 35).
Accrued income relates to interest, fees and commisions receivable. Other prepayments include fees and commissions on borrowings, prepaid rent and insurance expenses.
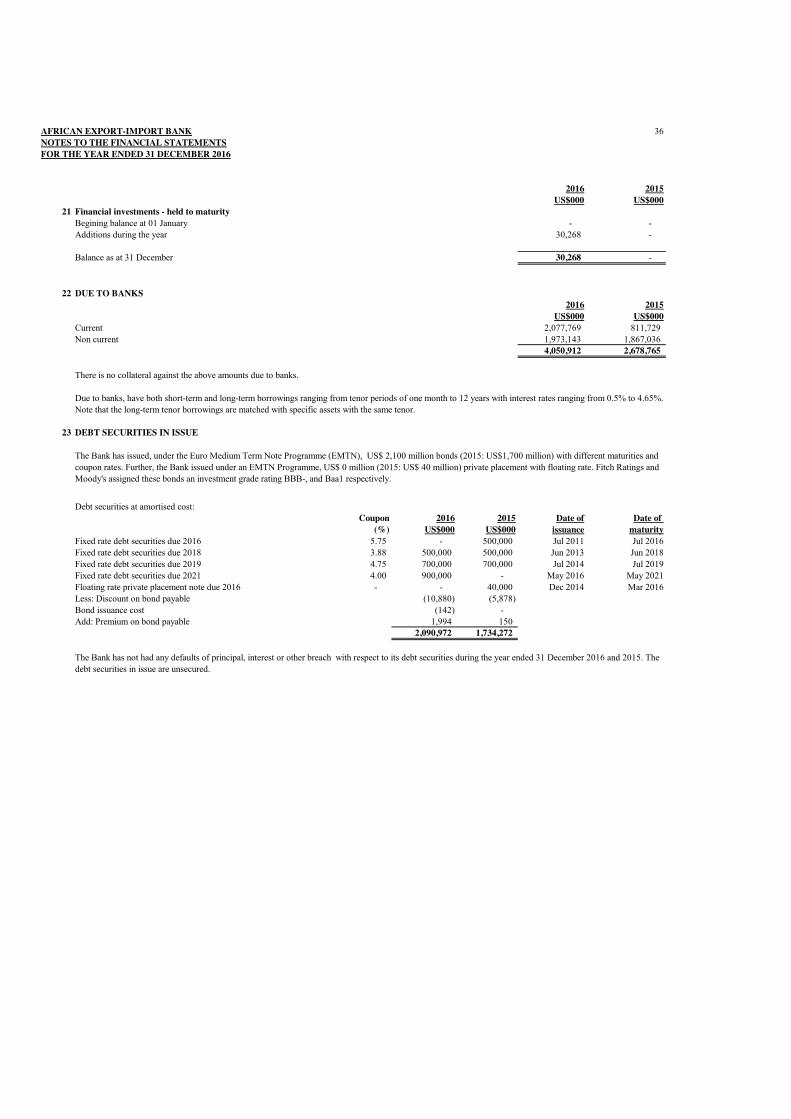
AFRICAN EXPORT-IMPORT BANK 36NOTES TO THE FINANCIAL STATEMENTSFOR THE YEAR ENDED 31 DECEMBER 2016
2016 2015US$000 US$000
21 Financial investments - held to maturityBegining balance at 01 January - - Additions during the year 30,268 -
Balance as at 31 December 30,268 -
22 DUE TO BANKS2016 2015
US$000 US$000Current 2,077,769 811,729 Non current 1,973,143 1,867,036
4,050,912 2,678,765
There is no collateral against the above amounts due to banks.
23 DEBT SECURITIES IN ISSUE
Debt securities at amortised cost:Coupon 2016 2015 Date of Date of
(%) US$000 US$000 issuance maturityFixed rate debt securities due 2016 5.75 - 500,000 Jul 2011 Jul 2016Fixed rate debt securities due 2018 3.88 500,000 500,000 Jun 2013 Jun 2018Fixed rate debt securities due 2019 4.75 700,000 700,000 Jul 2014 Jul 2019Fixed rate debt securities due 2021 4.00 900,000 - May 2016 May 2021Floating rate private placement note due 2016 - - 40,000 Dec 2014 Mar 2016Less: Discount on bond payable (10,880) (5,878) Bond issuance cost (142) - Add: Premium on bond payable 1,994 150
2,090,972 1,734,272
The Bank has issued, under the Euro Medium Term Note Programme (EMTN), US$ 2,100 million bonds (2015: US$1,700 million) with different maturities and coupon rates. Further, the Bank issued under an EMTN Programme, US$ 0 million (2015: US$ 40 million) private placement with floating rate. Fitch Ratings and Moody's assigned these bonds an investment grade rating BBB-, and Baa1 respectively.
The Bank has not had any defaults of principal, interest or other breach with respect to its debt securities during the year ended 31 December 2016 and 2015. The debt securities in issue are unsecured.
Due to banks, have both short-term and long-term borrowings ranging from tenor periods of one month to 12 years with interest rates ranging from 0.5% to 4.65%. Note that the long-term tenor borrowings are matched with specific assets with the same tenor.

AFRICAN EXPORT-IMPORT BANK 37NOTES TO THE FINANCIAL STATEMENTSFOR THE YEAR ENDED 31 DECEMBER 2016
24 PROPERTY AND EQUIPMENT
The table below analyses the details of the Bank's property and equipment.
Land Building Motor Furniture Leasehold Assets TotalVehicles and improvements under
equipment constructionUS$000 US$000 US$000 US$000 US$000 US$000 US$000
YEAR ENDED 31 DECEMBER 2016COSTCost/valuation as at 1 January 2016 13,410 28,827 307 11,048 1,034 11 54,637 Additions - 132 485 1,298 - 557 2,472 Capitalisation of assets under construction - 24 - - (24) - Disposals - - (73) (407) - - (480) Revaluation (6,768) (11,882) - - - - (18,650) Transfer* - (2,550) - - - - (2,550) Cost/valuation as at 31 December 2016 6,642 14,551 719 11,939 1,034 544 35,429
ACCUMULATED DEPRECIATIONAccumulated depreciation as at 1 January 2016 - - (218) (7,466) (1,012) - (8,696) Charge for the year - (2,550) (82) (1,841) (10) - (4,483) Disposals - - 73 407 - - 480 Transfer* - 2,550 - - - - 2,550 Total accumulated depreciation as at 31 December 2016 - - (227) (8,900) (1,022) - (10,149)
Net carrying amount as at 31 December 2016 6,642 14,551 493 3,039 12 544 25,280
During the year 2016 the bank did not enter in to any contracts that would lead to capital commitments exposure.
*Transfers relates to the accumulated depreciation as at the revaluation date that was eliminated against the gross carrying amount of the revalued asset.
The fair value of the building and the land which reflects market conditions at the reporting date was US$ 14,551,000 (2015: US$ US$ 28,827,000) and US$ 6,642,000 (2015: US$ 13,410,000) respectively. The fair value was determined using an independent valuer on 31 December 2016.The valuer used was Real Estate Investment House who has experience in similar projects. The net carrying amount of the Headquarters' land and building would have been US$ 34,000 (2015:US$ 34,000) and US$ 9,562,000 (2015:US$ 10,328,000) respectively if both classes had not been revalued.
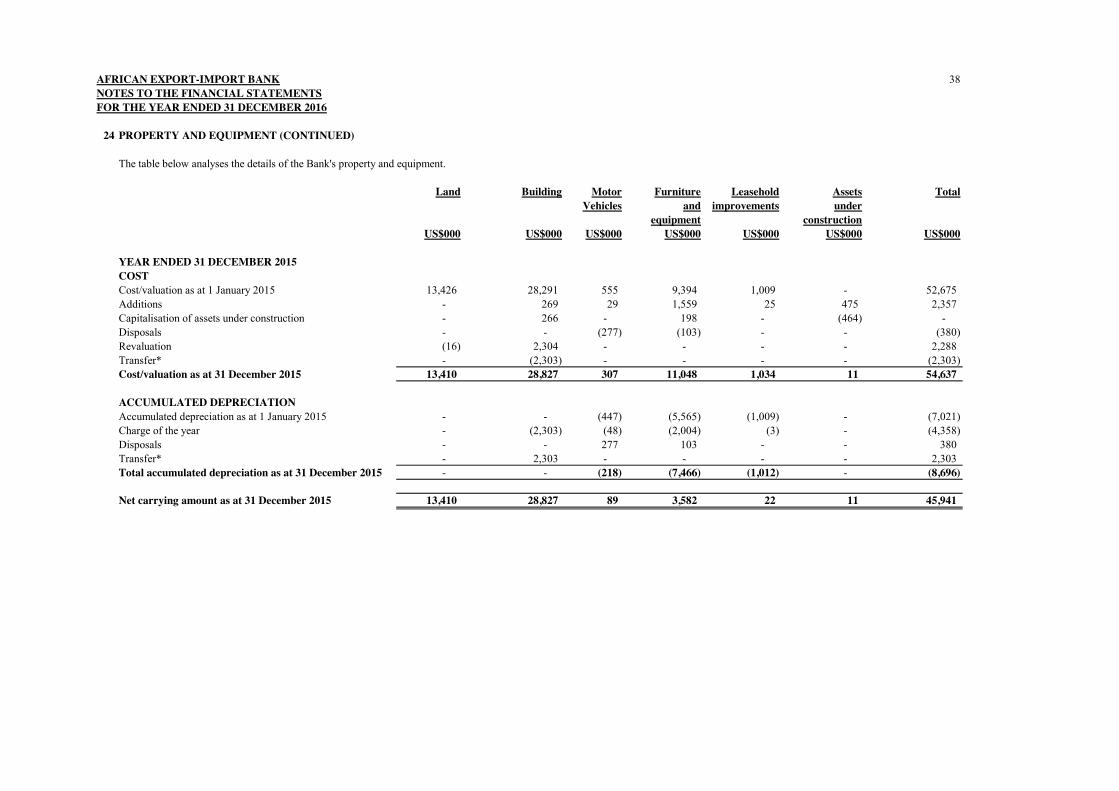
AFRICAN EXPORT-IMPORT BANK 38NOTES TO THE FINANCIAL STATEMENTSFOR THE YEAR ENDED 31 DECEMBER 2016
24 PROPERTY AND EQUIPMENT (CONTINUED)
The table below analyses the details of the Bank's property and equipment.
Land Building Motor Furniture Leasehold Assets TotalVehicles and improvements under
equipment constructionUS$000 US$000 US$000 US$000 US$000 US$000 US$000
YEAR ENDED 31 DECEMBER 2015COSTCost/valuation as at 1 January 2015 13,426 28,291 555 9,394 1,009 - 52,675 Additions - 269 29 1,559 25 475 2,357 Capitalisation of assets under construction - 266 - 198 - (464) - Disposals - - (277) (103) - - (380) Revaluation (16) 2,304 - - - - 2,288 Transfer* - (2,303) - - - - (2,303) Cost/valuation as at 31 December 2015 13,410 28,827 307 11,048 1,034 11 54,637
ACCUMULATED DEPRECIATIONAccumulated depreciation as at 1 January 2015 - - (447) (5,565) (1,009) - (7,021) Charge of the year - (2,303) (48) (2,004) (3) - (4,358) Disposals - - 277 103 - - 380 Transfer* - 2,303 - - - - 2,303 Total accumulated depreciation as at 31 December 2015 - - (218) (7,466) (1,012) - (8,696)
Net carrying amount as at 31 December 2015 13,410 28,827 89 3,582 22 11 45,941

AFRICAN EXPORT-IMPORT BANK 39NOTES TO THE FINANCIAL STATEMENTSFOR THE YEAR ENDED 31 DECEMBER 2016
25 DEPOSITS AND CUSTOMER ACCOUNTS2016 2015
US$000 US$000Shareholders' deposits for shares 8,866 8,515 Deposit accounts 25,942 49,060 Customer accounts 3,743,685 1,250,568
3,778,493 1,308,143
26 OTHER LIABILITIES2016 2015
US$000 US$000Prepaid and unearned income 63,899 38,757 Dividends payable 13,600 23,612 Deposits from tenants 423 423 Accrued expenses 57,907 59,971 Sundry creditors 14,808 16,199 Legal fees deposits 6,705 6,058
157,342 145,020
27 SHARE CAPITAL
2016 2015US$000 US$000
Authorised capital500,000 ordinary shares of US$10,000 each 5,000,000 5,000,000
Paid in share capitalPaid in capital -class A 240,416 180,224 Paid in capital -class B 98,976 88,072 Paid in capital -class C 39,096 38,856
378,488 307,152
The movement in paid up share capital is summarised as follows:
2016 2016 2015 2015No of shares US$000 No of shares US$000
At 1 January 76,788 307,152 46,393 185,572 Paid up from dividends during the year 1,420 5,680 62 156 Additional shares arising from discount offered retrospectively (Note 28.1) - - 1,121 11,428 Paid up in cash during the year 16,414 65,656 29,212 109,996 At 31 December 94,622 378,488 76,788 307,152
The share capital of the bank is divided into four classes of which A,B and C classes are payable in five equal instalments, of which the first two installments have been called up. Class D shares are fully paid at time of subscription. Shareholders can use their dividend entitlement to acquire more shares.
Class A are shares which may only be issued to (a) African states, either directly or indirectly through their central banks or other designated institutions, (b) the African Development Bank, and ( c ) African regional and sub regional institutions;
Class B are shares which may only be issued to African public and private commercial banks, financial institutions and African public and private investors; and
Class C are shares which may only be issued to (a) international financial institutions and economic organisations; (b) non African or foreign owned banks and financial institutions; and non African public and private investors.
Class D are shares which may be issued in the name of any person.
Shareholders rights are the same for all classes from the perspective of voting rights. Dividends are shared prorata according to number of shares subscribed.
In terms of customer group, the deposits and customer accounts above were from sovereigns, enterprises and financial institutions.The fair value of the deposits of customer accounts approximate the carrying amount, as they have variable interest rates.
As at 31 December 2016, the authorised capital comprised 500,000 (2015: 500,000 ) ordinary shares. The number of shares issued but not fully paid as at 31 December 2016 was 94,622 (2015: 76,788). The par value per share is US$10,000.

AFRICAN EXPORT-IMPORT BANK 40NOTES TO THE FINANCIAL STATEMENTSFOR THE YEAR ENDED 31 DECEMBER 2016
28 SHARE PREMIUMPremiums from the issue of shares are reported in the share premium accountThe movement in share premium account is summarised as follows:
2016 2016 2015 2015No of shares US$000 No of shares US$000
At 1 January 76,788 203,861 46,393 56,847 Paid up from dividends during the year 1,420 12,901 62 481 Additional shares arising from discount offered in retrospectively (see Note 28.1) - - 1,121 13,861 Paid up in cash during the year 16,414 138,548 29,212 132,672 At 31 December 94,622 355,310 76,788 203,861
28.1
29 RESERVES
General Reserves
Asset revaluation
ReserveCashflow hedge
Reserve TotalUS$000 US$000 US$000 US$000
Balance as at 1 January 2015 254,497 31,070 13,011 298,578 Revaluation of land - (16) - (16) Revaluation of building - 2,304 - 2,304 Depreciation transfer : buildings - (1,480) - (1,480) Transfer to cashflow hedge reserve - - 6,600 6,600 Transfer from retained earnings (note 30) 48,247 - - 48,247 Balance as at 31 December 2015 302,744 31,878 19,611 354,233
Balance as at 1 January 2016 302,744 31,878 19,611 354,233 Revaluation of land - (6,768) - (6,768) Revaluation of building - (11,882) - (11,882) Depreciation transfer : buildings - (1,628) - (1,628) Transfer to cashflow hedge reserve - - (33,087) (33,087) Transfer from retained earnings (note 30) 63,538 - - 63,538 Balance as at 31 December 2016 366,282 11,600 (13,476) 364,406
The asset revaluation and cashflow hedge reserves are restricted from distribution to the shareholders.
Nature and purpose of reserves
a. General reserve
b. Asset revaluation reserve
c. Cash flow hedge reserve
The cash flow hedge reserve represents the cumulative effective portion of gains or losses arising from changes in fair value of hedging instruments entered into for cash flow hedges. The cumulative gain or loss arising on changes in fair value of the hedging instruments that are recognised and accumulated under the heading of cash flow hedge reserve will be reclassified to profit or loss only when the hedged transaction affects the profit or loss, or included as a basis adjustment to the non-financial hedged item, consistent with the relevant accounting policy.
The general reserve is set up in accordance with Article 31 of the Bank's Charter in order to cover general banking risks, including future losses and other unforeseeable risks or contingencies. Each year the Bank transfers 50% of profit after deduction of dividends to general reserves.
The revaluation reserve is used to record increases in the fair value of land and building and decreases to the extent that such decrease relates to an increase on the same asset previously recognised in equity. An annual transfer from the asset revaluation reserve to retained earnings is made for the difference between depreciation based on the revalued amount of the asset and depreciation based on the asset original cost. When revalued assets are sold, the portion of the revaluation reserve that relates to those assets is effectively realised and transferred directly to retained earnings.
In July 2013, the Bank appealed to its shareholders to increase equity through acquisition of additional shares of which some of the shareholders responded favorably. During the Extra Ordinary Meeting held on 20 September 2014, the shareholders approved a rights issue to raise $ 500 million of equity. Further, the shareholders approved to issue such shares at a discount of 45% to motivate the shareholders exercise their rights. During 2015 the board and shareholders approved to apply the 45% discount retrospectively effective July 2013 to all existing shareholders who responded to the capital increase appeal. Accordingly, 1,121 additional shares were reallocated to the affected shareholders who acquired shares between July 2013 and December 2014 and the related effect on share capital and share premium balances were reflected in 2015.

AFRICAN EXPORT-IMPORT BANK 41NOTES TO THE FINANCIAL STATEMENTSFOR THE YEAR ENDED 31 DECEMBER 2016
30 RETAINED EARNINGS2016 2015
US$000 US$000Balance as at 1 January 355,147 300,744 Profit for the year 165,034 125,317 Transfer to general reserve (63,538) (48,247) Depreciation transfer: buildings 1,628 1,480 Dividends for prior year (28,823) (24,147) Balance as at 31 December 429,448 355,147
31 DIVIDENDS
Dividends per share is summarised as follows:2016 2015
US$000 US$000Proposed dividends per shareDividends appropriations 37,958 28,823
Number of shares at 31 December 94,622 76,788
Dividends per share 0.40 0.38
Dividends per share declared and paidDividends appropriations 28,823 24,147
Number of shares at 31 December of the previous year 76,788 47,514
Dividends per share 0.38 0.51
32 WARRANTS
2016 2016 2015 2015Expiry Date No of warrants US$000 No of warrants US$000
At 1 January 1,224 46,316 2,112 77,328 Retirement during the year (1,224) (46,316) (2,112) (77,328) Issued during the year 30-Mar-17 2,424 98,716 1,224 46,316 At 31 December 2,424 98,716 1,224 46,316
After reporting date, the directors proposed dividends appropriations amounting to US$ 37,958,000 (2015: US$ 28,823,000). The 2016 dividend appropriation is subject to approval by the shareholders in their Annual General Meeting. These financial statements do not reflect the dividend payable, which will be accounted for in equity as an appropriation of retained earnings in the year ending 2017.
The Bank held an Extra Ordinary Meeting on 20 September 2014, where the shareholders authorised an equity increase of $500 million from existingshareholders. The shareholders also approved that the Bank raise an additional US$1 billion at the Annual General Meeting held in Seychelles on the 23rd of July2016 to enable it to grow its business and meet the demands that will be placed on the Bank in the medium term. The shareholders also approved that anarrangement be put in place whereby a third party entity (entities or investors) would provide bridging financing to pre-finance the expected subscribed amounts interms of the equity raising plan. The third party entity (entities or investors) could achieve this in various ways, including among others, the issue of debtinstruments. It was therefore in this context that the Bank put in place the Equity Bridge Bond. Under the Equity Bridge Bond Structure, the Bank created an"orphan Special Purpose Vehicle- SPV" registered in the Seychelles. The shares of the SPV are held by a non-charitable trust with the trustee being anadministration company. The SPV is the issuer of the bond. As at 31 December 2016, the issuer had resolved to issue 5.0% bonds due 30 March 2017 for anaggregate principal amount of up to approximately US$ 99,965,760. The issuer used the proceeds of the bonds to subscribe for warrants representing Class Dshares of African Export-Import Bank. The warrants were created pursuant to the warrant instrument. Bonds amounting to US$100 million had been subscribed toby two investors as at year end. The Bank in turn issued warrants to the SPV of the subscribed amount of US$98,716,188 and credited the same to capital of theBank net of issuance costs amounting to US$1,249,572.
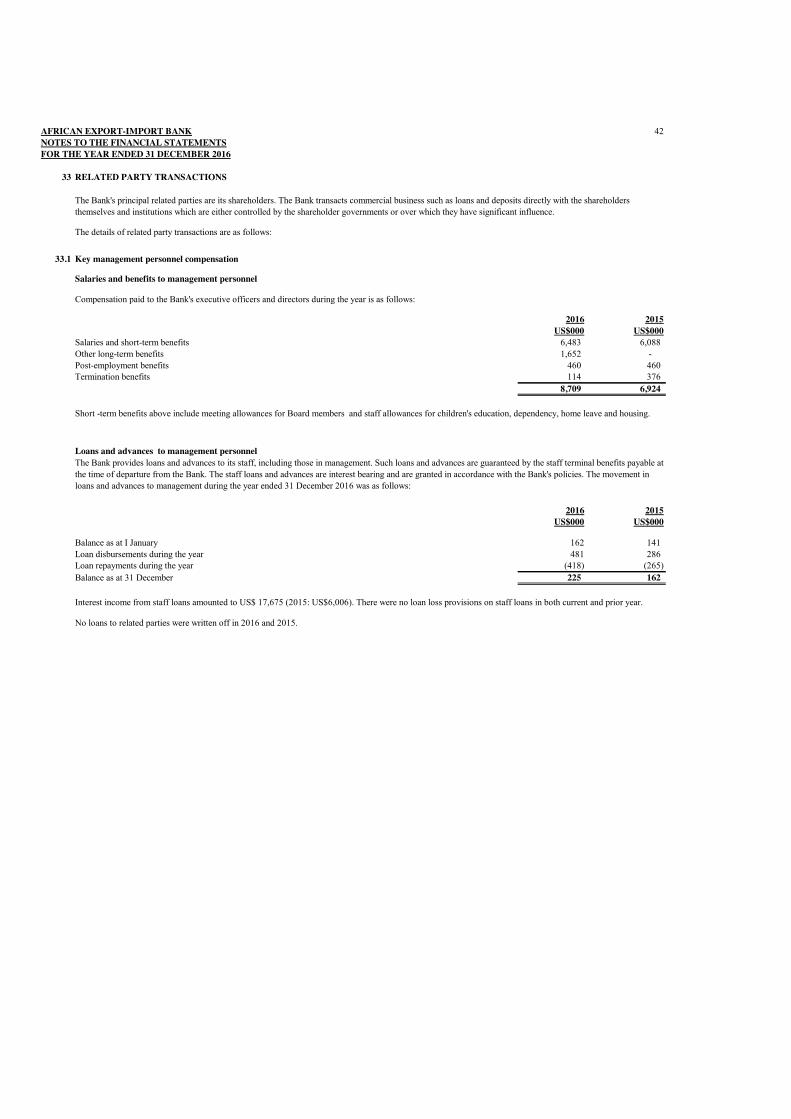
AFRICAN EXPORT-IMPORT BANK 42NOTES TO THE FINANCIAL STATEMENTSFOR THE YEAR ENDED 31 DECEMBER 2016
33 RELATED PARTY TRANSACTIONS
The details of related party transactions are as follows:
33.1 Key management personnel compensation
Salaries and benefits to management personnel
2016 2015US$000 US$000
Salaries and short-term benefits 6,483 6,088 Other long-term benefits 1,652 - Post-employment benefits 460 460 Termination benefits 114 376
8,709 6,924
Loans and advances to management personnel
2016 2015US$000 US$000
Balance as at I January 162 141 Loan disbursements during the year 481 286 Loan repayments during the year (418) (265) Balance as at 31 December 225 162
No loans to related parties were written off in 2016 and 2015.
Interest income from staff loans amounted to US$ 17,675 (2015: US$6,006). There were no loan loss provisions on staff loans in both current and prior year.
Compensation paid to the Bank's executive officers and directors during the year is as follows:
The Bank provides loans and advances to its staff, including those in management. Such loans and advances are guaranteed by the staff terminal benefits payable at the time of departure from the Bank. The staff loans and advances are interest bearing and are granted in accordance with the Bank's policies. The movement in loans and advances to management during the year ended 31 December 2016 was as follows:
Short -term benefits above include meeting allowances for Board members and staff allowances for children's education, dependency, home leave and housing.
The Bank's principal related parties are its shareholders. The Bank transacts commercial business such as loans and deposits directly with the shareholders themselves and institutions which are either controlled by the shareholder governments or over which they have significant influence.
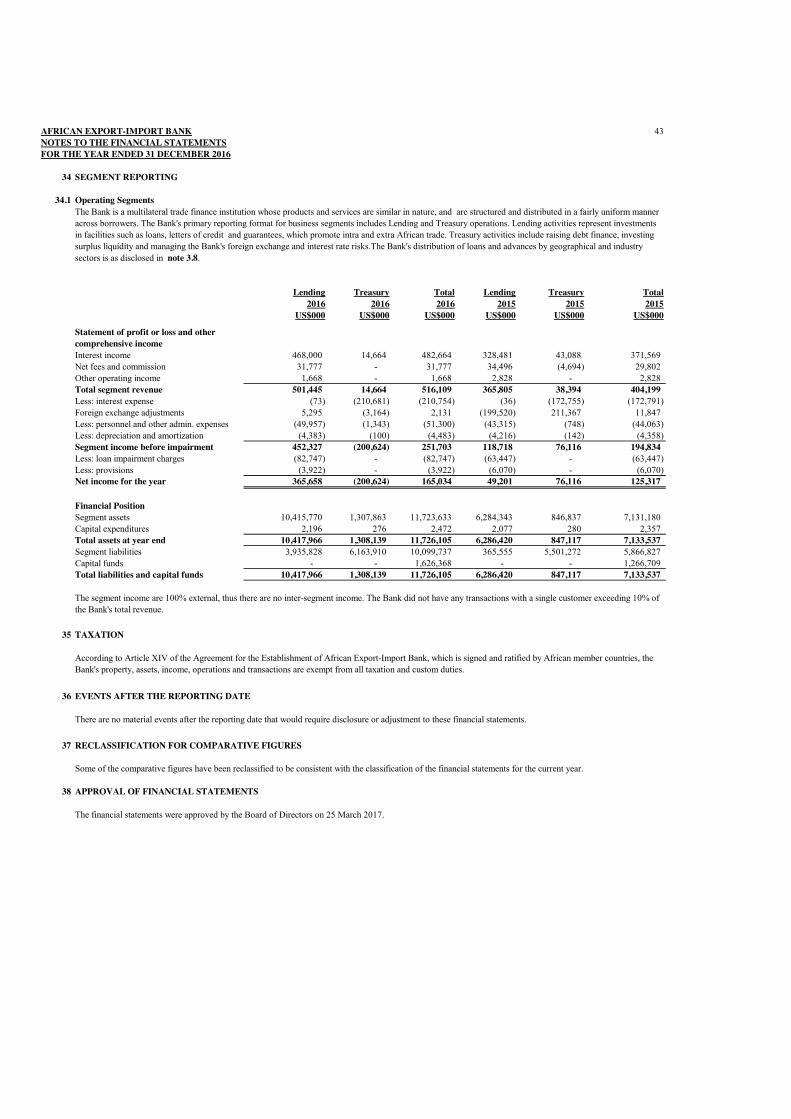
AFRICAN EXPORT-IMPORT BANK 43NOTES TO THE FINANCIAL STATEMENTSFOR THE YEAR ENDED 31 DECEMBER 2016
34 SEGMENT REPORTING
34.1 Operating Segments
Lending Treasury Total Lending Treasury Total2016 2016 2016 2015 2015 2015
US$000 US$000 US$000 US$000 US$000 US$000
Interest income 468,000 14,664 482,664 328,481 43,088 371,569 Net fees and commission 31,777 - 31,777 34,496 (4,694) 29,802 Other operating income 1,668 - 1,668 2,828 - 2,828 Total segment revenue 501,445 14,664 516,109 365,805 38,394 404,199 Less: interest expense (73) (210,681) (210,754) (36) (172,755) (172,791) Foreign exchange adjustments 5,295 (3,164) 2,131 (199,520) 211,367 11,847 Less: personnel and other admin. expenses (49,957) (1,343) (51,300) (43,315) (748) (44,063) Less: depreciation and amortization (4,383) (100) (4,483) (4,216) (142) (4,358) Segment income before impairment 452,327 (200,624) 251,703 118,718 76,116 194,834 Less: loan impairment charges (82,747) - (82,747) (63,447) - (63,447) Less: provisions (3,922) - (3,922) (6,070) - (6,070) Net income for the year 365,658 (200,624) 165,034 49,201 76,116 125,317
Financial PositionSegment assets 10,415,770 1,307,863 11,723,633 6,284,343 846,837 7,131,180 Capital expenditures 2,196 276 2,472 2,077 280 2,357 Total assets at year end 10,417,966 1,308,139 11,726,105 6,286,420 847,117 7,133,537 Segment liabilities 3,935,828 6,163,910 10,099,737 365,555 5,501,272 5,866,827 Capital funds - - 1,626,368 - - 1,266,709 Total liabilities and capital funds 10,417,966 1,308,139 11,726,105 6,286,420 847,117 7,133,537
35 TAXATION
36 EVENTS AFTER THE REPORTING DATE
37 RECLASSIFICATION FOR COMPARATIVE FIGURES
Some of the comparative figures have been reclassified to be consistent with the classification of the financial statements for the current year.
38 APPROVAL OF FINANCIAL STATEMENTS
The segment income are 100% external, thus there are no inter-segment income. The Bank did not have any transactions with a single customer exceeding 10% of the Bank's total revenue.
The financial statements were approved by the Board of Directors on 25 March 2017.
The Bank is a multilateral trade finance institution whose products and services are similar in nature, and are structured and distributed in a fairly uniform manner across borrowers. The Bank's primary reporting format for business segments includes Lending and Treasury operations. Lending activities represent investments in facilities such as loans, letters of credit and guarantees, which promote intra and extra African trade. Treasury activities include raising debt finance, investing surplus liquidity and managing the Bank's foreign exchange and interest rate risks.The Bank's distribution of loans and advances by geographical and industry sectors is as disclosed in note 3.8.
According to Article XIV of the Agreement for the Establishment of African Export-Import Bank, which is signed and ratified by African member countries, the Bank's property, assets, income, operations and transactions are exempt from all taxation and custom duties.
There are no material events after the reporting date that would require disclosure or adjustment to these financial statements.
Statement of profit or loss and other comprehensive income