review of soni power system operations alex baird grid operations manager real time
TRANSCRIPT

Review of SONI Power System
Operations
Alex Baird
Grid Operations Manager
Real Time

Presentation Structure
• System statistics– NI Summary– NI fuel mix– Gas as a percentage of System demand– Wind Statistics– Wind as a percentage of system demand
• System operation issues– Moyle flow– Moyle flows too low– Moyle flows too high– Moyle flows in future
• Winter Outlook for 2009/10

System Statistics

NI Summary System Statistics
• Main thermal Generating Plant 1996 MW with 291 MW of OCGTs giving a total (sent out) figure of 2287MW
• Generating stations 3
– Moyle DC interconnector to GB -80/450MW
– Energy 2009 YTD 5.85 TWh
• Energy Growth (year on year) for Sept -2.67%
• MW Load variation from 516 to 1725
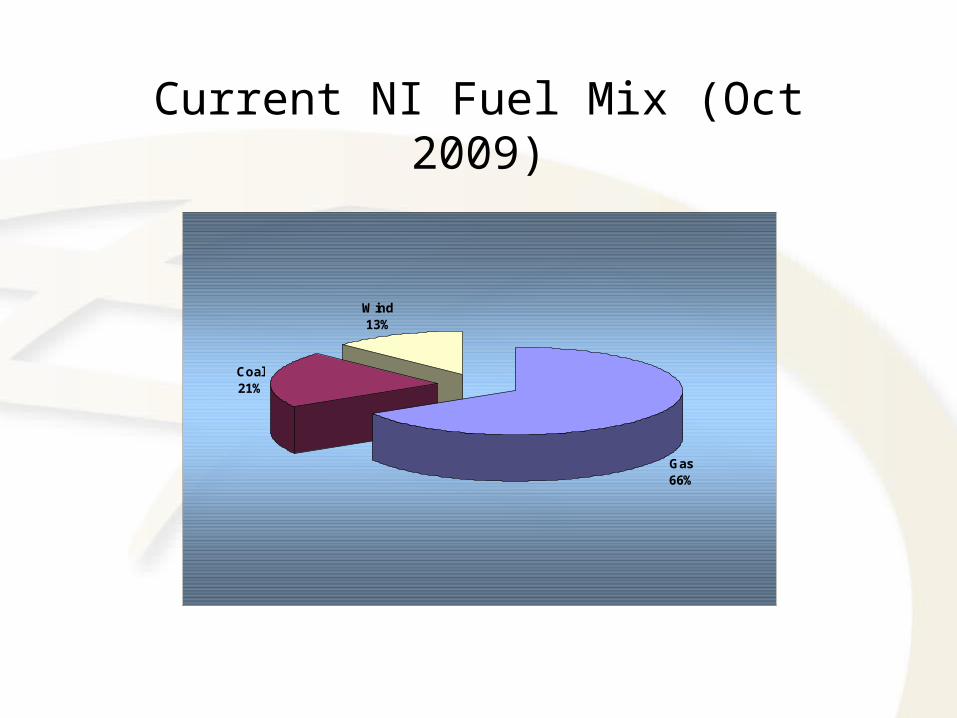
Current NI Fuel Mix (Oct 2009)
Gas66%
Coal21%
Wind13%

Gas % System DemandJan – Aug 2009
0
20
40
60
80
100
120
140
Date
Perc
enta
ge *
* Note that % Gas can exceed NI demand during periods where exporting to ROI

Wind Statistics
• Wind Generation capacity 292 MW
• No. of Wind farms 21
• Expected Capacity by end 2009 (extension to existing site) 303 MW
• Peak wind output (3rd Oct 09 01:00) 273 MW
• Wind contribution at system peak (29 Jan 09 @ 17:30) 195MW
• No transmission connected wind farms

Wind % of System DemandJan – Aug 2009
26 July 2009 05:00
0
5
10
15
20
25
30
35
40
45
01/0
1/20
09
08/0
1/20
09
15/0
1/20
09
22/0
1/20
09
29/0
1/20
09
05/0
2/20
09
12/0
2/20
09
19/0
2/20
09
26/0
2/20
09
05/0
3/20
09
12/0
3/20
09
19/0
3/20
09
26/0
3/20
09
02/0
4/20
09
09/0
4/20
09
16/0
4/20
09
23/0
4/20
09
30/0
4/20
09
07/0
5/20
09
14/0
5/20
09
21/0
5/20
09
28/0
5/20
09
04/0
6/20
09
11/0
6/20
09
18/0
6/20
09
25/0
6/20
09
02/0
7/20
09
09/0
7/20
09
16/0
7/20
09
23/0
7/20
09
30/0
7/20
09
06/0
8/20
09
13/0
8/20
09
20/0
8/20
09
27/0
8/20
09
Date
Per
cent
age

System Operation Issues

Moyle Flow
• Flow on the Moyle interconnector is decided as the result of the ex-ante UUC run
• The UUC takes no account of system constraints
• The TSO can only alter this flow by SO-SO trading with NGC
• SO-SO trading is agreed close to real time and is only firm once agreed
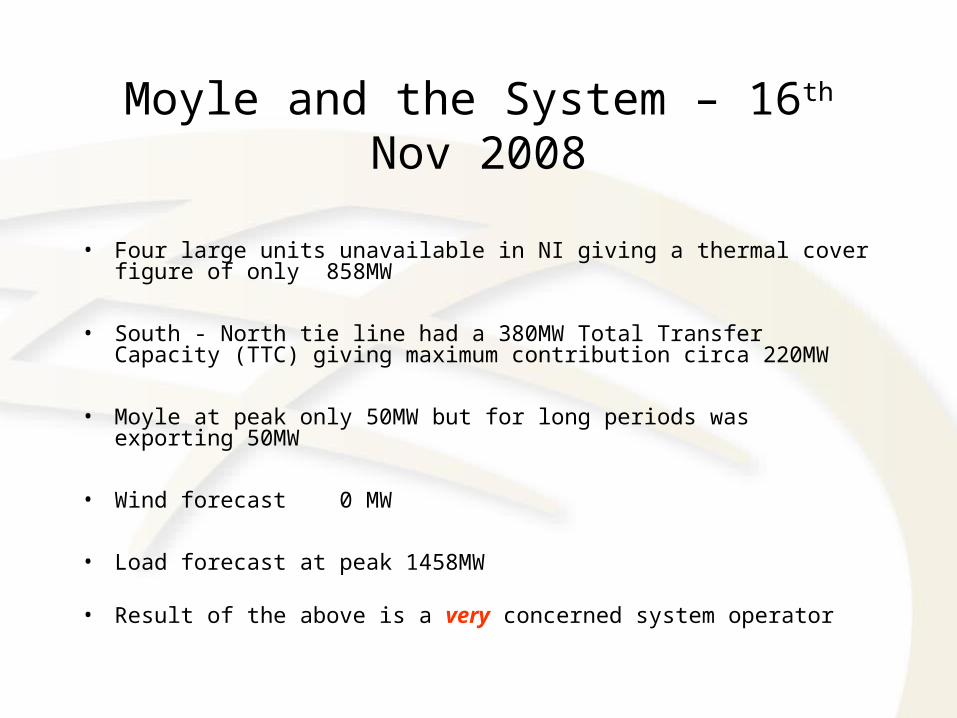
Moyle and the System – 16th Nov 2008
• Four large units unavailable in NI giving a thermal cover figure of only 858MW
• South - North tie line had a 380MW Total Transfer Capacity (TTC) giving maximum contribution circa 220MW
• Moyle at peak only 50MW but for long periods was exporting 50MW
• Wind forecast 0 MW
• Load forecast at peak 1458MW
• Result of the above is a very concerned system operator

Moyle and the System – 16th Nov 2008
0
200
400
600
800
1000
1200
1400
1600
0
200
400
600
800
1000
1200
1400
1600
NI Generation
NI Demand
Wind
S-N Support
Moyle Schedule Flow
Short Fall

Moyle and the System – 16th Nov 2008
-100
0
100
200
300
400
500
600
Moyle Actual Flow
Moyle Market Scheduled Flow

Moyle and the System – 8th Sep 2009
• Moyle scheduled import was 305 MW from 01:00 to 05:00
• North – South tie line had a 320MW TTC providing an export circa 200MW
• Wind generation approx. 240 MW all night
• NI minimum forecast demand was 610 MW over this period
• Three units required in NI at all times and on running plant this meant a min gen level of 430MW

Moyle and the System – 8th Sep 2009
0
200
400
600
800
1000
1200
1400
1600
NI Generation (inc. Moyle)
0
200
400
600
800
1000
1200
1400
1600
0
200
400
600
800
1,000
1,200
1,400
1,600
NI Demand
N-S Flow
NI Over Generation

Moyle and the System – 8th Sep 2009
0
50
100
150
200
250
300
350
400
450
Actual Moyle
Scheduled Moyle

Moyle flows in future
• The foregoing slides demonstrate the need for a mechanism to alter Moyle flows firmly and ahead of real time
• The SOs have been engaging with the Regulatory Authorities on mechanisms which can achieve this end
• From this engagement the SOs were directed to put in place a contract with NGC that allowed day ahead SO-SO trading on a firm basis
• This work is currently in progress

Winter Outlook
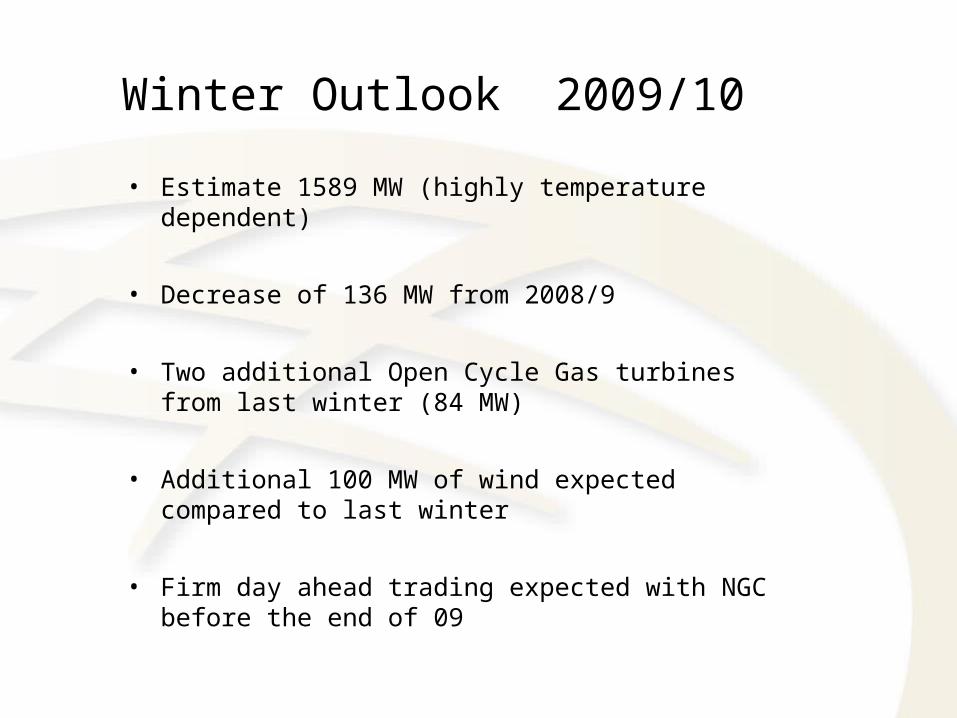
Winter Outlook 2009/10
• Estimate 1589 MW (highly temperature dependent)
• Decrease of 136 MW from 2008/9
• Two additional Open Cycle Gas turbines from last winter (84 MW)
• Additional 100 MW of wind expected compared to last winter
• Firm day ahead trading expected with NGC before the end of 09

Review of SONI Power System
Operations
Alex Baird
Grid Operations Manager
Real Time