review of south african tourism report of the sa... · review of south african tourism ... 5 2.3 sa...
TRANSCRIPT

Review of South African Tourism
Report of the Expert Panel to Minister Hanekom, June 2015

SA Tourism Review: Report of the Expert Panel, June 2015
ii
FOREWORD
The pace at which the global travel market is evolving is
quite giddying – it’s one of the fastest growing economic
sectors in the world, and as communications’ technology
and air travel have compressed the world into an
increasingly accessible global village, so has the competition
for a slice of the travel market heated up. Countries invest
considerable resources and state-of-the-art technologies in
making sure that their destinations are top-of-mind when
people make travel choices.
Destination marketing is now a highly specialised business,
and is constantly evolving - for example digital made up 25%
of destination marketing budgets last year, but in five years’
time that figure is going to be more like 75%. ‘Connected’
consumers and ‘automated’ travellers make mobile
bookings and use on-line services like Trip Advisor to inform
product choices.
Sitting as it does on the southern tip of Africa, South Africa is
a long haul destination for many international visitors
although it is from our region that we draw the most visitors.
But we are also blessed with an incredibly unique history, a
melange of vibrant cultures and a bounty of natural assets.
Nothing quite compares to the vast openness of the South
African landscape, layered with meaning through the
passage of time. For the traveller who makes the journey to
explore South Africa, the experiences on offer stand apart in
their uniqueness. And the journey is the destination, as a
Kenyan photojournalist, Dan Eldon, once wrote.
South African Tourism is the agency tasked with marketing
South Africa as a destination, both internationally and to our
domestic market. It has a difficult job, not least because
many of the obstacles to tourism growth in our country –
visa and other immigration regulations, airlift, safety and
security – are beyond its immediate control. For this reason
it needs to do its job in partnership with many actors and
agencies – provincial and city tourism authorities, national
departments, and most importantly, the tourism industry
itself who has to convert destination awareness into real life
travellers.
This means that SA Tourism needs a highly competent team
capable of collaboratively leading a global marketing
campaign in a tough economic environment against some
formidable competitors.
The committee appointed by the Minister of Tourism, Mr.
Derek Hanekom, to review the mandate, functioning,
institutional and governance arrangements of SA Tourism
has been mindful of the challenging task that SA Tourism
faces. Our goal has been to ensure that SA Tourism is fit for
purpose, and we trust that our criticisms and
recommendations are taken in that spirit.
We have called on a wide range of stakeholders, including
the management team and Board of SA Tourism, to
participate in this process, and the views and insights that
were shared with us have contributed enormously to our
findings. We thank you one and all for your time and
interest.
I would like to thank the members of the committee who
have each made such valuable contributions to the work
required in producing this report. The committee members
are:
Mavuso Msimang
Tanya Abrahamse (until the announcement of her
appointment as deputy-chair of the SA Tourism
Board on 30 April 2015)
Nunu Ntshingila-Njeke
Kate Rivett-Carnac
Jeanine Pires
Crispian Olver (deputy Chair)
Myself as Chair
We are grateful to the Minister and national Department of
Tourism for the trust you have bestowed on us, and we hope
in some small way to have contributed to the task you have
of leading this vitally important sector of our economy.
Regards
Valli Moosa
Chairperson: SA Tourism Review Committee

SA Tourism Review: Report of the Expert Panel, June 2015
iii
Contents
FOREWORD ................................................................................................................................................. ii
List of Acronyms ...........................................................................................................................................v
EXECUTIVE SUMMARY ................................................................................................................................ vi
1. Introduction ............................................................................................................................................ 1
1.1 Background ................................................................................................................................................................. 1
1.2 Approach .................................................................................................................................................................... 1
2. Overview of the Tourism Economy ......................................................................................................... 3
2.1 Why Tourism Matters ................................................................................................................... 3
2.2 Global Tourism Performance ....................................................................................................... 3
2.2.1 Global international tourist arrivals ....................................................................................................................... 3
2.2.2 Contribution to the Global Economy...................................................................................................................... 4
2.2.3 Future Outlook ....................................................................................................................................................... 5
2.3 SA Tourism Performance .............................................................................................................. 6
2.3.1 International tourism ............................................................................................................................................. 6
2.3.2 Domestic Tourism .................................................................................................................................................. 9
2.3.3 Contribution to the SA Economy ............................................................................................................................... 10
2.3.4 Industry Performance ............................................................................................................................................... 11
2.4 Summing it up: the opportunity ................................................................................................. 13
3. Key findings ........................................................................................................................................... 14
3.1 The Role and Mandate of South African Tourism ...................................................................... 14
3.2 International Marketing ............................................................................................................. 18
3.3 Domestic Tourism ....................................................................................................................... 23
3.4 Tourism Grading Council of South Africa ................................................................................... 27
3.5 South African National Convention Bureau ............................................................................... 30

SA Tourism Review: Report of the Expert Panel, June 2015
iv
3.6 Institutional positioning and partnerships ................................................................................. 34
3.7 Strategy, analytics and market intelligence ............................................................................... 39
3.8 Organisational Structure and Human Resource Development .................................................. 44
3.9 Budget and Finance .................................................................................................................... 49
3.10 Governance ............................................................................................................................. 56
3.11 Performance Management and Monitoring .......................................................................... 59
3.12 National Department .............................................................................................................. 62
5. Conclusion ...................................................................................................................................... 66
Annexure A: Full list of Recommendations, by Area ................................................................................ 67
Annexure B: List of Consulted Stakeholders ............................................................................................. 72
Annexure C: Bibliography .......................................................................................................................... 77
Annexure D: Chinese Tourism case study ................................................................................................. 82
Annexure E: King III Summary and Excerpts ............................................................................................. 91

SA Tourism Review: Report of the Expert Panel, June 2015
v
List of Acronyms
ExCo: Executive Committee
GDP: Gross Domestic Product
CITS: China International Travel Services
MTEF: Medium Term Expenditure Framework
NDT: National Department of Tourism
NTSS: National Tourism Sector Strategy
PFMA Public Finance Management Act
RevPAR: Revenue per Available Room
SABS: South African Bureau of Standards
SADC: Southern Africa Development Community
SANCB: South African National Convention Bureau
SOE: State Owned Enterprise
UK: United Kingdom
US: United States (of America)
StatsSA: Statistics South Africa
TGCSA: Tourism Grading Council of South Africa
TGS: Tourism Growth Strategy
TOMSA: Tourism Marketing South Africa
TSA: Tourism Satellite Accounts
VFR: Visiting Friends and Relatives
WTM: World Travel Market

SA Tourism Review: Report of the Expert Panel, June 2015
vi
EXECUTIVE SUMMARY
The SA Tourism Review Committee was set up in February
2015 by the Minister of Tourism in South Africa, Mr. Derek
Hanekom, to review SA Tourism’s vision, mission, strategy
and plan, and the performance of SA Tourism against its
mandate. As part of its brief, the committee was tasked to
review the institutional landscape and governance
arrangements.
The committee has engaged in a wide-ranging programme
of stakeholder consultations in order to understand
stakeholder views and elicit inputs and suggestions. In
addition, the committee has undertaken an extensive review
of the available literature and reports. This included a range
of internal documents, covering strategic planning,
governance, human resource and financial issues relating to
both the National Department of Tourism (NDT) and SA
Tourism itself. We have also examined broader market
opportunities and constraints in order to understand how
best SA Tourism can position itself.
SA Tourism has done well in certain areas and deserves
recognition for this. These achievements include its part in
the continuous growth rate in international tourists to South
Africa, which has been above global average growth rates
for many years; the recent establishment of a National
Convention Bureau to pursue aggressive business tourism
marketing; a new focus on expanding efforts on the very
important domestic market; excellence in certain country
offices; and SA Tourism’s online marketing approach which
draws heavily on user-generated content. Its track record of
‘clean’ audits is also commendable.
The tourism industry is a rapidly growing part of the global
economy, making up 9% of Gross World Product and 9% of
all jobs. Despite our status as a long-haul destination from
many leisure source markets, South Africa has been able to
successfully capitalise on its post-liberation status and
steadily grow the international market to a total of 9,5
million tourists in 2014.
SA Tourism stands at the forefront of South Africa’s tourism
effort, and is explicitly mandated to lead the country’s
marketing as a tourism destination. In this role, it has a
difficult mandate to fulfil. Many of the issues that confront
the tourism industry, and hold back further growth in the
industry – immigration laws, airlift, concerns about safety
and xenophobia – are largely beyond the control of SA
Tourism and even the Department of Tourism to which it
accounts. While the historic growth rates achieved are
impressive, South Africa’s market share and growth rates
from overseas source markets for the full 2014 year are not
so rosy, at 1,9% for the year. Statistics South Africa data
appears to indicate a decline in tourists from non-European
long haul markets in the second half of 2014, although
concerns exist regarding the reliability of that data.
We have examined the role and mandate of SA Tourism as
articulated in the Tourism Act of 2014. While the focus on
the Board at the expense of the organisation needs to be
remedied in that Act, we are confident that SA Tourism’s
mandate and role as specified in the Act are appropriate.
Most importantly, SA Tourism needs to understand the
international and domestic tourism markets, build brand
awareness of the country as a unique and alluring
destination amongst potential international and domestic
tourists, and lay the basis for the industry to convert this
awareness into actual tourists.
There is a planning hierarchy in government which serves to
clarify and position the mandate that SA Tourism carries,
starting with the National Development Plan which identifies
tourism as an essential part of our economy into the future.
Tourism is a key sector contributing to Outcome 2 (decent
employment through economic growth) in the state’s
Medium Term Strategic Framework for 2014 – 2019. The
Department of Tourism is charged with developing and
implementing the National Tourism Sector Strategy which
sets the overall framework for how the country plans to
grow the tourism economy. This in turn creates the context
within which SA Tourism’s Tourism Growth Strategy spells
out the strategic approach to the marketing effort.
The overwhelming majority of stakeholders surveyed believe
that SA Tourism could improve its performance in executing

SA Tourism Review: Report of the Expert Panel, June 2015
vii
its mandate1. Suggestions have focused on the need for
more innovation and freshness in marketing campaigns,
more marketing spend getting to actual consumer-facing
activities, and a careful balancing of focus on new markets as
well as more traditional markets. In addition, the Panel’s
research indicates that the organisational culture and certain
human resource practices also need work.
The original conception of SA Tourism was as a partnership
between government and industry in promoting the country.
Of necessity there needs to be a close working relationship
both with the industry it seeks to support, and the
government agencies and institutions which regulate and
fund it and which are integral to unblocking systemic
obstacles to growth. In reasserting the partnership that
should underpin SA Tourism, the way that SA Tourism works
with private and public stakeholders must be imbued with a
more collaborative approach that sees private industry and
government role players as part of a single ‘team SA’.
The international marketing effort is the mainstay of SA
Tourism’s business. Brand awareness requires on going
marketing activities and should never be taken for granted,
even in established markets. South Africa needs to keep
pace with best practice marketing efforts and especially the
emergence of on-line and digital platforms. SA Tourism’s
market campaigns need to be fresh and focused on the very
unique experiences we can offer as a country. The practice
of using a multitude of different marketing service providers
should be reconsidered. It is very important that SA Tourism
continues to create innovative tools to maximize user
content through social media channels and on the
southafrica.net site.
We also believe that the effort and resources that go into
hosting Indaba can be better applied to other areas.
The work of Brand SA on overall country brand management
is an essential adjunct to the destination marketing efforts of
SA Tourism and greater collaboration is required in this area
too.
1 Stakeholders’ views are reported on extensively on this report. The Panel does not necessarily agree with the views expressed.
The value of our marketing spend must be preserved in
terms of the currency of our core markets. This means that
SA Tourism needs to constantly ensure that its overheads
and fixed costs are kept to a minimum, allowing greater
tactical flexibility. At the same time National Treasury needs
to play a currency hedging role on behalf of SA Tourism, and
provide certainty regarding marketing commitments in core
markets.
While the SA Tourism research team currently undertakes
good work, the research capacity and budget need even
further resourcing. Stronger linkages are also required
between research and business planning and decision-
making. The decisions regarding which market segments to
target, and which markets are classed as core, investment,
watch-list or tactical, are fundamental to the success of the
marketing effort.
Solid research and good market intelligence are needed to
lay the platform on which the marketing campaigns are built
and the organisation’s strategy is developed. This must
include at least 5 yearly market segmentation studies, 3
yearly portfolio reviews and annual branding tracking in
priority markets. The integrity of these data-driven
methodologies needs to be retained. In addition, new
sources of market intelligence are required to augment the
research findings of the organisation and allow it to deliver
fresh insights into market developments and opportunities.
Stakeholders are widely sceptical about the veracity of the
data that comes out of Statistics South Africa which forms
the basis for SA Tourism’s own analysis of international
tourist arrivals. New data sources must be found to create a
completer picture of international arrivals to South Africa,
one that is both in line with global definitions, and
meaningful to industry.
Domestic tourism has been the step-child of SA Tourism for
some time; certain stakeholders have argued that domestic
tourism should be the function of provincial and local
tourism authorities. However the international and domestic
brands need to be seen as one brand applied across all
markets and segments both domestically and
internationally. Further, a vibrant local travel market is
needed to build the product base and lay the foundation on
which the international market is built.

SA Tourism Review: Report of the Expert Panel, June 2015
viii
SA Tourism clearly has a leadership role to play in this space.
Hopefully some proper attention will be paid to the
domestic tourism function with the allocation of an
additional R100m per year over the next three years. This
budget needs to be paired with significantly more strategic
and creative plans. Recognising this imperative, SA Tourism
has already started work to enhance its work in domestic
marketing.
It is also essential to establish a tourism culture in the
country, and in this regard we recommend that the
Welcome Campaign - or an updated equivalent - is re-
launched.
The panel believes that the Tourism Grading Council (TGCSA)
fits uneasily within the functions of SA Tourism. It appears to
have suffered from steadily declining industry participation,
partly because the brand value of the Star Grading system
has been eroded and it is being replaced by market
instruments such as Trip Advisor. However many
stakeholders believe there is a case for a star grading system
which can work in tandem with online guest reviews. While
TGCSA is currently working to link online systems with its
own system of grading by assessors, the Panel is of the view
that SA Tourism is not the correct institutional home for
TGCSA, and we recommend that the function should be
assigned elsewhere. The South African Bureau of Standards
is one option as it has the necessary competencies and
institutional mechanisms to grow the star grading into a
successful and largely self-sustaining tourism certification
system and is already home to the Responsible Tourism
Standard. This recommendation requires further
consideration to accommodate debate and discussions on
the true value of a traditional grading system, as well as a
possible new business model and location of such a system.
The SA National Convention Bureau has only recently been
established and it is too early to make a proper assessment
of its success. The work that has been done on establishing a
subvention fund, that can support bids for major
international events is to be welcomed. We recommend that
such a fund is supported by the fiscus. SANCB needs to
develop a range of performance indicators that help it to
make a strong case for larger budget allocations.
The internal structuring and governance of SA Tourism
needs to be capable of delivering on its mandate. This
requires a Board and management that have a practical
knowledge and experience of large scale marketing
campaigns and an intimate understanding of the needs of
the tourism industry. The SA Tourism Board needs to
operate in terms of the King III codes relating to areas such
as accountability, performance culture, non-interference
and separation of roles. A draft governance framework
between the national Department of Tourism and SA
Tourism, which applies these principles within a public
sector milieu, should also be implemented. Greater
attention is also needed to the overall strategic framework
within which SA Tourism operates, and how strategy
cascades down from the National Tourism Sector Strategy to
the Tourism Growth Strategy.
The leadership of SA Tourism has attracted some criticism
from stakeholders and staff. The incoming Board needs to
ensure that the CEO and leadership team have the
capabilities to carry out roles and duties as set out in their
key performance areas. The organisational culture and the
skills’ profile of the staff complement also need attention.
We recommend that a change management process is
established to address the organisational ‘DNA’ of SA
Tourism and shift the organisational culture and behaviour.
Putting in place effective delegations of authority which are
supported by the PFMA will help to empower junior, middle
and senior managers to respond to opportunities, use their
skills and judgement, and take responsibility for their
mandates. In this regard more consideration needs to be
given to the extent to which country offices are empowered
to take decisions ‘in market’. The reporting and approval
structure for the SA National Convention Bureau needs to be
addressed to support efficient decision-making.
Increasingly the decisions to open international offices seem
to be imposing an unduly high cost structure on the
organisation with limited additional outcomes. We
recommend that there is a comprehensive review of the
country office/ hub model, especially in light of budget
constraints, currency losses and particular circumstances
under which country offices operate without the diplomatic
‘cover’ afforded to foreign missions. SA Tourism must make
the case for the most appropriate forms of ‘in country’

SA Tourism Review: Report of the Expert Panel, June 2015
ix
presence. There is likely to be some variability between
countries in this regard. We understand there are currently
discussions on this point between the
Performance management and monitoring of SA Tourism
can be enhanced by introducing new measures into
organisational and executive performance management
systems. These should include stakeholder and staff
satisfaction. Marketing Return on Investment, or Value for
Money, should also be tracked including at an ExCo and
Board Committee level. SA Tourism needs to develop a set
of internal marketing and finance ratios and targets that
monitor expenditure and ‘return on investment’, and
identify areas for improvement.
In terms of future budget allocations, SA Tourism needs to
provide the national Department of Tourism and National
Treasury with a much clearer business case and consistently
make the economic argument for investment in marketing.
As part of the review we have examined the role of the
national Department of Tourism. The primary role of the
national department must be to position tourism as a key
economic sector within government and to unblock
obstacles to tourism growth. At the same time the
Department of Tourism needs to build a closely articulated
and supportive governance relationship with SA Tourism
that is responsive to the fast-paced needs of the tourism
market, in particular responding to major tourist concerns
and obstacles to tourism growth.
A structured relationship of accountability needs to be
complemented by a collaborative approach to addressing
key issues – SA Tourism must arm the national Department
of Tourism with the right information and insights, the
national department needs to fight for SA Tourism funding
and address obstacles to its effectiveness. A major current
concern relates to the new immigration regulations facing
tourists to our country. The requirement of biometric visas
and unabridged birth certificates is likely to have a real
impact on the number of tourists that visit our country.
While the intention behind these new procedures might be
sound, the practical mechanics of compliance based on the
current Home Affairs design appears impractical. Additional
administrative burdens placed on tourists prior to their
departure are likely to result in many simply switching
destinations to other countries, where travel is easier and
more accessible. The Department of Tourism and SA Tourism
have highlighted their concerns around these issues, but
more must be done earlier on to address these sorts of
regulatory barriers.
We trust that this review has been able to provide a useful
and practical set of recommendations that can assist both SA
Tourism and the department in taking forward their
responsibilities. A full summary of the recommendations, by
area, is provided in Annexure A while Table 1, over the
page, provides a list of our top 10 findings and areas of
recommendation.
The global tourism industry is a complex, fast changing
environment that needs a uniquely skilled team to be able to
position the country. There are many stakeholders with an
active interest in making this work, and that stand ready to
partner with and support SA Tourism in this exercise. We
hope to lay a foundation for reinvigorating the partnership
that is integral to the success of SA Tourism and can support
tourism’s economic contribution to the country’s
development.

x
Table 1: Top 10 Findings and Recommendations
Finding Recommendations Comment
1. Inadequate relationship between SA Tourism and the private sector as well as other public sector tourism bodies. The sense of partnership with the tourism industry is virtually non-existent.
SA Tourism must employ a range of measures to formalise and institutionalise collaboration with industry beyond the existing relationship with TBCSA. This includes, amongst others, appointing dedicated staff to deal with trade and product, co-opting private sector skills onto ad hoc and regular committees of the Board, far more workshops and fora for engagement. SA Tourism to revitalise existing platforms for coordination with provinces, and to put in place channels of communication with natural and cultural heritage institutions, and cities.
Stakeholder satisfaction measures should be added into organisational performance indicators as well as performance measures for the leadership of SA Tourism. See Section 3.6 for more detail.
2. Limited engagement and empowerment of management and staff by SA Tourism leadership.
The leadership of the organisation needs to empower staff and management to take decisions. Particular measures include putting in place delegations of authority, platforms for management to share and co-plan, and effective HR practices.
Board intervention to guide this process and to urgently put in place measures and interventions to ensure that the leadership team has the capabilities to carry out roles and duties required of them. The Board to urgently review the role, performance and capabilities of the Human Resource function. Staff satisfaction to be measured as part of organisational and executive performance management. See Section 3.8 for more detail.
3. No real time consumer data and non-credible and late statistical data. Research function needs greater resourcing.
Given the concerns over StatsSA data, SA Tourism to investigate others sources of data on tourist arrivals and industry performance to supplement and ‘triangulate’ StatsSA data. SA Tourism to increase research budget allocation and extend research areas. Research to be placed at the heart of the organisation. Traditional methodologies such as the prioritisation of markets and segments require a review and possible update. Engage more extensively with private sector in interpreting findings and improve the packaging and communication of insights for industry’s consumption.
Consider setting up a task team on foreign tourist arrivals stats to identify and review different sources to triangulate StatSA stats. Implement under Board guidance. See Section 3.7 for more detail.
4. Insufficient consumer facing While service providers are absolutely necessary to execute SA Tourism to develop a set of metrics to understand the

SA Tourism Review: Report of the Expert Panel, June 2015
xi
Finding Recommendations Comment
marketing activities - international marketing requires a fresh approach to refocus resources on areas of greatest return on investment.
marketing, where it makes business sense and will not compromise the marketing delivery, the many service providers should be consolidated to reduce fees and duplication/ dissonance in marketing. The objective here is to increase funds that reach consumers through media and reduce the ratio of funds employed in production, fees, project management and the like. Marketing initiatives such as large delegations to tourism shows, buyer selection, and like, need to be reviewed. Greater uniformity in brand communication and alignment between marketing initiatives will enhance and strengthen the tourism brand. The SANCB should receive improved research and budget support to extend its efforts and impact.
value of different marketing platforms and expenditure, relative to return on investment. As part of this, SA Tourism to monitor the ratio of service providers to actual ‘media’ expenditure. See Section 3.2 for more detail.
5. Domestic marketing has not received adequate attention. It requires a robust strategy. It also requires a very deliberate and well-constructed partnership with provinces and cities, as well as the private sector.
Domestic tourism requires a robust strategy to address, amongst others, the barriers to growth, lessons from benchmarking insights, the various partnerships options with local trade and product, and provincial and city tourism authorities. The international and domestic brands need alignment.
Domestic tourism has received a considerable boost from the fiscus and marketing activities should now be drastically enhanced. As with International Marketing, domestic marketing expenditure choices and initiatives must be based on cost-benefit or other options’ analysis techniques. Indicators must be put in place to routinely measure performance. SA Tourism must focus on getting more black South Africans to travel for leisure. See Section 3.3. for more detail.
6. Organisational development and design, and staff skills must be reviewed to support strategy implementation.
An organisational design and development exercise and an updated skills’ audit will be required to respond to more focused international marketing, and the extended domestic marketing function at SA Tourism. This should include a review of the country office/ new regional hub approach as it relates to international marketing efforts.
Flexibility and agility are important principles for a NTO that needs to be responsive to market changes and developments. Given currency fluctuations, and the challenges of setting up, running and closing down offices, a flexible model is required for ‘in country’ presence by SA Tourism. This needs to also be informed by the imperative to reduce overheads and release funds for actual marketing activities. See Section 3.8 for more detail.
7. Declining value of marketing spend in core markets. Imperfect alignment
A complete review of the budget is required to address a range of important operational and management dimensions, such as:
Implement Board-approved budget realignment within six months.

SA Tourism Review: Report of the Expert Panel, June 2015
xii
Finding Recommendations Comment
between budget allocations and SA Tourism mandate.
- country office/ hub model costs, per category; - country budgets and trends; - ratio of overheads to actual monies spent on marketing,
particularly media; and - the cost of marketing service providers and ratios to other
marketing categories. Re-alignment of budget should focus on: - reducing/ limiting overheads; - protecting spend in core markets; - Increasing marketing expenditure particularly on tourist-
facing media; - increasing the research budget; and - targeting reductions in non-return marketing costs such as
service providers; large delegations to show, etc.
SA Tourism to adopt a set of financial indicators that give an immediate sense of performance against important dimensions, such as those outlined above.
Ensure regular monitoring of key ratios and indicators including at Board level and in reporting to Department. Improve quality of MTEF submissions to National Treasury, and provide them with the economic case to support the marketing budget. See Section 3.9 for more detail.
8. The partnership between NDT and SA Tourism needs to be strengthened.
SA Tourism and NDT need to work in support of one another and to jointly pursue the strategic objectives for tourism in South Africa. Regular meetings are to be encouraged between the leadership of SA Tourism and NDT. Furthermore, the Minister and Board must share a view of the key areas of oversight that the Board should monitor.
The new governance protocol between the two institutions paves the way and should be finalised and adopted. See Section 3.10 for more detail.
9. While NDT has grown considerably to undertake a range of different projects and initiatives, other departments are implementing plans and policies that could impede tourism growth.
NDT to focus on addressing supply-side barriers to tourism growth and making the case in government for the resourcing and support of tourism.
SA Tourism to assist NDT to make a better case for the prioritisation of tourism as an economic sector, and for increasing fiscal contributions. See Section 3.12 for more detail.
10. TGCSA does not fit well within SA Tourism, or its mandate.
Stakeholder views, the record of performance and international benchmarking indicate that TGCSA should not form part of SA Tourism. This should be investigated further and a decision taken about its optimal placement.
The TGCSA has struggled to find an optimal business model. It is likely to play an ever-decreasing role in guest accommodation selection in a travel world that is dominated by digital user reviews. See Section 3.4 for more detail.
1
1. Introduction
1.1 Background South African Tourism (SA Tourism) is the national tourism
organisation (NTO) for the country. It is responsible for the
international and domestic marketing of South Africa as a
destination, including leisure and business tourism.
A Schedule 3A public entity, mandated by the Tourism Act
no. 3 of 2014, the organisation received a final approved
budget of R1, 09 billion in 2014/5, which will grow to R1, 17
billion in 2015/6 (the current year). Of the R1, 17 billion, it
was estimated that approximately 9% (R104 million) would
be derived from TOMSA contributions.
In April 2015 personnel at SA Tourism number 160 of the 200
approved posts. SA Tourism’s organisational footprint
includes 12 country offices. This includes Angola where the
decision to set up an office is currently being reviewed and
excludes Kenya where a formal office is not in place. A
General Marketing Agreement also exists with an agency
partner in Brazil. SA Tourism is governed by a Board of 13
members appointed by the Minister. The new Board
appointments were confirmed in a Cabinet statement in late
April 2015.
The Minister of Tourism is responsible for oversight of SA
Tourism. Against this backdrop, a 7 person panel was
appointed with a brief to conduct a strategic review of SA
Tourism. The Terms of Reference for the review is broadly
organized into:
Role, mandate and performance of SA Tourism, both in
terms of its marketing efforts and value for money, and
more broadly in terms of actual visitor numbers and
economic impact.
Internal organisational environment: the institution, its
governance, structures, and functional alignment to fulfil
its mandate.
External transactional environment: its role and
responsibilities in relation to tourism entities at a
national, provincial and local level, as well as the
relationship with the private sector.
1.2 Approach Primary research
Based on the Terms of Reference the strategic analysis
undertaken by the Panel involved:
1. An online survey of private sector views.
2. A questionnaire distributed to all public sector
stakeholders and tourism associations.
3. Focus group discussions with key stakeholders.
4. One-on-one interviews.
While the online survey was restricted to association
members of the Tourism Business Council of South Africa
(TBCSA), focus groups and one-one-one discussions spanned
a range of public and private stakeholders. In total, more
than 100 stakeholders were consulted, representing private
sector views, national institutions involved in marketing and
international relations, provincial government and its
agencies, local government and its agencies, the cultural and
nature heritage sectors, and the advertising and marketing
industries.
As indicated earlier, not all stakeholder views are accurate or
fair. But they do clearly indicate the perceptions of
stakeholders that need to be addressed by SA Tourism -
through action to remedy areas of concern or, at times,
simply improved communication and collaboration.
A number of engagements were also held with the National
Department of Tourism, and the leadership and management
of SA Tourism, including with SA Tourism country managers.
The Chair of the SA Tourism Board was consulted, and
written comments were provided by a small group of Board
members who served on the previous Board and have
subsequently been re-appointed. Dr Tanya Abrahamse was
appointed Deputy-Chair of the SA Tourism Board at the end
of April 2015. At that point she ceased to be part of the
independent review panel.
Annexure B provides a full list of stakeholders consulted.

SA Tourism Review: Report of the Expert Panel, June 2015
2
Secondary Research
Many documents were reviewed as part of the background
research process. These included:
Research reports into the performance of tourism,
locally and globally.
SA Tourism and Department of Tourism plans,
policies, strategies, budgets, Joint Marketing
Agreements, organograms and staff surveys.
Annual reports from provincial and national
departments and agencies.
Annexure C provides a list of all source documents.
We also consulted a variety of information on the National
Tourism Organisations within those countries against which
South Africa benchmarks itself, particularly Australia,
Thailand, Brazil and Kenya. Certain other countries (USA,
Canada, Britain, New Zealand) were reviewed on particular
dimensions, where considered useful. It should be noted that
while the choice of countries against which to benchmark SA
Tourism is strategically sound, many of those destinations
and NTOs are currently experiencing trying times and do not
necessarily represent ‘best practice’. Of the NTOs it is only
Tourism Australia which we feel can be clearly singled out for
best practice2.
Report Layout
The report is laid out as follows:
The performance of and economic case for
supporting tourism in South Africa is made at the
outset. As an addendum to this, Annexure D
contains a case study of the Chinese market.
The body of the report is structured into a number
of sections. The first set of sections considers what
2 In considering NTO practices from around the world, the Panel recognises
that context matters, and South Africa’s particular history and
developmental imperatives have been taken into consideration in our
recommendations.
SA Tourism does – its mandate, role, and focus
areas. The second set of sections examines how SA
Tourism operates. Figures 1 and 2, which follow,
depict the layout of these sections.
A conclusion sums up the recommendations and
indicates the opportunity for SA Tourism and NDT
to refocus.
Annexures contain various supplementary
information.
Figure 1: What SA Tourism does
Figure 2: How SA Tourism operates
2. Internat-ional
Marketing
1. Mandate and Role
3. Domestic Marketing
4. SA National
Convention Bureau
5. Tourism Grading
Council of South Africa
9.
Budget and
Finance issues
11. Perform-
ance Manage-ment and
Monitoring
8. Org. Structure
and Human Resource Develop-
ment
10. Governance
7.
Strategy, Analytics
and Market
Intelligence
12.
Relation-ship with
NDT
6. Institutional Positioning
and Partnerships

3
2. Overview of the Tourism Economy
2.1 Why Tourism Matters Tourism makes a massive contribution to World Domestic
Product, jobs and foreign exchange earnings. It is an unusual
economic sector and challenges conventional conceptions of
how production and consumption take place.
Tourism is unlike other sectors in a number of ways, and this
sets it apart:
It is an export sector, but the consumption takes
place in the travel destination (as the consumers
travel to the country of ‘production’).
It is a service sector, with most parts of the tourism
value chain comprising an experience, not the
purchase of a physical product or item.
While business tourism does often take place in
major urban areas, many leisure tourists are
looking for rural and natural ‘unspoilt’ settings
involving beaches, parks and mountains, amongst
others. Certain tourists even prefer not to have
extensive infrastructure (tarred roads, built
accommodation, electricity). This lends tourism to
rural development and geographic redistribution
within a country.
Domestic tourism also supports this geographic
distribution. In South Africa’s case, during peak
holiday season many South Africans travel from
urban centres where they live to visit friends and
relatives back home, often in poorer regions.
Creative destination development can also see
tourist nodes developed through sheer force of
imagination (and capital), as in the case of Sun City.
Tourism can be a powerful force for local economic
development, and the development of tourism
clusters can unlock major economic multipliers in
an area that might otherwise have little ‘industrial’
potential.
Most tourism businesses the world over are small
businesses which provide accommodation, guiding,
day tours, taxi services, and the like. The more
personal nature of the experience provided by
small businesses is a preference for many tourists,
particularly outside the business segment and
within the growing youth, responsible tourism and
cultural / heritage segments.
Authenticity and perceptions thereof in an
increasingly commoditized world favour
destinations that offer outstanding and unique
natural and cultural characteristics.
As with other economic sectors, marketing is an
important part of communicating the offering and
stimulating demand. But unlike other sectors where
the product is something that is well understood to
the consumer and can often be made to identical
specifications in various countries around the
world, in tourism, marketing is all about positioning
the country in a way that sets it apart from other
destinations. Destination marketing is about
creating brand awareness, and brand positivity
which ultimately leads to conversion into actual
tourist bookings.
The dynamic and fast-moving nature of consumer
preferences in tourism requires tourism companies
and organisations to be pre-emptive as well as very
speedily reactive in terms of marketing strategy and
product development.
Tourism marketing is no easy job. There is stiff global
competition and tourism brands are constantly affected by a
range of developments in the destination that are outside
the tourism sector’s control. A case in point are the recent
xenophobic attacks in South Africa which are a terrible
tragedy and shame in their own right, and will also have
negatively impacted on the South African brand, and the
attractiveness of South Africa as a tourism destination. This
is likely to be particularly true for tourists from other African
countries. The extent of the impact will be felt in the months
to come.
2.2 Global Tourism Performance 2.2.1 Global international tourist arrivals According the United Nations World Tourism Organisation
(UNWTO), over 1,1 billion tourists travelled abroad in 2014,
some 4,7% growth on 2013 numbers. North America grew
by 8%, followed by North-East Asia, South Asia, Southern

SA Tourism Review: Report of the Expert Panel, June 2015
4
and Mediterranean Europe, Northern Europe and the
Caribbean, all increasing by 7%.
Africa grew at only 2% for the year. This 2% growth
represents an additional 1 million foreign tourist arrivals.
Sub-Saharan Africa outperformed North Africa with a
growth of 3% compared with 1%, despite the outbreak of
the Ebola virus.
Figure 3: Global Tourist arrivals by destination region
Source: UNWTO, 2015
In terms of outbound tourism patterns, emerging market
growth was sluggish for 2014, while travel from traditional
source market grew more robustly:
China continued to see strong growth, with around
10% growth in outbound tourists, and an increase
in 17% in associated expenditure, for the first three
quarters of the year. (These impressive figures do,
however, represent a growth slowdown in both
tourists and spend). Total number of trips abroad
from China was an estimated 109 million in 2014.
China is the world’s largest outbound market since
2012 with a total expenditure of US$ 129 billion in
2013.
Brazil grew by about 2%, attributed in part to the
weakening of the currency and slower economic
growth.
Table 2: Outbound tourist data
2011 2012 2013 2014 YTD
Outbound trips
+5% +4% +4% +4.5%
Outbound nights
+4% +2% +4% +3%
Outbound spending in Euros
+8% +4% +6% +4%
Source: IPK Consulting for ITB Academy, 2015
Table 3: Long haul source markets and destinations
Rank Top Long Haul Source Markets
Top Long Haul Destinations
1 USA US 2 UK UK 3 China Thailand 4 Canada Italy 5 Japan China 6 Germany Germany
Source: IPK Consulting for ITB Academy, 2015
Outbound tourist expenditure from Russia dropped
by 6% while other, smaller emerging markets saw
impressive expenditure growth for their outbound
tourists. These markets included Saudi Arabia,
India, the Philippines and Qatar all reporting
increases of 30% or over.
2.2.2 Contribution to the Global Economy The UNWTO estimates that direct, indirect and induced
impacts from tourism account for:
1 in 11 jobs, or 9% of global employment.
9% of global GDP.
1,4 trillion dollars in exports (6% of global exports).
30% of services exports.

5
Figure 4: Tourism’s global economic impact
Source: UNWTO, 2015
According to the World Travel and Tourism Council’s 2013
benchmarking research involving in-depth analysis of 25
individual countries:
More than 102 million people are directly
employed in the industry. This is 5 times more than
automotive manufacturing, 5 times more than
global chemicals, and 4 times more than global
mining.
For every one dollar spent on Travel & Tourism, 3.2
dollars are generated in GDP across the entire
economy.
1 million dollars in tourism sales generates twice as
many jobs than the same 1 million dollars in
financial services, communications and automotive
manufacturing. This indicates that tourism has
strong multiplier effects, relative to certain
manufacturing industries.
2.2.3 Future Outlook The UNWTO’s confidence index records positive sentiments
and expectations for 2015 performance. Oil price declines
are expected to have a positive impact on travel and tourism
for much of the globe, although outbound tourism from oil
producing countries could be negatively affected. Growth is
forecast for somewhere between +3% and +4%. Forecasts
for international arrivals growth rates for Africa in 2015 are
between +3% and +5%.
Emerging travel trends impacting on international tourist
numbers include:
1. Holiday Type Market Segments:
a. City trips show the biggest growth as a market
segment – at 58% over the past five year - now
comprising 20% of the market.
b. Beach holidays, at 28% of the market, have grown by
18% over the past 5 years.
c. Touring holidays (packaged) have grown by 32% to
23% of holidays.
d. Countryside holidays have declined by 17% and now
comprise 11% of all holidays.
2. Business Market Segments:
a. Meetings, Incentives, Conferences and Exhibitions
comprise 58% of all business trips, with conferences /
meetings making up 41% and fairs / exhibitions 29%
of this subcategory.
b. 66% of all bookings worldwide are internet-based.
Some commentators predict that 70% will represent
saturation for mature markets. The global market
share for travel agents has stabilized at about 24%.
Smart phone booking comprised a growing
percentage, with China dominating at 10% of all
smartphone bookings, followed by Japan. Social
media channels remain important for research and
bookings.

SA Tourism Review: Report of the Expert Panel, June 2015
6
2.3 SA Tourism Performance 2.3.1 International tourism South Africa has experienced remarkable growth in
international tourist arrivals over the past two decades. SA
Tourism’s marketing efforts have undoubtedly contributed
to these strong historic growth rates, and also to the
considerable economic impact of the growing tourism sector
on the country’s development.
International tourists to South Africa in 2014 were also up
on 2013 although it appears that the strong growth trend
might now be under threat, at least in part as a result of
market access barriers in the form of new visa regulations.
Current efforts of the Department and Ministry of Tourism,
supported by an outcry from industry, seek to rapidly
address these barriers.
2014 tourist and arrivals’ data for South Africa was only
released by Stats SA at the end of March 2015, after
significant delays. Serious questions exist over the veracity
of the data. SA Tourism has indicated there are gaps in the
data and possibly other serious problems such as the
removal of transit tourists from the current data. This is
contrary to the global definition of a tourist and previous
data, which renders comparison difficult. SA Tourism is in
the process of getting data from the International Air
Transport Association to double-check the trends against a
more reliable source.
In the absence of other reliable and historical sources which
allow for trend analysis, the Stats SA data has been used in
the analysis which follows. According to the Stats SA data, in
2014 South Africa received 9 549 236 foreign tourists, up
6,6% on 2013’s 8 961 565 tourists. Overseas tourist numbers
only grew by 1,9% for the period, or by 41 575 tourists.
It appears, with very few exceptions, that the regional
location of the source markets determined their outbound
performance to South Africa, rather than their status within
SA Tourism’s portfolio:
Growth was experienced out of nearly all European
countries, with the exception of Russia (-9,6%) and
Norway (-2,8%). The growth rate in tourists to
South Africa for the whole of Europe was 6,8% for
the year.
A drop in the number of tourists was experienced
for the year from all other regions, other than
SADC. The Asian markets, all South American
markets, and nearly all African air markets (the
exception here is Angola which saw growth)
declined. African air markets for the purpose of this
analysis include Nigeria, Kenya, Tanzania, Angola
and the Democratic Republic of Congo.
Growth in tourist numbers was experienced from
all neighbouring African countries and from Zambia
too. It is worth noting that many of the cross-
border arrivals from Southern African Development
Community countries – a vast chunk of our
international tourist numbers – do not have the
same disposable income or spend patterns as those
tourists who arrive by plane.
Figure 5 indicates SA Tourism’s categories for prioritising
markets and their meaning.
Core Markets
Less attractive But Easier Tactical Markets
• Markets where there are particular opportunities, i.e. ‘low hanging fruit’
• 15% of organisation’s efforts deployed against these markets
Less Attractive And Difficult Watch-list Markets
• Markets that are on the radar • Activity in these markets will only occur if
there is spare capacity in the organisation • 5% of organisation’s effort deployed
against these markets
Attractive But Difficult Investment Markets
• Invest in these markets ahead of return, i.e. invest for the future
• 20% of organisation’s effort deployed against these markets
Attractive And Easier Core Markets
• Markets that deliver the ‘bread & butter’ • 60% of organisation’s effort deployed
against these markets • Best capabilities allocated to these markets
Watch list markets need to be watched for value segments
Investment markets are those where some
investment is made for returns in future
Tactical markets are those which should be considered for specific, tactical opportunities
Core markets are those which present the
greatest opportunity
Figure 5: SA Tourism 4 priority markets: core, investment, tactical and watch list

SA Tourism Review: Report of the Expert Panel, June 2015
7
Of SA Tourism’s core markets, Mozambique led in terms of
total tourists to South Africa in 2014, with 1 283 016
Mozambican tourists, up 17,6% on the 1 091 060 tourists in
2013. The Mozambique data does not show in the Figures
which follow as it distorts the graph given the high volumes
of tourists relative to all the other core markets.
As indicated in Figure 6, of the remaining core markets
(other than Mozambique), the UK is the largest, followed by
the US and Germany, in that order. France, the Netherlands,
Australia, China (including Hong Kong) and India are also
large source markets, accounting for over 80 000 tourists
each in South Africa in 2014.
Figure 6: Tourists received from Core Market (less Mozambique) in 2013 and 2014
Source: SA Tourism based on StatsSA data
The significant growth out of France and the Netherlands,
and moderate growth out of Germany, the UK and the US
more than offset the large drops from China, Brazil, India,
Nigeria and Tanzania. Figure 7 below indicates the growth or
decline in tourist numbers in percentage terms between
2013 and 2014 by core market. Notably, South Africa
experienced a drop of 23%, or approximately 25 000
tourists, from China.
Figure 7: Percentage change in core market tourist arrivals between 2013 and 2014
Source: SA Tourism based on StatsSA data
Investment Markets
As shown in Figure 8, Canada and Italy lead SA Tourism’s
investment markets by volume (other than the neighbouring
country investment markets), with between 50 000 and
60 000 each in 2013 and 2014.
Figure 8: Tourists from Investment Markets (ex. neighbouring countries), 2013 - 2014
Source: SA Tourism based on StatsSA data
Other than Italy which grew at 7%, and Canada which grew
by 1%, all the remaining non-neighbouring Investment
markets saw declines. Figure 9 shows these declines in
percentage terms.
0
50000
100000
150000
200000
250000
300000
350000
400000
450000
2013 2014
-30%
-25%
-20%
-15%
-10%
-5%
0%
5%
10%
15%
20%
010000200003000040000500006000070000
2013 2014

SA Tourism Review: Report of the Expert Panel, June 2015
8
Figure 9: Percentage growth/ decline between 2013 and 2014 from non-neighbouring Investment Markets
Source: SA Tourism based on StatsSA data
This decline - pretty much across the board - is a worrying
trend given the status of these markets within SA Tourism’s
priority market portfolio.
Tourists from neighbouring country Investment markets
increased between 2013 and 2014, as indicated in Figure 10,
which follows.
Figure 10: Tourists from neighbouring country Investment markets, 2013 -2014
Source: SA Tourism based on StatsSA data
The actual growth rates were 2,4%; 7,4% and 9,8% for
Lesotho, Botswana and Zimbabwe, respectively.
Tactical Markets
Namibia and Zambia are the two regional tactical markets.
Singapore, the United Arab Emirates and Switzerland are the
other three tactical markets in SA Tourism’s portfolio of
priority markets.
Figure 11 shows the performance of the Tactical markets.
Namibia, the largest in terms of tourists to South Africa,
grew very little, at 0.4% while Zambia, also a big market,
grew at 5%. Singapore saw a large decline of 18%, or 1 682
tourists. The number of tourists from the United Arab
Emirates grew at 27%, but this was off such a low base that
it represented only an additional 346 tourists for the year.
Switzerland grew at 6%, or by 2 743 tourists in 2014.
Figure 11: Tourists from Tactical markets, 2013 - 2014
Source: SA Tourism based on StatsSA data
Watch-list Markets
The Watch-list markets are mostly European and saw
growth in 2014, the exception being Norway where the
number of outbound tourists declined by 3% (this decline
only numbered 572 tourists). Tourists from Argentina and
Turkey decreased while tourist numbers from New Zealand
and Malawi were relatively flat. Tourists from Swaziland
grew considerably, from 830 480 to 918 490, or by 11%.
Ethiopian tourists are not listed separately in the StatsSA
table provided to us, so it appears numbers of tourists from
this country are very negligible. Malawi and Swaziland are
not included in Figure 12 as the high numbers of tourists
from those countries distorts the graph.
-30%
-25%
-20%
-15%
-10%
-5%
0%
5%
10%
0
500000
1000000
1500000
2000000
2500000
Lesotho Botswana Zimbabwe
2013
2014
0
50000
100000
150000
200000
250000
2013 2014

SA Tourism Review: Report of the Expert Panel, June 2015
9
Figure 12: Tourists from Watch-list markets, 2013 - 2014
Source: SA Tourism based on StatsSA data
Explaining the trends
The reliability of the data is so questionable that it is difficult
to ascribe causality to factors affecting arrivals. What is
notable is that tourist numbers from Investment markets
were down almost across the board. Given that these are
markets where SA Tourism invests for the future, this raises
questions around future tourist growth scenarios for South
Africa.
Industry has been quick to blame the new immigration
restrictions and the Ebola outbreak for the declines,
particularly from China, and there are instances of bookings
being cancelled. But the complete picture is still unclear and
requires more analysis. A recent survey of the Chinese
market by SA Tourism (admittedly before the impact of the
new visa restrictions) indicated that concerns about
personal safety and political stability were more prominent
reasons for Chinese travellers not choosing South Africa. The
Chinese market is considered in more detail in Annexure D.
2.3.2 Domestic Tourism According to newly released SA Tourism data (May 2015),
the total number of domestic trips increased by 11% in 2014
to reach 28 million trips compared to the 25,2 million trips
taken in 2013.
Approximately 12 million South African adults took a
domestic trip in 2014, the same number of travellers we had
in 2013. However, the average number of trips taken per
traveller increased from 2.1 in 2013 to 2.3 in 2014, as
indicated in Figure 13.
Figure 13: Number of Domestic Trips and Travellers, 2010 - 2014
Source: SA Tourism, 2014 Domestic Survey
0
10000
20000
30000
40000
50000
2013 2014
29.7 26.3 25.4 25.2
28.0
13.5 13.9 12.5 12.0 12.0
2.2
1.9 2.0 2.1
2.3
0.0
1.0
2.0
3.0
0
10
20
30
40
50
60
2010 2011 2012 2013 2014
Average Number of Trips per Traveler
Total Number of Domestic Travelers
Total Number of Domestic Trips

10
Figures 14 and 15, which follow, indicate a percentage
decline in the number of holiday and business trips and an
increase in Visiting Friends and Relatives (VFR) travel over
the last year.
Figure 14: 2013 Purpose of Domestic Trip
Source: SA Tourism, 2014 Domestic Survey
Figure 15: 2014 Purpose of Domestic Trip
Source: SA Tourism, 2014 Domestic Survey
The total revenue generated from domestic trips was R26,8
billion in 2014, an increase of 11% over the R24,3 billion of
2013. The increase in revenue was as a result of the increase
in the number of domestic trips, as the average spend per
trip decreased from R980/trip in 2014 to R950/trip in 2013.
The drop in average spend is attributable to the increase in
the number of VFR trips in 2014. These trips have a lower
average spend relative to other types of domestic trips.
The average length of a domestic trip decreased from 4.4
nights in 2013 to 4 nights in 2014. However, given that there
were more trips taken in 2014 than in 2013, the total
number of bednights increased by 2% from 111,3 million in
2013 to 113,1 million in 2014.
Economic constraints remain the biggest barrier to domestic
travel with 48% of the adult population mentioning that
they cannot afford to travel and they are unemployed or
have no income.
The domestic tourism data shows that the key SA Tourism
metrics of holiday trips, length of stay and spend per trip all
dropped in 2014, indicating a weakening performance.
2.3.3 Contribution to the SA Economy Statistics South Africa compiles a Tourism Satellite Account
(TSA) for the country. This is a globally preferred
methodology that constructs tourism’s contribution to the
national economy. The latest TSA for the country was
released in March 2015 and is for the 2013 year.
Using this approach, tourism’s contribution up until 2013
(with 2012 and 2013 data preliminary) is assessed. It
appears that the methodology is based on all ‘arrivals’, and
not on tourists (i.e. an overnight stay) and should be
understood as such.
Key findings of the TSA for 2013 relating to tourism’s direct
impact:
Tourism contributed R103, 6 billion to the GDP, or
2.9% (this percentage stayed the same between
2012 and 2013).
655 509 people (4% of total employment) were
directly engaged in producing goods and services
consumed by visitors. The number of persons
employed in the tourism industry increased by
9 854 (1,5%).
Domestic visitors contributed 57% (R124,7 billion)
of total tourism spend in 2013, while international
visitors contributed 43% (R94,2 billion). Total
tourism spend in 2013 was R218,9 billion, a growth
of 9,7% on R199,4 billion in 2012. Outbound
tourism expenditure was R62,6 billion, leaving
tourism with a positive trade balance of R31,6
billion to the benefit of the economy and foreign
exchange earnings.
Figure 16 shows the categories of products and services
upon which international and domestic visitors spent
VFR 70%
Holiday 12%
Business 8%
Other 10%
VFR 73%
Holiday 10%
Business 6%
Other 11%

SA Tourism Review: Report of the Expert Panel, June 2015
11
money. One clear area of difference relates to the high
domestic and low foreign spend on road transport.
Figure 16: Visitor spend patterns, 2013
Source: StatsSA, TSA 2013, 2015
2.3.4 Industry Performance Accommodation performance
Occupancy (the utilisation rate of the available rooms) and
Average Daily Rate (the average amount a room is sold for
across the different rates achieved per day) are the two key
metrics in the accommodation subsector. A third metric is
RevPAR – Revenue per Available room – and this is simply a
function of occupancy multiplied by Average Daily Rate. It
indicates the actual income or earnings per available room
per night, over a period. These measures provide a sense of
the ‘health’ of the business performance of the industry.
Statistics South Africa Tourist Accommodation Survey
Stats SA undertakes a regular accommodation survey to
assess the performance of this subsector. It segments
accommodation into hotels, caravan parks and camping
sites, guest houses and guest farms, and ‘other
accommodation’. Table 4 shows the August 2014 to January
2015 performance of these segments in terms of year on
year growth or decline in income in percentage terms.
In January 2015 overall income from accommodation
decreased by 1,5% year-on-year, mainly as a result of
income from ‘other’ accommodation (-9,2%) and ‘caravan
parks and camping sites’ (-3,2%). However, hotels and
guesthouses have seen a monthly growth in their income
from accommodation for some time.
Table 4: Year-on-year percentage changes in income from accommodation at current prices by type of accommodation
Type of accommodation Aug-14 Sep-14 Oct-14 Nov-14 Dec-14 Jan-15
Hotels 11,8 9,5 7,8 6,1 1,9 1,2
Caravan parks and camping sites -5,3 4,0 64,53 19,3 3,8 -3,2
Guest-house and guest-farms 12,3 6,8 9,2 10,3 11,2 11,3
Other accommodation 12,1 4,8 14,8 12,0 0,0 -9,2
Total income from accommodation 1/
11,8 7,9 10,2 8,0 2,0 -1,5
1/Excludes restaurant and bar sales and other income
Source: StatsSA, Accommodation Survey, 201
3 This 64,5% is reported in the StatsSA report. It is not clear if it is a mistake, or if there was a particular factor that caused such strong growth in caravan park and camping site income in October 2014..

12
South African National Parks data
South African National Parks (SANParks) owns and operates
the greatest number of accommodation units of any one
product owner in the country. SANParks experienced an
annual average growth rate of around 5% in visitors across all
the parks between 2009/10 and 2014/5.
Figure 17 shows that visitors to the parks grew from 4,5
million in 2009/10 to 5,6 million in 2014/5. The number of
international visitors grew from 473 791 in 2009/10 to
700 112 in 2014/5. Fairly flat occupancy levels and activity
utilisation rates were achieved while average rates increased
by 54% over the 5 year period. SANParks achieves around 70%
average annual occupancy of its units, and 48% occupancy for
its campsites. One can surmise that this high unit occupancy,
which remains at 70%, relates to the strong demand from
domestic tourists around peak holiday periods and weekends
and weaker demand during other periods.
Detailed data is not yet captured at Table Mountain National
Park nor at the West Coast National Park. Outside of those
parks 75% or so of the guests / visitors are South African,
around 30% of whom are black South Africans. Only 8% of the
room nights are sold to black South Africans.
Figure 17: SANParks data on volumes, 2009/10 to 2014/5
Source: SANParks, 2015
Of the international visitors to SANParks facilities, the top 5
source markets are Germany, United Kingdom, the
Netherlands, France and the United States, in that order.
Together these top 5 markets generated 317 184 visitors to
SANParks facilities in 2009/10 growing to 455 988 in 2014/5.
This represents an additional 44% in visitors over the five
year period, or an 8,7% compound average annual growth
rate. Nearly all the growth from these top 5 markets came
from German tourists, at 82% of all additional visitors.
Figure 18: Main international source markets at SANParks, 2009/10 to 2014/5
Source: SANParks, 2015
0
1000000
2000000
3000000
4000000
5000000
6000000
2009/10 2010/1 2011/2 2012/3 2013/4 2014/5
Guests to Parks
Guests to Parks (excluding Cableway)
Unit nights sold
Camp Site nights sold
Camper person nights sold
Activities sold
0
50000
100000
150000
200000
250000
300000
Germany
United Kingdom
Holland
France
United States

SA Tourism Review: Report of the Expert Panel, June 2015
13
2.4 Summing it up: the opportunity The data in this section indicates that off the back of good
historic performance, South Africa’s current tourism
performance could be improved. The following trends are of
concern:
Declines in tourist numbers from non-European and non-
SADC SA Tourism priority markets in the second half of
2014.
Declines from domestic holiday visitors in 2014.
Flat GDP and employment contribution of tourism in
2013 – relative to other sectors – with little employment
created between 2012 and 2013.
While occupancy rates seems to have been relatively healthy
in 2014, current industry sentiments dominating the travel
media are negative, citing the new immigration and birth
certificate procedures and the likely impact of xenophobia
on demand for the destination.
Despite this, the Panel believes the tourism industry can
make a profound economic impact. The size of the
opportunity is significant: on the international front South
Africa currently only converts around 1% of its global target
market into actual tourist arrivals; on the domestic front, our
domestic tourism contribution is relatively low compared
with competitors such as Brazil, Australia, Thailand
indicating much room for growth.
The rest of this report analyses the role and performance of
SA Tourism in relation to this aggregate picture, and details
the areas where we believe change is required to ignite
improved performance.

14
3. Key findings
3.1 The Role and Mandate of South African Tourism
Introduction
SA Tourism takes its mandate and function from the 2014
Tourism Act. It is an agency of the national Department of
Tourism (NDT), which in turn is part of the national
government machinery aimed at addressing the country’s
development imperatives.
SA Tourism articulates its strategic plan according to the
objectives set in the National Tourism Sector Strategy
(NTSS). This strategy falls under the umbrella of the
National Development Plan, the overall development plan
and aspirations set for the country. Figure 19 outlines this
hierarchical relationship.
Figure 19: Positioning SA Tourism within the country’s development aspirations
South Africa’s National Development Plan clearly indicates
that tourism is a key economic sector for the country. The
following key policy issues for tourism are noted in that
plan:
Increasing the number of tourists to the country
and the average amount of money spent by each
tourist (this is an area to which SA Tourism’s
mandate responds);
Improving the ease of doing business and
infrastructure (particularly transport and
accommodation).
Promoting business tourism and positioning SA as
a business and shopping destination (this is the
second area to which SA Tourism’s mandate
responds).
Supporting regional (SADC) tourism development
including through a Univisa type arrangement.
The Tourism Act of 2014 states its objects as to:
(a) Promote the practising of responsible tourism for the
benefit of the Republic and for the enjoyment of all its
residents and foreign visitors;
(b) Provide for the effective domestic and international
marketing of South Africa as a tourist destination;
(c) Promote quality tourism products and services;
(d) Promote growth in and development of the tourism
sector; and
(e) Enhance cooperation and coordination between all
spheres of government in developing and managing
tourism.
SA Tourism’s mandate corresponds to part (b), and the
Tourism Grading Council’s mandate to part (c). At the
behest of the Department, SA Tourism also houses this
Tourism Grading Council.
Stakeholder views
The general sentiment is that while SA Tourism’s
mandate is not clear to stakeholders, international
marketing of South Africa is the core activity that
SA Tourism is charged with and should focus on.
Further, that SA Tourism’s job should be to help
industry to transact, placing the local industry at
the centre of what it does as a tourism marketing
agency. Most stakeholders agreed that it is not SA
Tourism’s job to convert, which is rather seen as
the role of trade and product.
Government and society's National Development Plans
Department of Tourism and stakeholders' National Tourism
Sector Strategy
SA Tourism's strategic plan

SA Tourism Review: Report of the Expert Panel, June 2015
15
Most stakeholders also agree that SA Tourism
should be involved in domestic marketing, but this
was largely seen as a secondary focus to
international marketing, and a function to be
exercised in partnership with provincial and local
tourism bodies.
Certain aspects of the mandate or current
functions are seen as inappropriate for the
organisation. This includes transformation of the
tourism economy and grading. Other grading
related findings are discussed under the “Grading
Council” section.
Our research
Part of the lack of clarity over SA Tourism’s mandate
appears to stem from a lack of communication of its
current mandate and strategic objectives. SA Tourism’s
focus has shifted somewhat from 5 years ago, when it
was more actively involved in addressing barriers to
tourism growth, such as data, safety and security, and
airlift. Its mandate per the Tourism Act of 2014 does not
include addressing barriers to growth.
According to SA Tourism’s latest strategy, the 5 year 2015
- 2020 Strategic Plan, the organisation’s current
objectives are:
Contribute to the growth of international tourist
arrivals in South Africa.
Contribute to the growth of domestic tourism in
South Africa.
Grow tourism revenue, Total Tourist Foreign Direct
Spend (TTFDS) and Total Domestic Direct Spend
(TTDS).
Improve brand awareness of South Africa as a
tourist destination.
Provide quality assurance for tourism products.
Increase the number of business events hosted in
South Africa.
Figure 20: TBCSA Association Members’ responses on SA Tourism's mandate
Source: TBCSA online survey of association members, 2015
In its mission statement (see Figure 21, over the page), SA
Tourism does indicate its intention to ‘facilitate’ growth and
to achieve alignment with other stakeholders. In practice,
however, this has not been well-demonstrated.

SA Tourism Review: Report of the Expert Panel, June 2015
16
Source: SA Tourism 2015-2020 Strategy, 2015
Benchmarking
UNWTO research from 2008-9 indicates the wide range of
responsibilities across all National Tourism Authorities
(government departments) and NTOs. Marketing, and
particularly international marketing in leisure and business,
are the most common functions, as indicated in Table 5
over the page. In some instance only one institution exists –
referred to as the NTA/NTO.
While NTO’s across the world have varying mandates, the
benchmarked NTO’s have similar marketing mandates.
From the benchmarked set, Kenya Tourism is the only one
which includes grading within its mandate (perhaps based
on the South African model as a regional example).
According to the Tourism Australia Act 2004, Tourism
Australia’s main functions are to increase potential
international and domestic travellers’ awareness,
knowledge of Australia as well as desire to travel to
Australia; undertake research and report on trends in
tourism; communicate effectively with the industry, and
increase awareness about the contribution of tourism to
the economy, society and environment.
To help achieve its targets, Tourism Australia is focused on:
‘Increasing the number of leisure and business
event visitors.
Improving visitor value, including spend per trip
and spend per night.
Competing with out-of-region travel destinations.
Supporting supply-side factors, such as aviation
and tourism infrastructure investment’.
The last point is the only one where Tourism Australia
differs considerably from SA Tourism (other than grading).
While SA Tourism may not have a focus on airlift, much of
the foreign tourism revenue in South Africa is from air
arrivals. As such airlift has been and always will be a critical
enabler or disabler of tourism market access, both in terms
of its availability4 and the pricing thereof.
4 For example our research indicates that the cancellation of the SAA flight
to India has fundamentally affected the ability to attract a spread of tourists from around that country
To develop and implement a world-class
tourism marketing strategy for South Africa.
In pursuance of this, SA Tourism will:
Develop and implement domestic,
regional and international marketing
strategies informed by research,
information and knowledge-sharing;
Develop and implement a business
events’ strategy;
Implement and maintain a recognisable,
credible and globally benchmarked
system of quality assurance;
Facilitate strategic alignment of provinces
and industry – in support of the
marketing of tourism;
Continuously align efforts to support
tourism growth; and
Ensure the efficient utilisation of
resources in order to deliver against the
tourism strategy.
Figure 21: SA Tourism’s Mission statement

17
Table 5: NTO/ NTA functions, 2009
Source: UNWTO, Budgets of National Tourism Organisations 2008-2009, 2010.
Our Recommendations
1. While the focus on the Board at the expense of the
broader organisation needs to be remedied in the
Tourism Act, we are confident that SA Tourism’s
mandate and role as specified in the Act are
appropriate. The mandate is sufficiently flexible and
relevant to the tasks required of a destination
marketing organisation. International leisure tourism
marketing should remain the main focus of SA Tourism
with domestic tourism marketing and business tourism
marketing as important additional areas.
2. As a supply side intervention, TGCSA should be
removed from SA Tourism’s operations as it is not well
aligned to the organisation. (See more proposals in
TGCSA Section).
3. There exists a serious disconnect between what SA
Tourism is doing and what it is understood to be doing.
The mandate needs to be communicated effectively.
4. As part of their mandate, SA Tourism needs to explicitly
develop and deepen the partnership with the public
and private sectors. This should be subject to
performance measurement and review.
5. NDT needs to play a clearer role vis-à-vis SA Tourism.
While SA Tourism has a role to play in making the case
for tourism’s economic contribution and the need to
invest in tourism marketing, NDT must address
destination constraints - particularly those put in place
by other departments, such as visa regulations, health
concerns, statistics, etc.

18
3.2 International Marketing
Introduction
The mainstay of SA Tourism has always been international
marketing. Priority markets and segments are identified
and targeted based on regular research. SA Tourism also
undertakes benchmarking to track the destination’s brand
performance.
SA Tourism generates awareness of the destination and
demand through Joint Marketing Agreements and
communication activities. The organisation also works with
the outbound trade to package the destination; this is
mainly through the work of country offices in 12 different
source markets.
It delivers its marketing campaigns through a range of
service providers who essentially project manage the
campaigns, including global advertisements (print,
billboards, TV), local and international trade shows, digital
campaigns and the web, public relations activities, events,
and so on.
Stakeholder views
75% of the private sector respondents of the online
survey agree or totally agreed that SA Tourism could
improve its international marketing efforts. This was
also the view of the focus groups.
o There was a concern expressed that SA Tourism is
removing focus from traditional markets in favour
of new markets.
o Certain stakeholders raised the age-old criticism
that SA Tourism privileges certain local destinations
in its marketing campaigns and collateral.
o Many stakeholders called for greater innovation in
campaigns and ‘freshness’. In certain instances it
was suggested that SA Tourism start from scratch to
re-establish the brand uniqueness and focus on this.
o In general, stakeholders were quite positive about
the digital marketing initiatives of SA Tourism, such
as those with TripAdvisor. There was a call for
increased focus in this area.
o There were various criticisms linked to perceptions
of the large size and sense of ostentation associated
with SA Tourism travel delegations to international
tourism shows. This is perceived as wasteful and
not in keeping with our brand proposition and
country identity.
o The role of provinces and cities at international
tourism shows was also queried in terms of their
strategic value.
In terms of market opportunities, the following were
consistently identified:
o A focus on the unique visitor experiences that
distinguish South Africa from its competitors.
o Niche markets, particularly youth, cultural/
heritage, urban and medical.
o Greater collaboration with cities, domestic regions,
destinations.
o Greater regional and continental collaboration.

19
Figure 22: Private sector views on the International Marketing of SA Tourism
Source: TBCSA online survey of Associations’ members, 2015
In terms of other marketing platforms, many queries
and concerns were voiced around Indaba’s relevance,
buyer selection for shows, and the usefulness and
availability of other tools for trade and product
owners, such as a national product database and
image library.
Our research
SA Tourism only converts about 1% of its target market
into actual tourist arrivals – so the opportunity to grow
foreign leisure tourists is significant.
Priority Market and Segments
Figure 23, adjacent, shows SA Tourism priority markets.
The key metrics of volume and value are used to arrive at
this strategic prioritisation.
The prioritised segments have not changed for some
time. These are:
‘Wanderlusters’ (singles or couples aged 25 to 40),
and
‘Next-stop-South Africa’ (traditional market of
wealthier experienced travellers aged 40 to 60).
Figure 23: SA Tourism's Portfolio markets
AFRICA AMERICAS ASIA &
AUSTRALA
SIA
EUROPE &
THE UK
CORE
MARKETS
Angola
Domestic
Kenya
Mozambique
Nigeria
Tanzania
Brazil
USA
Australia
China
India
France
Germany
Netherlands
UK
INVESTMENT
MARKETS
Botswana
DRC
Ghana
Lesotho
Uganda
Zimbabwe
Canada Japan
South Korea
Italy
Russia
TACTICAL
MARKETS
Namibia
UAE
Zambia
- Singapore Switzerland
WATCH-LIST
MARKETS
Ethiopia
Malawi
Swaziland
Argentina New Zealand Austria
Belgium
Denmark
Finland
Norway
Spain
Sweden
Turkey
STRATEGIC
IMPORTANCE
Egypt, Israel,
Morocco,
Saudi Arabia,
Tunisia
- Malaysia -
Source: SA Tourism, Portfolio Review, 2013
5 - don't know 1 - totally disagree
3- partially disagree
16 - neutral
25- partially agree
50 -totally agree
SAT could improve its marketing to international tourists

SA Tourism Review: Report of the Expert Panel, June 2015
20
The brand experience or elements for the country relate
to diversity, possibility and ubuntu embodied in people,
heritage and culture, breathtakingly enriching memories,
and life-changing experiences.
Brand Performance
According to the 2013 Brand Tracker Survey results,
South Africa sustained its brand ranking compared to the
brand attributes of 13 of its rival destinations, including
Australia, Thailand, Brazil, Kenya and the USA. While
South Africa performed better than other competitors in
most attributes, key competitors like Australia and
Thailand were still ahead of South Africa – especially on
brand awareness, brand positivity and “destination under
consideration”.
South Africa is strongly perceived as being a destination
offering an ‘adventurous’ and a ‘natural wildlife’
experience – and remains dominant on these attributes
in most markets.
The global closure ratio (indicating those who visited the
destination in relation to those who sought information
on the destination) declined to 1:2.27 (in 2013) from
1:2.14 (in 2012).
Marketing Platforms and approaches
Trade shows held in South Africa
SA Tourism is refocusing Indaba to improve its relevance
to the trade, but there are now a diversity of
independently run trade shows held locally - World Travel
Market Africa, International Luxury Travel Mart Africa
and ‘We are Africa’. Anecdotal reports indicate a drop in
the number of deals done at Indaba, and the trade and
buyers are often prioritising other events. A separate
review has proposed a set of strategic recommendations
to improve Indaba’s relevance, standing and
performance.
International Trade shows
Provinces and cities do not add much value to the SA
Tourism exhibition stands or the broader South African
presence at global tourism shows, as they are unable to
transact, and in fact fragment the overall offering. Their
funds might be spent better elsewhere. While tourism
shows are still an important part of transacting for the
travel market, their importance is decreasing with the
advent of other digital platforms. SA Tourism needs to
develop a clear understanding of the value of trade
shows relative to their cost and the overall marketing
strategy; and, linked to this, the best manner in which to
present the country, and its offerings at such shows. An
assessment of participation also needs to include
reviewing pre- and post-show contacts.
International travel expenditure records for SA Tourism,
as provided to the Panel do not disaggregate the size of
delegations, composition or other travel choices. As a
result it is not possible for the Panel to comment
authoritatively on the matter of the size of, or
expenditure associated with teams attending tourism
shows.
Website and digital marketing
In line with current best practice, SA Tourism draws
extensively on user-generated content for its website.
User-generated content is preferable to mediated
content in that it genuinely reflects experiences and is
seen as reliable by potential tourists.
According to SimilarWeb, southafrica.net enjoys a higher
time on the site than some of our competitor
destinations, on average over four minutes with over four
pages viewed.
The website’s traffic is derived predominantly from
organic search (54.8%), followed by direct (27%) and
referrals (13%). Almost 46% of its traffic is from South
Africa, followed by the USA (13%) and the UK (8%).
SA Tourism has a range of digital marketing partnerships
with online travel players like TripAdvisor, WAYN.com
and Expedia, and supplements its online marketing
through Google Adwords, Lastminute.com, YouTube,
Opodo, E-Bookers, CNN and NatGeo. The southafrica.net
website is mobile responsive. The My South Africa
essentials iPhone App was launched in 2010.
SA Tourism Review: Report of the Expert Panel, June 2015
21
However, while SA Tourism has an extensive presence on
the web, it is not coherent enough: there are 17 sites all
with a different slant to attracting visitors to South Africa.
SA Tourism has contracted many agencies to work across
these multiple digital assets. While the country specific
requirements must be recognised and met, greater
conformity can be achieved.
Databases
There exists a range of resources for the trade and
product owners on the SA Tourism website with regard
to product databases and images. Not all are readily
accessible and they are also not well communicated.
Marketing execution model: service providers
SA Tourism enters into a range of contracts with services
providers. These providers deliver various project
management and content for marketing and
communications activities. An overall three year contract
is also entered into with a primary advertising agency to
project manage and execute many of these marketing
activities and platforms. (This contract is currently held
by Ireland Davenport. It has recently been extended to
September 2015, at a retainer of approximately R2,6
million per month).
Working with and through country offices/ hubs
Country offices focus on working with the trade to assist
with conversion. Effective work requires regular and
respectful engagement between Head Office and country
offices, particularly with regard to content and the
peculiarities of the markets. Furthermore, an
appreciation needs to be developed that certain global
marketing choices are not appropriate for all markets.
[China is a market that requires a different approach, as
Google-based IT and digital approaches do not work
there, and global media platforms like CNN are also not
pervasive communication tools]. The relationship
between Head office and Country offices is considered in
greater detail in the section “Organisational Structure
and Human Resource Development”.
Benchmarking
A number of marketing trends observable in NTOs
include:
Co-operative, or joint marketing, programmes are
popular for international campaigns and
communication strategies. Figure 25 which follows
provides an example of excellent co-operative
marketing in Australia.
A classic partnership marketing initiative was
Tourism Australia’s their ‘Best Job in the World’
competition, which got more than 620,000
applications from 330,000 individuals from 196
countries. It was done in partnership with
state/territory tourism organisations and
commercial partners Virgin Australia, STA Travel,
Citibank, Dell, IKEA, Sony Music and Monster.com.
Tourism Australia has also signed eight three-year
agreements with Emirates (AU$14.3m), Virgin
Australia (AU$12m), STA Travel (AU$9m), China
Southern Airlines (AU$9m), China Eastern Airlines
(AU$8.6m), Air New Zealand (AU$6m), Air China
(AU$6m) and Etihad (AU$6m). This indicates the
strength of their relationships with airlines and
their recognition of the importance of airlift access
to their country.
A common theme is the increased move to digital
marketing and enhanced website functionality.
For examples, India Tourism has recently
revamped www.incredibleindia.com in line with
their plans to increase digital marketing. Tourism
Australia is working on a system that will take the
consumer through the whole process of travelling
– from the dream, to the planning, booking,
travelling and sharing your experiences
afterwards.
Cities/ provinces/ regions tend to market
internationally too, sometimes co-operatively,
sometimes not. This indicates that the challenge
of cooperative marketing across the spheres of
government is by no means unique to South
Africa.

SA Tourism Review: Report of the Expert Panel, June 2015
22
Most established NTOs have long standing
campaigns that they run under the same umbrella
campaign – ‘There is nothing like Australia’ (2010),
‘100% Pure New Zealand’ (1999) and others like
‘Incredible India’, ‘Amazing Thailand’, ‘Magical
Kenya’ are five or more years old, but constantly
refreshed to add new elements.
Our recommendations:
1. SA Tourism should demonstrate leadership in
international marketing through innovation and
freshness, and a clear strategic core that aligns and
links the many marketing activities (including digital
and traditional, across and between countries, etc.).
SA’s competitive advantage lies in the very unique
experiences we can offer as a country. We should be
capitalizing on this, and not following in the tired
footsteps of others by marketing only adventure,
wildlife or beaches.
2. SA Tourism should review its marketing execution
business model, particularly the extensive use of
service providers.
3. SA Tourism should seriously consider handing over
the management of Indaba to an independent
operator, given that industry is now actively and
successfully operating in this space (as evidenced by
WTM Africa), and the drain that Indaba places on SA
Tourism resources.
4. SA Tourism should review its practices for buyer
selection and participation at international tourism
shows (particularly of provinces and cities, and its
own travel delegations). With the growing using of
online platforms to research and book travel,
investment in tourism shows might increasingly
provide less of a return than investments in other
marketing media and techniques.
5. SA Tourism should continue to have a strong focus on
digital marketing. There needs to be greater
consolidation of digital assets across the board in
order to achieve consistency in brand message and
consistency in brand tone, manner and feel.

23
3.3 Domestic Tourism
Introduction
Domestic tourism is the backbone of all successful tourism
economies. Not only is its revenue contribution often
greater than that of foreign tourism, but domestic tourism
also supports the tourism economy in other ways e.g.
through providing resilience in the face of events that might
deter foreign visitors. It may also provide a level of counter
seasonality to the months during which foreign tourists
travel, and a range of preferences for destinations, services
and experiences that might not be supported by foreign
tourists.
In many countries, including South Africa, domestic tourism
is also a source of geographic redistribution of income, as
South Africans travel to other parts of the county and spend
their money in these destinations.
Sho’t Left, now a number of years old, is the SA Tourism
domestic marketing campaign designed to encourage South
Africans to travel. A new SA Tourism domestic marketing
strategy and major budget injection plans to significantly
enhance domestic marketing over the next three years.
Figure 24: Online survey respondents satisfaction with SA Tourism's domestic marketing
Source: TBCSA online survey of Associations’ members, 2015
Stakeholder views
Stakeholders typically had less to say about domestic
tourism than international, perhaps indicating their lack of
focus in this area. Provincial and local government
stakeholders were not very clear on their own tourism
marketing strategies targeting domestic tourists.
There were divided opinions on Sho’t left: certain
stakeholders commended the campaign, while many
felt it was past its ‘sell by’ date. They pointed to a lack
of focus, obscure messaging (or even inappropriate –
most domestic travel is actually planned, not
spontaneous), and that it was not clear who the target
market was.
Visiting Friends and Relatives (VFR) travel is not seen as
an opportunity by SA Tourism, according to
stakeholders (and should be).
Totally agree, 49%
Agree, 28%
Neutral, 12%
Don't know, 7%
Disagree, 2%
Totally disagree, 1%
SAT could improve its performance in marketing to domestic tourists

SA Tourism Review: Report of the Expert Panel, June 2015
24
Metropolitan areas and cities should be viewed as
gateways, i.e. driving tourists to less visited places.
They have some funds which can be leveraged.
The domestic market is understood to be affected by
affordability, linked to disposable income and overall
performance of the economy. Many stakeholders
identified a lack of a domestic culture of travel and
poor public passenger transport as other important
issues. On the product side, insufficient product to
cater to the domestic market in terms of diversification
and prices was highlighted. The barriers to domestic
travel, as identified by stakeholders, are shown in the
pie chart, Figure 25, below.
Figure 25: Barriers to domestic travel
Source: Panel research, 2015
Our research
There is a clear lack of insight, understanding and focus on
the domestic market across all stakeholder groups. This is
despite the fact that the domestic tourism market
contributed 57% of total tourism revenue, at
approximately R125 billion, in 2013. While Visiting Friends
and Relatives’ travel has recently increased in terms of
number of trips, holiday and business travel have declined.
It is holiday travel that is seen as somewhat discretionary
and it is this market that SA Tourism focuses upon.
SA Tourism’s own research, based on its domestic survey,
indicates the reasons shown in Figure 27 as to why South
Africans do not travel. While not contradicting the view of
the private sector, and confirming the role of affordability
as key, the Domestic Survey research indicates that time
and motivation are also important factors. ‘No reason to
take a trip’ implies that proactive marketing could active
more domestic trips.
Source: SA Tourism, Domestic Survey, 2014
Sho’t Left
55% of the domestic survey respondents had heard of
Sho’t left (unaided) as indicated in Figure 28.
Figure 28: Have you ever heard of the Sho't Left campaign [unaided]
Source: SA Tourism, Domestic Survey, 2014
Sho’t left is not so much a domestic tourism strategy as a
campaign targeting one segment. As a campaign it has no
linkages to the international marketing of the brand,
leading to brand fragmentation.
46% 55% 55% 54%
45% 45%
-10%
10%
30%
50%
70%
2012 2013 2014
Unaided
Yes No
18.4
2.9 1.7 2.0
0.1
17.9
3.1 2.0 1.9 0.1
20.7
2.8 1.6 2.2 0.2
0
10
20
30
VFR Holiday Business Religious Medical
2012
2013
2014
Figure 26: Number of Domestic Trips by Purpose
35%
20% 16% 17%
10%
38%
20% 17%
11% 9%
41%
21% 19%
7% 9%
0%
10%
20%
30%
40%
50%
Cannot affordtravel
No reason totake a trip
Timeconstraints
Unemployed /no income
Disliketravelling
201220132014
Figure 27: Why South Africans don't travel

SA Tourism Review: Report of the Expert Panel, June 2015
25
New Domestic Marketing strategy
SA Tourism’s limited focus on domestic tourism – one
member of ExCo referred to it as the ‘stepchild’ of the
organisation - is currently changing with its new strategy
and budget. The new strategy, as provided to the Panel in
March 2015, will see R300 million spent between 2015/6
and 2017/8, will focus on:
The 5 priority segments for travel and spend based on
the 2011 SA Tourism domestic research study. These
are High-Life Enthusiasts, Spontaneous Budget
Explorers, Seasoned Leisure Seekers, New Horizon
Families and Well-to-Do Mzansi Families. It will also
focus on Middle Income Whites to try and boost
numbers.
The selected use of media channels and easily
accessible value packaged deals. SMME and small
travel businesses will package deals for ordinary South
Africans. Furthermore, online tour operators will be
partnered as will SANParks and Cape Nature.
Building a culture of travel through targeting the 9
other segments that travel very little as well as
targeting schools for school trips and tertiary
institutions.
Seasonality and geographic spread, to be addressed
through ‘deal driven tactical campaigns’ in the low
season from May to September and the use of iconic
heritage sites such as SANParks, Table Mountain
Cableway, Maropeng, etc. to incite free entry to
attractions encouraging day trips.
The budget is being divided between creating
awareness and a culture of travel, and conversion. This
is shown in Figure 29, adjacent.
Figure 29: Domestic Budget Breakdown
Source: SA Tourism, Domestic Tourism Strategy, 2015
The Panel believes that the new domestic tourism strategy
should be enhanced in a number of ways. It should:
review past performance of domestic campaigns,
such as Sho’t left;
reflect on the barriers to domestic tourism in
South Africa, including affordability, ‘no reason to
travel’ and so on;
consider opportunities for leveraging off
domestic VFR travel, which is currently the main
purpose of travel;
analyse the product offering for domestic tourists
and review ways to attract domestic tourists to
existing product, as well as product gaps and
opportunities;
consider the seasonality associated with
domestic tourism, as well as other factors, such
as the use of public transport, size of travel
groups, and so on;
undertake benchmarking of other domestic
tourism approaches to highlight any possible
learnings from elsewhere in the world; and
use options’ analyses, cost-benefit analyses, or
other strategic tools to consider how best to
deploy the new funds towards marketing
activities targeting the priority domestic
segments.
0%
10%
20%
30%
40%
50%
60%
70%
80%
2015/2016 2016/2017 2017/2018
Creating awareness + a culture of travel Conversion
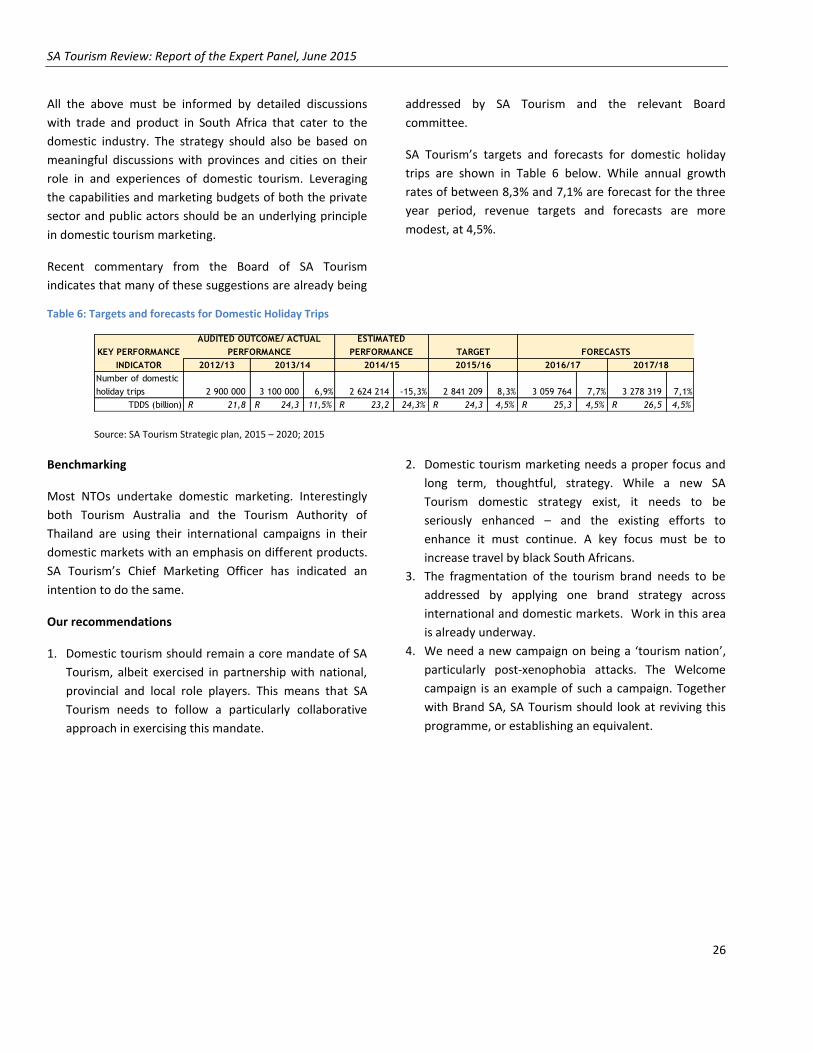
SA Tourism Review: Report of the Expert Panel, June 2015
26
All the above must be informed by detailed discussions
with trade and product in South Africa that cater to the
domestic industry. The strategy should also be based on
meaningful discussions with provinces and cities on their
role in and experiences of domestic tourism. Leveraging
the capabilities and marketing budgets of both the private
sector and public actors should be an underlying principle
in domestic tourism marketing.
Recent commentary from the Board of SA Tourism
indicates that many of these suggestions are already being
addressed by SA Tourism and the relevant Board
committee.
SA Tourism’s targets and forecasts for domestic holiday
trips are shown in Table 6 below. While annual growth
rates of between 8,3% and 7,1% are forecast for the three
year period, revenue targets and forecasts are more
modest, at 4,5%.
Table 6: Targets and forecasts for Domestic Holiday Trips
Source: SA Tourism Strategic plan, 2015 – 2020; 2015
Benchmarking
Most NTOs undertake domestic marketing. Interestingly
both Tourism Australia and the Tourism Authority of
Thailand are using their international campaigns in their
domestic markets with an emphasis on different products.
SA Tourism’s Chief Marketing Officer has indicated an
intention to do the same.
Our recommendations
1. Domestic tourism should remain a core mandate of SA
Tourism, albeit exercised in partnership with national,
provincial and local role players. This means that SA
Tourism needs to follow a particularly collaborative
approach in exercising this mandate.
2. Domestic tourism marketing needs a proper focus and
long term, thoughtful, strategy. While a new SA
Tourism domestic strategy exist, it needs to be
seriously enhanced – and the existing efforts to
enhance it must continue. A key focus must be to
increase travel by black South Africans.
3. The fragmentation of the tourism brand needs to be
addressed by applying one brand strategy across
international and domestic markets. Work in this area
is already underway.
4. We need a new campaign on being a ‘tourism nation’,
particularly post-xenophobia attacks. The Welcome
campaign is an example of such a campaign. Together
with Brand SA, SA Tourism should look at reviving this
programme, or establishing an equivalent.
2012/13
Number of domestic
holiday trips 2 900 000 3 100 000 6,9% 2 624 214 -15,3% 2 841 209 8,3% 3 059 764 7,7% 3 278 319 7,1%
TDDS (billion) 21,8R 24,3R 11,5% 23,2R 24,3% 24,3R 4,5% 25,3R 4,5% 26,5R 4,5%
ESTIMATED
PERFORMANCE TARGET FORECASTS
2016/17 2017/18
KEY PERFORMANCE
INDICATOR
AUDITED OUTCOME/ ACTUAL
PERFORMANCE
2013/14 2014/15 2015/16

27
3.4 Tourism Grading Council of South Africa
Introduction
Star grading systems for accommodation exist in many
countries. They still provide an assurance role, albeit
limited, that establishes comfort and a benchmark in the
mind of the consumer. However the changing face of
travel – now informed by online databases of peer
reviewed products and experiences – questions the long
term business case for traditional grading systems.
In South Africa, the Tourism Grading Council has operated
for just over ten years, and has been through a series of
reviews and business model refinements. The latest
business strategy, dated mid-2014, requests additional
resources and funds from NDT to better fulfil its mandate.
Stakeholder views
Stakeholders expressed a unanimous view that the
TGCSA does not fit within SA Tourism’s mandate.
Questions were raised regarding the business case for
TGCSA:
o Certain stakeholders believed that in the era of
social media driven reviews of destination
accommodation and experiences, a national
grading council is irrelevant.
o Other stakeholders felt that a grading council is still
needed, but with a curtailed role, and with a clear
business proposition.
o Yet others suggested that grading had a role but
could only work if it became mandatory.
Concerns were also expressed about the performance
of the TGCSA, amongst others:
o Limited consumer awareness and feedback.
o Major corporations have left the grading system.
o There aren’t sufficient benefits for participating
enterprises.
o The grading system requires improved evaluation
criteria and assessment frequencies.
o Ungraded establishments should be penalised by
timely removal of their TGCSA plaques.
o The website is not user-friendly
Our Research
TripAdvisor and other websites provide consumers with a
direct channel to rate their experiences in the destination.
A challenge here is that for smaller accommodation
properties there may not be sufficient TripAdvisor ratings
to provide guidance to potential customers. Thus part of
the value of star grading systems appears to be for non-
hotel accommodation, where the tourist wishes to get a
third party sense of the level of facilities.
Consumer experience is not limited to the facilities offered
(size of bed, television services, etc.). Many potential
customers are looking for a broader rating of the overall
experience at the establishment, linked to an increasing
desire for experiences. This challenges traditional grading
methods, which focus on the physical set of facilities more
than other, ‘softer’ considerations.
Performance of TGCSA
Board minutes and documents provided to the Panel
indicate that as many as 25% of the establishments
previously signed up to the TGCSA are no longer graded
properties.
A new business model proposed by TGCSA in mid-2014
motivates for additional resources and funds from NDT.
This is in order to better fulfil its mandate and to make the
‘basket of benefits’ available. Table 7 shows TGCSA targets
indicating forecast performance on the current strategy,
and with implementation of the new strategy.
Table 7: TGCSA performance and targets for graded properties
2012/3 2013/4 2014/5 2015/6
Actual Actual Forecast Estimated
6022 5587 6068 *7088
6493 *8155
*if new strategy implemented
Source: TGCSA Final Strategy; 2014
The new Tourism Grading Council strategic plan
includes:

SA Tourism Review: Report of the Expert Panel, June 2015
28
Continuously increasing the base of graded
establishments, as well as renewals.
Increasing value-add for graded establishments
through a tangible Basket of Benefits.
Empowering assessors to be of greater value to the
establishments.
Offering support to Exempted Micro Enterprises
(EMEs) – in order to create a more inclusive base of
graded establishments.
The same plan indicates that TGCSA will also:
Review the assessor model, and consider moving from
an outsourced function managed through Service
Provider Agreements to full-time employment.
Enhance and improve the integrity of the grading
criteria and process.
Enhance the competency and integrity of the grading
assessors.
It is clear from the above that the TGCSA is attempting to
grapple with certain of the challenges that confront its
business model. However it remains unclear to the Panel
what the demonstrable value of the grading system is.
In addition, the NDT has instructed TGCSA to extend
grading beyond accommodation to other industries such
as attractions, restaurants and tour operators. TGCSA has
also been requested to manage the Lilizela awards – an
annual industry awards programme. Given that TGCSA has
yet to excel within the traditional sector, this desire to
expand its mandate may be misplaced.
The recruitment of a new Chief Quality Officer is currently
underway.
Benchmarking
A United Nation’s World Tourism Organisation published
study, “Online guest reviews and hotel classification
systems”, looked at the integration of hotel classifications
(i.e. grading systems) with online consumer reviews. While
they should ideally be more integrated, the study found
this to be difficult, for a few reasons:
1. Consumers use both — the classification system gives
them the area to research (i.e. 3-4 stars in a certain
location), followed by online reviews to make their choice.
2. Online reviews work because they are perceived to be
independent. Bringing the two systems together might
raise concerns regarding review authenticity.
What is clear is that online reviews play a critically
important part in selection of properties. While the TGCSA
does have feedback on their site, it appears to be feedback
to the organisation and not reviews as such. Linking
consumer reviews of the graded properties to the star
grading could enhance the value of the TGCSA for
consumers.
Our recommendations
1. The TGCSA be moved from SA Tourism. A
separate process should consider where best it
could be located. The Panel has identified 3
possible options for its new location:
o A government component under NDT.
o A separate agency operating under its
own board (‘the Council’).
o The South African Bureau of
Standards (SABS). SABS is an attractive
option as it is the home of standards,
including voluntary standards. Under
the Act the Minister can assign the
TGCSA to SABS.
2. The process of recruiting a new Chief Quality
Officer should be put on hold until such time
as the location and business model, including
funding, for the TGCSA has been determined
3. The new business model for TGCSA should be
interrogated as to whether there is real value
in a grading council for industry and the
destination. The extended mandate should be
reviewed. In this regard, a limited role with
limited costs to the fiscus should be considered
for the short to medium term. The TGCSA
should principally be self-funding, which will
create a structured system of accountability. If
a compelling case is not built for the grading

SA Tourism Review: Report of the Expert Panel, June 2015
29
system and industry walks away from it, NDT
should not be required to subsidise it.
4. SA Tourism should continue to partner with
TripAdvisor and other online platforms that are
extensively used to research product and for
peer reviews of the destination.

SA Tourism Review: Report of the Expert Panel, June 2015
30
3.5 South African National Convention Bureau
Introduction
Business tourism includes travel to business events such as
meetings, conferences and exhibitions. It also includes
participating in incentives (or rewards) travel but excludes
regular business travel, which is not discretionary and
where NTOs can do little to leverage it. The appeal of
business tourism, and the reason many destinations now
target this market, is that business tourists’ spend is high,
and many business tourists extend their trip to leisure
travel, or return to the destination as leisure tourists.
According to the SA Tourism 2013 Annual report on
international arrivals, business tourists accounted for 8,3%
of all arrivals, up from 5,9% in 2012.
After research into the potential of business tourism, and
ways in which it could be leveraged by a dedicated team,
the South African National Convention Bureau (SANCB) was
established at SA Tourism. It is relatively new –
commencing operations in March 2012. Its primary focus is
support to industry and destinations in bids to host major
business tourism events.
Stakeholder views
Most stakeholders were positive about SANCB’s
performance. Suggestions to improve its performance
included:
More resources – a substantial bid fund.
Advance planning of more than a year and only attract
mega events that build strategic partnerships.
Work more closely with airlines.
Tourism organisations should have access to the
statistics and be aware of SANCB targets.
Improve buyers for Meetings Africa, share data,
market conference venues.
Ensure fair provincial representation.
Cities need to be included in meetings with SANCB,
not just provinces.
Our research
The business tourism strategy at SA Tourism is distinct from
the leisure portfolio market and segmentation approach.
Major associations are targeted (as they decide on the
location of events) using a hybrid sales model combining
sales representatives and in-house sales teams.
The business tourism priority markets and segments are
shown in Table 8, below.
Table 8: SA Tourism priority business tourism markets and segments
MEETINGS INCENTIVES CONVENTIONS EXHIBITIONS
Targeted geographic
locations
SADC, Europe, USA and
Asia
UK, Europe, US, BRICS and
Asia
Europe, USA and Africa South Africa, Europe and
US
Target audience African product launches
and user groups, as well
as African regional
meetings of multinational
corporations.
Incentive companies,
corporate agencies, and in-
house planners.
Associations with South
African key contacts or areas
of specialisation.
Internationalising
national shows and
African versions of
existing titles.
South Africa’s potential Limited Strong Strong Limited
Source: SA Tourism Strategic Plan: 2015 – 2020; 2015

31
SANCB provides a range of services within the business
tourism arena, from bid support to on-site services as
indicated in Figure 30, below.
Little market intelligence currently exists for business
tourism in South Africa.
According to the Strategic Research unit of SA Tourism, a
project is currently underway to establish benchmarks and
measures for business tourism. This is due to be completed
by the end of next year.
Source: SA Tourism Strategic Plan: 2015 – 2020; 2015
Structure and reporting of SANCB
As shown in Figure 31, the SANCB reports to a SANCB
Marketing sub-committee which in turn reports into the SA
Tourism Marketing Committee, and this to the Board.
Source: SANCB Activation Strategy, 2015
This complicated reporting and decision-making structure
impedes quick decisions and approvals.
The mechanism for coordination between primary
government stakeholders is the Business Events
Coordinating Forum (BECF). It consists of the heads of all
the Convention Bureaus and Business Events units in SA
and is recognised as the official coordinating platform. It
has developed and agreed on the minimum criteria for the
establishment of Convention Bureaus and Business Events
units in SA.
There are currently 5 Convention Bureaus (Durban KZN CB,
Cape Town and Western Cape CB, Johannesburg CB,
Tshwane CB and Gauteng CB) and 5 Business Events units:
Nelson Mandela Bay Tourism, Limpopo, Mpumalanga,
Northern Cape and the North West Province. In each case
jointly agreed to guidelines inform the status and
operations of these Bureaus and Units. These specify the
nature and extent of industry participation, budgets, legal
status, staff members, trade show participation, number of
S A N C B S U P P O R T S E R V I C E S
Bidding
Support
Bid strategy
Bid document lobbying
Bid promotion
Bid presentations
Site Inspection
Support
Bidding site inspections
Convention planning site inspections
Convention Planning
Support
Planning support
Venue and supplier recommendations
Final decision with client
Delegate Boosting Support
Marketing support to promote SA conferences
Delegate attendance promotion
On-Site Event Services
Support of
on-site
elements of
the event
Figure 30: SANCB support services
SA Tourism Board
CEO Marketing Committee
Chief Convention Bureau
Officer SANCB Marketing Sub-
committee Chairperson – SA Tourism
Board member
Business Events
Coordinating Forum
Figure 31: Reporting Structure of SANCB

SA Tourism Review: Report of the Expert Panel, June 2015
32
annual meetings and recognition / endorsement by
provincial and / or local government.
On the face of it, it appears that this Business Events
coordinating forum between national, provincial and local
tourism bodies is a far more strategic and tightly run affair
than the CEO’s and Marketing forums that characterise
their leisure tourism counterparts.
Subvention Fund
SANCB and SA Tourism ExCo have indicated that a
Subvention Fund is necessary to boost the support that
SANCB can offer to organisations and associations that bid
for major business events. The subvention fund may
include cash or in-kind incentives, including interest free
loans, insurance, etc. Much of its finance to date has been
taken up by financial guarantees required by the
associations that award bids to destinations.
A policy on subvention has been developed together with
industry to motivate for the funds – and a motivation was
made in the 2015 MTEF motivation. It amounted to R36
million for 2015/6, growing to R39,6 million in 2016/7.
According to SA Tourism, the funding request was not
granted. A set of policies, procedures and criteria are in
place to support the subvention fund, should it be secured
in future.
SANCB should use the benchmarks and measures for
business tourism that are currently under development at
SA Tourism to make a case for an increased share of the SA
Tourism budget, including a substantial subvention fund, in
the order of R100 million. Any motivations should however
be well-substantiated relative to best practice elsewhere in
the world and a track record of good performance
including a demonstration of ‘return on investment’ by
SANCB.
Benchmarking
NTOs tend to market to business events’ markets but few
run a bureau:
In Tourism Australia, a division exists for business
tourism marketing called Business Events Australia. It
works with the state convention bureaux and the
tourism industry to showcase Australia’s best incentive
offerings. The Association of Australian Convention
Bureaux brings together 15 city and regional bureaux
dedicated to marketing. The bureaux recognise their
collective responsibility to promote Australia as a
whole.
The Canadian Tourism Commission has a marketing
division called Business Events Canada. Besides
marketing Canada as being the best place to do
business and invest, the division focuses on priority
sectors where Canada holds a competitive advantage.
The Indian Convention Promotion Bureau, set up in
1988 as a non-profit organisation consists of members
from the travel trade, airlines, hotels etc. and their job
is to promote and raise awareness of India as a
Meetings, Incentives, Conferences and Exhibitions
destination. The Ministry assists them with money to
make bids from the members through its Market
Development Scheme.
Our Recommendations
1. The SANCB is a new institution and should be given an
opportunity to perform.
It should however be making a more compelling
business case to NDT, National Treasury and
industry for its existence and the motivation for the
use of state resources for subvention funding.
Effective Delegations of Authority need to be
developed to allow for speedy approvals affecting
SANCB operations without the formal sitting of the
Marketing committee of the Board, or the Board.
2. While it might not be currently appropriate for the
Subvention fund to be partly recapitalized from
successful bids through a levy on income received from
events, it is important that self-funding mechanisms
continue to be considered with the maturation of
SANCB and the Business Events’ industry. This will
reduce reliance on the fiscus and could provide for
greater flexibility.
3. Improved research and analysis must be generated for
business tourism, including data from business events
attendees (SANCB is in a position to get significant data
through surveys of attendees at events). This data can

SA Tourism Review: Report of the Expert Panel, June 2015
33
assist to make a case for subvention. Metrics must also
be developed to measure performance and the data
shared with industry.
4. SA Tourism must maximise the linkages between
business and leisure tourism. Within the various
strategies, plans, research, etc. there is no indication
that this area has received much attention.

34
3.6 Institutional positioning and partnerships
Introduction
Tourism is a concurrent function in government. It is also
impacted by a range of other national government
departments. Those that most affect tourism growth in
South Africa include safety and security (concerns regarding
crime), health (concerns regarding diseases), home affairs
(particularly visa regulations), transport (with relation to
international air service agreements, and aviation and
airport taxes) and higher education and labour (with regard
to labour relations and skills development).
Certain departments have reach and resources that could be
better leveraged for international marketing and brand
positioning. These include Telecommunications and Postal
Services (specifically Brand SA), the Department of
International Relations and Cooperation, and the
Department of Trade and Industry (through Trade and
Investment South Africa’s marketing and economic staff
stationed at missions).
In terms of the product mix and offering, Arts and Culture;
Sports; and Environment; are together responsible for the
oversight of many of the country’s natural, cultural heritage
and sporting facilities and events.
Provinces all have departments that contain a tourism
function, often with economic affairs / development and/or
environment. Each of the nine provinces also has a tourism
agency, again often with conservation and/or investment
promotion.
Local government also supports tourism, both within
economic development, and through visitor information
centres and bureaus. The biggest metros have standalone
tourism offices.
The private sector in tourism is comprised of many different
industry associations that represent different parts of the
value chain, from airlines, to intermediaries such as inbound
operators, to destination products like restaurants, hotels,
vehicle leasing, and the like.
Figure 32: TBCSA member associations
Source: TBCSA presentation to Tourism Portfolio committee, 2015
Certain associations exist on the basis of the tourist
segments they service, such as the Professional Hunters
Association, and the South African Youth Travel Federation.
The Tourism Business Council of South Africa (TBCSA) has
many of the associations as members, in addition to certain
of the larger corporate players. The current membership of
TBCSA is indicated in Figure 32 above.
Stakeholder views
The private sector and certain public sector bodies
believe that NDT and SA Tourism are not managing to
drive the tourism agenda across government. A
particular deterrent to tourism which has been singled
out (amongst others cited) is the new visa rules which
require tourists to appear in person to apply for visas.
Industry believes this had a major impact on tourist
arrivals from India and China in the last quarter of 2015.
The perceived inability of SA Tourism to speak out about
Ebola was also criticized.
The private sector is very dissatisfied with the level of
engagement with SA Tourism. They mentioned in
particular that they don’t have one person or team who

SA Tourism Review: Report of the Expert Panel, June 2015
35
is ‘industry-facing’ for them to contact. It appears that
the lack of a collaborative approach with industry is a
pervasive trend across the organisation.
Public sector stakeholders indicated that the CEO’s
forum and the Marketing managers’ forum are not
particularly strategic platforms and called for enhanced
collaboration and coordination between SA Tourism (and
NDT) and the provinces.
A challenge exists for the big cities that are not
accommodated in the existing (limited) communication
channels and are meant to work through provinces to
engage in the CEOs forums.
Natural and cultural heritage organisations have no
formal channels of engagement with either SA Tourism
or NDT. Of particular note is that SANParks does not have
a channel of engagement with SA Tourism despite being
the largest provider of tourist beds in the country.
Some stakeholders have commented that the original
conception behind Brand SA remains valid – i.e. brand
management is an essential adjunct to the destination
marketing efforts of SA Tourism.
Our research
Although tourism is a function of the three spheres of
government, it is essentially a private sector activity, with a
limited regulatory role for government. Government does
participate as a player in the tourism economy within the
accommodation and other offerings at national, provincial
and municipal conservation and heritage facilities.
Private sector
A strong relationship with TBCSA does not adequately
substitute for engagement with industry at large. Nor is ‘The
Power of One’, an annual roadshow by SA Tourism, a
platform for SA Tourism to share its marketing work, a
sufficient mechanism for engagement.
TBCSA has identified a number of opportunities for
collaboration, as indicated in Figure 34.
Figure 33: Online Survey responses to SA Tourism understanding of their business needs
Source: TBCSA online survey of Associations’ members, 2015
Figure 34: Opportunities for collaboration with TBCSA
Source: TBCSA presentation to Tourism Portfolio committee, 2015

SA Tourism Review: Report of the Expert Panel, June 2015
36
National Government
Tourism does not feature prominently within the cluster
system of coordination, or current priorities initiatives like
the Presidential Infrastructure Coordinating Commission and
its Strategic Integrated Projects. NDT needs to lobby more
effectively for the importance of tourism, and the need for
coordination in national government in those areas which
impact upon tourism.
Brand SA, DIRCO and TISA
The role of Brand SA as defined by its Board Members is to
create and harness messages to position South Africa in a
positive light. Given this mandate, it is surprising that there
is no mechanism or forum for Brand SA and SA Tourism to
discuss and shape this positioning on an ongoing basis.
South African embassies should be our brand ambassadors,
and NDT and SA Tourism should be concentrating on
empowering them to effectively market the destination
through e.g. participating in training programmes for
ambassadors, giving them brand guidelines, sharing
marketing insights and so on. Some work has been
conducted on this front by NDT and SA Tourism.
The same applies to the Department of Trade and Industry
economic representatives and marketing officers who are
located in the foreign missions. There are currently no
formal structured programmes with these officials.
Provinces and Local Government
Coordination between NDT and provincial departments is
through MINMEC and MIPTEC. SA Tourism formally
communicates with the provinces through the CEO’s forum
and the Marketing Managers’ forum but discussions in these
forums are not sufficiently focused on strategy. Local
government is meant to work through provinces.
Figure 35 shows the total budget of R1,5 billion for the
combined tourism allocations within provincial departments
in 2014/5. Despite this considerable budget, in reality the
levels of coordination between provinces and between
national and provinces are weak. The budgets are simply not
leveraged for maximum impact.
Figure 35: Provincial Tourism Budgets, in R millions, 2014/5
Source: National Treasury, Estimates of Provincial Expenditure; 2014
*Gauteng includes not only Gauteng Tourism Authority, but the Cradle of
Humankind and Dinokeng projects too.
** A large portion of Mpumalanga, Eastern Cape and North West’s budgets
include the provincial Tourism and Parks agencies. Much of those agencies
funding is likely to go on conservation activities, not tourism.
Provinces should be responsible for getting tourists into
their regions. They can market to trade in collaboration with
country offices, and even run joint campaigns. Some
provinces do undertake international Joint Marketing
Agreements (for example KwaZulu-Natal has such
agreements in Poland where SA Tourism does not operate).
The most effective place for provinces to spend their funds is
on hosting trade and media: certain provinces have quite
substantial hosting budgets.
Municipalities need to focus on getting the basics right such
as roads, and other infrastructure services. With digital
technology, walk-ins to information offices are dropping.
There will need to be some reconceptualization of the role
of information offices and visitors centres.
Natural and Cultural Heritage Authorities and Agencies
No formal channels of coordination exist with the nature
and cultural heritage sector, or sports facilities and agencies,
other than where the tourism agency is also the
Eastern Cape, R 212
North West, R
175
Western Cape, R 115
KwaZulu-Natal, R 287
Mpumlanga **, R 333
Limpopo, R 162
Northern Cape, R 48
Free State, R 48
Gauteng*, R 157

SA Tourism Review: Report of the Expert Panel, June 2015
37
conservation authority. The World Heritage Site
management authorities are also not formally engaged,
although NDT is currently working to enhance the visitors
experience at certain of these sites.
Benchmarking
Unlike certain other NTOs (Australia and Canada, amongst
others), nowhere in its strategic plan does SA Tourism use
the language of partnerships, leverage, cooperation, or
collaboration. Certain NTOs are also measured against
stakeholder satisfaction and partnerships.
The Australia Tourism Act actually gives Tourism Australia a
function:
“to communicate effectively with the Australian tourism
industry on issues that may affect it; and
‘to increase awareness throughout Australia of the
contribution of tourism to Australia’s economy, society and
environment’.
Furthermore,
‘In performing its functions, Tourism Australia must have
regard to the needs of the Australian tourism industry and
government.’
‘Tourism Australia may perform its functions:
(a) in cooperation with the tourism industry; and
(b) in cooperation with Australian governments and
agencies, and foreign governments’.
Part of Tourism Australia’s engagement involves an annual
Australian Tourism Directions Conference, which examines
the long-term opportunities for tourism and its growing
economic value while addressing key issues. The conference
also reports on the state of the industry and delivers
research and insights. In 2013 it was attended by more than
300 leaders and decision-makers from the tourism industry,
as well as senior Australian government officials, academics
and media.
Following the national conference, Tourism Australia
conducted industry briefings around the country in
collaboration with Austrade and the state/territory tourism
organisations. They provided an overview of Tourism
Australia’s marketing initiatives, consumer insights, business
events’ activities and partnership opportunities. They were
rated ‘good to excellent’ by more than 90% of respondents
in all locations.
Tourism Australia works with all state/territory organisations
on all their campaigns.
Our Recommendations
1. SA Tourism must be underpinned by a partnership
between government and industry. SA Tourism
needs to work in a way that is fundamentally
collaborative: where collaboration is a value and
measure for the organisation.
2. TBCSA provides an overarching voice for tourism on
certain issues and should and must remain a main
channel of communication, but SA Tourism will
need to also engage with industry associations and
members across its functional areas.
3. Additional formal and informal channels are
required for communication with industry
associations, trade and product. These may include
An annual conference.
Newsletters.
Regular workshops with invitations sent through
associations (members associations of TBCSA).
A (dedicated) team or post at SA Tourism is
required to work with stakeholders (such as a
trade manager post where the primary job
description is engagement with trade and
product).
Website to be reformed to allow for
stakeholders to draw data reports of relevance.
4. New and improved platforms for cooperation and
collaboration with government should include:
A shared platform for tourism with counterpart
government departments to ensure the timely
addressing of issues with major implications for
tourism.

SA Tourism Review: Report of the Expert Panel, June 2015
38
Regular and formalized engagement between SA
Tourism and Brand SA at a marketing level,
where messaging and responses to crises, as
well as proactive opportunities, can be shared.
Provinces, as partners in tourism marketing and
destination delivery, require the CEO’s forum
and marketing managers’ forum to become
more strategic with important discussions on
brand alignment and marketing initiatives and
materials. Metros should be invited to attend
such forums. Provinces and cities need to be
empowered to play a more meaningful role.
A channel should be established to engage the
key cultural and natural heritage management
agencies, and World Heritage Sites, in a regular
manner. This could be part of the role to be
undertaken by the proposed trade and product
manager.

SA Tourism Review: Report of the Expert Panel, June 2015
39
3.7 Strategy, analytics and market intelligence
Introduction
Strategy relies on cutting-edge research and market
intelligence to inform and guide decision-making. The
quality of the decision-making is directly linked to the
accumulated intelligence from markets, insights from
partners and stakeholders. This is particularly true for an
organisation such as SA Tourism that competes in a global
arena characterised by constant change. Information and
analysis to inform insights and strategy need to be very
current.
The key research and strategic documents that inform SA
Tourism’s work include:
The National Tourism Sector Strategy of the
Department of Tourism, updated every five years.
SA Tourism’s Tourism Growth Strategy, meant to
be updated every three years, which outlines the
international marketing strategy including:
o The portfolio review, undertaken every
three years.
o The market segmentation review, every
five years.
Brand tracking, which happens each year, and
establishes how South Africa is performing in
terms of brand awareness, brand positivity and
brand associations. This is benchmarked against
peers.
A 5 year SA Tourism strategic plan.
An annual performance plan against the key
objectives and targets of the organisation.
Stakeholder Views:
Public and private sector stakeholders generally expressed
discontent with the tourism research and statistics that
exists in the country at large as well as at SA Tourism.
Particular findings relate to:
Reliability and Accuracy:
o While industry has been unhappy with the Stats SA
tourism and migration release for some time, SA
Tourism and NDT have themselves expressed
concerns regarding the veracity of recent data.
o Not only this, but the methodologies appear to have
changed, with transit tourists removed from the
latest data, which is not in keeping with previous
data nor with the UNWTO definitions of a tourist.
(However, Industry believes that the transit visitors
create an inaccurate picture of tourist arrivals, and
have singled out tourists from Brazil, China and the
US in particular in this regard).
o The small size of the sample undertaken in the SA
Tourism Domestic Survey raises questions around
the accuracy of the findings.
Comparability and coordination:
o The lack of data at a city and provincial level that is
comparable and aligned with the SA Tourism data
reduces local level analysis and comparisons.
o A lack of coordination with others sources, such as
SANParks data impacts on possible insights.
o Industry involvement in identifying trends and
research needs, and/or interpreting findings is
totally lacking.
Packaging and communication of research and market
intelligence publications:
o Stakeholders seem unaware of the range of research
publications developed by SA Tourism, including
country reports and the like. Indeed, SA Tourism has
a wealth of quality research that could enhance the
performance of businesses if it were shared better,
and if industry took greater interest and initiative in
using these sources.
Our research
Tourism Research in the country
The delay in tourist arrivals data from Home Affairs and
Stats SA in 2014 made measurement of the performance of
the tourism economy in South Africa impossible, and the
measurement of SA Tourism equally difficult. While the
data has finally been released, there are concerns
regarding its accuracy. The Strategic Research Unit of SA
Tourism is investigating other sources of data to triangulate

SA Tourism Review: Report of the Expert Panel, June 2015
40
the Stats SA data. This includes data from the International
Air Transport Authority, based on ticket sales; and data
from the Airports Company of South Africa.
SANParks have access to a vast amount of data which has
not been used by SA Tourism or NDT. SANParks point to the
increasing number of direct sales (via online platforms)
which cut out intermediaries such as tour operators. In the
case of SANParks, this is now at 30% of their total bookings.
Direct online sales will necessarily decrease the sales made
by the trade and could explain in part the lack of growth
experienced by some of the operators, although
conclusively establishing this requires proper evidence-
based research findings.
Research at SA Tourism
The value of research insights
While a capable albeit small research team exists at SA
Tourism, the broader organisation appears to be in a
‘research mind-set’ and has not progressed the function to
one of ‘analytics, insights and market intelligence’.
Research appears to have not been valued properly at the
institution. This is in part a result of staff changes and
movements, and in part what appears to be a lack of
management and leadership focus on and integration of
research (and perhaps understanding of the critical
importance and value of this area). There are now efforts
underway to revive the role of research within the
organisation.
A limited budget exists for research which is largely eaten
up by standard ongoing research work, such as brand
tracking, departure surveys, domestic tourism surveys,
foreign tourist arrivals’ analysis and so on. This means little
forward-looking research is being commissioned.
Furthermore, budget forecasts indicate a (marginally)
reduced budget for research. (The research budget is
covered in more detail in the Budget and Finance section).
Methodological approaches
A core research output which is fundamental to the
organisation’s strategy - the Tourism Growth Strategy - is
out of date. While the Portfolio Review – a review of the
core, tactical, investment and watch-list markets which is at
the heart of this TGS - is up to date, it is no longer publicly
available on the SA Tourism website.
The Portfolio Review methodology is one developed in the
early 2000’s and while it should be maintained for
consistency, new modules could be considered for inclusion
to reflect fast-changing consumer and market trends and
practices. It could be argued that tourism retails
experiences in the same way that Woolworths retails food.
Creative thinking is required to capture more information
on tourists to South Africa, and their behaviour in South
Africa. One suggestion, from SANParks, relates to
introducing some sort of travel card which could essentially
track purchases and travel behaviour once in the country.
South African Tourism could also consider partnering VISA
and Master Card for data mining, as well as some of the
major online retailers like Trip Advisor and Google. This
could provide the real time information on trends that SA
Tourism and the industry need so badly.
As indicated elsewhere, SA Tourism’s domestic tourism
survey sample size is very small. Stats SA are planning to
embark on a domestic survey although it remains unclear
when this will start. Analytics and market intelligence must
be evidence based (proper and scientific) which requires
reasonable sample sizes and a commitment to the correct
budgets to undertake the level of detailed work that is
required.
While it is important that SA continues to adopt the global
(UNWTO) definition of a tourist, valid concerns do exist
regarding the Stats SA data. Stats SA also has to provide the
information in a much shorter time frame.
Packaging and communicating the research
The current research output from the Strategic Research
Unit is quite impressive, but the format of the research
publications is not always optimal for trade and product
usage, nor is it well communicated. As indicated by SA
Tourism management itself, new databases could be
considered that allow stakeholders to ‘pull data’ and

SA Tourism Review: Report of the Expert Panel, June 2015
41
customize their own reports to allow for optimal usage and
value.
Industry can also provide valuable insights into trends as
they are highlighted in research findings.
Strategic Planning at SA Tourism
Current process
SA Tourism’s Strategic Management Process is depicted in
Figure 36, which follows.
This process does not specify the key strategic research and
analytics’ deliverables into strategy, that is, the Tourism
Growth Strategy with its portfolio review and market
segmentation.
Source: SA Tourism, Strategic Plan 2015 – 2010; 2015
New Process
A new Planning, Reporting, Monitoring Framework is being
put in place and a Strategic Implementation Plan
Monitoring Tool will cascade organisational targets to an
operational, divisional, level. A Revised Targets
methodology for the organisation details the targets for
international tourists and domestic trips. The budget is
taken into consideration to derive a cost of acquisition per
market, and to assist in estimates, targets and forecasts.
This more targeted forecasting is to be commended.
It appears that country targets are arrived at through using
high level assumptions related to budget and arrivals’
trends and then there are discussions with marketing staff
and country managers on how to plan to meet the targets.
Alignment between the National Tourism Sector Strategy
and SA Tourism’s 5 year Strategic Plan
The National Tourism Sector Strategy (NTSS) is currently
due to be revised. That strategy states the economic
importance of tourism to the economy, and establishes
clear objectives for the sector.
SA Tourism’s TGS is ‘subordinate’ to the NTSS although it
does include the empirical basis for the marketing targets
that get set.
ENVIRONMENTAL SCAN
Situational Analysis Alignment to legislation and government policies Global Trends Customer Insights and Competitor Analysis Industry/ Market structure
Other related industries
PLAN & BUDGET
MTEF and ENE 5 Year Strategic Plan Annual Performance Plan Divisional Strategies and Plans Projects e.g. Indaba, Meetings Africa and Lilizela Awards
IMPLEMENTATION
Implementation of the Strategic Plan, APP, Divisional Strategy and Plans
MONITORING, REPORTING & EVALUATION
Divisional Monthly Reports Quarterly Business Performance Report Quarterly Individual Performance Reports Mid-Term Review Annual Report
CONTINUOUS
Figure 36: SA Tourism's strategic planning process

SA Tourism Review: Report of the Expert Panel, June 2015
42
There are a range of inconsistencies between the NTSS
objectives, and those of SA Tourism’s strategic plan, as
follows:
The NTSS target for foreign arrivals are no longer
comparable with SA Tourism’s as the latter’s
targets are based on foreign tourists (as now
measured by Stats SA) and NTSS with the larger
figure of foreign arrivals.
SA Tourism only measures its performance on
domestic holiday trips, not other domestic trips
while the NTSS contains a range of domestic trip
targets (including for holiday purposes). The NTSS
target for domestic holiday trips is 6 million
holiday trips in 2015, while SA Tourism is 2,8
million, less than half, given the drop in trips
experienced in recent years.
In terms of entrenching a tourism culture amongst
South Africans, the NTSS is fairly general in its
prescriptions; while SA Tourism measures the rand
value, in R millions, of media and PR. These SA
Tourism measures do not adequately measure the
broader objective of developing a tourism culture;
they are output rather than outcome based.
In terms of positioning South Africa as a globally
recognized tourism brand, NTSS suggests using the
2010 World cup as a baseline for brand awareness
and perception. SA Tourism currently measures
brand awareness, brand positivity, and the
percentage increase in Public Relations’ value.
There clearly exists a level of dissonance between the
objectives and methodologies utilised in the NTSS and SA
Tourism’s Strategic Plan.
Benchmarking
Market intelligence and Country Reports tend to help
communication strategies to be more effective in achieving
goals and deciding on the focus of the limited budgets of
NTOs. While SA Tourism does undertake marketing
intelligence and country research to derive analytics, on a
comparative basis the Strategic Research Unit appears less
resourced, and its research/ market intelligence activities
more circumscribed than those of comparable NTOs.
SA Tourism’s research unit has recently undertaken
investigated other NTO’s research programme work. Figure
37, adjacent, shows those categories of research
undertaken by NTOs in Australia, Canada and Britain. Areas
not currently covered by the SA Tourism research function
include:
Product research
Trends
Economic analysis
Forecasts
Industry research
Aviation research (only Australia does this, given
its reliance on long-haul travel which is not that
dissimilar to South Africa’s own for revenue).
Figure 37: Categories of research undertaken by other NTO's
Source: Strategic Research unit, SA Tourism, 2015
Of particular note given the dissatisfaction of industry with
SA Tourism is that ‘industry research’ is part of the research
portfolio in both Australia and Canada, but not in South
Africa.
Our recommendations:
1. Reposition research at the heart of SA Tourism strategic
planning by:
a. Reviewing and updating the TGS every three years,
including the market prioritization and
segmentation work. Discuss the findings with

SA Tourism Review: Report of the Expert Panel, June 2015
43
stakeholders and staff. Ensure this work feeds
directly into Strategic Planning.
b. Rename the Strategic Research Unit as “Insights and
Analytics” to attest to its important role in strategy
and expand and resource a larger, more strategic
mandate.
c. Regular reporting to and engagement with ExCo on
these insights and analytics. “Insights and Analytics”
should be a standing item on Board committee
meetings.
d. Strategic Planning must centrally situate research
insights and the culture of SA Tourism must value
and elevate strategic insights that inform marketing
choices.
2. Enhance research deliverables through:
a. Finding new sources to triangulate the StatsSA
releases on tourist arrivals and migration. Board to
consider setting up a task team with industry
participation to look at this matter.
b. Reviewing the current methodologies for market
and segment prioritisation and adding new modules
to historical research methodologies to reflect
changing practices and new digital sources of
information.
c. Ensuring the new domestic tourism survey to be
undertaken by StatsSA is extended to a larger
survey.
d. Routinely undertaking benchmarking work to
understand new practices at comparable NTOs.
e. Improved packaging and communication of insights
and analytics so it has maximum value and impact
for stakeholders to inform their own marketing
choices and activities.
f. Engaging industry to help interpret the
market intelligence based on their actual
experience of working with the markets.
g. Achieving greater alignment between the
NTSS and Strategic Plan of SA Tourism.
3. On the basis of quality market intelligence,
business planning should be reinstituted as the
core mechanism for determining strategy and
allocating resources:
a. ExCo must prioritise and participate in the
business planning process.
b. Country office and regional managers
need to be involved in an iterative
process of determining priorities and
plans in each market.
c. Once approved the business units should
be given the operational autonomy to
implement in terms of the strategy.

44
3.8 Organisational Structure and Human Resource Development
Introduction
SA Tourism has been through a period of change in top
management over the past 5 years. As of June 2015 a
completely new team (bar the CEO and the Chief
Convention Bureau officer) is in place with appointments
made of a new Chief Financial Officer and Chief Operating
Officer in 2014, and a new Chief Marketing Officer in early
2015. The post of Chief Quality Assurance Officer has been
vacant since April 2015.
Key posts within the shareholder department – the
National Department of Tourism – have also seen changes.
When the incumbent CEO of SA Tourism was appointed in
2011, a new Director-General was also appointed at the
helm of the standalone Department of Tourism. More
recently, Minister Hanekom has replaced Minister van
Schalkwyk (in 2014), and a new Director-General is now
being sought within that same tourism department.
These new teams present the opportunity for a fresh start
and enhanced coordination between the entities.
Stakeholder views
The main opinions as expressed by stakeholders, based on
their perceptions:
SA Tourism’s leadership and staff do not possess
the right skills to do an optimal job. Many public
and private stakeholders also queried whether SA
Tourism staff has a detailed understanding of the
destination offering.
The perception of country offices is that certain of
these perform well (Germany, India and China /
Japan were mentioned a number of times), while
other country office managers “are simply waiting
out their contracts”. A number of stakeholders
(private and public) indicated that the country
office model needs to be rethought and other
approaches should be considered, such as
leveraging the capacity of South African
Embassies.
The view was expressed that the values of the
organisation are not what they should be and staff
do not live the values. A few respondents close to
the organisation indicated the culture has become
one of compliance and fear, and that there is
limited strategic engagement with staff.
As indicated elsewhere, the lack of a post or team
for a global trade manager and product manager
seriously impedes communication between the
industry and SA Tourism.
Interviews were also conducted with a number of current
SA Tourism executives and managers as well as past staff. A
handful of country office managers were also consulted for
their views. All these respondents expressed largely the
same view: the main point relates to the perceived
centralisation of control by leadership. While historic
reasons may have existed for this approach, it was
indicated by many staff members that this style of
leadership stymies any flexibility to respond to
opportunities and disempowers the staff.
Our Research
Organisational Culture and Development
Certain of the past organisational practices of SA Tourism
seem to have fallen by the wayside although current
indications are that these may be re-introduced. This
includes the induction approach: 'marketing the SA Tourism
way’, the strong focus on research, and the strong lobbying
approach to government around market access barriers in
tourism, amongst others. Staff engagement appears to
have decreased as the Management Committee has been
scrapped.
Discussions with Board indicate that the focus of the
incumbent CEO after his appointment was to get the
organisation’s compliance back on track after a lack of
accountability at the organisation and concerns around
disregard for the PFMA.
The 2013 Hay and Best Company to Work For surveys both
yielded findings that staff satisfaction was low on a number

SA Tourism Review: Report of the Expert Panel, June 2015
45
of elements. These survey findings are now rather dated,
and the picture they present does not go into explaining
the reasons for their findings. Nevertheless, they do point
to high levels of staff dissatisfaction in 2013:
The Hay survey indicated that while staff were largely
content with their direct managers, and the (then) CFO,
there was strong dissatisfaction with (the then) other
members of ExCo as well as the practices of senior
management.
Figure 38: Hay Survey Findings, 2013
Source: Hay Survey: South African Tourism, 2013
The Best Company to Work For survey measured
Employee (staff other than ExCo), and Employer (ExCo)
ratings of different dimensions. It then used a factor to
account for the level of importance ascribed to those
different dimensions by the individual respondents to
arrive at a score out of 5. Anything below 3.37 is
deemed an area of concern; scores below 3.15 are
‘problematic’.
Of particular note is that ExCo scores were lower on
many items than other staff. Given that this survey was
conducted in 2013, none of the then ExCo members
(other than the CEO) remains in their post.
Table 9: Best Company to Work for Survey Findings, 2013
Dimension Employee Employer
Work-life balance 3.54 2.9
Manager / Supervisor 3.42 2.65
Job Satisfaction 3.33 3
Sense of Confidence 3.29 2.64
Operational Effectiveness 3.28 3.31
Performance & Recognition 3.06 2.66
Ethics & Integrity 2.81 2.76
Inclusion 2.79 3.25
Remuneration 2.73 2.69
Career Development 2.6 2.55
Source: Best Company to Work for Survey: South African Tourism, 2013
At Board request an action list was compiled as a response
to the Hay and Best Company to Work For surveys. It aimed
to put in place a range of initiatives like e-newsletters, CEO
feedback to staff, new policies on remuneration and
bonuses, and a code of ethics.
SA Tourism has also recently (March 2015) requested
proposals for an organisational development exercise
(which excludes country offices).
Skills and Human Resource Development
As to be expected, most staff (81 of 170 in March 2015) is
located in the ‘marketing’ function, as indicated in Figure
39, over the page. Marketing staff numbers are down
approximately 10% on numbers between 2009 and 2012. In
terms of overall staff levels, SA Tourism was sitting with a
16% staff vacancy rate in March 2015, down from a 19%
vacancy rate in 2013/4. Figure 39, below, shows the staff
complement of SA Tourism between 2009/10 and 2014/15.
0%10%20%30%40%50%60%70%80%

SA Tourism Review: Report of the Expert Panel, June 2015
46
Research remains a small component of the overall staff
complement, while Operations has fluctuated and is now at
its largest size. The SANCB has grown in line with its own
setting up phase, while the Grading Council’s staff has also
fluctuated. SA Tourism plans to increase its current 170
staff members to 212 in 2019/20.
Figure 39: SA Tourism staff numbers by component
Source: SA Tourism Figures, March 2015
Training expenditure appears low as indicated in data
provided by SA Tourism, below the 1% standard
recommended rate. Furthermore, SA Tourism has indicated
that there is no current skills audit for the organisation to
indicate skills’ levels and gaps.
The marketing capabilities of the organisation are also
affected by a high turnover of staff and service providers.
This is in part a result of the primary service contract lasting
3 years, half of which is spent ‘learning’ the complex
business of tourism marketing. (It is understood that this
time frame is stipulated within the PFMA).
A draft Human Resources strategy exists and a ‘Human
Resources strategy elements for tracking’ document has
been provided to the Panel and contains a range of once-
off and ongoing actions. These address everything from
leadership, to vacancy rates, induction, talent management
and the like. But discussions with staff and management
indicate that more needs to be done to support Human
Resource development and staff needs and concerns.
Table 10: SA Tourism Staff statistics
Source: SA Tourism Figures, 2015
Country offices: moving to a hub approach
SA Tourism experiences a number of challenges relating
to staff and the more general operations of country
offices, including set up and closing down of these
offices.
Identifying, attracting and retaining the right staff to
manage country offices are ongoing challenges.
Undoubtedly these are also challenges experienced by
other NTOs and organisations that have remote offices
elsewhere in the world. The requirement for decisive,
strong, capable individuals to run offices abroad, while
needing to deal with a head office and its bureaucracy, is
tricky.
In line with the general point made earlier, the
delegations of authority appear to be too limited for
0
20
40
60
80
100
120
140
160
180
20
09
/10
20
10
/11
20
11
/12
20
12
/13
20
13
/14
20
14
/15
Operations
Finance andSCM
NCB
Grading Council
Research
Marketing
2009/10 2010/11 2011/12 2012/13 2013/14 2014/15
Approved posts 179 184 193 196 201 202
Actual staff 149 158 158 160 162 170
Vacancies (%) 17% 14% 18% 18% 19% 16%
Dismissals (no.) 0 1 0 2 4 1
Turnover (%) 7.8 6.96 8.23 14.4 11.73 7.65
Training as % of personnel budget 1.85% 0.92% 0.68% 0.57% 0.43% 0.73%
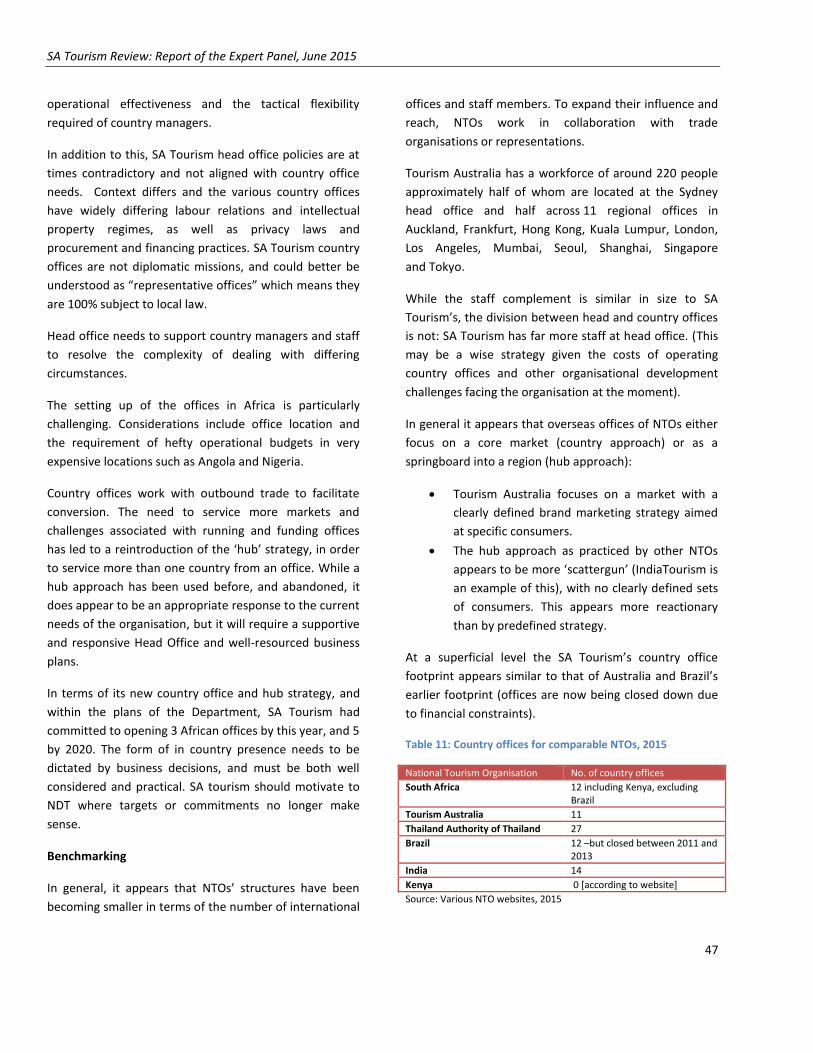
SA Tourism Review: Report of the Expert Panel, June 2015
47
operational effectiveness and the tactical flexibility
required of country managers.
In addition to this, SA Tourism head office policies are at
times contradictory and not aligned with country office
needs. Context differs and the various country offices
have widely differing labour relations and intellectual
property regimes, as well as privacy laws and
procurement and financing practices. SA Tourism country
offices are not diplomatic missions, and could better be
understood as “representative offices” which means they
are 100% subject to local law.
Head office needs to support country managers and staff
to resolve the complexity of dealing with differing
circumstances.
The setting up of the offices in Africa is particularly
challenging. Considerations include office location and
the requirement of hefty operational budgets in very
expensive locations such as Angola and Nigeria.
Country offices work with outbound trade to facilitate
conversion. The need to service more markets and
challenges associated with running and funding offices
has led to a reintroduction of the ‘hub’ strategy, in order
to service more than one country from an office. While a
hub approach has been used before, and abandoned, it
does appear to be an appropriate response to the current
needs of the organisation, but it will require a supportive
and responsive Head Office and well-resourced business
plans.
In terms of its new country office and hub strategy, and
within the plans of the Department, SA Tourism had
committed to opening 3 African offices by this year, and 5
by 2020. The form of in country presence needs to be
dictated by business decisions, and must be both well
considered and practical. SA tourism should motivate to
NDT where targets or commitments no longer make
sense.
Benchmarking
In general, it appears that NTOs’ structures have been
becoming smaller in terms of the number of international
offices and staff members. To expand their influence and
reach, NTOs work in collaboration with trade
organisations or representations.
Tourism Australia has a workforce of around 220 people
approximately half of whom are located at the Sydney
head office and half across 11 regional offices in
Auckland, Frankfurt, Hong Kong, Kuala Lumpur, London,
Los Angeles, Mumbai, Seoul, Shanghai, Singapore
and Tokyo.
While the staff complement is similar in size to SA
Tourism’s, the division between head and country offices
is not: SA Tourism has far more staff at head office. (This
may be a wise strategy given the costs of operating
country offices and other organisational development
challenges facing the organisation at the moment).
In general it appears that overseas offices of NTOs either
focus on a core market (country approach) or as a
springboard into a region (hub approach):
Tourism Australia focuses on a market with a
clearly defined brand marketing strategy aimed
at specific consumers.
The hub approach as practiced by other NTOs
appears to be more ‘scattergun’ (IndiaTourism is
an example of this), with no clearly defined sets
of consumers. This appears more reactionary
than by predefined strategy.
At a superficial level the SA Tourism’s country office
footprint appears similar to that of Australia and Brazil’s
earlier footprint (offices are now being closed down due
to financial constraints).
Table 11: Country offices for comparable NTOs, 2015
National Tourism Organisation No. of country offices
South Africa 12 including Kenya, excluding Brazil
Tourism Australia 11
Thailand Authority of Thailand 27
Brazil 12 –but closed between 2011 and 2013
India 14
Kenya 0 [according to website]
Source: Various NTO websites, 2015

SA Tourism Review: Report of the Expert Panel, June 2015
48
Our Recommendations
1. In light of the issues raised by both stakeholders and
the internal surveys, the new Board needs to urgently
put in place measures and interventions to ensure that
the CEO and leadership team have the capabilities to
carry out roles and duties as set out in their key
performance areas.
2. The Board should urgently review the role,
performance and capabilities of the Human Resource
function given the findings and recommendations of
this Report and the Hay and Best Company to Work For
Surveys.
3. SA Tourism must establish a culture of engagement and
empowerment within and across all levels and units of
the organisation, to include:
Introducing ways for middle management to
engage in strategic discussions and share plans
and practices.
Effective delegations of authority to devolve
decision-making to management.
A change management process to look at the DNA
of the organisation, and to shift the organisational
culture.
Staff satisfaction should be monitored through
annual surveys and remedial actions swiftly taken.
4. The finalization of the organisational review of head
office should be postponed until such time as the
findings of the Panel are discussed between the
Minister, Board and ExCo, as these may have bearings
on organisational design. This organisational design
should include (as it currently does not) a
comprehensive review of the country office / hub office
model, given funding and resource constraints
including currency risks and losses. This includes the
‘mandated plans’ to expand to 5 country offices in
Africa. The most appropriate and practical forms of
establishing a market presence must guide the
decision. This includes keeping overheads low and the
investigation of other modalities of ‘in country’
presence.
5. A skills’ audit must be undertaken against the new
organisational design to understand which important
skills are missing.
Source: Tourism Australia, 2015.
Tourism Australia has the following organizational values:
> There’s nothing like getting value for money. Tourism Australia encourages staff to treat every dollar as if
it is their own. This means being accountable in managing money, planning work effectively, looking for
efficiencies and achieving value for money in all their endeavours.
> There’s nothing like an enquiring mind. Tourism Australia’s staff members are enthusiastic, collaborative
and creative. They are hungry for knowledge and are always looking for ways to improve outcomes for
Australian tourism.
> There’s nothing like sharing for success. Tourism Australia expects its staff members to work together
cooperatively and professionally, to be respectful and trusting of others, to collaborate freely, to focus on
the customer, and to use their expertise and experience to get the best possible results.
Figure 40: Tourism’s Australia’s Organisational Values

SA Tourism Review: Report of the Expert Panel, June 2015
49
3.9 Budget and Finance
Introduction
SA Tourism’s budget for this year (2015/6) is R1,18 billion.
It is funded mainly from transfers from the Department of
Tourism. An additional 12% to 15% of the budget is a
contribution from TOMSA - a bednight levy on guests at
participating accommodation facilities. The decision to
participate in the TOMSA scheme and impose a levy on
guests is voluntary.
Excluding the 2009/10 year, when the 2010 FIFA World
Cup inflated the budget, between 2010/11 and 2013/4 the
trend was for the government grant to increase in real
terms. For 2014/5, 2015/6 and 2016/7 the grant has and
will remain static in real terms due to a more constrained
fiscal environment.
However, recent new allocations include those for
domestic marketing (at R100 million per year between
2015/6 and 2017/8), the SANCB as well as the Africa
strategy (Africa offices).
While expenditure on international marketing accounts for
close to 50% of the total budget, in real terms the
allocation did not grow in 2014/5 and will not grow over
the remaining period of the MTEF.
The main expenditure category for the organisation relates
to ‘goods and services’, which mainly comprises the
various marketing activities.
Table 12: SA Tourism income, by component (R'000) (adjusted to 2014/5 prices)
2009/10 2010/11 2011/12 2012/13 2013/14 2014/15
Audited Audited Audited Audited Audited Budget
Government grant R 902 457 R 785 066 R 787 106 R 841 996 R 913 190 R 880 009
TOMSA levies R 97 395 R 130 462 R 115 567 R 124 879 R 138 390 R 104 000
Indaba & Meetings Africa R 85 338 R 90 254 R 56 732 R 55 779 R 44 759 R 48 694
Grading fees R 6 186 R 7 924 R 6 220 R 3 627 R 15 007 R 14 668
Sundry revenue R 9 644 R 50 251 R 50 664 R 66 312 R 24 121 R 47 717
Total R 1 101 021 R 1 063 957 R 1 016 289 R 1 092 593 R 1 135 466 R 1 095 088
Source: SA Tourism figures adjusted using Statistics SA CPI data, March 2015
Stakeholder views
Stakeholders are concerned about the efficiency of SA
Tourism’s spend - too much of SA Tourism’s budget is
spent on overheads and too little on marketing.
National Treasury has indicated the following:
o More compelling proposals are needed for budget
allocations and increases in the MTEF, as well as
other proposals.
o Treasury manages currency risk and does a post-hoc
reimbursement of ‘currency losses’ based on
whether additional funding is warranted. This is the
same approach as applies to the Department of
International Relations and Cooperation. National
Treasury is willing to consider creative proposals
from SA Tourism regarding the management of
currency volatility but the size of SA Tourism’s
budget relative to other government functions with
similar requirements (DIRCO is a primary example)
does not warrant a substantially different
mechanism.

SA Tourism Review: Report of the Expert Panel, June 2015
50
Our Research
SA Tourism’s budget and sources of income
While government grants will not increase in nominal or
real terms over the Medium Term Expenditure Framework
(MTEF) period, TOMSA levies are increasing, at least in
nominal terms, and have done so for some time (bar 2010
to 2011, as a result of the FIFA 2010 World Cup). SA
Tourism’s TOMSA entry for 2014 at R104 million appears
to be an estimate as TOMSA’s own records show R112
million for the year, as indicated in Figure 41, below.
Figure 41: TOMSA levy contributions, R’millions, 2000 – 2014
Source: TOMSA, 2015
While income is received from SA Tourism’s two owned
events – Indaba and Meetings Africa – costs associated
with the events means that they are not profit centres.
Furthermore, the grading fees are before costs.
Figure 42: SA Tourism income by component (R’000) (adjusted to 2014/15 prices)
Source: SA Tourism figures adjusted using Statistics SA CPI data March 2015
SA Tourism’s budget expenditure
Table 13 shows the SA Tourism budget as provided in the
MTEF allocation letter from the then Acting Director-
General of Tourism to the Chair of the SA Tourism Board,
dated 22/12/2014. Assuming 5% inflation, this equates to
little real growth in the international marketing budget and
a decline in the category of ‘financial assistance’.
It appears that the special allocations to domestic
marketing and ‘growing tourism from Africa to South
Africa’ are made at the expense of routine work,
particularly for 2015/6.
Table 13: Allocations from NDT to SA Tourism, R’000’s.
2014/5 2015/6 2016/7 2016/7
International Marketing
R449 232 R451 900 R487 847 R512 239
Domestic Marketing
R43 672 R43 800 R44 000 R156 450
Additional Domestic marketing: ECSP
R100 000 R105 000
Financial Assistance
R233 518 R231 112 R240 000 R252 000
Grading Council
R29 220 R29 500 R30 000 R31 500
Convention Bureau
R33 607 R33 700 R34 00 R35 700
Lilizela awards
R3 000 To be motivated
To be motivated
-
Growing tourism from Africa to South Africa
R84 000 R84 000 R84 000 R88 200
TOTAL R876 309 R974 012 R1024 847 R1 076 089
Source: NDT, 2015 and 2014
SA Tourism’s own budget statements also show this trend,
as shown in Table 14 below. It appears that in real terms
the International Marketing budget will decline over the
next three years, and so will the research component. The
11% (over and above inflation) increase in budget is in
place this year to accommodate the extra domestic
strategy injection.
It is not clear where the additional ‘Growing tourism from
Africa to South Africa’ fund allocation from NDT is located
in SA Tourism’s budget as presented in Table 14. This
should be under either ‘marketing – international’ or
26.30 30 40 44 48 48 53
62 68
104 106
92 97 107
112
0
20
40
60
80
100
120
20
00
20
01
20
02
20
03
20
04
20
05
20
06
20
07
20
08
20
09
20
10
20
11
20
12
20
13
20
14

SA Tourism Review: Report of the Expert Panel, June 2015
51
‘marketing support units’ but both these components see decreases, or little growth, not considerable increases.
Table 14: 2014/5 – 2017/8 SA Tourism expenditure by functional area, adjusted to 2014/5 prices, in R‘000s
2014/15 2015/16 2016/17 2017/18
Budget Budget Budget Budget
Board / governance R 303 R 297 R 291 R 286
Marketing – international R 443 893 R 435 438 R 427 144 R 419 008
Marketing – domestic R 38 977 R 134 568 R 135 147 R 135 147
Marketing support units R 352 559 R 296 976 R 303 302 R 311 629
Grading Council R 44 171 R 43 244 R 42 420 R 41 612
NCB R 59 661 R 58 525 R 57 410 R 56 316
Research R 60 660 R 50 760 R 49 793 R 48 845
Finance and SCM R 28 037 R 32 310 R 31 695 R 31 091
Operations R 66 827 R 65 554 R 64 305 R 63 081
TOTAL R 1 095 088 R 1 117 671 R 1 111 507 R 1 107 015
Source: SA Tourism figures, 2015, adjusted
Expenditure by category, shown in Table 15, below,
indicates that ‘goods and services’ are by far the largest
category of expenses. This amounted to some R900 million
in 2014/5 or 75% of the budget. These costs should have
some level of flexibility (even if tied to three year
marketing services contracts). A clear breakdown of ‘goods
and services’ expenditure has not been received from SA
Tourism.
Personnel, at R178 million, is 15% of the budget. Rental
and office costs are only R25 million, or 2% of the budget.
Table 15: SA Tourism expenditure by category (R’000) (adjusted to 2014/15 prices)
2009/10 2010/11 2011/12 2012/13 2013/14 2014/15
Audited Budget
Capital R 110 541 R 79 564 R 35 036 R 31 960 R 88 853 R 88 509
Personnel R 144 286 R 128 790 R 143 609 R 166 530 R 178 642 R 177 861
S&T R 1 592 R 1 521 R 2 771 R 1 221 R 2 994 R 3 019
Rental & office costs R 19 611 R 18 648 R 13 930 R 18 080 R 24 795 R 24 696
Goods and services R 935 532 R 914 997 R 855 978 R 906 762 R 907 952 R 889 512
TOTAL R 1 211 562 R 1 143 521 R 1 051 325 R 1 124 553 R 1 203 236 R 1 183 597
Source: SA Tourism figures adjusted using Statistics SA CPI data March 2015
Expenditure on priority markets
Figure 43, which follows, shows the marketing expenditure
for the priority markets in nominal, Rand terms. The total
country expenditure was R494 million in 2014/5. This will
drop to R438 million this year (2015/6).
Most markets saw a constant and slow increase in
expenditure between 2009/10 and 2014/5. Exceptions are
the UK, France and Italy, which all saw a spike in
expenditure in 2013/4 followed by a budgeted drop in
2014/5.
This is at least in part explained by currency movements in
that year as the Rand lost value against the Euro.

52
Figure 43: SA Tourism expenditure by market (R’000) (unadjusted)
Source: SA Tourism figures, 2015
If one considers the budgets in currency of target market
and nominal terms, then a real drop is also indicated for
the marketing budgets of USA (in addition to Italy, UK and
France) in 2014/5 against 2013/4 audited performance.
But India, China, Japan, Australia, Brazil and Kenya all see
significant increases in budgets between 2013/4 and
2014/5 in the currency of target market.
The budget allocations to international markets,
particularly traditional markets, remain largely flat
between 2014/5 and 2017/8. This means in real terms
these budgets are likely to be eroded. The newer markets
and those markets outside of Europe appear to be less
affected (other than India, where a budget decrease is also
noted).
Of particular concern here is that the existing offices will
have additional responsibilities to service surrounding
countries, as part of the new hub strategy. Where
resources are not increasing, this may prove difficult.
Figure 44, over the page, shows the budget amounts and
trends for the period.
R 0
R 10 000
R 20 000
R 30 000
R 40 000
R 50 000
R 60 000
R 70 000
R 80 000
R 90 000
R 100 000
Audited Audited Audited Audited Audited Budget
2009/10 2010/11 2011/12 2012/13 2013/14 2014/15
USA
UK
Germany
France
Netherlands
Italy
India
China
Japan
Australia
Angola
Nigeria
Brazil
Kenya

53
Figure 44: SA Tourism international current and forecast marketing budgets, by country, 2014/5 to 2017/8, R’000s.
Source: SA Tourism Figures, 2015
Expenditure on marketing categories and service providers
SA Tourism management accounts record a budget of R781
million on marketing in 2013/4. This grew to R849 million in
2014/5. The main marketing cost categories, as recorded by
SA Tourism, are shown in Figure 45, adjacent.
SA Tourism captures ‘research’ and ‘travel’ under marketing
expenditure, as well as more standard categories, such as
‘media’ (33% of total), production (20%), activation (14%),
and hosting (8%).
Travel amounted to approximately R20 million, or 5%, of
marketing budget in 2014/5. This data is not broken down by
employee band to cover Board, ExCo, management or
general staff.
Of the marketing cost categories it is ‘Media’ that indicates
the actual consumer facing spend. This amounted to 33% or
R276 million in 2014/5. The marketing budget allocations as a
percentage of total are indicated in Figure 46, over the page.
Figure 45: SA Tourism marketing categories of expenditure, 2013/4 and 2014/5
Source: SA Tourism Figures, 2015
R 0
R 10 000
R 20 000
R 30 000
R 40 000
R 50 000
R 60 000
R 70 000
R 80 000
R 90 000
Budget Budget Budget Budget
2014/15 2015/16 2016/17 2017/18
USA
UK
Germany
France
Netherlands
Italy
India
China
Japan
Australia
Angola
Nigeria
Brazil
Kenya
-
50 000 000
100 000 000
150 000 000
200 000 000
250 000 000
300 000 000
2013/2014 2014/2015

SA Tourism Review: Report of the Expert Panel, June 2015
54
‘Capabilities’ (12%) refers to certain service provider fees, at
about R100 million in the 2014/5 financial year. Together
with Production (20% of total costs), which also relates to
service provider fees, at R170 million, an amount of about
R270 million, or about 30% of total marketing budget
appears to have gone to service providers in 2014/5. It is
likely that other service provider costs are not shown as
separate line items, and that a truer figure for total fees is
higher, perhaps as much as 40% (approximately R360 million)
in 2014/5.
Figure 46: SA Tourism Marketing percentage allocations, by category, in 2014/5
Source: SA Tourism Figures, 2015
In general, the financial information provided to the Panel by
SA Tourism does not allow for a clear or meaningful analysis
of spend patterns, or ratios on critical areas like the cost of
intermediation / service providers and the country offices.
The organisation itself needs a clearer grasp on expenditure,
and marketing “returns”. This sort of information will also
improve SA Tourism’s ability to make a compelling case for
funds to both NDT and National Treasury.
Currency Losses
In terms of currency losses, SA Tourism indicates losses have
varied from R10 million in 2011/12 to R128 million in 2014/5,
amounting to some R300 million over the past 4 years. For
2013/4 and 2014/5 losses were in the region of 15% of the
total annual budgets, a significant amount.
Benchmarking
SA Tourism’s Strategic Research Unit has recently conducted
research into the budgets of other NTOs. Table 16, which
follows, shows that the sources of income for SA Tourism are
largely similar when compared to those of Australia.
Table 16: Budget Sources of Income Comparison: SA, Australia, Thailand, 2013
Source of income South Africa Australia Thailand
Income from Government Y Y Y
Sale of goods and rendering of services Y Y Y
Advertising / Sale of Marketing material Y Y N
Interest Y Y N
Contributions revenue N Y N
Rental income Y Y N
Foreign exchange N Y N
Grading income Y N N
Membership charges N N Y
Shared profit from investment with partnership company N N Y
Other gains / Revenue (unspecified in financial statements) Y Y Y
Source: SA Tourism Research unit, 2015
Media, 33%
Production, 20%
Activation, 14%
Total Travel Expenses, 2%
Customer Relationship
Management, 2%
PR & COMMS,
2%
Hosting, 8%
Capabilities, 12%
Research, 5%

SA Tourism Review: Report of the Expert Panel, June 2015
55
The Tourism Australia Annual Report indicates that
currency losses due to currency volatility are returned
to them by their department of Finance. Excerpts from
the Tourism Australia Annual Report which explains
this, read as follows:
“The overall financial result for Tourism Australia,
excluding foreign exchange losses, was a small surplus of
$0.1 million, which is within 0.1 per cent of budget.
“The Australian dollar’s fall in value from the previous
financial year (between 10 per cent and 14 per cent in the
UK, the USA, Europe and China) resulted in an overall
foreign exchange loss for the year of $9 million compared
to the budgeted exchange rates provided by the
Australian Government. This foreign exchange loss will be
returned to Tourism Australia in 2014–15 by the
Department of Finance in line with Australian
Government policy.
Tourism Australia had a deficit of $8.9 million in 2013–14,
taking the impact of foreign exchange into consideration.”
Our Recommendations
1. SA Tourism to provide NDT and National Treasury
with a much clearer business case for investment in
marketing, and consistently make the economic
argument for budget allocations.
2. SA Tourism needs to develop a clear strategy to
improve collection of the TOMSA levy which
includes demonstrating value for money. The SA
Tourism budget from NT should not be cut when
TOMSA revenues grow.
3. SA Tourism to generate management accounts that
provide a useful level of detail on key expenditure
considerations and ratios as they relate to
marketing investments and returns. A review of the
budget should be undertaken to include a range of
important operational and management
dimensions, such as:
country office/ hub model costs, per category;
country budgets and trends;
ratio of overheads to actual monies spent on
marketing media; and
the cost of marketing service providers and
ratios to other marketing categories.
4. A re-alignment, and ongoing monitoring of the
budget should focus on
reducing/ limiting overheads;
increasing marketing expenditure, in particular
on actual tourist facing media;
protecting spend in core markets (this can be
accommodated within the existing mechanism
followed by National Treasury but SA Tourism
needs to be given an explicit undertaking that
NT will manage the currency risk);
increasing the research budget; and
targeting reductions in non-return marketing
costs – such as service providers; large
delegations to shows; etc.
The board-approved budget realignment should be
approved within six months. Regular monitoring of
key ratios and indicators should be reported at
Board level and in reporting to Department.
56
3.10 Governance
Introduction
The corporate governance legislation which informs SA
Tourism includes:
Section 55 of the Constitution, which provides the
National Assembly with powers over executive
organs of state in the national sphere of
government.
The Tourism Act of 2014, which establishes SA
Tourism as a juristic person and provides its
mandate.
Section 92 of the Constitution, which requires the
Minister of Tourism to be responsible for the
tourism portfolio, and entities within it.
The Public Finance Management Act, which
specifies how public funds are managed.
The Protocol on Corporate Governance in the
public sector, which includes the principles
contained in King II. A summary of King III’s more
recent principles is contained in Annexure E.
The Executive Authority for SA Tourism is the Minister of
Tourism, who also acts as shareholder. The Accounting
Authority is the Board of SA Tourism and the Board reports
directly to the Minister of Tourism.
SA Tourism is governed by a Board of at least 9 and no more
than 13 members plus one officer of the Department of
Tourism appointed by the Minister of Tourism. This Board is
subject to Cabinet approval.
Source: SA Tourism, 2015
Stakeholder views
Questions and concerns were raised about the
composition of the Board with regards to their skill set.
A perception exists that the Board lacks tourism, and
particularly tourism marketing, experience.
There exists a perception that Board members travel
extensively to international tourism shows. Related to
this is the view that the funds needed for large SA
Tourism delegations to shows could better be spent
elsewhere.
In the past there have been certain concerns regarding
the accountability of the SA Tourism Board as
Accounting Authority, and its reporting to the
Department (the Executive Authority).
Our Research
The Board
Role of Board
The Corporate Governance policy of the Board, which refers
to and extensively draws upon King II, indicates that the
main responsibility of the Board is to:
‘Provide a wider perspective, independent and objective
strategic horizons and enhanced sense of responsibility
and accountability”.
Composition of Board
The newly appointed Board collectively possesses a range of
capabilities. The array of skills and experiences needed to
steer SA Tourism into its next phase that the Board
encompasses include governance, legal, arts and culture,
human resource, finance management and business
management.
Given that the arena of tourism marketing is a particular
specialty which requires an understanding not only of
tourism, but of marketing and advertising, and that only a
few Board members appear to have direct and particular
experience and insights into tourism marketing, this
capability will need to be strengthened.
Committees of the Board
While the Tourism Act indicates that the Board will establish
committees in line with functional needs, the SA Tourism
Corporate Governance policy indicates that there are 6 such
board committees, as follows:

SA Tourism Review: Report of the Expert Panel, June 2015
57
Chairpersons’ committee (comprised of the Chair
of the board and Chairs of each of the committees.
It meets on an ad hoc basis including on urgent
matters).
Marketing committee.
Remuneration committee.
Audit and Risk committee.
TGCSA Awards committee: the Chair is appointed
by the Minister and also serves on the main SA
Tourism Board and an additional 8 members with
particular expertise which is relevant to grading.
SA National Convention Bureau Marketing
subcommittee that reports to the marketing
committee. The Chair is a SA Tourism Board
member but other members are drawn from
relevant business tourism associations and value
chain stakeholders. In addition the Chief
Convention Bureau Officer and CEO also serve on
this committee. In total it has no more than 9
members.
The Panel’s review of Board minutes indicates that the
committees are active and provide ongoing inputs and
guidance into the operations of the organisation, including
strategic guidance. The Board committees have also noted
and proposed certain areas requiring improvement
regarding the capabilities of the leadership team and the
strategies, plans and policies of the organisation.
In terms of Board travel, an area highlighted by certain
stakeholders, our research has been unable to disaggregate
travel by Board, ExCo and staff. We are therefore unable to
comment conclusively on the extent of Board travel in
response to the stakeholder perceptions that exist that
Board members’ travel to tourism shows is a routine
matter.
The ExCo
The Chief Executive Officer leads an executive team also
comprising a Chief Operating Officer, A Chief Marketing
Officer, a Chief Financial Officer, a Chief Quality Assurance
Officer and a Chief Convention Bureau officer.
Governance – NDT and SA Tourism
A draft governance protocol now exists between SA
Tourism and NDT. It is in essence the ‘shareholders’
compact’ which, according to Treasury’s regulations, is an
agreement between the Executive Authority and
Accounting Authority with respect to performance
expectations and parameters:
“It describes the relationship between the signatories
and defines the behaviour that would be required on
both sides to support effective performance and
management of the entity.”
The protocol indicates the Executive Authority (Minister’s)
role as:
Providing policy direction to SA Tourism in line with
the legislative mandate.
Monitoring and ensuring SA Tourism complies with
relevant laws and legal prescripts.
Ensuring timely appointments and/or re-
appointments of SA Tourism Board.
Ensuring that appropriate and effective induction,
training and education programmes are offered to
new and existing directors.
Monitoring and assessing the financial and non-
financial performance of SA Tourism.
Ensuring that the annual performance plans,
strategic plans, annual reports and audited
financial statements of SA Tourism are submitted
to the Executive Authority through the Accounting
Officer and tabled in Parliament.
The role of the Director-General, as Accounting Officer, is
indicated as one which assists the Minister and provides
recommendations to the Minister on matters affecting SA
Tourism.
SA Tourism’s governance policies
The Corporate Governance policy of the Board makes
specific statements regarding the objectives of internal
control. Amongst those processes and documents listed are
the Tourism Growth Strategy and the Code of Conduct for
the Board and staff. Both require updates, in line with the
aforementioned policy. The Code of Conduct makes no

SA Tourism Review: Report of the Expert Panel, June 2015
58
reference to Board members’ travel to SA Tourism shows
around the world.
Another area which requires attention, and is a focus of
King III, relates to Information Technology oversight.
Currently the organisation has an Information Technology
committee, but this is a not a committee of the Board. King
III suggests a Board committee to deal with IT governance,
given the strategic importance and value of IT to
organisations.
Benchmarking
The Tourism Australia Act is detailed in the provisions it
makes for Board appointments and specifies the skill sets
that Board members must possess. Background of current
board members at Tourism Australia and other NTOs
include:
Tourism Australia: The chair is the former Managing
Director of Qantas. The deputy chair has three decades
of experience in culinary tourism. Other Board members
have particular experience in different aspects of
tourism and marketing including having held positions in
marketing at a global hotel groups, executive posts at
Qantas; the former chair of Tourism Accommodation
Australia and Chief Development Officer of
InterContinental Hotels Group Asia Pacific (a chartered
accountant); ex CEO of Virgin Blue (aviation and
corporate leadership); etc.
In Great Britain, Visit Britain (which reports to the
Ministry for Culture, Media and Sport) has a six-person
board of largely private sector players – five of whom
are appointed by the Minister. The chair’s background is
in the National Trust, World Travel and Tourism Council
and is a former CEO of Visa and Thomas Cooke. There is
an ex-Boston consulting man, online specialist who ran
both last-minute.com and Travelocity, a person from a
brand agency who was also a former CEO of Virgin Air
and another who is the former Chair of ExCel.
The Tourism Australia Act also makes provision for the
establishment of Advisory committees: The Canada Tourism
Commission also has advisory committees which engage
specialist industry skills on particular areas of importance to
their organisations.
Our Recommendations
1. South Africa’s particular circumstances, including its
unique geographical, historical and political context,
require that the Board of SA Tourism should reflect:
a. a partnership between public and private sector;
b. a strong focus on leadership or management
experience in tourism, particularly tourism
marketing;
c. diversity that can properly reflect and accurately
represent the country and ensure this is taken
forward in destination brand positioning and
marketing.
2. In order to co-opt additional specialist tourism
marketing skills, we recommend the following:
a. Subcommittees, such as the Marketing Committee,
should bring in additional industry experience in
relevant areas.
b. Ad hoc advisory committees should be set up from
time to time to advise the Board on particular issues.
3. The new governance protocol with NDT must be
finalised as a matter of urgency.
4. SA Tourism’s Corporate Governance policy and Code of
Conduct for Board members must be updated based on
King III, and the new protocol with NDT. This should
include, but not be limited to:
a. Information Technology risks and systems should be
reported on to the Board.
b. Given the stakeholder perceptions that exist
regarding Board travel to tourism shows, and the
current efforts around cost containment at SA
Tourism, as well as the kind of image SA Tourism
should project of the country, the Code of Conduct
for the Board should specify that Board travel is not
to occur unless under special circumstances, and the
possible eventualities of these special circumstances
should be spelt out.
c. An annual performance review should be conducted of
the Board and its committees, which should include the
extent to which it members contribute to its
effectiveness.
59
3.11 Performance Management and Monitoring
Introduction
Appropriate performance measures – at organisational, and
ExCo levels – can assist with guiding strategic focus and
behaviour. This helps to achieve strategic outcomes for an
organisation. SA Tourism’s current performance targets are:
Foreign tourist numbers and spend.
Domestic holiday tourist numbers and spend.
Brand Performance.
Number of graded properties.
Number of business tourism events.
In addition to the standard Annual Performance Plan for the
organisation, a set of new performance related procedures
have recently been developed. These allow for the
translation of the strategic organisational targets to a
departmental level:
The SA Tourism Planning, Reporting, Monitoring
Framework indicates that ultimately staff performance
plans will be linked with organisational performance
plans and indicates a number of other processes that
need to be followed in order to implement the
framework.
The Strategic Implementation Plan Monitoring Tool
details implementation of targets at a functional level
and departmental level.
There is a new target setting methodology, already
discussed under ‘Strategy, analytics and market
intelligence’.
Stakeholder views
Private sector stakeholders were unanimous that SA
Tourism is not performing on key measures such as
delivering tourist volumes and spend, geographic spread
or seasonality.
Concerns were expressed about performance
management at SA Tourism and the incentivisation of
staff.
Our Research
Organisational Performance
SA Tourism’s annual performance indicators for 2015/6 are
indicated in the table at the end of this section. There are no
measures on stakeholder or partner satisfaction, or internal
performance measures against the key values and
aspirations for Human Resource Development or
Organisational Development (such as staff satisfaction).
Certain State Owned Enterprises adopt a balanced scorecard
approach to attach weightings to external objectives as well
as internal objectives. A combination of outcome and
process indicators may also be used to accommodate
difficulties in ascribing developmental or ‘softer’ impacts to
one activity. NDT is itself currently in the process of
returning to a balanced scorecard approach.
Executive Performance Management
According to the 2009 Corporate Governance Policy of SA
Tourism, revised in October 2013, the key performance
criteria of the CEO relate to:
Organisational culture and structure.
Governance and leadership.
Team building.
Human Resources
Strategic Relationship.
Corporate Citizenship.
Transformation management.
While minutes of the August 2014 Remuneration Committee
of the Board indicate the need for a new approach to
executive remuneration and performance, we have not been
able to verify that this has been addressed. It is not clear
therefore that SA Tourism’s leaderships’ performance
agreements and incentives are directly linked to
organisational targets. Nor is it clear if any other measures,
like those related to internal organisational consideration,
such as governance and leadership, are included.

SA Tourism Review: Report of the Expert Panel, June 2015
60
Marketing Effectiveness Performance measures
A high level of variation exists across country offices in their
marketing activities (as observed through a consideration of
the country office JMAs). Furthermore, an analysis of the
marketing budget appears to indicate that a significant share
of the budget is eaten up by the fees of many service
providers.
Trying to get a clearer understanding of these two
dimensions of marketing performance has revealed that
there is not a set of marketing effectiveness measures within
the organisation. While Brand tracking and ‘click through
rates’ for digital marketing are measured, ‘value for money’,
or ‘return on investment’ are absent from all strategic
documents that we have reviewed.
The absence of a set of marketing effectiveness measures,
ratios and targets, is concerning given that this is the core
business of the organisation. While high level objectives
relating to tourist arrivals are important, the ‘next level
down’ where SA Tourism can more accurately indicate a
causal relationship with their marketing choices, is absent.
Monitoring value for money ratios could also help the
organisation to identify areas in which to ‘finesse’ the
business model and release additional funds. Where difficult
decisions are necessary with a budget that is challenged in
hard currency terms, these sorts of measures are absolutely
essential.
Benchmarking
Internal organisational factors are important dimensions of
an NTO’s performance, including stakeholder satisfaction.
Both Canada Tourism Commission and Tourism Australia
include these indicators in their performance management
system.
Tourism Australia also has partnership satisfaction measures
and marketing effectiveness measures (they use ‘traditional
marketing recall from consumers’ and ‘monthly unique
visitors to Tourism Australia website’).
Our Recommendations
1. SA Tourism should introduce staff satisfaction and
stakeholder satisfaction measures into its
organisational performance management and
targets to be monitored by the Board.
2. ExCo’s performance contracts should be aligned to
the organisational one and the CE’s measures of
performance should reflect the Corporate
Governance policy’s prescriptions to include a
range of internal ‘health of organisation’ measures.
The CEO and Chief Marketing Officer’s performance
should also be measured into terms of marketing
effectiveness.
3. Organisational and Executive performance
management reviews must be based on objective
measures. The results of the annual organisational
performance review, and possibly that of the CE,
should be made public.
4. Marketing effectiveness measures should be
developed and introduced to achieve an
understanding of the impact of various marketing
activities relative to Rands spent. These should also
include different cost ratios related to actual
marketing delivery models.

61
Table 17: Annual performance indicators, 2015/6, as per South African Tourism Annual Performance Plan 2015/6
KEY PERFORMANCE INDICATOR
AUDITED OUTCOME/ACTUAL PERFORMANCE ESTIMATED PERFORMANCE
TARGET FORECASTS
2011/12 2012/13 2013/14 2014/15 2015/16 2016/17 2017/18
Number of international tourist arrivals achieved
8 339 354 9 188 368 9 616 964 4.7% 10 263 393 6.7% 10 977 407 7.0% 11 540 685 5.1% 12 020 928 4.2%
Number of domestic holiday trips achieved
3 900 000 2 900 000 3100 000 6.9% 2 624 214 -15.3% 2 841 209 8.3% 3 059 764 7.7% 3 278 319 7.1%
Total revenue achieved (billion rand)
R91.3 R 96.0 R 94.6 -4.0% R 101.8 7.6% R 107.4 5.5% R 112.7 5.0% R 117.5 4.2%
TTFDS (billion rand) R 71 R 74.2 R 70.3 -5.3% R 78.6 11.8% R 83.1 5.7% R 87.4 5.2% R 91.0 4.1%
TDDS (billion rand) R 20.3 R 21.8 R 24.3 11.5% R 23.2 24.3% R 24.3 4.5% R 25.3 4.5% R 26.5 4.5%
Brand awareness achieved (%)
77% (Feb 2012)
81% (Feb 2013)
79% (2013 average) 80% 80% 80% 80%
Number of graded accommodation establishment members achieved
4 886 6 022 5 587 -7.2% 7 088 26.9% 6 493 -8.4% 6 948 7.0% 7 643 10.0%
*Number of business events achieved in South Africa
N/A 52 587 (delegates)
118 - 71 -39% 87 22.5% 118 35% 125 5.9%
Source: South African Tourism, Strategic Plan 2015 – 2020; 2015

62
3.12 National Department
Introduction
A new standalone Department of Tourism was announced in
2009 by the President. Since then the department has grown
considerably in staff and work programmes. It has become
involved in a great many activities aimed at tourism
development in the country.
This section considers the focus of the Department, and its
relationship with SA Tourism. Of particular importance is the
division of roles and responsibilities and the degree to which
these two organisations are aligned to support one another,
and further the broader economic objectives for tourism in
the country.
Stakeholder views
Most private stakeholders were not very clear on what
NDT’s focus is, nor how its mandate relates to that of SA
Tourism. Comments included:
o NDT should be doing the work on transformation and
host the Grading Council, not SA Tourism.
o NDT should focus on policy making and addressing
barriers to travel and supply-side issues including
safety and security, airlift, product mix, skills and
training, visa policies and costs, negative image of
country and continent (Ebola, etc.). Co-ordinated
work with other government departments is
required.
Public sector stakeholders indicated similar views to the
private sector. Additionally, that:
o NDT should work with local government; smaller, less
visited provinces and key attractions like World
Heritage sites.
Certain well-placed experts and public sector
representatives queried NDT’s size and effectiveness.
Particular questions were asked regarding the area of
International Tourism Management relative to SA
Tourism’s mandate.
Our Research
NDT has grown considerably from 68 staff (not including
shared service staff) at the time of the announcement of the
new, standalone department in 2009 to 530 in 2014/5. The
total budget in 2014/5 was R1,6 billion with the main budget
items transfers at R1,27 billion in 2014/5 - the bulk of NDT’s
budget - and personnel, which was R233 million in 2014/5.
There are four divisions within NDT: Operations, Policy and
Knowledge Services, International Tourism Management and
Domestic Tourism Management.
Table 18 shows the key staff indicators and how these have
changed over the past 5 years.
Table 18: NDT staff indicators, 2011 to 2015
Mar-11 Mar-12 Mar-13 Mar-14 Mar-15
Funded
posts 378 446 528 555 570
Actual staff 303 404 467 507 530
Vacancies
(%) 19.8% 9.4% 11.6% 8.6% 7%
Turnover
(%) 12% 8% 13.4% 12.4% 11%
Training
as % of staff
costs 1.1% 1.6% 1.8% 2.1% 1.8%
Source: NDT. 2015
The NDT personnel budget has grown by around 86% to
R233 million in 2014/5.

SA Tourism Review: Report of the Expert Panel, June 2015
63
Figure 47: NDT expenditure by category (R’m) in adjusted to 2014/15 prices
Source: NDT, 2015
Once transfer payments are removed, the expenditure by
component area is the highest by far in the COO / Corporate
Services division, at R140 million in 2014/5, of the R389, 6
million budget.
Most of the staff is also located in the COO / Corporate
Services division – at 236 of 530, almost half. A number of
roles of the Corporate Services division are mandated within
the PFMA and other legislation. This in part explains the
larger budget and staff complement.
Table 19: NDT expenditure by component (R’m) (excluding transfer payments) adjusted to 2014/15 prices
2010/11 2011/12 2012/13 2013/14 2014/15
Ministry R 30,2 R 33,7 R 32,0 R 39,5 R 36,2
DG's office and internal audit
R 10,9 R 10,8 R 18,1 R 18,6 R 17,9
COO / Corporate Services
R 105,9 R 152,7 R 118,7 R 130,4 R 140,5
Policy and knowledge management
R 15,5 R 27,8 R 40,8 R 34,2 R 41,5
International tourism management
R 28,7 R 24,4 R 26,3 R 38,2 R 46,1
Domestic tourism management
R 50,2 R 52,7 R 67,9 R 92,1 R 81,0
Office accommodation
R 45,2 R 31,4 R 27,5 R 30,6 R 26,4
TOTAL R 286,7 R 333,5 R 331,4 R 383,5 R 389,6
Source: NDT ,2015
NDT’s focus areas
According to the 2015/6 Performance Plan of the
Department, these are the key functions of the department:
Policy and knowledge management division, accounting
for 71 staff. The budget in 2014/5 was R950 million,
which includes the transfer payment to SA Tourism of
R880 million, and R21 million for the tourism incentive
programme.
The main programme purposes include support to sector
policy development and evaluation, research and
knowledge management, and the promotion of
transformation and responsible tourism. Areas of
particular relevance to SA Tourism and to the focus areas
outlined for NDT by stakeholders include:
o A new tourism incentive, launched in March 2015,
which includes a facility for ‘market access’.
o Destination development plans supported at certain
major attractions and tourist information capacity
building.
o National Tourism Information Gateways plans and
implementation strategies.
o Initiatives to professionalise tourist guides.
o State of Tourism Reports. (Presumably these cover
the impact of tourism on the economy and raise and
review important issues around tourism development
in the country, including impediments).
o A Tourism Knowledge portal.
The International Tourism Management division
comprises 62 staff. The total budget for this division was
R45 million in 2014/5. This will grow to R56,5 million in
2017/8. Compromised of geographically focused teams,
the main programme purpose is to provide strategic
policy direction for the development of South Africa’s
tourism potential throughout various regions of the
world. This division has particular relevance to SA
Tourism and includes:
o Capacity building in skills development in embassies
for destination promotion. 126 missions supported in
adopting business planning model for
institutionalising tourism.
R 0.0
R 200.0
R 400.0
R 600.0
R 800.0
R 1 000.0
R 1 200.0
R 1 400.0
R 1 600.0
R 1 800.0Transfer payments
Goods and services
Office rental &running costs
S&T
Personnel
Capital

SA Tourism Review: Report of the Expert Panel, June 2015
64
o Develop watch list markets and markets outside SA
Tourism’s portfolio.
o Promote regional tourism integration. Measures here
include reports on international agreements and
participation in regional forums as well as a review of
the expansion of Indaba.
Questions have been raised regarding the strategic value of
these activities and their interaction with SA Tourism’s
marketing efforts.
The Domestic Tourism Management division has 97 staff
configured with a provincial focus. The 2014/5 budget for
this division was R363 million of which R299 million was
the Expanded Public Works Programme incentive –
known as the Social Responsibility Initiative. The
division’s programme purpose is to provide strategic
policy direction for the development and growth of
sustainable domestic tourism throughout South Africa.
Areas with some relevance to SA Tourism include the
implementation of:
o Education and awareness programmes aimed at
stimulating interest in travel and promoting wider
access to grow domestic tourism (however, the
deliverable is Tourism Month).
o Service excellence standards - 2 sites are identified in
the 2014/5 performance report. Service excellence
training is also undertaken.
Through its considerable staff complement and budget the
NDT undertakes a wide range of activities in support of
implementing the NTSS. Stakeholders repeatedly identified
a number of obstacles to growth, and proposed this as the
critical area the NDT should focus on unlocking.
The obstacles identified are shown in Figure 48, which
follows.
Figure 48: Obstacles to international tourism
Source: Panel research based on stakeholder submissions, 2015
Perceived obstacles have also been categorized according to
their impact on domestic or international tourism growth, as
indicated in the Figure 49, below.
Figure 49: Obstacles to tourism growth ranked by frequency with which issues were raised
Domestic International
1. Affordability 2. Transport infrastructure
& cost 3. Lack of tourism culture 4. Inappropriate products
& packages 5. Safety 6. Marketing & awareness
1. Immigration restrictions
2. Long haul destination & airlift
3. Marketing & awareness
4. Safety 5. Affordability / value for
money 6. Products & standards
Source: Expert panel research based on stakeholder submissions, 2015
Our research indicates that the new immigration regulations
are likely to have seriously negative consequences. For
example:
Japan does not issue birth certificates; Italy only
issues birth certificates at local offices and these
vary in format; and in China only two visa
processing offices have been proposed by the
Department of International Relations and
Cooperation. For all non-English speaking countries,
translation into English is an additional cost and
hurdle. It is also not clear if the new visa regulations
and the Approved Destination Status accorded to

SA Tourism Review: Report of the Expert Panel, June 2015
65
South Africa by China are in concert or are
contradictory.
An associated issue relates to the processing time for visas.
In India this takes close to 22 days as adequate processing
capabilities are not in place. The same is true for visas issued
in important African destinations. For example, it is
impractical for Nigerians outside Lagos and Abuja to obtain
visas.
Furthermore, for biometric visas, South Africa apparently
only issues a 1 month single entry visa (which excludes a
number of travellers wanting to visit the region), compared
to competitors such as Australia and the US which issue 5
and even 10 year multiple entry visas.
Benchmarking
Tourism tends to be a standalone Ministry in developing
countries, whilst in the developed world it more often falls
under Departments of Commerce or Industry. The roles of
the national department and NTOs vary extensively from
country to country.
Recommendations
1. The primary role for NDT must be to position tourism as a
key economic sector within government and to unblock
obstacles to tourism growth. NDT should look at cutting
back on its other focus areas and staffing levels and
rather focus on legislation, regulation and policy. A
departmental review should consider how to refocus the
department for greater effectiveness.
2. In relation to SA Tourism, a structured relationship of
accountability needs to be complemented by a
collaborative approach to working together to address
key issues – SA Tourism must arm NDT with the right
information and insights, NDT needs to fight for SA
Tourism funding and address obstacles to its
effectiveness. Regular meetings are to be encouraged
between the leadership of SA Tourism and NDT.
Furthermore, the Minister and Board must share a view
of the key areas of oversight that Board should monitor.

66
5. Conclusion
The last few years at SA Tourism may be characterised as a
period of stabilisation which appears to have resulted in a
greater level of centralisation and control.
SA Tourism possesses many staff hard at work doing their
best to deliver marketing value for the country. Certain
examples of good or best practices were regularly cited
across stakeholder groups and deserve a mention:
Certain county offices and their managers,
particularly Germany, India and the China / Japan
/ Korea hub.
The digital presence and online partnerships of SA
Tourism, particularly its strong focus on user-
generated content.
Certain of the global television advertisements.
The evidence based and rigorous research
methodologies historically used to arrive at
decisions regarding which markets to prioritise.
The unqualified audits also indicate that the finances of
the organisation are largely well managed and in keeping
with the prescripts of the PFMA.
This report has highlighted many areas where SA Tourism
must make significant changes and strides to succeed as a
leading NTO in the 21st century. SA Tourism is in a good
position to put in place a refocused strategy and
reinvigoration of its delivery for a number of reasons:
For the most part a relatively new ExCo who
represent a ‘fresh start’.
A new Board who will be well-briefed to steer and
monitor the performance of the organisation.
A relatively new Minister to champion the cause
of tourism in government.
Furthermore, the private sector is keen to partner with SA
Tourism in many aspects of its mandate. Public sector
partners, particularly provincial and local government,
have also indicated their desire for a more strategic
collaboration.
With full adoption of the recommendations contained
within this report, we can expect:
A real and valuable partnership with industry and
government stakeholders which is supported
through both formal and informal engagements
and shared strategising.
Enhanced international marketing to unleash
stronger tourist arrivals growth and tourism
revenue.
An improved culture of travel amongst South
Africans, and greater awareness of and
enthusiasm amongst South Africans for their
country’s travel experiences.
An increasingly robust tourism strategy which
drives operations, and pervades the organisation,
informed by cutting edge research and analytics,
resulting in optimal allocation of limited resources
and improved decision making.
A culture of trust, inclusion, openness, fairness,
delegation, respectfulness and transparency, led
and demonstrated by ExCo and cascading to all
levels of staff, and permeating dealings with
stakeholders.
Clearer performance expectations and definitions
of roles and responsibilities between NDT and SA
Tourism.
A more focused NDT which uses its resources to
address the major barriers to tourism growth,
lobby government, and provide strong support to
SA Tourism’s work.
Taken together, all of these improved elements should
translate into a strong growth in tourist numbers and
spend, and most important of all, a significantly larger
economic impact from tourism in South Africa.

SA Tourism Review: Report of the Expert Panel, June 2015
67
Annexure A: Full list of Recommendations, by Area
3.1 The Role and Mandate of South African
Tourism
1. While the focus on the Board at the expense of the
broader organisation needs to be remedied in the
Tourism Act, we are confident that SA Tourism’s
mandate and role as specified in the Act are
appropriate. The mandate is sufficiently flexible
and relevant to the tasks required of a destination
marketing organisation. International tourism
marketing should remain the main focus of SA
Tourism with domestic tourism marketing and
business tourism marketing as important additional
areas.
2. TGCSA should be removed from SA Tourism’s
operations as it is not well aligned to the
organisation.
3. There exists a serious disconnect between what SA
Tourism is doing and what it is understood to be
doing. The mandate needs to be communicated
effectively.
4. As part of their mandate, SA Tourism needs to
explicitly develop and deepen the partnership with
the public and private sectors. This should be
subject to performance measurement and review.
5. NDT needs to play a clearer role vis-à-vis SA
Tourism. While SA Tourism has a role to play in
making the case for tourism’s economic
contribution and the need to invest in tourism
marketing, NDT must address destination
constraints particularly those put in place by other
departments, such as visa regulations, health
concerns, statistics, etc.
3.2 International Marketing
1. SA Tourism should demonstrate leadership in
international marketing through innovation and
freshness, and a clear strategic core that aligns and
links the many marketing activities (including digital
and traditional, and across and between countries).
SA’s competitive advantage lies in the very unique
experiences we can offer as a country. We should
be capitalising on this, and not following in the tired
footsteps of others by marketing only adventure,
wildlife or beaches.
2. SA Tourism should review its marketing execution
business model, particularly the use of extensive
service providers.
3. SA Tourism should seriously consider handing over
the management of Indaba to an independent
operator, given that industry is now actively and
successfully operating in this space (as evidenced by
WTM Africa), and the drain that Indaba places on
SA Tourism resources.
4. SA Tourism should review its practices for buyer
selection and participation at international tourism
shows (particularly of provinces and cities, and its
own large travel delegations). With the growing
using of online platforms to research and book
travel, investment in tourism shows might
increasingly provide less of a return than
investments in other marketing media and
techniques.
5. SA Tourism should continue to have a strong focus
on digital marketing. There needs to be greater
consolidation of digital assets across the board in
order to achieve consistency in brand message and
consistency in brand tone, manner and feel.
3.3 Domestic Tourism
1. Domestic tourism should remain a core mandate of
SA Tourism, albeit exercised in partnership with
national, provincial and local role players. This
means that SA Tourism needs to follow a
particularly collaborative approach in exercising this
mandate.
2. Domestic tourism marketing needs a proper focus
and long term, thoughtful, strategy. While a new SA
Tourism domestic strategy exist, it needs to be
seriously enhanced – and the existing efforts to
enhance it must continue. A key focus must be to
increase travel by black South Africans.
3. The fragmentation of the tourism brand needs to be
addressed by applying one brand strategy across
international and domestic markets. Work in this
area is already underway.
4. We need a new campaign on being a ‘tourism
nation’, particularly post-xenophobia attacks. The
Welcome campaign is an example of such a
campaign. Together with Brand SA, SA Tourism

SA Tourism Review: Report of the Expert Panel, June 2015
68
should look at reviving this programme, or an
equivalent.
3.4 Tourism Grading Council of South Africa
1. The TGCSA be moved from SA Tourism. A
separate process should consider where best it
could be located. The Panel has identified 3
possible options for its new location:
A government component under NDT.
A separate agency operating under its own
board (‘the Council’).
The South African Bureau of Standards
(SABS). SABS is an attractive option as it is
the home of standards, including voluntary
standards. Under the Act the Minister can
assign the TGCSA to SABS.
2. The process of recruiting a new Chief Quality
Officer should be put on hold until such time as
the location and business model, including
funding, for the TGCSA has been determined
3. The new business model for TGCSA should be
interrogated as to whether there is real value in
a grading council for industry and the
destination. The extended mandate should be
reviewed. In this regard, a limited role with
limited costs to the fiscus should be considered
for the short to medium term. The TGCSA should
principally be self-funding, which will create a
structured system of accountability. If a
compelling case is not built for the grading
system and industry walks away from it, NDT
should not be required to subsidise it.
4. SA Tourism should continue to partner with
TripAdvisor and other online platforms that are
extensively used to research product and for
peer reviews of the destination.
3.5 South African National Convention Bureau
1. The SANCB is a new entity and should be given an
opportunity to perform.
It should however be making a more
compelling business case to NDT, National
Treasury and industry for its existence and the
motivation for the use of state resources for
subvention funding.
Effective Delegations of Authority need to be
developed to allow for speedy approvals
affecting SANCB operations without the formal
sitting of the Marketing committee of the
Board, or the Board.
2. While it might not be currently appropriate for the
Subvention fund to be partly recapitalized from
successful bids through a levy on income received
from events, it is important that self-funding
mechanisms continue to be considered with the
maturation of SANCB and the Business Events’
industry. This will reduce reliance on the fiscus and
could provide for greater flexibility.
3. Improved research and analysis must be generated
for business tourism, including data from business
events attendees (SANCB is in a position to get
significant data through surveys of attendees at
events). This data can assist to make a case for
subvention. Metrics must also be developed to
measure performance and the data shared with
industry.
4. SA Tourism must maximise the linkages between
business and leisure tourism. Within the various
strategies, plans, research, etc. there is no
indication that this area has received any
attention.
3.6 Institutional positioning and partnerships
1. SA Tourism must be underpinned by a partnership
between government and industry. SA Tourism
needs to work in a way that is fundamentally
collaborative, where collaboration is a value and
measure for the organisation.
2. TBCSA provides an overarching voice for tourism
on certain issues and should and must remain a
main channel of communication, but SA Tourism
will need to also engage with industry associations
and members across its functional areas.
3. Additional formal and informal channels are
required for communication with industry
associations, trade and product. These may include
An annual conference.
Newsletters.
Regular workshops with invitations sent
through associations (members associations
of TBCSA).
A (dedicated) team or post at SA Tourism is
required to work with stakeholders (such as
trade manager post where the primary job
description is engagement with trade and
product).

SA Tourism Review: Report of the Expert Panel, June 2015
69
Website to be reformed to allow for
stakeholders to draw data reports of
relevance.
5. New and improved platforms for cooperation and
collaboration with government should include:
A shared platform for tourism with counterpart
government departments to ensure the timely
addressing of issues with major implications for
tourism.
Regular and formalized engagement between SA
Tourism and Brand SA at a marketing level,
where messaging and responses to crises, as
well as proactive opportunities, can be shared.
Provinces and cities, as partners in tourism
marketing and destination delivery, require the
CEO’s forum and marketing managers’ forum to
become more strategic with important
discussions on brand alignment and marketing
initiatives and materials. Metros should be
invited to attend such forums. Provinces and
cities need to be empowered to play a more
meaningful role.
A channel should be established to engage the
key cultural and natural heritage management
agencies, and World Heritage Sites, in a regular
manner. This could be part of the role to be
undertaken by the proposed product manager.
3.7 Strategy, analytics and market intelligence
1. Reposition research at the heart of SA Tourism
strategic planning by:
Reviewing and updating the TGS every three
years, including the market prioritization and
segmentation work. Discuss the findings with
stakeholders and staff. Ensure this work feeds
directly into Strategic Planning.
Rename the SRU “Insights and Analytics” to
attest to its important role in strategy and
expand and resource a larger, more strategic
mandate.
Regular reporting to and engagement with
ExCo on these insights and analytics. “Insights
and Analytics” should be a standing item on
Board committee meetings.
Strategic Planning must centrally situate
research insights and the culture of SA
Tourism must value and elevates strategic
insights that inform marketing choices.
2. Enhance research deliverables through:
Finding new sources to triangulate the StatsSA
releases on tourist arrivals and migration.
Board to consider setting up a task team with
industry participation to look at this matter.
Reviewing the current methodologies for
market and segment prioritisation and adding
new modules to historical research
methodologies to reflect changing practices
and new digital sources of information.
Ensuring the new domestic tourism survey to
be undertaken by StatsSA is extended to a
larger survey.
Routinely undertaking benchmarking work to
understand new practices at other comparable
NTOs.
Improved packaging and communication of
insights and analytics so it has maximum value
and impact for stakeholders to inform their
own marketing choices and activities.
Engaging industry to help interpret the market
intelligence based on their actual experience
of working with the markets.
On the basis of quality market intelligence,
business planning should be reinstituted as
the core mechanism for determining strategy
and allocating resources:
ExCo must prioritise and participate in the
business planning process.
Country office and regional managers need to
be involved in an iterative process of
determining priorities and plans in each
market.
Once approved the business units should be
given the operational autonomy to implement
in terms of the strategy.
3.8 Organisational Structure and Human
Resource Development
1. In light of the issues raised by both stakeholders
and the internal surveys, the new Board needs to
urgently put in place measures and interventions to
ensure that the CEO and leadership team have the
capabilities to carry out roles and duties as set out
in their key performance areas (and proposals
thereto, which follows).
2. The Board should urgently review the role,
performance and capabilities of the Human
Resource function given the findings and

SA Tourism Review: Report of the Expert Panel, June 2015
70
recommendations of this Report and the Hay and
Best Company to Work For Surveys.
3. SA Tourism must establish a culture of engagement
and empowerment within and across all levels and
units of the organisation, to include:
introducing ways for middle management to
engage in strategic discussions and share
plans/ practices;
effective delegations of authority to devolve
decision-making to management;
a change management process to look at the
DNA of the organisation, and to shift the
organisational culture; and
staff satisfaction should be monitored through
annual surveys and remedial actions swiftly
taken.
4. The finalisation of the organisational review of head
office should be postponed until such time as the
findings of the Panel are discussed between the
Minister, Board and ExCo as these may have
bearings on organisational design. This
organisational design should include (as it currently
does not) a comprehensive review the country
office/ hub office model given funding and resource
constraints including currency risks and losses. This
includes the ‘mandated plans’ to expand to 5
country offices in Africa. The most appropriate and
practical forms of establishing a market presence
must guide the decision.
5. A skills’ audit must be undertaken against the new
organisational design to understand which
important skills are missing.
3.9 Budget and Finance
1. SA Tourism to provide NDT and National Treasury
with a much clearer business case for investment in
marketing, and consistently make the economic
argument for budget allocations.
2. SA Tourism needs to develop a clear strategy to
improve collection of the TOMSA levy which
includes demonstrating value for money. Their
budget from NT should not be cut when revenues
grow.
3. A review of the budget should be undertaken to
include a range of important operational and
management dimensions, such as:
Country office/ hub model costs, per category;
Country budgets and trends;
Ratio of overheads to actual monies spent on
marketing media;
the cost of marketing service providers and
ratios to other marketing categories.
4. A re-alignment, and ongoing monitoring of the
budget, should focus on:
reducing/ limiting overheads;
increasing marketing expenditures, in particular
on actual tourist facing media;
protecting spend in core markets (this can be
accommodated within the existing mechanism
followed by National Treasury but SA Tourism
needs to be given an explicit undertaking that
NT will manage the currency risk);
increasing the research budget; and
targeting reductions in non-return marketing
costs – such as service providers; large
delegations to shows; etc.
The board-approved budget realignment should be
approved within six months. Regular monitoring of key
ratios and indicators should be reported at Board level
and in reporting to the Department.
3.10 Governance
1. South Africa’s particular circumstances, including its
unique geographical, historical and political context,
require that the Board of SA Tourism should reflect:
a. a partnership between public and private sector;
b. a strong focus on leadership or management
experience in tourism, particularly tourism
marketing; and
c. diversity that can properly reflect and accurately
represent the country and ensure this is taken
forward in destination brand positioning and
marketing.
2. In order to co-opt additional specialist tourism
marketing skills, we recommend the following:
a. Subcommittees, such as the Marketing
Committee, should bring in additional industry
experience in relevant areas.
b. Ad hoc advisory committees should be set up
from time to time to advise the Board on
particular issues.
3. The new governance protocol with NDT must be
finalised as a matter of urgency.
4. SA Tourism’s Corporate Governance policy and
Code of Conduct for Board members must be

SA Tourism Review: Report of the Expert Panel, June 2015
71
updated based on King III, and the new protocol
with NDT. This should include, but not be limited to:
a. Information Technology risks and systems
should be reported on to the Board.
b. Given the stakeholder perceptions that exist
regarding Board travel to tourism shows, and
the current efforts around cost containment at
SA Tourism, as well as the kind of image SA
Tourism should project of the country, the Code
of Conduct for the Board should specify that
Board travel is not to occur unless under special
circumstances, and the possible eventualities of
these special circumstances should be spelt out.
c. An annual performance review should be
conducted of the Board and its committees,
which should include the extent to which it
members contribute to its effectiveness.
3.11 Performance Management and Monitoring
1. SA Tourism should introduce staff satisfaction and
stakeholder satisfaction measures into its
organisational performance management and
targets to be monitored by Board.
2. ExCo’s performance contracts should be aligned to
the organisational one and the CE’s measures of
performance should reflect the Corporate
Governance policy’s prescriptions to include a range
of internal ‘health of organisation’ measures. The
CEO and Chief Marketing Officer’s performance
should also be measured into terms of marketing
effectiveness.
3. Organisational and Executive performance
management reviews must be based on objective
measures. The results of the organisational review,
and possibly that of the CE, should be made public.
4. Marketing effectiveness measures should be
developed and introduced to achieve an
understanding of the impact of various marketing
activities relative to Rand’s spent. These should also
include different cost ratios related to actual
marketing delivery models.
3.12 National Department
1. The primary role for NDT must be to position
tourism as a key economic sector within
government and to unblock obstacles to tourism
growth. NDT should look at cutting back on its other
focus areas and staffing levels and rather focus on
legislation, regulation and policy. A departmental
review should consider how to refocus the
department for greater effectiveness.
2. In relation to SA Tourism, a structured relationship
of accountability needs to be complemented by a
collaborative approach to working together to
address key issues – SA Tourism must arm NDT with
the right information and insights, NDT needs to
fight for SA Tourism funding and address obstacles
to its effectiveness.

72
Annexure B: List of Consulted Stakeholders NAME OF ORGANISATION PERSONS CONSULTED NATURE OF CONSULTATION
A&K Paul Baner Workshop on the 12th March 2015
AA Quality Assured Shane Erlank On line survey 1st March 2015 - 1st April 2015
African Ample Assistance Travel Charlene Sudlow Workshop on the 18th March 2015
AASA Chris Egenthal On line survey 1st March 2015 - 1st April 2015
ACSA Bongani Masego & Tebogo Mekoe On line survey 1st March 2015 - 1st April 2015
Afrikaanse Handelse Instituut Kobus Tait On line survey 1st March 2015 - 1st April 2015
ASATA Otto de Vries On line survey 1st March 2015 - 1st April 2015
AVIS SA Keith Rankin & Lance Smith On line survey 1st March 2015 - 1st April 2015
BARSA June Crawford On line survey 1st March 2015 - 1st April 2015
Bidvest Car Rental Paulette Mc Ghee & Lindsay Versfeld On line survey 1st March 2015 - 1st April 2015
Big Ambitions Natalia Rosa Telecon 4 May 2015 and written submission
Blue Train Herbert Masheula & Hanlie Kotze On line survey 1st March 2015 - 1st April 2015
Bon Hotels Guy Stehlik On line survey 1st March 2015 - 1st April 2015
Brand SA Thebe Ikalafeng & Happy Ntshingila Telecon & Meeting on the 24th April 2015
Cape Grace Sandy Powell Workshop on the 18th March 2015
Cape Nature Razeena Omar Telecon
Cape Rainbow Tours Alvin Kushner Workshop on the 18th March 2015
Cape Town Partnership Skye Grove Meeting on the 6th March 2015
Cape Town Tourism Enver Mally & Velma Corcoran Meeting on the 6th March 2015
Cape Town Waterfront Annemie Lieberberg Workshop on the 18th March 2015
City Lodge Group Clifford Ross On line survey 1st March 2015 - 1st April 2015
City of Cape Town Anton Groenewald Meeting on the 6th March 2015
City of Ekurhuleni Tebogo Mangangwana Meeting on the 16th March 2015
City of Tshwane Linda Ngcipe Meeting on the 16th March 2015
COMAIR Margaret Kinsman Workshop on the 12th March 2015
Deloitte Jan Hutton Phone/Skype on the 5th March 2015, Workshop on the 12th March 2015

SA Tourism Review: Report of the Expert Panel, June 2015
73
Durban Convention Bureau James Seymour Written Submission on the 13th March 2015 and Meeting on the 12th May 2015
Durban Tourism Phillip Sithole Written Submission
Ecco Tours Steve Bailey Workshop on the 18th March 2015
ERM Tours Barry Hultek Workshop on the 12th March 2015
Europcar SA Dawn Jones On line survey 1st March 2015 - 1st April 2015
Exhibition Association of South Africa Sue Gannon On line survey 1st March 2015 - 1st April 2015
Expedia Ross Carter On line survey 1st March 2015 - 1st April 2015
Fair Trade in Tourism SA Jennifer Seif On line survey 1st March 2015 - 1st April 2015
Fair Trade in Tourism South Africa Jennifer Seif Telecon on 6 March 2015, email correspondence thereafter
Fairfield Juliane Loubser Workshop on the 18th March 2015
Fancourt Lizl De Wet Workshop on the 18th March 2015
FEDHASA Eddy Khosa On line survey 1st March 2015 - 1st April 2015
FNB Wiza Nyondo On line survey 1st March 2015 - 1st April 2015
Forever Resorts Kobus Tait On line survey 1st March 2015 - 1st April 2015
Freelancer Didi Moyle Meeting on the 10th March 2015
Gauteng Province Mags Pillay Telecon
Gloo Digital Pete Case Telecon on the 24th April 2015
Gooderson Leisure Gail Westphal Meeting 30th March 2015
Grant Thornton Gillian Saunders Meeting on the 20th March 2015 & On line survey
Grosvenor Peter-John Metrovic Workshop on the 18th March 2015
Ignite Strategies (PTY) LTD Paul Bannister Meeting on the 11th March 2015
Ilanga Travel Anedore Kessler Workshop on the 18th March 2015
Ilios Travel Mohamed Baba Workshop on the 18th March 2015
INDABA Hotel Charles Drews Workshop on the 12th March 2015
Industrial Development Corporation Chistine Engelbrecht & Moseketsi Mpeta On line survey 1st March 2015 - 1st April 2015
Ireland Davenport Andre Lombaard Meeting on the 21st April 2015
Isimangaliso Andrew Zaloumis Telecon
Iziko Museums Susan Glanville - Zini Telecon
Johannesburg Tourism Company Phelisa Mangcu On line survey 1st March 2015 - 1st April 2015

SA Tourism Review: Report of the Expert Panel, June 2015
74
Kuoni Private Safaris Bettina van der Hurk Workshop on the 18th March 2015
Legacy Hotels & Resorts International Paddy Brearly On line survey 1st March 2015 - 1st April 2015
Legend Tours Faiz Nordien Workshop on the 18th March 2015
Leriba Hotel & Spa Peet Du Preez On line survey 1st March 2015 - 1st April 2015
Marriott Luxury Hotels International Mark Satterfield On line survey 1st March 2015 - 1st April 2015
MORE Britt More Workshop on the 12th March 2015
Ministry of Tourism Minister Derek Hanekom Meeting on the 25 May 2015
National Accommodation Association of South Africa
Donovan Muirhead On line survey 1st March 2015 - 1st April 2015
National Department of Tourism Dirk van Schalkwyk Meeting on the 23rd April 2015
National Department of Tourism Shaun Vorster Meeting on the 28 March 2015
National Department of Tourism Victor Tharage Meeting in March 2015
National Treasury Ricardo Andrews, Ashley Ramasimu, Luchelle Soobyah & Owen Willcox
Meeting on the 09th April 2015
North West Parks and Tourism Board Written Submission
Now Media Tessa Reed Workshop on the 12th March 2015
Paarl & Wellington Tourism David Frandsen Workshop on the 18th March 2015
Pam Golding Hotels Joop Demes On line survey 1st March 2015 - 1st April 2015
Peermont Global Resorts SA Jegie Padmanathan On line survey 1st March 2015 - 1st April 2015
PHASA Adri Kitshoff On line survey 1st March 2015 - 1st April 2015
Pulse Africa Nicci Leuterna Workshop on the 12th March 2015
Red Carnation Hotels Sally Gray Meeting on the 30th March 2015
Rhino Africa David Ryan Workshop on the 18th March 2015
Robben Island Museum Nomonde Ndlangisa Meeting on the 6th March 2015
Rovos Rail Ed Mitchell Workshop on the 12th March 2015
Royal African Discoveries Johan Groenewald Workshop on the 12th March 2015
SA Chefs Association Graham Donet On line survey 1st March 2015 - 1st April 2015
SA Express Airways Inati Ntshanga On line survey 1st March 2015 - 1st April 2015
SA Tourism research Bashni Muthaya Telecon 5 March 2015. A number of follow up emails thereafter
SA Tourism Board Zweli Mntambo Meeting on the 23rd March 2015

SA Tourism Review: Report of the Expert Panel, June 2015
75
SA Tourism Board Zweli Mntambo, Ayanda Ntsaluba, Graham Wood Written comments on draft final report, June 2015
SA Tourism ExCo Thulani Nzima, Sthembiso Dlamini, Thembi Kunene, Margie Whitehouse, Sthembiso Dlamini & Tom Bouwer
Meetings on 25th February and 23rd March 2015
SAA Sean Bradly On line survey 1st March 2015 - 1st April 2015
SAACI Zelda Coetzee & Adriaan Liebetrau On line survey 1st March 2015 - 1st April 2015
SABI Jacques Smit Workshop on the 12th March 2015
SABOA Eric Cornelius On line survey 1st March 2015 - 1st April 2015
SAN Parks Glenn Phillips On line survey 1st March 2015 - 1st April 2015 and telecon
SAN Parks Fundisile Mketeni Telecon
SAN Parks Dries de Wet email correspondence on April 30
SANBI Lihle Dhlamini Telecon
SATSA David Frost Meeting on the 24th February 2015, Workshop on the 12th & 18th March 2015, Online survey
SAVRALA Marc Corcoran & Sandile Ntsoane On line survey 1st March 2015 - 1st April 2015
SAYTC Gavin Eyre On line survey 1st March 2015 - 1st April 2015
Singita Caroline Burke Workshop on the 18th March 2015
Siyabona Africa Hans Gerrizen On line survey 1st March 2015 - 1st April 2015
South African Tourism Country Managers Managers representing 7 country offices Meeting on the 12th May 2015
Southern Africa 360 Collin Thaver Workshop on the 18th March 2015
Spirit of Africa Kiera Powers Workshop on the 18th March 2015
Stellenbosch Tourism Anne-Marie Ferns Workshop on the 18th March 2015
Stormsriver Adventures Ashley Wentworth On line survey 1st March 2015 - 1st April 2015
Sun International Garth Collins On line survey 1st March 2015 - 1st April 2015
Table Mountain Cableway Sabine Lehmann Meeting on the 6th March 2015
Tamrich Tours Rob Hetem Workshop on the 12th March 2015
The Reed Carol Weaving Workshop on the 12th March 2015
Thebe Tourism Group Jerry Mabena On line survey 1st March 2015 - 1st April 2015
Thompsons Africa Linda Pampallis Workshop on the 18th March 2015 & On line survey
TISA, the dti Stefanus Botes Email correspondence on the 30th April 2015
Tourism Enterprise Partnership (TEP) Saliffou Siddo On line survey 1st March 2015 - 1st April 2015

SA Tourism Review: Report of the Expert Panel, June 2015
76
Tourism KZN Ndabo Khoza Meeting on the 12th May 2015
Tourvest Martin Wiest & Tommy Edmond Workshop on the 12th March 2015, Online survey
Tsogo Sun Elke Menz & Marcel Vonaulock Workshop on the 18th March 2015, On line survey
VOASA Melanie Hatjigrounnakis On line survey 1st March 2015 - 1st April 2015
Wesgro Judy Lain Meeting on the 6th March 2015, Written Submission
WETU Andrew Ardington Workshop on the 18th March 2015
White Shark Projects Charmaine Beukes Workshop on the 18th March 2015
Wilderness Safaris Colin Bell & Sue Van Winsen Phone/Skype on the 5th March 2015, Workshop on the 12th March 2015

77
Annexure C: Bibliography
1. ABRAHAMSE, T. (2015). SAT review-nature heritage report. Sent by email from [email protected]
South Africa.
2. ASSOCIATION OF AUSTRALIA CONVENTION BUREAUX. (2015). Various webpages from aacb.org.au. Accessed
online in March and April 2015. Australia.
3. AUSTRALIA BUREAU OF STATS. (2015). Various webpages from abs.gov.au. Accessed online in March and April
2015. Australia.
4. AUSTRALIA GOVERNMENT DEPARTMENT OF INDUSTRY AND SCIENCE. (2014). Various webpages from
industry.gov.au. Accessed online in March and April 2015. Australia.
5. CANADA TOURISM. (2015). Various webpages from www.canada.travel. Accessed online in March and April
2015. Canada.
6. CANADIAN TOURISM COMMISSION. (2011). Annual report 2011. Accessed online at http://en-
corporate.canada.travel/about-ctc/corporate-reports/ctc-annual-report. Canada.
7. CAPE NATURE. (2013/14). Annual Report. South Africa.
8. CAPE TOWN TRAVEL. (2015). Written Inputs to South African Tourism Expert panel. South Africa.
9. DELOITTE. (2013). Best Company to Work for Survey: South African Tourism. South Africa.
10. DEPARTMENT OF ENVIRONMENTAL AFFAIRS. (2014). Governance Protocol for Environmental Affairs: Public
Entities. Sent by email from [email protected]. South Africa.
11. DEPARTMENT OF PUBLIC ENTERPRISES. (2002). Protocol on Corporate Governance in Public Sector. South Africa.
12. DEPARTMENT OF TOURISM. (2005). Governance Oversight Role. South Africa.
13. DEPARTMENT OF TOURISM. (2010). National Tourism Sector Strategy. South Africa.
14. DEPARTMENT OF TOURISM. (2014). Budget Allocations for the MTEF Period 2014/15 to 2016/17. South Africa.
15. DEPARTMENT OF TOURISM. (2014). Governance Protocol Draft. South Africa.
16. DEPARTMENT OF TOURISM. (2014). MTEF letter to NDT DG. South Africa.
17. DEPARTMENT OF TOURISM. (2014). NDT finance stats. South Africa.
18. DEPARTMENT OF TOURISM. (2014). NDT HR stats. South Africa.
19. DEPARTMENT OF TOURISM. (2014). South African Tourism Review Committee TOR. South Africa.
20. DEPARTMENT OF TOURISM. (2014). Tourism Act 2014. South Africa.
21. DEPARTMENT OF TOURISM. (2014). Tourism Growth Strategy 2010-2014. South Africa.
22. DEPARTMENT OF TOURISM. (2015). South African Tourism Stakeholders Contact List. South Africa.
23. DURBAN KZN CONVENTION BUREAU. (2015). Written Inputs to South African Tourism Expert panel. South Africa.
24. DURBAN TOURISM. (2015). Written Inputs to South African Tourism Expert panel. South Africa.
25. EASTERN CAPE PARKS AND TOURISM AGENCY. (2013/14). Annual Report: 2013. South Africa.
26. GRAIL RESEARCH AND SOUTH AFRICAN TOURISM. (2014). Global performance in 2014. Sent by email from
[email protected]. South Africa.
27. GRANT THORNTON. (2015). Indaba Rapid Review. South Africa.
28. HAY GROUP. (2013). Hay staff survey: South African Tourism. South Africa.
29. HONG ET AL. (2001). Tourism in South Korea: A performance evaluation model for Korea National Tourism
organization. MBA Dissertation. Accessed online at
http://www.researchgate.net/publication/27634191_Tourism_in_South_Korea__a_performance_evaluation_mo
del_for_Korea_national_tourism_organization. South Korea.
30. INCREDIBLE INDIA. (2015). Various webpages from www.incredibleindia.org. Accessed online in March and April
2015. India.
31. INDIA STATS. (2015). Various webpages from www.indiastat.com. Accessed online in March and April 2015. India.

SA Tourism Review: Report of the Expert Panel, June 2015
78
32. INDIA TOURISM REVIEW. (2015). Various webpages from www.indiatourismreview.com. Accessed online in
March and April 2015. India.
33. INSTITUTE OF DIRECTORS IN SOUTHERN AFRICA. (2009). King Code of Governance for South Africa 2009. South
Africa.
34. IPK INTERNATIONAL AND ITB BERLIN. 2015. ITB world travel trends report 2014/5. Accessed online at
http://www.itb-
berlin.de/media/itb/itb_dl_de/itb_itb_berlin/itb_itb_academy/ITB_2015_WTTR_Report_A4_4.pdf Germany.
35. KENYA TOURISM BOARD. (2015). Various webpages from www.ktb.go.ke. Accessed online in March and April
2015. Kenya.
36. KERALA TOURISM. (2015). Various webpages from www.keralatourism.com. Accessed online in March and April
2015. India.
37. MAGICAL KENYA. (2015). Various webpages from www.magicalkenya.com. Accessed online in March and April
2015. Kenya.
38. MINISTRY OF TOURISM GOVERMENT OF INDIA. (2015).Various webpages from www.tourism.gov.in &
www.tourism.nic.in. Accessed online in March and April 2015. India.
39. MPUMALANGA TOURISM AND PARKS BOARD. (2013/14). Annual Report. South Africa.
40. MSIMANG, M. (2015). Review of SA Tourism Performance Against Mandate. South Africa. Sent by email from
[email protected]. South Africa.
41. NATIONAL PLANNING COMMISSION. 2011. National Development Plan: Vision for 2030. South Africa. Accessed
online at
http://www.poa.gov.za/news/Documents/NPC%20National%20Development%20Plan%20Vision%202030%20-lo-
res.pdf. South Africa.
42. NATIONAL TREASURY. (2013/14). Estimates of Provincial Revenue and Expenditure. South Africa.
43. NORTH WEST PARKS AND TOURISM BOARD. (2013/14). Annual Report. South Africa.
44. NORTH WEST PARKS AND TOURISM BOARD. (2015). Written Inputs to South African Tourism Expert panel. South
Africa.
45. PIRES, J. (2015). Benchmarking Work: National Tourism Organisations. Sent by email from [email protected].
Brazil.
46. POTAL BRAZIL. (2015). Various Tourism Brazil webpages from www.brazil.gov.br. Accessed online in March and
April 2015. Brazil.
47. ROSA, N. (2015). Situational analysis summary: South Africa online marketing. Sent by email from
[email protected] South Africa. South Africa.
48. SOUTH AFRICAN NATIONAL PARKS. (2015). Tourism Statistics Summary. Sent by email from
[email protected]. South Africa
49. SOUTH AFRICAN TOURISM. (2003). Supply Chain Management Code of Conduct. South Africa.
50. SOUTH AFRICAN TOURISM. (2006). Disciplinary Code and Procedure. South Africa.
51. SOUTH AFRICAN TOURISM. (2009). Board Code of Conduct. South Africa.
52. SOUTH AFRICAN TOURISM. (2010). Action Plan & Monitoring: Hay and BCTWF staff surveys. South Africa.
53. SOUTH AFRICAN TOURISM. (2010). Benchmarking reports. Competitor destinations. South Africa.
54. SOUTH AFRICAN TOURISM. (2010). Measurement of Targets 2010 – 2014. South Africa.
55. SOUTH AFRICAN TOURISM. (2010). Original contract between South African Tourism and Ireland Davenport.
South Africa.
56. SOUTH AFRICAN TOURISM. (2011). Ministerial Review Committee on JMAs. South Africa.
57. SOUTH AFRICAN TOURISM. (2011). SA Tourism Annual Report 2011-12. South Africa.
58. SOUTH AFRICAN TOURISM. (2012). Analysis for Value of Money Perception. Sent by email from
[email protected]. South Africa.
59. SOUTH AFRICAN TOURISM. (2012). Consolidated Management Report. South Africa.

SA Tourism Review: Report of the Expert Panel, June 2015
79
60. SOUTH AFRICAN TOURISM. (2012). Guaranteed Remuneration and Performance Incentive Policy. South Africa.
61. SOUTH AFRICAN TOURISM. (2013) SAT Audit Report. 2013/2014. South Africa.
62. SOUTH AFRICAN TOURISM. (2013). Consolidated Management Report. South Africa.
63. SOUTH AFRICAN TOURISM. (2013). Grading Criteria Review. South Africa.
64. SOUTH AFRICAN TOURISM. (2013). Review Committee Request on Africa Air JMAs. 2013/2014. South Africa.
65. SOUTH AFRICAN TOURISM. (2013). SAT0Q-POL-09 - Corporate Governance Policy. South Africa.
66. SOUTH AFRICAN TOURISM. (2013). TGCSA Client Feedback Surveys. South Africa.
67. SOUTH AFRICAN TOURISM. (2014). 2015 MTEF motivation for funding: Subvention proposal. South Africa.
68. SOUTH AFRICAN TOURISM. (2014). 27 July 2014 – Final TGCSA Strategy. South Africa.
69. SOUTH AFRICAN TOURISM. (2014). Addendum to contract between South African Tourism and Ireland Davenport.
South Africa.
70. SOUTH AFRICAN TOURISM. (2014). Budget Breakdown: 2014/2015. South Africa.
71. SOUTH AFRICAN TOURISM. (2014). Consolidated Management Report. South Africa.
72. SOUTH AFRICAN TOURISM. (2014). Conversion curves per market/segment. South Africa.
73. SOUTH AFRICAN TOURISM. (2014). Country Office Business Plans. South Africa.
74. SOUTH AFRICAN TOURISM. (2014). Domestic Indicators Q1 2014 final. Available online at www.southafrica.net.
South Africa.
75. SOUTH AFRICAN TOURISM. (2014). Domestic Indicators Q2 2014 final. Available online at www.southafrica.net.
South Africa.
76. SOUTH AFRICAN TOURISM. (2014). Domestic Indicators Q3 2014 with economic indicators. Available online at
www.southafrica.net. South Africa.
77. SOUTH AFRICAN TOURISM. (2014). Domestic JMAs. South Africa.
78. SOUTH AFRICAN TOURISM. (2014). Final TCGSA Strategy. South Africa.
79. SOUTH AFRICAN TOURISM. (2014). Global JMAs. South Africa
80. SOUTH AFRICAN TOURISM. (2014). Global Report. South Africa.
81. SOUTH AFRICAN TOURISM. (2014). Highlights of 2014 Domestic v4 28042015. Sent by email from
[email protected]. South Africa.
82. SOUTH AFRICAN TOURISM. (2014). HR strategy. South Africa.
83. SOUTH AFRICAN TOURISM. (2014). Ministerial Review Committee on JMAs Feb 2014 Sadiq Din…mestic and
Global. South Africa.
84. SOUTH AFRICAN TOURISM. (2014). SA Tourism planning, reporting and framework. South Africa.
85. SOUTH AFRICAN TOURISM. (2014). SANCB Committee Minutes. South Africa.
86. SOUTH AFRICAN TOURISM. (2014). SAT Organogram. South Africa.
87. SOUTH AFRICAN TOURISM. (2014). Strategic indicators dashboard. South Africa.
88. SOUTH AFRICAN TOURISM. (2014). TGCSA Awards Committee Minutes. South Africa.
89. SOUTH AFRICAN TOURISM. (2015). Implementation of the Hub Strategy. South Africa.
90. SOUTH AFRICAN TOURISM. (2015). Joint Marketing Agreements: Australia; Brazil; China; France; Germany; India;
Japan; Netherlands; UK; USA. South Africa
91. SOUTH AFRICAN TOURISM. (2015). Marketing South Africa in China – prepared for Minister Hanekom. Sent by
email from [email protected]. South Africa.
92. SOUTH AFRICAN TOURISM. (2015). Review of the role of the SRU. Sent by email from [email protected].
South Africa.
93. SOUTH AFRICAN TOURISM. (2015). SAT’s revised framework for setting targets. South Africa.
94. SOUTH AFRICAN TOURISM. (2015). South African Tourism 2015/6 Annual Performance Plan. South Africa
95. SOUTH AFRICAN TOURISM. (2015). South African Tourism Country Managers Contact Details. South Africa.
96. SOUTH AFRICAN TOURISM. (2015). Subvention Fund Proposal 2015 MTEF - Additional Funding_ SANCB. South
Africa.

SA Tourism Review: Report of the Expert Panel, June 2015
80
97. SOUTH AFRICAN TOURISM BOARD. (2015). Comments on the panel review report. Electronic note sent from Chair
of SA Tourism Board to Panel, June 18, 2015.
98. SOUTHERN AFRICA TRAVEL UPDATE. (2015). 2014 stats just out show plummeting Chinese numbers. Available
online at http://www.tourismupdate.co.za/Home/Detail?articleId=49198#sthash.Rq2s92Rj.dpuf [Accessed March
2015]. South Africa.
99. SOUTHERN AFRICA TRAVEL UPDATE. (2015). Stats for leisure travel paint a bleak picture. Available online at
http://www.tourismupdate.co.za/Home/Detail?articleId=49198#sthash.Rq2s92Rj.dpuf. South Africa.
100. STATISTICS SOUTH AFRICA. (2015). 2 STAKEHOLDERS NDT 19 03 2015. Stats_SA presentation. Sent by email from
[email protected]. South Africa.
101. STATISTICS SOUTH AFRICA. (2015). SA Tourism Satellite Account presentation. Sent by email from
[email protected]. South Africa.
102. STATISTICS SOUTH AFRICA. (2015). Statistical release P6410. Tourist Accommodation (preliminary) January 2015.
Available online at www.statsa.gov.za. South Africa.
103. STATISTICS SOUTH AFRICA. (2015). Tourism Satellite Account for South Africa, final 2011 and provisional 2012 and
2013. Available online at www.statssa.gov.za. South Africa.
104. STATISTICS SOUTH AFRICA. (2015). Tourists Table A. Sent by email from [email protected]. South Africa.
105. TBCSA AND GRANT THORNTON. (2015). Tourism Business Index. 4th
Quarter 2014 results. Available online at
www.tbcsa.travel. South Africa.
106. THAILAND DEPARTMENT OF TOURISM. (2015). Various webpages from www.tourism.go.th. Accessed online in
March and April 2015. Thailand.
107. TOURISM AUSTRALIA. (2014). Tourism Australia’s Corporate Plan 2014-2017. Available online at
http://www.tourism.australia.com/documents/corporate/Performance-reporting-Corporate-Plan-2014.pdf.
Australia.
108. TOURISM AUSTRALIA. (2015). Various webpages from www.australia.com. and www.tourism.australia.com.
Accessed online in March and April 2015. Australia.
109. TOURISM AUTHORITY OF THAILAND. (2015). Various webpages from www.tatnews.org. Accessed online in March
and April 2015. Thailand.
110. TOURISM BUSINESS COUNCIL OF SOUTH AFRICA. 2015. Presentation for the National Assembly’s Portfolio
Committee on Tourism. South Africa. Available online at www.tbcsa.travel. South Africa.
111. TOURISM NEW ZEALAND. (2015). Various webpages from www.tourismnewzealand.com &
www.tourismnewzealand.com. Accessed online in March and April 2015. New Zealand.
112. UNITED NATIONS WORLD TOURISM ORGANISATION. (2015). Over 1.1 billion tourists travelled abroad in 2014.
Available online at http://media.unwto.org/press-release/2015-01-27/over-11-billion-tourists-travelled-abroad-
2014. Spain.
113. UNITED NATIONS WORLD TOURISM ORGANISATION. (2010). Budgets of National Tourism Organisations. South
Africa.
114. UNITED NATIONS WORLD TOURISM ORGANISATION. (2014). Online Guest reviews and hotel classification
systems – an integrated approach. Available online at www.unwto.org. Spain.
115. VISIT BRASIL. (2015). Tourism Brazil webpages from www.visitbrasil.com. Accessed online in March and April
2015. Brazil.
116. VISIT BRITAIN. (2015). Various webpages from www.visitbritain.org & www.visitbritain.com. Accessed online in
March and April 2015. Britain.
117. WESGRO. (2013/14). Annual Report. South Africa.
118. WESGRO. (2015). Written Inputs to South African Tourism Expert panel. South Africa.
119. WORLD TRAVEL AND TOURISM COUNCIL. (2015). February 2015 – Monthly economic impact. Available online at
www.wttc.org. Spain.

SA Tourism Review: Report of the Expert Panel, June 2015
81
120. WORLD TRAVEL AND TOURISM COUNCIL. (2015). Travel and Trade linkages: Analysis of trends. Executive
Summary. April 2014. Available online at www.wttc.org. Spain.
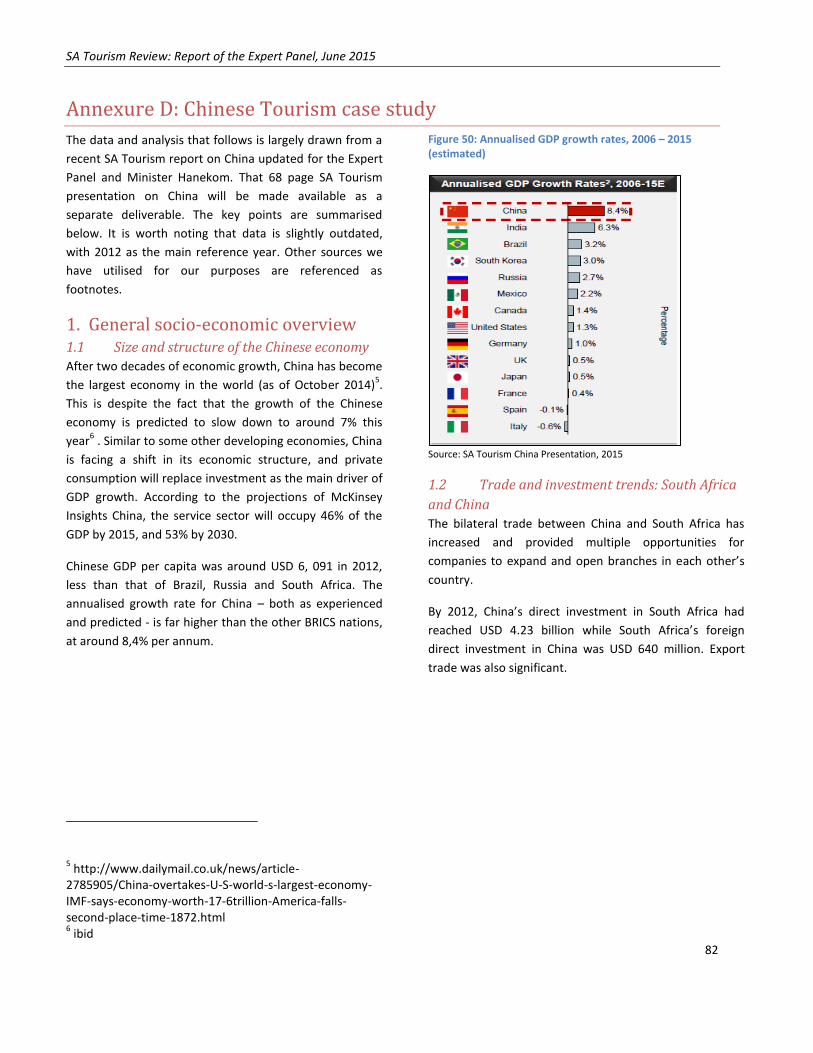
SA Tourism Review: Report of the Expert Panel, June 2015
82
Annexure D: Chinese Tourism case study
The data and analysis that follows is largely drawn from a
recent SA Tourism report on China updated for the Expert
Panel and Minister Hanekom. That 68 page SA Tourism
presentation on China will be made available as a
separate deliverable. The key points are summarised
below. It is worth noting that data is slightly outdated,
with 2012 as the main reference year. Other sources we
have utilised for our purposes are referenced as
footnotes.
1. General socio-economic overview 1.1 Size and structure of the Chinese economy
After two decades of economic growth, China has become
the largest economy in the world (as of October 2014)5.
This is despite the fact that the growth of the Chinese
economy is predicted to slow down to around 7% this
year6 . Similar to some other developing economies, China
is facing a shift in its economic structure, and private
consumption will replace investment as the main driver of
GDP growth. According to the projections of McKinsey
Insights China, the service sector will occupy 46% of the
GDP by 2015, and 53% by 2030.
Chinese GDP per capita was around USD 6, 091 in 2012,
less than that of Brazil, Russia and South Africa. The
annualised growth rate for China – both as experienced
and predicted - is far higher than the other BRICS nations,
at around 8,4% per annum.
5 http://www.dailymail.co.uk/news/article-
2785905/China-overtakes-U-S-world-s-largest-economy-IMF-says-economy-worth-17-6trillion-America-falls-second-place-time-1872.html 6 ibid
Figure 50: Annualised GDP growth rates, 2006 – 2015 (estimated)
Source: SA Tourism China Presentation, 2015
1.2 Trade and investment trends: South Africa
and China
The bilateral trade between China and South Africa has
increased and provided multiple opportunities for
companies to expand and open branches in each other’s
country.
By 2012, China’s direct investment in South Africa had
reached USD 4.23 billion while South Africa’s foreign
direct investment in China was USD 640 million. Export
trade was also significant.

SA Tourism Review: Report of the Expert Panel, June 2015
83
Figure 51: Exports from China to RSA, and from RSA to China, 2012 in USD.
Source: SA Tourism China Presentation, 2015
1.3 Population and wealth distribution trends
The population of China was 1,35 billion in 2012 and
estimated at 1,4 billion in 20157, nearly half of whom live
in rural areas. Between 2000 and 2012, the population of
urban residents rose by 13.5% when compared to 2000.
Regional inequality of social development is significantly
high in China. The uneven distribution of wealth is evident
from the large gap in the urban and rural annual
household incomes in China. USD $3,500 was the average
annual household income in 2012 but households in the
top 5% income bracket make up for about 23% of the
total Chinese household income while the lowest 5%
income households contribute just 0.1% to the total
income. The Chinese government plans to implement
efforts such as raising the minimum wages to 40% of the
average salary in 2015 to support poorer families.
Coastal cities such as Beijing, Shanghai, Guangzhou and
Shenzhen have high population density, regional GDP and
disposable income. Due to the rise in income and growing
7 http://www.worldometers.info/world-population/china-
population/
Chinese economy, average per capita consumption
expenditure of urban households increased from CNY
4,998 in 2000 to CNY 15,161 in 2011. Consumer
expenditure is likely to increase further. Nevertheless
China still had the lowest consumption to GDP ratio in
2012 at 35%, as compared to USA (70%) and India (60%).
1.4 Technology
The online industry is firmly controlled by technology
conglomerates such as Baidu, Tencent and Alibaba. As
popular social media websites such as Facebook, Youtube
and Twitter are banned in China, local websites such as
Weibo and Yoku offer similar services. China had
approximately 564 million internet users in December
2012 with the internet penetration rate as high as 42.1%.
In March 2012, China crossed the 1 billion mobile
subscriptions mark, becoming the first country in the
world to do so.
Figure 52: Major Chinese Technology Conglomerates
Source: SA Tourism China Presentation, 2015
2. Travel and Tourism: key trends
and factors 2.1 Structure of the industry
The Chinese retail market is highly fragmented with over
23,000 agents in 2012. High entry barriers such as the
requirement of a special license, and acquisitions by the
top players, has seen consolidation of the industry with
the share of national level players such as Chinese
International Travel Services (CITS), Alibaba, Shanghai
Chunqiu increasing. CITS has maintained its market
position as being the top retail player in the Chinese
market for organising outbound trips.

SA Tourism Review: Report of the Expert Panel, June 2015
84
2.2 Researching and booking trips
Travel agents are preferred over tour operators when
booking an international trip. A majority of Chinese
travellers prefer going for package holidays than travelling
independently. Chinese travellers make maximum
bookings online for flights and hotels when travelling
abroad. The number of foreign travel agencies has
recently increased significantly due to ease in regulations.
A higher internet penetration rate makes online portals
the most frequently used means for seeking travel-related
information in China. Though local travel agents are not a
key source of information, they are used since they help
to speed-up the visa application process and eliminate
language barriers. A majority of Chinese travellers use
professional travel websites such as Ctrip and eLong for
booking hotels and airlines when they are travelling to an
international destination.
Figure 53: Travel booking channels and online travel booking websites
Source: SA Tourism China Presentation, 2015
According to the Digital Influence Index, social media is
considered to be more influential than travel agents,
newspaper or TV in China. More than 80% of the Chinese
travellers gather information before travelling, online
channels being the major source of information.
Chinese travellers believe that it is critical for a company
to have a properly functioning website in Chinese since
most of them access the company website before using
online forums and social media sites.
2.3 Outbound travel trends
The tourists and their expenditure
Urban residents are the main participants of domestic and
outbound tourism, accounting for more than 70% of the
market, with significantly higher expenditure and
frequency. The population aged 25-65 is the backbone of
the tourism industry, out of which people aged 45-64
account for more than half of overall travellers. As China’s
population ages, the tour-loving population is expected to
expand further and reinforce domestic and outbound
travel.
Almost one-fourth of the outbound travellers have
income less than USD $11,350, with overall average
income being USD$17,800. Travel sales grew by 7%
annually from 2006–2012 to USD $35 Billion. Package
bookings, flight and accommodation form a major part of
the retail sales, accounting for 90% of the sales.
Domestic versus Outbound travel
Much travel is domestic – at 98% of all trips – or about 2,5
billion trips in 2012. Of the domestic trips, 1,7 billion were
leisure, 772 million for business.

SA Tourism Review: Report of the Expert Panel, June 2015
85
Outbound travel of the Chinese has increased in the past
few years due to a surge in its economic growth,
increased focus on long haul and family travel, decreased
travel regulations and an increase in travellers from Tier 2
cities. Outbound trips numbered some 48 million in 2012,
up from 42 million in 2011, a growth rate of 14%.
Figure 54: Outbound vs. domestic travel
Source: SA Tourism China Presentation, 2015
The recent UNWTO data quoted in Section 1 of this report
indicates that this growth rate slowed somewhat in 2014,
to about 10%. There appears to be a lack of correlation
between the data used by SA Tourism and that of
UNWTO: UNWTO refers to 109 million outbound trips
from China in 2014. This would be more than 100%
growth from 2012 numbers reported by SA Tourism (as
derived from Grail Research and Euromonitor).
Purpose of Travel
According to the data in Figure 54, above, of the 48
million outbound trips in 2012, 15 million or 31% were for
business. Travel to attend Business events, also known as
Meetings, Incentives, Conferences and Exhibitions travel,
is a large share of overall business tourism and travel from
China at 84% of total. At present, South Korea and
Singapore are the top business travel destinations for the
Chinese.
SA Tourism’s business tourism strategy segmentation
identifies strong potential for South Africa to target
incentives’ travel from Asia but meetings, conferences and
exhibitions originating from Asian markets, including
China, are not yet viewed as attractive opportunities.
Outbound travel destinations
The main outbound travel destinations from China are
Hong Kong, Macau and Taiwan – all of which Chinese
mainlanders would view as part of their larger territory.
The South East Asian countries of Singapore, Thailand and
Malaysia are also popular destinations in the region.
Further afield it is the traditional European destinations of
England, France and Germany that are leading long haul
countries. Australia and the United States are major
emerging long haul destinations for the Chinese outbound
market.
Regulating the outbound market
The Approved Destination Status (ADS) is a bilateral
agreement between China and other countries granting
overseas group travel undertaken by a qualified
international travel agency. The ADS visa is independent
to the regular individual tourism visa or business travel
visa and can only be applied for through designated travel
agencies. The designated agencies for ADS visa are

SA Tourism Review: Report of the Expert Panel, June 2015
86
responsible for the safety of the tourists in their ADS visa
travel group, including illegal residence and other
violations. The ADS visa only allows group travel (mostly
with fixed route), and has certain merits:
With qualified travel agency as the warrantor,
the process is swifter and less complicated’.
Most ADS visas require similar materials from
travellers so the applicants don’t have to check
the specific requirement of every country
through local embassies.
By 2009, 116 countries had received the ADS,
covering all popular destinations and in 2012 the
number of approved nations are 140, including
South Africa.
Travel preferences
The deep-rooted gift-giving culture and high domestic
tariff raised on luxury brands has resulted in increased
spending on shopping while travelling. In 2012, Chinese
travellers spent an estimated USD $3.2 billion in Europe,
mainly on fashion, cosmetics, perfume and leather
products.
Length of trip and seasonality of travel
Length of travel is determined by the distance of the
destination from China: the further the destination, the
longer the trip. Close destinations, with short trips of 1 to
3 days, are preferred. The length of stay is also longer for
wealthy travellers with their average trip length of 5 to 8
days.
There are three major holidays in China – The Chinese
New Year (Lunar New Year) in February, Labour Day in
May and the National Day in October and these are the
times that Chinese tourists travel. The Chinese New Year
and National Day are both 7-day holidays, commonly
known as The Golden Weeks.
3. Travel to South Africa 3.1 Awareness of South Africa South Africa received the Approved Destination Status
(ADS) in 2003 but Chinese consumers are not very familiar
with South Africa as a tourist destination (only 16% of
total considered themselves very familiar with the
destination in a survey in February 2013). Most Chinese
consumers were however able to identify South Africa
when listed along with other tourist destinations. It
appears that the 2010 FIFA World Cup helped publicise
South Africa as a tourist destination.
Figure 55: Chinese awareness and familiarity with South Africa, 2011 -2013
Source: SA Tourism China Presentation, 2015

SA Tourism Review: Report of the Expert Panel, June 2015
87
3.2 Arrivals and Tourist data
Around 2–5% of Chinese travellers have visited South
Africa. South Africa gets visited by Chinese who have
usually already visited more conventional long haul
destinations such as the US, the UK and Australia. Travel
to South Africa is often combined with travel to other
African countries such as Zimbabwe and Kenya.
Chinese arrivals to South Africa increased at an annual
rate of 20% between 1998 and 2004 then decreased at
about 3% per annum between 2005 and 2008. After this
they increased again and according to SA Tourism, there
were 143 000 trips from China to South Africa in 2012
representing a compound annual growth rate of 44%
between 2008 and 2012. (In 2011, the South African
government simplified the visa norms for the Chinese
nationals who wanted to visit South Africa and this is
understood to have significantly boosted the number of
trips made by the Chinese to South Africa in 2012).
Presumably the legacy of awareness of South Africa after
the 2010 FIFA World Cup also played a role.
Figure 56, below, shows the actual numbers of Chinese
arrivals in South Africa between 2008 and 2012, and
forecast arrivals for 2013 to 2017.
Figure 56: Actual and forecast Chinese arrivals in South Africa, 2012
Source: SA Tourism China Presentation, 2015
Despite the ambitious forecasts, the number of Chinese
tourists visiting South Africa actually dropped in 2013 to
108 219. 2014 saw a further significant drop – this time of
25% - in the number of Chinese tourists visiting South
Africa to around 83 024. So in reality the performance of
South Africa in terms of Chinese tourists has been
nowhere near what was forecast. The reasons for this
significant decline are not yet known although the large
declines in 2014 seem to have been mainly experienced in
the last quarter of that year.
3.3 Satisfaction with travel, top experiences and
brand associations
According to the data captured in the Departure survey,
most Chinese travellers to South Africa are satisfied with
their trip to South Africa and a high proportion of these
travellers would like to visit again. They would be
motivated to visit again if more tourism services are
offered. The most attractive features of the travel to
South Africa are the hospitality, friendly people and
beautiful scenery.
In terms of perceptions of the destination, Chinese
tourists indicated that they would like to travel to South
Africa in a group and be accompanied by a Chinese tour
guide partly due to the language barrier. In the opinion of
Chinese travellers, South Africa is a destination that offers
natural attractions such as oceans, beaches and
mountains, exotic food and safari. Most of them
mentioned Cape of Good Hope as one of the destinations
that they would like to visit
Barriers to visiting South Africa include not much
information being available on the country; linked to this
is that the marketing of South Africa in China is still seen

SA Tourism Review: Report of the Expert Panel, June 2015
88
as relatively limited. Visa and connectivity issues are also
barriers, as is the perceptions of less offerings and
facilities than competitors, particularly luxury (4 to 5 star)
hotels. Limited Chinese tour guides are also a perceived
barrier.
3.4 Travel characteristics and patterns in South
Africa Credit Cards are the most used mode of payment by the
consumers. Gauteng, Western Cape and North West are
the major provinces visited by the Chinese travellers when
they visit South Africa. Chinese travellers typically visit
South Africa in the months of December, January and July.
The average trip of a Chinese consumer to South Africa is
3-5 days and around three-fourths of them visited South
Africa for the first time.
Travel agents are used by 80% of Chinese travellers to
South Africa; direct purchase with an airline accounts for a
further 15%.
Diverse culture and scenery are the most important
reasons to visit South Africa. A majority of Chinese
consumers enjoy shopping and the nightlife on their
leisure trip to South Africa.
Chinese consumers do worry about their safety and the
political scenario in South Africa. 2013 research into
reasons for not visiting South Africa indicated that
‘concerns for my personal safety’ was identified as a
reason by 50% of respondents. Even in the absence of any
bad experience, security is a slight concern for them.
Figure 57: Reasons for visiting/ not visiting SA in 2013
Source: SA Tourism China Presentation, 2015
Chinese consumers typically visit South Africa for a holiday
or a business trip. Of note here is that while most
outbound business trips for the Chinese are to attend in
business tourism events, most business trips to South
Africa
comprise of business travel (not part of a meeting,
conference, incentive of exhibition). This is shown in
Figure 58, which follows.

SA Tourism Review: Report of the Expert Panel, June 2015
89
Figure 58: Why Chinese tourists visit South Africa: purpose of visit
Source: SA Tourism China Presentation, 2015
Chinese tourists to South Africa like to travel either with a
tour group or alone. Colleagues or associates are also
popular travel partners.
4. Benchmarking other NTOs activities
in China International destinations such as the US, Australia and
South Korea have enrolled in many new tourism
programmes to attract wealthy Chinese travellers. These
countries have also eased their visa norms to lure Chinese
travellers. The tourism boards of other countries are
marketing themselves extensively by partnering with the
Chinese agencies and providing customised
services/packages to the travellers. Ways in which they
are going about this include:
More Marketing: Tourism boards such as those in
Australia and Turkey have invested heavily in marketing
their countries, including TV and video advertising. They
have also coordinated with Chinese travel agencies to
help increase their popularity, particularly at the time of
special occasions.
Partnership with the “Right” Agencies”: The US, Australia
and Germany choose qualified partner by conducting
“excellent expert tests”. The right agencies help them to
gain popularity by advertising their products.
Customised Products/Services: Majority of countries such
as Australia have designed packages catering to the
specific needs of the Chinese travellers. They receive
regular feedback from the travellers and agencies to make
improvements in their package.
Ease of Regulations: Japan, Australia, New Zealand, US
and EU have loosened their regulation on Chinese guides.
Also, countries such as Australia and Turkey have started
online Visa application to avoid inconvenience and ease
the process.
Souvenirs/Gifts: Majority of the countries provide
souvenirs/gifts to Chinese travellers to make them feel
that they are highly valued. For instance, Taiwan sends
local tea to Chinese customers, and European countries
provide luxury items such as shopping bags.
5. SA Tourism marketing strategy in
China SA Tourism’s most recently published data on the
segments they are targeting in China, from 2010, is shown
in Figure 59, below. The total size of the targeted market
is 12, 9 million Chinese. These potential tourists have a
high income, travel internationally, are between the ages
of 15 and 60, and reside in the Coastal cities of Beijing,
Shanghai, Guangzhou and Shenzhen.

90
Figure 59: Target market size and segments for SA Tourism, 2010
Source: SA Tourism Growth Strategy, 2010
This target market is then classified into SA Tourism’s four
focus segments of Organised Wanderlusters, Experienced
Wanderlusters, Upcoming Wanderlusters and Purpose
Travellers.
The list below specifies the main 2015 activities listed in
the Joint Marketing Agreement programme for the SA
Tourism China office as provided to the Expert panel.
These provide a sense of the detail of the actual current
marketing initiatives undertaken in China by SA Tourism:
1. With Beijing Global Tour International Travel
Service Co, ltd: Business to Business
advertisement; product introduction and
marketing events; online travel trade platform –
online advertisements; traditional travel service –
advertisements.
2. Shanghai Ctrip Commerce Co ltd: advertisement
campaign, Weibo posting, e-newsletter and
Wechat precise marketing.
3. Utour: Advertisements, travel month, broadcast,
tourism experience promotion (influencers to
travel to South Africa).
4. GZL International Travel service: newspaper
advertisements.
5. Beijing CAISSA International Travel Service Co.
ltd: radio broadcasts, newspaper coverage,
online marketing, brochures, roadshows, internet
and social media.

91
Annexure E: King III Summary and Excerpts
Key aspects of the Report The philosophy of the Report revolves around leadership, sustainability and corporate citizenship. To facilitate an understanding of the thought process, debate and changes in the Report, the following key aspects are highlighted: 1. Good governance is essentially about effective leadership. Leaders should rise to the challenges of modern governance. Such leadership is characterised by the ethical values of responsibility, accountability, fairness and transparency and based on moral duties that find expression in the concept of Ubuntu. Responsible leaders direct company strategies and operations with a view to achieving sustainable economic, social and environmental performance. 2. Sustainability is the primary moral and economic imperative of the 21st century. It is one of the most important sources of both opportunities and risks for businesses. Nature, society, and business are interconnected in complex ways that should be understood by decision-makers. Most importantly, current incremental changes towards sustainability are not sufficient – we need a fundamental shift in the way companies and directors act and organise themselves. 3. The concept of corporate citizenship which flows from the fact that the company is a person and should operate in a sustainable manner. Sustainability considerations are rooted in the South African Constitution which is the basic social contract that South Africans have entered into. The Constitution imposes responsibilities upon individuals and juristic persons for the realisation of the most fundamental rights. New issues in the report Information technology governance Information systems were used as enablers to business, but have now become pervasive in the sense that they are built into the strategy of the business. The pervasiveness of IT in business today mandates the governance of IT as a corporate imperative. In most companies, IT has become an integral part of the business and is fundamental to support, sustain and grow the business. Not only is IT an operational enabler for a company, it is an important strategic asset to create opportunities and to gain competitive advantage. Companies have made, and continue to make a significant
investment in IT. Virtually all components, aspects and processes of a company include some form of automation. This has resulted in companies relying enormously on IT systems. Further, the emergence and evolution of the internet, ecommerce, on-line trading and electronic communication have also enabled companies to conduct business electronically and perform transactions instantly. These developments bring about significant risks and should be well governed and controlled. To address this by legislation alone is not the answer. International guidelines have been developed through organisations such as ITGI and ISACA (COBIT and Val IT), the ISO authorities (e.g.: ISO 38500) and various other organisations such as OCEG. These may be used as a framework or audit for the adequacy of the company’s information governance for instance, but it is not possible to have ‘one size fits all’. However, companies should keep abreast of the rapidly expanding regulatory requirements pertaining to information. THE CODE Ethical Leadership and Corporate Citizenship Governance element: Responsible Leadership and Ethical Foundation Principles: 1.1 The board should provide effective leadership based on an ethical foundation. 1.2. The board should ensure that the company is and is seen to be a responsible corporate citizen. 1.3. The board should ensure that the company’s ethics are managed effectively. Boards and Directors Governance Element: Role and Function of the Board Principles 2.1. The board should act as the focal point for and custodian of corporate governance. 2.2. The board should appreciate that strategy, risk, performance and sustainability are inseparable. 2.3. The board should provide effective leadership based on an ethical foundation. 2.4. The board should ensure that the company is and is seen to be a responsible corporate citizen. 2.5. The board should ensure that the company’s ethics are managed effectively.

SA Tourism Review: Report of the Expert Panel, June 2015
92
2.6. The board should ensure that the company has an effective and independent audit committee. 2.7. The board should be responsible for the governance of risk. 2.8. The board should be responsible for information technology (IT) governance. 2.9. The board should ensure that the company complies with applicable laws and considers adherence to non-binding rules, codes and standards. 2.10. The board should ensure that there is an effective risk-based internal audit. 2.11. The board should appreciate that stakeholders’ perceptions affect the company’s reputation. 2.12. The board should ensure the integrity of the company’s integrated report. 2.13. The board should report on the effectiveness of the company’s system of internal controls. 2.14. The board and its directors should act in the best interests of the company. 2.15. The board should consider business rescue proceedings or other turnaround mechanisms as soon as the company is financially distressed as defined in the Act. 2.16. The board should elect a chairman of the board who is an independent non-executive director. The CEO of the company should not also fulfil the role of chairman of the board. 2.17. The board should appoint the chief executive officer and establish a framework for the delegation of authority. Governance Element: Composition of the Board 2.18. The board should comprise a balance of power, with a majority of non-executive directors. The majority of non-executive directors should be independent. Governance Element: Board Appointment Process 2.19 Directors should be appointed through a formal process. Governance Element: Director Development 2.20. The induction of and ongoing training and development of directors should be conducted through formal processes. Governance Element: Company Secretary 2.21 The board should be assisted by a competent, suitably qualified and experienced company secretary. Governance element: Performance Assessment 2.22 The evaluation of the board, its committees and the individual directors should be performed every year.
Governance element: Board Committees 2.23. The board should delegate certain functions to well-structured committees but without abdicating its own responsibilities. Governance element: Group Boards 2.24. A governance framework should be agreed between the group and its subsidiary boards. Governance Element: Remuneration of Directors and Senior Executives: 2.25. Companies should remunerate directors and executives fairly and responsibly. 2.26. Companies should disclose the remuneration of each individual director and certain senior executives. 2.27. Shareholders should approve the company’s remuneration policy. Audit Committees 3.1. The board should ensure that the company has an effective and independent audit committee. Governance Element: Membership and resources of the audit committee 3.2. Audit committee members should be suitably skilled and experienced independent non-executive directors. 3.3. The audit committee should be chaired by an independent non-executive director. Governance element: Responsibilities of the Audit Committee 3.4. The audit committee should oversee integrated reporting. 3.5. The audit committee should ensure that a combined assurance model is applied to provide a coordinated approach to all assurance activities. Governance element: Internal Assurance Providers: 3.6. The audit committee should satisfy itself of the expertise, resources and experience of the company’s finance function. 3.7. The audit committee should be responsible for overseeing of internal audit. 3.8. The audit committee should be an integral component of the risk management process. Governance element: External Assurance Providers 3.9. The audit committee is responsible for recommending the appointment of the external auditor and overseeing the external audit process.

SA Tourism Review: Report of the Expert Panel, June 2015
93
Governance element: Reporting 3.10. The audit committee should report to the board and shareholders on how it has discharged its duties. 4. The Governance of Risk Governance element: The Board’s responsibility for risk management 4.1. The board should be responsible for the governance of risk. 4.2. The board should determine the levels of risk tolerance. 4.3. The risk committee or audit committee should assist the board in carrying out its risk responsibilities. Governance element: Management’s responsibility for risk management 4.4. The board should delegate to management the responsibility to design, implement and monitor the risk management plan. Governance element: risk assessment 4.5. The board should ensure that risk assessments are performed on a continual basis. 4.6. The board should ensure that frameworks and methodologies are implemented to increase the probability of anticipating unpredictable risks. Governance element: risk response 4.7. The board should ensure that management considers and implements appropriate risk responses. Governance element: Risk monitoring 4.8. The board should ensure continual risk monitoring by management. Governance element: Risk assurance 4.9. The board should receive assurance regarding the effectiveness of the risk management process. 5. The Governance of information technology 5.1. The board should be responsible for information technology (IT) governance. 5.2. IT should be aligned with the performance and sustainability objectives of the company. 5.3. The board should delegate to management the responsibility for the implementation of an IT governance framework. 5.4. The board should monitor and evaluate significant IT investments and expenditure. 5.4.1. The board should oversee the value delivery of IT and monitor the return on investment from significant IT projects.
5.4.2. The board should ensure that intellectual property contained in information systems is protected. 5.4.3. The board should obtain independent assurance on the IT governance and controls supporting outsourced IT services. 5.5. IT should form an integral part of the company’s risk management. 5.6. The board should ensure that information assets are managed effectively. 5.7. A risk committee and audit committee should assist the board in carrying out its IT responsibilities. 6. Compliance with laws, rules, codes and standards 6.1. The board should ensure that the company complies with applicable laws and considers adherence to nonbinding rules, codes and standards. 6.2. The board and each individual director should have a working understanding of the effect of the applicable laws, rules, codes and standards on the company and its business. 6.2.1. The induction and ongoing training programmes of directors should incorporate an overview of and any changes to applicable laws, rules, codes and standards. 6.2.2. Directors should sufficiently familiarise themselves with the general content of applicable laws, rules, codes and standards to discharge their legal duties. 6.3. Compliance risk should form an integral part of the company’s risk management process. 6.4. The board should delegate to management the implementation of an effective compliance framework and processes. 7. Internal Audit Governance element: the need for and role of internal audit 7.1. The board should ensure that there is an effective risk based internal audit. Governance element: Internal Audit’s approach and plan 7.2. Internal audit should follow a risk based approach to its plan. 7.3. Internal audit should provide a written assessment of the effectiveness of the company’s system of internal controls and risk management. 7.4. The audit committee should be responsible for overseeing internal audit. Governance element: Internal Audit’s status in the company 7.5. Internal audit should be strategically positioned to achieve its objectives.

SA Tourism Review: Report of the Expert Panel, June 2015
94
8. Governing stakeholder relationships 8.1. The board should appreciate that stakeholders’ perceptions affect a company’s reputation. 8.2. The board should delegate to management to proactively deal with stakeholder relationships. 8.3. The board should strive to achieve the appropriate balance between its various stakeholder groupings, in the best interests of the company. 8.4. Companies should ensure the equitable treatment of shareholders. 8.5. Transparent and effective communication with stakeholders is essential for building and maintaining their trust and confidence.
Governance element: Dispute resolution 8.6. The board should ensure that disputes are resolved as effectively, efficiently and expeditiously as possible. 9. Integrated reporting and disclosure Governance element: transparency and accountability 9.1. The board should ensure the integrity of the company’s integrated report. 9.2. Sustainability reporting and disclosure should be integrated with the company’s financial reporting. 9.3. Sustainability reporting and disclosure should be independently assured.