review of the 2018 pre-election report on ontario's … · office of the auditor general of...
TRANSCRIPT
Office of the Auditor General of Ontario
April 2018
Review of the 2018 Pre-Election
Report on Ontario’s Finances

Office of the Auditor General of Ontario
To the Honourable Speaker of the Legislative Assembly
I am pleased to transmit my Review of the 2018 Pre-Election Report on Ontario’s Finances for submission to the Assembly in accordance with the provisions of subsection 10(3) and section 13 of the Fiscal Transparency and Accountability Act, 2004, and Ontario Regulation 41/18.
Bonnie Lysyk, MBA, FCPA, FCA, LPA Auditor General
April 25, 2018Toronto, Ontario
ISBN 978-1-4868-2073-3 (Print)
ISBN 978-1-4868-2074-0 (PDF)
Cover photograph credit: Office of the Auditor General of Ontario/Mariana Green
An electronic version of this report is available at www.auditor.on.ca
© 2018, Queen’s Printer for Ontario
Ce document est également disponible en français.

Table of Contents
1.0 Synopsis 5
2.0 The Independent Auditor General’s Statement 7
3.0 Background 10
4.0 Objective and Scope 10
5.0 Results 11
Appendix 26

Special Reportiv
5
Review of the 2018 Pre-Election Report on Ontario’s Finances
1.0 Synopsis
The government released its 2018 Pre-Election Report on Ontario’s Finances (Pre-Election Report) on March 28, 2018, as required by the Fiscal Transparency and Accountability Act, 2004 (Act) and Ontario Regulation 41/18. Under the Act, I am responsible for reviewing this report to determine whether it is reasonable and for providing a statement describing the results of my Office’s work. In this report I fulfill this responsibility.
The Act requires that the pre-election report provide information about Ontario’s finances for the fiscal year of the budget and the following two years. Accordingly, this year’s Pre-Election Report presents information on Ontario’s finances for the 2018/19, 2019/20 and 2020/21 fiscal years (as reported in the 2018 Ontario Budget). Neither the Pre-Election Report nor my examination provides information for the 2017/18 fiscal year. Key financial items the government must report on include economic forecasts and assumptions used to project revenues, expenses (including interest on debt), the reserves, the Province’s surpluses or deficits and the ratios of provincial debt to Ontario’s gross domestic product (GDP).
We concluded that the Pre-Election Report is not a reasonable presentation of Ontario’s finances insofar as its expense estimates are understated for two items (outlined in the bullets below), resulting in understated annual deficits. After adjusting for these items, the annual deficit would be $11.7 billion for 2018/19 (or 75% more than the reported $6.7 billion), $12.2 billion for 2019/20 (or 85% more than the reported $6.6 billion) and $12.5 billion for 2020/21 (or 92% more than the reported $6.5 billion).
When expenses are understated, the perception is created that government has more money available than it actually does. Government decision-makers might therefore budget more money to be spent on initiatives and programs, when that money is actually needed to pay for expenses the government has failed to record properly. Therefore, more money will need to be borrowed to pay for the unrecorded expenses even when government reports an annual surplus or a balanced budget. A perception is also created of an improving trend in the relationship between the government’s financial obligations and its capacity to raise funds to meet them, when the burden of net debt is actually increasing.
The two understated expense items are:
• The government did not properly record the true financial impact of the Fair Hydro Plan’s electricity rate reduction in the Pre-Election Report.1 Specifically, the funds that ratepayers are not required to pay must be borrowed in order to pay power generators. Neither the expenses to pay power gen-erators nor the interest on the funds borrowed to pay power generators have been included in the
1 Throughout this report, our reference to the Fair Hydro Plan excludes the HST rebate and other taxpayer-funded programs.
6
expense estimates in the Pre-Election Report. As a result, the combined other program and interest expenses are understated by $2.4 billion in 2018/19, $2.6 billion in 2019/20 and $2.8 billion in 2020/21.
• The government recorded pension revenue from the Ontario Teachers’ Pension Plan and insufficient pension expense from the Ontario Public Service Employees’ Union Pension Plan, both of which reduce the overall pension expense. It should not have done this because it does not have the uni-lateral legal right to reduce its future contributions to these plans or to withdraw any surplus from these plans without first reaching a formal agreement with the plans’ other joint sponsors. Since there is no evidence that minimum contributions will be reduced or any surplus withdrawn, the gov-ernment continues to forecast making contributions to these plans of about $2.0 billion in 2018/19, $2.0 billion in 2019/20 and $2.1 billion in 2020/21. The result of the incorrect recording of pension revenues and expenses is an understatement of other program expenses in the Pre-Election Report of $2.6 billion in 2018/19, $3.0 billion in 2019/20 and $3.2 billion in 2020/21.
A stated principle in the Act is that the government’s fiscal policy should be based on cautious assump-tions. Aside from the above two significant items, we found that the government based its estimates of revenues, program expenses and interest on debt on cautious assumptions, as required by the Act. The gov-ernment also showed prudence by including a reserve amount in its fiscal plan (although it is lower than in previous years), again as required by the Act. We further concluded that the assumptions used to prepare the Pre-Election Report are consistent with the plans of the government of Ontario (as reflected in the 2018 Ontario Budget). The Pre-Election Report has been prepared on a basis that is consistent with the Act and generally consistent with the guidance for future-oriented financial information from the Chartered Profes-sional Accountants of Canada. However, the Pre-Election Report does not contain a prescribed general-purpose future-oriented income statement (a Consolidated Statement of Estimated Revenues, Expenses and Reserve), as required by the guidance for future-oriented financial information issued by the Chartered Professional Accountants of Canada.
The reader should keep in mind that the actual financial results for 2018/19–2020/21 will undoubt-edly differ from the Pre-Election Report’s estimates, because (beside the understatement of expenses already described) future events are not certain and can have unpredictable impacts. We identified two areas where the risk of future uncertainty is high and could result in significant differences between esti-mated and actual spending:
• Actual compensation costs may differ significantly from estimates due to the undetermined results of future contract negotiations (see Section 5.3.4).
• The costs of increased spending on new programs as announced by the government may differ significantly from estimates because there is no program history to inform the estimates (see Section 5.3.4).
As well, we noted one risk relating to the forecasted income from Government Business Enterprises. In its December 31, 2017, annual report, Hydro One Limited disclosed a potential one-time decrease in net income as a result of a rate decision by the Ontario Energy Board (OEB) that is currently under review by the OEB. If Hydro One’s Motion to Review to the OEB is unsuccessful, the one-time decrease would be approximately $420 million to the forecasted revenues in the Pre-Election Report, potentially for 2018/19 (based on the estimated Provincial ownership percentage of Hydro One Limited).
Other risks that could result in differences between forecasted and actual results are discussed in Section 5.0.
Overall, in conclusion, our work indicated that the Pre-Election Report is not a reasonable and fair presentation of Ontario’s finances, as outlined above and further explained in this report.
7Review of the 2018 Pre-Election Report on Ontario’s Finances
2.0 The Independent Auditor General’s Statement
The Auditor General’s Statement on the 2018 Pre-Election Report on Ontario’s Finances
To the Legislative Assembly of the Province of Ontario:
I am required by subsection 10(3) of the Fiscal Transparency and Accountability Act, 2004 (Act) and Ontario Regulation 41/18 to promptly review and report on the reasonableness of the 2018 Pre-Election Report on Ontario’s Finances (Pre-Election Report) issued on March 28, 2018.
I have examined the support provided by the government for its assumptions, its estimates of revenues and expenses, details of the reserves and the ratios of provincial debt to Ontario’s gross domestic product (GDP) for the three fiscal years ending March 31, 2019; March 31, 2020; and March 31, 2021.
Responsibilities
The Ministry of Finance and Treasury Board Secretariat are responsible for preparing the information con-tained in the Pre-Election Report on behalf of the Government of Ontario in accordance with the require-ments of the Act and the applicable standards established by the Chartered Professional Accountants of Canada.
The Office of the Auditor General is an independent office of the Legislative Assembly as per the Auditor General Act. My responsibility is to issue a statement on the reasonableness of the Pre-Election Report. My examination was made in accordance with Canadian Standards on Assurance Engagements—Direct Engagements issued by the Auditing and Assurance Standards Board of the Chartered Professional Accountants of Canada.
I have no responsibility to update this report for events and circumstances occurring after the date of my report.
Statement on Reasonableness
In my opinion, the Pre-Election Report is not a reasonable presentation of Ontario’s finances because of the understatement of expenses resulting from the Fair Hydro Plan and from the understatement of pension expenses relating to the Ontario Teachers’ Pension Plan and the Ontario Public Sector Employees’ Union (OPSEU) Pension Plan for the years ending March 31, 2019; March 31, 2020; and March 31, 2021. The fore-casted annual deficits and ratios of provincial debt to Ontario’s GDP for the years ending March 31, 2019; March 31, 2020; and March 31, 2021, are therefore significantly understated.

8
Understatement of Annual Deficits in Ontario’s Medium-Term Fiscal Plan
If the government had correctly included the expenses resulting from the Fair Hydro Plan in its combined other program and interest expenses, the forecasted annual deficits reported in Ontario’s Medium-Term Fiscal Plan would be higher by $2.4 billion in 2018/19, $2.6 billion in 2019/20 and $2.8 billion in 2020/21.
If the government had correctly included the pension expenses relating to the Ontario Teachers’ Pension Plan and the OPSEU Pension Plan in its other program expenses, the forecasted other program expenses and annual deficits reported in Ontario’s Medium-Term Fiscal Plan would be higher by $2.6 billion in 2018/19, $3.0 billion in 2019/20 and $3.2 billion in 2020/21.
Combined, these two items result in understatements of the forecasted annual deficits reported in Table 1—Ontario’s Medium-Term Fiscal Plan of the Pre-Election Report of $5.0 billion in 2018/19, $5.6 billion in 2019/20 and $6.0 billion in 2020/21.
Understatement of Ratios of Provincial Debt to Ontario’s GDP
If the government had correctly included the expenses resulting from the Fair Hydro Plan and the expenses relating to the Ontario Teachers’ Pension Plan and the OPSEU Pension Plan in its calculation of the ratios of provincial debt to Ontario’s GDP, the ratios of Accumulated-Deficit-to-GDP would have increased to 25.6% for 2018/19, 25.9% for 2019/20 and 26.2% for 2020/21.
Reserve Amounts Lower Than in Previous Years
As per Section 10(2)(3) of the Act, the Pre-Election Report must include a reserve to provide for unexpected adverse changes in revenues and expenses, in whole or in part. Our examination found that the Pre-Election Report forecasts reserves of $0.7 billion for each of the three years of the Pre-Election Report’s forecasts, totalling $2.1 billion. While the annual reserve amount of $0.7 billion is slightly higher relative to the 2017/18 and 2018/19 reserves included in the 2017 Budget, the three-year total in the Pre-Election Report is significantly lower than the three-year reserves reported in budgets from previous years. For example, the total reserve over the three years of the fiscal plan totalled $3.4 billion in each of the 2013, 2014 and 2015 Budgets, and totalled $3.3 billion in the 2016 Budget. Although the government has not used the annual reserve in the past, if the intent of the reserves is to provide for unexpected adverse changes, such as the 2008 global recession, the Pre-Election Report’s lower reserve forecasts could reduce the flexibility of the government to respond. While the forecasted reserve has been significantly decreased, the Pre-Election Report’s contingency fund allocations included in Program Expenses are forecast to be significantly higher than in the past several years.
Other Comments on Examination Results
• The results of our examination (i.e., the Pre-Election Report’s performance against our objectives and criteria) are outlined in the Appendix to this report. Our objectives relate to the prescribed presentation and disclosure standards applicable to the Pre-Election Report; the reasonableness and supportability of the assumptions; and the consistency of the assumptions with the plans of the government of Ontario (as reflected in the 2018 Ontario Budget).

9Review of the 2018 Pre-Election Report on Ontario’s Finances
• The assumptions used to prepare the Pre-Election Report are consistent with the plans of the govern-ment (as reflected in the 2018 Ontario Budget). However, a key principle of the Act is that Ontario’s fiscal policy be based on cautious assumptions, and the assumptions underlying the expense estimates relating to the Fair Hydro Plan and the pension expenses are not cautious in nature. All other assumptions in the Pre-Election Report are suitably supported, and the estimated revenues and all other estimated expenses for the three fiscal years reflect the use of such assumptions. These assumptions provide a reasonable basis for estimating revenues and all other expenses, keeping in mind that the degree of uncertainty with respect to assumptions and future estimates increases the further in the future the estimates relate to.
• The Pre-Election Report has been prepared on a basis that is consistent with the Act and generally consistent with the guidance for future-oriented financial information from the Chartered Profes-sional Accountants of Canada. However, the Pre-Election Report does not contain a prescribed general-purpose future-oriented income statement, as required by the guidance for future-oriented financial information issued by the Chartered Professional Accountants of Canada.
Because the revenue, expense and annual deficit estimates are based on assumptions regarding future events, actual results will vary from the information presented, and the variations may be material. Accord-ingly, I express no opinion as to whether these estimates will be achieved.
Toronto, Ontario Bonnie Lysyk, MBA, FCPA, FCA, LPA April 25, 2018 Auditor General of Ontario

10
3.0 Background
The Fiscal Transparency and Accountability Act, 2004 (Act) established a number of legislative require-ments for both Ontario’s fiscal policies and its fiscal plan. The Act states that Ontario’s fiscal policy should be based on cautious assumptions. The Act also states that in such circumstances as may be prescribed by regulation, the Ministry of Finance (Ministry) shall release a pre-election report about Ontario’s finances and shall do so before the deadline established by the regulation, and that the pre-election report is to be reviewed by the Auditor General. The pre-election report is required to include the following:
• the macroeconomic forecasts and assumptions that were used to prepare the fiscal plan and a description of any significant differences from those forecasts and assumptions;
• an estimate of Ontario’s revenues and expenses, including estimates of the major components of the revenues and expenses as set out in the plan;
• details of the reserve required to provide for unexpected adverse changes in revenues and expenses; and
• information about the ratio of provincial debt to Ontario’s gross domestic product.The Act specifies that the circumstances governing the release of the pre-election report may be
prescribed by regulation. On February 23, 2018, the government filed Ontario Regulation 41/18, requir-ing that the report be released within seven days of the 2018 Budget motion, which was the day on which the Budget bill was introduced and read for the first time. The government introduced its Budget bill on March 28, 2018, and released the 2018 Pre-Election Report on Ontario’s Finances on the same day.
The Act specifies that the pre-election report should provide an update to the most recent fiscal plan, which in this case was presented in the 2018 Ontario Budget. Accordingly, the fiscal forecasts presented in the Pre-Election Report are the same as those included in the 2018 Ontario Budget.
Since our review of the 2011 Pre-Election Report, the Financial Accountability Office (FAO) was established by the Financial Accountability Officer Act, 2013. The role of the FAO is to provide independent analysis of Ontario’s finances—including the budget—trends in the economy and related matters important to the Legislative Assembly of Ontario, such as estimates of the financial impact of bills or other proposals over which the Legislature has jurisdiction. Our Office has reviewed the 2018 Pre-Election Report as required under the Fiscal Transparency and Accountability Act, and the FAO was preparing to issue its review of the 2018 Budget at the time we were completing this report.
4.0 Objective and Scope
The objective of our examination is set out in subsection 10(3) of the Act, which states, “The Auditor Gen-eral shall promptly review the pre-election report to determine whether it is reasonable, and shall release a statement describing the results of the review.”
Auditors usually examine information relating to financial transactions that have already occurred. In contrast, the pre-election report provides the government’s estimates of future fiscal results. We therefore conducted our work and reported on the results of our examination in accordance with the applicable Can-adian Standards on Assurance Engagements—Direct Engagements issued by the Auditing and Assurance

11Review of the 2018 Pre-Election Report on Ontario’s Finances
Standards Board of the Chartered Professional Accountants of Canada (CPA Canada). Our criteria for this examination were developed using standards for future-oriented financial information issued by CPA Canada (see the Appendix). In addition, we reviewed the guidance provided by the American Institute of Certified Public Accountants relating to the preparation and examination of financial forecasts and projections. This guidance calls for forecasts of future-oriented financial information to be based on reasonable, supportable and internally consistent assumptions that management believes reflect the most probable set of economic conditions and planned courses of action.
In conducting our work, we obtained a reasonable level of assurance, which consisted of inquiry, analysis and other procedures, including examination of the government’s supporting documentation for the estimates and for the key assumptions underlying them. We also reviewed the government’s Program Review, Renewal and Transformation planning and budget processes, assessed historical trend data, and met with Treasury Board Secretariat and Ministry of Finance officials, as well as officials from other minis-tries, regarding the government’s expenditure forecasts and related assumptions.
Because the government develops the estimates for its future taxation revenues using forecasting techniques based on underlying economic data—such as growth in the gross domestic product, inflation, consumer spending, and wage and salary levels—we engaged an independent expert in the area of econo-metric forecasting to assist us in our review of certain tax revenue estimates.
The Office of the Auditor General applies the Canadian Standards of Quality Control and, as a result, maintains a comprehensive quality control system that includes documented policies and procedures with respect to compliance with rules of professional conduct, professional standards and applicable legal and regulatory requirements.
5.0 Results
5.1 Ontario’s Medium-Term Fiscal PlanIn the 2007 and the 2011 pre-election reports, the government included the Consolidated Statement of Estimated Revenue, Expense and Reserve, which summarized revenue and expense items in detail. This statement is not included in the 2018 Pre-Election Report. The exclusion of this statement is not consistent with one of CPA Canada’s presentation and disclosure requirements for future-oriented financial informa-tion: CPA Canada requires general-purpose future-oriented financial information to be presented in the format of an entity’s financial statements and include at least an income statement (see the Appendix).
Instead, the 2018 Pre-Election Report contains a less detailed Medium-Term Fiscal Plan (Table 1, pre-senting the estimated revenues and expenses for 2018/19, 2019/20 and 2020/21). The reader must consult two other tables to see the details of the revenue and expense outlooks (Table 5 and Table 7).
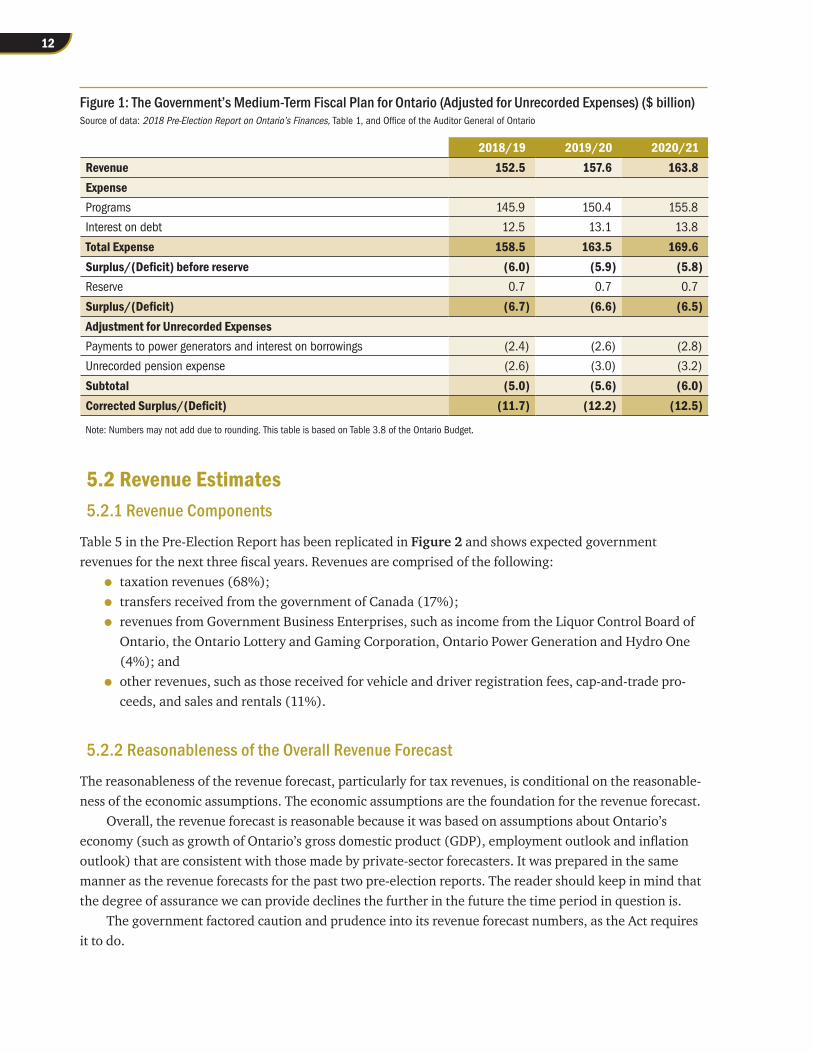
In Figure 1, we replicate Table 1 and adjust it for the payments to power generators and interest on borrowings, unrecorded pension expenses, and the impact of these adjustments on the annual deficits.
12
5.2 Revenue Estimates5.2.1 Revenue Components
Table 5 in the Pre-Election Report has been replicated in Figure 2 and shows expected government revenues for the next three fiscal years. Revenues are comprised of the following:
• taxation revenues (68%);
• transfers received from the government of Canada (17%);
• revenues from Government Business Enterprises, such as income from the Liquor Control Board of Ontario, the Ontario Lottery and Gaming Corporation, Ontario Power Generation and Hydro One (4%); and
• other revenues, such as those received for vehicle and driver registration fees, cap-and-trade pro-ceeds, and sales and rentals (11%).
5.2.2 Reasonableness of the Overall Revenue Forecast
The reasonableness of the revenue forecast, particularly for tax revenues, is conditional on the reasonable-ness of the economic assumptions. The economic assumptions are the foundation for the revenue forecast.
Overall, the revenue forecast is reasonable because it was based on assumptions about Ontario’s economy (such as growth of Ontario’s gross domestic product (GDP), employment outlook and inflation outlook) that are consistent with those made by private-sector forecasters. It was prepared in the same manner as the revenue forecasts for the past two pre-election reports. The reader should keep in mind that the degree of assurance we can provide declines the further in the future the time period in question is.
The government factored caution and prudence into its revenue forecast numbers, as the Act requires it to do.
Figure 1: The Government’s Medium-Term Fiscal Plan for Ontario (Adjusted for Unrecorded Expenses) ($ billion)Source of data: 2018 Pre-Election Report on Ontario’s Finances, Table 1, and Office of the Auditor General of Ontario
2018/19 2019/20 2020/21Revenue 152.5 157.6 163.8ExpensePrograms 145.9 150.4 155.8
Interest on debt 12.5 13.1 13.8
Total Expense 158.5 163.5 169.6Surplus/(Deficit) before reserve (6.0) (5.9) (5.8)Reserve 0.7 0.7 0.7
Surplus/(Deficit) (6.7) (6.6) (6.5)Adjustment for Unrecorded ExpensesPayments to power generators and interest on borrowings (2.4) (2.6) (2.8)
Unrecorded pension expense (2.6) (3.0) (3.2)
Subtotal (5.0) (5.6) (6.0)Corrected Surplus/(Deficit) (11.7) (12.2) (12.5)
Note: Numbers may not add due to rounding. This table is based on Table 3.8 of the Ontario Budget.

13Review of the 2018 Pre-Election Report on Ontario’s Finances
Our independent expert in econometric forecasting helped us review the government’s assumptions and estimates for several of the more significant tax revenues, and advised us that the government’s eco-nomic outlook is reasonable when compared to private-sector forecasters’ views on Ontario’s economy. Specifically, he noted that for all years and all economic indicators, the government’s forecast is very near the private-sector’s average outlook. For instance, Figure 3 shows that the government forecast real GDP growth percentages that are slightly below the average percentage increases forecast by 13 private-sector economists as obtained from a March 2018 survey of forecasters by the Ministry of Finance.
The government’s forecast did not fall within the ranges of private-sector forecasters for only two economic indicators, Home Resales and Home Resale Prices. However, there are very few private-sector forecasts available for these indicators. The Ministry of Finance provided background information as to why the estimates for these indicators deviated from the private-sector forecasts, and its evidence (i.e., more up-to-date information on the housing market, backed by a sophisticated housing forecasting model) was reasonable.
Several private-sector organizations also concluded that the government’s economic assumptions were reasonable. For instance, the Conference Board of Canada stated: “The Ministry of Finance economic growth assumptions appear reasonable, with real GDP growth forecast to ease to an average of around 2 per cent between 2018 and 2020, compared with an average of 2.7 per cent in the last four years.”
Figure 2: The Government’s Revenue Estimates for 2018/19–2020/21 ($ billion)Source of data: 2018 Pre-Election Report on Ontario’s Finances, Table 5
2018/19 2019/20 2020/21RevenuePersonal income tax 35.6 37.7 39.7
Sales tax 26.8 27.9 28.9
Corporations tax 15.1 15.6 16.0
Ontario Health Premium 3.9 4.1 4.3
Education property tax 6.1 6.1 6.2
All other taxes 16.0 16.7 17.3
Total Taxation Revenue 103.6 108.1 112.4Government of Canada 26.0 25.7 26.8
Income from Government Business Enterprises 5.3 6.0 6.6
Other non-tax revenue 17.6 17.7 18.0
Total Revenue 152.5 157.6 163.8
Note: Numbers may not add due to rounding. This table is based on Table 3.12 of the Ontario Budget.
Figure 3: The Government’s Projections for Real GDP Growth (%)Sources of data: Ministry of Finance Survey of Forecasters (March 1, 2018), 2018 Ontario Budget, Table 3.6
2018 2019 2020 2021Average Projection from Private-Sector Forecasters’ Survey 2.3 1.9 2.0 1.8
Government’s Projection 2.2 1.8 1.9 1.7

14
5.2.3 Revenue Estimates by Component
Personal Income Tax, Corporations Tax, Sales Tax and the Ontario Health Premium Our examination of taxation revenues included the Province’s estimates of personal income tax, corpora-tions tax, sales tax, and the Ontario Health Premium. We concluded that these estimates are reasonable. These four sources of taxation revenue account for $81.4 billion of estimated provincial revenue in 2018/19, or 78.7% of total expected taxation revenues for that fiscal year, 78.9% for 2019/20 and 79.1% for 2020/21.
However, personal income tax revenues may not be as high as forecast for 2018/19. The forecast factors in the significant increase to the minimum wage in 2018, but because this increase affects lower-income individuals, the associated taxation revenue projections may be somewhat high. A rough estimate of the potential overstatement of personal income tax revenue is $100 million to $350 million for 2018/19. This is in the range of reasonability given that total provincial revenues in 2018/19 are estimated to be $152.5 billion.
Our conclusion on the reasonability of these tax revenue estimates was based on our assessment of the reasonableness of the underlying economic assumptions, our evaluation of the appropriateness of the revenue models used to forecast revenues, and the overall reasonableness of the forecasts for the growth of the specific revenue sources considered in relation to their economic drivers.
Other Taxation RevenuesOther primary sources of taxation revenues are employer health tax, education property tax, gasoline tax, land transfer tax and tobacco tax. These sources of taxation revenues account for 21.3% of the total esti-mated provincial taxation revenues for 2018/19, 21.1% for 2019/20 and 20.9% for 2020/21. The estimates for these revenues were largely arrived at using tax-forecasting models. We reviewed the reasonableness of the assumptions used, the support for these assumptions, and the methodologies for applying the forecast-ing models to arrive at the tax-revenue estimates. We noted that the methodologies used were consistent in each of the years covered in the Pre-Election Report. As well, we considered the reasonableness of the Ministry’s explanations for the changes in expected taxation revenues from year to year. We concluded that all were reasonable.
Other RevenuesTransfers from the government of Canada include Canada Health Transfers, Canada Social Transfers, and Equalization payments. These three sources of federal revenue account for $21.4 billion in estimated provincial revenue in 2018/19, or 82.2% of the total estimated federal revenue for that fiscal year, 83.1% for 2019/20 and 82.5% for 2020/21. Our assessment of these estimated revenues primarily consisted of ensuring that the formulas and assumptions used for estimating Ontario’s share of these federal transfers were reasonable and applied correctly, which they were.
Government Business Enterprises provided the Ministry with their net income estimates over the next three fiscal years. We compared these estimates with historical trends and conducted additional work to investigate any significant variances from one year to the next. We also reviewed the available business plans of the Government Business Enterprises to ensure that their internal forecasts were consistent with the amounts forecast in the Pre-Election Report. The variances and internal projections were consistent with the amounts forecast. We noted one risk relating to the forecasted income from Government Business

15Review of the 2018 Pre-Election Report on Ontario’s Finances
Enterprises. In its December 31, 2017, annual report, Hydro One Limited disclosed a potential one-time decrease in net income as a result of a rate decision by the Ontario Energy Board (OEB) that is currently under review by the OEB. If Hydro One’s Motion to Review to the OEB is unsuccessful, the one-time decrease would be approximately $420 million to the forecasted revenues in the Pre-Election Report, pot-entially for 2018/19 (based on the estimated Provincial ownership percentage of Hydro One Limited).
For the larger non-tax revenue streams—such as vehicle driver and registration fees, cap-and-trade proceeds, and sales and rentals—we also reviewed the supporting documentation for the estimates and analyzed changes in revenue amounts from one year to the next. The estimates were supported, and no concerns arose from our analysis of changes in revenue amounts.
5.2.4 Risks Relating to Revenue Forecasts
Although the government’s economic forecast and related revenue estimates in the Pre-Election Report can be considered reasonable, economic and revenue forecasting is still far from an exact science. The under-lying economic forecasts are subject to many risks. The economic experts contracted by the government to review its Budget economic forecast echoed this viewpoint, noting considerable uncertainty surrounding U.S. economic policy and its potential to influence the economies of Canada and rest of the world. Also, the impact of the increase in minimum wage in Ontario on Consumer Price Index inflation and employment could adversely affect the economic forecast in the near term.
The uncertainty of U.S. economic policy could be a significant downside risk for the Ontario economy. The leading concern is current U.S. policy on international trade and uncertainty over the future of the North American Free Trade Agreement (NAFTA). This is almost certainly causing at least a temporary chilling effect on private-sector investment in the province. In an environment where it is unclear if there will be a new NAFTA, and if so, what it will look like, it is sensible for corporations to wait and see what landscape emerges.
A trade war between the U.S. and China could make matters much worse on the international trade front, with Canada and Ontario being caught in the middle. Mitigating this is the lack of certainty that the U.S. will follow through on threats. The possibility of an international trade war could lead to weak private-sector investment in Ontario.
On the other hand, the U.S.’s recent tax reform agreement could result in economic growth in Ontario. Personal and corporate tax cuts should increase aggregate demand in the U.S., which should be a positive for Ontario exports and Ontario output.
Finally, the Ontario economy faces domestic risks that could undermine economic performance, even in the absence of adverse international developments. A sharp decline in housing prices, coupled with the high level of household debt, could lead to a slowdown in consumer spending, which would undermine economic growth prospects. On the other hand, it is possible that there may be upside risks associated with a stronger-than-expected global outlook.
Overall, we concluded that the Pre-Election Report provides a reasonable and somewhat cautious underpinning for the medium-term revenue forecasts.

16
5.3 Expense Estimates5.3.1 Expense Components
As stated in Section 1.0 Synopsis, the government’s decision not to record the expenses associated with payments due to power generators and interest on debt, as well as certain pension expenses, affects all three years of the government’s expense forecasting. We comment on this in detail in Section 5.3.2.
The following is a list of the major components of government expenses. The percentages, which relate to 2018/19, have been adjusted to include expenses associated with payments to power generators and interest on debt associated with borrowings for the Fair Hydro Plan, as well as correct pension expenses:
• transfer payments, including transfers to the broader public sector (81%);
• ministry salary-related, benefit and pension costs (7%);
• interest on debt (8%); and
• other expenses (4%).Figure 4 replicates Table 7 of the Pre-Election Report and adjusts it for the unrecorded payments to
power generators and interest on borrowings, pension expenses, and the impact of these adjustments on the annual deficit.
5.3.2 Reasonableness of the Overall Expense Forecast
We concluded that program and interest expenses are understated by $5.0 billion in 2018/19, $5.6 billion in 2019/20 and $6.0 billion in 2020/21. On the basis of this significant understatement of expenses, we conclude that the overall expense forecasts are not reasonable.
Figure 4: The Government’s Expense Estimates for 2018/19–2020/21 (Adjusted for Unrecorded Expenses) ($ billion)Source of data: 2018 Pre-Election Report on Ontario’s Finances, Table 7 and Office of the Auditor General of Ontario
2018/19 2019/20 2020/21ProgramsHealth sector 61.3 64.2 66.6
Education sector* 29.1 30.1 31.5
Postsecondary and training sector 11.8 12.0 12.0
Children’s and social services sector 17.9 18.7 19.8
Justice sector 5.0 5.0 5.0
Other programs 20.8 20.4 20.8
Total Programs 145.9 150.4 155.8Interest on debt 12.5 13.1 13.8
Total Expense 158.5 163.5 169.6Adjustment for Unrecorded ExpensesPayments to power generators and interest on borrowings 2.4 2.6 2.8
Unrecorded pension expense 2.6 3.0 3.2
Subtotal 5.0 5.6 6.0Corrected Total Expense 163.5 169.1 175.6
Note: Numbers may not add due to rounding. This table is based on Table 3.17 of the Ontario Budget.
* Excludes Teachers’ Pension Plan, which is included in Other programs.

17Review of the 2018 Pre-Election Report on Ontario’s Finances
Understating expenses can contribute to the perception that government has more money available than it actually does. Government decision-makers might therefore allocate money to initiatives and pro-grams that is actually needed to pay for expenses the government has failed to record properly.
The understatement results from the government not fully recording expenses relating to:
• payments to power generators with funds the government has borrowed for the Fair Hydro Plan; and
• the Ontario Teachers’ Pension Plan and the Ontario Public Service Employees’ Union Pension Plan.
Fair Hydro PlanIn the Pre-Election Report, the government has adopted rate-regulated accounting to forecast the fiscal impact of the transactions legislated in the Ontario Fair Hydro Plan Act, 2017 (Fair Hydro Plan). As a result, the government is not forecasting an increase in expenses relating to its policy decision to reduce electricity rates. Since the costs involved in reducing consumers’ electricity rates and the transactions for recovering these costs in the future were established by legislation and not through a regulatory process, they do not meet the eligibility criteria for adopting rate-regulated accounting.
If the cost of the rate reduction outlined in the Fair Hydro Plan had been correctly forecast as an expense rather than a rate-regulated asset, the combined other program and interest expenses and the forecasted deficits would increase by $2.4 billion in 2018/19, $2.6 billion in 2019/20, and $2.8 billion in 2020/21.
The Office of the Auditor General’s position has been discussed previously in the 2017 special report titled The Fair Hydro Plan: Concerns About Fiscal Transparency, Accountability and Value For Money and in Chapter 2 of our 2017 Annual Report. Also, on March 21, 2018, we presented the Status Report on the Special Audit of the Financial Statements of IESO, dated March 20, 2018, to the Standing Committee on Public Accounts. We provided the Committee with an update to this status report on March 28, 2018. Both special reports, the update and our annual reports can be found on our website at www.auditor.on.ca.
PensionsThe government is forecasting revenues from the Ontario Teachers’ Pension Plan and is forecasting insuffi-cient expenses for the Ontario Public Service Employees’ Union Pension Plan, thereby understating the government’s overall pension expenses and growing the net pension asset. The growing asset does not constitute a true asset in that the government does not have the unilateral legal right to withdraw funds from the plans or reduce future minimum contributions to the plans without the express agreement of the plans’ joint sponsors.
If overall pension expenses from the pension plans were correctly presented, the other programs expenses and forecasted deficits would increase by $2.6 billion in 2018/19, $3.0 billion in 2019/20, and $3.2 billion in 2020/21.
The government is forecasting that it will receive $3.4 billion in revenues from the Ontario Teachers’ Pension Plan over the three-year period ending March 31, 2021. However, what is labelled as revenues are actually calculated amounts that are not accessible and not collectible in cash. In fact, pension contribu-tions are still required to be made by the Province to the Ontario Teachers’ Pension Plan to match the con-tributions made by teachers. These payments are forecast to be $5.3 billion in cash outflows over the same three-year period.

18
This widening gap between the government’s calculated pension revenue and the Province’s pension contributions to the Ontario Teachers’ Pension Plan—totalling $8.7 billion over three years ($3.4 billion plus $5.3 billion as in the previous paragraph)—distorts the forecasted resources available for government decision-makers to allocate in their fiscal planning. At worst, this could help enable a “structural deficit,” where program expenditures are exceeding revenues on an ongoing basis, requiring governments to con-tinuously borrow in order to deliver basic programs.
The Office of the Auditor General’s qualification over this accounting treatment has been discussed previously in Chapter 2 in both our 2016 Annual Report and 2017 Annual Report, which can be found on our website at www.auditor.on.ca.
Additional Comment on the Government’s Overall Expense ForecastWhile we concluded that certain of the key assumptions underlying the government’s expense forecasts were reasonable (see Section 5.3.3), the overall expense forecast is not reasonable for the reasons noted above. The underlying assumptions that led to not forecasting expenses associated with the Fair Hydro Plan and that led to forecasting pension revenue are incorrect. In both cases, the government is understating expenses and increasing borrowings to cover current costs, but the impact of this does not show up in net debt (net debt provides a measure of the amount of future revenues needed to pay for past government transactions and events).
5.3.3 Expense Estimates by Component
Program ExpensesProgram expenses, funded by transfer payments to specific sectors, are by far the largest component of total expenses at 77%. Therefore, this was a key area in our examination of expense estimates. The government has two main types of transfer-payment programs:
• Entitlement transfer-payment programs—programs in which the transfer-payment recipient has a legal entitlement to funds if certain eligibility or other conditions are met. Examples include social assistance (Ontario Disability Support Program and Ontario Works) and the Ontario Health Insur-ance Plan (OHIP) program. The challenge in estimating future expenses associated with entitlement programs is determining how many recipients will have a legal entitlement to the benefits in any future year. In the case of OHIP, for instance, the cost to the government depends on the number of people who access medical services in any given year. In essence, the expenses relating to entitle-ment programs are somewhat open-ended.
• Discretionary transfer-payment programs—programs in which the government has some latitude in determining the ultimate amount to be spent both up front and during the fiscal year. While the esti-mates of such expenses are typically constrained by the amounts provided in prior years, estimated future amounts can also be adjusted to reflect government policy priorities. In some cases discretion-ary programs may have some attributes of an entitlement transfer payment program.
Our review of transfer-payment expense estimates paid significant attention to the larger programs and those for which significant fluctuation from historical trends were noted. This focus was particularly important given that the Pre-Election Report notes a number of new initiatives for the larger program areas (for example, health and social assistance) requiring sharp increases in spending over previous years. The new initiatives are a mix of entitlement and discretionary transfer-payment programs. For entitlement

19Review of the 2018 Pre-Election Report on Ontario’s Finances
programs, there is a higher risk of actual costs differing significantly from estimates if the government’s assumptions regarding the number of eligible people entitled to the benefits are off target (see Section 5.3.4 for details).
We reviewed the assumptions underlying the transfer-payment programs’ expense estimates, con-sidered entitlement criteria where applicable, assessed the forecasting models used and analyzed program trends. We concluded that the transfer-payment program expenses forecast over the next three years were reasonable.
We performed similar work for broader-public-sector organizations (for example, hospitals, school boards and colleges) and government organizations (for example, Metrolinx and Cancer Care Ontario). These entities’ expenses (and revenues) are part of the Province’s expense (and revenue) estimates. We performed trend analysis on the major revenue and expense categories reported from each sector. We also reviewed the underlying assumptions for growth or decline in each major revenue and expense category for reasonableness, and the documentation supporting the assumptions, such as approved business plans. In addition, we reconciled recorded provincial grant expenses to these entities to the provincial grant revenues the entities recorded. We concluded that the assumptions were reasonable. As well, the expenses granted reconciled with the revenues recorded. However, there is a forecasted understatement of expenses relating to the Independent Electricity System Operator resulting from the legislated accounting of the Fair Hydro Plan. This is part of the understatement of expenses discussed in Section 5.3.2.
Interest Expense on DebtTo assess the reasonableness of the estimated expenses for interest on debt, we assessed the forecasting methodology used and the supporting documentation, and held discussions with senior management. We concluded that the assumptions underlying the government’s interest expense forecasts over the next three years are reasonable, with the exception of understated interest expenses relating to the Fair Hydro Plan. This is part of the understatement of interest expenses discussed in Section 5.3.2.
5.3.4 Risks Relating to Expense Forecasts
We note two areas of risk relating to the government’s expense forecasts:
• Actual compensation costs may differ significantly from estimates due to the undetermined results of future contract negotiations.
• The costs of new spending initiatives may differ significantly from estimates because there is no program history to inform the estimates.
Compensation Costs/Salary IncreasesCompensation costs account for approximately 35% of the government’s program spending (this calcula-tion for compensation costs does not account for the compensation expenses of non-consolidated transfer-payment recipients). One factor that could result in actual compensation costs differing from estimates is that a number of collective agreements across the public sector are currently up for renegotiation or will be up for renegotiation over the next three years: for example, contracts for correctional staff and Ontario Provincial Police employed by the Ministry of Community Safety and Correctional Services, nurses employed at hospitals, teachers employed by school boards and physicians providing services to the general public under the Ontario Health Insurance Program.
20
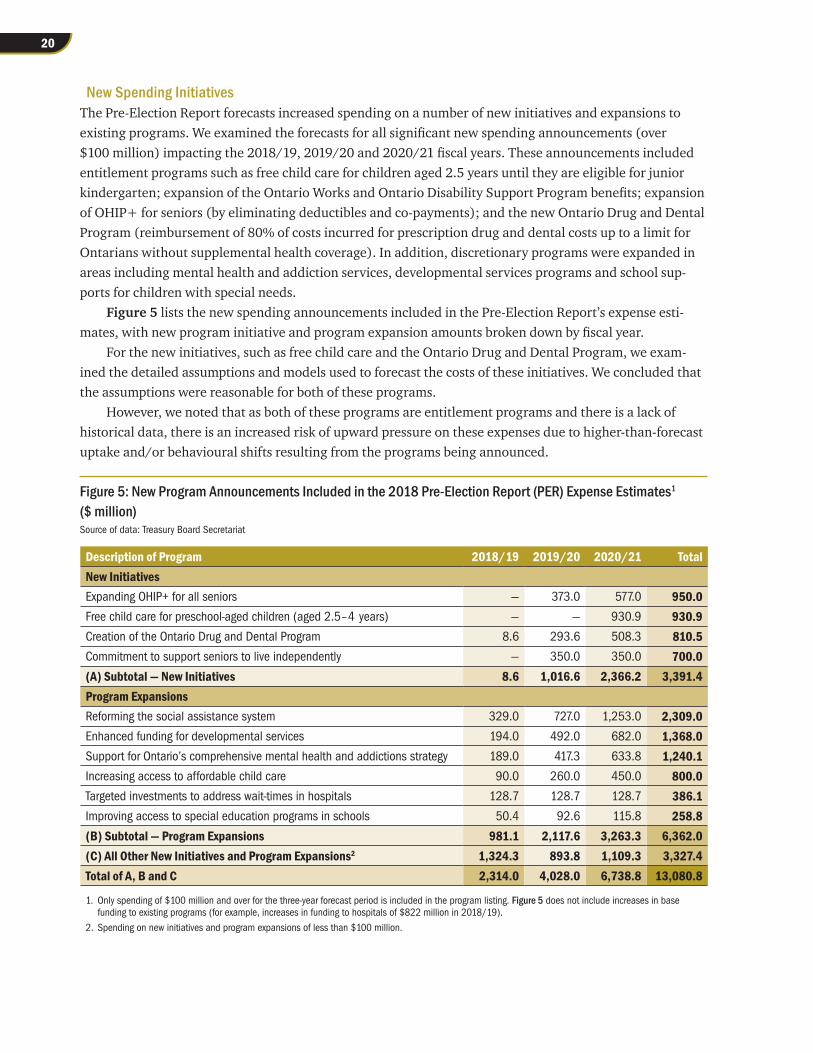
New Spending InitiativesThe Pre-Election Report forecasts increased spending on a number of new initiatives and expansions to existing programs. We examined the forecasts for all significant new spending announcements (over $100 million) impacting the 2018/19, 2019/20 and 2020/21 fiscal years. These announcements included entitlement programs such as free child care for children aged 2.5 years until they are eligible for junior kindergarten; expansion of the Ontario Works and Ontario Disability Support Program benefits; expansion of OHIP+ for seniors (by eliminating deductibles and co-payments); and the new Ontario Drug and Dental Program (reimbursement of 80% of costs incurred for prescription drug and dental costs up to a limit for Ontarians without supplemental health coverage). In addition, discretionary programs were expanded in areas including mental health and addiction services, developmental services programs and school sup-ports for children with special needs.
Figure 5 lists the new spending announcements included in the Pre-Election Report’s expense esti-mates, with new program initiative and program expansion amounts broken down by fiscal year.
For the new initiatives, such as free child care and the Ontario Drug and Dental Program, we exam-ined the detailed assumptions and models used to forecast the costs of these initiatives. We concluded that the assumptions were reasonable for both of these programs.
However, we noted that as both of these programs are entitlement programs and there is a lack of historical data, there is an increased risk of upward pressure on these expenses due to higher-than-forecast uptake and/or behavioural shifts resulting from the programs being announced.
Figure 5: New Program Announcements Included in the 2018 Pre-Election Report (PER) Expense Estimates1 ($ million)Source of data: Treasury Board Secretariat
Description of Program 2018/19 2019/20 2020/21 TotalNew InitiativesExpanding OHIP+ for all seniors — 373.0 577.0 950.0Free child care for preschool-aged children (aged 2.5–4 years) — — 930.9 930.9Creation of the Ontario Drug and Dental Program 8.6 293.6 508.3 810.5Commitment to support seniors to live independently — 350.0 350.0 700.0(A) Subtotal — New Initiatives 8.6 1,016.6 2,366.2 3,391.4Program ExpansionsReforming the social assistance system 329.0 727.0 1,253.0 2,309.0Enhanced funding for developmental services 194.0 492.0 682.0 1,368.0Support for Ontario’s comprehensive mental health and addictions strategy 189.0 417.3 633.8 1,240.1Increasing access to affordable child care 90.0 260.0 450.0 800.0Targeted investments to address wait-times in hospitals 128.7 128.7 128.7 386.1Improving access to special education programs in schools 50.4 92.6 115.8 258.8(B) Subtotal — Program Expansions 981.1 2,117.6 3,263.3 6,362.0(C) All Other New Initiatives and Program Expansions2 1,324.3 893.8 1,109.3 3,327.4Total of A, B and C 2,314.0 4,028.0 6,738.8 13,080.8
1. Only spending of $100 million and over for the three-year forecast period is included in the program listing. Figure 5 does not include increases in base funding to existing programs (for example, increases in funding to hospitals of $822 million in 2018/19).
2. Spending on new initiatives and program expansions of less than $100 million.

21Review of the 2018 Pre-Election Report on Ontario’s Finances
For the expansion of existing programs, we examined the assumptions and models used to forecast these costs. We concluded that the assumptions were reasonable with respect to these programs as well.
We noted that there is an uptake risk associated with the entitlement programs being expanded; however, the risk is lower due to the larger volume of historical data available for the forecasts. For discre-tionary programs, there is little risk of upward pressures to the forecasted expenses as the government has discretion to limit the amount of spending to the announced level.
5.4 Contingency FundThe government has included a contingency fund in each year of its estimates to cushion ministries from the impact of the fiscal plan’s assumptions not being borne out. In this way, the government’s fiscal plan complies with the Act’s requirement that it incorporate prudence and flexibility into its fiscal planning.
Typically, when ministries face unavoidable pressures and cannot manage with existing funds, they request funds from the contingency fund, which is controlled centrally at Treasury Board Secretariat. Treasury Board Secretariat assesses requests in the context of the government’s fiscal plan and overall priorities and recommends to the government whether or not to provide funds. Contingency funds have traditionally been used to address unanticipated expenses and to fund ministry programs and initiatives not included in the Budget because information or policy approval was still lacking when the Budget was prepared.
The total contingency fund allocation of $7.9 billion for the three years in the Pre-Election Report ($1.6 billion in 2018/19) is larger than the three-year total amounts set aside in previous budgets. This amount is compared to the three-year contingency fund allocations in previous budgets as follows:
• $1.6 billion in the 2014 Budget;
• $2.3 billion in the 2015 Budget;
• $6.4 billion in the 2016 Budget;
• $3.1 billion in the 2017 Budget; and
• $7.9 billion in the 2018 Pre-Election Report. In the last 10 years, the contingency fund amount in any given year has varied widely, from a low of
$0.5 billion in 2012 to highs of $3.4 billion and $2.0 billion in 2009 and 2010, respectively. Contingency fund levels are reset annually through the multi-year planning process, using available
financial information to help determine which risks have the highest likelihood of being realized. Any contingency fund balance not allocated by year-end is used to reduce expense and improve the Province’s financial results.
Most of the contingency funds have not been earmarked for specific purposes. Nevertheless, Treasury Board Secretariat is closely monitoring certain areas of risk, such as land claims and collective bargaining settlements.
Treasury Board Secretariat also advised us that the contingency funds are not intended to be used as a source to offset increasing expenses. Ministries are directed to monitor and manage expense risks through-out the year. As part of normal risk management, ministries include in quarterly reports their current and future financial risks, and Treasury Board reviews them and discusses financial risk management strategies being implemented with ministries.
22
5.5 The ReserveThe government’s fiscal plan includes a reserve of $0.7 billion in each of 2018/19, 2019/20 and 2020/21.
The Act requires that the government’s fiscal plan incorporate prudence in the form of a reserve to protect it against unexpected changes in the Province’s revenue and expenses.
In contrast to contingency funds, which are meant to offset the consequences of the fiscal plan’s assumptions not being borne out, the purpose of the reserve is to offset the impact of unexpected and adverse future events of the magnitude of, for example, a global recession (such as the one in 2008).
Generally, higher reserve amounts are reported in the latter years of a fiscal plan in order to better reflect the greater uncertainty of estimating revenue and expense further into the future. If a portion of the reserve is not required by fiscal year-end, it will contribute to an improvement in the Province’s annual surplus or deficit position.
Given that the reserve has been established to respond to unexpected future events, it is not possible to conclude on the appropriateness of the amount. Historically, the government has rarely had to use the budget reserve (in the last 10 years, the government has used it only twice, in 2008/09 and 2009/10, due to the global financial crisis). We therefore note only, for purposes of our examination of the Pre-Election Report, that the government has complied with the Act by including a reserve in its fiscal plan.
The total reserve of $2.1 billion reported over the three years in the 2018 Pre-Election Report matches the $2.1 billion total reserve included in the 2017 Budget. However, this amount is significantly lower than the reserve reported in budgets from previous years. For example, the annual reserve over the three years of the fiscal plan totalled $3.4 billion in each of the 2013, 2014 and 2015 Budgets, and totalled $3.3 billion in the 2016 Budget.
Most, if not all, economists would argue that the annual reserve should actually increase over time. The main reason for this is that there is more uncertainty and risk to the outlook in later years (years fur-ther in the future). A secondary reason is that, over the shorter term, the economy (revenues and expendi-tures) is projected to grow, so the annual reserve should grow too. Past federal budgets and some Ontario budgets followed this practice of increasing the annual reserve through future years.
The lower reserve in the Pre-Election Report means the government will have less of a cushion to help ensure it meets its fiscal targets even if unforeseen economic changes make it a challenge to do so. The lower reserve also allows the government to report a lower annual deficit in the Pre-Election Report.
5.6 Ratio of Provincial Debt to GDP5.6.1 Provincial Debt
There are three possible measures of debt:
• Total debt is the total amount of borrowed money the government owes to external parties. It con-sists of bonds issued in public capital markets, non-public debt, T-bills and U.S. commercial paper. Total debt provides the broadest measure of a government’s debt load.
• Net debt is the difference between the government’s total liabilities and its financial assets. Liabil-ities consist of all amounts the government owes to external parties, including total debt, accounts payable, pension and retirement obligations, and transfer-payment obligations. Financial assets are those that theoretically can be used to pay off liabilities or finance future operations, and include cash, accounts receivable, temporary investments and investments in government business
23Review of the 2018 Pre-Election Report on Ontario’s Finances
enterprises. Net debt provides a measure of the amount of future revenues required to pay for past government transactions and events.
• Accumulated deficit represents the sum of all past annual deficits and surpluses of the government. It can also be derived by deducting the value of the government’s non-financial assets, such as its tangible capital assets, from its net debt.
While the government has reported its provincial-debt-to-GDP ratio using accumulated deficit, as required by the Act, our report also presents forecasted annual net debt to GDP, as this is a more common measure of a government’s debt burden.
After properly accounting for the expected costs of the Fair Hydro Plan, accumulated deficit and net debt is forecast to increase by $4.0 billion in 2018/19, $6.6 billion in 2019/20 and $9.4 billion for 2020/21. After properly accounting for the net pension assets of the Ontario Teachers’ Pension Plan and the OPSEU Pension Plan, accumulated deficit and net debt will increase by $17.3 billion for 2018/19, $20.3 billion for 2019/20 and $23.6 billion for 2020/21. Combined, these two items increase accumulated deficit and net debt by $21.3 billion for 2018/19, $26.9 billion for 2019/20 and $33.0 billion for 2020/21.
The annual deficit impacts from the Fair Hydro Plan and the change in the net pension asset are $5.0 billion for 2018/19, $5.6 billion for 2019/20 and $6.0 billion for 2020/21.
5.6.2 Ontario’s Ratio of Accumulated Deficit to GDP
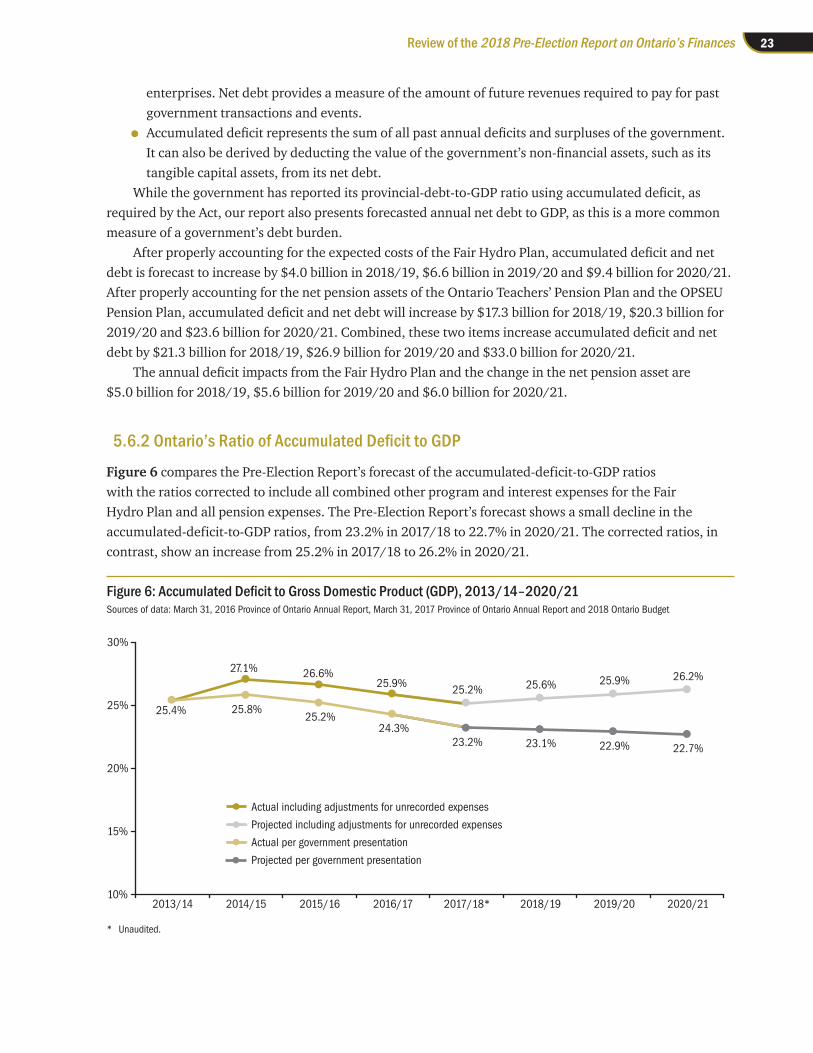
Figure 6 compares the Pre-Election Report’s forecast of the accumulated-deficit-to-GDP ratios with the ratios corrected to include all combined other program and interest expenses for the Fair Hydro Plan and all pension expenses. The Pre-Election Report’s forecast shows a small decline in the accumulated-deficit-to-GDP ratios, from 23.2% in 2017/18 to 22.7% in 2020/21. The corrected ratios, in contrast, show an increase from 25.2% in 2017/18 to 26.2% in 2020/21.
Figure 6: Accumulated Deficit to Gross Domestic Product (GDP), 2013/14–2020/21Sources of data: March 31, 2016 Province of Ontario Annual Report, March 31, 2017 Province of Ontario Annual Report and 2018 Ontario Budget
* Unaudited.
25.4%
27.1% 26.6%25.9% 25.2% 25.6% 25.9% 26.2%
25.8%25.2%
24.3%23.2% 23.1% 22.9% 22.7%
10%
15%
20%
25%
30%
2013/14 2014/15 2015/16 2016/17 2017/18* 2018/19 2019/20 2020/21
Actual including adjustments for unrecorded expenses
Projected including adjustments for unrecorded expenses
Actual per government presentation
Projected per government presentation
24
5.6.3 Ontario’s Ratio of Net Debt to GDP
A key indicator of the government’s ability to carry its debt is the level of debt relative to the size of the economy. The ratio of net debt to gross domestic product measures the relationship between a govern-ment’s obligations and its capacity to raise the funds needed to meet them. It is an indicator of the burden of government debt on the economy.
If the amount of debt that must be repaid relative to the value of the GDP is rising—in other words, the ratio is rising—it means the government’s net debt is growing faster than the provincial economy and becoming an increasing burden.
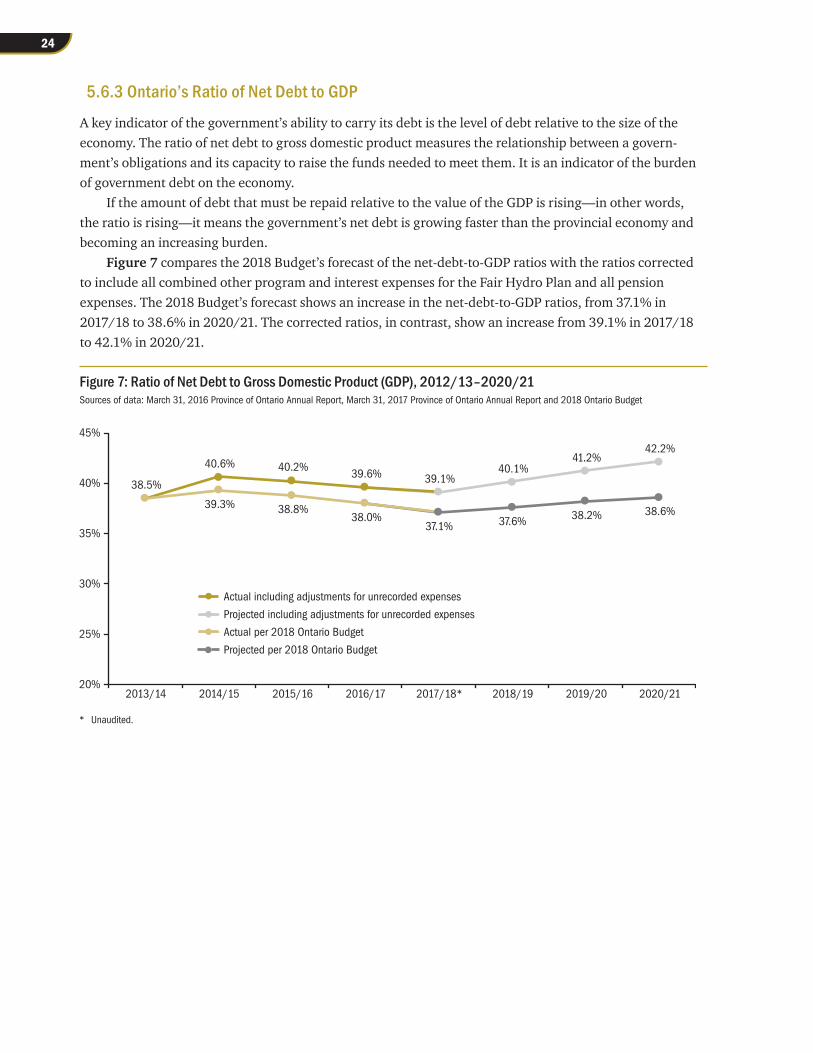
Figure 7 compares the 2018 Budget’s forecast of the net-debt-to-GDP ratios with the ratios corrected to include all combined other program and interest expenses for the Fair Hydro Plan and all pension expenses. The 2018 Budget’s forecast shows an increase in the net-debt-to-GDP ratios, from 37.1% in 2017/18 to 38.6% in 2020/21. The corrected ratios, in contrast, show an increase from 39.1% in 2017/18 to 42.1% in 2020/21.
Figure 7: Ratio of Net Debt to Gross Domestic Product (GDP), 2012/13–2020/21Sources of data: March 31, 2016 Province of Ontario Annual Report, March 31, 2017 Province of Ontario Annual Report and 2018 Ontario Budget
* Unaudited.
38.5%
40.6% 40.2%39.6% 39.1%
40.1%41.2%
42.2%
39.3% 38.8%38.0%
37.1% 37.6% 38.2% 38.6%
20%
25%
30%
35%
40%
45%
2013/14 2014/15 2015/16 2016/17 2017/18* 2018/19 2019/20 2020/21
Actual including adjustments for unrecorded expenses
Projected including adjustments for unrecorded expenses
Actual per 2018 Ontario Budget
Projected per 2018 Ontario Budget

25Review of the 2018 Pre-Election Report on Ontario’s Finances
5.6.4 Net Debt Per Ontario Resident
Using the more common measure, Ontario’s net debt will have increased by 26% over a five-year period, from $314 billion in 2016/17 to $393 billion by 2020/21. To put this in perspective, the amount of net debt owed by each resident of Ontario on behalf of the government will increase from about $22,000 per person in 2016 to about $26,000 per person in 2021. In other words, eliminating the Province’s forecast net debt in 2021 would require every Ontarian to pay about $26,000. Figure 8 shows the net debt per Ontario resident from 2016/17 to 2020/21.
Figure 8: Net Debt per Ontario Resident, 2016/17–2020/21 ($ 000)Sources of data: March 31, 2016 Province of Ontario Annual Report, March 31, 2017 Province of Ontario Annual Report, 2018 Ontario Budget and Statistics Canada
* Unaudited.
Actual including adjustments for unrecorded expenses
Projected including adjustments for unrecorded expenses
$22.13$22.48
$23.68
$24.97
$26.25
$20
$21
$22
$23
$24
$25
$26
$27
2016/17 2017/18* 2018/19 2019/20 2020/21

26
Appendix: Results of Our Examination on the Pre-Election Report’s Performance Against Our Objectives and Criteria
Objectives Critera ResultsThe 2018 Pre-Election Report on Ontario’s Finances should be consistent with the presentation and disclosure standards established by the Chartered Professional Accountants of Canada for future-oriented financial information and with the requirements of the Fiscal Transparency and Accountability Act, 2004.
• The information presented is consistent with the relevant legislative provisions of the Fiscal Transparency and Accountability Act, 2004, that govern the Pre-Election Report.
Met
• Key economic and financial assumptions are clearly explained and supportable.
Met except for the assumptions relating to the presentation of the expenses relating to the Fair Hydro Plan and Pensions.
• Forecasts are significantly detailed to demonstrate the impact of economic conditions and government actions on its financial situation.
Met
• Significant risks related to forecasts are simply stated and related sensitivity analyses are published.
Met
• Government directives and announcements that have a significant influence on the 2018 Pre-Election Report are described.
Met
• The financial information is prepared in accordance with Public Sector Accounting Standards (PSAS).
Not Met. The financial information relating to the Fair Hydro Plan and Pensions is not prepared in accordance with PSAS. The failure to prepare this information in accordance with PSAS leads to a material misstatement in the projected deficit and provincial debt-to-GDP ratios outlined in the Pre-Election Report.
• The presentation and disclosure in the 2018 Pre-Election Report is consistent with the presentation and disclosure requirements of CPA Canada Section 4250 (Part V).
Partially Met. The Pre-Election Report does not contain a prescribed general purpose future-oriented income statement as required by Section 4250.

27Review of the 2018 Pre-Election Report on Ontario’s Finances
Objectives Critera ResultsAs of the date of this report, the assumptions used to prepare the report should be consistent with the plans of the Government of Ontario, and the estimated revenues and expenses for the three fiscal years reflect the use of such assumptions.
• Decisions of government subsequent to March 7, 2018, and prior to the date of the report do not have a material impact on the estimated revenues and expenses for years presented in the Pre-Election Report.
Met
• The assumptions used to estimate revenues and expenses are consistent with the approvals provided by the Treasury Board on the 2018 Program Review, Renewal and Transformation (PRRT) submissions and the 2018 Budget.
Met
• The revenues and expenses for the years presented reflect the decisions of Treasury Board on the 2018 PRRT submissions and the 2018 Budget.
Met
The assumptions relating to the fiscal years ending March 31, 2019, March 31, 2020, and March 31, 2021, respectively, are suitably supported, provide a reasonable basis for estimating revenues and expenses, keeping in mind that the degree of uncertainty with respect to assumptions increases the further in the future estimates are made.
• The assumptions used are supported by the expected economic conditions and the decisions of government.
Met
• The estimated revenues and expenses reflect the assumptions used as outlined in the Pre-Election Report.
Met

Office of the Auditor General of Ontario
20 Dundas Street West, Suite 1530Toronto, OntarioM5G 2C2
www.auditor.on.ca
ISBN 978-1-4868-2073-3 (Print) ISBN 978-1-4868-2074-0 (PDF)