review of the ank group’s ost -sharing formula · african development bank group review of the...
TRANSCRIPT
African Development Bank Group
REVIEW OF THE BANK GROUP’S COST-SHARING FORMULA
NOVEMBER, 2010
TABLE OF CONTENTS
LIST OF TABLES LIST OF FIGURES LIST OF BOXES LIST OF ABBREVIATIONS
EXECUTIVE SUMMARY ................................................................................................. 1
I. INTRODUCTORY BACKGROUND ................................................................................. 3
II. GUIDING PRINCIPLES FOR THE BANK GROUP’S COST-SHARING FORMULA ................................. 4
Statutory Requirements for Fair Allocation of Costs Incurred .................................................... 4
Cost-allocation Principles and Requirements .................................................................................... 5
Other Guiding Principles ............................................................................................................................ 5
III. THE CURRENT COST-SHARING FORMULA AND REASONABLENESS OF ITS RESULT ......................... 6
Cost Sharing Parameters .......................................................................................................................... 6
The Cost-Sharing Method ......................................................................................................................... 8
Evolution of the Results of the Formula and Validity of the Methodology ............................. 8
Relevance and Reasonability of the cost shares .............................................................................. 9
Comparability with Other MDBs ........................................................................................................... 11
IV. RATIONALE AND PROCESS FOR THE REVISON OF THE COST-SHARING FORMULA ........................ 12
Recent Developments with Impact on Cost-Sharing Formula .................................................. 13
Gradual and Phased Approach to the Adjustment of the formula ........................................... 14
V. PROPOSED SHORT-TERM REFINEMENTS TO CURRENT FORMULA ......................................... 15
Adjustment of Weights of the Activity Parameters ....................................................................... 15
Private Sector Operations ....................................................................................................................... 20
HIPCs and MDRI ......................................................................................................................................... 20
Other Short Term Adjustments ............................................................................................................ 20
Impact of the Proposed short term Adjustments on the Results of the Formula .............. 21
VI. POSSIBLE LONGER-TERM IMPROVEMENTS TO CURRENT FORMULA ...................................... 21
Classification of Operational and Non-Operational Expenses ................................................... 22
Allocation of Operational Costs ............................................................................................................. 23
Allocation of Non-Operational Costs ................................................................................................... 25
VII. IMPACT OF THE REVIEW ON THE BANK GROUP INSTITUTIONS ............................................ 27
Impact on ADB ............................................................................................................................................ 27
Impact on ADF ............................................................................................................................................ 27
Impact on NTF ............................................................................................................................................. 27
VIII. CONCLUSIONS .................................................................................................. 28
ANNEXES
LIST OF TABLES
Table 1: Expense Categorization for Cost-sharing..................................................................................... 7
Table 2: Activity Parameters .................................................................................................................... 8
Table 3: Recent History of Cost Shares ..................................................................................................... 9
Table 4: Average Loan Size & Ratio of Lending Volume to Administrative Expenses for 2008 ................. 12
Table 5: Number of Members Countries & Cost Shares in 2008 ............................................................. 12
Table 6A: ADB Annual Approvals and Size of Active Portfolio ................................................................. 17
Table 6B: ADF Annual Approvals and Size of Active Portfolio ................................................................. 17
Table 7: AsDB Project Origination & Execution Costs – 2005-2007 Average ........................................... 19
Table 8: Proposed Weights for Grants Relative to Loans ........................................................................ 20
Table 9: Indicative ADB and ADF Cost Shares for 2009 ........................................................................... 21
Table 10: Specific Parameters for Allocation of Certain Non-Operational Expenses ................................ 26
LIST OF FIGURES
Figure 1(a): Ratios of Lending Volumes to Administrative Expenses ....................................................... 10
Figure 1(b): Average Sizes of ADB and ADF Loans................................................................................... 10
Figure 2a: Evolution of ADB and ADF Active Portfolio ............................................................................ 16
Figure 2b: Ratio of Number of Active Loans & Grants to Number of Loan Approvals .............................. 16
Figure 3: Schematic of Comprehensive Cost Accounting System ............................................................ 24
LIST OF BOXES
Box 1: An Approach to Classifying Cost Center Expenses ........................................................................ 23
LIST OF ABBREVIATIONS
ADB African Development Bank
ADF African Development Fund
AsDB Asian Development Bank
BDIR Board of Directors
BGOV Board of Governors
CGSP General Services and Procurement
CIMM Information Management
COBS Strategy and Budget
ECON Chief Economist Office
FFCO Financial Control Department
FFMA Financial Management Department
FNVP Financial Vice Presidency
FO Field Office
HIPC Heavily Indebted Poor Countries
IBRD International Bank for Reconstruction and Development
IDA International Development Association
IFC International Finance Corporation
IFRS International Financial Reporting Standards
MDB Multilateral Development Bank
MDRI Multilateral Debt Relief Initiative
NTF Nigeria Trust Fund
OIVP Operations III - Infrastructure, Private Sector & Regional Integration - Vice Presidency
OPEV Operations Evaluation
OPSM Private Sector
ORPC Operational Resources and Policies
ORPF Procurement and Fiduciary Services
ORQR Results and Quality Assurance
ORRU Partnership and Cooperation Unit
ORSB Operations Regional South 2
ORVP Operations I - Country & Regional Programs & Policy - Vice Presidency
OSGE Governance, Economic and Financial Reforms
OSVP Operations II - Sector Operations - Vice Presidency
PCR Project Completion Report
SEGL General Secretariat
TRS Time Recording System
UA Unit of Account
WB World Bank
1
EXECUTIVE SUMMARY
The African Development Bank Group (the Bank Group) delivers its operational programs
through three entities: The African Development Bank (ADB), the African Development Fund
(ADF) and the Nigeria Trust Fund (NTF). The Group has a single combined administrative
expense budget and records expenses, when incurred, against such budget. While the three
windows are complementary, they are statutorily required to be legally separate and
distinct. Statutorily (under Article 31 of ADF agreement and Article IX of the NTF
Agreement), the ADF and NTF are required to reimburse the ADB for the fair value of their
use of the offices, staff, organization, services and facilities in accordance with
arrangements made between these two entities and the ADB. These arrangements take the
form of a sharing of costs through a defined cost sharing formula. The separation principles
enshrined in both the ADF and ADB Agreements prohibit each institution from bearing the
expenses, costs or losses of the other.
An appropriate cost-sharing formula permits a reasonable allocation of shared expenses, in
response to the statutory requirements described above, thereby enabling the financial
statements of each entity to reflect the costs of conducting its business. The Bank Group’s
practices for allocating shared expenses are similar to those of comparable MDBs that
operate both a market-based lending window and a concessional lending window.
The current formula used to allocate costs between the three windows of the Bank Group
has been applied since 1994. Like most other MDBs, the Bank Group’s operational activities
have evolved over the years in all areas and notably with regard to its private sector
operations. This has varying effects on the relative work-effort in delivering the operational
programs of each entity. Certain exogenous developments, such as the MDRI and IFRS fair-
value accounting requirements, have also affected the application of the formula. In this
regard, the introduction of UA budgeting from 2010, along with the planned implementation
of comprehensive cost accounting and simplified time-recording for professional staff in
Operations departments in 2011/2012 is expected to provide additional information on the
key drivers of the operational costs of the Bank Group, thereby providing an important
opportunity to make further improvements to the current formula.
Against the background summarized above, Management undertook a study (with the
assistance of an independent consultant with substantial experience in this subject with
other International Financial Institutions) with the primary objective of identifying
opportunities to improve the current formula or its application, to faithfully and reasonably
reflect the evolution to date of the Bank Group’s business activities. The review was to
examine whether the Bank Group was making the best use of the available information to
allocate its administrative costs. Each element of the formula was therefore scrutinized,
taking into account the views of staff and managers regarding the factors that drive the
costs, to determine whether it adequately reflected the business activities of the Bank
Group.
2
The review included: (i) consultations with managers on operational factors that impact
upon administrative expenses and on ways of enhancing the formula, (ii) surveys through
the use of questionnaires to obtain the views of Operations staff on their experience with
the costs of their activities, (iii) benchmarking to gather information from comparator
organizations about their cost allocation practices, and (iv) bilateral discussions and
exchanges with Board Members.
The key conclusions and recommendations of the review are as follows:
Overall, the current cost sharing formula remains a useful cost allocation tool. The cost
shares produced by the formula are reasonable when benchmarked with other MDBs and
in relationship to the lending volumes, average loan sizes and active portfolios of ADB
and ADF.
The review also identified certain refinements that could be immediately made
in some detailed elements of the formula based on currently available
information, while fully respecting the spirit and core principles of the formula.
These are essentially:
- The allocation of costs related to private sector operations directly to the ADB
window;
- Application of a revised weight of 50% to loans in the portfolio under
execution;
- Application of revised weights to project-financing grants (same weights as
project loans for approvals and for the portfolio under execution) and
technical assistance grants/loans (50% for approvals and 30% for the
portfolio under execution);
- Application of 50% weight to MDRI assets and exclusion of HIPCs assets, and.
- Exclusion of certain inactive loans eligible for cancellation (i.e. loans and
grants that remain unsigned for more than 12 months) from the cost sharing
formula.
Management believes that these improvements would produce cost shares that better
reflect the factors that drive the costs of the Bank Group. If the changes were applied
retroactively to allocate the 2009 administrative costs, the proposed refinements would
result in cost shares of approximately 31.2%, 67.0% and 1.8% for the ADB, ADF and NTF,
respectively.
In the longer-term, as previously noted, the information from the cost accounting and the
time recording systems being implemented would provide additional insights or perspectives
regarding how staff-time and other resources are actually spent in delivering the services of
the Bank Group, thereby providing opportunities for further improvements to the formula.
Further, Management recommends that the formula be reviewed periodically
(every 3 years) to assess its continued relevance in the context of the evolving business
activities of the Group.
3
I. INTRODUCTORY BACKGROUND
1.1 In recent years, concerns have been expressed regarding the fairness of the current
cost sharing formula. The steady increase over the years in the share of the ADF has often
been cited as a reason for a review of the formula. Such concerns have been expressed by
certain shareholders during the course of both the GCI-VI and ADF replenishment
discussions. In response to such concerns and noting the statutory requirements for a fair
cost-sharing formula, Management initiated a review with the assistance of an independent
consultant with substantial experience in this subject with other International Financial
Institutions. The fundamental purpose of the review was to examine whether the Bank
Group was making the best use of the available information to appropriately allocate its
administrative costs. The method and elements of the current cost sharing formula were
therefore extensively reviewed to determine whether they adequately reflected the business
activities of the Group and the views of staff and managers regarding the factors that drive
the costs. Thus there was no expectation or predetermination of cost shares, or evaluation
of alternative scenarios of cost shares, as part of the review.
On April 29, 2010, the Board of Directors held informal discussions on the cost- sharing
formula presented by the consultant, during which comments were made on the proposals
for short-term and long-term adjustments. Subsequently, on July 14, 2010 a formal Board
discussed the revised proposal. During the latter discussions, further issues emerged and
the document was referred to AUFI and CODE for a deeper technical review. The
AUFI/CODE meeting was held on October 14, 2010 and a large majority of members agreed
on the broad thrust of the proposal. However, they requested further clarifications on the
short-term adjustments. Management conducted an additional survey which confirmed the
weights, based on the differentiating characteristics of projects under execution versus
project approvals, as well as project loans versus technical assistance grants/loans. The
treatment of inactive loans has also been refined to reflect management’s overall
assessment of the extent of time spent in the follow up of such loans. The proposals
presented in this report reflect the results of the survey and address concerns raised during
the AUFI/CODE meeting.
1.2 This report is organized in 8 sections. After this introductory background, the second
section of this report recalls the statutory requirements and principles underpinning the
cost-sharing formula. Section 3 briefly presents the current cost-sharing formula, its
application in relation with the evolution of the Bank’s business and expenditure profile as
well as the comparison with other MDBs. Section 4 highlights the rationale for a review of
the formula. Sections 5 and 6 present the two-stage process of adjusting the formula with:
(i) some short-term improvements to the parameters that could be made to the current
formula, and (ii) longer-term adjustments to factor in the evolving cost drivers of the Bank
business, the implementation of the enhanced budgeting framework and cost accounting as
well as prospects for better cost determination to be supported by a simplified time
recording system. Section 7 provides the impact of the review on each institution of the
Bank Group. The conclusions of the review are summarized in Section 8.
4
II. GUIDING PRINCIPLES FOR THE BANK GROUP’S COST-SHARING FORMULA
Statutory Requirements for Fair Allocation of Costs Incurred
2.1 The African Development Bank (ADB), the African Development Fund (ADF) and the
Nigerian Trust Fund (NTF) that constitute the three windows of the Bank Group are legally
and financially independent institutions not subjected to accounting consolidation. But they
are administered in a combined organization to execute the shared mandate of catalyzing
the social and economic development of the regional member countries of the Bank Group.
Hence, with the very limited exception of certain costs that are specifically attributable to
and therefore chargeable to a specific Bank Group window, the administrative costs of the
Group are incurred by ADB on behalf of the Group. The Bank Group has a single
administrative expense budget for meeting the costs of the three institutions.
2.2 Statutorily (under Article 31 of ADF agreement and Article IX of the NTF Agreement),
the ADF and NTF are required to reimburse the ADB for the fair value of their use of the
offices, staff, organization, services and facilities in accordance with arrangements made
between these two entities and the ADB. These arrangements take the form of a sharing of
costs through a defined cost sharing formula.
2.3 Furthermore, Article 11 of the Agreement Establishing ADB requires such separation
of costs. In the specific case of the NTF, the total amount to be reimbursed should not
exceed 20% of the gross income of the NTF. This implies that the ADB assumes the
responsibility for any excess over such defined upper limit.
2.4 Any cost sharing arrangement must comply with these statutory requirements. An
appropriate cost-sharing formula results in an allocation of shared expenses in a manner
that reasonably reflects the costs of conducting the business of each Bank Group window.
The cost sharing formula is therefore important to, but not influenced by, all discussions
regarding, or that take into account, the financial position and outlook of each window.
Examples of such discussions include ADF replenishment negotiations, periodic reviews of
the NTF, reviews of the pricing of ADB products and annual reviews of the ADB by the rating
agencies. The Group’s cost sharing practices are similar in all material aspects to those of
comparable MDBs that operate both a market-based lending window and a concessional
lending window.
2.5 Also, the Bank’s Financial Regulations (Regulation 3.4 and 4.3) require (i) that costs
appertaining exclusively to a particular funding source (i.e. Ordinary Resources or Special
Resources) should be charged to such source; and (ii) for the Board of Directors to
determine the apportionment of other administrative expenditures in conformity with the
relevant rules and regulations.
5
Cost-allocation Principles and Requirements
2.6 The generally accepted principles and requirements of effective cost allocation set
out in cost accounting literature include the following:
Cost allocation should reflect the business activities performed and the nature and
amount of costs should be transparent.
The parameters used for cost allocation should reflect the factors that generate the
costs (i.e. cost drivers) and be clearly identifiable and measurable. There should be
an established objective and logical linkage between the administrative cost incurred
and the indicator used for sharing such cost.
Recording and reporting of cost data should be comprehensive and reliable: (i),
covering all categories of the running costs and products of the institution; (ii)
ensuring consistency and comparability over time; and (iii) enabling necessary
decisions to be taken in a timely manner. More importantly, for every activity
undertaken, it should identify the institution for which the work is done, how much
time is spent on that activity, and what cost is involved.
Cost data must be transparent, accessible and traceable for audit trail purposes.
Other Guiding Principles
2.7 In addition to the above principle, best practices indicate that the formula should
also reflect the following attributes:
Simplicity, continuity and reasonableness – in the context of the very dynamic
nature of the Bank Group’s business and associated costs, the formula should
provide some level of continuity with previous versions and be as simple to apply as
possible. Increased complexity does not necessarily improve the final results of the
formula. Finally, reasonableness means that the formula should fairly reflect, as
closely as possible, the factors that drive the Bank’s administrative costs.
Transparency and dynamism – the formula should not be predetermined or
reverse engineered. Implicit in the formula is the fact that the derived shares are not
invariant to time, since the parameters and their value as well as the Bank’s assets
fluctuate from period to period and future values cannot be predicted with certainty
and accuracy. New cost sharing arrangements provide a new base for reimbursing
expenses and should not be used to make adjustments retroactively. Therefore, the
formula should be subjected to periodic review.
Objectivity– There is no scientific method of allocating costs and informed
judgments often need to be made by business managers regarding cost drivers and
cost attribution. Consistent with the statutory requirements, such judgments should
not be driven by the financial implications for a given entity or ad hoc political
negotiations.
6
III. THE CURRENT COST-SHARING FORMULA AND REASONABLENESS OF ITS RESULT
3.1 The Bank’s cost sharing formula has undergone several revisions1 all aimed at
deriving fair and objective measures to apportion costs incurred by the Bank Group among
the three institutions. The most recent update of the cost sharing formula, adopted in 1994,
has served its purpose reasonably well overall, with the premise underlying the formula
remaining relevant to date.
Cost Sharing Parameters
3.2 The current cost sharing basis for the Bank Group (ADB, ADF & NTF) is based on 3
sets of parameters:
Category and nature of expenditure: Specific and sharable expenses, operational and
non-operational expenses;
Activity parameters with the number of loans and grants as the cost driver;
Stock of operations2 or balance sheet parameter which is the volume of outstanding
assets.
3.3 Category of expenditure to be shared: The classification and traceability of
expenditures are paramount in the application of the cost sharing formula. In this regard,
Bank Group administrative expenses are divided into two broad categories:
(i) Specific expenses, which are expenses that are incurred directly by each
institution and that ought to be directly assigned to the given institution, such as
general capital increase related expenses for ADB and Replenishment related
expenses for ADF; and
(ii) Shareable expenses, which are all pooled costs that cannot be attributable to
a specific entity and which nevertheless must be allocated. The allocation principle is
that the shareable expenses should be assigned on the basis of the number and type
of activities carried out on behalf of each institution. For this purpose, costs are
further categorized into: (i) operational and (ii) non-operational expenses. The scope
and coverage of these expenses have been refined with the institutional reforms
undertaken in 2006 that allows for a fine-tuning of the organization with
categorizations of cost centers (i.e. organizational units) into direct operations and
operations support. Table 01 summarizes the categorization of the Bank group
expenditures.
1 Different formulae have been applied for the period 1974-1981; 1982-1983; and 1994 to the present.
2 All lending operations and their related financial assets.
7
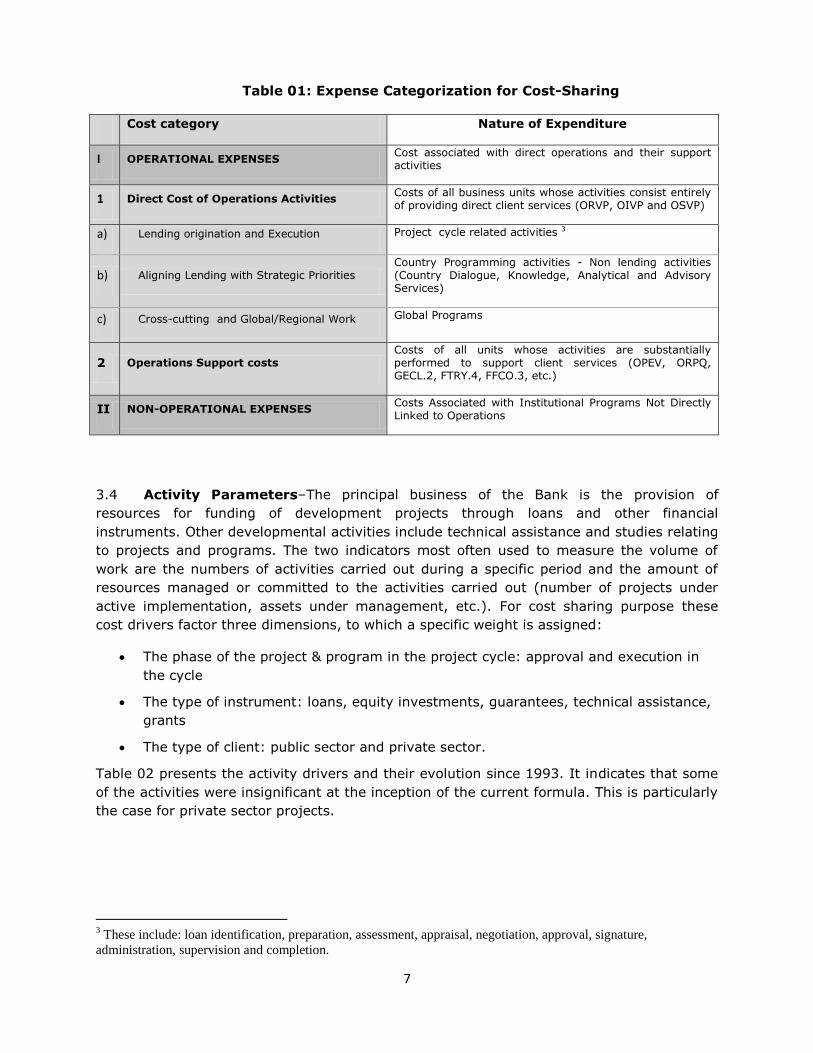
Table 01: Expense Categorization for Cost-Sharing
Cost category Nature of Expenditure
I OPERATIONAL EXPENSES Cost associated with direct operations and their support activities
1 Direct Cost of Operations Activities Costs of all business units whose activities consist entirely of providing direct client services (ORVP, OIVP and OSVP)
a) Lending origination and Execution Project cycle related activities 3
b) Aligning Lending with Strategic Priorities Country Programming activities - Non lending activities (Country Dialogue, Knowledge, Analytical and Advisory Services)
c) Cross-cutting and Global/Regional Work Global Programs
2 Operations Support costs Costs of all units whose activities are substantially performed to support client services (OPEV, ORPQ, GECL.2, FTRY.4, FFCO.3, etc.)
II NON-OPERATIONAL EXPENSES Costs Associated with Institutional Programs Not Directly Linked to Operations
3.4 Activity Parameters–The principal business of the Bank is the provision of
resources for funding of development projects through loans and other financial
instruments. Other developmental activities include technical assistance and studies relating
to projects and programs. The two indicators most often used to measure the volume of
work are the numbers of activities carried out during a specific period and the amount of
resources managed or committed to the activities carried out (number of projects under
active implementation, assets under management, etc.). For cost sharing purpose these
cost drivers factor three dimensions, to which a specific weight is assigned:
The phase of the project & program in the project cycle: approval and execution in
the cycle
The type of instrument: loans, equity investments, guarantees, technical assistance,
grants
The type of client: public sector and private sector.
Table 02 presents the activity drivers and their evolution since 1993. It indicates that some
of the activities were insignificant at the inception of the current formula. This is particularly
the case for private sector projects.
3 These include: loan identification, preparation, assessment, appraisal, negotiation, approval, signature,
administration, supervision and completion.
8
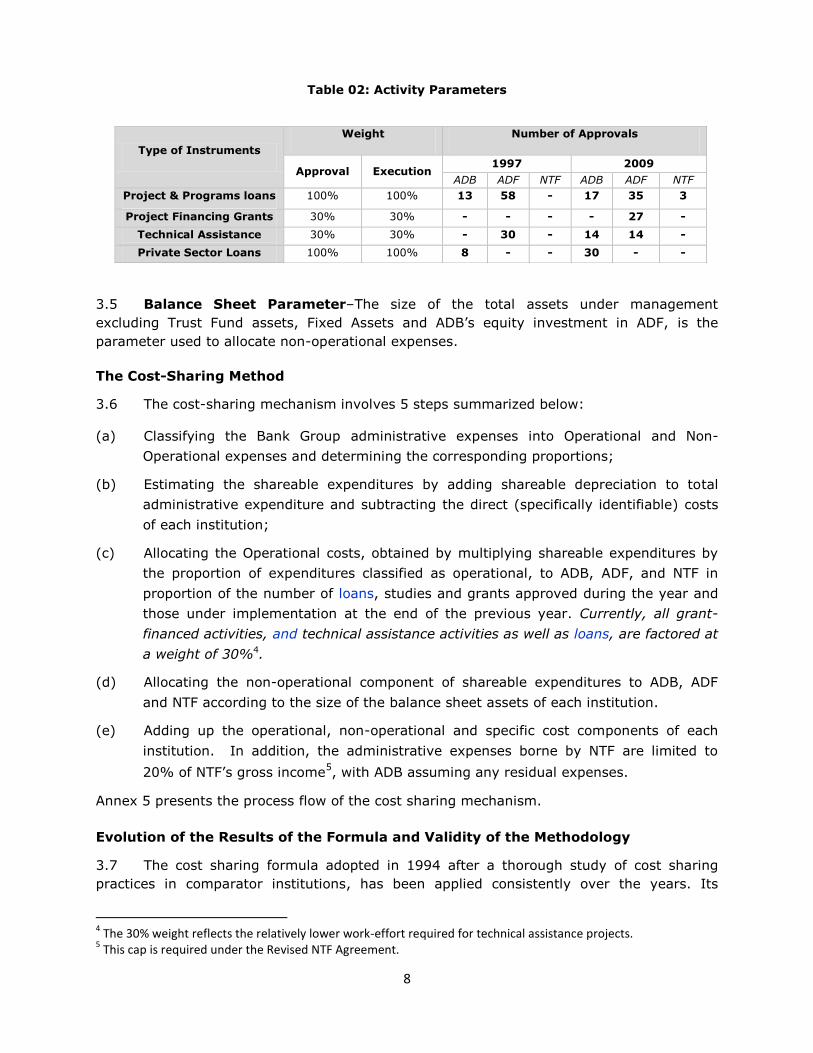
Table 02: Activity Parameters
3.5 Balance Sheet Parameter–The size of the total assets under management
excluding Trust Fund assets, Fixed Assets and ADB’s equity investment in ADF, is the
parameter used to allocate non-operational expenses.
The Cost-Sharing Method
3.6 The cost-sharing mechanism involves 5 steps summarized below:
(a) Classifying the Bank Group administrative expenses into Operational and Non-
Operational expenses and determining the corresponding proportions;
(b) Estimating the shareable expenditures by adding shareable depreciation to total
administrative expenditure and subtracting the direct (specifically identifiable) costs
of each institution;
(c) Allocating the Operational costs, obtained by multiplying shareable expenditures by
the proportion of expenditures classified as operational, to ADB, ADF, and NTF in
proportion of the number of loans, studies and grants approved during the year and
those under implementation at the end of the previous year. Currently, all grant-
financed activities, and technical assistance activities as well as loans, are factored at
a weight of 30%4.
(d) Allocating the non-operational component of shareable expenditures to ADB, ADF
and NTF according to the size of the balance sheet assets of each institution.
(e) Adding up the operational, non-operational and specific cost components of each
institution. In addition, the administrative expenses borne by NTF are limited to
20% of NTF’s gross income5, with ADB assuming any residual expenses.
Annex 5 presents the process flow of the cost sharing mechanism.
Evolution of the Results of the Formula and Validity of the Methodology
3.7 The cost sharing formula adopted in 1994 after a thorough study of cost sharing
practices in comparator institutions, has been applied consistently over the years. Its
4 The 30% weight reflects the relatively lower work-effort required for technical assistance projects.
5 This cap is required under the Revised NTF Agreement.
Type of Instruments
Weight Number of Approvals
Approval Execution 1997 2009
ADB ADF NTF ADB ADF NTF
Project & Programs loans 100% 100% 13 58 - 17 35 3
Project Financing Grants 30% 30% - - - - 27 -
Technical Assistance
Grants
30% 30% - 30 - 14
14 -
Private Sector Loans 100% 100% 8 - - 30 - -
9
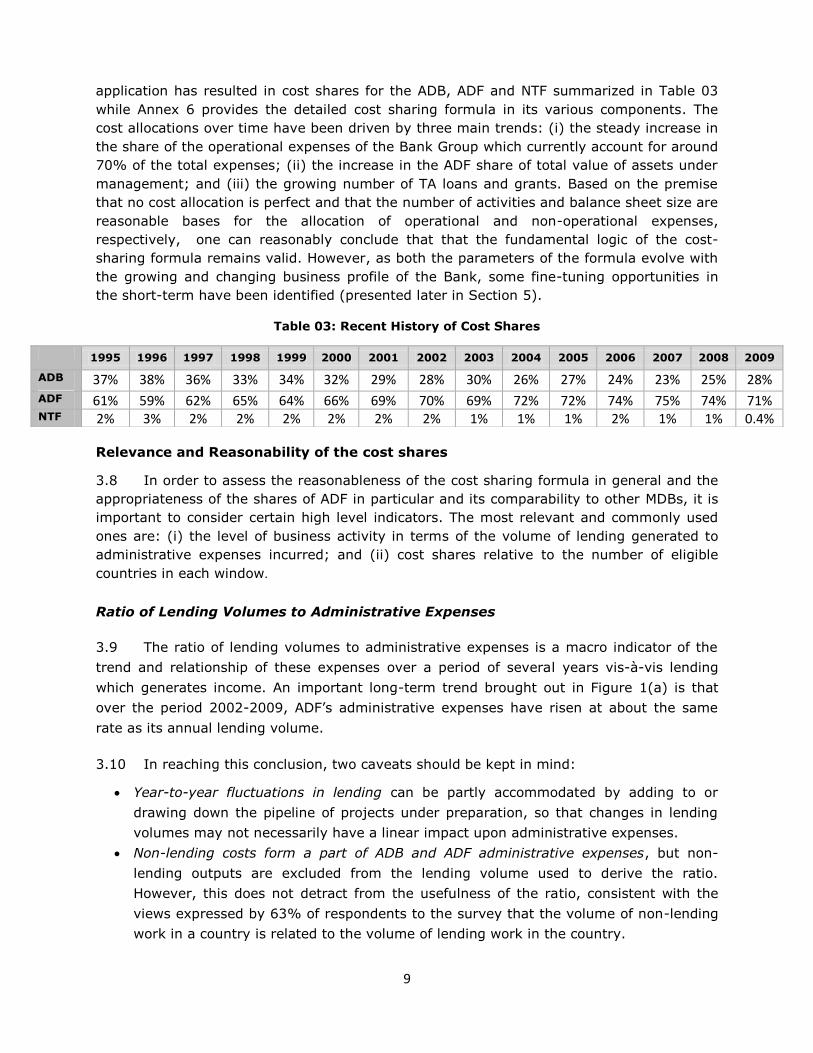
application has resulted in cost shares for the ADB, ADF and NTF summarized in Table 03
while Annex 6 provides the detailed cost sharing formula in its various components. The
cost allocations over time have been driven by three main trends: (i) the steady increase in
the share of the operational expenses of the Bank Group which currently account for around
70% of the total expenses; (ii) the increase in the ADF share of total value of assets under
management; and (iii) the growing number of TA loans and grants. Based on the premise
that no cost allocation is perfect and that the number of activities and balance sheet size are
reasonable bases for the allocation of operational and non-operational expenses,
respectively, one can reasonably conclude that that the fundamental logic of the cost-
sharing formula remains valid. However, as both the parameters of the formula evolve with
the growing and changing business profile of the Bank, some fine-tuning opportunities in
the short-term have been identified (presented later in Section 5).
Table 03: Recent History of Cost Shares
Relevance and Reasonability of the cost shares
3.8 In order to assess the reasonableness of the cost sharing formula in general and the
appropriateness of the shares of ADF in particular and its comparability to other MDBs, it is
important to consider certain high level indicators. The most relevant and commonly used
ones are: (i) the level of business activity in terms of the volume of lending generated to
administrative expenses incurred; and (ii) cost shares relative to the number of eligible
countries in each window.
Ratio of Lending Volumes to Administrative Expenses
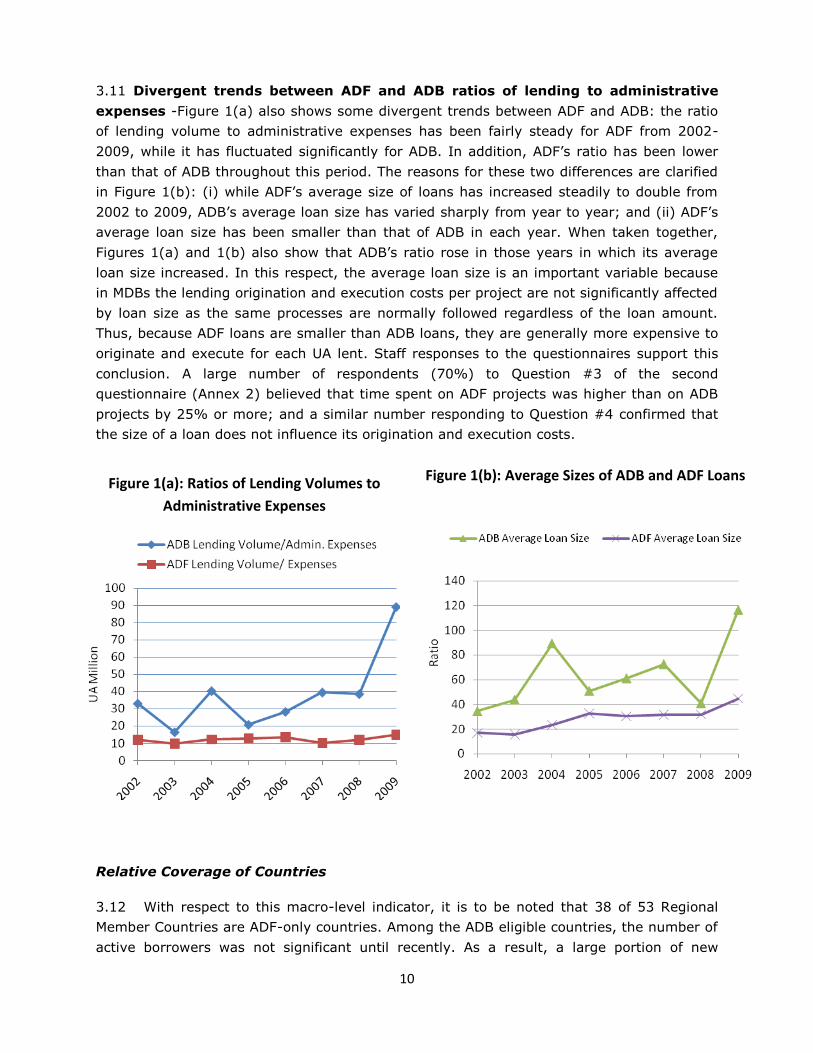
3.9 The ratio of lending volumes to administrative expenses is a macro indicator of the
trend and relationship of these expenses over a period of several years vis-à-vis lending
which generates income. An important long-term trend brought out in Figure 1(a) is that
over the period 2002-2009, ADF’s administrative expenses have risen at about the same
rate as its annual lending volume.
3.10 In reaching this conclusion, two caveats should be kept in mind:
Year-to-year fluctuations in lending can be partly accommodated by adding to or
drawing down the pipeline of projects under preparation, so that changes in lending
volumes may not necessarily have a linear impact upon administrative expenses.
Non-lending costs form a part of ADB and ADF administrative expenses, but non-
lending outputs are excluded from the lending volume used to derive the ratio.
However, this does not detract from the usefulness of the ratio, consistent with the
views expressed by 63% of respondents to the survey that the volume of non-lending
work in a country is related to the volume of lending work in the country.
1995 1996 1997 1998 1999 2000 2001 2002 2003 2004 2005 2006 2007 2008 2009
ADB 37% 38% 36% 33% 34% 32% 29% 28% 30% 26% 27% 24% 23% 25% 28%
ADF 61% 59% 62% 65% 64% 66% 69% 70% 69% 72% 72% 74% 75% 74% 71%
NTF 2% 3% 2% 2% 2% 2% 2% 2% 1% 1% 1% 2% 1% 1% 0.4%
10
3.11 Divergent trends between ADF and ADB ratios of lending to administrative
expenses -Figure 1(a) also shows some divergent trends between ADF and ADB: the ratio
of lending volume to administrative expenses has been fairly steady for ADF from 2002-
2009, while it has fluctuated significantly for ADB. In addition, ADF’s ratio has been lower
than that of ADB throughout this period. The reasons for these two differences are clarified
in Figure 1(b): (i) while ADF’s average size of loans has increased steadily to double from
2002 to 2009, ADB’s average loan size has varied sharply from year to year; and (ii) ADF’s
average loan size has been smaller than that of ADB in each year. When taken together,
Figures 1(a) and 1(b) also show that ADB’s ratio rose in those years in which its average
loan size increased. In this respect, the average loan size is an important variable because
in MDBs the lending origination and execution costs per project are not significantly affected
by loan size as the same processes are normally followed regardless of the loan amount.
Thus, because ADF loans are smaller than ADB loans, they are generally more expensive to
originate and execute for each UA lent. Staff responses to the questionnaires support this
conclusion. A large number of respondents (70%) to Question #3 of the second
questionnaire (Annex 2) believed that time spent on ADF projects was higher than on ADB
projects by 25% or more; and a similar number responding to Question #4 confirmed that
the size of a loan does not influence its origination and execution costs.
Relative Coverage of Countries
3.12 With respect to this macro-level indicator, it is to be noted that 38 of 53 Regional
Member Countries are ADF-only countries. Among the ADB eligible countries, the number of
active borrowers was not significant until recently. As a result, a large portion of new
Figure 1(b): Average Sizes of ADB and ADF Loans
Figure 1(a): Ratios of Lending Volumes to
Administrative Expenses
11
approvals is for ADF. Staff indications are that the level of work effort required in project
approval and execution tend to be different between country categories. Hence, for a given
project, less time is required in countries with more efficient institutional, administrative and
fiduciary structures than in countries where institutional management and implementation
capacity may be weaker.
Comparability with Other MDBs
3.13 The comparison with sister institutions, provides an important perspective on the
overall reasonableness of the results of the current formula. While there are differences
between the operational activities of ADB, ADF and other MDBs (such as types of countries
covered and the volume of private sector work), the allocated administrative expenses of
ADB and ADF, relative to their annual lending volumes, are broadly similar to the allocations
between the concessional and market windows of comparators.
Average Loan Size & Ratio of Lending Volume to Administrative Expenses
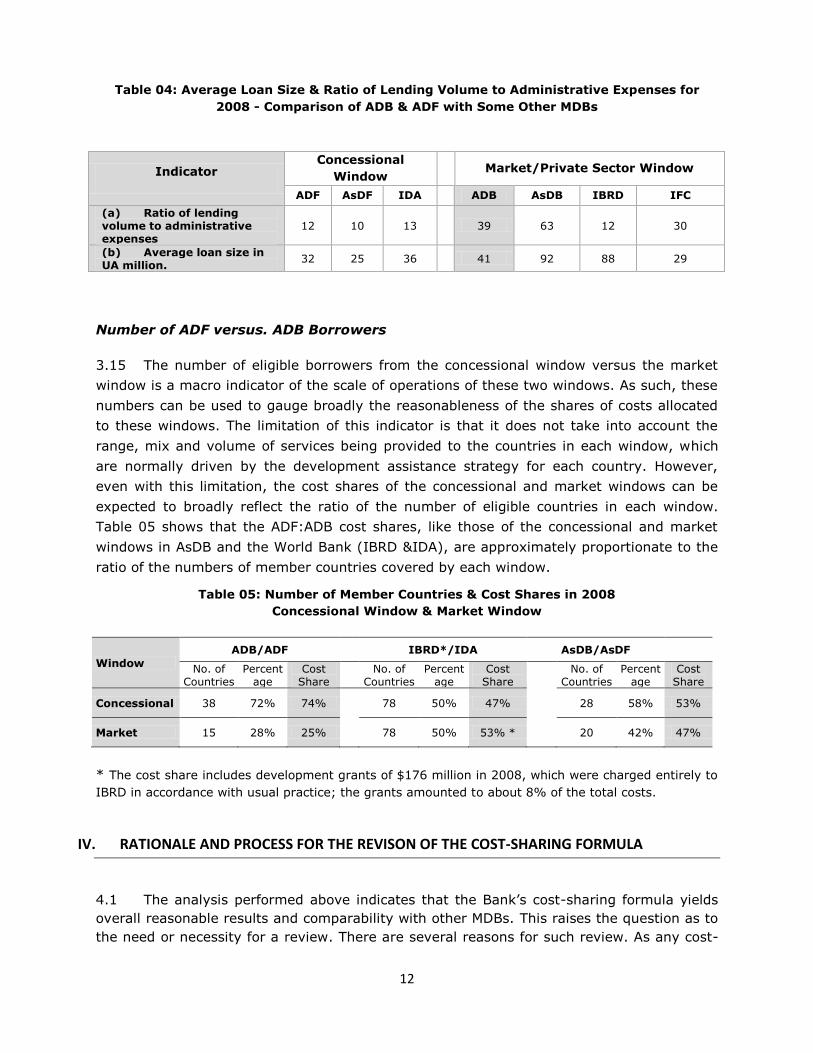
3.14 The ADF and ADB ratios of lending volumes to administrative expenses in 2008 were
compared with those of three other MDBs. Subject to the limitation of comparing the ratios
in a single year instead of over a longer period (as noted in paragraph 3.10), this
comparison, summarized in Table 04, shows the following:
ADF’s ratio is broadly similar to those of the Asian Development Fund (AsDF) and
IDA.
The ratio for ADB does vary from those of the Asian Development Bank (AsDB) and
IBRD. As AsDB has a private sector window like ADB, it is regarded as the closest
comparator to ADB. The reason for the difference between ADB’s and AsDB’s ratios is
that AsDB has a much larger average loan size than ADB.
IBRD’s ratio is not directly comparable with those of ADB and AsDB for three
reasons: (i) ADB’s ratio jumped sharply from 21 in 2005 to 40 in 2007, as its
average loan size increased by 40%; (ii) unlike ADB and AsDB, IBRD only makes
public sector loans; and (iii) compared with AsDB’s fairly even distribution of loan
amounts, IBRD’s distribution was skewed by 7 large loans of $500 million or more;
excluding these large loans, IBRD’s average loan size was $100 million (UA65
million).
The ratio for IFC was also examined, in order to look at the impact of private sector
loans on the ADB ratio. IFC’s ratio was slightly lower than that of ADB in 2008, but
was broadly in line with the average level of the ADB ratio over the period 2002-
2008.
12
Table 04: Average Loan Size & Ratio of Lending Volume to Administrative Expenses for
2008 - Comparison of ADB & ADF with Some Other MDBs
Indicator Concessional
Window
Market/Private Sector Window
ADF AsDF IDA ADB AsDB IBRD IFC
(a) Ratio of lending volume to administrative expenses
12 10 13 39 63 12 30
(b) Average loan size in UA million.
32 25 36 41 92 88 29
Number of ADF versus. ADB Borrowers
3.15 The number of eligible borrowers from the concessional window versus the market
window is a macro indicator of the scale of operations of these two windows. As such, these
numbers can be used to gauge broadly the reasonableness of the shares of costs allocated
to these windows. The limitation of this indicator is that it does not take into account the
range, mix and volume of services being provided to the countries in each window, which
are normally driven by the development assistance strategy for each country. However,
even with this limitation, the cost shares of the concessional and market windows can be
expected to broadly reflect the ratio of the number of eligible countries in each window.
Table 05 shows that the ADF:ADB cost shares, like those of the concessional and market
windows in AsDB and the World Bank (IBRD &IDA), are approximately proportionate to the
ratio of the numbers of member countries covered by each window.
Table 05: Number of Member Countries & Cost Shares in 2008
Concessional Window & Market Window
Window
ADB/ADF
IBRD*/IDA AsDB/AsDF
No. of Countries
Percentage
Cost Share
No. of Countries
Percentage
Cost Share
No. of
Countries Percent
age Cost
Share
Concessional 38 72% 74%
78 50% 47% 28 58% 53%
Market 15 28% 25%
78 50% 53% * 20 42% 47%
* The cost share includes development grants of $176 million in 2008, which were charged entirely to
IBRD in accordance with usual practice; the grants amounted to about 8% of the total costs.
IV. RATIONALE AND PROCESS FOR THE REVISON OF THE COST-SHARING FORMULA
4.1 The analysis performed above indicates that the Bank’s cost-sharing formula yields
overall reasonable results and comparability with other MDBs. This raises the question as to
the need or necessity for a review. There are several reasons for such review. As any cost-
13
sharing formula, it is subject to periodic reviews to ensure alignment with the business
growth profile of the institution. Since the last review initiated in 1993, several
developments have occurred that affect the parameters of the formula and the quality of
information related to the various components of the parameters. Accordingly, this review is
considered necessary, as further elaborated upon below.
Recent Developments with Impact on Cost-Sharing Formula
4.2 The parameters of the cost-sharing formula that serves as the basis for the allocation
of Bank Group administrative expenses between ADB, ADF and NTF have been affected by a
number of recent developments. These are essentially:
Change in the Activity and Lending Instrument Profiles
4.3 The present formula relies exclusively on the number of loans and grants approved
and under execution with equal weights to origination as well as execution. Refinement of
cost data over the years indicates that these two phases in the project life require different
work effort. Another related issue is the exclusion of non-lending activities which during the
revision of the formula in 1993 were relatively smaller than direct project lending. Non-
lending services delivered to clients are likely to become increasingly important as – like
other major MDBs – the Bank Group emphasizes its role of being a Knowledge institution.
Also, while non-lending activities are generally driven by the due diligence work and
advisory services associated with lending, in some countries (such as post-conflict and
fragile states) non-lending services may take precedence over lending, which may then
follow depending on country conditions and the results of analytical and advisory and policy-
related work.
Increasing Private Sector Operations
4.4 From the inception of the formula up to the early 2000s, the volume and complexity
of private sector operations were relatively low, compared to the total volume of Bank
Group operations. Therefore, the impact of their exclusion from the formula was marginal.
The growing increase in that portfolio in the Bank Group’s development activities introduces
another dimension to be integrated into the formula. Private sector operations are
exclusively financed from the ADB window. Since revenues related to private sector
operations are recognized in the ADB financial statements, the related costs should to the
extent possible be identified and charged exclusively to the ADB, irrespective of whether
some operations actually take place in ADF countries.
Decentralization and Field Offices’ Costs
4.5 Another evolution in the Banks’ business is the decentralization. From a small
number of (7) offices in 1993, the field office (FO) network currently comprises some 25
14
offices. The current practice is to treat all FO costs as shareable expenses. Indeed, every FO
cannot be associated exclusively with ADB or ADF because private sector operations,
although financed exclusively by ADB, are also carried out in countries that normally borrow
from ADF. However, costs incurred by FOs for originating and executing private sector
operations (and attributable to ADB) can be estimated by using the ratio of the number of
private sector operations to number of total operations in each country where an FO is
located.
HIPCs and MDRI
4.6 The ADF balance sheet includes HIPC and other grants totaling UA 1.5 billion at 31
December, 2009. As these assets, unlike active loans, do not require loan administration
and other non-operational supporting activities, they can be removed from the ADF balance-
sheet assets for calculating ADF’s share of non-operational expenses. Similarly, as cancelled
MDRI loans (UA 4.1 billion at 31 December, 2009) require lower administrative effort
compared with active loans, attaching a 100% weight to these assets would not be
reasonable for calculating ADF’s cost share.
Changes in Financial Reporting
4.7 Changes in the financial reporting requirements, particularly those relating to
financial instruments in general and, in particular, the adoption of the fair value option in
2005, have significantly impacted the balance sheet particularly of the ADB and
consequently have an impact on the application of the cost-sharing formula.
Implementation of Budget reforms
4.8 The Board approved various budget reforms in July 2007 with gradual
implementation of cost accounting, UA budgeting and time recording system, expected to
be completed by 2012. The implementation of these changes will have an impact on the
cost-sharing parameters and should enhance the quality of information used for the
determination of cost-sharing.
Other Specific Issues
4.9 There are also changes expected in the coming years due to the increased private
sector lending to LICs, revision of the longer-term institutional strategy, the growing
importance of knowledge products and advisory services, etc.
As result of the above developments, the review is considered as timely.
Gradual and Phased Approach to the Adjustment of the formula
4.10 In light of the above, there are a number of changes or refinements that could be
made to the current formula. These may be grouped into two categories: (i) refinements
15
related to parameters that are associated with the application of the cost-sharing principles,
in order to reflect the specific circumstances of the Bank’s evolving operating environment
and portfolio; and (ii) changes related to adjustments to cost drivers to reflect the future
business growth of the Bank as well as full implementation of cost accounting and its
attendant time recording system. The latter category is contingent upon a credible time
recording system6 and is therefore not feasible in the near term.
4.11 Management therefore proposes a two-step process: (i) refinement of the
parameters and their relative weights and (ii) longer-term adjustments to introduce
traceable cost drivers and segregation of expenses.
4.12 In proposing a two-step process, Management is cognizant that cost allocation is not
an exact science as it frequently requires informed judgments to be made by business
managers about cost drivers and objective methods of cost attribution. As such, the
objective of cost allocation is to meet the test of fair measurement and overall
reasonableness with regard to the attribution of costs to the relevant drivers, rather than an
unrealistic level of precision. Any formula that is to be derived from both short-term and
longer-term adjustments will require some degree of simplicity if it is to remain easy to
apply and to evaluate.
V. PROPOSED SHORT-TERM REFINEMENTS TO CURRENT FORMULA
5.1 The assessment of possible short-term improvements to the current formula,
starting with the 2010 cost allocation focused on: (i) adjustment of the weights attached to
the active portfolio versus loan approvals and weights assigned to project-financing and TA
grants versus loans; (ii) adjustments related to full allocation of Private Sector operations
costs to ADB; (iii) treatment of HIPC and MDRI assets; and (iv) other specific adjustments
to cater for some specific type of loans and active portfolio clean-up.
Adjustment of Weights of the Activity Parameters
5.2 Although objectively there are differences in work-effort between origination and
execution, loans and grants, ordinary asset management and MDRI assets, there are some
difficulties in quantifying with a high degree of accuracy, the weights to assign to the
various parameters in the formula. Data series availability and consistency across years are
limiting factors in the quantification process. In this context, the historical data available
have to be complemented by the results of the surveys undertaken at three successive
evaluations of the parameters of the formula within the context of this study. For this
purpose, Management undertook a sensitivity analysis to show the implications of various
weight changes on the formula. This would provide a reasonable guide for decision making
until a simplified time recording system becomes effective.
6 Implementation of a simplified and auditable time-recording system is a long process.
16
Active Loans & Grants portfolios versus Approvals
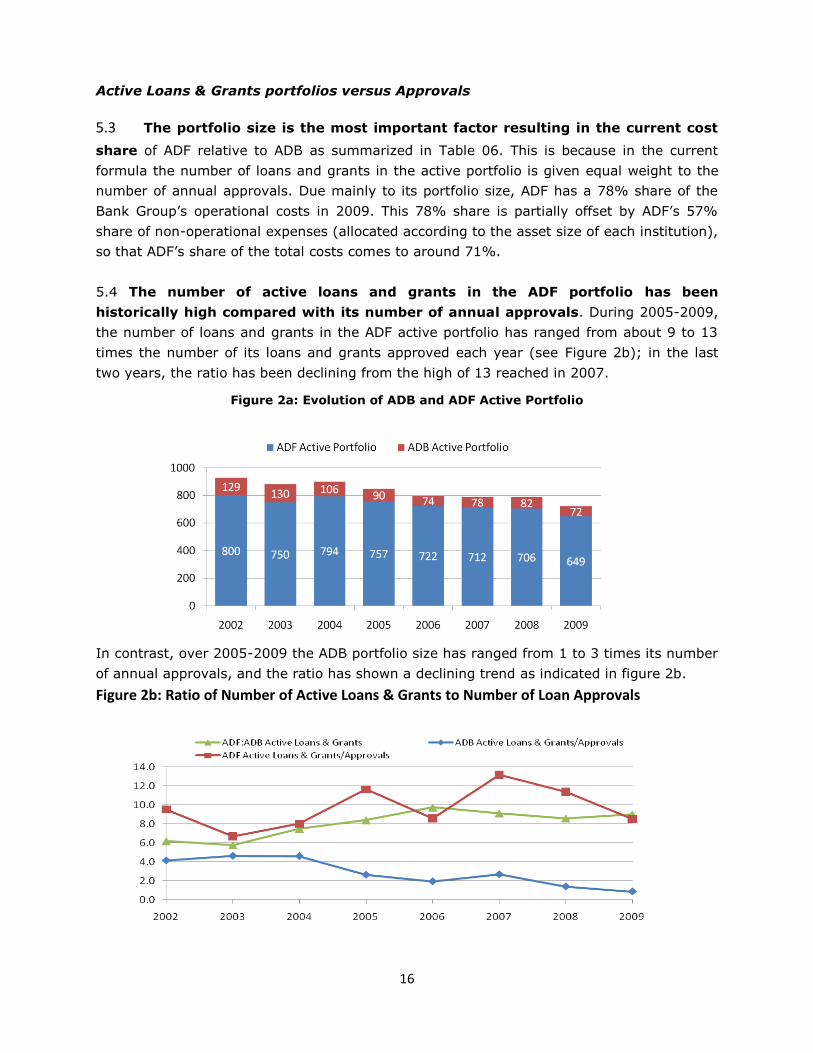
5.3 The portfolio size is the most important factor resulting in the current cost
share of ADF relative to ADB as summarized in Table 06. This is because in the current
formula the number of loans and grants in the active portfolio is given equal weight to the
number of annual approvals. Due mainly to its portfolio size, ADF has a 78% share of the
Bank Group’s operational costs in 2009. This 78% share is partially offset by ADF’s 57%
share of non-operational expenses (allocated according to the asset size of each institution),
so that ADF’s share of the total costs comes to around 71%.
5.4 The number of active loans and grants in the ADF portfolio has been
historically high compared with its number of annual approvals. During 2005-2009,
the number of loans and grants in the ADF active portfolio has ranged from about 9 to 13
times the number of its loans and grants approved each year (see Figure 2b); in the last
two years, the ratio has been declining from the high of 13 reached in 2007.
Figure 2a: Evolution of ADB and ADF Active Portfolio
In contrast, over 2005-2009 the ADB portfolio size has ranged from 1 to 3 times its number
of annual approvals, and the ratio has shown a declining trend as indicated in figure 2b.
Figure 2b: Ratio of Number of Active Loans & Grants to Number of Loan Approvals
17
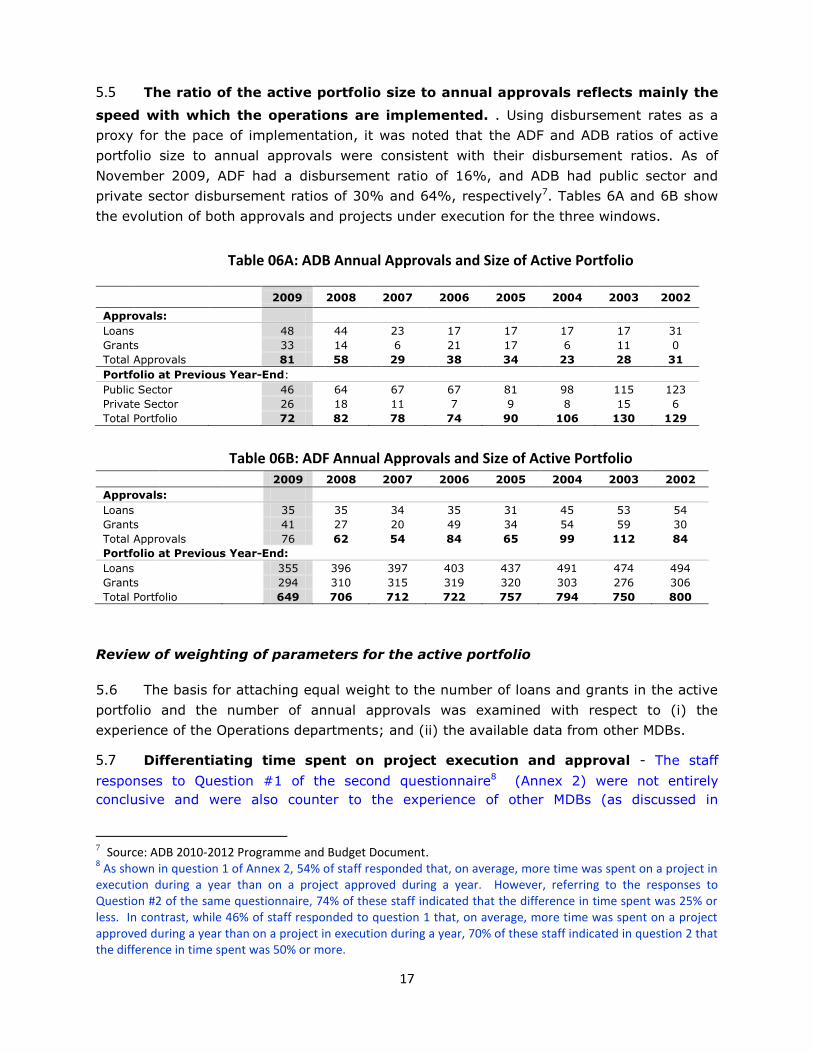
5.5 The ratio of the active portfolio size to annual approvals reflects mainly the
speed with which the operations are implemented. . Using disbursement rates as a
proxy for the pace of implementation, it was noted that the ADF and ADB ratios of active
portfolio size to annual approvals were consistent with their disbursement ratios. As of
November 2009, ADF had a disbursement ratio of 16%, and ADB had public sector and
private sector disbursement ratios of 30% and 64%, respectively7. Tables 6A and 6B show
the evolution of both approvals and projects under execution for the three windows.
Table 06A: ADB Annual Approvals and Size of Active Portfolio
2009 2008 2007 2006 2005 2004 2003 2002
Approvals:
Loans 48 44 23 17 17 17 17 31
Grants 33 14 6 21 17 6 11 0
Total Approvals 81 58 29 38 34 23 28 31
Portfolio at Previous Year-End:
Public Sector 46 64 67 67 81 98 115 123
Private Sector 26 18 11 7 9 8 15 6
Total Portfolio 72 82 78 74 90 106 130 129
Table 06B: ADF Annual Approvals and Size of Active Portfolio
2009 2008 2007 2006 2005 2004 2003 2002
Approvals:
Loans 35 35 34 35 31 45 53 54
Grants 41 27 20 49 34 54 59 30
Total Approvals 76 62 54 84 65 99 112 84
Portfolio at Previous Year-End:
Loans 355 396 397 403 437 491 474 494
Grants 294 310 315 319 320 303 276 306
Total Portfolio 649 706 712 722 757 794 750 800
Review of weighting of parameters for the active portfolio
5.6 The basis for attaching equal weight to the number of loans and grants in the active
portfolio and the number of annual approvals was examined with respect to (i) the
experience of the Operations departments; and (ii) the available data from other MDBs.
5.7 Differentiating time spent on project execution and approval - The staff
responses to Question #1 of the second questionnaire8 (Annex 2) were not entirely
conclusive and were also counter to the experience of other MDBs (as discussed in
7 Source: ADB 2010-2012 Programme and Budget Document.
8 As shown in question 1 of Annex 2, 54% of staff responded that, on average, more time was spent on a project in
execution during a year than on a project approved during a year. However, referring to the responses to Question #2 of the same questionnaire, 74% of these staff indicated that the difference in time spent was 25% or less. In contrast, while 46% of staff responded to question 1 that, on average, more time was spent on a project approved during a year than on a project in execution during a year, 70% of these staff indicated in question 2 that the difference in time spent was 50% or more.
18
paragraph 5.9). Further assessment of the details of this questionnaire and the responses
indicates that the staff responses were due to the following reasons:
Given the size of the active portfolio (particularly for ADF), staff do spend more time
on projects in execution, than on the much smaller number of projects approved
each year, for the entire portfolio. The survey was not very explicit, as it was
meant to request the amount of time spent during the approval and execution phase,
per project rather than for the entire portfolio, in order to properly reflect
weights in the formula.
The breakdown of the responses by department showed that staff in sector
departments and FOs, which have a larger share of responsibility for project
execution or larger portfolio under supervision than project approval, responded that
more time was spent on a project in execution than on a project approved.
Due to the 9-10 years or so, on average, that an ADF project remains in the active
portfolio, it is understandable that staff believed that they spent more time overall on
a project in execution than on a project approved during the much shorter project
approval cycle.
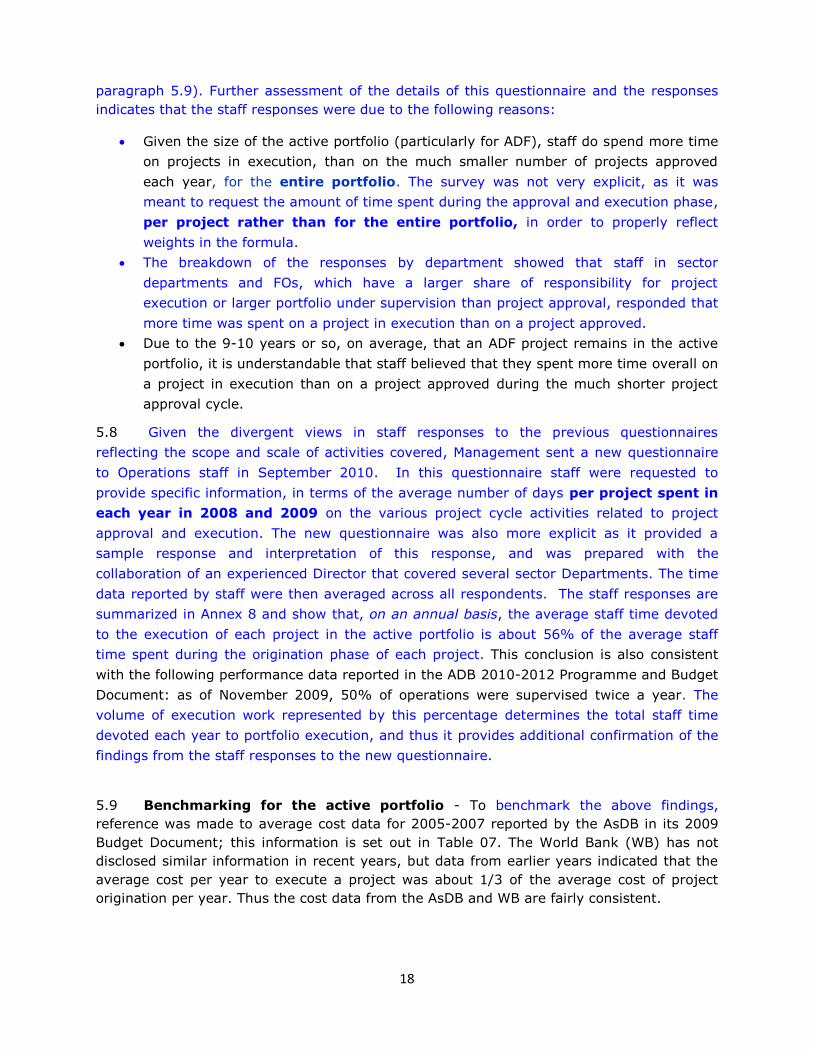
5.8 Given the divergent views in staff responses to the previous questionnaires
reflecting the scope and scale of activities covered, Management sent a new questionnaire
to Operations staff in September 2010. In this questionnaire staff were requested to
provide specific information, in terms of the average number of days per project spent in
each year in 2008 and 2009 on the various project cycle activities related to project
approval and execution. The new questionnaire was also more explicit as it provided a
sample response and interpretation of this response, and was prepared with the
collaboration of an experienced Director that covered several sector Departments. The time
data reported by staff were then averaged across all respondents. The staff responses are
summarized in Annex 8 and show that, on an annual basis, the average staff time devoted
to the execution of each project in the active portfolio is about 56% of the average staff
time spent during the origination phase of each project. This conclusion is also consistent
with the following performance data reported in the ADB 2010-2012 Programme and Budget
Document: as of November 2009, 50% of operations were supervised twice a year. The
volume of execution work represented by this percentage determines the total staff time
devoted each year to portfolio execution, and thus it provides additional confirmation of the
findings from the staff responses to the new questionnaire.
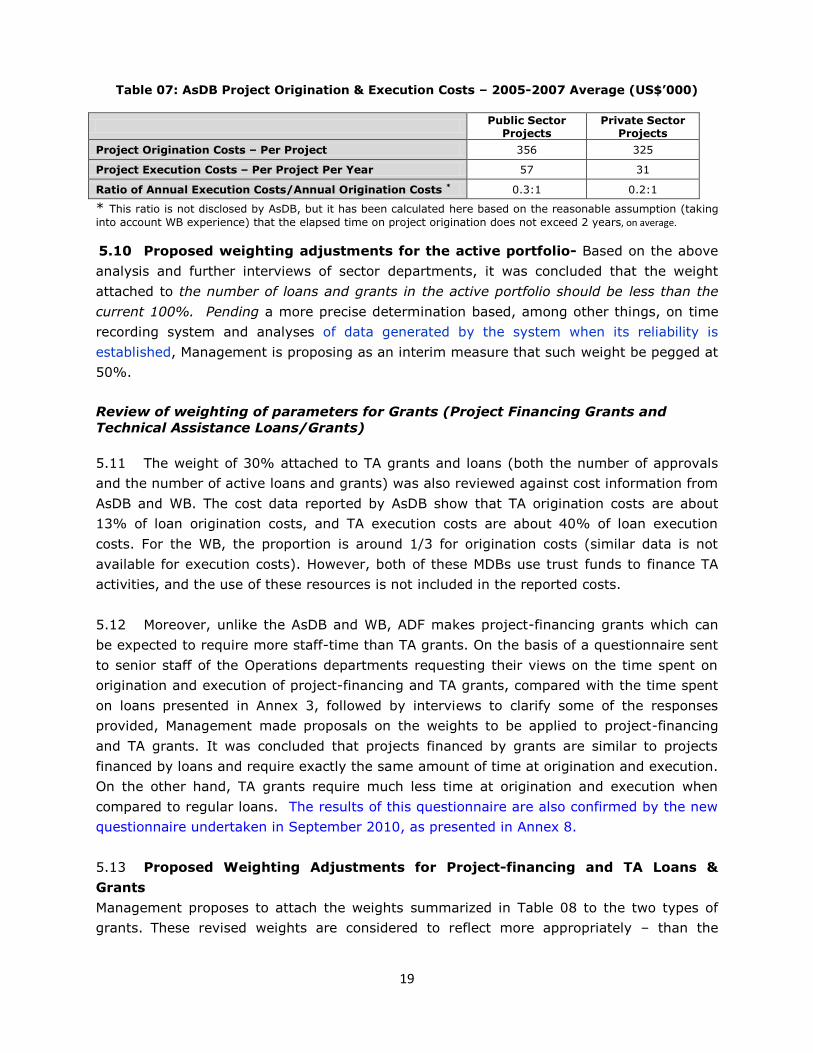
5.9 Benchmarking for the active portfolio - To benchmark the above findings,
reference was made to average cost data for 2005-2007 reported by the AsDB in its 2009
Budget Document; this information is set out in Table 07. The World Bank (WB) has not
disclosed similar information in recent years, but data from earlier years indicated that the
average cost per year to execute a project was about 1/3 of the average cost of project
origination per year. Thus the cost data from the AsDB and WB are fairly consistent.
19
Table 07: AsDB Project Origination & Execution Costs – 2005-2007 Average (US$’000)
Public Sector
Projects Private Sector
Projects
Project Origination Costs – Per Project 356 325
Project Execution Costs – Per Project Per Year 57 31
Ratio of Annual Execution Costs/Annual Origination Costs * 0.3:1 0.2:1
* This ratio is not disclosed by AsDB, but it has been calculated here based on the reasonable assumption (taking
into account WB experience) that the elapsed time on project origination does not exceed 2 years, on average.
5.10 Proposed weighting adjustments for the active portfolio- Based on the above
analysis and further interviews of sector departments, it was concluded that the weight
attached to the number of loans and grants in the active portfolio should be less than the
current 100%. Pending a more precise determination based, among other things, on time
recording system and analyses of data generated by the system when its reliability is
established, Management is proposing as an interim measure that such weight be pegged at
50%.
Review of weighting of parameters for Grants (Project Financing Grants and
Technical Assistance Loans/Grants)
5.11 The weight of 30% attached to TA grants and loans (both the number of approvals
and the number of active loans and grants) was also reviewed against cost information from
AsDB and WB. The cost data reported by AsDB show that TA origination costs are about
13% of loan origination costs, and TA execution costs are about 40% of loan execution
costs. For the WB, the proportion is around 1/3 for origination costs (similar data is not
available for execution costs). However, both of these MDBs use trust funds to finance TA
activities, and the use of these resources is not included in the reported costs.
5.12 Moreover, unlike the AsDB and WB, ADF makes project-financing grants which can
be expected to require more staff-time than TA grants. On the basis of a questionnaire sent
to senior staff of the Operations departments requesting their views on the time spent on
origination and execution of project-financing and TA grants, compared with the time spent
on loans presented in Annex 3, followed by interviews to clarify some of the responses
provided, Management made proposals on the weights to be applied to project-financing
and TA grants. It was concluded that projects financed by grants are similar to projects
financed by loans and require exactly the same amount of time at origination and execution.
On the other hand, TA grants require much less time at origination and execution when
compared to regular loans. The results of this questionnaire are also confirmed by the new
questionnaire undertaken in September 2010, as presented in Annex 8.
5.13 Proposed Weighting Adjustments for Project-financing and TA Loans &
Grants
Management proposes to attach the weights summarized in Table 08 to the two types of
grants. These revised weights are considered to reflect more appropriately – than the
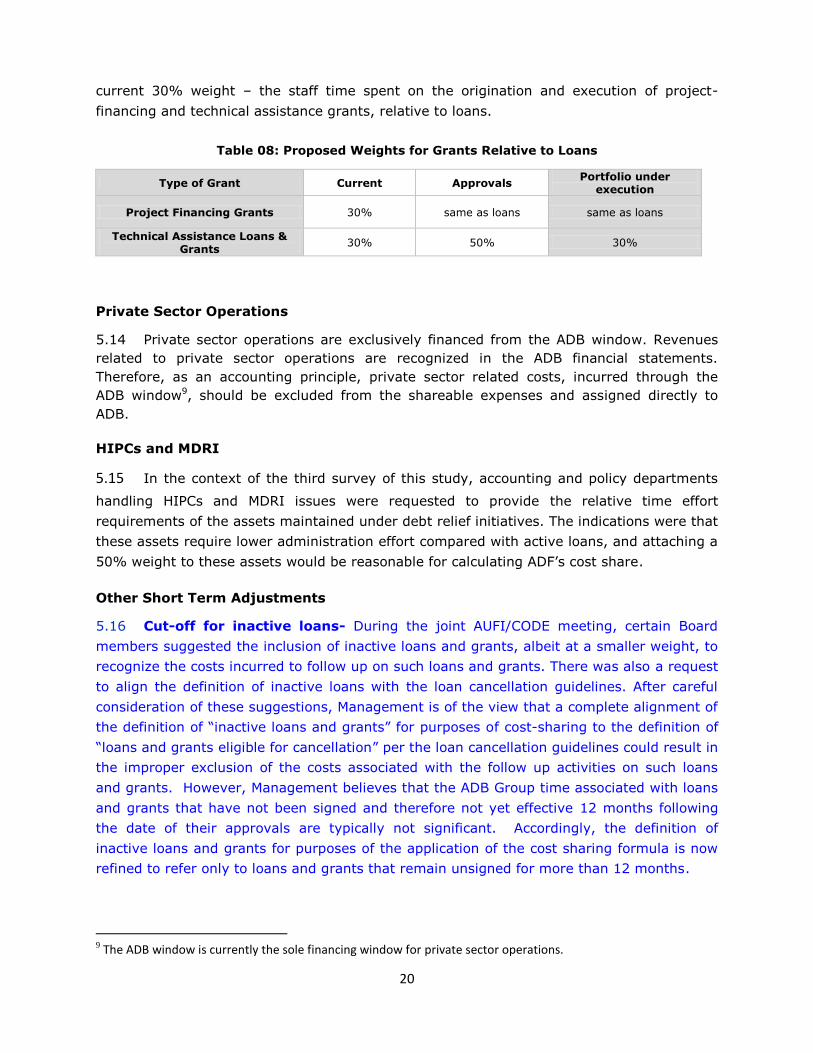
20
current 30% weight – the staff time spent on the origination and execution of project-
financing and technical assistance grants, relative to loans.
Table 08: Proposed Weights for Grants Relative to Loans
Type of Grant Current Approvals Portfolio under
execution
Project Financing Grants 30% same as loans same as loans
Technical Assistance Loans & Grants
30% 50% 30%
Private Sector Operations
5.14 Private sector operations are exclusively financed from the ADB window. Revenues
related to private sector operations are recognized in the ADB financial statements.
Therefore, as an accounting principle, private sector related costs, incurred through the
ADB window9, should be excluded from the shareable expenses and assigned directly to
ADB.
HIPCs and MDRI
5.15 In the context of the third survey of this study, accounting and policy departments
handling HIPCs and MDRI issues were requested to provide the relative time effort
requirements of the assets maintained under debt relief initiatives. The indications were that
these assets require lower administration effort compared with active loans, and attaching a
50% weight to these assets would be reasonable for calculating ADF’s cost share.
Other Short Term Adjustments
5.16 Cut-off for inactive loans- During the joint AUFI/CODE meeting, certain Board
members suggested the inclusion of inactive loans and grants, albeit at a smaller weight, to
recognize the costs incurred to follow up on such loans and grants. There was also a request
to align the definition of inactive loans with the loan cancellation guidelines. After careful
consideration of these suggestions, Management is of the view that a complete alignment of
the definition of ―inactive loans and grants‖ for purposes of cost-sharing to the definition of
―loans and grants eligible for cancellation‖ per the loan cancellation guidelines could result in
the improper exclusion of the costs associated with the follow up activities on such loans
and grants. However, Management believes that the ADB Group time associated with loans
and grants that have not been signed and therefore not yet effective 12 months following
the date of their approvals are typically not significant. Accordingly, the definition of
inactive loans and grants for purposes of the application of the cost sharing formula is now
refined to refer only to loans and grants that remain unsigned for more than 12 months.
9 The ADB window is currently the sole financing window for private sector operations.
21
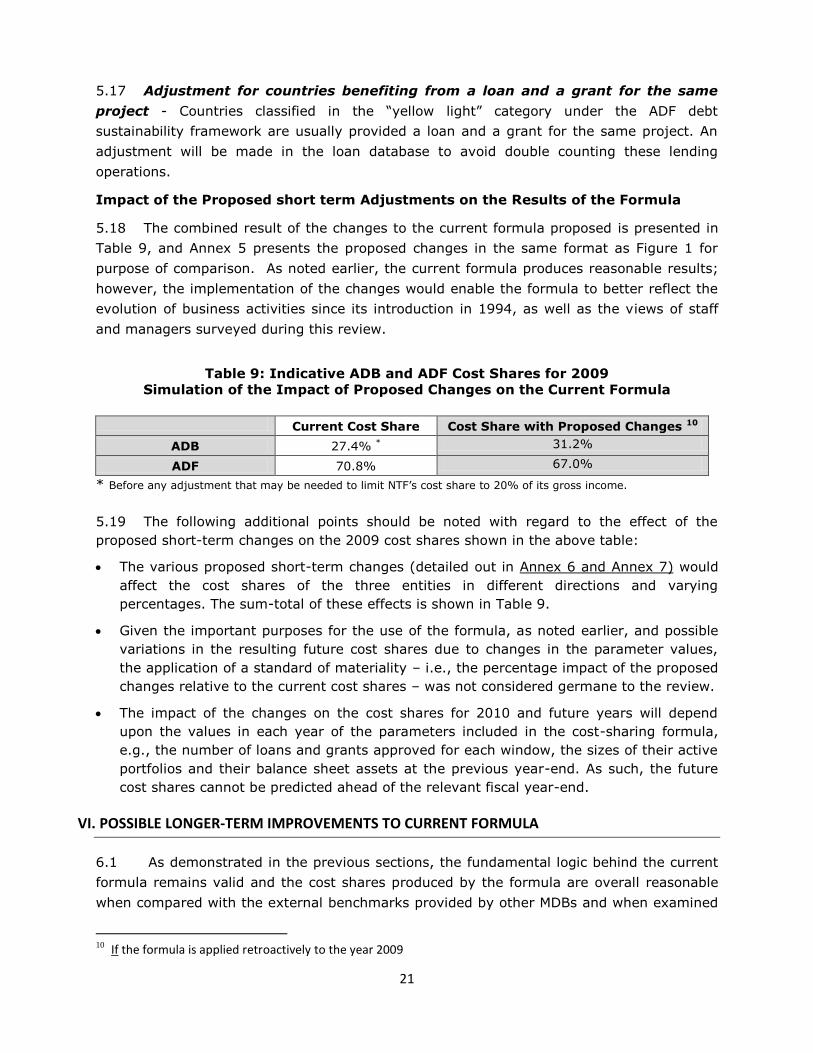
5.17 Adjustment for countries benefiting from a loan and a grant for the same
project - Countries classified in the ―yellow light‖ category under the ADF debt
sustainability framework are usually provided a loan and a grant for the same project. An
adjustment will be made in the loan database to avoid double counting these lending
operations.
Impact of the Proposed short term Adjustments on the Results of the Formula
5.18 The combined result of the changes to the current formula proposed is presented in
Table 9, and Annex 5 presents the proposed changes in the same format as Figure 1 for
purpose of comparison. As noted earlier, the current formula produces reasonable results;
however, the implementation of the changes would enable the formula to better reflect the
evolution of business activities since its introduction in 1994, as well as the views of staff
and managers surveyed during this review.
Table 9: Indicative ADB and ADF Cost Shares for 2009
Simulation of the Impact of Proposed Changes on the Current Formula
Current Cost Share Cost Share with Proposed Changes 10
ADB 27.4% * 31.2%
ADF 70.8% 67.0%
* Before any adjustment that may be needed to limit NTF’s cost share to 20% of its gross income.
5.19 The following additional points should be noted with regard to the effect of the
proposed short-term changes on the 2009 cost shares shown in the above table:
The various proposed short-term changes (detailed out in Annex 6 and Annex 7) would
affect the cost shares of the three entities in different directions and varying
percentages. The sum-total of these effects is shown in Table 9.
Given the important purposes for the use of the formula, as noted earlier, and possible
variations in the resulting future cost shares due to changes in the parameter values,
the application of a standard of materiality – i.e., the percentage impact of the proposed
changes relative to the current cost shares – was not considered germane to the review.
The impact of the changes on the cost shares for 2010 and future years will depend
upon the values in each year of the parameters included in the cost-sharing formula,
e.g., the number of loans and grants approved for each window, the sizes of their active
portfolios and their balance sheet assets at the previous year-end. As such, the future
cost shares cannot be predicted ahead of the relevant fiscal year-end.
VI. POSSIBLE LONGER-TERM IMPROVEMENTS TO CURRENT FORMULA
6.1 As demonstrated in the previous sections, the fundamental logic behind the current
formula remains valid and the cost shares produced by the formula are overall reasonable
when compared with the external benchmarks provided by other MDBs and when examined
10
If the formula is applied retroactively to the year 2009
22
in the context of the lending volumes, average loan sizes and active portfolios of ADB and
ADF. However, in view of future developments in the Banks’ business, a further breakdown
of cost drivers could enhance the accuracy of the formula. The budget process and its
associated cost accounting system, affords the opportunity to enhance the quality of
information used for the determination of cost-sharing amongst the Bank Group entities and
thereby its acceptability. Given the requirements of these enhancements, they cannot
realistically be implemented in the short-term.
6.2 It is important to note that these proposed longer-term adjustments are not
intended as a substitute to the proposed short-term fine tuning, but rather as part of
ongoing efforts to assure the continuing relevance and reasonableness of the cost sharing
formula. For instance, given the growing complexity of the Bank’s balance sheet
(development related exposure and treasury operations as well as their related operational
and non-operational activities) and the variety of non-operational expenses, further
segregation of these expenses is preferable. Such breakdown would require a separate
indicator for each category or cost item to reflect the work effort involved. By using these
more refined and traceable indicators the accuracy and objectivity of the formula could be
further enhanced.
6.3 The various options assessed in this respect are summarized below.
Classification of Operational and Non-Operational Expenses
6.4 The current practice is to divide the costs of each cost center into operational and
non-operational expenses on the basis of a categorization made during 2006 institutional
reforms. The categorization provides a reasonable breakdown based on the general
characteristics and nature of each cost center’s business activities and level of contribution
to the core business of the Bank (i.e. lending). For new business units created since 2006,
COBS has similarly decided on the breakdown of their expenses. While, on the face of it,
this approach is reasonable, it does not involve the use of measurable and monitorable
parameters as the bases for allocation of some Non-Operations departments’ expenses. The
longer-term objective of the organization fine-tuning is to give priority and impetus to
operations departments and country focus and drive the activities of support departments
toward that target. This entails a more rational way to classify expenses as the institution
grows and the number of cost centers increased since 2006. For example, the classification
of FFCO3 (Loan Disbursement) whose costs are treated as 100% operational, while the
costs of FFCO4 (Loan Accounting) are treated as only 50% operational, should be reviewed
to reflect the changes in the work efforts.
6.5 The Bank should consider adopting a more systematic approach (see Box 1) to
classifying the expenses of cost centers as operational vs. non-operational, that would be
also consistent with the practices of other MDBs. Alternatively, a thorough review of the
current allocation percentages should be undertaken to remove the inconsistencies of the
type noted above.
23
Allocation of Operational Costs
Need to Improve Lending Indicators for Allocation of Operational Costs
6.6 The numbers of lending operations approved during the year and included in the
year-end active portfolio may be regarded as reasonable indicators of the volume of staff
and other resources deployed for lending origination and execution. However, the use of
this indicator for cost allocation rests on the assumption that the origination and execution
of each loan requires an equal amount of staff-costs and other resources. Replies received
from Operations business units to the first questionnaire used for this review11 indicated a
clear recognition of the following:
Differences between the costs of ADB, ADF and NTF tasks were not all in one
direction, i.e., some tasks were more expensive for ADB than ADF/NTF, while others
were more expensive for ADF/NTF than ADB.
The cost differences were caused, or at least influenced by, a multiplicity of
operational factors that could not be captured sufficiently through the use of the
numbers of lending operations as the allocation parameter.
6.7 Another limitation of the exclusive use of lending-related indicators to allocate all
operational costs between ADB, ADF and NTF is that they do not recognize the importance
of non-lending services delivered to clients. These services are likely to become increasingly
important as – like other major MDBs – the Bank Group emphasizes its role of being a
Knowledge Bank. Also, while non-lending activities are generally driven by the due diligence
work and advisory services connected with lending, in some countries (such as post-conflict
and fragile states) non-lending services may take precedence over lending, which may then
11
The questions in the questionnaire included the following: Operations Departments were requested to indicate the approximate differences between ADB and ADF/NTF with regard to time spent on various tasks related to financing and non-financing activities, and then to indicate if there is a connection between those differences and various operational factors, such as the amount of financing, implementing agency capacity and country conditions (e.g., fragile state), etc.
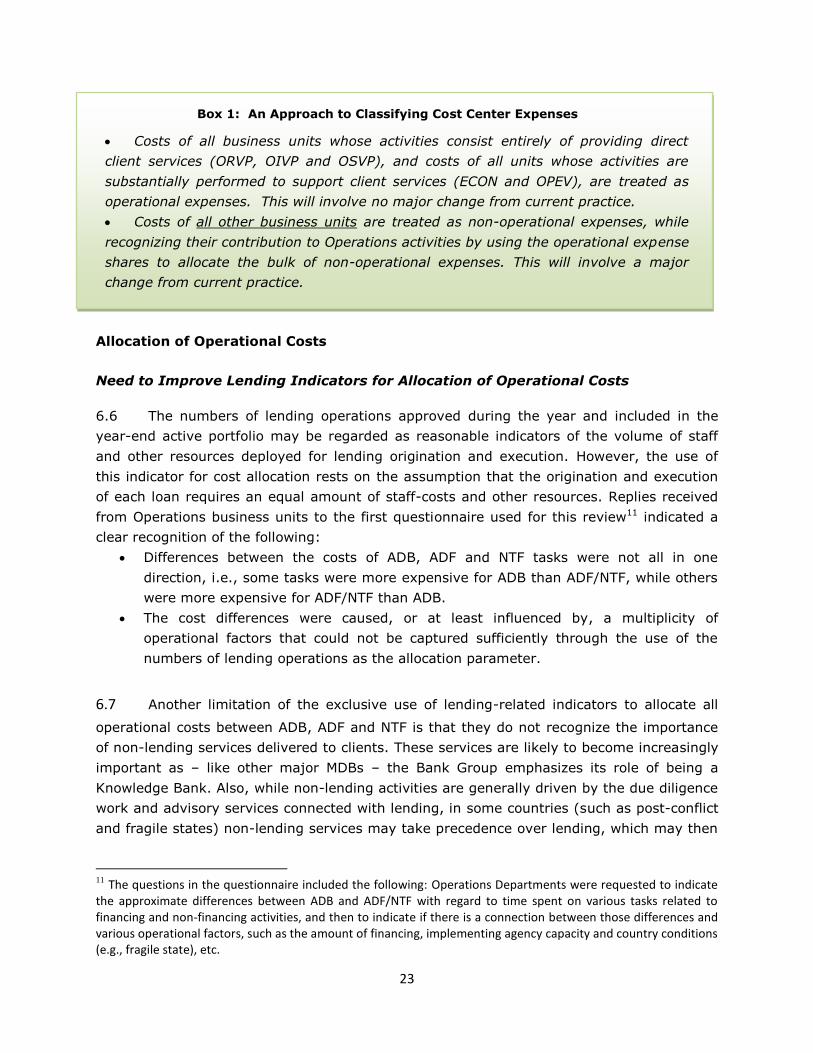
Box 1: An Approach to Classifying Cost Center Expenses
Costs of all business units whose activities consist entirely of providing direct
client services (ORVP, OIVP and OSVP), and costs of all units whose activities are
substantially performed to support client services (ECON and OPEV), are treated as
operational expenses. This will involve no major change from current practice.
Costs of all other business units are treated as non-operational expenses, while
recognizing their contribution to Operations activities by using the operational expense
shares to allocate the bulk of non-operational expenses. This will involve a major
change from current practice.
24
follow depending on country conditions and the results of analytical and advisory and policy-
related work.
Options to Allocate Operational Expenses
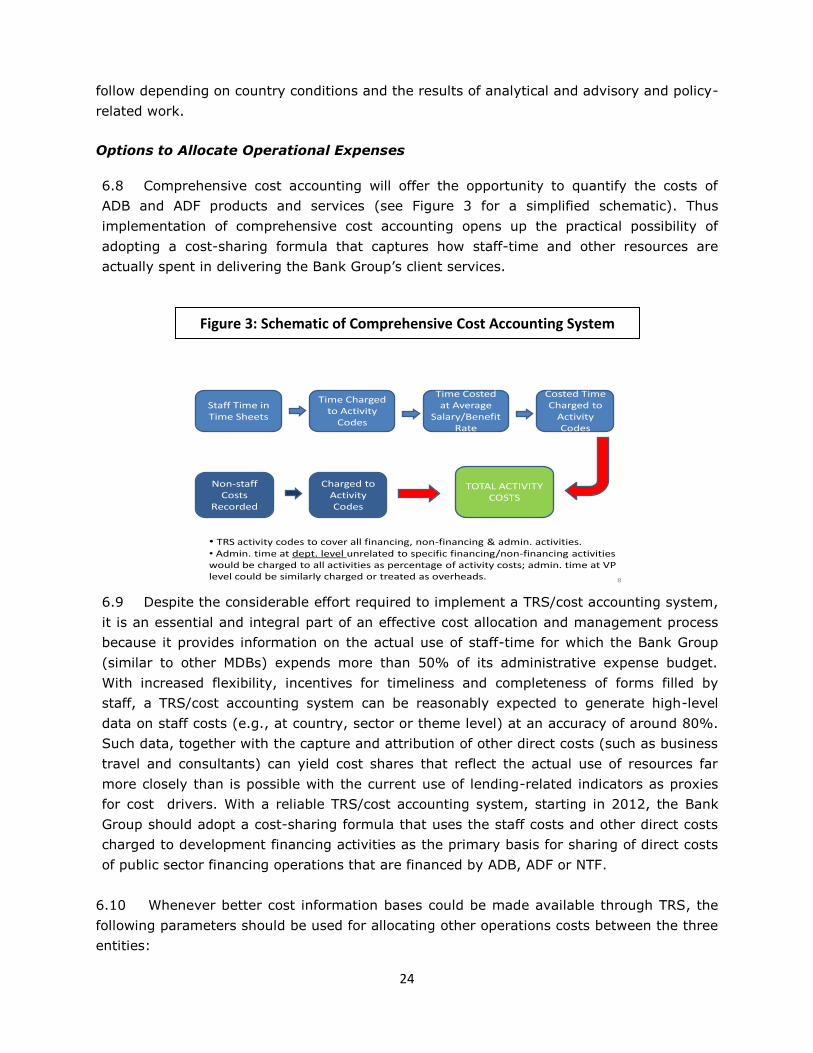
6.8 Comprehensive cost accounting will offer the opportunity to quantify the costs of
ADB and ADF products and services (see Figure 3 for a simplified schematic). Thus
implementation of comprehensive cost accounting opens up the practical possibility of
adopting a cost-sharing formula that captures how staff-time and other resources are
actually spent in delivering the Bank Group’s client services.
Staff Time in Time Sheets
Time Charged to Activity
Codes
Time Costed at Average
Salary/Benefit Rate
Costed Time Charged to
Activity Codes
Non-staff Costs
Recorded
Charged to Activity Codes
TOTAL ACTIVITY COSTS
• TRS activity codes to cover all financing, non-financing & admin. activities.• Admin. time at dept. level unrelated to specific financing/non-financing activities would be charged to all activities as percentage of activity costs; admin. time at VP level could be similarly charged or treated as overheads. 8
6.9 Despite the considerable effort required to implement a TRS/cost accounting system,
it is an essential and integral part of an effective cost allocation and management process
because it provides information on the actual use of staff-time for which the Bank Group
(similar to other MDBs) expends more than 50% of its administrative expense budget.
With increased flexibility, incentives for timeliness and completeness of forms filled by
staff, a TRS/cost accounting system can be reasonably expected to generate high-level
data on staff costs (e.g., at country, sector or theme level) at an accuracy of around 80%.
Such data, together with the capture and attribution of other direct costs (such as business
travel and consultants) can yield cost shares that reflect the actual use of resources far
more closely than is possible with the current use of lending-related indicators as proxies
for cost drivers. With a reliable TRS/cost accounting system, starting in 2012, the Bank
Group should adopt a cost-sharing formula that uses the staff costs and other direct costs
charged to development financing activities as the primary basis for sharing of direct costs
of public sector financing operations that are financed by ADB, ADF or NTF.
6.10 Whenever better cost information bases could be made available through TRS, the
following parameters should be used for allocating other operations costs between the three
entities:
Figure 3: Schematic of Comprehensive Cost Accounting System
Figure 5: Schematic of Required Cost Accounting System
25
Direct costs of public sector financing activities that are financed by more
than one window should be shared between ADB, ADF and NTF according to the
ratio of the amount of financing by each window.
Direct costs of private sector financing from the ADB window in all countries
should be fully charged to ADB, as it is currently the sole financing window for these
operations.
Direct costs of non-financing activities12 should be allocated—to the extent
possible—based on the financing window involved; an example would be the costs of
studies related to the private sector, which would be fully charged to ADB.
For non-financing activities of ORVP, OIVP and OSVP not financed by a
specific window, the direct costs should be allocated between ADB, ADF and NTF
according to their shares of the total direct costs of all other activities (both public
and private sector); the rationale for such allocation is that those non-financing
activities that cannot be identified with a specific window benefit all other activities
funded by the three windows according to their scale, as measured by their direct
costs.
Indirect costs of ORVP, OIVP and OSVP, e.g., management costs in Operations
Departments (including Field Offices) and non-staff costs (e.g., office rent) of Field
Offices, should be allocated to ADB, ADF and NTF according to their shares of the
total direct costs of public and private sector activities, both financing and non-
financing. The rationale is that management activities and field office presence
benefit all work performed by the three Operations vice-presidencies.
Direct and indirect costs of ECON and OPEV that are not specifically
identifiable with and charged to ADB, ADF or NTF13 should be allocated between
the three windows on the same basis as the indirect costs of ORVP, OIVP and OSVP,
and for the same reason as stated above.
Allocation of Non-Operational Costs
Need for an Adequate Substitute to Relative Asset Size to Allocate Non-
Operational Expenses
6.11 The use of the relative asset sizes of the three entities to allocate non-operational
expenses under the current formula does not meet the test that cost allocation should be
based on clearly identifiable cost drivers. It may be argued that asset size (i.e., balance
sheet value) is an approximate indicator of the size of an institution and, therefore, its
volume of administrative expenses. However, given the dynamic and evolving profile of the
balance sheet, it becomes clear that values of assets do not drive most administrative
12
Non-financing activities would include (but may not be limited to): sector studies, analytical and advisory work, country dialogue, country strategies, country portfolio review, aid coordination, safeguards assessments, financial assessments, technical assessments and portfolio assessments. 13
An example of specifically identifiable costs would be those incurred for an EADI course or OPEV review that exclusively addresses the private sector (i.e., ADB-specific) or fragile states (ADF-specific).
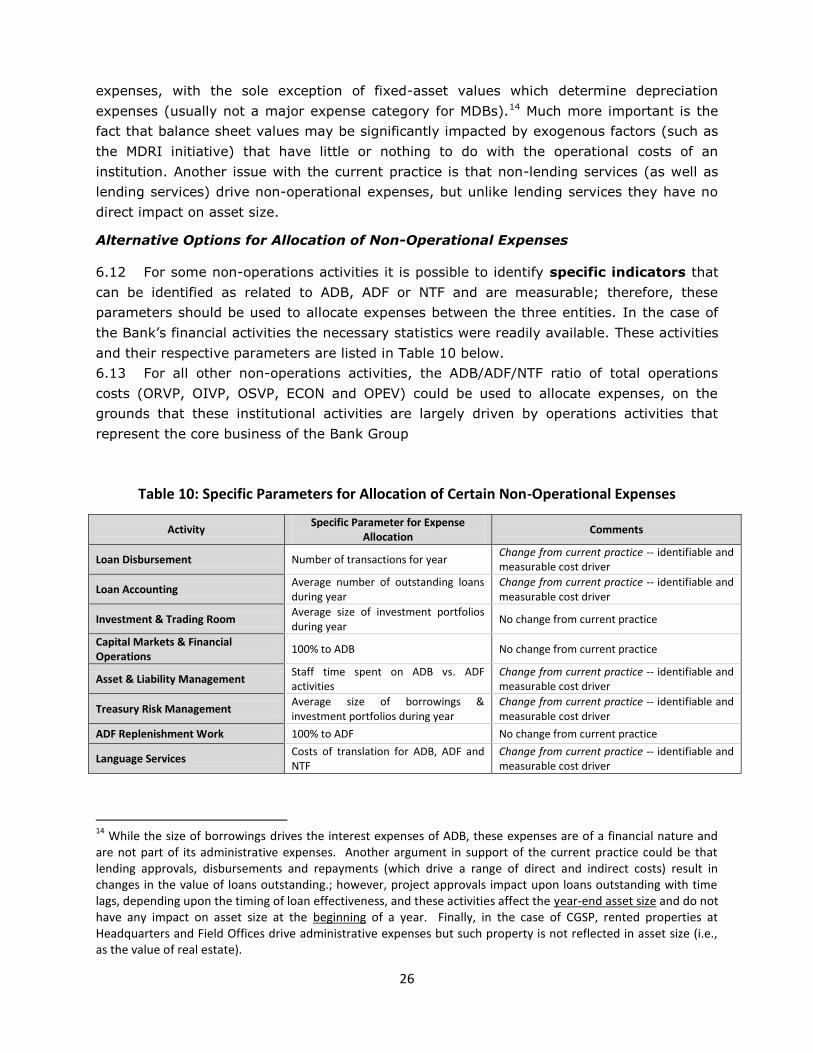
26
expenses, with the sole exception of fixed-asset values which determine depreciation
expenses (usually not a major expense category for MDBs).14 Much more important is the
fact that balance sheet values may be significantly impacted by exogenous factors (such as
the MDRI initiative) that have little or nothing to do with the operational costs of an
institution. Another issue with the current practice is that non-lending services (as well as
lending services) drive non-operational expenses, but unlike lending services they have no
direct impact on asset size.
Alternative Options for Allocation of Non-Operational Expenses
6.12 For some non-operations activities it is possible to identify specific indicators that
can be identified as related to ADB, ADF or NTF and are measurable; therefore, these
parameters should be used to allocate expenses between the three entities. In the case of
the Bank’s financial activities the necessary statistics were readily available. These activities
and their respective parameters are listed in Table 10 below.
6.13 For all other non-operations activities, the ADB/ADF/NTF ratio of total operations
costs (ORVP, OIVP, OSVP, ECON and OPEV) could be used to allocate expenses, on the
grounds that these institutional activities are largely driven by operations activities that
represent the core business of the Bank Group
Table 10: Specific Parameters for Allocation of Certain Non-Operational Expenses
Activity Specific Parameter for Expense
Allocation Comments
Loan Disbursement Number of transactions for year Change from current practice -- identifiable and measurable cost driver
Loan Accounting Average number of outstanding loans during year
Change from current practice -- identifiable and measurable cost driver
Investment & Trading Room Average size of investment portfolios during year
No change from current practice
Capital Markets & Financial Operations
100% to ADB No change from current practice
Asset & Liability Management Staff time spent on ADB vs. ADF activities
Change from current practice -- identifiable and measurable cost driver
Treasury Risk Management Average size of borrowings & investment portfolios during year
Change from current practice -- identifiable and measurable cost driver
ADF Replenishment Work 100% to ADF No change from current practice
Language Services Costs of translation for ADB, ADF and NTF
Change from current practice -- identifiable and measurable cost driver
14
While the size of borrowings drives the interest expenses of ADB, these expenses are of a financial nature and are not part of its administrative expenses. Another argument in support of the current practice could be that lending approvals, disbursements and repayments (which drive a range of direct and indirect costs) result in changes in the value of loans outstanding.; however, project approvals impact upon loans outstanding with time lags, depending upon the timing of loan effectiveness, and these activities affect the year-end asset size and do not have any impact on asset size at the beginning of a year. Finally, in the case of CGSP, rented properties at Headquarters and Field Offices drive administrative expenses but such property is not reflected in asset size (i.e., as the value of real estate).
27
VII. IMPACT OF THE REVIEW ON THE BANK GROUP INSTITUTIONS
Impact on ADB
7.1 As indicated in Table 9 above, the review of the Bank Group’s cost-sharing formula
will result in a marginal increase of 3.8% in ADB cost share, from 27.4% to 31.2%. Applying
such increase to the Bank Group’s administrative budget for the year 2010 of UA 264 million
will result in an increase in ADB administrative expenses of UA 10 million. This represents an
increase of 14% on ADB 2010 budgeted administrative expense of UA 72 million. When
translated into equivalent spread this would correspond to around 5 basis points
7.2 Cost containment efforts and effective management of budget pressure areas
through savings and efficiency gains could offset this increase so that it would not be
reflected as an increase in the lending spread. In the worst case scenario the cost implication
will not be automatically passed through to borrowers, in line with commitments made in the
sovereign pricing discussions15 to fully cover administrative expenses by 2013.
7.3 The increase in ADB administrative expense is expected to represent 5% of its
projected allocable income16 of UA 194 million for the year 2010. Such increase will impact
marginally the Bank’s capacity to transfer resources to reserves or development initiatives for
the year 2010. This increase will also have a negligible impact on the Bank’s financial
strength, as the projected risk capital of UA 4,735 million for the year 2010 will only decrease
by 0.21%.
Impact on ADF
7.4 The proposed fine-tuning of the Bank Group’s cost-sharing formula would result in a
decrease of approximately UA 10 million in ADF administrative expenses. Such improvement
in annual internal resources would increase the Fund’s commitment capacity substantially (to
the tune of approximately UA 77 million) during the next replenishment period.
Impact on NTF
7.5 With regard to the NTF, the review will result in a very marginal increase in its cost
share by 0.1%. However, given that NTF expenses are capped at 20% of its gross income
with ADB assuming any residual expenses, the proposed change in methodology will have
no impact on NTF financial statements.
15
ADB/BD/WP/2010/15 rev.1: Proposal for revised loan pricing for sovereign and sovereign guaranteed operations 16
The allocable net income excludes the fair valuation of borrowings and derivatives and is based financial
projections as of September 2010.
28
VIII. CONCLUSIONS
8.1 The review of the Bank Group’s cost sharing formula and cost allocation practices of
comparable institutions indicates that there is no perfect method. An appropriate cost-
sharing formula permits a reasonable allocation of shared expenses, in response to the
statutory requirements and shall comply with general cost allocation principles.
8.2 The review concluded that the current formula produced results that are reasonable
overall when compared with the external benchmarks provided by other MDBs and when
examined in the context of the lending volumes, average loan sizes and active portfolios of
ADB and ADF. At the same time, the review has identified opportunities for improvements
that can be made in the short-term, starting with the cost allocation for 2010. These
improvements would produce cost shares which better take into account the factors that
drive the costs of the Bank Group, consistent with the evolution in the businesses of the
Bank Group.
8.3 In this regard, Management is making the following recommendations:
Short Term Adjustments
i. Revised weights of 50% should be applied to loans in the active portfolio,
ii. Revised weights should be applied to project-financing grants (same weights as
project loans for approvals and for the portfolio under execution) and technical
assistance grants/loans (50% for approvals and 30% for the active portfolio); for
this purpose, a single operation should be recorded as a loan where a country
benefits from both a loan and a grant for the same project;
iii. Costs related to private sector operations should be directly allocated to the ADB
window; and
iv. 50% weight should be applied to MDRI assets as they require a lower administration
effort compared to regular loans, and exclusion of HIPCs assets; and
v. Inactive loans eligible for cancellation (i.e. loans and grants that remain unsigned for
more than 12 months) should be excluded from the cost sharing formula.
Periodic Review of the Cost-Sharing Formula
The Bank Group should also periodically (every 3 years) review the cost-sharing formula to
assess its continued relevance in the context of the business activities of the Group.
Longer-Term Adjustments
i. The Bank Group should leverage upon the time recording and comprehensive cost
accounting systems being implemented in 2010, to adopt a cost-sharing formula that
captures how staff-time and other resources are actually spent in delivering the Bank
Group’s client services.
ii. Where feasible, specific indicators should be used to allocate non-operational
expenses; for all other non-operational expenses, the allocation ratio of operational
expenses based on cost accounting would also provide the parameter for allocation
of non-operational expenses.
1
Annex 1
Comparator MDBs’ Practices
Questionnaires were sent to ASDB, EBRD, EIB, IADB and WB, with the objective of learning about their cost-sharing methodologies and reviewing their applicability to the Bank Group. The EBRD and EIB indicated that they do not have concessional funding windows. Below are summaries of their cost-sharing methodologies and the implications for the Bank Group. While this information is useful for reference, the comparator MDBs’ practices do not offer practical solutions that would improve the current cost-sharing formula of the Bank Group.
Asian Development Bank:
A 3-year moving average of the total number of loans approved for the market-based (MW) and concessional funding (CW) windows is used to allocate administrative expenses. Each regional operations department’s expenses are allocated based on the 3-year moving average of the total number of loans approved for that department. All other administrative expenses are allocated based on the overall 3-year moving average of total number of loans approved for MW and CW after deducting the income/fees earned for the administration of trust funds. Some specific cost centers such as the Funding Division of Treasury and Private Sector Operations Department are 100% charged to MW. The Investment Division of Treasury cost center is allocated based on the average investment portfolio for MW and CW, and the Office of Risk Management cost center allocation ratio is 95% to 5% between MW and CW.
Although the AsDB uses a 3-year moving average of the number of loans approved, this cost-sharing formula has limitations similar to those of the Bank Group’s current formula, with regard to the exclusive use of lending-related indicators.
Inter-American Development Bank:
Under its Multilateral Debt Relief and Concessional Finance Reform initiative, IADB switched in 2008 from a time-recording data-based cost allocation to specific (and declining) percentages of administrative expense allocations to its CW. The purpose of this change was to increase resources for heavily indebted poor member countries. The IADB approach to cost-sharing is a top-down cap governed by its objective of augmenting resources for its CW-funded member countries and, as such, it is not considered germane to this review.
World Bank (IBRD/IDA):
The WB uses a time recording (TRS) data-based cost-allocation formula that was implemented in 2002 and has been subject to periodic reviews and refinements since then. The basic parameter used for allocating the costs of operations activities is the country-specific costs of MW and CW as recorded in the TRS/cost accounting system. Specific indicators are used for
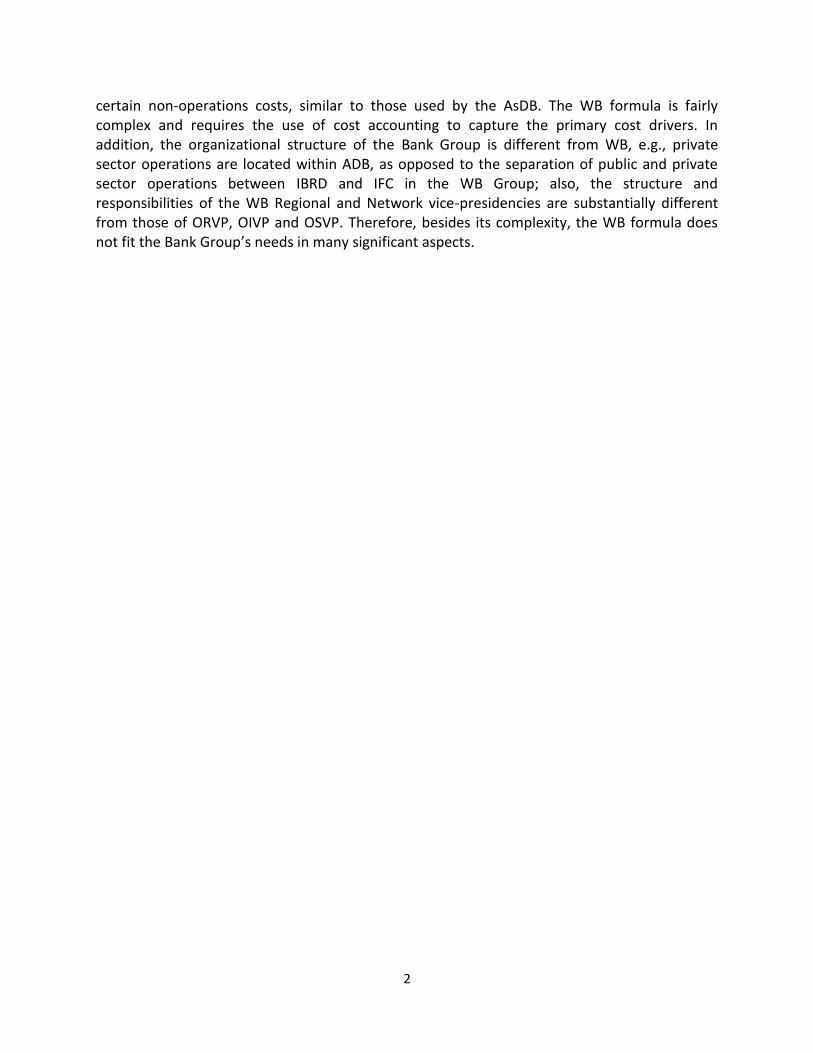
2
certain non-operations costs, similar to those used by the AsDB. The WB formula is fairly complex and requires the use of cost accounting to capture the primary cost drivers. In addition, the organizational structure of the Bank Group is different from WB, e.g., private sector operations are located within ADB, as opposed to the separation of public and private sector operations between IBRD and IFC in the WB Group; also, the structure and responsibilities of the WB Regional and Network vice-presidencies are substantially different from those of ORVP, OIVP and OSVP. Therefore, besides its complexity, the WB formula does not fit the Bank Group’s needs in many significant aspects.
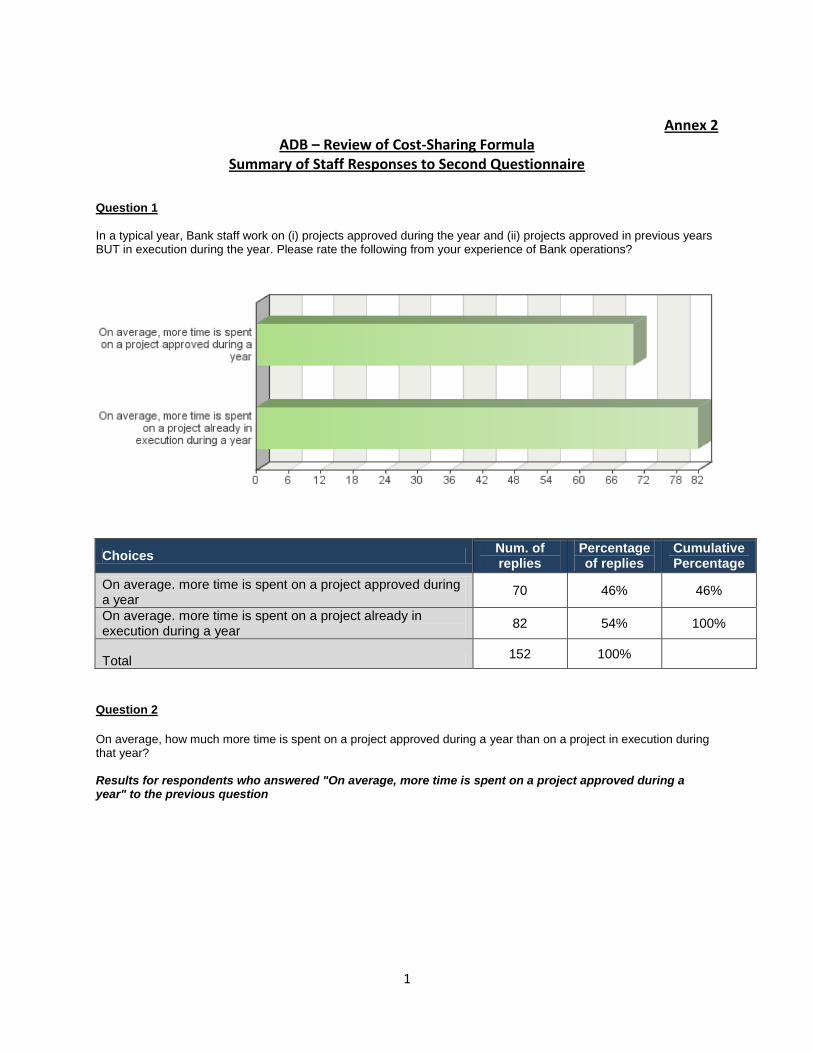
1
Annex 2
ADB – Review of Cost-Sharing Formula Summary of Staff Responses to Second Questionnaire
Question 1
In a typical year, Bank staff work on (i) projects approved during the year and (ii) projects approved in previous years BUT in execution during the year. Please rate the following from your experience of Bank operations?
Choices Num. of replies
Percentage of replies
Cumulative Percentage
On average. more time is spent on a project approved during a year
70 46% 46%
On average. more time is spent on a project already in execution during a year
82 54% 100%
Total 152 100%
Question 2
On average, how much more time is spent on a project approved during a year than on a project in execution during that year? Results for respondents who answered "On average, more time is spent on a project approved during a year" to the previous question
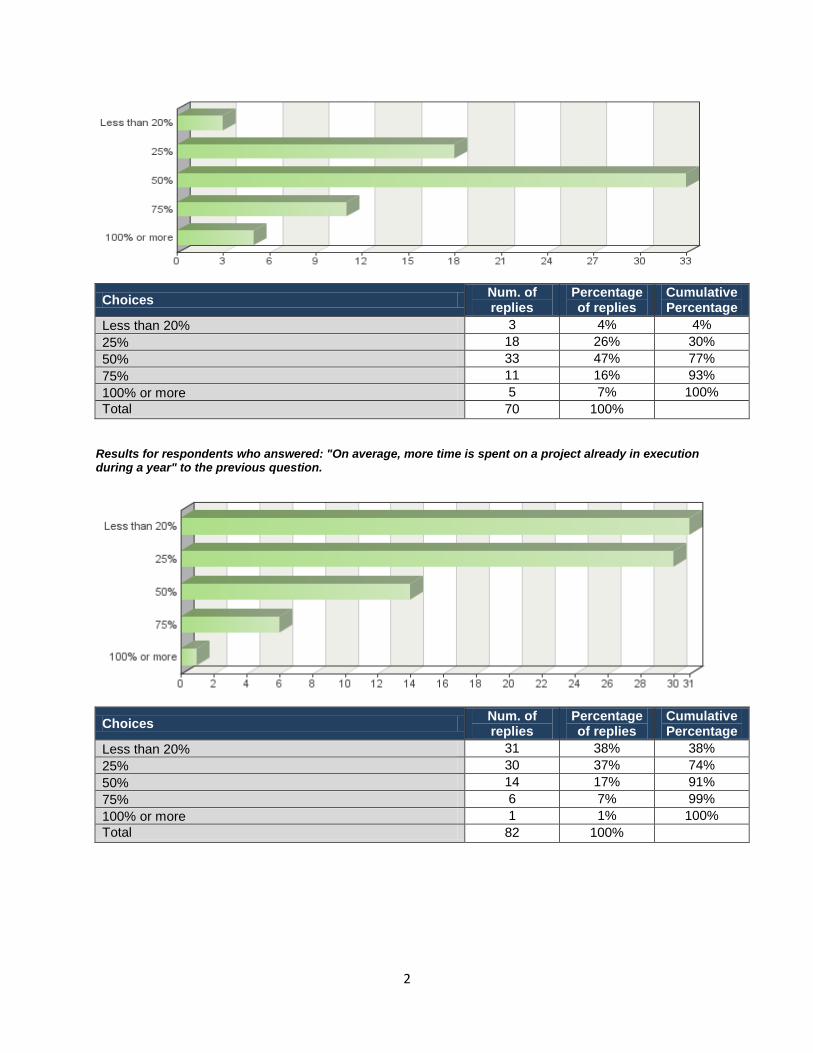
2
Choices Num. of replies
Percentage of replies
Cumulative Percentage
Less than 20% 3 4% 4%
25% 18 26% 30%
50% 33 47% 77%
75% 11 16% 93%
100% or more 5 7% 100%
Total 70 100%
Results for respondents who answered: "On average, more time is spent on a project already in execution during a year" to the previous question.
Choices Num. of replies
Percentage of replies
Cumulative Percentage
Less than 20% 31 38% 38%
25% 30 37% 74%
50% 14 17% 91%
75% 6 7% 99%
100% or more 1 1% 100%
Total 82 100%
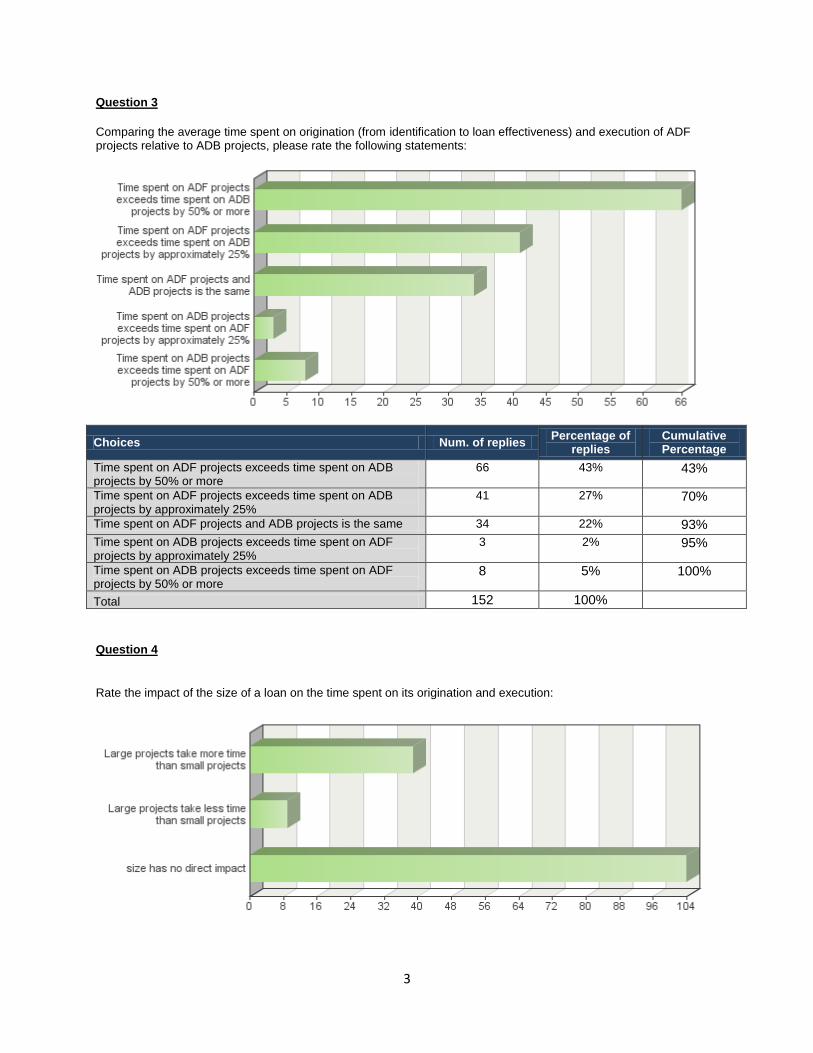
3
Question 3
Comparing the average time spent on origination (from identification to loan effectiveness) and execution of ADF projects relative to ADB projects, please rate the following statements:
Choices Num. of replies Percentage of
replies Cumulative Percentage
Time spent on ADF projects exceeds time spent on ADB projects by 50% or more
66 43% 43%
Time spent on ADF projects exceeds time spent on ADB projects by approximately 25%
41 27% 70%
Time spent on ADF projects and ADB projects is the same 34 22% 93%
Time spent on ADB projects exceeds time spent on ADF projects by approximately 25%
3 2% 95%
Time spent on ADB projects exceeds time spent on ADF projects by 50% or more
8 5% 100%
Total 152 100%
Question 4
Rate the impact of the size of a loan on the time spent on its origination and execution:
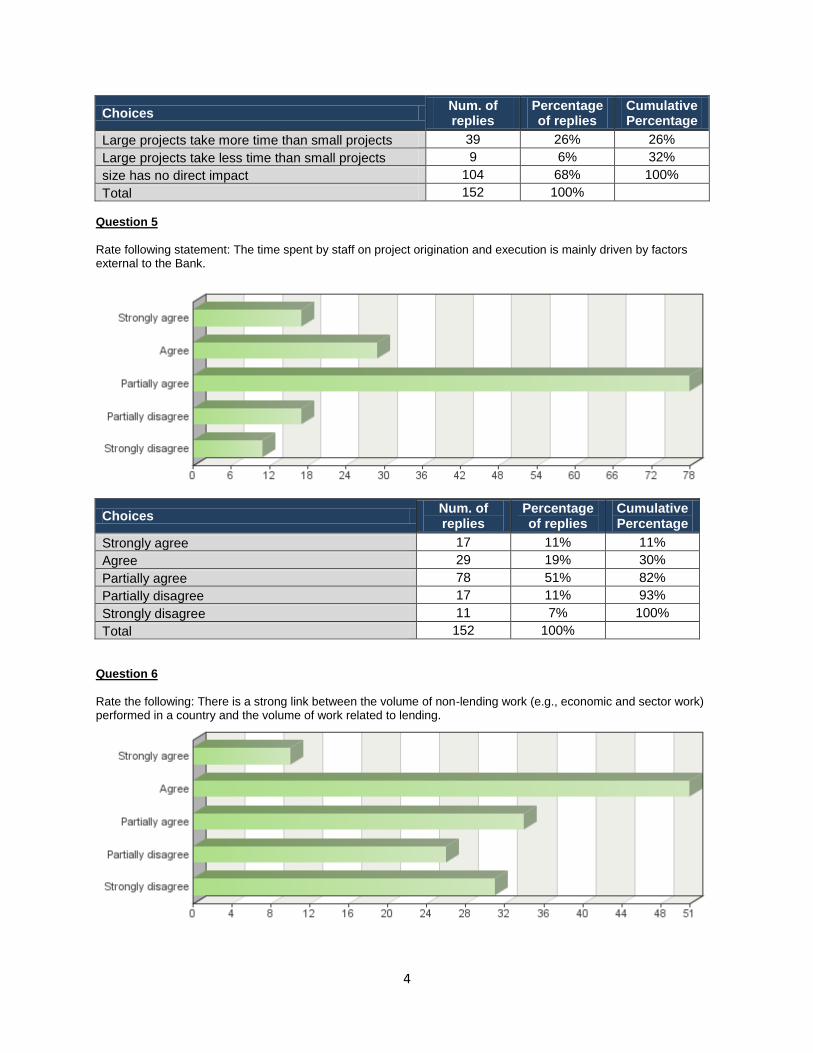
4
Choices Num. of replies
Percentage of replies
Cumulative Percentage
Large projects take more time than small projects 39 26% 26%
Large projects take less time than small projects 9 6% 32%
size has no direct impact 104 68% 100%
Total 152 100% Question 5
Rate following statement: The time spent by staff on project origination and execution is mainly driven by factors external to the Bank.
Choices Num. of replies
Percentage of replies
Cumulative Percentage
Strongly agree 17 11% 11%
Agree 29 19% 30%
Partially agree 78 51% 82%
Partially disagree 17 11% 93%
Strongly disagree 11 7% 100%
Total 152 100% Question 6
Rate the following: There is a strong link between the volume of non-lending work (e.g., economic and sector work) performed in a country and the volume of work related to lending.
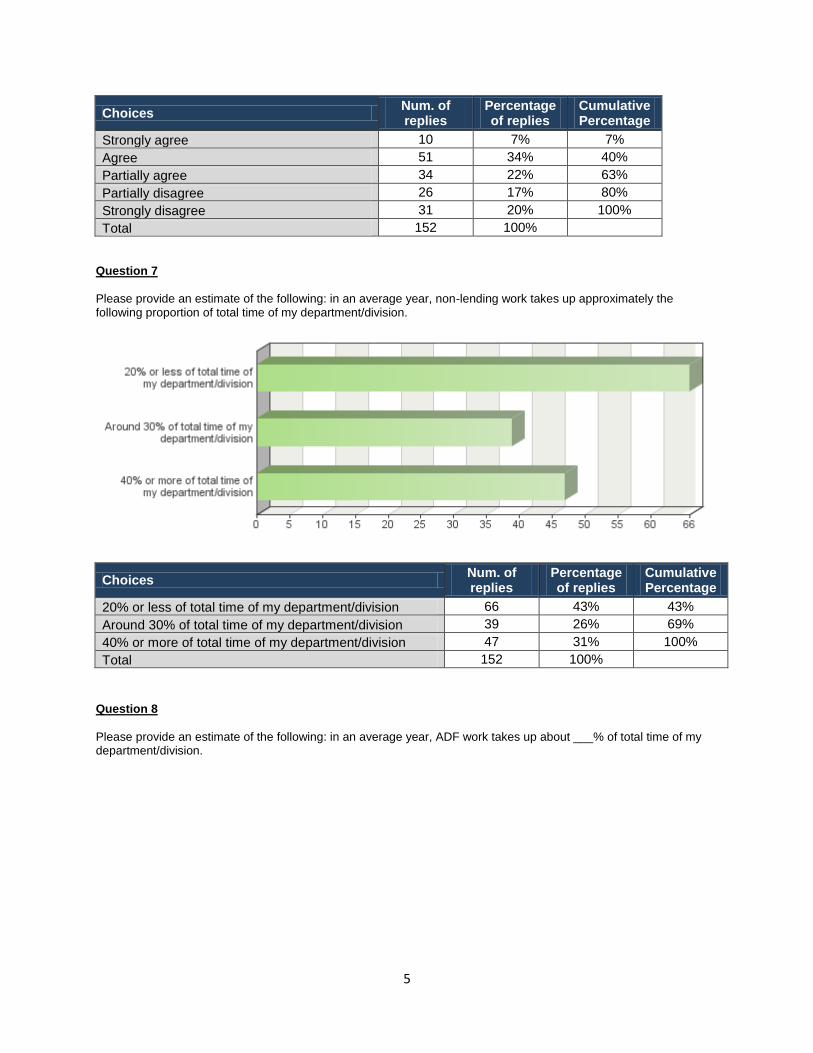
5
Choices Num. of replies
Percentage of replies
Cumulative Percentage
Strongly agree 10 7% 7%
Agree 51 34% 40%
Partially agree 34 22% 63%
Partially disagree 26 17% 80%
Strongly disagree 31 20% 100%
Total 152 100% Question 7
Please provide an estimate of the following: in an average year, non-lending work takes up approximately the following proportion of total time of my department/division.
Choices Num. of replies
Percentage of replies
Cumulative Percentage
20% or less of total time of my department/division 66 43% 43%
Around 30% of total time of my department/division 39 26% 69%
40% or more of total time of my department/division 47 31% 100%
Total 152 100%
Question 8
Please provide an estimate of the following: in an average year, ADF work takes up about ___% of total time of my department/division.
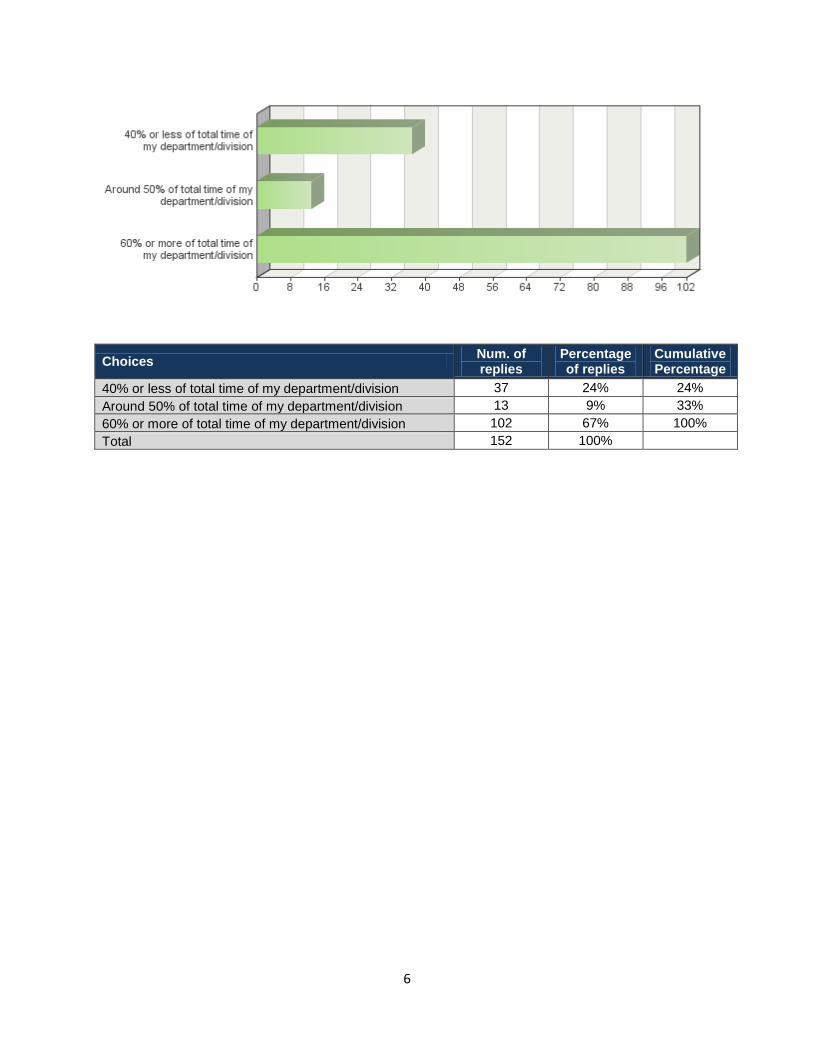
6
Choices Num. of replies
Percentage of replies
Cumulative Percentage
40% or less of total time of my department/division 37 24% 24%
Around 50% of total time of my department/division 13 9% 33%
60% or more of total time of my department/division 102 67% 100%
Total 152 100%
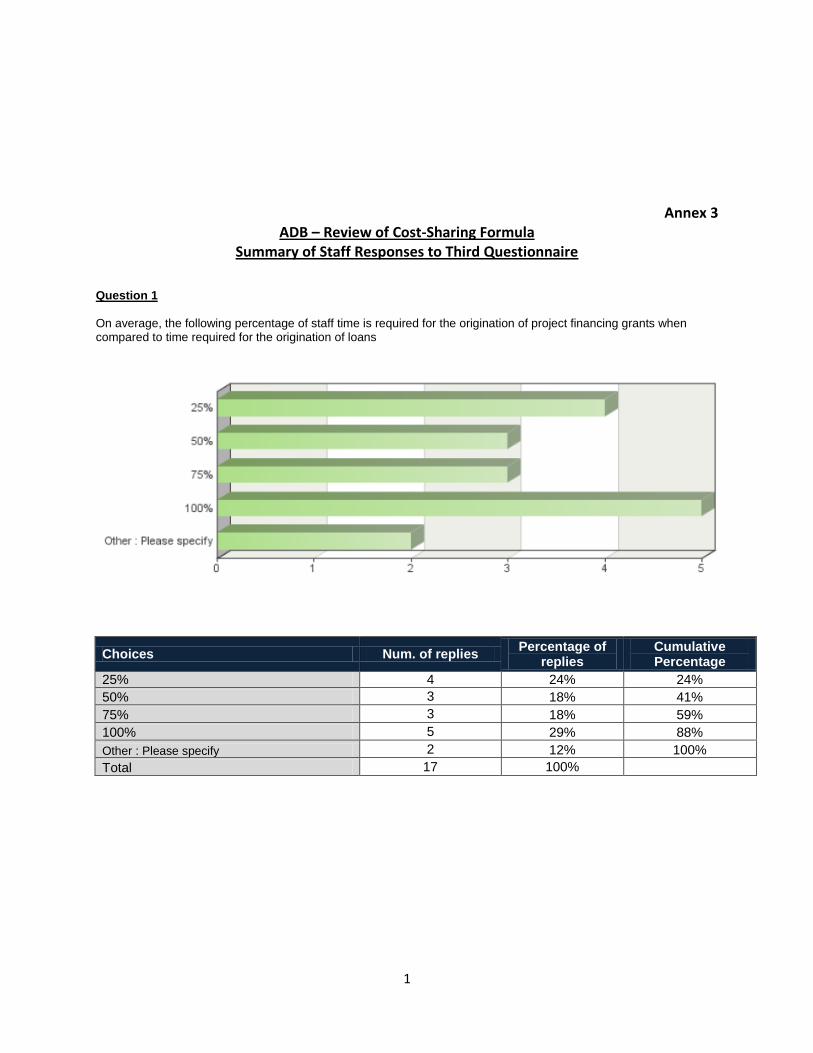
1
Annex 3 ADB – Review of Cost-Sharing Formula
Summary of Staff Responses to Third Questionnaire Question 1
On average, the following percentage of staff time is required for the origination of project financing grants when compared to time required for the origination of loans
Choices Num. of replies Percentage of
replies Cumulative Percentage
25% 4 24% 24%
50% 3 18% 41%
75% 3 18% 59%
100% 5 29% 88%
Other : Please specify 2 12% 100%
Total 17 100%
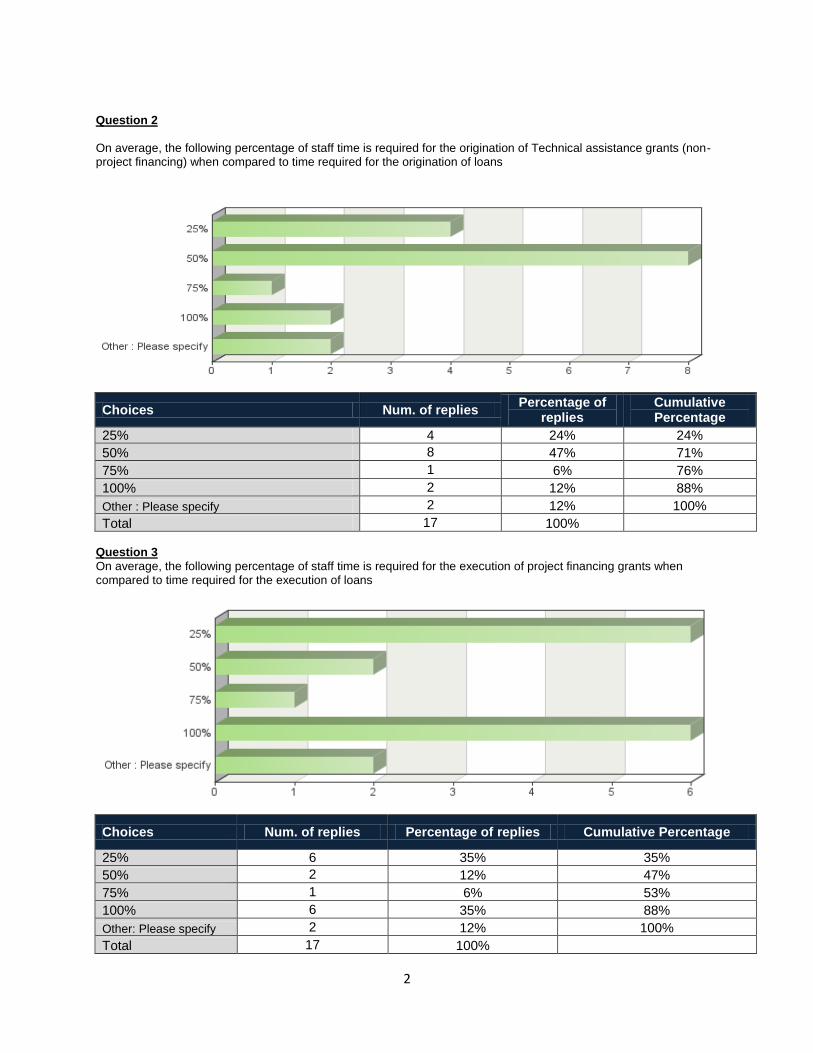
2
Question 2
On average, the following percentage of staff time is required for the origination of Technical assistance grants (non-project financing) when compared to time required for the origination of loans
Choices Num. of replies Percentage of
replies Cumulative Percentage
25% 4 24% 24%
50% 8 47% 71%
75% 1 6% 76%
100% 2 12% 88%
Other : Please specify 2 12% 100%
Total 17 100% Question 3
On average, the following percentage of staff time is required for the execution of project financing grants when compared to time required for the execution of loans
Choices Num. of replies Percentage of replies Cumulative Percentage
25% 6 35% 35%
50% 2 12% 47%
75% 1 6% 53%
100% 6 35% 88%
Other: Please specify 2 12% 100%
Total 17 100%
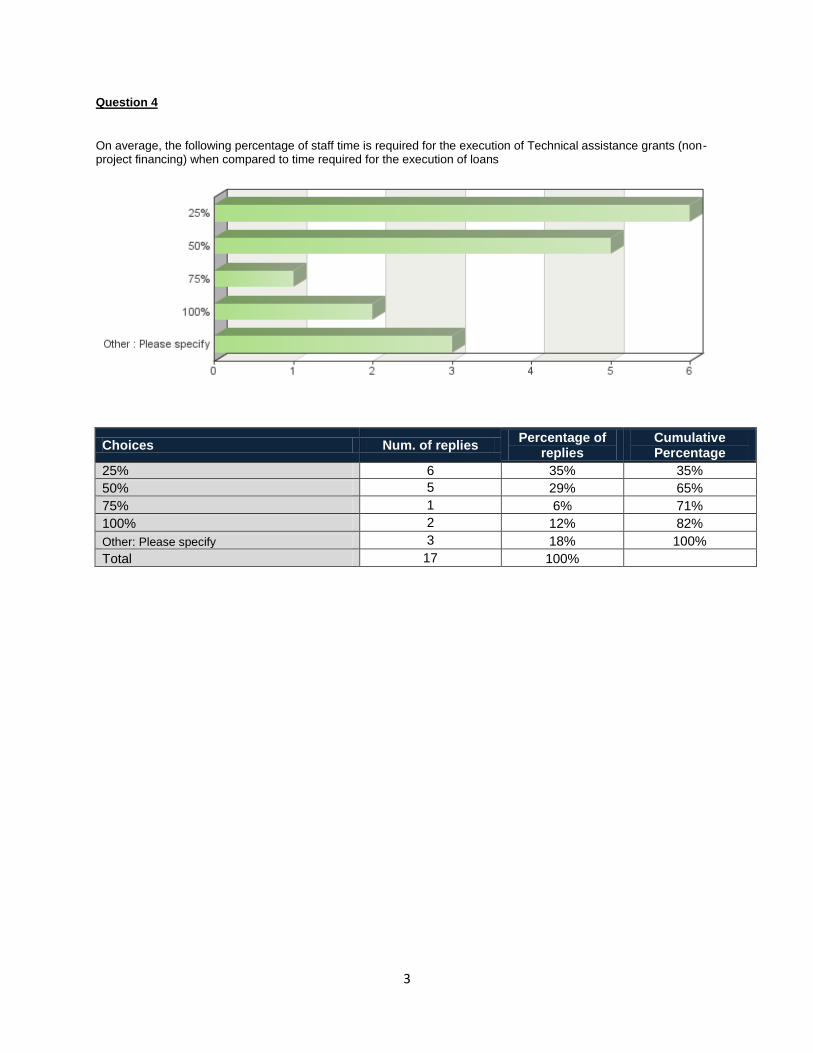
3
Question 4
On average, the following percentage of staff time is required for the execution of Technical assistance grants (non-project financing) when compared to time required for the execution of loans
Choices Num. of replies Percentage of
replies Cumulative Percentage
25% 6 35% 35%
50% 5 29% 65%
75% 1 6% 71%
100% 2 12% 82%
Other: Please specify 3 18% 100%
Total 17 100%
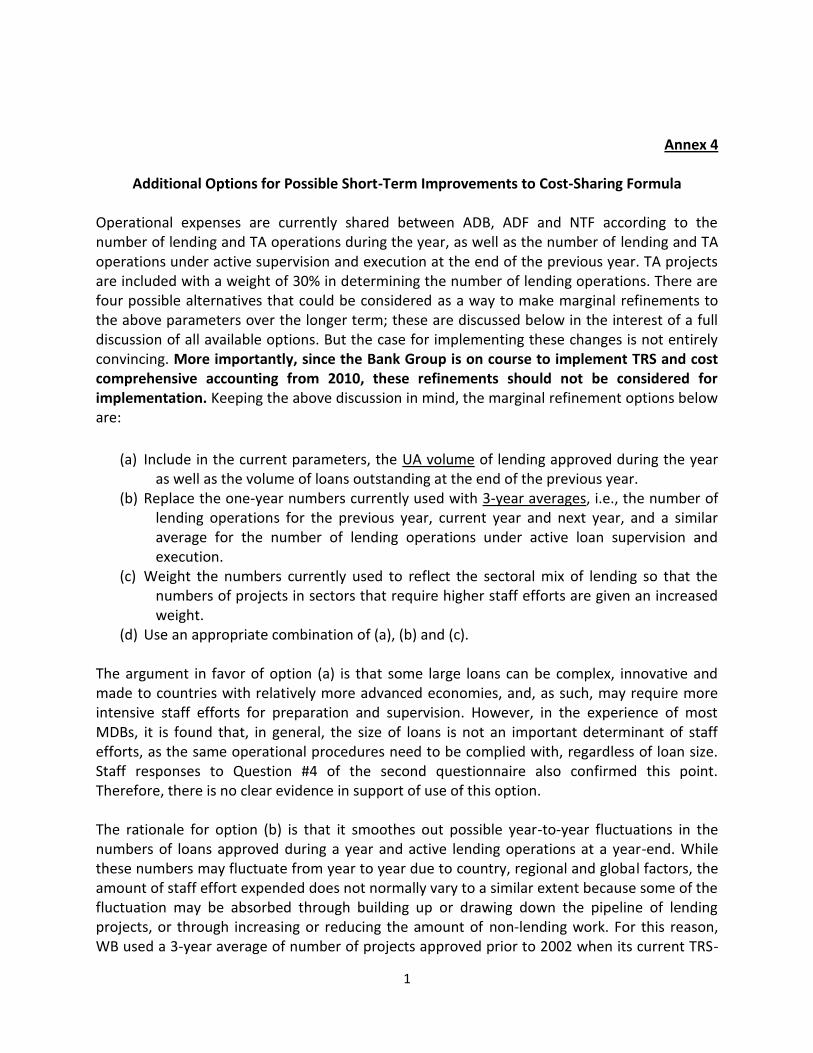
1
Annex 4
Additional Options for Possible Short-Term Improvements to Cost-Sharing Formula Operational expenses are currently shared between ADB, ADF and NTF according to the number of lending and TA operations during the year, as well as the number of lending and TA operations under active supervision and execution at the end of the previous year. TA projects are included with a weight of 30% in determining the number of lending operations. There are four possible alternatives that could be considered as a way to make marginal refinements to the above parameters over the longer term; these are discussed below in the interest of a full discussion of all available options. But the case for implementing these changes is not entirely convincing. More importantly, since the Bank Group is on course to implement TRS and cost comprehensive accounting from 2010, these refinements should not be considered for implementation. Keeping the above discussion in mind, the marginal refinement options below are:
(a) Include in the current parameters, the UA volume of lending approved during the year as well as the volume of loans outstanding at the end of the previous year.
(b) Replace the one-year numbers currently used with 3-year averages, i.e., the number of lending operations for the previous year, current year and next year, and a similar average for the number of lending operations under active loan supervision and execution.
(c) Weight the numbers currently used to reflect the sectoral mix of lending so that the numbers of projects in sectors that require higher staff efforts are given an increased weight.
(d) Use an appropriate combination of (a), (b) and (c). The argument in favor of option (a) is that some large loans can be complex, innovative and made to countries with relatively more advanced economies, and, as such, may require more intensive staff efforts for preparation and supervision. However, in the experience of most MDBs, it is found that, in general, the size of loans is not an important determinant of staff efforts, as the same operational procedures need to be complied with, regardless of loan size. Staff responses to Question #4 of the second questionnaire also confirmed this point. Therefore, there is no clear evidence in support of use of this option. The rationale for option (b) is that it smoothes out possible year-to-year fluctuations in the numbers of loans approved during a year and active lending operations at a year-end. While these numbers may fluctuate from year to year due to country, regional and global factors, the amount of staff effort expended does not normally vary to a similar extent because some of the fluctuation may be absorbed through building up or drawing down the pipeline of lending projects, or through increasing or reducing the amount of non-lending work. For this reason, WB used a 3-year average of number of projects approved prior to 2002 when its current TRS-
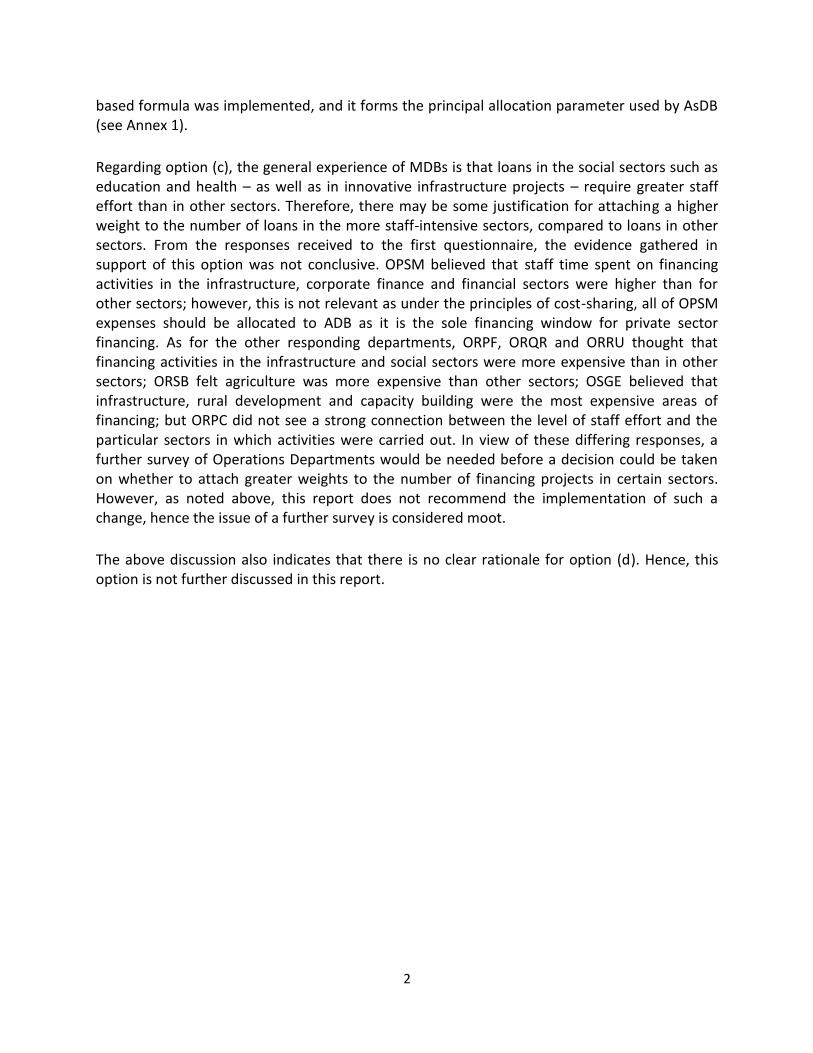
2
based formula was implemented, and it forms the principal allocation parameter used by AsDB (see Annex 1).
Regarding option (c), the general experience of MDBs is that loans in the social sectors such as education and health – as well as in innovative infrastructure projects – require greater staff effort than in other sectors. Therefore, there may be some justification for attaching a higher weight to the number of loans in the more staff-intensive sectors, compared to loans in other sectors. From the responses received to the first questionnaire, the evidence gathered in support of this option was not conclusive. OPSM believed that staff time spent on financing activities in the infrastructure, corporate finance and financial sectors were higher than for other sectors; however, this is not relevant as under the principles of cost-sharing, all of OPSM expenses should be allocated to ADB as it is the sole financing window for private sector financing. As for the other responding departments, ORPF, ORQR and ORRU thought that financing activities in the infrastructure and social sectors were more expensive than in other sectors; ORSB felt agriculture was more expensive than other sectors; OSGE believed that infrastructure, rural development and capacity building were the most expensive areas of financing; but ORPC did not see a strong connection between the level of staff effort and the particular sectors in which activities were carried out. In view of these differing responses, a further survey of Operations Departments would be needed before a decision could be taken on whether to attach greater weights to the number of financing projects in certain sectors. However, as noted above, this report does not recommend the implementation of such a change, hence the issue of a further survey is considered moot.
The above discussion also indicates that there is no clear rationale for option (d). Hence, this option is not further discussed in this report.
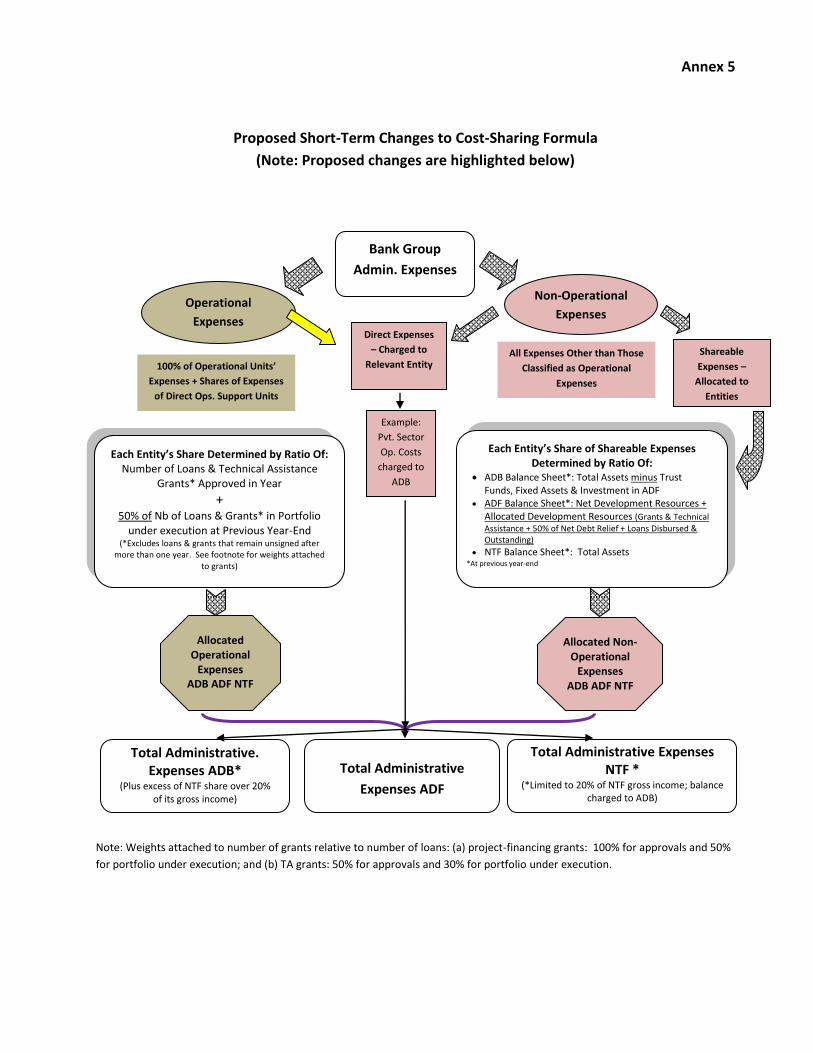
Annex 5
Proposed Short-Term Changes to Cost-Sharing Formula
(Note: Proposed changes are highlighted below)
Note: Weights attached to number of grants relative to number of loans: (a) project-financing grants: 100% for approvals and 50%
for portfolio under execution; and (b) TA grants: 50% for approvals and 30% for portfolio under execution.
Bank Group
Admin. Expenses
Operational
Expenses
Non-Operational
Expenses
100% of Operational Units’
Expenses + Shares of Expenses
of Direct Ops. Support Units
All Expenses Other than Those
Classified as Operational
Expenses
Each Entity’s Share Determined by Ratio Of: Number of Loans & Technical Assistance
Grants* Approved in Year
+ 50% of Nb of Loans & Grants* in Portfolio
under execution at Previous Year-End (*Excludes loans & grants that remain unsigned after
more than one year. See footnote for weights attached to grants)
Each Entity’s Share of Shareable Expenses Determined by Ratio Of:
ADB Balance Sheet*: Total Assets minus Trust Funds, Fixed Assets & Investment in ADF
ADF Balance Sheet*: Net Development Resources + Allocated Development Resources (Grants & Technical
Assistance + 50% of Net Debt Relief + Loans Disbursed & Outstanding)
NTF Balance Sheet*: Total Assets *At previous year-end
Allocated Operational
Expenses ADB ADF NTF
Allocated Non-Operational
Expenses ADB ADF NTF
Total Administrative. Expenses ADB*
(Plus excess of NTF share over 20% of its gross income)
Total Administrative
Expenses ADF
Total Administrative Expenses NTF *
(*Limited to 20% of NTF gross income; balance charged to ADB)
Direct Expenses
– Charged to
Relevant Entity Shareable
Expenses –
Allocated to
Entities
Example:
Pvt. Sector
Op. Costs
charged to
ADB
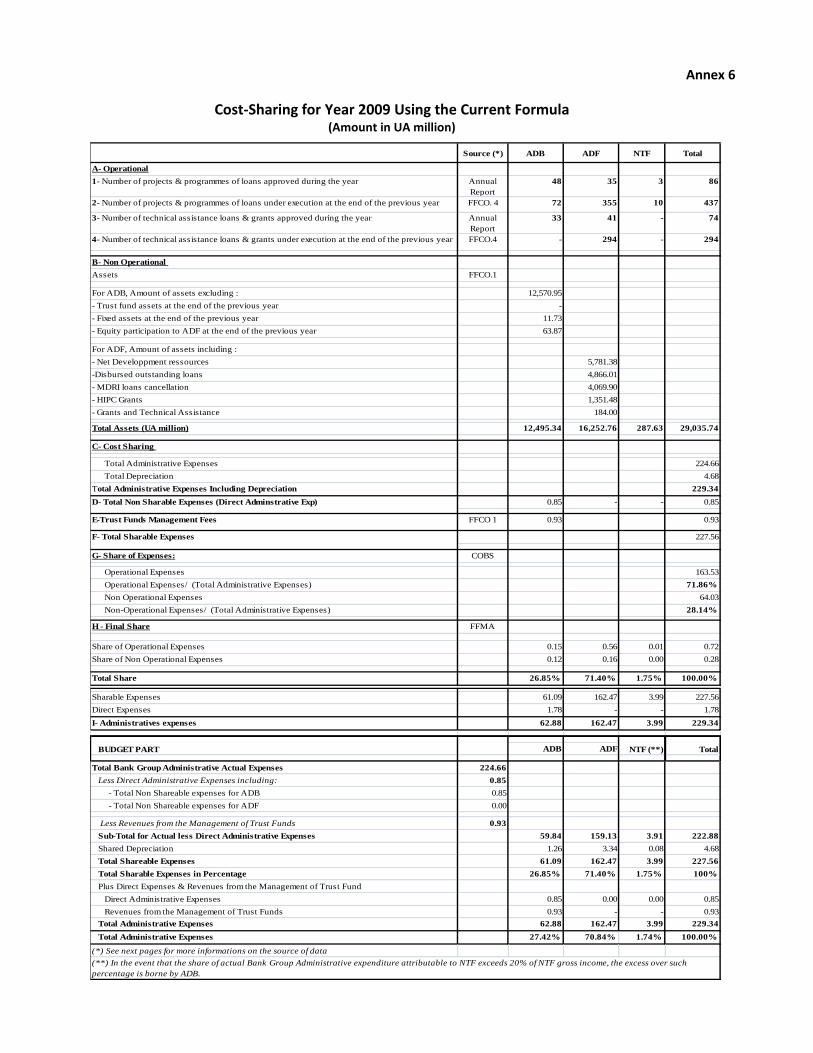
Annex 6
Cost-Sharing for Year 2009 Using the Current Formula (Amount in UA million)
Source (*) ADB ADF NTF Total
A- Operational
1- Number of projects & programmes of loans approved during the year Annual
Report
48 35 3 86
2- Number of projects & programmes of loans under execution at the end of the previous year FFCO. 4 72 355 10 437
3- Number of technical assistance loans & grants approved during the year Annual
Report
33 41 - 74
4- Number of technical assistance loans & grants under execution at the end of the previous year FFCO.4 - 294 - 294
B- Non Operational
Assets FFCO.1
For ADB, Amount of assets excluding : 12,570.95
- Trust fund assets at the end of the previous year -
- Fixed assets at the end of the previous year 11.73
- Equity participation to ADF at the end of the previous year 63.87
For ADF, Amount of assets including :
- Net Developpment ressources 5,781.38
-Disbursed outstanding loans 4,866.01
- MDRI loans cancellation 4,069.90
- HIPC Grants 1,351.48
- Grants and Technical Assistance 184.00
Total Assets (UA million) 12,495.34 16,252.76 287.63 29,035.74
C- Cost Sharing
Total Administrative Expenses 224.66
Total Depreciation 4.68
Total Administrative Expenses Including Depreciation 229.34
0.85 - - 0.85
E-Trust Funds Management Fees FFCO 1 0.93 0.93
227.56
G- Share of Expenses: COBS
Operational Expenses 163.53
Operational Expenses/ (Total Administrative Expenses) 71.86%
Non Operational Expenses 64.03
Non-Operational Expenses/ (Total Administrative Expenses) 28.14%
H - Final Share FFMA
Share of Operational Expenses 0.15 0.56 0.01 0.72
Share of Non Operational Expenses 0.12 0.16 0.00 0.28
Total Share 26.85% 71.40% 1.75% 100.00%
Sharable Expenses 61.09 162.47 3.99 227.56
Direct Expenses 1.78 - - 1.78
I- Administratives expenses 62.88 162.47 3.99 229.34
ADB ADF
Total Bank Group Administrative Actual Expenses 224.66
Less Direct Administrative Expenses including: 0.85
- Total Non Shareable expenses for ADB 0.85
- Total Non Shareable expenses for ADF 0.00
Less Revenues from the Management of Trust Funds 0.93
Sub-Total for Actual less Direct Administrative Expenses 59.84 159.13 3.91 222.88
Shared Depreciation 1.26 3.34 0.08 4.68
Total Shareable Expenses 61.09 162.47 3.99 227.56
Total Sharable Expenses in Percentage 26.85% 71.40% 1.75% 100%
Plus Direct Expenses & Revenues from the Management of Trust Fund
Direct Administrative Expenses 0.85 0.00 0.00 0.85
Revenues from the Management of Trust Funds 0.93 - - 0.93
Total Administrative Expenses 62.88 162.47 3.99 229.34
Total Administrative Expenses 27.42% 70.84% 1.74% 100.00%
(*) See next pages for more informations on the source of data
(**) In the event that the share of actual Bank Group Administrative expenditure attributable to NTF exceeds 20% of NTF gross income, the excess over such
percentage is borne by ADB.
D- Total Non Sharable Expenses (Direct Adminstrative Exp)
F- Total Sharable Expenses
BUDGET PART NTF (**) Total
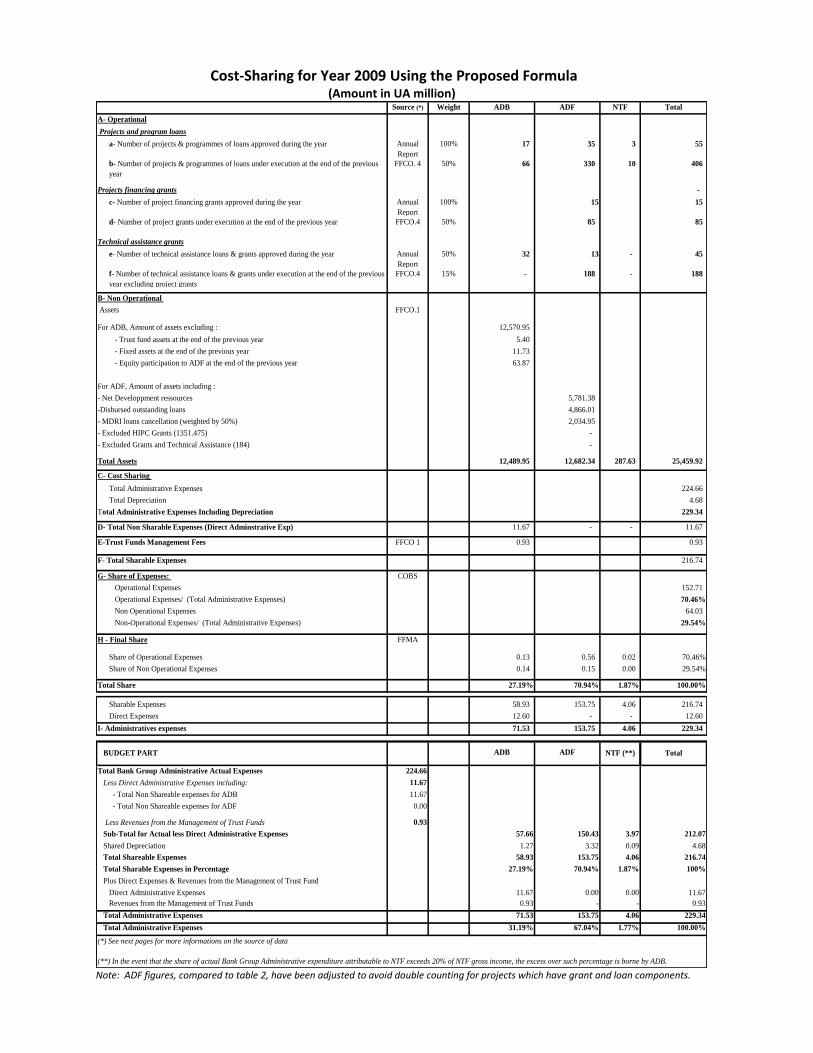
Cost-Sharing for Year 2009 Using the Proposed Formula (Amount in UA million)
Source (*) Weight ADB ADF NTF Total
A- Operational
Projects and program loans
a- Number of projects & programmes of loans approved during the year Annual
Report
100% 17 35 3 55
b- Number of projects & programmes of loans under execution at the end of the previous
year
FFCO. 4 50% 66 330 10 406
- Projects financing grants -
c- Number of project financing grants approved during the year Annual
Report
100% 15 15
d- Number of project grants under execution at the end of the previous year FFCO.4 50% 85 85
Technical assistance grants
e- Number of technical assistance loans & grants approved during the year Annual
Report
50% 32 13 - 45
f- Number of technical assistance loans & grants under execution at the end of the previous
year excluding project grants
FFCO.4 15% - 188 - 188
B- Non Operational
Assets FFCO.1
For ADB, Amount of assets excluding : 12,570.95
- Trust fund assets at the end of the previous year 5.40
- Fixed assets at the end of the previous year 11.73
- Equity participation to ADF at the end of the previous year 63.87
For ADF, Amount of assets including :
- Net Developpment ressources 5,781.38
-Disbursed outstanding loans 4,866.01
- MDRI loans cancellation (weighted by 50%) 2,034.95
- Excluded HIPC Grants (1351.475) -
- Excluded Grants and Technical Assistance (184) -
Total Assets 12,489.95 12,682.34 287.63 25,459.92
C- Cost Sharing
Total Administrative Expenses 224.66
Total Depreciation 4.68
Total Administrative Expenses Including Depreciation 229.34
11.67 - - 11.67
E-Trust Funds Management Fees FFCO 1 0.93 0.93
216.74
G- Share of Expenses: COBS
Operational Expenses 152.71
Operational Expenses/ (Total Administrative Expenses) 70.46%
Non Operational Expenses 64.03
Non-Operational Expenses/ (Total Administrative Expenses) 29.54%
H - Final Share FFMA
Share of Operational Expenses 0.13 0.56 0.02 70.46%
Share of Non Operational Expenses 0.14 0.15 0.00 29.54%
Total Share 27.19% 70.94% 1.87% 100.00%
Sharable Expenses 58.93 153.75 4.06 216.74
Direct Expenses 12.60 - - 12.60
I- Administratives expenses 71.53 153.75 4.06 229.34
ADB ADF
Total Bank Group Administrative Actual Expenses 224.66
Less Direct Administrative Expenses including: 11.67
- Total Non Shareable expenses for ADB 11.67
- Total Non Shareable expenses for ADF 0.00
Less Revenues from the Management of Trust Funds 0.93
Sub-Total for Actual less Direct Administrative Expenses 57.66 150.43 3.97 212.07
Shared Depreciation 1.27 3.32 0.09 4.68
Total Shareable Expenses 58.93 153.75 4.06 216.74
Total Sharable Expenses in Percentage 27.19% 70.94% 1.87% 100%
Plus Direct Expenses & Revenues from the Management of Trust Fund
Direct Administrative Expenses 11.67 0.00 0.00 11.67
Revenues from the Management of Trust Funds 0.93 - - 0.93
Total Administrative Expenses 71.53 153.75 4.06 229.34
Total Administrative Expenses 31.19% 67.04% 1.77% 100.00%
(*) See next pages for more informations on the source of data
(**) In the event that the share of actual Bank Group Administrative expenditure attributable to NTF exceeds 20% of NTF gross income, the excess over such percentage is borne by ADB.
D- Total Non Sharable Expenses (Direct Adminstrative Exp)
F- Total Sharable Expenses
BUDGET PART NTF (**) Total
Note: ADF figures, compared to table 2, have been adjusted to avoid double counting for projects which have grant and loan components.
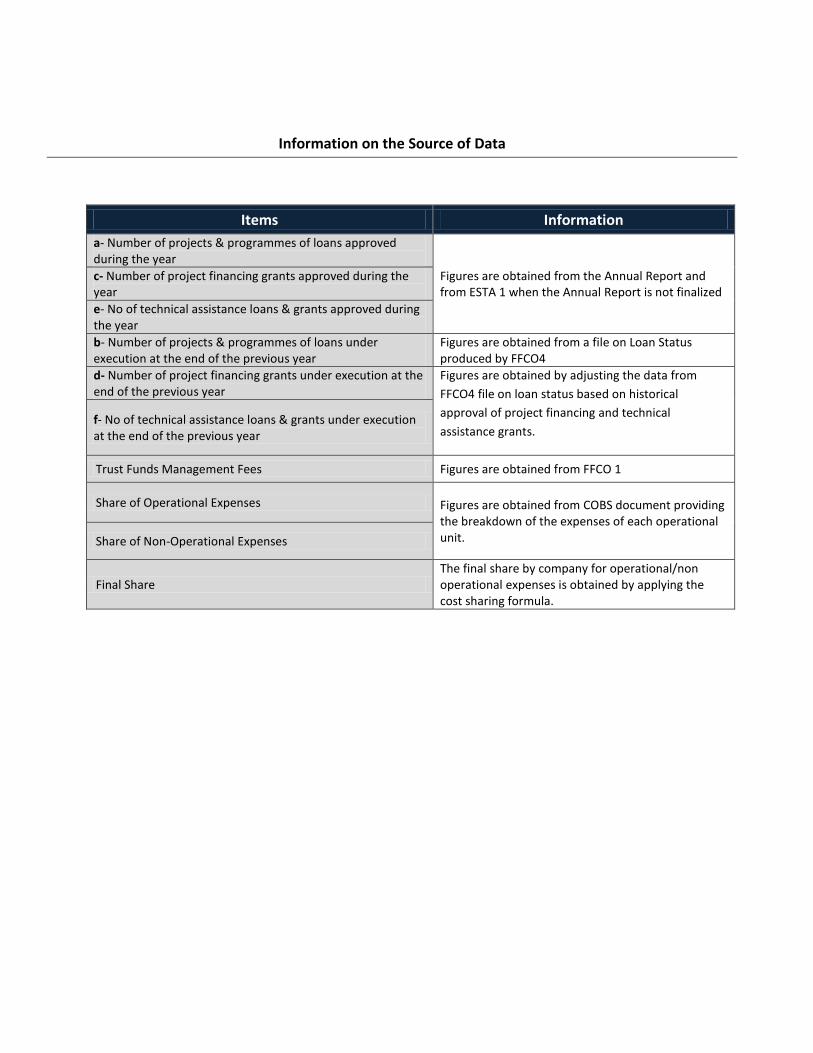
Information on the Source of Data
Items Information
a- Number of projects & programmes of loans approved during the year
Figures are obtained from the Annual Report and from ESTA 1 when the Annual Report is not finalized
c- Number of project financing grants approved during the year
e- No of technical assistance loans & grants approved during the year
b- Number of projects & programmes of loans under execution at the end of the previous year
Figures are obtained from a file on Loan Status produced by FFCO4
d- Number of project financing grants under execution at the end of the previous year
Figures are obtained by adjusting the data from
FFCO4 file on loan status based on historical
approval of project financing and technical
assistance grants. f- No of technical assistance loans & grants under execution at the end of the previous year
Trust Funds Management Fees Figures are obtained from FFCO 1
Share of Operational Expenses Figures are obtained from COBS document providing the breakdown of the expenses of each operational unit. Share of Non-Operational Expenses
Final Share The final share by company for operational/non operational expenses is obtained by applying the cost sharing formula.
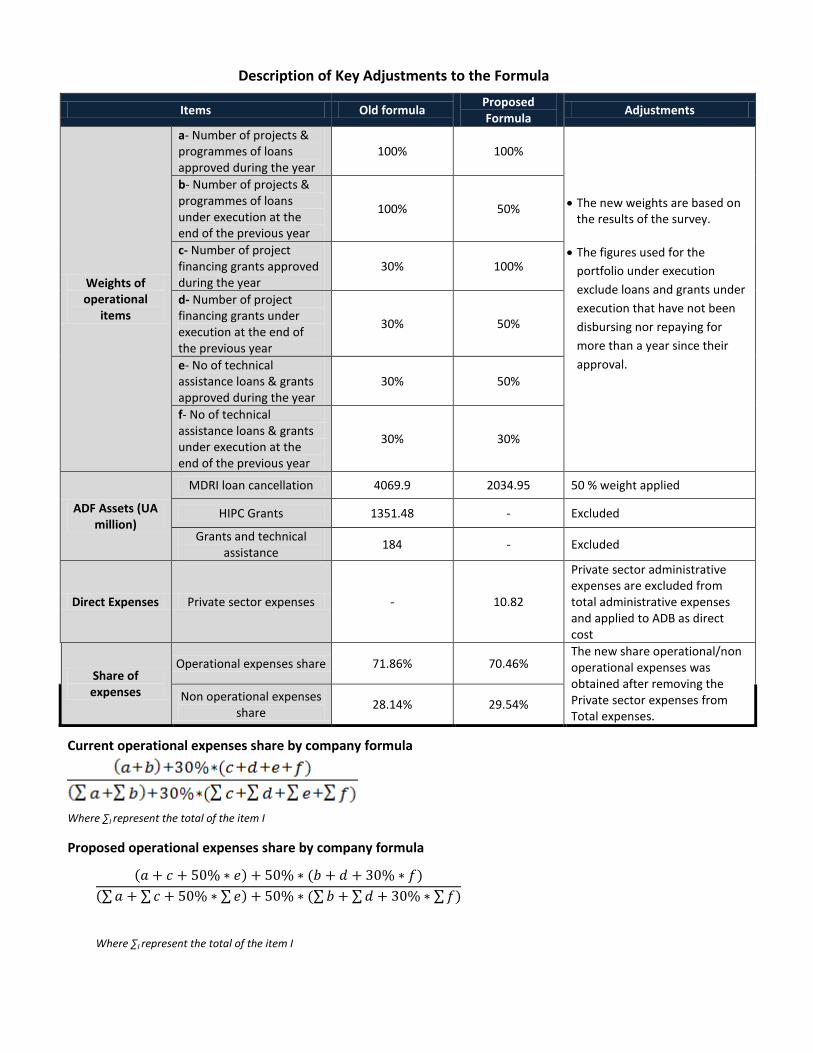
Description of Key Adjustments to the Formula
Items Old formula Proposed Formula
Adjustments
Weights of operational
items
a- Number of projects & programmes of loans approved during the year
100% 100%
The new weights are based on the results of the survey.
The figures used for the
portfolio under execution
exclude loans and grants under
execution that have not been
disbursing nor repaying for
more than a year since their
approval.
b- Number of projects & programmes of loans under execution at the end of the previous year
100% 50%
c- Number of project financing grants approved during the year
30% 100%
d- Number of project financing grants under execution at the end of the previous year
30% 50%
e- No of technical assistance loans & grants approved during the year
30% 50%
f- No of technical assistance loans & grants under execution at the end of the previous year
30% 30%
ADF Assets (UA million)
MDRI loan cancellation 4069.9 2034.95 50 % weight applied
HIPC Grants 1351.48 - Excluded
Grants and technical assistance
184 - Excluded
Direct Expenses Private sector expenses - 10.82
Private sector administrative expenses are excluded from total administrative expenses and applied to ADB as direct cost
Share of expenses
Operational expenses share 71.86% 70.46% The new share operational/non operational expenses was obtained after removing the Private sector expenses from Total expenses.
Non operational expenses share
28.14% 29.54%
Current operational expenses share by company formula
Where ∑I represent the total of the item I
Proposed operational expenses share by company formula
𝑎 + 𝑐 + 50% ∗ 𝑒 + 50% ∗ (𝑏 + 𝑑 + 30% ∗ 𝑓)
𝑎 + 𝑐 + 50% ∗ 𝑒 + 50% ∗ ( 𝑏 + 𝑑 + 30% ∗ 𝑓)
Where ∑I represent the total of the item I
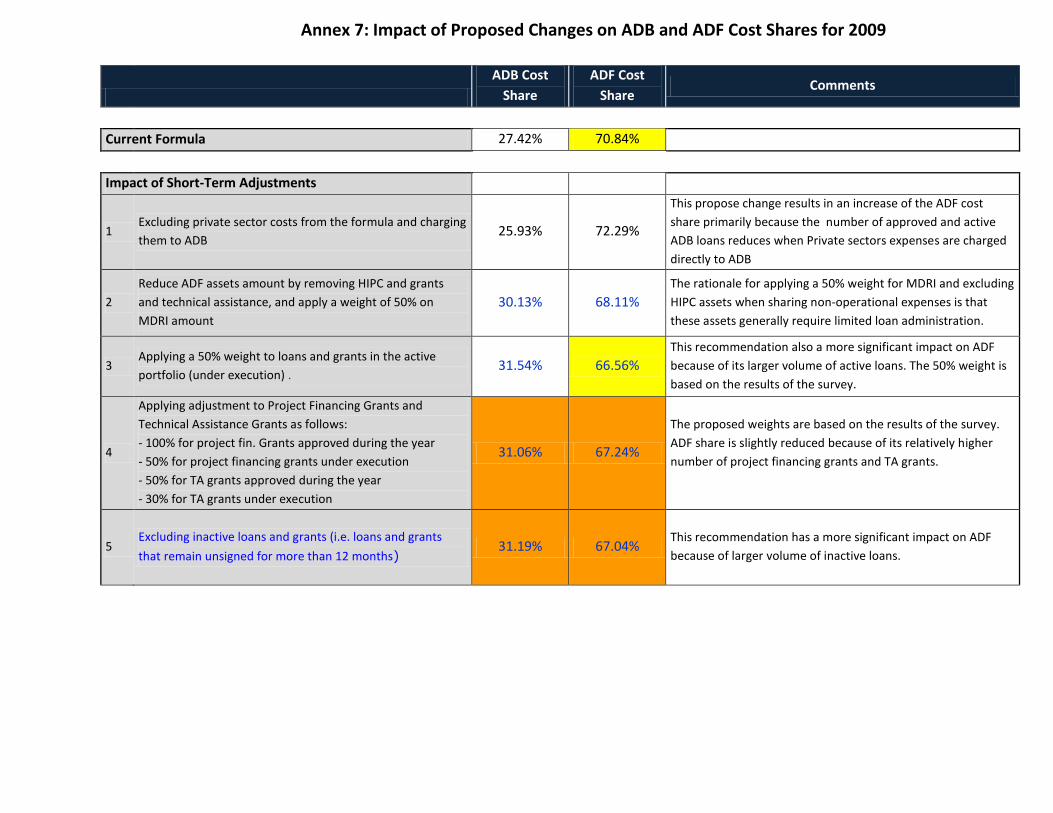
Annex 7: Impact of Proposed Changes on ADB and ADF Cost Shares for 2009
ADB Cost
Share
ADF Cost
Share Comments
Current Formula 27.42% 70.84%
Impact of Short-Term Adjustments
1 Excluding private sector costs from the formula and charging
them to ADB 25.93% 72.29%
This propose change results in an increase of the ADF cost
share primarily because the number of approved and active
ADB loans reduces when Private sectors expenses are charged
directly to ADB
2
Reduce ADF assets amount by removing HIPC and grants
and technical assistance, and apply a weight of 50% on
MDRI amount
30.13% 68.11%
The rationale for applying a 50% weight for MDRI and excluding
HIPC assets when sharing non-operational expenses is that
these assets generally require limited loan administration.
3 Applying a 50% weight to loans and grants in the active
portfolio (under execution) . 31.54% 66.56%
This recommendation also a more significant impact on ADF
because of its larger volume of active loans. The 50% weight is
based on the results of the survey.
4
Applying adjustment to Project Financing Grants and
Technical Assistance Grants as follows:
- 100% for project fin. Grants approved during the year
- 50% for project financing grants under execution
- 50% for TA grants approved during the year
- 30% for TA grants under execution
31.06% 67.24%
The proposed weights are based on the results of the survey.
ADF share is slightly reduced because of its relatively higher
number of project financing grants and TA grants.
5 Excluding inactive loans and grants (i.e. loans and grants
that remain unsigned for more than 12 months) 31.19% 67.04%
This recommendation has a more significant impact on ADF
because of larger volume of inactive loans.
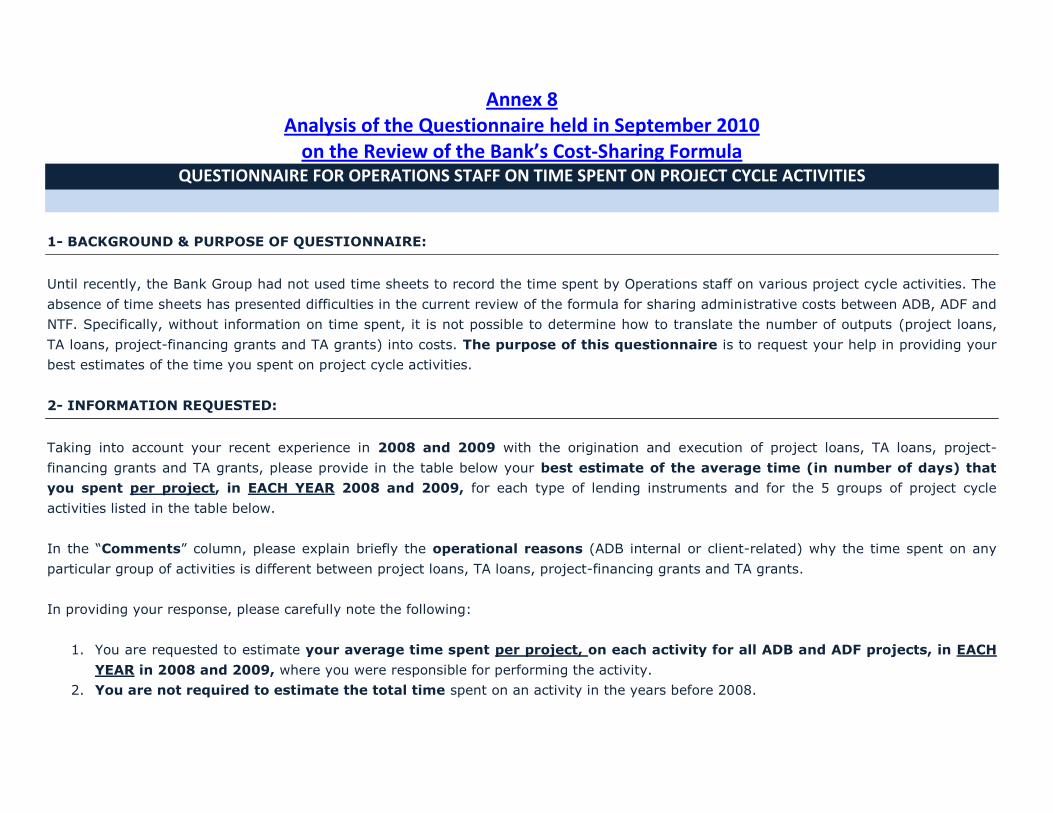
Annex 8 Analysis of the Questionnaire held in September 2010
on the Review of the Bank’s Cost-Sharing Formula QUESTIONNAIRE FOR OPERATIONS STAFF ON TIME SPENT ON PROJECT CYCLE ACTIVITIES
1- BACKGROUND & PURPOSE OF QUESTIONNAIRE:
Until recently, the Bank Group had not used time sheets to record the time spent by Operations staff on various project cycle activities. The
absence of time sheets has presented difficulties in the current review of the formula for sharing administrative costs between ADB, ADF and
NTF. Specifically, without information on time spent, it is not possible to determine how to translate the number of outputs (project loans,
TA loans, project-financing grants and TA grants) into costs. The purpose of this questionnaire is to request your help in providing your
best estimates of the time you spent on project cycle activities.
2- INFORMATION REQUESTED:
Taking into account your recent experience in 2008 and 2009 with the origination and execution of project loans, TA loans, project-
financing grants and TA grants, please provide in the table below your best estimate of the average time (in number of days) that
you spent per project, in EACH YEAR 2008 and 2009, for each type of lending instruments and for the 5 groups of project cycle
activities listed in the table below.
In the ―Comments‖ column, please explain briefly the operational reasons (ADB internal or client-related) why the time spent on any
particular group of activities is different between project loans, TA loans, project-financing grants and TA grants.
In providing your response, please carefully note the following:
1. You are requested to estimate your average time spent per project, on each activity for all ADB and ADF projects, in EACH
YEAR in 2008 and 2009, where you were responsible for performing the activity.
2. You are not required to estimate the total time spent on an activity in the years before 2008.
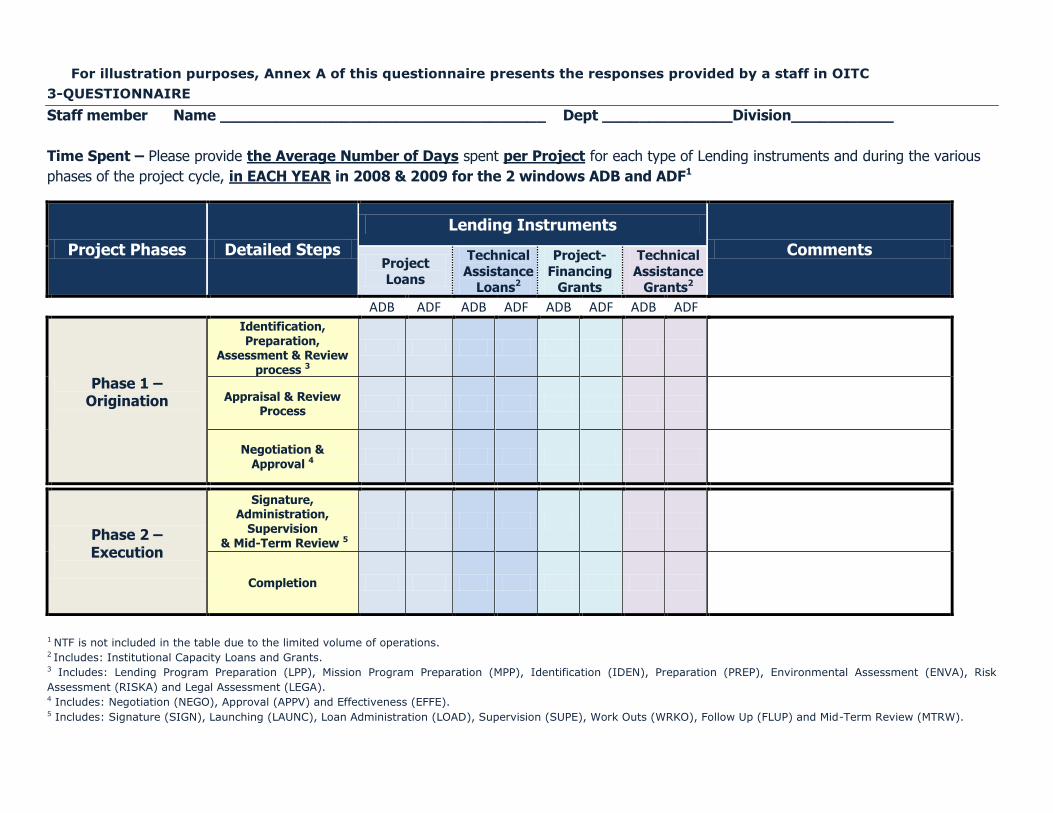
For illustration purposes, Annex A of this questionnaire presents the responses provided by a staff in OITC
3-QUESTIONNAIRE
Staff member Name ___________________________________ Dept ______________Division___________
Time Spent – Please provide the Average Number of Days spent per Project for each type of Lending instruments and during the various
phases of the project cycle, in EACH YEAR in 2008 & 2009 for the 2 windows ADB and ADF1
Project Phases Detailed Steps
Lending Instruments
Comments Project
Loans
Technical
Assistance Loans2
Project-
Financing Grants
Technical
Assistance Grants2
ADB ADF ADB ADF ADB ADF ADB ADF
Phase 1 – Origination
Identification, Preparation,
Assessment & Review process 3
Appraisal & Review Process
Negotiation & Approval 4
Phase 2 – Execution
Signature, Administration,
Supervision & Mid-Term Review 5
Completion
1 NTF is not included in the table due to the limited volume of operations. 2 Includes: Institutional Capacity Loans and Grants. 3 Includes: Lending Program Preparation (LPP), Mission Program Preparation (MPP), Identification (IDEN), Preparation (PREP), Environmental Assessment (ENVA), Risk
Assessment (RISKA) and Legal Assessment (LEGA). 4 Includes: Negotiation (NEGO), Approval (APPV) and Effectiveness (EFFE). 5 Includes: Signature (SIGN), Launching (LAUNC), Loan Administration (LOAD), Supervision (SUPE), Work Outs (WRKO), Follow Up (FLUP) and Mid-Term Review (MTRW).
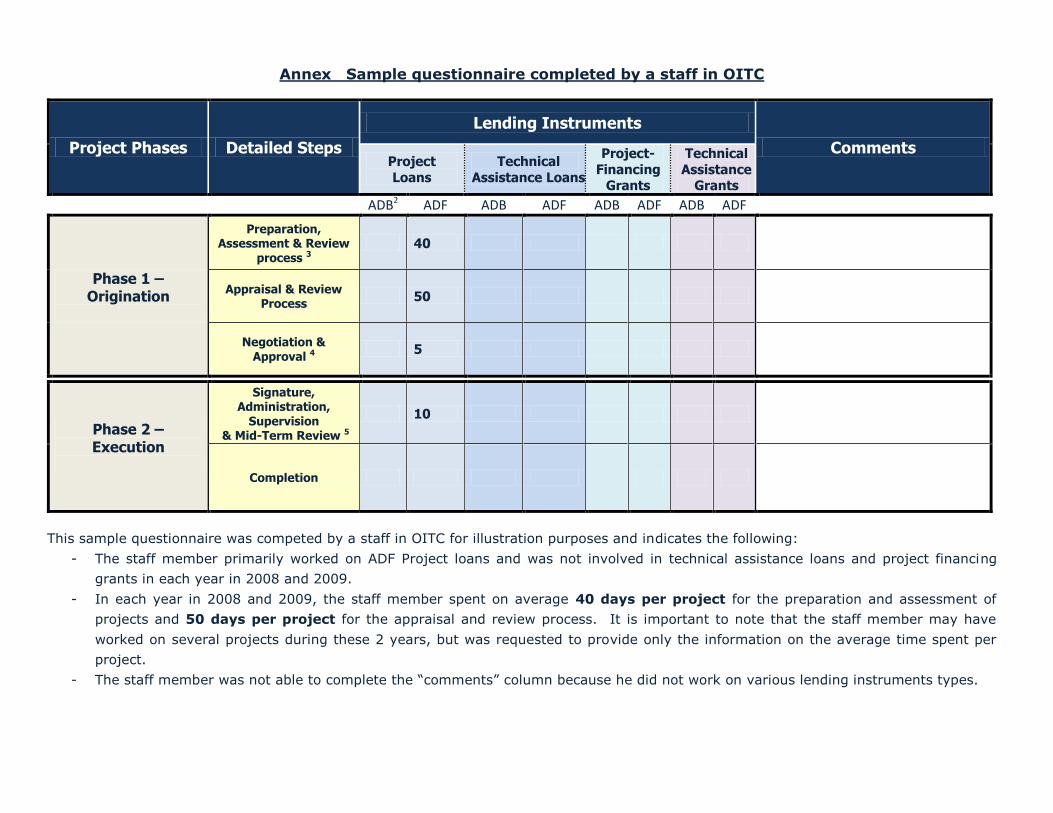
Annex Sample questionnaire completed by a staff in OITC
Project Phases Detailed Steps
Lending Instruments
Comments Project
Loans
Technical
Assistance Loans
Project-
Financing Grants
Technical
Assistance Grants
ADB2 ADF ADB ADF ADB ADF ADB ADF
Phase 1 – Origination
Preparation, Assessment & Review
process 3 40
Appraisal & Review Process
50
Negotiation & Approval 4
5
Phase 2 – Execution
Signature, Administration,
Supervision & Mid-Term Review 5
10
Completion
This sample questionnaire was competed by a staff in OITC for illustration purposes and indicates the following:
- The staff member primarily worked on ADF Project loans and was not involved in technical assistance loans and project financing
grants in each year in 2008 and 2009.
- In each year in 2008 and 2009, the staff member spent on average 40 days per project for the preparation and assessment of
projects and 50 days per project for the appraisal and review process. It is important to note that the staff member may have
worked on several projects during these 2 years, but was requested to provide only the information on the average time spent per
project.
- The staff member was not able to complete the ―comments‖ column because he did not work on various lending instruments types.
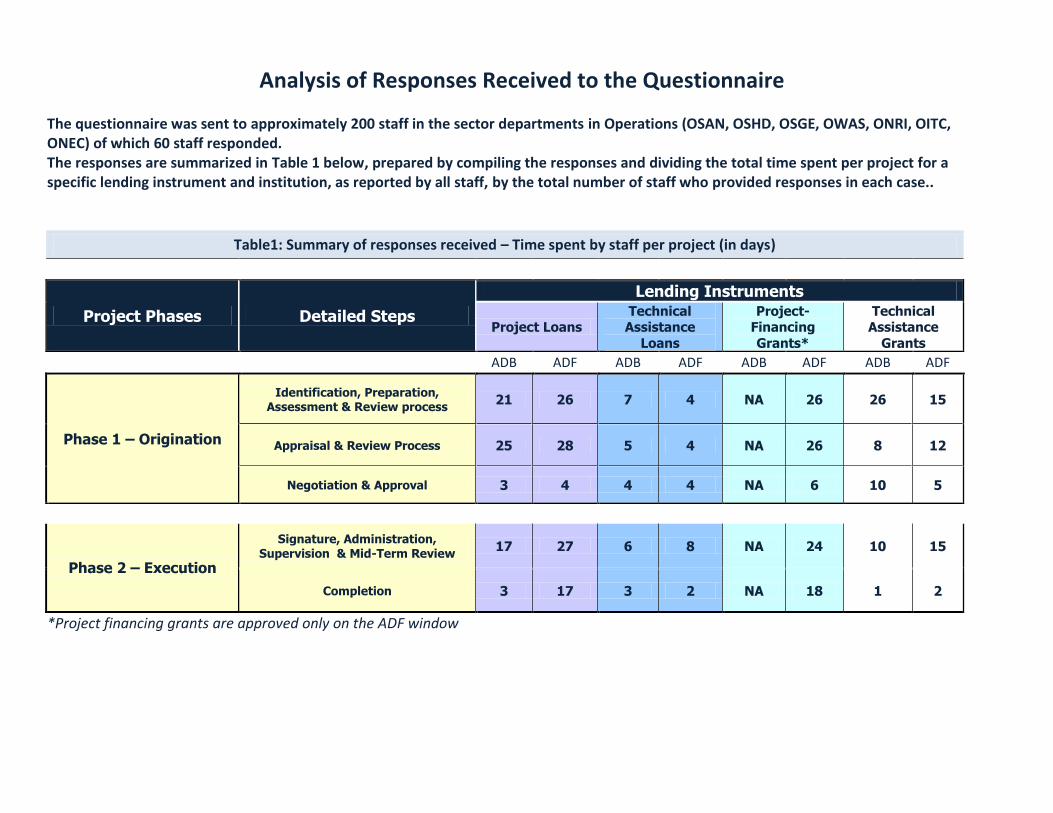
Analysis of Responses Received to the Questionnaire
The questionnaire was sent to approximately 200 staff in the sector departments in Operations (OSAN, OSHD, OSGE, OWAS, ONRI, OITC, ONEC) of which 60 staff responded. The responses are summarized in Table 1 below, prepared by compiling the responses and dividing the total time spent per project for a specific lending instrument and institution, as reported by all staff, by the total number of staff who provided responses in each case..
Table1: Summary of responses received – Time spent by staff per project (in days)
Project Phases Detailed Steps
Lending Instruments
Project Loans Technical Assistance
Loans
Project-Financing
Grants*
Technical Assistance
Grants
ADB ADF ADB ADF ADB ADF ADB ADF
Phase 1 – Origination
Identification, Preparation, Assessment & Review process
21 26 7 4 NA 26 26 15
Appraisal & Review Process 25 28 5 4 NA 26 8 12
Negotiation & Approval 3 4 4 4 NA 6 10 5
Phase 2 – Execution
Signature, Administration, Supervision & Mid-Term Review
17 27 6 8 NA 24 10 15
Completion 3 17 3 2 NA 18 1 2
*Project financing grants are approved only on the ADF window
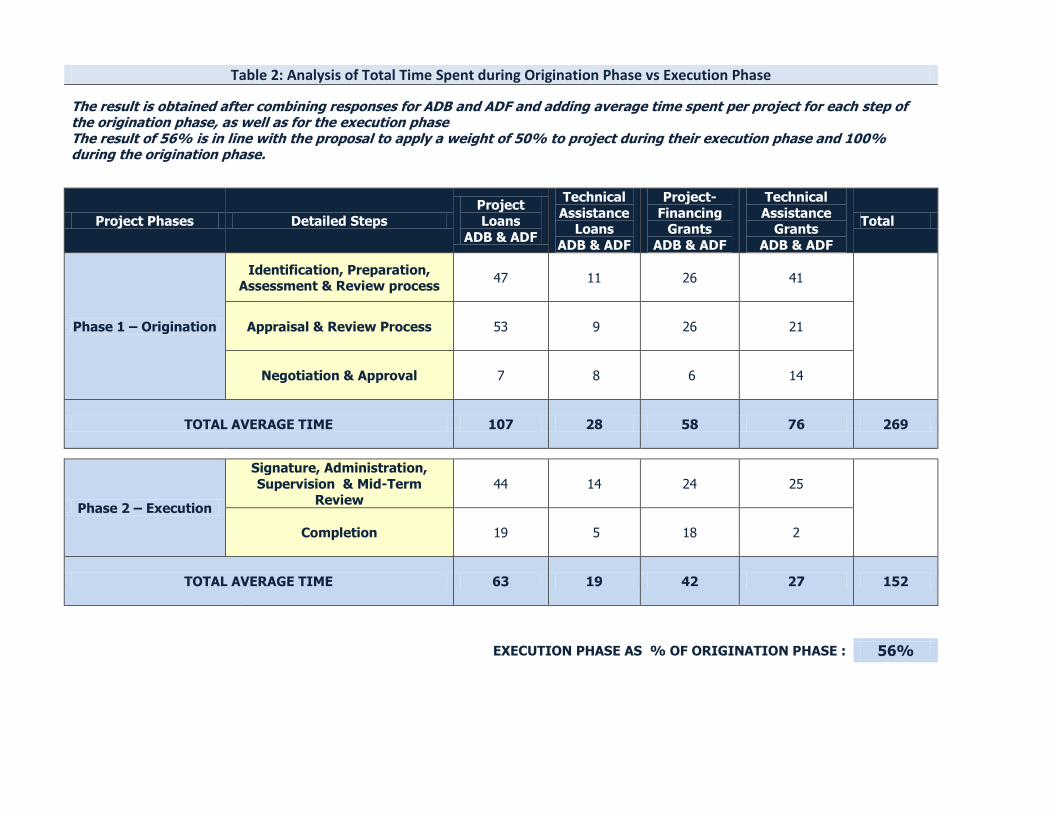
Table 2: Analysis of Total Time Spent during Origination Phase vs Execution Phase
The result is obtained after combining responses for ADB and ADF and adding average time spent per project for each step of the origination phase, as well as for the execution phase The result of 56% is in line with the proposal to apply a weight of 50% to project during their execution phase and 100% during the origination phase.
Project Phases Detailed Steps
Project
Loans
ADB & ADF
Technical
Assistance Loans
ADB & ADF
Project-
Financing Grants
ADB & ADF
Technical
Assistance Grants
ADB & ADF
Total
Phase 1 – Origination
Identification, Preparation, Assessment & Review process
47 11 26 41
Appraisal & Review Process 53 9 26 21
Negotiation & Approval 7 8 6 14
TOTAL AVERAGE TIME 107 28 58 76 269
Phase 2 – Execution
Signature, Administration,
Supervision & Mid-Term Review
44 14 24 25
Completion 19 5 18 2
TOTAL AVERAGE TIME 63 19 42 27 152
EXECUTION PHASE AS % OF ORIGINATION PHASE : 56%
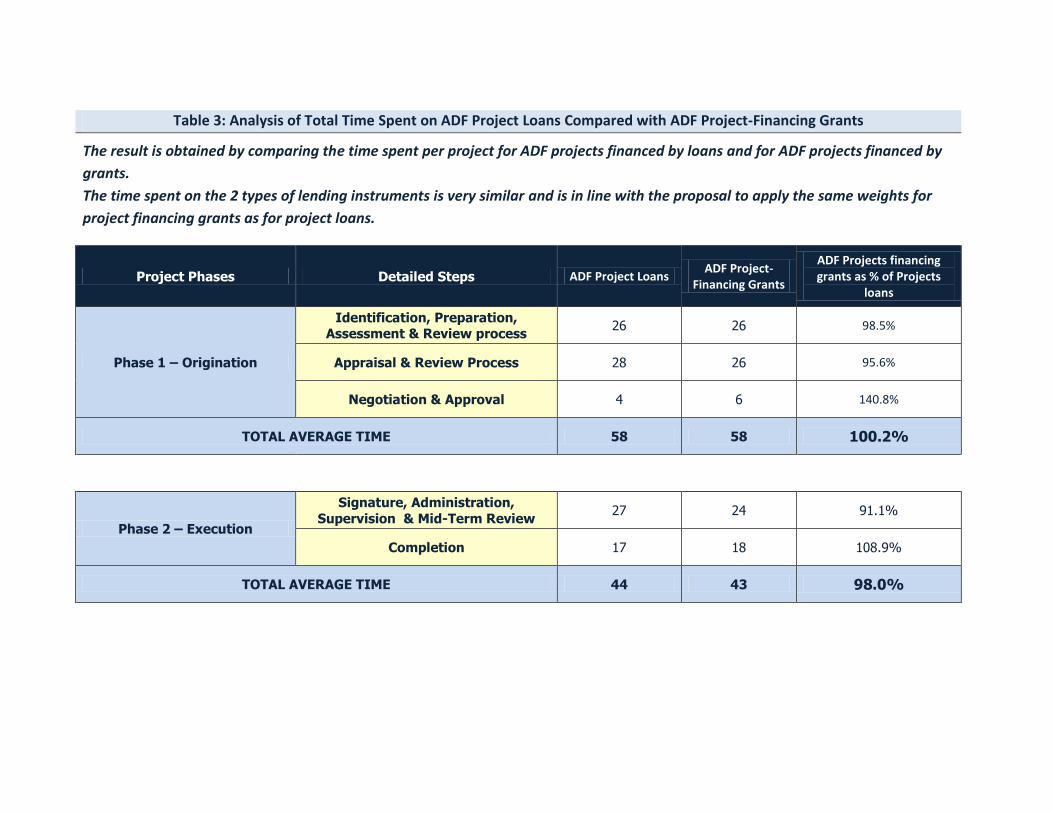
Table 3: Analysis of Total Time Spent on ADF Project Loans Compared with ADF Project-Financing Grants
The result is obtained by comparing the time spent per project for ADF projects financed by loans and for ADF projects financed by
grants.
The time spent on the 2 types of lending instruments is very similar and is in line with the proposal to apply the same weights for
project financing grants as for project loans.
Project Phases Detailed Steps ADF Project Loans ADF Project-
Financing Grants
ADF Projects financing grants as % of Projects
loans
Phase 1 – Origination
Identification, Preparation, Assessment & Review process
26 26 98.5%
Appraisal & Review Process 28 26 95.6%
Negotiation & Approval 4 6 140.8%
TOTAL AVERAGE TIME 58 58 100.2%
Phase 2 – Execution
Signature, Administration,
Supervision & Mid-Term Review 27 24 91.1%
Completion 17 18 108.9%
TOTAL AVERAGE TIME 44 43 98.0%
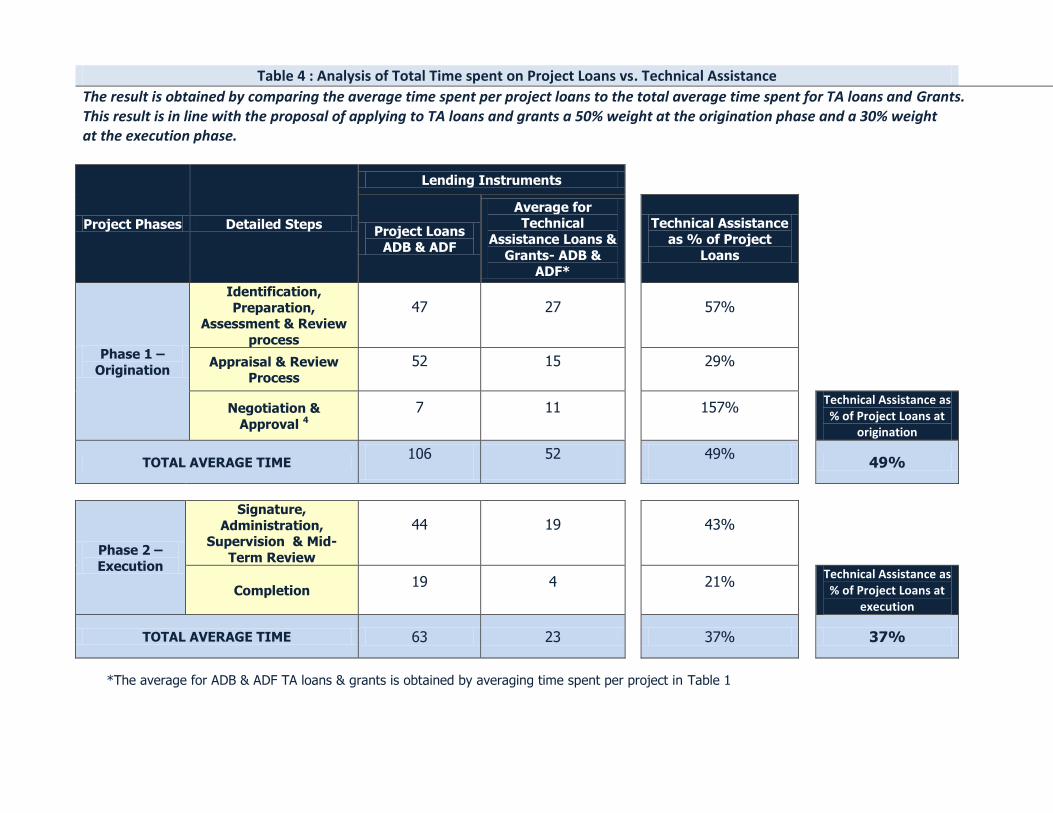
Table 4 : Analysis of Total Time spent on Project Loans vs. Technical Assistance
The result is obtained by comparing the average time spent per project loans to the total average time spent for TA loans and Grants. This result is in line with the proposal of applying to TA loans and grants a 50% weight at the origination phase and a 30% weight at the execution phase.
Project Phases Detailed Steps
Lending Instruments
Project Loans ADB & ADF
Average for Technical
Assistance Loans &
Grants- ADB & ADF*
Technical Assistance
as % of Project
Loans
Phase 1 –
Origination
Identification,
Preparation, Assessment & Review
process
47
27
57%
Appraisal & Review Process
52
15
29%
Negotiation &
Approval 4
7
11
157%
Technical Assistance as % of Project Loans at
origination
TOTAL AVERAGE TIME 106
52
49%
49%
Phase 2 –
Execution
Signature,
Administration, Supervision & Mid-
Term Review
44
19
43%
Completion 19
4
21%
Technical Assistance as % of Project Loans at
execution
TOTAL AVERAGE TIME 63 23 37%
37%
*The average for ADB & ADF TA loans & grants is obtained by averaging time spent per project in Table 1
