review of the titanic competition - welcome to the society ... · pdf filetitanic: machine...
TRANSCRIPT

Review of the Titanic Competition
15th February 2016

• Data Analytics in the Society of Actuaries
• Team ZLAP
• Deloitte GI Team
• Where Can I Get More?
Agenda
Disclaimer:The material, content and views in the following presentation are those of the presenter(s).
• Wider Fields Committee and Data Analytics subgroup.
• Past events:
– Who is the driver?
– Titanic Competition Workshop
• Future events
Data Analytics in the Society of Actuaries
Disclaimer:The material, content and views in the following presentation are those of the presenter(s).

Titanic: Machine Learning from Disaster
Team ZLAP
15th February 2016

• Team ZLAP
– Nicholas Clarke Product Solutions
– Patrick Mangan Data Analytics
– Julianne Harrington Data Analytics
Introduction
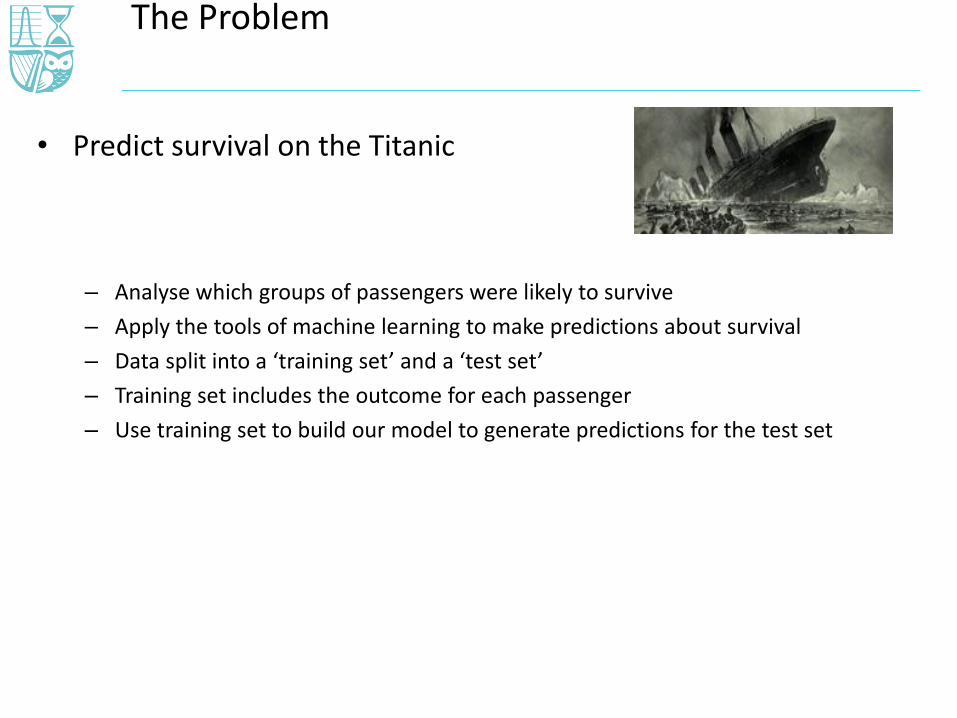
• Predict survival on the Titanic
– Analyse which groups of passengers were likely to survive
– Apply the tools of machine learning to make predictions about survival
– Data split into a ‘training set’ and a ‘test set’
– Training set includes the outcome for each passenger
– Use training set to build our model to generate predictions for the test set
The Problem

• IPython Notebook
– Powerful
– Fast
– Flexible
– Open-source
– Bundle your analysis in one file
– A range of packages like Pandas, NumPy, SciPy, Scikit-Learn, Matplotlib, Statsmodels
Tools Used

• 891 train / 418 test
• Variables:– Name
– Sex
– Age
– Number of Siblings/Spouses Aboard
– Number of Parents/Children Aboard
– Ticket Number
– Passenger Fare
– Cabin
– Port of Embarkation
Data

• Extracting title from name
• Family grouping– Survival status of family members (spouse, parent/child)
• Normalising data– Log(fare)
– Log(fare) outside 2 standard deviations
• Categorical Variables– Child
– Lone traveller
Feature Engineering

• Averaging across sub groups
• Randomised Lasso Regression– Modelling ages
– Automatic feature selection
Imputing Missing Variables

• Men, women, and children were modelled separately.– Allowed for group-specific covariates to be created.
– Less data in each group for cross-validation.
– Some covariates have different meanings/strengths for each of the groups.
• Avenues not explored:
– Ethnicity/language
– Matching by tickets
Sub Models

• Logistic Regression– Widely used, reasonably simple classifier.
– Models the probability that a passenger survives.
• Decision Trees– Uses consecutive “splitting” rules to classify data points.
– Tree is then “pruned” (via cross-validation) to avoid over-fitting.
– Even still, decision trees suffer from high variance!
• Bagging / Random Forests– Bootstrapping (“bagging”) helps reduce variance.
– Random Forests then decorrelates the trees.
• Ensemble Learning
Models Used

A Simple Classification Problem
We want to find the separating hyperplane.
Support Vector Machines

SVM looks for the maximal margin hyperplane.
Support Vector Machines

A Slightly Less Simple Classification Problem
Don’t need to restrict to a linear separator.
Support Vector Machines

• Not possible/prudent to correctly classify all training points– Some data points will be on the wrong side of the hyperplane.
• How much do we want to avoid misclassification?– If 9/10 1st class women survived in our training set, should we predict all 1st class
women to survive?
• How much influence should each individual training point have?– Does the fate of a 1st class 20 year-old tell us anything about the fate of a 1st class
21 year-old? What about a 30 year-old?
Support Vector Machines & The Titanic

• Men, women, and children were modelled separately.
• Features used were:
– Women: Social class, age, log(fare), log(fare) outside 2sd, title, lone traveller, pensioner, husband’s fate, husband’s title, children’s fate
– Children: Social class, gender, log(fare), log(fare) outside 2sd, age, toddler, mother’s fate, father’s fate, father’s title, siblings’ fate, lone traveller
– Men: Gender…
Model Specifics

• Our Score
– Public Score: 0.82297
i.e. our model correctly predicts survival for 82.3% of the passengers
Result

Any Questions?

Titanic: Machine Learning from
Disaster
Deloitte GI
15th February 2016

• Team introduction
• Overview of software used
• Overview of general approach
• Challenges
• Next steps / future improvements
Deloitte Model - Introduction

• Excel– Exploratory analysis
– One-way tables, two-way tables
• R– Feature engineering
– Data adjustments
– Model training
– Model testing
– Model output for submission to Kaggle
• Useful Resources– Kaggle tutorial and forums
– R help files
– SAI workshop
Software and Resources
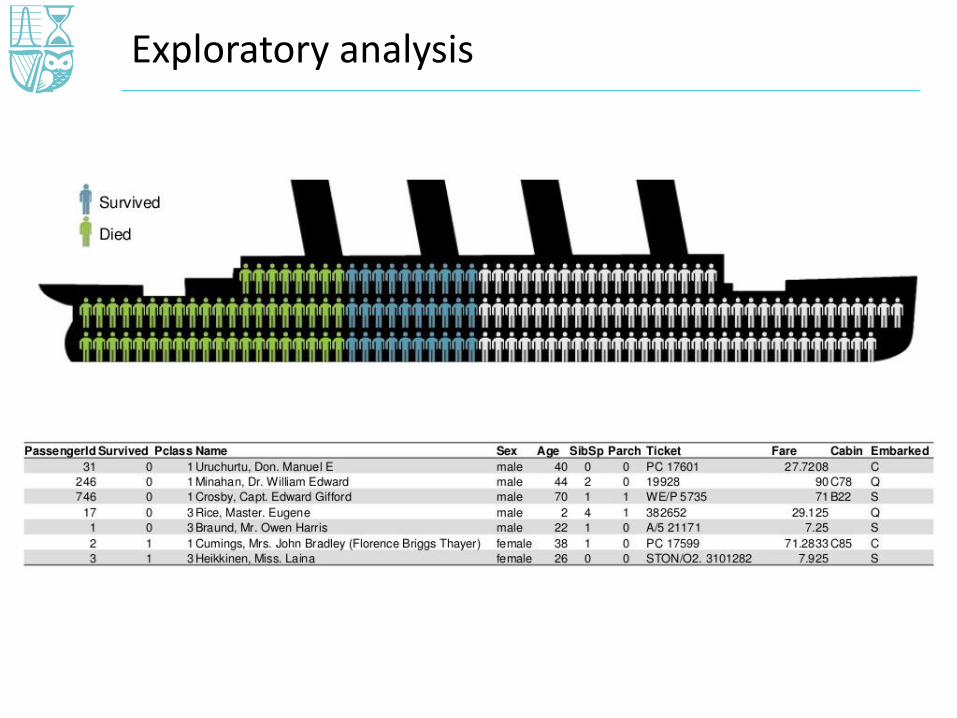
Exploratory analysis

• One-way and two-way tables used to identify variables of statistical significance
• Missing and incomplete data fields were identified e.g. Age, location embarked, fare.
Exploratory analysis
1 2 3
Count 216 184 491
# Survived 136 87 119
% Survived 63.0% 47.3% 24.2%
Class
Adult Child Missing
Count 601 113 177
# Survived 229 61 52
% Survived 38.1% 54.0% 29.4%
Age Group

• Engineered new variables based on the data available:
– Title: Indicator of sex and age.• Extracted from passenger name
• Less common/rare titles grouped e.g. ‘Capt’, ‘Don’, ‘Major’ grouped in with ‘Sir’.
– Family Size:• # of siblings + # of parents + 1
– Family ID:• Family name & size
• “Small” for 2 or less (or erroneous data)
Feature engineering

• Data adjustments were carried out in R, to estimate missing and incomplete data items:
– Age: • ~20% of passengers have blank ages
• Filled in blanks using decision tree (utilised engineering variables)
• Key data adjustment.
– Location Embarked:• Information for two passengers missing –assumed embarked at most popular
location (Southampton).
– Fare: • One fare missing – assumed median fare.
Data adjustments

• Early models
– Everyone dies! (~62% accuracy)
– Women survive (~ 74% accuracy)
• Machine learning models
– Decision tree
– Binomial regression
– Random forest
Model training – An iterative process!
Model
Tuning
Exploratory
Analysis
Data
Cleaning
Feature
Engineering
Model
Development

• Set of rules
• Intuitive
• BUT... greedy!
Model training – Decision tree
yes no
1
2
3
6
12 13 7
Title = Dr,Mr,Rev,Sir
Pclass >= 2.5
FamilySize >= 4.5
0
.62 .38
100%
0
.84 .16
60%
1
.28 .72
40%
0
.52 .48
19%
0
.91 .09
5%
1
.38 .62
14%
1
.06 .94
21%
yes no
1
2
3
6
12 13 7
Rattle 2016-Jan-31 19:42:51 thyland

• Problem with decision trees
– May miss ‘optimal’ solution
– Prone to overfitting
• Random forests
– Multiple decision trees• Random subset of variables used
• Random subset of data used
– Returns mode output of all trees
– Corrects for overfitting
Model training – Random Forests

Model training – Binomial Regression
• 𝜂𝑖 = 𝛽0 + 𝛽1Age𝑖 + 𝛽2Title𝑖 +⋯+ 𝛽5 Sex𝑖 ∗ Class𝑖 +⋯
• ℙ Survived =1
1+𝑒−𝜂𝑖
• Predict passenger survived if ℙ Survived > 0.55
• 0.55 threshold based on value which maximised
Accuracy = (# of True −ve) + (# of True +ve)
Total # of observations

Model training – Combining models
Model 1DT
Model 2RF
Model 3GLM
Model 4Combined
PassengerID
893
894
895
896
... ... ... ... ...
• Final model = vote across the 3 models– 0/3 or 1/3 survive –> DIED
– 2/3 or 3/3 survive –> SURVIVE

Set of weak learners = strong learner?
Gender Based Model
Everyone
dies
62%
Females
survive
74%
Decision
Tree
79.4%
Random
Forest
81.34%
Binomial
Regression
79.4%
Combined Model Result: 81.8%

• Limitations existed:
– Time
– Resource
• Possible next steps / enhancements:
– Further cleansing of data
– Enhanced feature engineering
– Further model testing, identifying insignificant variables.
– Combining algorithms
– Additional algorithms – e.g. LDA
Possible Next Steps

• Key step: data cleaning, feature engineering
• Diminishing marginal returns of predictive power
• Furthered knowledge of machine learning and R
• Actuarial skillset highly transferable to data analytics
Conclusion

• Formal education: UCD Msc Data Analytics, UCD Business School MSc in Business Analytics, DIT Msc Computing (Data Analytics)
• Web: Kaggle, KDNuggets, UCI Machine Learning Repository, R-Bloggers, numerous sites for online courses such as Coursera, LinkedIn groups, etc.
• MeetUp Groups: Dublin R, Data Scientists Ireland, Deep Learning Dublin, Dublin Data Science Beginners, Machine Learning Dublin, Hadoop User Group Ireland, and many more!
• Dublin R: San Francisco Crime Database exploration 24th
February.
Where Can I Get More?
Disclaimer:The material, content and views in the following presentation are those of the presenter(s).