review of updated manitoba hydro … morrison park advisors inc. 150 york street, suite 1610,...
TRANSCRIPT

MPA Morrison Park Advisors Inc. 150 York Street, Suite 1610, Toronto, ON M5H 3S5 T 416.861.9753 www.morrisonpark.com
Review of Updated
Manitoba Hydro
Development Plans
Prepared by Morrison Park Advisors
For
Manitoba Public Utilities Board
May 2014

Commercial Evaluation of Manitoba Hydro Preferred Development Plan Business Case Page 2 of 44
MPA Morrison Park Advisors Inc. January 2014
Page Intentionally Left Blank

Commercial Evaluation of Manitoba Hydro Preferred Development Plan Business Case Page 3 of 44
MPA Morrison Park Advisors Inc. January 2014
Contents
1. Introduction .................................................................................................................... 5
2. Model Outputs .............................................................................................................. 11
3. The Impact of Droughts ................................................................................................ 30
4. Conclusions ................................................................................................................... 43
Tables
1. Comparison of Updated to Original Plans .............................................................. 5
2. Comparison of Updated Economic Variables ......................................................... 8
3. Export as % of Total Revenues – 2013 vs Updated Plans ..................................... 22
4. Government Revenues at 6% Discount Rate Ref/Ref/Ref – 2013 vs. Updated Plans
............................................................................................................................... 29
Figures
1. Total Cost to Ratepayers at a 3.8% Maximum Annual Rate Change .................... 11
2. Total Cost to Ratepayers at a 4% Maximum Annual Rate Change ....................... 13
3. Comparison of 2013 and 2014 Ratepayer Costs................................................... 14
4. Cumulative Rate Increases for the PDP under 3.8% and 4% Annual Rate Change
Rules ...................................................................................................................... 15
5. Cumulative Rate Increases for Plan 5 under 3.8% and 4% Annual Rate Change
Rules ...................................................................................................................... 16
6. Cumulative Rate Increases for All Gas under 3.8% and 4% Annual Rate Change
Rules ...................................................................................................................... 17
7. Sensitivity to Interest Rates .................................................................................. 19
8. Sensitivity to Construction Cost Increases ............................................................ 21
9. Excerpt from PUB/MPA1-004(a) ........................................................................... 22
10. NPV of Ratepayer Costs for Alternative Periods ................................................... 23
11. Manitoba Ratepayer Costs at 4% and 5% Maximum Annual Rate Change ......... 25
12. Comparison of PDP Rate Paths with 4% and 5% Maximum Annual Rate Change
Rule ...................................................................................................................... 26
13. Comparison of Plan 5 Rate Paths with 4% and 5% Maximum Annual Rate Change
Rule ....................................................................................................................... 27
14. Government of Manitoba Revenues ................................................................... 28
15. Net Income Performance Under Challenging Hydrology – 2013 vs. 2014 .......... 31

Commercial Evaluation of Manitoba Hydro Preferred Development Plan Business Case Page 4 of 44
MPA Morrison Park Advisors Inc. January 2014
16. Equity Ratio Given Challenging Hydrology – 2013 vs. 2014 ................................ 32
17. Interest Coverage Ratio Given Challenging Hydrology – 2013 vs. 2014 ............... 34
18. Cash Flow Less Capital Expenditures Given Challenging Hydrology – 2013 vs.
2014 ...................................................................................................................... 36
19. Cash Flow Less Capital Expenditures Given Challenging Hydrology – Base vs.
+ 1% ....................................................................................................................... 38
20. Net Income Given Challenging Hydrology – 3.8% vs. 4% Maximum Annual Rate
Increase ................................................................................................................. 40
21. Equity Ratio Given Challenging Hydrology – 4% Annual Maximum Rate Change 41

Commercial Evaluation of Manitoba Hydro Preferred Development Plan Business Case Page 5 of 44
MPA Morrison Park Advisors Inc. January 2014
1. Introduction 1
Manitoba Hydro provided detailed information to the Manitoba Public Utilities Board (PUB) on its 2
Preferred Development Plan and alternatives beginning with its Business Case, delivered in August 2013. 3
Subsequent information was provided through IRs and supplementary information disclosures (some of 4
which were commercially sensitive) to participants in the PUB’s process. 5
Morrison Park Advisors reviewed and analyzed the information provided, and commented on it in its 6
Report (January 2014), in various responses to IRs from the PUB and other participants, and in its 7
presentation and verbal comments before the PUB (April 2014). 8
Coincident with the commencement of public hearings before the PUB, Manitoba Hydro began releasing 9
updates to the Preferred Development Plan (PDP) and to various potential alternatives. These updates 10
take into account both changes in the external environment (e.g., inflation rates and natural gas price 11
projections), and changes in Manitoba Hydro management expectations (e.g., cost of construction for 12
various proposed projects). 13
Given changes to multiple variables simultaneously, it is impossible to accurately predict the combined 14
outcome on the relative attractiveness of the various alternatives presented by Manitoba Hydro absent 15
testing of the new data. As a result, MPA updated its own models based on the new data provided by 16
Manitoba Hydro, analyzed the outputs in detail, and presents its results in this supplementary report. 17
1.1. New Information Provided by Manitoba Hydro 18
Manitoba Hydro provided new information for the following Plans: 19
Table 1. Comparison of Updated to Original Plans 20
Plan Elements (2013 version)
(base DSM)
Elements (2014 version)
(DSM level 2, no pipeline)
1 All Gas
• Single cycle natural gas units added in 2022-23,
2025-26, 2028-29, 2034-35, 2047-48
• Combined Cycle natural gas units added in 2031-32,
2037-38, 2040-41, 2044-45
All Gas
• Single cycle natural gas units added in
2031-32, 2035-36, 2039-40, 2047-48
• Combined Cycle natural gas unit added
in 2042-43
2 K22/Gas
• Keeyask Hydroelectric Generating Station in 2022-23
• Single cycle natural gas units added in 2029-30,
2032-33
• Combined Cycle natural gas units added in 2034-35,
2038-39, 2041-42, 2045-46
K31/Gas
• Keeyask Hydroelectric Generating
Station in 2031-32
• Single cycle natural gas units added in
2040-41, 2044-45, 2047-48

Commercial Evaluation of Manitoba Hydro Preferred Development Plan Business Case Page 6 of 44
MPA Morrison Park Advisors Inc. January 2014
Plan Elements (2013 version)
(base DSM)
Elements (2014 version)
(DSM level 2, no pipeline)
4 K19/Gas24/250MW
• Keeyask Hydroelectric Generating Station in 2019-20
• 250 MW Transmission Interconnect in 2020-21
• Single cycle natural gas units added in 2024-25,
2029-30
• Combined Cycle natural gas units added in 2032-33,
2038-39, 2041-42, 2045-46
K19/Gas40/250MW
• Keeyask Hydroelectric Generating
Station in 2019-20
• 250 MW Transmission Interconnect in
2020-21
• Single cycle natural gas units added in
2040-41, 2044-45, 2047-48
5 K19/Gas25/750MW(WPS Inv.)
• Keeyask Hydroelectric Generating Station in 2019-20
• 750 MW Transmission Interconnect in 2020-21
• Interconnect will be partially owned and funded by a
US investor
• Single cycle natural gas units added in 2025-26, 2026-
27, 2028-29, 2031-32, 2033-34, 2045-46, 2047-48
• Combined Cycle natural gas units added in 2042-43
K19/Gas31/750MW
• Keeyask Hydroelectric Generating
Station in 2019-20
• 750 MW Transmission Interconnect in
2020-21
• Single cycle natural gas units added in
2031-32, 2044-45, 2047-48
6 K19/Gas31/750MW
• Keeyask Hydroelectric Generating Station in 2019-20
• 750 MW Transmission Interconnect in 2020-21
• Single cycle natural gas units added in 2031-32 (x2),
2032-33, 2034-35, 2043-44
• Combined Cycle natural gas units added in 2039-40,
2045-46
K19/Gas40/750MW
• Keeyask Hydroelectric Generating
Station in 2019-20
• 750 MW Transmission Interconnect in
2020-21
• Single cycle natural gas units added in
2040-41, 2044-45, 2047-48
14 K19/C25/750MW(WPS Inv.)
• Keeyask Hydroelectric Generating Station in 2019-20
• 750 MW Transmission Interconnect in 2020-21
• Interconnect will be partially owned and funded by a
US investor
• Conawapa Hydroelectric Generating Station in
2025-26
• Single cycle natural gas units added in 2041-42,
2044-45, 2046-47
K19/C31/750MW
• Keeyask Hydroelectric Generating
Station in 2019-20
• 750 MW Transmission Interconnect in
2020-21
• Conawapa Hydroelectric Generating
Station in 2031-32
1
The original versions of the Plans, provided in August 2013, assumed the 2012 Manitoba load forecast, 2
and a “base” level of Demand Side Management (DSM), as per the programs approved by the PUB at the 3
time. The 2014 versions of the Plans assume the newer 2013 Manitoba load forecast and substantially 4
higher “Level 2” spending on DSM. The difference is significant, and causes dramatic changes in the 5
timing and composition of energy generation investments by Manitoba Hydro. 6
Investment in DSM (e.g., subsidies for efficiency measures such as improved lighting and motors, fuel 7
switching for heating purposes from electricity to natural gas, subsidies for combined heat and power or 8
waste heat electricity generation at industrial facilities, etc.) means that net load measured on the 9

Commercial Evaluation of Manitoba Hydro Preferred Development Plan Business Case Page 7 of 44
MPA Morrison Park Advisors Inc. January 2014
Manitoba grid will be significantly reduced over time, as compared to current projections. This should 1
have two impacts: more of Manitoba’s Hydro’s electricity production from existing facilities should be 2
available for export (particularly in “wet” years), and new facilities to provide dependable energy will 3
not be needed until later in the period under study. As a result, the revised plans include fewer single 4
cycle and almost no combined cycle natural gas-fired generation units over the course of the next forty 5
years. 6
Annual expenditures on DSM will be much higher throughout the period studied, but assuming the net 7
cost of DSM investments is lower than the cost of the new generation being avoided, then Manitoba 8
consumers as a whole should be better off. 9
[Note: this is an assumption made about Manitoba electricity consumers collectively. DSM programs by 10
definition apply unequally across consumers when considered individually. DSM programs typically 11
result in a higher price per unit energy because total demand is reduced, while system fixed costs – 12
including DSM spending – do not fall with demand. Consumers who respond to DSM programs and 13
reduce their consumption will benefit from the DSM investments, while consumers who do not 14
participate in DSM programs and therefore do not reduce their power consumption will potentially pay 15
more for their electricity. The rest of this paper focuses exclusively on collective customer rate impacts, 16
and will not comment on the potential distributional effects of DSM within the Plans.] 17
As noted in Table 1, the additional load that may result from new interprovincial pipelines that might be 18
built in the future was not included in the scenarios tested by MPA. According to Manitoba Hydro, such 19
pipelines could increase Manitoba load by 1300 GWh by 2027 if they are built. This would reduce 20
Manitoba Hydro’s ability to export power, and may require changes in the timing of new generation 21
units in certain plans. 22
Capital costs for the Keeyask and Conawapa projects have been increased, in accordance with the most 23
recent construction contracts entered into by Manitoba Hydro. 24
The WPS Investment in the transmission interconnection with the United States that was assumed in 25
certain Plans in 2013 is no longer assumed in any Plans. Manitoba Hydro is instead assumed to absorb 26
the portion of the capital cost that was previously assigned to WPS, and recover those expenditures over 27
time through other arrangements. 28
Common costs shared by all Plans (such as transmission, distribution and administrative costs) have 29
been updated to match the recently released 2013 IFF and 2013 CEF. 30
Interest and inflation forecasts have also been updated. The following table highlights changes in the 31
economic variables used in the analysis of the Plans: 32
Commercial Evaluation of Manitoba Hydro Preferred Development Plan Business Case Page 8 of 44
MPA Morrison Park Advisors Inc. January 2014
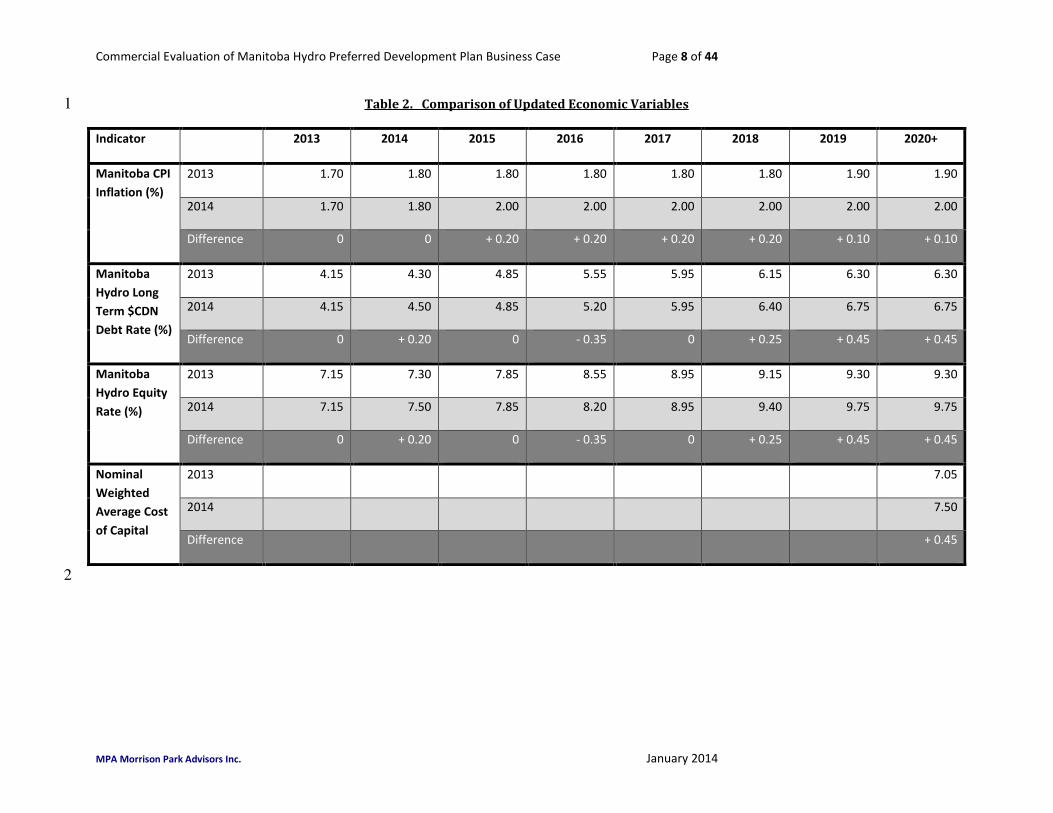
Table 2. Comparison of Updated Economic Variables 1
Indicator 2013 2014 2015 2016 2017 2018 2019 2020+
Manitoba CPI
Inflation (%)
2013 1.70 1.80 1.80 1.80 1.80 1.80 1.90 1.90
2014 1.70 1.80 2.00 2.00 2.00 2.00 2.00 2.00
Difference 0 0 + 0.20 + 0.20 + 0.20 + 0.20 + 0.10 + 0.10
Manitoba
Hydro Long
Term $CDN
Debt Rate (%)
2013 4.15 4.30 4.85 5.55 5.95 6.15 6.30 6.30
2014 4.15 4.50 4.85 5.20 5.95 6.40 6.75 6.75
Difference 0 + 0.20 0 - 0.35 0 + 0.25 + 0.45 + 0.45
Manitoba
Hydro Equity
Rate (%)
2013 7.15 7.30 7.85 8.55 8.95 9.15 9.30 9.30
2014 7.15 7.50 7.85 8.20 8.95 9.40 9.75 9.75
Difference 0 + 0.20 0 - 0.35 0 + 0.25 + 0.45 + 0.45
Nominal
Weighted
Average Cost
of Capital
2013 7.05
2014 7.50
Difference + 0.45
2

Commercial Evaluation of Manitoba Hydro Preferred Development Plan Business Case Page 9 of 44
MPA Morrison Park Advisors Inc. January 2014
Taken together, all of these changes result in dramatically different Plans for consideration. Timing and 1
extent of investments has changed, relative importance of exports vs. domestic load has changed 2
(because of lower Manitoba demand), and capital costs have changed for both internal and external 3
reasons. The only commonality between the “new” and “old” versions of the Plans are potential 4
investments in Keeyask, Conawapa and transmission interties. 5
1.2. Scenarios 6
In August 2013 Manitoba Hydro provided data for and analysis of the various Plans in light of 27 7
different scenarios, based on High, Reference and Low forecasts for groups of variables relating to 8
energy prices, capital costs and the economy. In addition, other cases were developed and examined 9
relating to higher and lower demand expectations, and the possibility of droughts at different times in 10
the future. 11
Comprehensive data for the 2014 updated Plans has been provided for a single scenario: reference 12
economics, reference energy and reference capital costs (Ref/Ref/Ref). 13
Based on our model, MPA can and did test the impact of alternative interest costs (as a proxy for 14
broader economic variables) and increased costs for construction of Keeyask and Conawapa (as a proxy 15
for capital cost variables). This should be understood as sensitivity testing, rather than scenario analysis, 16
however. 17
MPA could not test sensitivity to alternative energy prices. Changes in the price of electricity exports and 18
natural gas purchases have important impacts on Manitoba Hydro’s expected behaviour at a plant level: 19
depending on relative prices of exports, natural gas and domestic electricity rates, decisions are made 20
whether to use or build up water reserves, and decisions are made between buying imported power and 21
running domestic plants. These are the critical outputs of Manitoba Hydro’s SPLASH model. Data from 22
Manitoba Hydro’s SPLASH model has been provided only for Reference energy prices, not for High or 23
Low energy prices. MPA’s analysis of potential alternative energy price scenarios must perforce be 24
restricted to conjectures based on the impact of energy prices on the 2013 Plans provided by Manitoba 25
Hydro. 26
Also, while load forecasts are updated with respect to the 2014 versions of the Plans, Manitoba Hydro 27
did not provide additional data from SPLASH model runs with higher or lower Manitoba demand. Again, 28
MPA’s analysis must be restricted to comparisons with previously provided information. 29
1.3. New Analysis and Previous Conclusions 30
As summarized in MPA’s presentation to the PUB in April 2014, we ultimately came to the following 31
conclusions based on all of the information provided to us based on Manitoba Hydro’s 2013 Plans: 32
a) In our view, there was no compelling commercial reason to not go ahead with the Keeyask and 33
transmission interconnection projects, as described in the Preferred Development Plan and 34
several other alternative plans; 35

Commercial Evaluation of Manitoba Hydro Preferred Development Plan Business Case Page 10 of 44
MPA Morrison Park Advisors Inc. January 2014
b) Conawapa – which in our view is better understood as an ongoing development project rather 1
than an immediate commercial opportunity as is Keeyask – faces a higher burden which does 2
not appear to be met: it is not clearly commercially superior to alternatives, in fact appears to be 3
less attractive than certain other alternatives, and therefore Manitoba Hydro should be required 4
to demonstrate why it is appropriate to continue spending development capital on the project 5
instead of pursuing alternatives. 6
In considering the new information provided by Manitoba Hydro, we were guided by these conclusions 7
with respect to our further analysis: 8
• Does the new information suggest that alternatives are now clearly commercially superior to 9
proceeding with Keeyask and the transmission interconnection? 10
• Is Conawapa now more attractive than alternatives as a development opportunity? 11
1.4. Note on Adjustments to the Model 12
MPA’s financial model is identical to the version used to test the original data provided by Manitoba 13
Hydro. No changes were made in order to ensure that new versions of the Plans can be compared to 14
original versions. 15
A critical feature of the model is the domestic rate-setting mechanism. Manitoba domestic rates are set 16
based on Manitoba Hydro’s expected financial performance, as well as based on export prices and 17
volumes. Crucially, changes from year to year are constrained to a maximum of two times the rate of 18
inflation. 19
In the original data provided by Manitoba Hydro, long-term inflation in the Reference economics 20
scenario was 1.9% per year. This resulted in a maximum change in Manitoba domestic rates of 3.8% per 21
year (either up or down). 22
In the 2014 data recently provided, long-term inflation is assumed to be 2% per year, which would result 23
in a maximum annual rate change in our model of 4% per year. The difference of 0.2% per year in 24
maximum change in rates may not at first appear significant, but over the course of 20 years, that small 25
difference in rates does become significant. For example, assuming an initial rate of 100, after 20 years 26
of 3.8% increases the ending rate would be 210. If the rate of increase is instead 4%, then the ending 27
rate is 219. Considered over large volumes of energy, such rate changes could have important impacts 28
on Manitoba Hydro finances. 29
In order to provide insight to the potential impact of rate-setting decisions, MPA tested the model set to 30
both a maximum change in annual rates of 3.8% and 4%. 31
32

Commercial Evaluation of Manitoba Hydro Preferred Development Plan Business Case Page 11 of 44
MPA Morrison Park Advisors Inc. January 2014
2. Model Outputs 1
For each of the Plans (All Gas, 2, 4, 5, 6, PDP), MPA modeled the financial performance of Manitoba 2
Hydro for each of the 99 hydrology patterns provided (the same patterns that were reviewed in our 3
January report to the PUB). A variety of outputs were collected, including ratepayer costs, government 4
revenues, export revenues, etc. In each case, raw outputs were summarized by averaging the results of 5
the 99 hydrology patterns, recording high and low results, and the standard deviations around the mean 6
(note that in an assumed “normal” distribution such as hydrology, approximately two thirds of cases 7
should be within one standard deviation of the mean). 8
In addition, net present values for the results were calculated at both 6% and 10%. 9
2.1. Ratepayer Total Costs 10
Figure 1 below presents the total costs to Manitoba ratepayers over the life of the model, for the 11
Ref/Ref/Ref Scenario. This calculation has been performed based on a 3.8% per year maximum change 12
in domestic rates, consistent with MPA’s January report. 13
Figure 1. Total Cost to Ratepayers at a 3.8% Maximum Annual Rate Change 14
15
Some notable comparisons can be observed: 16
• The results for Plans 4, 5 and 6 (all of which include Keeyask but not Conawapa) are within 1% of 17
each other across all cases (NPV at 6% or 10%, as well as nominal dollars, and also across 18
maximum, minimum and average values). 19
Present Value and Nominal Value of Domestic Revenue
Reference Economics, Energy and Capital
Reference 2013 Manitoba Load; DSM Level II
(2015 - 2062)
($ in millions)
All Gas Plan 2 Plan 4 Plan 5 Plan 6 PDP
Present Value
NPV @ 6.00%
Average $39,659 $40,284 $39,440 $39,636 $39,696 $41,999
Maximum $40,915 $41,569 $40,561 $40,671 $40,816 $43,854
Minimum $38,596 $39,282 $38,274 $38,571 $38,642 $40,815
Standard Deviation $486 $485 $494 $465 $492 $708
Present Value
NPV @ 10.00%
Average $21,999 $22,248 $22,225 $22,312 $22,345 $23,322
Maximum $22,406 $22,720 $22,561 $22,666 $22,736 $23,886
Minimum $21,583 $21,787 $21,737 $21,864 $21,895 $22,961
Standard Deviation $201 $257 $183 $168 $172 $225
Nominal Value
Average $161,316 $162,570 $151,161 $151,791 $151,794 $158,555
Maximum $172,403 $176,999 $161,403 $164,331 $162,887 $172,101
Minimum $153,275 $154,896 $141,117 $142,701 $142,824 $149,689
Standard Deviation $4,568 $4,059 $4,278 $4,212 $4,449 $4,950

Commercial Evaluation of Manitoba Hydro Preferred Development Plan Business Case Page 12 of 44
MPA Morrison Park Advisors Inc. January 2014
• Plan 4, which includes Keeyask and a 250 MW intertie, is very slightly superior in all cases to Plan 1
5, which includes Keeyask and a larger intertie. However, the difference between the two Plans 2
is approximately half of one percent, which is well within the margin of error that should be 3
assumed for a model of this sort. 4
• Plan 2, which includes Keeyask but no transmission intertie, and is therefore a domestically 5
focused Plan, is slightly inferior to Plans 4, 5, and 6 at an NPV of both 6% and 10%. However, in 6
nominal dollar terms it is significantly inferior, which indicates that its costs to ratepayers are 7
higher further out in the future. 8
• The All Gas Plan is competitive with Plans 4, 5, and 6 at an NPV of 6%, but slightly superior (by 9
approximately 1%) at an NPV of 10%. However, in nominal dollar terms the All Gas Plan has the 10
highest ratepayer cost of all Plans modeled, which indicates that its costs to ratepayers are 11
significantly higher further out in the future. 12
• The PDP is approximately 5% inferior to Plans 4, 5 and 6 across all cases. It is the worst 13
performing Plan in terms of NPV calculated at both 6% and 10%, but is superior to the All Gas 14
Plan and Plan 2 in nominal dollar terms. The PDP also has the highest standard deviation, which 15
suggests that it is the most sensitive to hydrology. Notably, there is no discount rate at which 16
the PDP is superior to Plans 4, 5 and 6: they are superior to the PDP regardless of discount rate 17
assumptions (note that nominal dollars are equivalent to a discount rate of 0%). 18
Figure 2 presents the same information as Figure 1, based on the application of a maximum 4% annual 19
change in rates in the model. 20

Commercial Evaluation of Manitoba Hydro Preferred Development Plan Business Case Page 13 of 44
MPA Morrison Park Advisors Inc. January 2014
Figure 2. Total Cost to Ratepayers at a 4% Maximum Annual Rate Change 1
2
Some observations: 3
• As compared to the results with a 3.8% maximum change in rates, the NPVs at both 6% and 10% 4
are slightly higher across all Plans when a 4% maximum change in rates rule is applied. However, 5
total cost to Manitoba ratepayers in nominal dollar terms is lower. This impact is a result of 6
higher rate increases in early years, and lower rates in later years, across all Plans. 7
• Rank ordering between the Plans has not changed despite the move from 3.8% maximum 8
changes in rates to 4% maximum changes in rates. However, the gap between Plans has 9
changed: the difference between the PDP and Plans 4, 5 and 6 has narrowed somewhat, as has 10
the gap between Plan 2 and Plans 4, 5 and 6 when discounted. 11
• The standard deviation applicable to the PDP has significantly decreased. This suggests that 12
more rapid increases in domestic rates and revenues, and the concomitant reduction in debt 13
and interest charges that would result for Manitoba Hydro, are critical to reducing the sensitivity 14
of the PDP to the hydrological performance of Manitoba’s generation fleet. 15
2.2. Comparison to 2013 Plans 16
As noted in section 1.1. above, the updated versions of the Plans contain a number of significant 17
changes from the versions provided in 2013. This has resulted in significant changes in the projected 18
costs to Manitoba ratepayers. The Figure below summarizes the differences in NPV at 6% and 10%, 19
based solely on the Ref/Ref/Ref scenario, with a maximum rate change of 3.8% per year. 20
Present Value and Nominal Value of Domestic Revenue
Reference Economics, Energy and Capital
Reference 2013 Manitoba Load; DSM Level II
(2015 - 2062)
($ in millions)
All Gas Plan 2 Plan 4 Plan 5 Plan 6 PDP
Present Value
NPV @ 6.00%
Average $39,687 $40,313 $39,454 $39,633 $39,699 $42,040
Maximum $40,830 $41,497 $40,557 $40,581 $40,692 $43,533
Minimum $38,652 $39,356 $38,273 $38,520 $38,651 $40,858
Standard Deviation $493 $491 $498 $460 $479 $432
Present Value
NPV @ 10.00%
Average $22,071 $22,285 $22,302 $22,400 $22,439 $23,507
Maximum $22,409 $22,816 $22,695 $22,714 $22,759 $23,987
Minimum $21,588 $21,860 $21,834 $21,958 $21,989 $23,115
Standard Deviation $204 $256 $202 $170 $173 $141
Nominal Value
Average $160,890 $162,840 $150,881 $150,990 $150,948 $155,786
Maximum $174,221 $176,603 $161,941 $164,688 $162,469 $165,868
Minimum $151,390 $156,667 $141,592 $141,259 $139,321 $148,197
Standard Deviation $4,851 $4,080 $4,333 $4,423 $4,674 $3,113

Commercial Evaluation of Manitoba Hydro Preferred Development Plan Business Case Page 14 of 44
MPA Morrison Park Advisors Inc. January 2014
Figure 3. Comparison of 2013 and 2014 Ratepayer Costs 1
2
Across all Plans, projected total costs for Manitoba ratepayers have declined. 3
• It is notable that this decline has occurred despite the fact that expected interest rates have 4
increased, capital costs for projects have increased, and inflation rates have increased slightly. 5
• The declines speak to the powerful impact of dramatically expanded DSM programs (4x the 6
spending contemplated in the 2013 Business Case), which are expected to dramatically reduce 7
Manitoba domestic load, and free up more capacity for export. Moreover, as noted above, the 8
Plans themselves now contemplate a much reduced level of capital spending on generation 9
projects (and generally later in time), though of course spending on enhanced DSM programs 10
will begin almost immediately. 11
• The gap between All Gas and the Keeyask-based Plans has narrowed. All Gas is now marginally 12
superior to Plans 4, 5 and 6 at a 10% discount rate, and essentially identical at a 6% discount 13
rate. Based on the 2013 Plans, Plans 4 and 6 were superior to All Gas at 6%, and Plan 4 was also 14
superior at 10%. 15
• The gap between the PDP and the other Plans has actually increased as compared to the 2013 16
versions of the Plans. 17
2.3. Rate Paths 18
Some of the observations made above with respect to ratepayer costs can be more easily illustrated by 19
reference to projected rate increases in the future. For example, Figure 4 (below) presents rate 20
increases for the PDP under 3.8% and 4% maximum annual rate changes.21
Present Value of Domestic Revenue
Reference Economics, Energy and Capital
2013 Plans vs. 2014 Plans
(2015 - 2062)
($ in millions)
All Gas Plan 2 Plan 4 Plan 5 Plan 6 PDP
Present Value
NPV @ 6.00%
2013 Average $43,791 $42,878 $43,301 $44,230
2014 Average $39,659 $40,284 $39,440 $39,636 $39,696 $41,999
Difference -$4,132 -$3,438 -$3,605 -$2,231
% -9.4% -8.0% -8.3% -5.0%
NPV @ 10.00% $23,623 $23,476 $23,633 $24,148
2013 Average $21,999 $22,248 $22,225 $22,312 $22,345 $23,322
2014 Average -$1,624 -$1,251 -$1,288 -$826
Difference -6.9% -5.3% -5.4% -3.4%
%

Commercial Evaluation of Manitoba Hydro Preferred Development Plan Business Case Page 15 of 44
MPA Morrison Park Advisors Inc. January 2014
Figure 4. Cumulative Rate Increases for the PDP under 3.8% and 4% Annual Rate Change Rules 1
2
The graph on the left depicts the rate paths for the 99 hydrological patterns for the PDP under the Ref/Ref/Ref scenario, with the application of a 3
3.8% rule for maximum annual change in Manitoba domestic rates. On the right, the results are depicted for exactly the same assumptions, 4
except for the use of a 4% maximum annual rate change rule. Since in both cases maximum annual rate increases are required for the first 20 5
years of the model, it can be seen that customer rates in Manitoba are approximately 9% higher in the year 2034 in the right hand graph. By the 6
year 2038, the mid-point of the model period, rates in the right hand graph have peaked for virtually all of the 99 hydrological patterns tested, 7
and rate declines have already begun in many instances. The left hand graph depicts that rates have not yet peaked in 2038 for many 8
hydrological patterns, and the definitive turn downwards does not begin until 2040 or slightly later. 9
An observation that can be drawn from this comparison is that higher rates in the early years of the PDP would bring rates in later years down 10
even further. However, such a change would simply accentuate the trade-off being made between the welfare of ratepayers in different periods 11
of time. 12
Figure 5 (below) depicts the rate paths that would result from Plan 5 under the same conditions. 13
2% Inflation 2% Inflation

Commercial Evaluation of Manitoba Hydro Preferred Development Plan Business Case Page 16 of 44
MPA Morrison Park Advisors Inc. January 2014
Figure 5. Cumulative Rate Increases for Plan 5 under 3.8% and 4% Annual Rate Change Rules 1
2
Cumulative rate increases for Plan 5 appear to peak in the early 2030s, before the mid-way point of the model is reached, then fall for 3
approximately 10 years, and then rise again at a rate less than the maximum allowable (for all but a few hydrological patterns). With the higher 4
allowable 4% change in rates, the peak appears to occur slightly earlier, as would be expected, and the distribution of the rate paths appears to 5
be somewhat more compact until the late years of the model, suggesting that the higher domestic revenues resulting from higher Manitoba 6
rates would reduce the sensitivity of Manitoba Hydro to financial stresses from hydrological patterns. 7
As compared to the PDP, the rate path is radically different, and represents a significantly different inter-generational choice with respect to the 8
allocation of costs and benefits over time. 9
Figure 6 (below) provides the expected rate paths for the All Gas Plan. 10
2% Inflation 2% Inflation

Commercial Evaluation of Manitoba Hydro Preferred Development Plan Business Case Page 17 of 44
MPA Morrison Park Advisors Inc. January 2014
Figure 6. Cumulative Rate Increases for All Gas under 3.8% and 4% Annual Rate Change Rules 1
2
The All Gas Plan represents yet another intergenerational allocation of costs and benefits, with cumulative Manitoba rate increases peaking in 3
the late 2020s, then declining modestly for a decade, before strongly increasing again. This pattern is consistent with the results noted in Section 4
2.1, above, where the All Gas Plan was superior to the PDP at a NPV of 6%, and especially at 10% (because it entails lower rates in the earlier 5
years of the model), but was significantly inferior to the PDP in nominal dollar terms (because of the impact of the very high prices under All Gas 6
in the later years of the model). As compared to Plan 5, cumulative rate increases for All Gas are identical until the late 2020s, then All Gas rates 7
are somewhat lower for approximately 10 years, before Plan 5 rates permanently fall below All Gas rates in the late 2030s. 8
The impact of the higher annual rate change limit, as with the other Plans, is to marginally shorten the initial period of maximum rate increases, 9
and then to make the decline in customer rates more decisive, before allowing them to rise again. 10
11
12
2% Inflation 2% Inflation
Commercial Evaluation of Manitoba Hydro Preferred Development Plan Business Case Page 18 of 44
MPA Morrison Park Advisors Inc. January 2014
2.4. Sensitivities 1
As noted above, Manitoba Hydro has not provided data for the updated Plans across the full range of 27 2
scenarios that were defined in August 2013. Absent SPLASH outputs for energy pricing alternatives, 3
sensitivities of updated Plans to energy price changes cannot be calculated. This will be discussed 4
further below. However, MPA’s model provides the flexibility to test the sensitivity of the Plans to 5
changes in nominal interest rates and to higher construction costs. 6
All sensitivities were calculated based on the 3.8% maximum annual change in domestic rates rule, in 7
order to allow comparison to modeling work previously undertaken by MPA. 8
2.4.1. Interest Rates 9
As noted in section 1.1. above, Manitoba Hydro assumed long-term interest rates of 4.50% for 2014, 10
rising to 6.75% for 2019 onwards. Changing these interest rate assumptions will raise or lower the 11
projected debt interest costs to Manitoba Hydro, and will have a strong impact on the company’s 12
finances. 13
Typically, interest rate changes do not occur in isolation, since changes in interest rates are usually at 14
least partly correlated with changes in inflation rates (as changes in interest costs permeate the 15
economy they have an impact on prices for all goods, to a greater or lesser extent depending on a 16
variety of elasticities of demand and price). However, in our model interest rate changes are isolated 17
from inflation, so a 1% increase in interest charges does not affect assumed inflation (this is equivalent 18
to a 1% change in “real” interest rates). Such a change could occur in the real world if, for example, the 19
cost of debt to the Province of Manitoba (and hence Manitoba Hydro) were to rise or fall because the 20
capital markets change their view of the Province’s economic or fiscal performance. In such a case, 21
underlying Canada interest rates would not change, and inflation would likely not be affected to any 22
significant degree. As was noted in our January report, historically the “spread” between Manitoba and 23
Canada has actually fluctuated substantially over time, without relationship to inflation, so this scenario 24
is not far-fetched. 25
For the purposes of the current analysis, testing the sensitivity of the Plans to changes in interest rates is 26
a proxy for the High/Reference/Low economic scenarios that were previously tested. 27
Figure 7 (below) summarizes the expected total cost to ratepayers from both an increase and a decrease 28
in interest rates of 1%. 29
Currently, Manitoba’s electricity system has the following output characteristics: 30

Commercial Evaluation of Manitoba Hydro Preferred Development Plan Business Case Page 19 of 44
MPA Morrison Park Advisors Inc. January 2014
Figure 7. Sensitivity to Interest Rates 1
2
Interest rates have some clear impacts on total costs to Manitoba ratepayers: 3
• Changes in interest rates have the greatest impact on the PDP, which employs the greatest 4
amount of debt capital, and the least impact on the All Gas Plan, which employs the least 5
amount of debt capital. 6
Present Value and Nominal Value of Domestic Revenue
Reference Economics, Energy and Capital
Reference 2013 Manitoba Load; DSM Level II
(2015 - 2062)
($ in millions)
All Gas Plan 2 Plan 4 Plan 5 Plan 6 PDP
Present Value
NPV @ 6.00%
Average $41,424 $42,324 $41,916 $42,285 $42,338 $45,971
Maximum $42,950 $43,821 $43,409 $43,575 $43,733 $47,659
Minimum $40,028 $41,234 $40,464 $41,032 $40,994 $44,136
Standard Deviation $609 $561 $659 $617 $661 $732
Present Value
NPV @ 10.00%
Average $22,756 $23,172 $23,124 $23,287 $23,292 $24,461
Maximum $23,240 $23,731 $23,548 $23,755 $23,711 $24,893
Minimum $22,318 $22,702 $22,675 $22,898 $22,886 $23,966
Standard Deviation $230 $265 $228 $205 $220 $193
Nominal Value
Average $168,986 $170,449 $165,237 $165,950 $166,785 $190,187
Maximum $183,358 $183,264 $178,972 $178,760 $181,019 $205,753
Minimum $158,243 $163,218 $154,544 $155,096 $155,654 $174,402
Standard Deviation $5,070 $3,778 $4,845 $4,781 $5,049 $6,516
Present Value and Nominal Value of Domestic Revenue
Reference Economics, Energy and Capital
Reference 2013 Manitoba Load; DSM Level II
(2015 - 2062)
($ in millions)
All Gas Plan 2 Plan 4 Plan 5 Plan 6 PDP
Present Value
NPV @ 6.00%
Average $38,076 $38,312 $37,506 $37,631 $37,701 $39,033
Maximum $39,107 $39,485 $38,430 $38,527 $38,549 $40,118
Minimum $37,185 $37,395 $36,415 $36,608 $36,707 $37,953
Standard Deviation $445 $459 $441 $402 $420 $505
Present Value
NPV @ 10.00%
Average $21,295 $21,342 $21,376 $21,458 $21,502 $22,283
Maximum $21,694 $21,888 $21,739 $21,797 $21,827 $22,630
Minimum $20,883 $20,829 $20,971 $21,035 $21,079 $21,918
Standard Deviation $207 $235 $193 $167 $181 $205
Nominal Value
Average $154,164 $154,122 $143,351 $143,109 $143,104 $141,142
Maximum $167,952 $165,362 $152,939 $154,959 $152,952 $148,757
Minimum $146,923 $149,118 $136,304 $137,046 $136,294 $134,001
Standard Deviation $4,248 $3,271 $3,604 $3,658 $3,786 $3,351
Sensitivity: + 1% Interest
Sensitivity: - 1% Interest

Commercial Evaluation of Manitoba Hydro Preferred Development Plan Business Case Page 20 of 44
MPA Morrison Park Advisors Inc. January 2014
• For Plan 5, a 1% increase in interest rates causes the NPV (at 6%) of Manitoba ratepayer costs to 1
rise by approximately 6.5%. For All Gas this sensitivity is only 4.5%, while for the PDP the 2
sensitivity is 9.5%. 3
• At lower interest rates the PDP becomes relatively more attractive, since the gap between the 4
NPV (at a 6% rate) of the PDP and Plans 4, 5 and 6 has narrowed to approximately 4%. In 5
nominal dollar terms the PDP actually has the lowest total cost to Manitoba ratepayers over the 6
life of the model (which suggests that at a very low discount rate the NPV of the PDP would 7
overtake the other Plans). 8
• Interestingly, at lower interest rates the difference between All Gas and Plan 2 (which includes 9
Keeyask but no transmission intertie) essentially disappears. 10
• At higher interest rates the All Gas Plan is superior to all alternatives at both the 6% and 10% 11
NPVs, but not in nominal dollar terms (which suggests that Plans 4, 5 and 6 would be superior to 12
All Gas at a very low discount rate). However, it should be noted that the difference between 13
the NPVs (at a 6% rate) of the All Gas and Plans 4, 5 and 6 are separated by slightly more than 14
1%, which is a barely significant difference. 15
• At higher interest rates the PDP is the most expensive Plan under all discount rates (including 16
nominal dollars, which is a 0% discount rate). 17
2.4.2. Construction Costs 18
Figure 8 (below) presents the results of modeling for total ratepayer costs in the event that the 19
construction costs of Keeyask and Conawapa are higher than currently forecast by $1 Billion (in 2014 $). 20
Note that this sensitivity is not a calculation of generally higher capital costs, but a calculation of the 21
sensitivity of the Plans to specific project cost overruns. If construction costs are generally higher, then 22
all Manitoba Hydro capital investments become more expensive, including those relating to 23
transmission, distribution and administration. MPA does not have the means to calculate such a 24
sensitivity since it does not have access to detailed Manitoba Hydro common cost information. 25

Commercial Evaluation of Manitoba Hydro Preferred Development Plan Business Case Page 21 of 44
MPA Morrison Park Advisors Inc. January 2014
Figure 8. Sensitivity to Construction Cost Increases 1
2
The impact of higher construction costs is very similar to the impact of higher interest rates: 3
• This sensitivity has no impact on the All Gas Plan, since cost increases were tested only for the 4
Keeyask and Conawapa projects. 5
• Adding $1 billion to the construction cost of Keeyask causes Plan 5 NPV (at 6%) of ratepayer 6
costs to rise by slightly less than 3%. At this level, All Gas is approximately 2% superior to Plan 5 7
(or the other Plans including Keeyask in 2019). However, at lower discount rates Plans 4, 5 and 6 8
would still be superior to All Gas. 9
• The PDP is clearly inferior to all other Plans if both Keeyask and Conawapa construction costs 10
are increased. 11
2.4.3. Energy Prices 12
As noted above, Manitoba Hydro did not provide SPLASH data for High and Low energy prices applied to 13
the updated Plans, as they did for the 2013 Plans. As a result, it is not possible for MPA to examine in 14
detail the potential impact on Manitoba ratepayers if energy prices were to fluctuate away from 15
Reference assumptions. However, based on the work completed previously, and the new information 16
available, it is possible to make “educated guesses” as to the sensitivity of the various Plans to energy 17
prices. 18
Present Value and Nominal Value of Domestic Revenue
Reference Economics, Energy and Capital
Reference 2013 Manitoba Load; DSM Level II
(2015 - 2062)
($ in millions)
All Gas Plan 2 Plan 4 Plan 5 Plan 6 PDP
Present Value
NPV @ 6.00%
Average $39,659 $40,937 $40,496 $40,729 $40,768 $43,975
Maximum $40,915 $42,140 $41,738 $41,787 $41,927 $45,252
Minimum $38,596 $39,903 $39,415 $39,751 $39,813 $42,549
Standard Deviation $486 $504 $503 $462 $486 $526
Present Value
NPV @ 10.00%
Average $21,999 $22,483 $22,641 $22,742 $22,756 $23,915
Maximum $22,406 $22,900 $22,992 $23,037 $23,081 $24,276
Minimum $21,583 $21,997 $22,252 $22,419 $22,439 $23,482
Standard Deviation $201 $265 $168 $147 $145 $147
Nominal Value
Average $161,316 $166,224 $156,295 $156,941 $157,233 $173,282
Maximum $172,403 $183,673 $168,821 $169,759 $168,430 $183,628
Minimum $153,275 $158,664 $144,142 $147,314 $147,132 $163,259
Standard Deviation $4,568 $5,068 $4,374 $4,366 $4,552 $4,358
Sensitivity: + $1 Billion for Keeyask, + $1 Billion for Conawapa (2014 $)

Commercial Evaluation of Manitoba Hydro Preferred Development Plan Business Case Page 22 of 44
MPA Morrison Park Advisors Inc. January 2014
In response to an information request from the PUB, in the record as PUB/MPA 1-004(a), MPA 1
calculated the impact on various Plans of altering energy price assumptions while holding economics 2
and capital variables at Reference assumptions. The following is a reprint of those outputs: 3
Figure 9. Excerpt from PUB/MPA1-004(a) 4
5
In our work on the 2013 Plans, we concluded that energy prices had an inverse relationship to Manitoba 6
ratepayer costs for those Plans which included Keeyask and Conawapa, but not necessarily for the All 7
Gas Plan. In other words, High energy prices would lead to lower Manitoba ratepayer costs in the Plans 8
based on the Keeyask and Conawapa projects. 9
One reason for this relationship is the higher export emphasis of those Plans. Recall that “energy prices” 10
in the Manitoba Hydro scenarios consisted of a complex of four variables: electricity export prices (to 11
the MISO market), electricity import prices (from the MISO market), natural gas prices (at delivered cost 12
to Manitoba natural gas-fired electricity facilities), and carbon costs (as potentially imposed on fossil 13
fuel-burning electricity generation facilities in the future). As these prices rise (in concert, as per 14
Manitoba Hydro), Plans which include more gas-fired generation would suffer from higher natural gas 15
fuel costs. On the other hand, Plans which emphasize hydroelectric production would not be affected by 16
natural gas prices, but would benefit from higher export prices in the MISO market. Over the course of a 17
48-year model the picture is complicated by the fact that hydrology is different every year, and in 18
droughts the impact of energy prices is reversed across Plans (high prices are bad for hydroelectric Plans 19
in a drought because imports will be more expensive). However, since droughts are a relatively 20
infrequent occurrence, they do not dominate the average impact across Plans. 21
Table 3 (below) compares the role of exports in the 2013 versions of the Plans with the role of exports in 22
the updated versions (calculated from the 6% NPV figures). 23
Table 3. Export as % of Total Revenues – 2013 vs. Updated Plans 24
All Gas 2 4 5 6 PDP
2013 Version 8.6% 14.2% 13.8% 17.3%
2014 Version 13.9% 16.1% 20.2% 21.4% 21.1% 27.5%
Change + 5.3% + 6.0% + 7.3% + 10.2%
PV of Domestic Revenue
Comparison of Sensitivity to Energy Scenarios
Economic and Capital Scenarios at Reference
(in millions)
Plan 1 Plan 4 Plan 6 Plan 12 Plan 14 Plan 1 Plan 4 Plan 6 Plan 12 Plan 14
High $44,107 $41,868 $42,317 $42,409 $41,991 $23,441 $22,810 $22,991 $23,274 $23,268
Reference $43,791 $42,878 $43,301 $44,727 $44,230 $23,623 $23,476 $23,633 $24,285 $24,148
Low $43,695 $44,192 $44,585 $47,375 $47,037 $23,724 $24,017 $24,169 $25,122 $25,037
Sensitivity from
Low to High 0.94% -5.26% -5.09% -10.48% -10.73% -1.19% -5.02% -4.87% -7.35% -7.06%
6.00% Discount Rate 10.00% Discount Rate

Commercial Evaluation of Manitoba Hydro Preferred Development Plan Business Case Page 23 of 44
MPA Morrison Park Advisors Inc. January 2014
The significant increases in revenues from exports for Manitoba Hydro across all of the updated Plans 1
result from the much lower domestic demand in Manitoba due to Level 2 DSM programs. The updated 2
All Gas Plan has an export orientation as strong as the 2013 versions of Plans 4 and 6. The updated 3
versions of Plans 4 and 6 are now almost 50% more export oriented, and in fact are projected to 4
generate more revenue from exports that the 2013 version of the PDP. 5
This suggests that ratepayer costs in all of the updated Plans are inversely proportional to energy prices, 6
and likely quite strongly inversely proportional. 7
2.5. Inter-generational Impacts 8
In section 2.3. above, the depiction of rate paths for different Plans suggest strongly diverging treatment 9
of Manitoba ratepayers over time. 10
• Regardless of the Plan chosen, ratepayers will face the maximum allowable rate increase for the 11
next fifteen years under all Plans. 12
• After approximately 2030, the Plans diverge fairly dramatically, and continue to diverge for 13
decades to come. 14
2.5.1. NPVs for Shorter Periods 15
MPA calculated the NPVs for domestic ratepayer costs for periods of 20 years and 30 years, as well as 16
for 48 years. Figure 10 (below) presents these calculations for a 3.8% annual maximum rate change per 17
year. 18
Figure 10. NPV of Ratepayer Costs for Alternative Periods 19
20
A variety of observations can be made from this data: 21
Present Value of Domestic Revenue
Reference Economics, Energy and Capital
20 year, 30 year and 48 year periods
($ in millions)
All Gas Plan 2 Plan 4 Plan 5 Plan 6 PDP
Present Value
NPV @ 6.00%
2015 - 34 $24,244 $24,094 $24,911 $24,965 $24,993 $25,212
2015 - 44 $31,014 $31,728 $32,111 $32,314 $32,407 $34,694
2015 - 62 $39,659 $40,284 $39,440 $39,636 $39,696 $41,999
NPV @ 10.00%
2015 - 34 $17,224 $17,133 $17,572 $17,599 $17,612 $17,721
2015 - 44 $19,900 $20,149 $20,440 $20,526 $20,566 $21,488
2015 - 62 $21,999 $22,248 $22,225 $22,312 $22,345 $23,322

Commercial Evaluation of Manitoba Hydro Preferred Development Plan Business Case Page 24 of 44
MPA Morrison Park Advisors Inc. January 2014
• In the first 20 year period, Plan 2 is actually the least costly for ratepayers. This is likely the case 1
because it does not involve writing off the costs sunk into Keeyask (as the All Gas Plan does), 2
while new spending on Keeyask occurs relatively late in the period. 3
• The All Gas Plan represents the lowest ratepayer cost if the period examined is 30 years. In fact, 4
the gap between the All Gas Plan and Plans 4, 5 and 6 is actually wider at 30 years than at 20 5
years, and the gap between All Gas and the PDP is also at its widest point. 6
• The gap between All Gas and Plans 4, 5 and 6 is never more than approximately 4%, regardless 7
of the discount rate selected. 8
• When the examined period is 48 years, Plans 4, 5 and 6 have caught up to or surpassed the All 9
Gas Plan, which suggests that ratepayers in that final 18 year period are dramatically better off 10
under Keeyask-based Plans. 11
• While the PDP has the highest ratepayer costs under all periods, the gap narrows considerably 12
over time. If the model were to progress beyond 48 years, then it is likely that the ranking of the 13
PDP would continue to improve in nominal dollar terms. However, depending on the discount 14
rate selected, the PDP might never catch up to Plans 4, 5 and 6. Higher discount rates 15
dramatically reduce the present value effect of results so far in the future. 16
• From an inter-generational perspective, choice of Plans (considered solely from the perspective 17
of ratepayer costs) is largely irrelevant to people who are likely to be ratepayers only for the 18
next 15 years (e.g., older ratepayers, or businesses that do not foresee a long-term future in the 19
province). However, beyond that point, the choice of Plans can have a very significant impact. 20
Generational burdens, and the likely competitiveness of Manitoba electricity rates, will be very 21
different depending on the choices made. 22
2.5.2. PUB Rate-setting Impacts 23
As noted above, MPA ran a financial model at both a 3.8% maximum annual change in domestic rates 24
and a 4% annual maximum change. While the model was originally constructed to allow a maximum 25
annual change of two times the projected rate of inflation (i.e., 2 x 2% = 4%), since the projected rate of 26
inflation was previously 1.9% we ran the model both ways to ensure that comparisons could be made 27
with previous results. 28
It is apparent that the setting of rates has important impacts on both total costs to ratepayers, 29
intergenerational allocation of ratepayer costs, and the financial health of Manitoba Hydro. 30
In order to more clearly illustrate these issues, we ran the model at a maximum annual change in 31
domestic rates of 5% for Plan 5 and the PDP. This is two and one half times the projected long-term rate 32
of inflation, and represents a significant and noticeable annual increase in rates. At 5% growth per year 33
existing rates would double in 15 years, and triple in 23 years, as compared to 18 and 29 years 34
respectively for a 4% annual increase. 35

Commercial Evaluation of Manitoba Hydro Preferred Development Plan Business Case Page 25 of 44
MPA Morrison Park Advisors Inc. January 2014
Figure 11. Manitoba Ratepayer Costs at 4% and 5% Maximum Annual Rate Change 1
2
• As can be noted from the Figure, NPV results do not change dramatically for either Plan as a 3
result of adopting a higher maximum annual rate change. While rates are rising faster in the 4
early years of the model, the process of discounting the future (which makes earlier ratepayer 5
costs more important) offsets the benefits achieved by Manitoba Hydro more quickly recovering 6
costs. 7
• In nominal dollar terms, raising rates by 5% per year has a significant impact, particularly for the 8
PDP, which sees total nominal dollar ratepayer costs fall by approximately 4% over the life of the 9
model. At very low discount rates, this effect would also be noticeable. 10
Rate charts illustrate the impact of increasing the maximum allowed annual rate change. 11
Present Value and Nominal Value of Domestic Revenue
Reference Economics, Energy and Capital
Reference 2013 Manitoba Load; DSM Level II
(2015 - 2062)
($ in millions)
Present Value @4% @5% @4% @5%
NPV @ 6.00%
Average $39,633 $39,764 $42,040 $41,352
Maximum $40,581 $40,775 $43,533 $42,591
Minimum $38,520 $38,719 $40,858 $40,222
Standard Deviation $460 $455 $432 $524
Present Value
NPV @ 10.00%
Average $22,400 $22,824 $23,507 $23,682
Maximum $22,714 $23,209 $23,987 $24,362
Minimum $21,958 $22,221 $23,115 $23,138
Standard Deviation $170 $175 $141 $227
Nominal Value
Average $150,990 $148,489 $155,786 $149,665
Maximum $164,688 $163,013 $165,868 $160,936
Minimum $141,259 $139,894 $148,197 $138,458
Standard Deviation $4,423 $4,422 $3,113 $4,823
5 PDP

Commercial Evaluation of Manitoba Hydro Preferred Development Plan Business Case Page 26 of 44
MPA Morrison Park Advisors Inc. January 2014
Figure 12. Comparison of PDP Rate Paths with 4% and 5% Maximum Annual Rate Change Rule 1
2
It is apparent from these graphs that raising rates at 5% per year versus 4% has a dramatic impact on rate path. While under 5% annual rate 3
increases a doubling of rates is reached sooner, the rates peak earlier and at a lower absolute level before declining. The logic behind these 4
differences centres on the fact that Manitoba Hydro would be generating significantly more revenue in the early years of the Plan, and hence 5
would be taking on less debt, paying less interest over time, and more quickly paying down debt principal, which allows rate declines to be 6
implemented. 7
Interestingly, the 5% graph demonstrates greater sensitivity to hydrological patterns (since the 99 lines are spread more widely after 2040). In 8
the 4% graph, the spreading of the lines appears to begin in about 2055, suggesting that if the model were continued further into the future, a 9
similar phenomenon would take place. 10
From an inter-generational perspective, the 5% path demonstrates more clearly than ever that the economic trade-off between ratepayers at 11
different points in the future is crucially affected by the PUB’s rate-making policies. 12
2% Inflation 2% Inflation

Commercial Evaluation of Manitoba Hydro Preferred Development Plan Business Case Page 27 of 44
MPA Morrison Park Advisors Inc. January 2014
1
Figure 13. Comparison of Plan 5 Rate Paths with 4% and 5% Maximum Annual Rate Change Rule 2
3
For Plan 5, the cumulative rate impact of allowing 5% annual rate changes rather than 4% is less immediately apparent than for the PDP. 4
However, it is clear that the first rate peaks occur earlier in the 5% case, and that the subsequent rate decline is deeper before rates resume 5
their upward trajectory. For example, in 2038, rates in the 4% case are between 60% and 100% above the initial level, while in the 5% case rates 6
are only 60% to 80% above the initial level. 7
Finally, it is interesting to note that after reaching their bottom, both rate paths essentially begin to follow an upward trajectory roughly 8
consistent with inflation. This is very likely to be a reflection of the inflation-based assumptions embedded into the model further into the 9
future. It perhaps suggests the essentially mechanical nature of the modeling exercise beyond the limits of the projects that can actually be 10
planned in detail today. 11
12
2% Inflation 2% Inflation

Commercial Evaluation of Manitoba Hydro Preferred Development Plan Business Case Page 28 of 44
MPA Morrison Park Advisors Inc. January 2014
2.6. Government Revenues 1
An important element of the review of the alternative Plans is the revenue that they are expected to 2
deliver to the Government of Manitoba. 3
Government revenues were projected based on the 3.8% maximum annual rate change rule so that 4
figures would be comparable to earlier modeling. Outputs are provided at a 6% discount rate, a 3% 5
discount rate (which approximates the government’s own cost of funds), and in nominal dollars. 6
Figure 14. Government of Manitoba Revenues 7
8
Unsurprisingly, the PDP provides the Government with the most revenue: across each revenue source 9
individually, in total, and regardless of the discount rate calculation. This should be expected since the 10
PDP uses the most water, the most capital, and the most debt of all of the Plans. 11
From the Government’s perspective, however, the benefits of additional revenue from Manitoba Hydro 12
must be balanced against the higher costs to ratepayers that result from the PDP, and the potential 13
economic drag that may result from those higher rates (higher costs for a staple such as electricity is 14
roughly the equivalent of a reduction in disposable income for individuals and businesses, which results 15
in lower tax revenue to the Government from sources other than Manitoba Hydro). 16
Government revenues can also be compared as between the 2013 versions of the Plans, and the 17
updated versions. 18
Average Present Value of Revenue to the Province of Manitoba
Reference Economics, Energy and Capital
Reference 2013 Manitoba Load; DSM Level II
(2015 - 2062)
($ in millions)
Revenue All Gas Plan 2 Plan 4 Plan 5 Plan 6 PDP
NPV @ 6.00%
Water Rental $1,606 $1,669 $1,768 $1,771 $1,769 $1,887
Capital Tax $1,510 $1,756 $1,830 $1,856 $1,855 $2,247
$3,116 $3,425 $3,599 $3,627 $3,623 $4,133
Debt Guarantee Fee $2,370 $2,692 $2,838 $2,918 $2,908 $3,486
$5,486 $6,117 $6,437 $6,545 $6,531 $7,619
NPV @ 3.00%
Water Rental $2,628 $2,780 $2,928 $2,931 $2,928 $3,207
Capital Tax $2,635 $3,147 $3,166 $3,209 $3,207 $4,021
$5,263 $5,927 $6,094 $6,139 $6,135 $7,228
Debt Guarantee Fee $3,987 $4,642 $4,565 $4,701 $4,671 $5,646
$9,250 $10,569 $10,659 $10,840 $10,807 $12,874
Nominal Dollars
Water Rental $5,103 $5,506 $5,745 $5,749 $5,744 $6,472
Capital Tax $5,490 $6,679 $6,494 $6,572 $6,573 $8,440
$10,593 $12,185 $12,239 $12,320 $12,317 $14,912
Debt Guarantee Fee $7,998 $9,430 $8,561 $8,813 $8,727 $10,278
$18,591 $21,615 $20,800 $21,133 $21,045 $25,190Total
subtotal
Total
subtotal
Total
subtotal

Commercial Evaluation of Manitoba Hydro Preferred Development Plan Business Case Page 29 of 44
MPA Morrison Park Advisors Inc. January 2014
Table 4. Government Revenues at 6% Discount Rate Ref/Ref/Ref – 2013 vs. Updated Plans 1
All Gas 2 4 5 6 PDP
2013 Version $5,866 $6,733 $6,775 $8,061
2014 Version $5,486 $6,117 $6,437 $6,545 $6,531 $7,619
Change - 6.5% - 4.4% - 3.6% - 5.5%
2
Across all of the Plans, government revenues have declined with the updates made. In addition, the 3
relative size of the gap between the PDP and most of the other Plans has narrowed slightly. 4
Nevertheless, a gap continues to exist. 5
6
Commercial Evaluation of Manitoba Hydro Preferred Development Plan Business Case Page 30 of 44
MPA Morrison Park Advisors Inc. January 2014
3. The Impact of Droughts 1
In our response to PUB/MPA 1-027, MPA provided a detailed description of the projected consequence 2
of a “challenging” hydrological pattern. This pattern included two significant periods of drought, as well 3
as a generally low average hydrology over an extended period of time. 4
In order to consider the impact of the updates made to the Plans, the same hydrological pattern was 5
examined. Only the Ref/Ref/Ref scenario can be properly compared, as data for other scenarios (and in 6
particular High and Low energy scenarios) has not been provided by Manitoba Hydro. Maximum annual 7
rate changes are maintained at 3.8% to avoid adding a further difference. 8
Note that in the IR noted above MPA examined All Gas, Plans 4, 6 and 12, and the PDP. With the 9
updated 2014 information, a slightly different set of alternatives was tested: All Gas, Plans 2, 4, 5, 6 and 10
the PDP. 11
3.1. Net Income 12
The following Figure compares the results of the 2013 Plans with the updated Plans. 13
Across all Plans it is immediately apparent that financial performance is now stronger. With the updated 14
Plans, Manitoba Hydro is far less likely, even under very challenging hydrological conditions, to suffer 15
negative net income. After 2021, only the All Gas Plan and Plans 1, 2 and 4 have any years with negative 16
net income, notwithstanding the fact that Manitoba Hydro is presumed to be facing serious drought 17
years in this projection. 18
A lower debt burden resulting from delayed generation projects (as compared to the 2013 versions of 19
the Plans) clearly plays a role in these results. 20
21

Commercial Evaluation of Manitoba Hydro Preferred Development Plan Business Case Page 31 of 44
MPA Morrison Park Advisors Inc. January 2014
Figure 15. Net Income Performance Under Challenging Hydrology – 2013 vs. 2014 1
2
3
4
Commercial Evaluation of Manitoba Hydro Preferred Development Plan Business Case Page 32 of 44
MPA Morrison Park Advisors Inc. January 2014
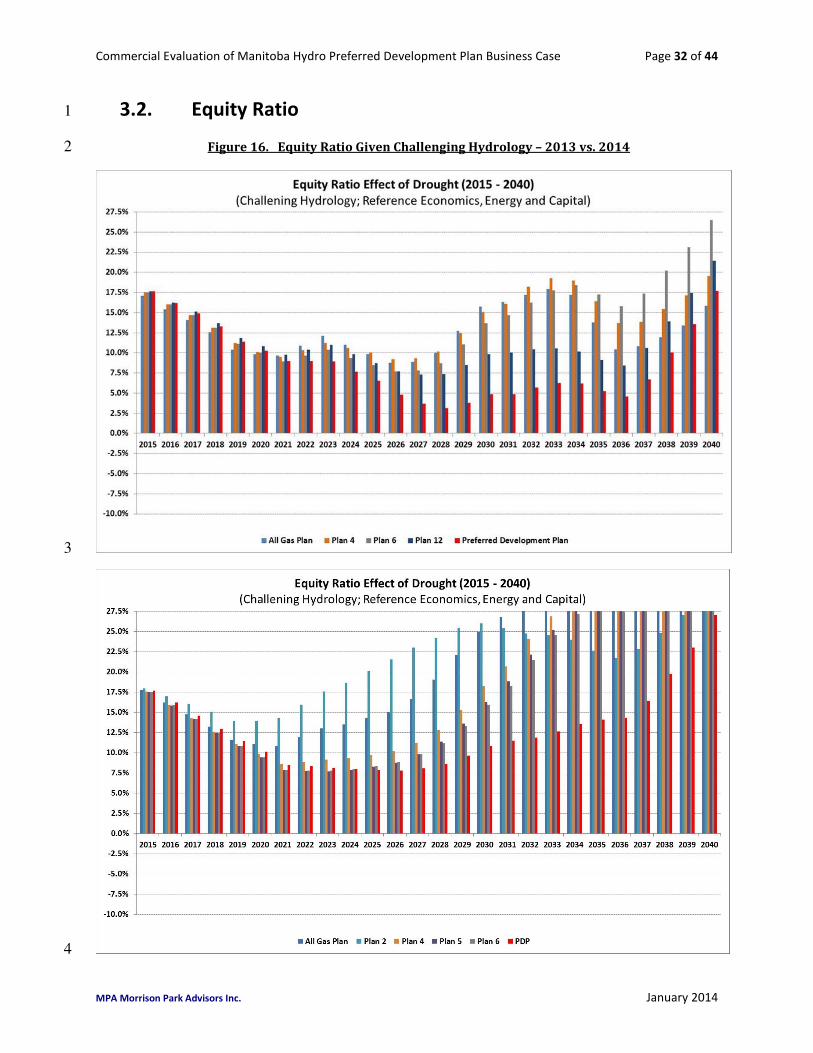
3.2. Equity Ratio 1
Figure 16. Equity Ratio Given Challenging Hydrology – 2013 vs. 2014 2
3
4

Commercial Evaluation of Manitoba Hydro Preferred Development Plan Business Case Page 33 of 44
MPA Morrison Park Advisors Inc. January 2014
Note that Manitoba Hydro’s equity ratio target is 25%. 1
The equity ratio results for the updated versions of the Plans are consistent with net income 2
performance: 3
• For many of the Plans, the target equity ratio is met within 20 years, even under this challenging 4
hydrology scenario. 5
• The PDP does not meet its equity ratio until 2040, but while its equity ratio falls below 10%, it 6
never drops below 5%, as it did with the 2013 version of the Plan. 7
• For Plans 4, 5 and 6, the equity ratio is below 10% for less than a decade before improving 8
strongly. 9
3.3. Interest Coverage Ratio 10
The improvement of the 2014 version of the Plans can be readily seen in the interest coverage ratio 11
projection as well. 12
The 2013 versions of the Plans resulted in at least 10 years of interest coverage ratio below 1x for all 13
Plans. In a few instances Plans actually fell below 0.5x for brief periods. The 2014 versions of the Plans 14
are more robust, with few having interest coverage ratios below 1x for more than 5 years, and only one 15
falling to 0.5x for a single year. 16

Commercial Evaluation of Manitoba Hydro Preferred Development Plan Business Case Page 34 of 44
MPA Morrison Park Advisors Inc. January 2014
Figure 17. Interest Coverage Ratio Given Challenging Hydrology – 2013 vs. 2014 1
2
3

Commercial Evaluation of Manitoba Hydro Preferred Development Plan Business Case Page 35 of 44
MPA Morrison Park Advisors Inc. January 2014
3.4. Operating Cash Flow Less Capital Expenditures 1
The principal financial difference between the 2013 and 2014 versions of the Plans is demonstrated by 2
the calculation of cash flow less annual capital expenditures. The 2014 versions of the Plans require far 3
less debt to be accumulated over time, across all Plans. This results in less debt, and hence less interest 4
cost. 5
In addition, the repayment of debt principal begins much earlier in all Plans. 6
Despite a very challenging hydrology pattern, the 2014 versions of the Plans indicate no significant risk 7
of perceived financial distress in a Ref/Ref/Ref scenario. 8
9

Commercial Evaluation of Manitoba Hydro Preferred Development Plan Business Case Page 36 of 44
MPA Morrison Park Advisors Inc. January 2014
Figure 18. Cash Flow Less Capital Expenditures Given Challenging Hydrology – 2013 vs. 2014 1
2
3

Commercial Evaluation of Manitoba Hydro Preferred Development Plan Business Case Page 37 of 44
MPA Morrison Park Advisors Inc. January 2014
3.5. Sensitivity 1
As was noted above, without detailed SPLASH model outputs it is not possible for MPA to produce valid 2
projections in alternate scenarios. However, we were able to test Manitoba Hydro’s financial 3
performance under this challenging hydrology pattern based on the sensitivities described above. Two 4
examples appear to provide useful insights. 5
3.5.1. Higher Interest Costs 6
Increasing the rate of interest applied to Manitoba Hydro increases its net costs, reduces net income, 7
and reduces its operating cash flow. The financial effect is similar to a reduction in revenue that might 8
be caused by lower export prices. 9
In the challenging hydrology environment presented here, a one percent increase in interest rates 10
causes all of the financial indicators to deteriorate. A comparison is provided below between the 11
performance of the updated 2014 Plans at Ref/Ref/Ref and the same Plans at an interest rate one 12
percent higher than projected in the Ref/Ref/Ref scenario. 13
14

Commercial Evaluation of Manitoba Hydro Preferred Development Plan Business Case Page 38 of 44
MPA Morrison Park Advisors Inc. January 2014
Figure 19. Cash Flow Less Capital Expenditures Given Challenging Hydrology – Base vs. +1% 1
2
3
The effect of increasing the interest rate by 1% is reduced cash flow across all Plans. 4
Commercial Evaluation of Manitoba Hydro Preferred Development Plan Business Case Page 39 of 44
MPA Morrison Park Advisors Inc. January 2014
Those Plans that have greater capital requirements, and in particular the PDP, are particularly affected 1
by the change in interest rates. Since the same Plans that are more capital intensive are more sensitive 2
to export prices, as noted above, it should be assumed that a decline in export prices below the 3
Reference projection would similarly affect the same Plans to a greater degree. 4
It is notable that cash flow in some Plans actually improves under the higher interest rate case in the 5
late years of the model depicted on the graph. This is a result of the relationship between rate increases 6
and the timing of droughts: in a lower interest rate environment, robust financial health at Manitoba 7
Hydro allows for lower Manitoba domestic rates and greater reliance on exports. When drought sets in 8
and exports are curtailed, however, this means that a greater drop in revenue results, and the limitation 9
on the maximum rate increase subsequent to the drought limits the ability of Manitoba Hydro to quickly 10
recover its financial position. In a higher interest rate environment, rates would not have been declining 11
as rapidly, so the onset of drought would not have as great an impact on the company’s finances, and 12
recovery would be more rapid after the fact. 13
3.5.2. Higher Maximum Rate Increases 14
The financial robustness of Manitoba Hydro in the face of drought is to some degree in the hands of the 15
PUB through its rate-setting policy. As part of its modeling exercise, MPA calculated the projected 16
performance of Manitoba Hydro in the face of drought at both maximum annual rate changes of 3.8% 17
and 4.0%. The impact of this difference is depicted below for the net income of the updated 2014 Plans. 18
19

Commercial Evaluation of Manitoba Hydro Preferred Development Plan Business Case Page 40 of 44
MPA Morrison Park Advisors Inc. January 2014
Figure 20. Net Income Given Challenging Hydrology – 3.8% vs. 4% Maximum Annual Rate Increase 1
2
3

Commercial Evaluation of Manitoba Hydro Preferred Development Plan Business Case Page 41 of 44
MPA Morrison Park Advisors Inc. January 2014
While the difference between a 3.8% maximum change in rates and 4% is small, it is nevertheless 1
noticeable beginning in about 2020. Across all Plans net income rises to higher levels in the 2020s, as 2
does cash flow, reducing the amount of debt that Manitoba Hydro must carry. By the early 2030s net 3
income has improved by approximately $200 million per year for most Plans. 4
As can be recalled from Figures 4, 5 and 6, above, the difference between maximum rate changes of 5
3.8% and 4% allows domestic rates to peak earlier and then begin to decline. Given the mid-2030s 6
timing of the major drought in this particular hydrological pattern being examined, several of the Plans 7
would be caught by the limitation on rate increases. For example, Plan 1 would have had declining rates 8
beginning in the late 2020s, but when the drought hits, the model only allows rate increases of 4%, 9
despite very significant declines in net income caused by the drought. As a result, Manitoba Hydro’s 10
financial position worsens dramatically for a few years before recovering. However, as the graph below 11
demonstrates, this is not a major financial risk, because Manitoba Hydro’s finances have already 12
become robust by that point. Notwithstanding the sharply negative net income resulting from the All 13
Gas Plan during the drought of the 2030s, Manitoba Hydro’s equity ratio does not fall below 20%. 14
Figure 21. Equity Ratio Given Challenging Hydrology – 4% Annual Maximum Rate Change 15
16
This demonstrates that there is a direct trade-off between inter-generational concerns in rate-setting 17
policies, and the financial robustness of Manitoba Hydro to withstand challenging hydrology and other 18
financially threatening events. The differences between the Plans suggests that this flexibility should be 19
relied upon if Manitoba Hydro ultimately pursues a Plan that has a higher capital intensity, and is 20

Commercial Evaluation of Manitoba Hydro Preferred Development Plan Business Case Page 42 of 44
MPA Morrison Park Advisors Inc. January 2014
therefore more likely to be subject to significant financial shocks from drought or other causes during 1
the next 20 years. 2
3
4

Commercial Evaluation of Manitoba Hydro Preferred Development Plan Business Case Page 43 of 44
MPA Morrison Park Advisors Inc. January 2014
4. Conclusions 1
4.1. Keeyask and the Intertie 2
Does the new information provided by Manitoba Hydro suggest that alternatives are now clearly 3
commercially superior to proceeding with Keeyask and the transmission interconnection? 4
As shown in Chapter 2 above, the gap between the All Gas Plan and Plans which include Keeyask 2019 5
and a transmission intertie, has narrowed somewhat. The Plans are essentially identical in their 6
ratepayer impact for the first 15 years, but in the second 15 years All Gas appears to have an advantage, 7
which it then gives up in the final period of our financial model. 8
However, this gap is not large enough overall to appear to be significant, given all of the caveats about 9
assumptions and precision that must be recognized in any long-term financial modeling exercise. 10
As was noted by MPA before the PUB, Keeyask and the transmission intertie are immediate, real, 11
actionable projects, which in our view should not be dismissed without clear evidence of commercially 12
superior alternatives. Neither the All Gas Plan, nor Plan 2 (which does not include an intertie and 13
schedules Keeyask for a later build) appear to satisfy that condition from the perspective of ratepayers. 14
From the government’s perspective, the All Gas Plan provides the lowest revenues over time, and 15
generates the least export revenue (in addition to fewer jobs and economic development, which is an 16
issue outside our scope). 17
From the perspective of potential financial distress, neither the All Gas Plan nor Plan 2 can be 18
demonstrated to be demonstrably different from Plans 4, 5 and 6 under a challenging hydrology 19
scenario, as can be seen from the review of this issue in Chapter 3, above. While the exact timing of 20
investments and potential drought or other distress events result in differences between Plans, it is not 21
clear that there is any clear superiority or inferiority as between the Plans considered over a long period 22
of time. 23
Based on this review of the new information, MPA sees no reason to modify our views as expressed 24
before the PUB. 25
4.2. Conawapa 26
Does the new information provided by Manitoba Hydro suggest that Conawapa is now a more attractive 27
development opportunity than alternatives, and therefore deserves expenditure of substantial 28
resources to the exclusion of other opportunities? 29
As noted in section 2.1 above, the PDP is clearly inferior to Plans 4, 5 and 6 across all discount rates, 30
including 0%. Increasing the maximum annual rate change from 3.8% to 4% does not change this 31
conclusion. Even at a maximum rate change of 5% (2.5x the rate of inflation), Plan 5 is still superior to 32
the PDP in a Ref/Ref/Ref scenario. 33

Commercial Evaluation of Manitoba Hydro Preferred Development Plan Business Case Page 44 of 44
MPA Morrison Park Advisors Inc. January 2014
As has been noted in the past, the PDP is more sensitive to export prices and interest rates than other 1
Plans. As a result, it is reasonable to believe that should interest rates fall below Reference projections, 2
or export prices rise above Reference projections, then the gap between the PDP and alternatives could 3
narrow. 4
From the government’s perspective, it is unquestionable that the PDP delivers greater revenue than 5
alternatives (as well as more jobs and economic development). However, does this benefit decisively 6
outweigh the greater cost to Manitoba ratepayers that should be expected? 7
A final consideration is that according to the updated 2014 Plan presented by Manitoba Hydro, the PDP 8
now contemplates Conawapa for an in-service date of 2031, with construction commencement more 9
than 10 years away. Given this extended timeframe for continued development, it does not appear 10
reasonable to assume that Conawapa should be an exclusive development priority superior to other 11
alternatives. 12
MPA continues to support its comments to the PUB that Conawapa should be considered a 13
development opportunity, competing with other potentially superior alternatives, and continued 14
expenditures to develop Conawapa should be justified in that light. 15