review reliability based methods - eurofitnet.org · this report edited by vtt presents a status...
TRANSCRIPT
TECHNICAL REPORTMANUFACTURING TECNOLOGYKim Wallin & Pekka NevasmaaREF: SINTAP VTT/4 (SINTAP-3-2-1997)
Brite-Euram Project No.: BE95-1426Contract No.: BRPR-CT95-0024Task No.: 3Date: 17.03.1997Contributing Organisations: VTT, TWI, British Steel,
SAQ, JRC and NE
STRUCTURAL INTEGRITY ASSESSMENT PROCEDURES FOREUROPEAN INDUSTRY
SINTAP
TASK 3 STATUS REVIEW REPORT:RELIABILITY BASED METHODS
REPORT VAL A: SINTAP VTT/4
Reported by: VTT Manufacturing Technology
Editors: P. Nevasmaa & K. Wallin
Espoo, March 1997
VTT Manufacturing TechnologyP.O. Box 1704, 02044 VTT, Finland
Tel. +358 9 4561, Fax. +358 9 456 7002

MANUFACTURING TECHNOLOGY 17.03.1997 1(72)
SUMMARY
This report edited by VTT presents a status review of currently available data for "Structural IntegrityAssessments Procedures for European Industry" (SINTAP) Task 3 "Reliability Based Methods - Optimisedtreatment of data". It is contributed by the following partners: Technical Research Centre of Finland / VTTManufacturing Technology (VTT/VAL), Finland, The Welding Institute (TWI), United Kingdom, British Steel plc(BS), United Kingdom, SAQ Inspection Ltd. (SAQ), Sweden, European Commission Joint Research Centre,Petten (JRC), Netherlands and Nuclear Electric Ltd. (NE), United Kingdom.
Structural integrity can be regarded as the demonstration of the fitness-for-purpose of engineeringcomponents and structures throughout their operational lifetime. Used correctly, such an approach canprovide a balance between economy and concern of safety. It can also prevent unnecessary repairs duringthe structure's lifetime. This is a crucial matter especially in structures intended for demanding applications,like offshore construction, power generation and processing. Despite significant improvements in thescope and accuracy of such methods in recent years, problems still exist. In particular, the absence of asingle unified method in Europe which can be used in industry is a barrier to wider acceptance of suchapproaches.
The principal aims of Task 3 in "SINTAP" are to address the probabilistic aspects of structural integrityassessment procedures. The main aims of the status review were therefore to provide a statisticalapproach for treating input data by collating and summarising all the review input delivered by thecontributing partners from sub-tasks 3.2 to 3.5. These include aspects such as 1) probabilistic fracturemechanics analysis and statistical methodology for quantifying fracture toughness scatter in small scaletests, i.e. material data treatment, 2) Charpy - fracture toughness correlations, 3) non-destructive (NDE)evaluation guidance and 4) safety factors and risk assessment.
At first, potential industrial problems in each sub-task have been outlined and the typical availability ofcurrent data in practical situations is described. This is then followed by an introduction of possibleunresolved issues and gaps in current knowledge. The contribution of each partner in the four sub-task hasbeen demonstrated and the relevance of their input to SINTAP has been identified. Finally, plans andrecommendations for further work, as well as for the focus of follow-up work within SINTAP has been made.In the end, conclusions summarising the principal findings in each task has been given.
MANUFACTURING TECHNOLOGY 17.03.1997 2(72)
CONTENTS
SUMMARY 1
1. INTRODUCTION 5
2. OPTIMISED TREATMENT OF TOUGHNESS DATA 7
2.1 Industrial problems and issues 72.2 Current status 9
2.2.1 Determination of fracture toughness values 92.2.2 Parent plate fracture toughness 92.2.3 Heat-affected zones 102.2.4 Weld metal 112.2.5 Determination of strength property distributions 11
2.3 Methods for statistical modelling of data and probabilistic 12 fracture mechanics analyses 2.3.1 Probabilistic fracture mechanics analyses by TWI 12 2.3.2 Statistical brittle fracture model for small specimen 12
data treatment by VTT2.3.2.1 Basic equations for the statistical treatment of data 132.3.2.2 Temperature dependence of fracture toughness 142.3.2.3 Parameter estimation 142.3.2.4 Safety factors 152.3.2.5 Lower bounds 152.3.2.6 Size requirements 162.3.2.7 Reliability of small scale test data 17
2.4 Treatment of ductile fracture and strength mismatch data 182.4.1 Ductile fracture behaviour 182.4.2 Effect of weld strength mismatch 19
2.5 Future work 22
3. CHARPY - FRACTURE TOUGHNESS CORRELATIONS 23
3.1 Industrial problems and issues 233.2 Current status and approaches 243.3 Potential problems with correlations 26
3.3.1 Differences in test methods 263.3.2 Changes in Charpy transition behaviour of modern steels 273.3.3 Shape of transition curves 273.3.4 Prediction of Charpy and fracture toughness values at 28
a range of temperatures3.3.5 Relationships between fracture toughness parameters 283.3.6 Effect of thickness 293.3.7 Statistical aspects 29
3.4 Direct correlations between Charpy impact energy and fracture toughness 293.4.1 Generic correlations 303.4.2 Specific correlations for lower shelf and lower transition regions 30
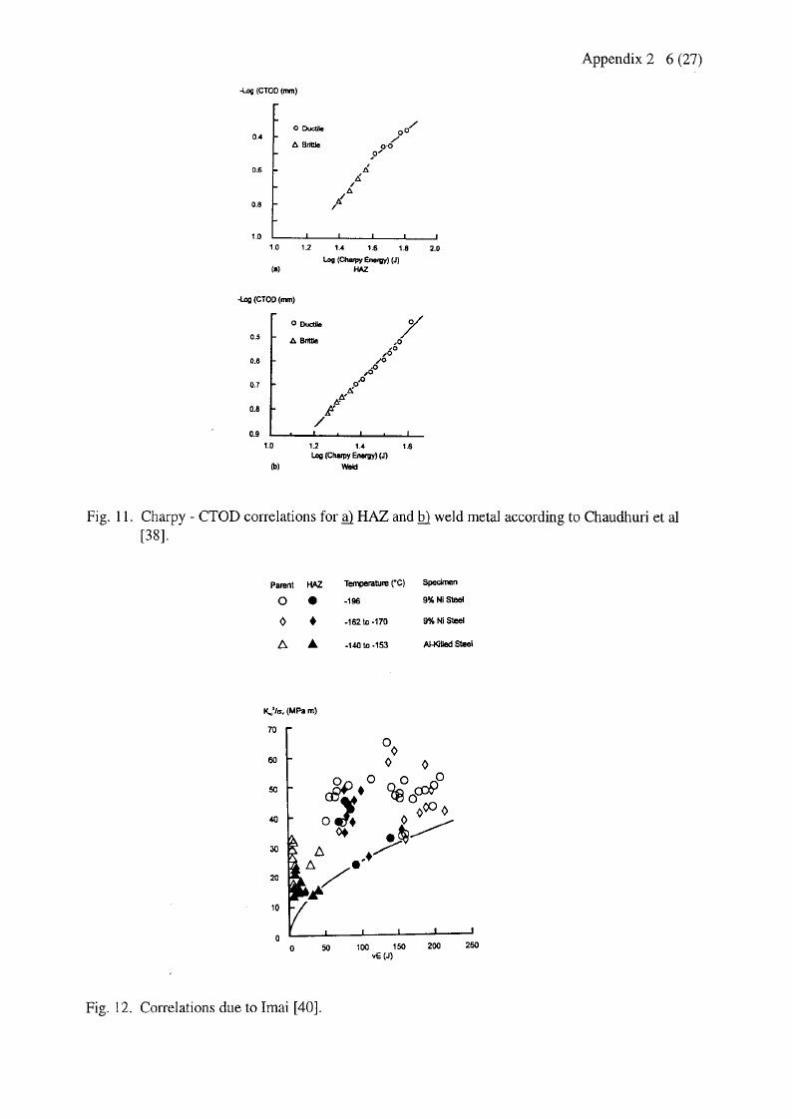
3.4.2.1 Chaudhuri et al 303.4.2.2 Girenko et al 313.4.2.3 Imai et al 313.4.2.4 Logan et al 313.4.2.5 Sailors and Corten 313.4.2.6 Barsom, Rolfe and Novak 313.4.2.7 Exxon Fitness for Service Guide 323.4.2.8 Comparison of lower shelf/lower transition correlations 32
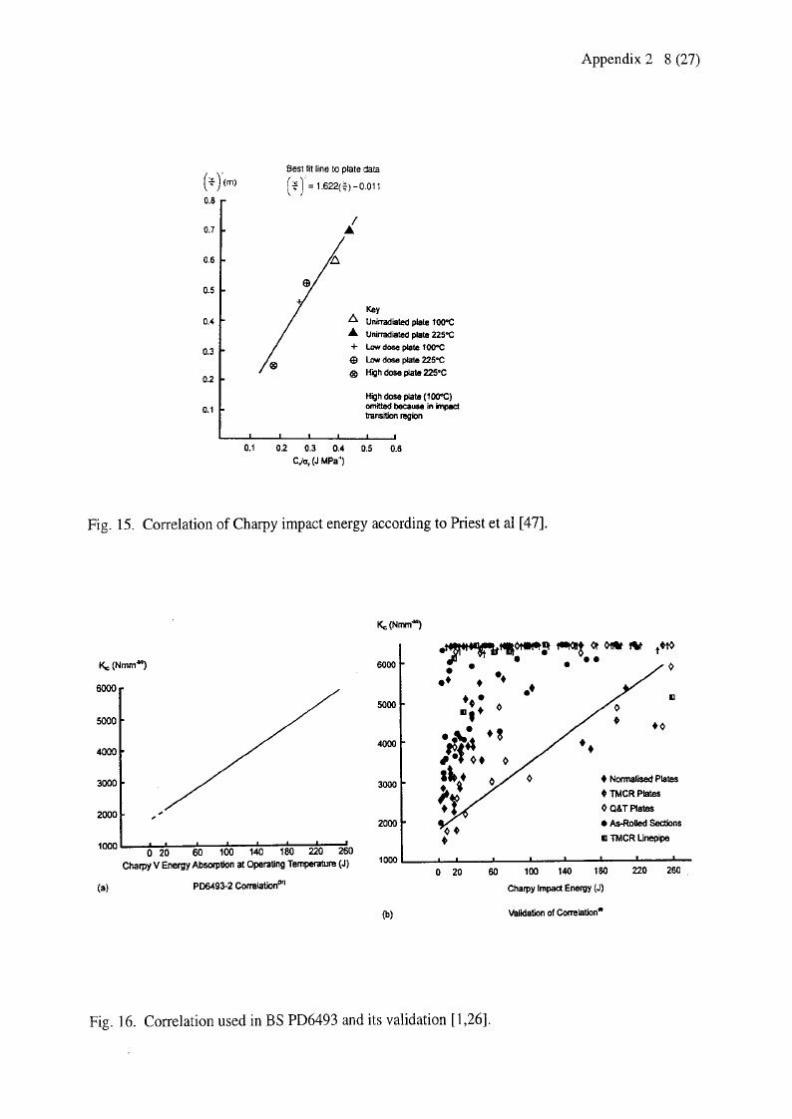
3.4.3 Specific correlations for upper transition and upper shelf regions 323.4.3.1 Ito et al 323.4.3.2 Norris et al 323.4.3.3 Priest et al 33
MANUFACTURING TECHNOLOGY 17.03.1997 3(72)
3.4.3.4 Thorby et al 333.4.3.5 Witt 333.4.3.6 BS PD 6493-2 333.4.3.7 Comparison of upper transition/upper shelf correlations 34
3.5 Correlations involving reference temperatures 343.5.1 Specific correlations involving temperature shifts 35
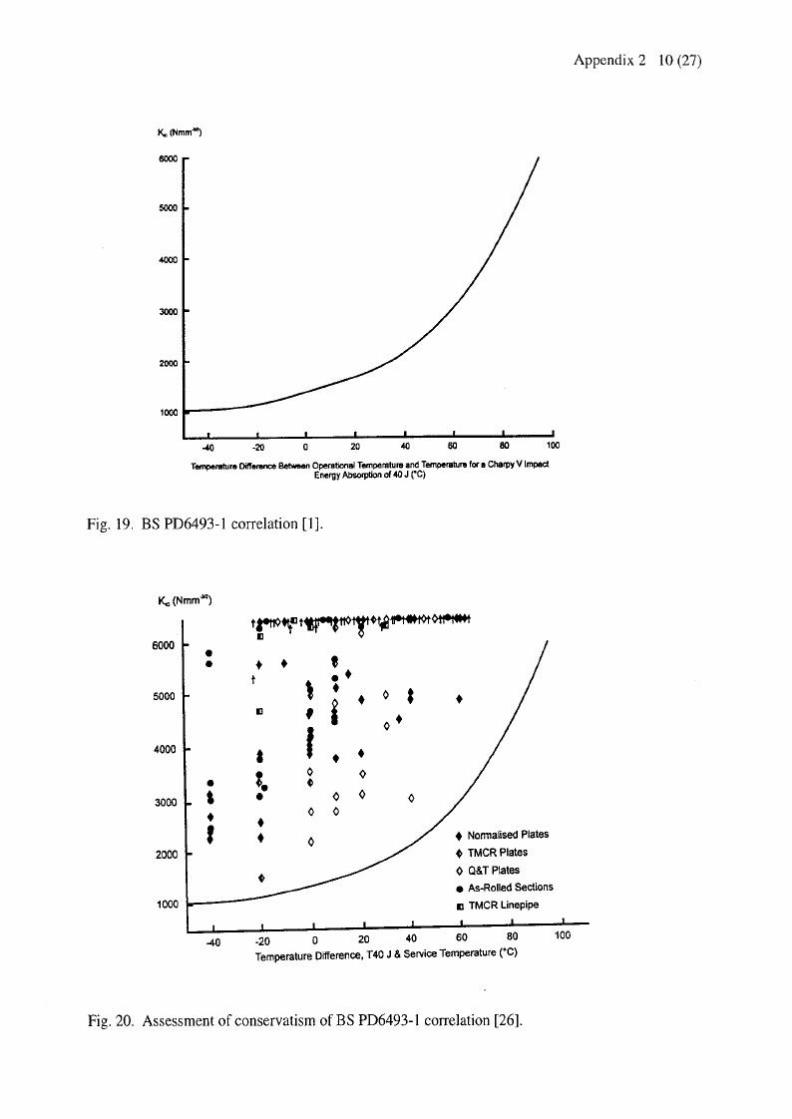
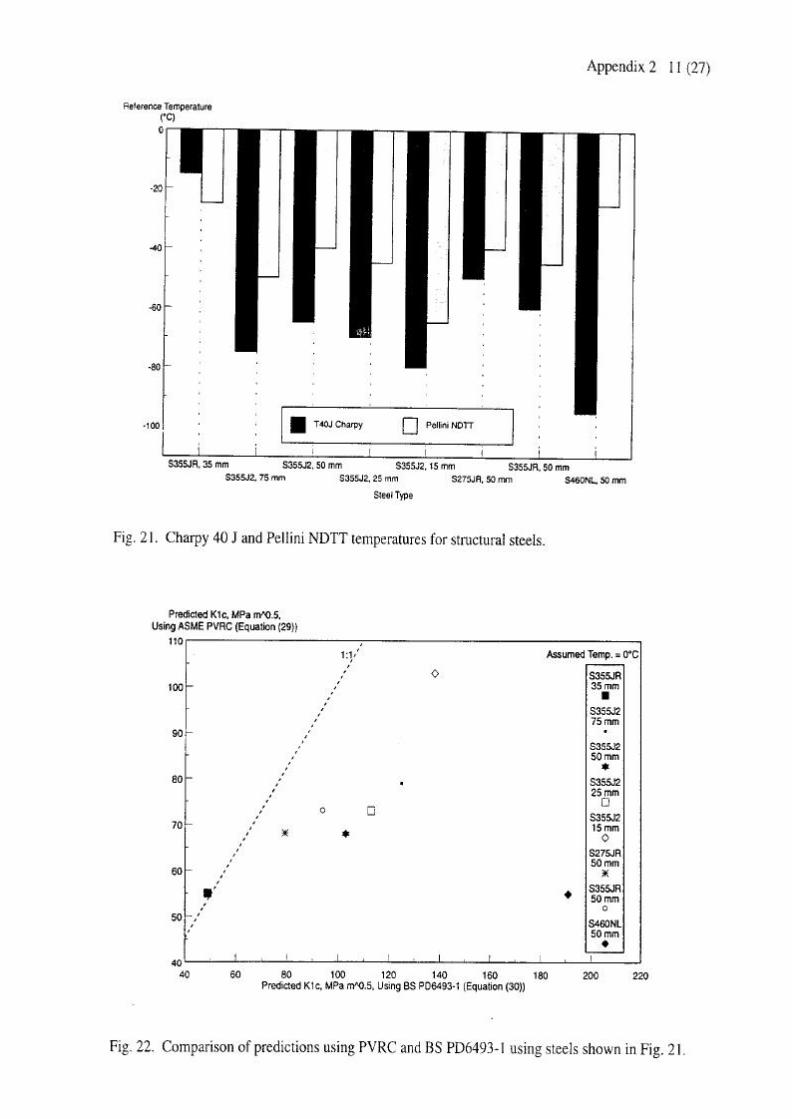
3.5.1.1 ASME-PVRC 353.5.1.2 BS PD 6493-1 353.5.1.3 Barsom 353.5.1.4 Matsumoto et al 363.5.1.5 Oda 363.5.1.6 Braid 36
3.5.2 Development of the approach used in Eurocode 3 363.5.2.1 Development of method 373.5.2.2 Validation 38
3.6 Industrial requirements 393.7 Future work 40
4. NON-DESTRUCTIVE EVALUATION GUIDANCE FOR FITNESS FOR 41 PURPOSE ASSESSMENTS
4.1 Industrial problems and issues 414.2 Current status of knowledge 414.3 Gaps in current knowledge 424.4 Addressing the gaps 434.5 Examples of what can be obtained from existing databases (PISC) 44
4.5.1 Overall effectiveness of inspection techniques of reactor 44pressure vessel welds 4.5.1.1 Overall NDT effectiveness evaluation in the PISC 44 programme4.5.1.2 Challenging inspection problems in RPV 464.5.1.3 Conclusions 46
4.5.2 Primary piping inspection effectiveness 474.5.2.1 Introduction 474.5.2.2 Inspectability of Safe-ends 474.5.2.3 Inspectability of wrought stainless-steel primary piping 484.5.2.4 Inspectability of cast stainless-steel primary piping 484.5.2.5 Inspectability of components made of cast and wrought 48
stainless steel 4.5.2.6 Large stainless steel castings inspection 49
4.5.2.7 Inspection of non pressure retaining components 494.5.3 Steam generators inspection effectiveness 494.5.4 Qualification of inspection procedure 504.5.5 Human factors 504.5.6 Performance diagrams 51
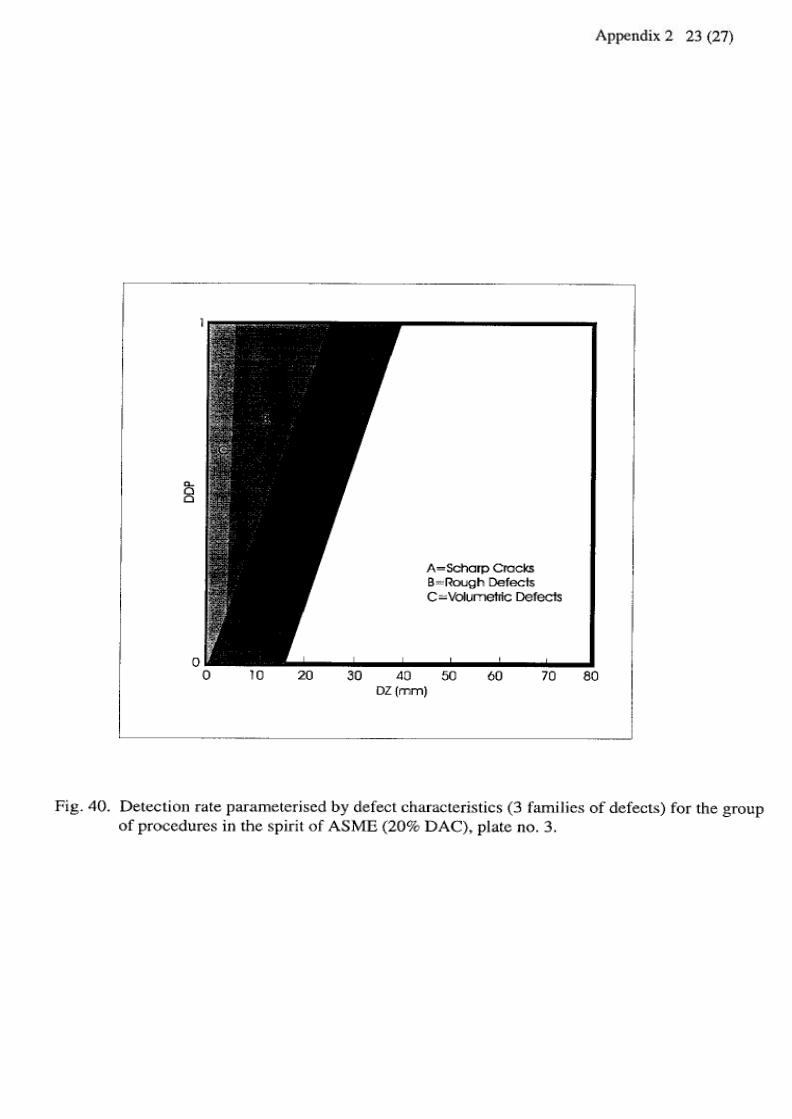
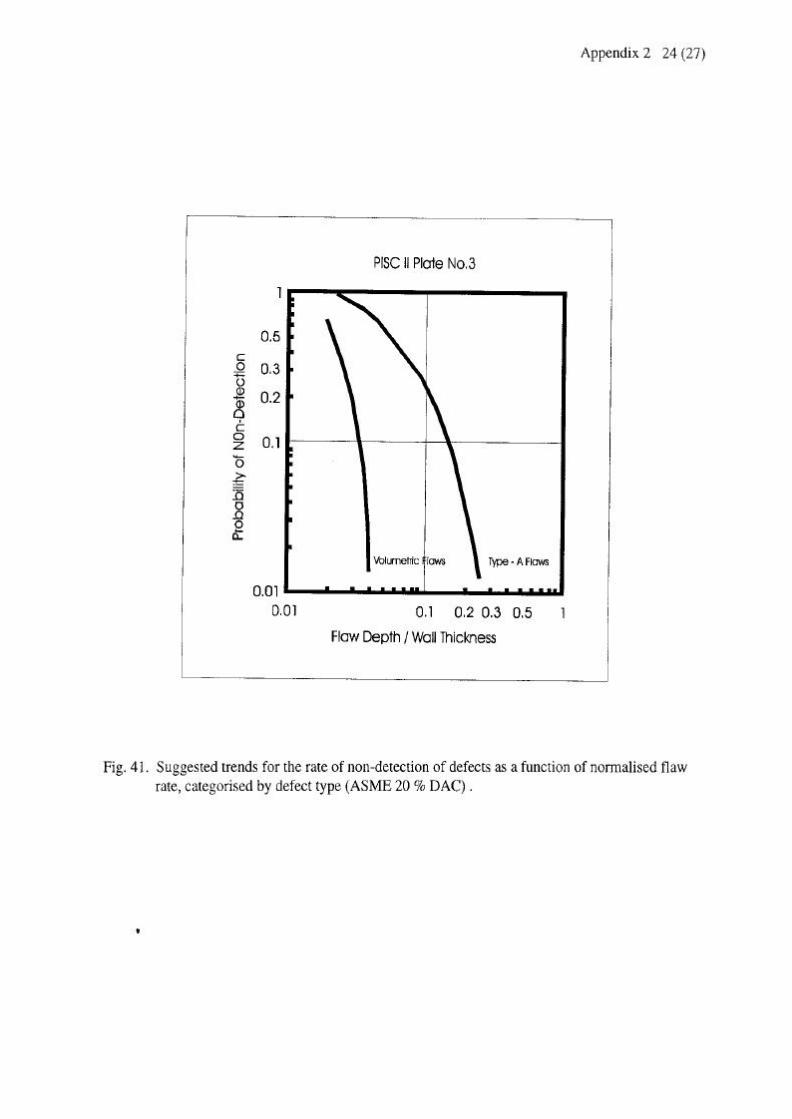
4.5.6.1 Introduction 514.5.6.2 Missing defects as a function of their size 514.5.6.3 Importance of the type of defect 52
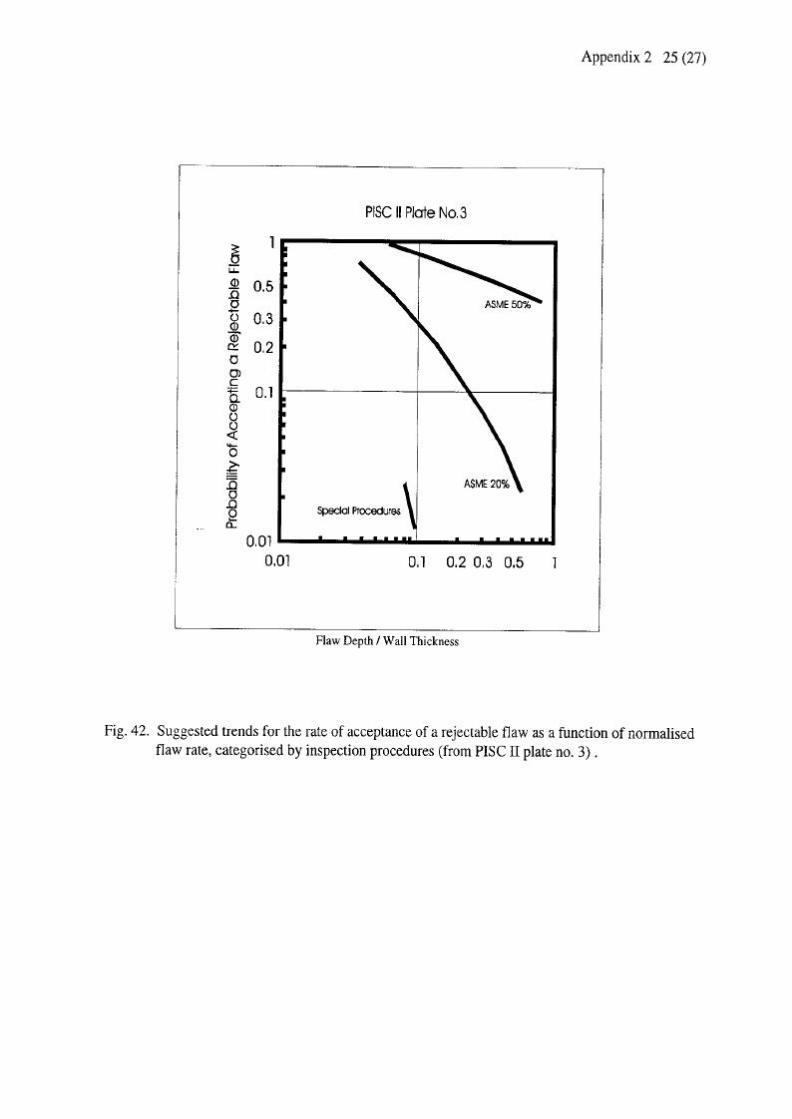
4.5.7 Errors of defect evaluation leading to under-estimation 524.5.8 Probability of defect presence after ISI 53
4.6 Future work 53
5. SAFETY FACTORS AND RISK ASSESSMENT 54
5.1 Industrial problems and issues 545.2 A probabilistic model 54
5.2.1 An example of a mixed level elastic-plastic analysis 555.2.2 Which approach to choose 56
5.3 Some unresolved issues 565.4 Proposed work within SINTAP 57
5.4.1 The probabilistic model by SAQ 575.4.2 Choice of random parameters 57

MANUFACTURING TECHNOLOGY 17.03.1997 4(72)
5.4.3 A computer program 585.4.4 A comparison with deterministic methods 58
5.5 Future work 58
CONCLUSIONS 59
REFERENCES 63
APPENDIX 1: TABLES 1 - 3
APPENDIX 2: FIGURES 1 - 45
MANUFACTURING TECHNOLOGY 17.03.1997 5(72)
1. INTRODUCTION
A status review of statistical approaches for treating input data, based on the currently existing informationfor SINTAP Task 3 "Reliability Based Methods - Optimised treatment of data" is presented in this reportedited by Technical Research Centre of Finland (VTT). The report is contributed by the following partners:VTT Manufacturing Technology / Technical Research Centre of Finland (VTT), The Welding Institute (TWI),British Steel plc (BS), SAQ Inspection Ltd. (SAQ), European Commission Joint Research Centre (JRC) andNuclear Electric Ltd. (NE). This work is part of VTT's contribution to Task 3 addressing the probabilisticaspects of structural integrity assessment procedures.
Structural integrity can be regarded as the demonstration of the fitness-for-purpose of engineeringcomponents and structures throughout their operational lifetime. Used correctly, such an approach canprovide a balance between economy and concern of safety. It can also prevent unnecessary repairs duringthe structure's lifetime. This is a crucial matter especially in structures intended for demanding applications,like offshore construction, power generation and processing. Despite significant improvements in thescope and accuracy of such methods in recent years, problems still exist. In particular, the absence of asingle unified method in Europe which can be used in industry is a barrier to wider acceptance of suchapproaches.
The principal aims of this work were to provide information of the current structural integrity assessmentapproaches, in order to be able to outline a framework for a commonly agreed probabilistic assessmentmethod intended as an European procedure. The need for safety in critical structures dictates that if only alimited number of material data are available, a deterministic approach based on a pessimistic, or even'worst case', data set must be used. This easily leads to excessive conservatism which can be overcomethrough the use of a probabilistic, or reliability based, approach. For this purpose, the status reviews fromcontributing partners in sub-tasks 3.2 to 3.5 collate the existing data, information and approaches on theaspects of probabilistic assessment and statistical methodology for fracture toughness scatter, i.e. materialdata treatment, Charpy - fracture toughness correlations, as well as of non-destructive evaluation guidanceand safety factors and risk assessment.
Section 2 (Optimised treatment of toughness data) deals with development of general statisticalmethodology for optimum treatment of fracture toughness data, including size effect corrections. It alsoprovides information from previous work on the probabilistic assessment of HAZ fracture toughness (e.g.BSI PD6493) and statistical treatment of data. Aspects of a framework method for statistical approach fortreating fracture toughness test data have been discussed. Approaches like a probabilistic fracturemechanics analysis developed at TWI and a statistical brittle fracture model developed at VTT, for instance,enable the derivation of safety factors as a function of number of fracture toughness tests for differentconfidence levels. Finally, general aspects of ductile fracture behaviour and weld strength mismatch arebriefly discussed.
Section 3 (Charpy - fracture toughness correlations) reviews the existing Charpy - fracture toughnesscorrelations for ferritic structural steels, as well as their sources. The potential problems, limitations andadvantages of correlations are then outlined, including trends in steel parent material development duringdecades and the associated influences on material's fracture behaviour. In particular, the influence of steelcleanliness on its fracture initiation toughness has been emphasised. Background and philosophy of arecent Eurocode 3 approach is described. Recommendations on most appropriate methods for correlatingof Charpy energy and fracture toughness are proposed.
Section 4 (NDE guidance) provides information on statistical treatment of NDE data, as well as guidance onissues relating to the interaction between NDT and fracture mechanics assessment, including probability ofdetection and sizing errors. Recommendations for the implementation of probabilistic failure-analysis-diagram (FAD)-based fracture assessment procedures are included. Methods of selecting an appropriateNDT method and statistically quantifying reliability of flaw size measurements are briefly outlined. Finally,examples of what can be obtained from existing databases (PISC) are given.
Section 5 (Safety factors and risk assessment) concentrates on aspects of a probabilistic safety evaluationmodel quantifying different margins of safety using relevant random parameters instead of deterministicsafety factors. Differences between the new method and the deterministic methods (e.g. R6-method) areoutlined. Background knowledge for basic framework for a probabilistic safety evaluation model has beencollated and presented.

MANUFACTURING TECHNOLOGY 17.03.1997 6(72)
The aim of Task 3 is to address the probabilistic aspects of structural integrity assessment procedures byproviding statistical approaches for treating input data. The final goal of Task 3 is to incorporate outputs ofsub-tasks 3.1 - 3-5 into a statistical reliability-based validated procedure which then will serve as acommonly agreed probabilistic structural integrity assessment procedure on an European level.
MANUFACTURING TECHNOLOGY 17.03.1997 7(72)
2. OPTIMISED TREATMENT OF TOUGHNESS DATA
This section of the status review describes the development of a general statistical methodology foroptimum treatment of fracture toughness data that is to be used in probabilistic fracture mechanicsreliability analyses.
It begins with an outline of current issues that are relevant to work being undertaken by TWI. Next, papersand publications which describe TWI work in this area are summarised and their relevance to SINTAPidentified. Information from previous work on the probabilistic assessment of HAZ fracture toughness andstatistical treatment of data is provided. Assessment of heat-affected zone (HAZ) toughness as a function oflength of local brittle zone (LBZ) sampled is described, with subsequent derivation of a probabilisticapproach for incorporating fracture toughness distributions into a procedure based on the Monte Carloapproach. Furthermore, the work undertaken by VTT in the field of statistical modelling of brittle fracture foroptimum treatment of toughness data is outlined, including statistically defined safety factors and specimensize requirements.
Finally, aspects of a unified framework method for statistical treatment of fracture toughness test data hasbeen discussed. In the end, general aspects dealing with ductile fracture behaviour, as well as with theinfluence of weld strength mismatch on fracture toughness and failure behaviour are briefly outlined anddiscussed. With respect to welding residual stresses, reference is made to Task 4.
2.1 Industrial problems and issues
Fracture toughness testing standards can not give any recommendations for the application of fracturetoughness data for structural integrity assessment, since they are based on ensuring the test performanceand the quality of the data rather than treatment of data. Classical, continuum mechanics based, fracturemechanics assumes the materials fracture toughness to be a specific single value material property.Therefore, most defect assessments are conducted using deterministic procedures, often with limited dataon material properties. Usually there are few fracture toughness results available and the assessment isbased on the lowest of three or the statistical equivalent to the minimum of three results (see Appendix A in[1] and R6 method [12]). With the high scatter associated with tests on inhomogeneous materials such aswelds (i.e. weld metal and HAZ), use of a minimum value can result in predicting a very small tolerable flawsize which would be difficult to find and could make the structure uneconomic to build or operate. On theother hand, the attainment of high toughness from a limited number of tests could be fortuitous and couldresult in a false sense of security.
Increasing the number of tests to obtain a more reliable estimate of fracture toughness increasesconfidence, but posses additional problems such as how a statistical distribution should be fitted to thedata. Should this be based on a mathematical best fit, or should it be based on a theoretical model, suchas the weakest link with a theoretically derived shape parameter and threshold toughness? Furthermore,should weld metals and heat affected zones be treated in the same way as parent material? Or shouldrecognition be made of the fact that very mixed microstructures, hence fracture properties, are present at areal crack?
Materials research has shown that fracture toughness in the case of cleavage fracture is not a simplematerial property. Firstly, cleavage fracture initiation toughness exhibits a large amount of scatter, as it isaffected both by changes in the stress distribution and by the probability of finding a critical locally situatedcleavage initiator. Secondly, cleavage fracture initiation shows a characteristic statistical size effectassociated with the length of the crack front [10]. The macroscopic fracture resistance to ductile fracture, inturn, is governed by the mean toughness properties of the material and less with scatter in the associatedfracture mechanism.
To have confidence in the results of fracture analyses, it is desirable to employ results from as large a dataset as possible. In practice, this is difficult when there are insufficient results from a particular data set.Sometimes it is possible to combine different data sets to achieve an acceptable sample size. If astatistical size effect associated with cleavage fracture exists, one should adjust the experimentaltoughness values to allow for the different crack front lengths. Procedures to use in such cases need to beaddressed.
Even when a solution to the above discussed problems is found, one still remains, namely, which value oftoughness should actually be used? According to BS PD6493:1991 Appendix A [1], it is appropriate to use

MANUFACTURING TECHNOLOGY 17.03.1997 8(72)
the mean minus one standard deviation value. The DnV Recommended Practice for unstable fracture [2]uses the lower 5th percentile toughness (K, CTOD or J). Clearly, there is no general consensus about thismatter.
With respect to testing standards, on the other hand, ordinary KIC tests according to ASTM E399 apply a95% secant procedure. The problem with KIC is, however, that it does not distinguish between ductilefracture and brittle cleavage fracture. In some cases this may, for instance, throw doubt on the credibility ofthe Charpy - fracture toughness correlations, see later sections 3.4 and 3.5.1.5. In the case of ductilefracture, a large specimen will yield higher KIC than a small specimen, even for valid tests (due to anincreasing R-curve of ductile fracture). The validity criteria, in fact, has actually only been chosen as toproduce a linear-elastic load response of the specimen, without any direct relationship to the stress state inreality. On the other hand, KIC corresponding to brittle cleavage fracture depends not necessarily solely onmaterial properties, since the probability of cleavage fracture initiation also may be specimen and crack sizedependent.
Choice of a specific value of fracture toughness can be avoided with a probabilistic fracture mechanicsapproach. The need for statistical modelling of cleavage fracture initiation has been acknowledged duringthe last few years. The problem then focuses on the type of distribution applicable to the fracture toughnessdata. For high integrity structures, the description of the lower tail of the distribution becomes critical. Inprobabilistic fracture mechanics analyses, a number of methods and models are available although veryfew comparative studies have been conducted to validate the results. A short review has been presented byWallin in [11]. Most of the models for describing fracture toughness in the cleavage fracture temperatureregion are based on the assumption that cleavage fracture initiation behaves according to weakest linkstatistics where one single event is sufficient to cause macroscopic failure. Simple guidelines for obtainingoptimum, best and safe estimates of structural behaviour based on statistical modelling of small specimendata are presented later, section 2.3.2.
Probabilistic fracture mechanics can also be used to determine partial safety factors, or partial coefficients,for use in deterministic analyses of structural integrity. Regardless of whether a structural integrityassessment aims at best estimate or safe estimate of the structural behaviour, safety factors are needed toadjust the measured fracture toughness. Use of these factors ensures that the structure containing a defectachieves a defined target reliability.
The partial safety factor or 'partial coefficient' can be designed to recognise the inherent scatter in thetoughness data and other input variables or the criticality of the component. Options to use these arecontained in both the DnV D404 [2] and BS PD6493 [1] approaches. The partial safety factors for fracturetoughness are 1.2 and 1.4 for Kmat and δmat in PD6493, respectively, and 1.15 for K, CTOD and J in D404. Inthe case of BS PD6493:1991, the partial safety factors were derived using a defect assessment procedure[3] not given in the current document which may be inappropriate. Furthermore, the choice of partial safetyfactor may depend on the type of structure being considered. Also, current procedures address reliabilitywith respect to a single defect in a single weld. The behaviour of a system containing a number of weldsand defects is not described at present and needs to be addressed.
It is essential that the influence of welding residual stresses on fracture toughness of real welds isrecognised. Whether residual stresses are considered or neglected may also have an impact on theaccuracy of fracture toughness predictions based on small-scale test data. As an example, it has recentlybeen shown [64] how welding residual stresses present in a relatively large wide-plate test specimen affectits fracture behaviour and, hence, also the relationship between the fracture toughness estimate predictionbased on Charpy transition temperature and fracture behaviour of a wide-plate specimen (in terms of failureload, in this case). For the wide-plate test results to fall within the prediction, it was found that theassumption of a compressive residual stress of about 100 MPa was enough to describe the experimentalresults (Note: wide-plate specimens were notched from the outer HAZ). Ignoring the influence of residualstresses, on the other hand, led to a fracture toughness prediction with lesser accuracy [64]. However,since welding residual stresses belong specifically in Task 4 of SINTAP, they are not the item of furtherdiscussion here.
2.2 Current status
In this section reports and papers describing the work conducted by TWI, VTT and NE concerning statisticaltreatment of data and probabilistic fracture mechanics are reviewed.

MANUFACTURING TECHNOLOGY 17.03.1997 9(72)
2.2.1 Determination of fracture toughness values
In R/H/R6 - Revision 3 Appendix 1 [12] guidelines are given for determining fracture toughness andstatistical analysis of fracture toughness data. This supplement to the current R6 method is submitted byNE, in order to serve as their contribution to SINTAP sub-task 3.2. As the Appendix 1 [12] at the moment,however, is of confidential nature, the policy of its further distribution outside the consortium should beclearly stated.
2.2.2 Parent plate fracture toughness
Towers et al [4] describe the results of an extensive European Round Robin test programme whichmeasured the fracture toughness of a 365 N/mm2 yield strength, normalised, C-Mn steel to BS 4360:1979Grade 50D. The steel plate was 52 mm thick. Over 900 fracture toughness tests were conducted toexamine the effects of:
a) specimen configurationb) overall specimen sizec) specimen dimensionsd) strain rate and method of loading
Most of the tests were on full plate thickness, deeply notched bend specimens and both CTOD and J weremeasured. At a test temperature of -65 °C, which represented approximately the middle of the ductile tobrittle transition temperature, approximately 100 tests were conducted. Specimens failed by cleavage and inabout 55% of the tests this was preceded by ductile crack growth. The log(e)-normal distribution was foundto provide a reasonable fit to both the CTOD and J results. Although there were 14 laboratories involved inthe project, the inter-laboratory variations in fracture toughness measurement were found to be smallcompared with the inherent scatter in the data.
In addition to the fracture toughness tests, wide plate tests were also conducted which enabled the degreeof safety of various flaw assessment methods to be evaluated.
The main importance of this study to SINTAP is that it presents a large, well characterised fracturetoughness data set on a structural grade steel which can be used to assess statistical and probabilisticfracture mechanics analyses.
In another programme conducted on the same steel grade but larger thickness (100 mm), data wereobtained over a temperature range -125 to -75°C [5]. Although a small number of tests were conducted on100 mm thick specimens, a larger number were conducted on 10 mm thick specimens, some which wereside grooved, taken from the larger ones. The aim of the project was to assess size effects in terms ofstatistical sampling and constraint effects.
2.2.3 Heat-affected zone
Certain combinations of steel composition and welding condition can give rise to low heat- affected zone(HAZ) fracture toughness in relation to the parent plate or weld metal and is often referred to as the LBZ (=local brittle zone) problem. Pisarski and Jutla [6] examined HAZ fracture toughness data obtained on anormalised C-Mn steel plate 50 mm thick to BS 4360:1974 Grade 50E which had been welded at a heatinput of 4.5 kJ/mm. Ninety eight CTOD test results and 17 wide plate test results were analysed in order todetermine the characteristic CTOD value that would be used in a Level 2 PD6493 defect assessmentprocedure. The study involved grouping together various small data sets, using non-parametric statistics, inorder to form larger ones amenable to further statistical analysis. All the tests were conducted at -10 °C andthe study examined the effect of the degree of HAZ refinement and as-welded and post-weld heat treatmentcondition on fracture toughness. The study [6] also examined the effect on flaw size estimates of usingCTOD results from specimens where no post test metallography was conducted (i.e. no censoring of thedata), and results from when it was (i.e. data were censored). The censored data set included only thoseresults where the specimen was shown to sample grain coarsened HAZ, which is expected to have thelowest toughness (i.e. LBZ).
The study concluded that when the welding procedure is capable of giving low HAZ fracture toughness, it isacceptable to use the lower 20th percentile CTOD of the log-normal distribution (90% confidence) foruncensored data in a defect assessment. However, if results are used from tests where post-testmetallography has confirmed that the lowest toughness region in the HAZ has been tested (i.e. censored

MANUFACTURING TECHNOLOGY 17.03.1997 10(72)
data), then median toughness (90% confidence) can be used. Analysis of the wide plate test resultsshowed that fracture toughness values selected in these ways ensured that there was safety factor of 2 onflaw size prediction. It should be emphasised, however, that these conclusions are valid only for the CTODLevel 2 procedure in PD6493 and therefore are not generally applicable.
Pisarski and Slatcher [7,8] used similar HAZ data sets to develop a weak link model in which fracturetoughness was shown to depend on the length of brittle HAZ (i.e. LBZ) material present at the crack tip. Themodel was used to predict HAZ fracture toughness distributions in through-thickness notched specimens,which tested mixed microstructures consisting both of LBZ and microstructures of higher toughness, fromsurface notched specimens which sampled either all LBZ or tough microstructures. In the model thecumulative fracture toughness distribution function is given by:
Kχ(χ) = 1 - exp(-[p1ψ1+ p2ψ2]χβ) ...........................................................................(1)
where: p1, p2 are the lengths of microstructure 1 and 2 present along the crack front,
ψ1, ψ2, are functions of the Weibull scale parameter for microstructures 1 and 2,
β is the Weibull shape parameter.
This model was incorporated into a probabilistic fracture mechanics assessment using the Level 2procedure in BSI PD6493:1991. Analyses were conducted using the first order reliability method and Monte-Carlo simulation to estimate the probability of failure. The analyses were used to illustrate the effect of LBZheight and distribution on the probability of failure in a welded plate containing a semi-elliptical surfacecrack. Some comparisons were made between the predictions of failure probability from the model with thebehaviour of wide plate specimens.
The relevance of this work to SINTAP is that it provides a well defined HAZ data set for further analyses, andit illustrates the problems of conducting probabilistic defect assessments in welded components.
2.2.4 Weld metal
Hadley and Dawes [9] describe a European round-robin programme involving 12 laboratories to quantifyscatter in weld metal fracture toughness when measured in terms of CTOD and J. Tests were conductedon as-welded submerged arc weld metal which was deposited using SD3 wire and OP121TT flux weldedonto a 50mm thick steel plate to BS 4360:1986 Grade 50D. The study involved single edge notched bendspecimens notched in the through-thickness and surface orientations. These were tested at -60 and -20°C. The surface notches included deeply cracked (a/W = 0.4) and shallow crack (a/W = 0.15) specimens.Through-thickness notched specimens were all deeply cracked (a/W = 0.5).
Approximately 360 tests were conducted and the results subjected to statistical analysis. Non-parametricstatistics were used to make inter-laboratory comparisons. Log-normal distributions were fitted to CTODand J data for each specimen geometry and test temperature. Although the analyses did show that therewere some inter-laboratory differences, the value of the work to SINTAP is again the availability of a large setof fracture toughness data on well characterised weld metal for future analysis.
2.2.5 Determination of strength property distributions
The R/H/R6 - Revision 3 Appendix 10 [80], submitted by NE as their contribution to SINTAP sub-task 3.2gives guidelines for treatment of strength property distributions as an input to probabilistic calculation. Themethodology makes use of flow stress, normally taken to be the arithmetic mean of yield stress andultimate tensile stress. In general, any combination of the two quantities may be adopted. Thus the requireddistribution of flow stress can be derived from distributions of yield stress and ultimate tensile stress. Thelog-normal and Weibull distributions have been found suitable to be used for tensile properties [80].
As the Appendix 10 [80] at the moment, however, is of confidential nature, the policy of its further distributionoutside the consortium should be clearly stated.
2.3 Methods for statistical modelling of data and probabilistic fracture mechanicsanalyses

MANUFACTURING TECHNOLOGY 17.03.1997 11(72)
During the 1990s, there has been extensive development and progress within Europe in the field ofprobabilistic approaches for reliable and sophisticated treatment of fracture toughness data. Recently,Moskovic and Neale [17,143], as well as Heerens et al [144] have described the treatment of fracturetoughness data and characterisation of fracture toughness in the ductile to brittle transition regime. BothVTT [13-16,18,19,29,32,36,37,60,64] and TWI [6-9] have also conducted work on methods for statisticalmodelling of data and probabilistic fracture mechanics analyses.
With respect to purposes of structural design, this review report concentrates on the two followingapproaches presented and discussed in this section: a probabilistic fracture mechanics analysis methoddeveloped at TWI and a statistical brittle fracture model developed at VTT.
2.3.1 Probabilistic fracture mechanics analyses by TWI
TWI have developed a probabilistic fracture mechanics analysis method which employs the Level 2 and 3Failure Analysis Diagrams in BSI PD6493:1991 as limit state functions. First order reliability methods andMonte-Carlo simulation are used to estimate failure probability. The first order method also providessensitivity values and the design point for each parameter. The probabilistic assessment methodincorporates many of the features of PD6493, consequently both K and CTOD analyses can be conductedon surface and embedded cracks. In addition, the effects of residual stresses, local stress concentration,strength variations and presence of mixed materials can be included.
The method can be used to assess the probability of failure by fracture or ductile crack growth and allow forlocal plastic collapse in both cases. Currently, comparisons are being made between the TWI method andother probabilistic fracture mechanics methods including UMFRAP: a reliability analysis developed byUMIST and STAR 6 based on the R6 assessment procedure.
The applicability of the method in assessing probability of failure and helping define partial safety factors foruse in deterministic fracture mechanics analyses is suggested to be verified within the SINTAP study. Thiswork will also have a strong link to sub-task 3.5 discussed later in section 5 in this review report.
2.3.2 Statistical brittle fracture model for small specimen data treatment by VTT
The statistical brittle fracture model presented here is suitable for deriving safety factors for use in structuralintegrity assessments. It focuses on the application of brittle cleavage fracture toughness data. Simpleguidelines for obtaining optimum best and safe estimates of the fracture behaviour in a structure based onsmall specimen data are given.
Here, "best estimate" is defined as an estimate of K0 which corresponds to the median value, whereas"safe estimate" corresponds to a failure probability lower than 50%. The "amount of safety", so to speak,depends on the particular application. This means that selecting a confidence level to be used in theassessment depends on the criticality of the component in question. For very critical structural parts, forinstance, a 90% confidence level can be chosen instead of a 50% median level.
A simple procedure for determination of the measuring capacity of a test specimen from experimental datais also presented.
2.3.2.1 Basic equations for the statistical treatment of data
The fracture toughness to be used in a fracture mechanics analysis can be based upon KIC, J, or CTOD.Regardless of parameter it is preferable to express the fracture toughness in terms of it's equivalent K-value, denoted here as KIC. The statistical brittle fracture model of Wallin [13] assumes a Weibull typedistribution function for scatter in fracture toughness:
P[K K]= 1- exp -K - KK - KIC
min
0 min
m ≤
I
...............................................(2)
where P[KIC ≤ KI] is the cumulative failure probability, KI is the stress intensity factor, Kmin is the lower boundto the fracture toughness and K0 is a temperature and specimen size dependent normalisation fracture

MANUFACTURING TECHNOLOGY 17.03.1997 12(72)
toughness, that corresponds to a 63.2% cumulative failure probability which is approximately 1.1 ICK(mean fracture toughness). Although "Kmin" itself can be regarded as "theoretical" in nature, it has beenfound that for structural steels, a fixed, experimental value of Kmin = 20 MPa√m can be used.
The model also predicts a statistical size effect of the form [14]:
KB2 = (KB1 -Kmin)(B1/B2) ¼+ Kmin ...........................................................................(3)
where B1 and B2 correspond to respective specimen thickness (length of crack front).
Other statistical brittle fracture models [11] yield very similar equations, the main difference beingessentially in the treatment of Kmin.
Close to the lower shelf of fracture toughness (KIC < 50 MPa√m) the equations are expected to beinaccurate. The model applied here is based upon the assumption that brittle fracture is primarily initiationcontrolled, even though it contains a conditional crack propagation criterion, which among others results inthe lower bound fracture toughness Kmin. On the lower shelf, the initiation criterion is no longer dominant,but the fracture is completely propagation controlled [15]. In this case there is no statistical size effect (Eq. 3)and also the toughness distribution differs slightly from Eq. 2. In the ductile to brittle transition region Eqs. 2and 3 should be valid as long as loss of constraint and/or ductile tearing do not play a significant role.
2.3.2.2 Temperature dependence of fracture toughness
For structural steels, a "master curve" describing the temperature dependence of fracture toughness hasbeen proposed [16]:
k0=31+77 . EXP(0.019. [T-T0]) ....................................................................(4)
where T0 (°C) is the transition temperature where the mean fracture toughness, corresponding to a 25 mmthick specimen, is 100 MPa√m and K0 which is a normalisation fracture toughness at 63.2% cumulativefailure probability, is 108 MPa√m.
Eq. 3 gives an approximate temperature dependence of the fracture toughness for ferritic structural steelsand it is comparatively well verified [16,18,19,29,32,36,37,60,63,64]. The effect that possible outlier or invalidfracture toughness values may have upon the transition temperature T0 decreases if the temperaturedependence is fixed.
2.3.2.3 Parameter estimation
The parameters to estimate are either the transition temperature T0 or the normalisation parameter K0.Usually the separate fracture toughness values are analysed directly by a combination of Eqs. 2-4. This ispossible when all specimens fail by brittle fracture. The analysis of data sets which include results endingin non-failure, is slightly more complicated. If some of the non-failure values are lower than some of thefailure values, the data set is defined as being randomly censored. Moskovic [17] has presented a generalmethod of analysing randomly censored fracture toughness data sets. His method, based upon themaximum likelihood concept (MML), is somewhat simplified when it is combined with Eqs. 2-4. The MMLestimation method is preferable also for data sets with no censored data.
Censoring is not only restricted to non-failure results, it can also be used if the cleavage fracture toughnessviolates the specimen size criterion, or if too much ductile crack growth precedes cleavage fracture. In suchcases, the toughness value corresponding to the validity criterion in question is used and the result istreated as a non-failure result.
The maximum likelihood estimate, assuming a randomly censored data set, for estimating T0 when thescatter obeys Eq. 2 and K0 = a + b × exp{c. [T-T0]}, with the parameters a, b and c being fixed, becomes [18]:

MANUFACTURING TECHNOLOGY 17.03.1997 13(72)
δ i . exp{c.[Ti - T0]}
a - K + b. exp{c. Ti - T0]} -
(K - K )4 c Ti - T0]}
a - K = b. exp{c. [Ti - T0]})5 = 0
i = 1
n
i 1
n
min
IC
min
i min$
$.exp{ .[ $
( $∑
=∑ .....(5)
from which the estimate $T0 can be solved iteratively. Kroneckers delta (δi) is unity (1) when KICcorresponds to failure by brittle fracture and zero (0) when KIC corresponds to non-failure (at end of test).The estimate will be slightly biased to a higher temperature, but it can be bias adjusted by subtracting 5.4°C/r, where r is the number of toughness values corresponding to brittle failure. Usually, the bias correctioncan be omitted if r ≥ 6.
If all test results correspond to one single temperature, Eq. 5 can be simplified to give a maximumlikelihood estimate for $K 0 [18] as:
$)
/
K = (K - K
r - 1 + In(2)0
IC minii
n
=∑
1
1 4
.........................................................................(6)
In Eq. 6, n is the total number of fracture toughness values (failed and non-failed) and r is the number oftoughness values corresponding to brittle failure. Eq. 6 includes also a small bias correction which starts tohave an effect when r < 6.
2.3.2.4 Safety factors
Eq. 6 gives a best estimate of K0 which corresponds to the median value. The upper tail of the K0
distribution is described by a normal distribution, with the standard deviation of approximately σKo-Kmin ≈25%/√r. A safety factor for K0 is obtained by combining the standard deviation of the upper tail with thedesired confidence level. The resulting safety factor a is presented in Fig. 1 as a function of number of testsfor different confidence levels. The safety corrected K0 becomes:
K = K + K K
1 = 0 min0 min
$ −α
........................................................................(7)
Similarly to K0, a safety margin can be determined for the bias corrected transition temperature estimate$T0 . When applying Eq. 5 the standard deviation of the lower tail of the T0 distribution is approximately σTo ≈
14 °C/√r. The resulting safety margin ∆T is presented in Fig. 2 as a function of number of tests for differentconfidence levels. It should be pointed out that the safety margin in Fig. 2 includes the bias correction sothat the transition temperature estimate $T0 obtained from Eq. 5 should be used directly. The safetycorrected T0 becomes:
T = T + T0 0$ ∆ ..................................................................................(8)
If the major part of the data set is censored, or if the material is suspected to be macroscopicallyinhomogeneous, K0 can also be estimated directly from the lowest measured fracture toughness valueKlow according to:
K0 = {Klow-Kmin} . [-n/log(1-Pconf)]1/4+ Kmin ........................................(9)
where Pconf is the desired confidence level. Eq. 9 has also been used by Wallin and Hauge [19] to develop astatistical analysis method for LBZ data.
Since the above K0 estimate is based on only one toughness value, it will have the same scatter as a singletest. Thus, the use of Eq. 6 is endorsed when ever possible.

MANUFACTURING TECHNOLOGY 17.03.1997 14(72)
2.3.2.5 Lower bounds
The statistical brittle fracture model includes a lower bound fracture toughness parameter Kmin. Even thoughthe existence of the lower bound is theoretically justified, its exact value is unclear. The value of 20 MPa√mhas been found to yield a good fit to most studied fracture toughness data sets, but it is still only to beregarded as a fitting parameter taken for simplicity to be constant. A more realistic lower bound for cleavagefracture toughness is obtained by adopting the crack arrest toughness (if known). Application of the crackarrest toughness does not guarantee that cleavage fracture initiation is impossible, but it guarantees thatcleavage fracture propagation is hindered, leading only to a very limited crack extension.
Statistically, the soundest definition of a lower bound is a value corresponding to a 1% total failureprobability. If the bias corrected transition temperature is used, the lower bound fracture toughness can bewritten as:
KICLB= 20 + 11 + 77.exp 0.019. T - T0 - . [0.5 - P] . In
1
1- P
1/4
.25
B$
/14
1 4
r
...(10)
where temperature is in °C, thickness is in mm and fracture toughness is in MPa√m. P is the desiredcumulative total failure probability corresponding to the lower bound. Eq. 10 is presented graphically in Fig.3 for r = 1 and r = 100. As seen from the figure, in the case of a lower bound estimate corresponding to aspecifically low total failure probability, the number of tests do not appear very important. However, thisfeature is partly apparent and due to the very conservative nature of the lower bound estimate. It is thuspreferable to use safety factors relating to some confidence level in combination with a desired failureprobability.
2.3.2.6 Size requirements
The statistical model used is valid only when the test results are unaffected by loss of constraint and ductiletearing prior to cleavage fracture. Therefore, recommendations for censoring of data affected by either oneor both of these effects are needed.
Any test specimen has a specific material dependent measuring capacity of fracture toughness, related tothe dimensions and loading geometry of the specimen. The term "loss of constraint" includes two differentphenomena. First, out of plane constraint, which is related to the thickness of the test specimen anddescribes the stress state (plane strain vs. plane stress) ahead of the crack tip. Second, in plane constraint,which is related to the capability of the fracture mechanics parameter to correctly describe the stressesahead of the crack. Fracture toughness testing is usually performed using bend specimens, with a squaresection ligament. Since the specimen is loaded in bending, approximately half of the ligament is in tension.Thus, the effective in plane dimension is only half of the ligament (i.e. half of the thickness) available tomaintain in-plane constraint. Three-dimensional finite element analyses by Nevalainen and Dodds [20]confirm this result quite well.
An additional factor affecting the measurement capacity of a specimen is the amount of ductile crack growthprior to cleavage fracture initiation. Ductile crack growth has a twofold effect [11]. Firstly, a growing cracktends to become sharper than a stationary crack, which increases the overall constraint. On the other hand,ductile crack growth causes a statistical sampling effect [11]. Both effects tend to increase the 'fracturetoughness' capacity of the specimen, but the effect is expected to be small for ∆a < 1 mm.
The effective loading capacity of a specimen can be expressed in terms of the parameter α0:
ασ
0
2y
I2=
E.(1- v . .B
K
)........................................................................(11)
where E is the modulus of elasticity, ν is the Poisson factor, σy is the yield strength and KI is the fracturemechanical loading (elastic or elastic-plastic) expressed in form of K -units.

MANUFACTURING TECHNOLOGY 17.03.1997 15(72)
Based on finite element analyses [20], the measuring capacity of bend specimens has been estimated tobe α0 = 50. Applying the statistical analysis described here, it is also possible to estimate the measuringcapacity experimentally if there is available test data to different specimen sizes. The procedure is asfollows:
- For each specimen size estimate K0 and it's confidence bounds with Eq. 6, and calculateα0 corresponding to K
- Size adjust the largest specimen K0 to correspond to the thickness of the smaller specimens withEq. 3, denote it K0_stat and calculate the ratio K0/K0_stat.
- Plot K0/ K0_stat vs. α0 and examine when the ratio begins to rise clearly above unity. This definesthe specimens measuring capacity.
The above procedure was applied to a number of fracture toughness data sets representing mainlypressure vessel steels. Despite the scatter it was evident that the ratio K0/ K0_stat becomes significantlydependent on a0 when α0 << 30. This can be taken as a basis for the specimen size requirement. Ductilecrack growth preceding cleavage fracture was not found to have a noticeable effect on the result.
2.3.2.7 Reliability of small-scale test data
The standard Charpy test, usually regarded as only a quality control tool, is actually quite capable ofproducing relatively accurate quantitative predictions of large scale structural response [63,64]. As theCharpy test, however, seems slightly less sensitive to toughness degradation resulting from welding orstrain ageing, compared with the fracture toughness test, one should determine the fracture toughnessdirectly applying CTOD or some other appropriate fracture mechanical test (KIC, JC) whenever an accuratedescription of the material's toughness is required. If, however, only a conservative estimate is required,such as for material selection purposes, the Charpy test can be used as the primary basis for toughnesscriteria. Only a single transition temperature (28 J) is then needed.
The results of recent work [63] comparing material's failure behaviour in small-scale and large-scale testsfurther show that the Charpy-V - fracture toughness correlation (Eq. 49) shown to be valid for ferriticstructural steels is also applicable to cold-deformed and strain-aged steel material. This is important, sinceit has been shown [63] that, for instance, the relationship between material's Charpy transition temperatureand nil-ductility transition temperature (NDTT) is influenced by treatments like cold-forming and/or strainageing.
At present, standardised CTOD testing generally prescribes the use of full thickness specimens,regardless of the plate thickness. Because the deformation characteristics of a real structure may have verylittle in common with those of the CTOD specimen, there is practically no guarantee that the CTOD valuesare really descriptive of the structure. The results of recent work [63,64] show that the inclusion of aspecimen size criterion, guaranteeing descriptive results, combined with a sophisticated statistical analysisenable small-scale fracture toughness data to be reliably used also for the failure assessment of largestructures.
2.4 Treatment of ductile fracture and strength mismatch data
In this section, aspects related to the micromechanism of ductile fracture and how it is treated in testingstandards is briefly outlined and discussed. The influence of weld strength mismatch on fractureperformance in small and large scale tests, as well as on subsequent failure behaviour of a structure arealso briefly outlined.
2.4.1 Ductile fracture behaviour
Present testing standards do not give any recommendations for the correct application of fracturetoughness data for structural integrity assessment and yet this is a crucial point for a successfulassessment. Originally, the lack of recommendations regarding the treatment of data has been due tolacking knowledge as to what the recommendations should be.
Classical, continuum mechanics based, fracture mechanics assume the materials fracture toughness tobe a specific single value material property. Any scatter in the fracture toughness is attributed to
MANUFACTURING TECHNOLOGY 17.03.1997 16(72)
macroscopic inhomogeneity of the material. Materials research has shown that the simple continuummechanics description of the material can be inappropriate when considering the material behaviour. Thematerial may fracture by different micromechanisms leading to different inherent properties of the fractureresistance.
The two main micromechanisms encountered in fracture resistance testing are ductile fracture andcleavage fracture. A third micromechanism i.e. grain boundary fracture is also possible, but it is of lesserrelevance. This is fortunate, because the fracture mechanical modelling of grain boundary fracture is stillincomplete. For structural integrity assessment it is advisable to treat grain boundary fracture similarly tocleavage fracture.
There is a widely recognised view that ductile fracture proceeds by a continuous mechanism of microvoidnucleation and coalescence. Microvoid coalescence is a critical strain-controlled mechanism. As such, it isstrongly governed by the maximum strain state along the crack front. For the crack to propagatemacroscopically, microvoid coalescence must occur along the whole crack front. The macroscopic fractureresistance to ductile fracture is thus governed by the mean toughness properties of the material. Thismeans that for a macroscopically homogeneous material, the parameters related to ductile fracture shouldshow only a small amount of scatter. Also, as long as the fracture mechanics parameter describe thestrains in front of the crack, the fracture resistance properties should also be specimen size and geometryindependent.
The first standardised fracture mechanics test was the ASTM E399 "Plane Strain Fracture Toughness" (KIC)test. It was developed mainly for aluminium and titanium alloys and extra high strength steels. A commondenominator for the majority of the materials was that they failed by ductile fracture. Due to it's continuousnature, ductile fracture develops a rising R-curve, i.e. increasing fracture resistance with increasing crackgrowth.
Ordinary KIC tests according to ASTM E399 and related standards apply a 95% secant procedure. Thesecant procedure is based on the assumption that the deviation from linearity in the load-displacementtrace is in practice only due to stable ductile crack growth. A KIC value corresponding to the 95% secant isassumed to be related to a toughness value corresponding to a 2% crack growth in the ligament. Thespecimen size criterion in the standards are actually included to ensure that the load-displacementresponse of the specimen will be unaffected by plasticity effects. Parameters violating the KIC size criterion(KQ) usually describe mainly specimen plasticity effects and as such they should not be used. The problemwith KIC is that it does not distinguish between ductile fracture and brittle cleavage fracture.
In the case of ductile fracture the KIC will correspond to a 2% crack growth in the ligament. This causes thata larger specimen will correspond to more actual ductile crack growth. Because ductile fracture has anincreasing R-curve (dK/da>0), a large specimen will yield a higher KIC than a small specimen, even for validtests. On the other hand, the validity criteria in the testing standards are such that a KIC value for ductilefracture is obtainable only for materials whose R-curve is very flat. The validity criteria in the KIC standardhave actually only been chosen as to produce a linear elastic load response of the specimen and to yieldessentially specimen size independent toughness values for ductile fracture. Somewhat misleading, theterm "plane strain" has been used in this context. In reality, the validity criteria are not directly related to thestress state and the KIC size criteria should not be used as a criterion for plane strain.
2.4.2 Effect of weld strength mismatch
It has recently become clear that the failure behaviour of a welded structure is influenced by the relativestrength of the weld metal, the HAZ and the parent plate. It has been widely established [133-142,145-147]that in a welded joint, weld metal strength mismatch affects fracture toughness test results obtained fromthe HAZ, and that the effect of mismatch also often appears differently in the CTOD and wide-plate tests.Therefore, this item is briefly discussed here although it is not primarily a matter of Task 3 of SINTAP butTask 1, instead.
With respect to small-scale CTOD testing, the heterogeneity of the crack tip vicinity - i.e. the deformation ofthe entire vicinity of the crack tip - can strongly influence on the apparent toughness and the crack pathdirection [145-147]. Both experimental work and theoretical FEM calculations have demonstrated [133,137-139,145-147] that increasing weld metal overmatching strength may elevate the stress level in the adjacentcoarse-grained HAZ (CGHAZ). This accrues from the fact that during external bending loading, higherstrength in the weld metal confines the crack path into the HAZ by hindering any localisation of strains in theweld metal itself, thereby increasing the stress state in the adjacent CGHAZ. An elevated stress level in the
MANUFACTURING TECHNOLOGY 17.03.1997 17(72)
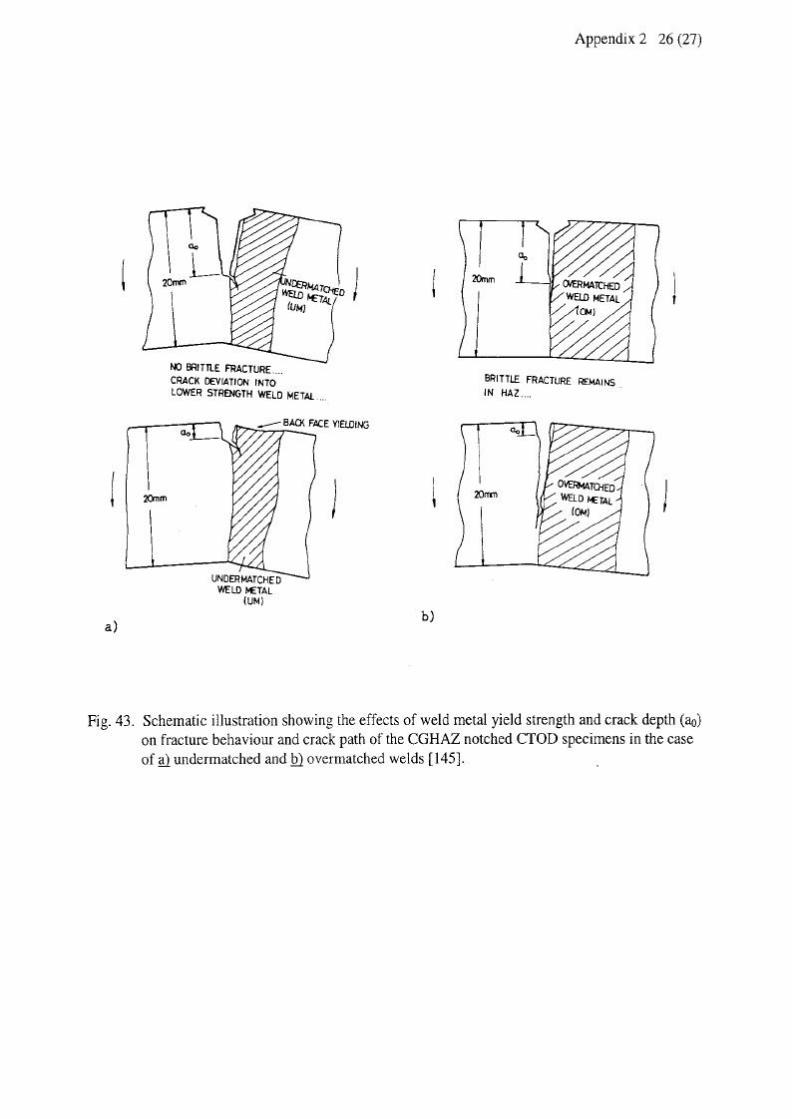
CGHAZ can have a subsequent detrimental effect on brittle fracture resistance, seen as low CTOD values inthe CGHAZ. Therefore, excessive weld overmatching strength may unnecessarily lower the CTOD resultsfor the HAZ for a given welded joint, and even prevent fulfilling the toughness requirements originally set bythe standards. Undermatching weld metal strength, on the other hand, will cause a concentration of theapplied strain in the weld metal instead of the HAZ, which may then result in the deviation of the crack pathfrom the HAZ into the weld metal [145-147].
The effect of weld metal yield strength and crack depth on crack path and fracture behaviour of the CGHAZ inthe case of a) undermatched and b) overmatched weld is schematically shown in Fig. 43.
Also other cracking problems, such as weld metal hydrogen cracks, may be encountered if highlyovermatching weld metals are meant to be used, especially in the higher strength quenched & temperedsteels with weld metal yield strength in the range of 550...600 MPa and above.In accordance with small-scale tests, the degree of weld metal strength overmatch can also influence theincidence of wide-plate fractures and, especially, the direction of fracture path. In contrast to the CTOD test,a beneficial effect of weld metal overmatching strength on fracture toughness is often recognised in thewide-plate test, as overmatching shields a crack from applied strains. The fracture behaviour depends,among other things, on the degree of strength overmatch and hence also the strength class of the parentplate [141].
In 500 MPa tensile strength steels, like YS 355 normalised grades, where considerable weld metalstrength overmatching is commonly faced with most notch tough consumables, the fracture path in the wideplate test has frequently been found to tear away from the fusion line towards the lower strength parentplate. The level of strain in the weld metal rises less steeply than that in the parent plate, once the loweryield strength parent plate has started to yield. The strain on the fusion line is generally lower still, whereasthe strain in the weld metal eventually approaches that achieved in the parent plate if sufficient overall strainoccurs. The observed strain levels in the HAZ hence remain lower than in the surrounding material and theovermatching weld metal in this sense gives protection to the weld against the defects [141].
In 800 MPa tensile strength steels, like YS 700 MPa quenched & tempered grades, in turn, the degree ofweld metal overmatching strength usually remains considerably less. As a result, the fracture path hasbeen observed to deviate back towards the CGHAZ adjacent to the fusion line and subsequently initiate abrittle fracture. The level of strain at the fusion boundary rises more steeply compared with that in the weldmetal and parent plate. The more matching weld metal strength in this strength class hence decreases thelevel of protection given to the defect. These effects have been shown to increase the incidence of wide pla-te fractures [141].
With regard to the degree of strength mismatch, it has been found [142] that with increasing crack lengthsand/or decreasing weld overmatching levels, weldment performance depends decisively on weld metaltoughness, since all the applied strain concentrates into the crack tip or surrounding weld metal. Thus, for agiven applied strain, an undermatching weld metal requires higher fracture initiation resistance(toughness) than an overmatching weld [142, 145-147]. This means that defective undermatching weldmetals exposed to plastic straining require adequate strain hardening and high toughness to preventfailure at low overall strain levels. The need for plastic straining capacity in some applications can thereforelimit the use of undermatching weld metals.
Besides standard CTOD (BS 5762), fracture toughness can be expressed in terms of 'local CTOD' usingthe δ5 parameter [145-147]. The following advantages have been found: i) δ5 is a quantity which is locallymeasured; thus the measurement is independent of the global behaviour of the specimen, ii) δ5 is directlymeasured as a displacement; no calibration function is therefore needed, iii) δ5 can be easily estimated asa driving force parameter using the ETM failure assessment method. It has been found [147] that ingeneral, the CTOD δ5 measurements are well consistent with the calculated CTOD values according to BS5762 for both shallow (a/W = 0.16) and deep (a/W = 0.4...0.5) cracked specimens, if the plastic rotationfactor (rp) is adjusted as approx. 0.25, see Fig. 44.The effects of weld metal mismatching strength (M) and a/W ratio on the CGHAZ apparent toughness interms of locally measured CTOD (δ5) are shown in Fig. 45. It is seen that an undermatching weld metalresults in an increase of the critical CTOD δ5, compared with overmatching weld metals and that the effectof crack depth appears most pronounced in undermatching welds. Also for matching welds, shallownotched specimens are seen to yield higher apparent CTOD values than deep notched specimens. Forhighly overmatching welds, on the other hand, the loss of crack tip constraint caused by a shallow crack is

MANUFACTURING TECHNOLOGY 17.03.1997 18(72)
almost totally compensated by the constraint resulting from overmatching strength and hence thereappears to be no effect of notch depth on apparent HAZ fracture toughness [145,146].
It is well known that advanced steelmaking techniques lowering the C content which causes a decrease intensile strength, in combination with modern rolling practices, is capable of raising the material's yieldstrength without the corresponding increase in tensile strength. Recent work [133,138,142] havedemonstrated that this may result in a marked increase in the material's yield-to-tensile ratio (Re/Rm) with aconcomitant reduction of the strain hardening rate/capacity. It follows that under external load, anylocalisation of strain in defective regions (or near local brittle zone capable of initiating a crack) may lead tounstable collapse at low overall deformation levels, whilst conventional steels with lower Re/Rm ratios (i.e.higher strain hardening capacity) will tend to spread their plastic deformation over a larger part of thecomponent. In other words, materials with a high yield-to-tensile ratio may have inadequate strain har-dening capacity to redistribute local deformations.
The relationship between strain hardening capacity (i.e. the Re/Rm ratio) and toughness will becomeincreasingly significant as the yield strength level of steels tends to increase. This rise in material's yieldstrength in welded steel structures is further accompanied by a corresponding increase in design stressesand/or residual stress. By some authors [133,138,142] it has been proposed that the overall failure beha-viour of weldments in such a situation is not always governed by toughness alone, but also by the baseand/or weld metal Re/Rm ratio and that the failure behaviour should therefore no longer be treated as asmall-scale phenomenon, nor assessed only by small-scale tests.
Similarly, HAZ undermatching strength, like local softened zones typical to TMCP and quenched & tempered(QT) steels may in some cases adversely affect the performance of the entire weldment [135,136]. It hasbeen reported [138] that in the presence of a softened zone, the wide-plate test specimens notched at theHAZ can show tendency to fracture at low strains with the fracture path being confined to the fusionboundary. It has been shown [142] that plastic straining tolerance decreases in the presence of welddefects. In the presence of a crack, all applied deformation will concentrate as plastic strain in this "weak"region [135,136,138]. Unless this region is very tough and free from flaws, imperfections and defects, sucha situation may lead to low-strain fracture [138,142]. This may also occur in the presence of LBZ in the vi-cinity of a softened zone.
In fact, it has been postulated [140,142] that local toughness properties, assessed for instance by CTODtesting, would be critical particularly - and, perhaps, only - for undermatching welds containing large de-fects.As the softened zone in a real weldment usually locates in the outer HAZ further away from the fusionboundary, the probability of such a zone to contain any cracks or weld defects is very low. In a recent work[134], it has been demonstrated that in modern high performance TMCP steels with excellent toughnessproperties, the ductility and toughness of the softened zone are generally satisfactorily high and no failurestriggered by the existence of this zone have been recognised in large-scale wide-plate tests.
Welded structures are normally designed to perform within the elastic stress range, which is the case forinstance in offshore applications [142]. In this case, the material's fracture toughness and failureperformance can generally be satisfactorily assessed using small-scale fracture toughness tests, likeCTOD. In fact, recent studies [63,64] demonstrate that the inclusion of the specimen's size criterion,guaranteeing descriptive test results, combined with a sophisticated statistical analysis enable small-scalefracture toughness data to be reliably used for the failure assessment of large structures.
Despite this, there are some reasons why weldments should possess also plastic straining capacity toensure full safety against failure. These include for example: i) severe field conditions or structureinstallations that may dictate the need for weldments which can undergo plastic strains without damage, ii)weld defects may grow in size by fatigue during service and iii) complex structures may require a certaindegree of plastic straining capacity to achieve their design strength [142]. In such cases, and for welds ofstrength mismatch and/or LBZ, wide-plate testing, in addition of small-scale fracture toughness tests, maybe necessary to assess the failure behaviour of the entire structural member.
2.5 Future work
In this section two models, a probabilistic fracture mechanics analysis method developed at TWI and astatistical brittle fracture model developed at VTT have been reviewed. The relevance of the TWI model to
MANUFACTURING TECHNOLOGY 17.03.1997 19(72)
SINTAP is that it can be used to assess the probability of failure by fracture or ductile crack growth and tohelp define partial safety factors for use in deterministic fracture mechanics analyses. It also enables theassessment of the effect of local brittle zones (LBZ) on weldment's fracture toughness. The statistical brittlefracture model by VTT, in turn, can be applied to derive statistically defined safety factors applicable forsubsequent structural integrity assessment. It provides means for obtaining optimum best and safeestimates of the fracture behaviour in a structure based on small specimen data. The safety factors areconnected to maximum likelihood estimates of either the fracture toughness or the transition temperatureallowing for the analysis of randomly censored data. The VTT model can be further used to determine themeasuring capacity of a test specimen from experimental data.
It is recommended that the suitability of the VTT methodology in serving as a basis for a common Europeanstructural integrity assessment procedure will be evaluated. This work forms a part of VTT's contribution inSINTAP project Task 3. The possibilities of incorporating the TWI model and the VTT model in a way thatenables the influence of local inhomogeneities (e.g. LBZ) in the HAZ to be taken into account via the TWImodel in the final procedure based on the VTT model are suggested to be investigated. This is seen as ameans of improving the accuracy of the VTT model at its present stage. Therefore, these approaches will befurther developed with particular emphasis in using existing data sets from European Round Robinexercises.
MANUFACTURING TECHNOLOGY 17.03.1997 20(72)
3. CHARPY - FRACTURE TOUGHNESS CORRELATIONS
This section of the status review covers existing Charpy - fracture toughness correlations for ferriticstructural steels, as well as their sources and validity ranges. It also outlines the potential problems,advantages and limitations of correlations. Furthermore, common approaches are identified and suitablegeneric forms of correlations highlighted. Attention is also paid to assess, from an industrial viewpoint,what should be required in a standard. Finally, a suggestion for the next stage of work on correlations withinthe SINTAP project is provided.
Very often the situation is that in practical terms a Charpy impact energy at a given temperature is all thatmay be available to the user to determine a toughness value. The safe application of correlations, however,presents significant difficulties to the engineer, owing to the wide variety of possible material types,applications and limited availability of data. The principal objective of this section is not to derive any newcorrelations or to assess the accuracy of existing ones but to provide a framework for further work aimed atintroducing and recommending the most appropriate methods for correlating Charpy energy and fracturetoughness for structural integrity assessments.
3.1 Industrial problems and issues
Fracture mechanics based structural integrity assessment procedures, such as BSI PD6493: 1991 [1],require knowledge of material fracture toughness, in terms of K, CTOD or J. In an ideal situation fracturetoughness data for use in structural integrity assessments are generated through the use of appropriatefracture mechanics-based toughness tests. However, in reality it is often found that such data areunavailable, insufficient or inadequate and cannot be easily obtained due to unavailability of material or theimpracticability of removing material from the actual structure. In such circumstances it is necessary toemploy indirect methods of estimating fracture toughness. If other measures of toughness such as Charpyimpact energy (Cv), nil-ductility temperature (NDTT), etc. are known, then it may be possible to estimatefracture toughness values suitable for fracture assessment purposes, based on correlations between themand fracture toughness (K). The Charpy impact energy for a particular material is often more likely to beavailable than fracture toughness since it is used as an acceptance test for quality control purposes formany steels.
The safe application of published correlations presents significant difficulties to the engineer because ofthe wide variety of possible material types, applications and limited availability of data. Despite thesedifficulties, the reality of the situation is that in practical terms a Charpy impact energy at a given temperatureis all that may be available for a material and to the user. The question is not therefore whether suchcorrelations should be used in practice, but rather which type of correlation should be used and what arethe limits of applicability. There are a large number of publications on this subject and a number ofextensive reviews have been carried out [21-23]. However, the results of these reviews have largely beenignored in structural integrity assessment codes which tend to include, if at all, only one or two correlationswhich may be overly conservative. Furthermore, although many correlations use the same mathematicalform, and consequently give similar results, the existence of so many in the literature renders the choice ofappropriate correlation a daunting task for many users, despite the existence of comprehensive software toprovide details on the correlations [22].
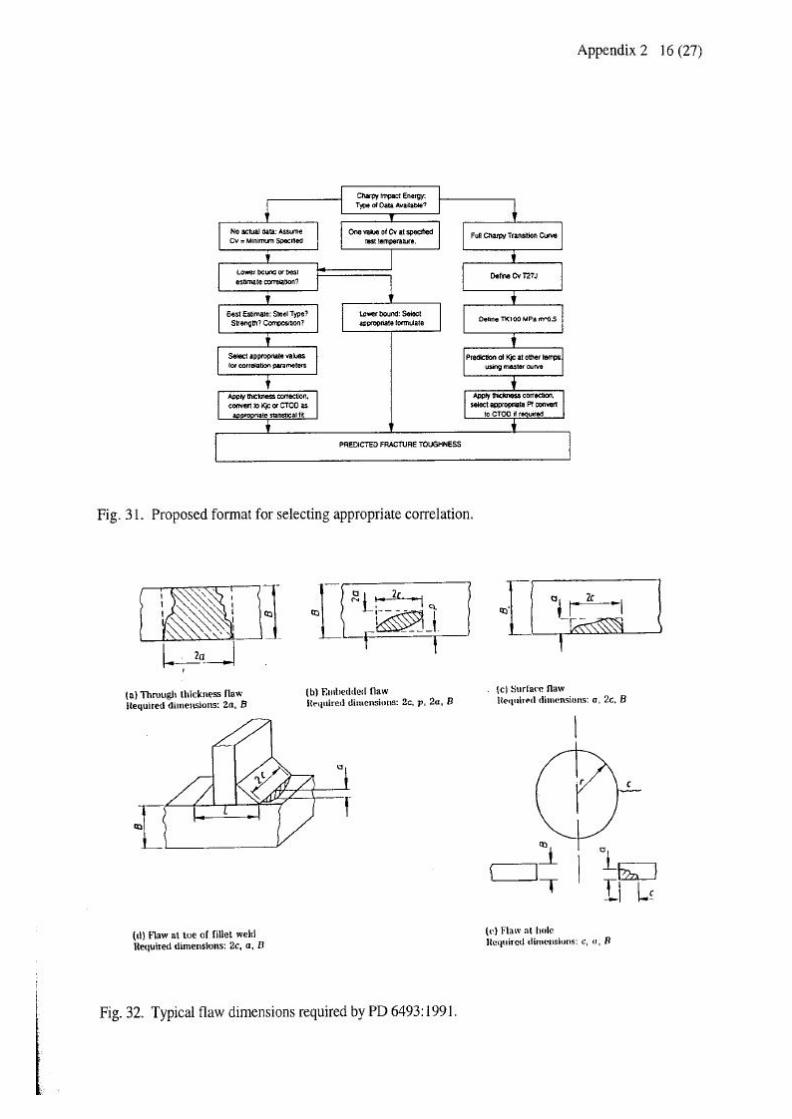
The major problem with applying fracture mechanics based assessment methods is the availability of inputdata. Fracture toughness is the property which is the most rarely known [24]. Even if Charpy data areavailable, the format of the information will also dictate how useful it is. Charpy impact energy data for amaterial either under fabrication or in-service will usually take one of four forms, c.f. Fig. 6:
(i) A certificate verifying that the Charpy requirements for the particular grade (x J at T °C) has beensatisfied.
(ii) A certificate stating what the actual Charpy energy is at the test temperature (T °C) for the grade,usually in the form of detailed actual Charpy energy measurements, normally three (3) at the testtemperature.
(iii) A Charpy energy as for (ii) but with a % crystallinity value in addition.
(iv) A full Charpy impact transition curve, possibly also with a % crystallinity values or curves.
MANUFACTURING TECHNOLOGY 17.03.1997 21(72)
The least desirable data form is (i), the most common (ii), and the most desirable (iv).
The range of formats in which such data are available means that a number of correlation types are neededwhich allow for flexibility depending on data availability. The use of only one direct correlation betweenCharpy impact energy and fracture toughness will not allow maximum benefit to be gained from anyavailable transition curve data; whereas, a correlation based on a temperature shift of the temperaturecorrelating to a specific Charpy energy is of little use if only one other Charpyÿenergy at differenttemperature is available. It is therefore proposed that a number of different correlation approaches shouldbe available to the user. The selection of the most appropriate approach should be based on dataavailability.
For welded structures, the use of correlations is even more difficult because of the complex nature ofwelded joints. Weldments, especially thick section multipass welds, contain a wide range ofmicrostructures with a wide range of material properties (toughness and tensile properties), which may behighly temperature dependent. In addition, toughness is affected by section thickness, crack size andposition, and joint configuration (constraint). The application of Cv - K correlations is further hampered by theinherent scatter associated with fracture toughness measurements. Unfortunately, correlations areespecially problematic for ferritic steels which is the most common application of structure integrityassessment procedures, owing to the transition from brittle to ductile behaviour with temperature.
These difficulties in assessing fracture toughness of welded structures are also reflected by the fact that themajority of the Cv - K correlations presented in sections 3.4 and 3.5 are for the base material and only few ofthem actually apply to the HAZ or weld metal.
3.2 Current status and approaches
A large number of correlations have been developed and published for a wide variety of materials. Someare specific to a particular material type, while others include several or many material types and grades. Anumber of general reviews have been published [21,23], and a number of published correlations are widelyused, such as the ASME KIR curve, PD 6493 correlations, and the Barsom-Rolfe-Novak, Sailors-Corten andMarandet-Sanz correlations [23]. An extensive review of existing correlations is presented here in section3.4.
In principle, there are essentially three approaches to Charpy-V - fracture toughness correlations, Fig. 7:
- Direct relationship between Charpy impact energy and fracture mechanics parameter.
- Relationship between Charpy impact energy and fracture mechanics parameter factored inaccordance with tensile properties.
- Relationships between transition temperatures corresponding to specific levels of Charpy impactenergy or fracture toughness
TWI has undertaken a group-sponsored project completed in 1994 which collected together over 30published correlations [85]. The final report of this project is attached to this report. It includes a review ofvarious types of toughness correlations, and describes in detail published Charpy energy (Cv) - fracturetoughness (K) correlations for the lower-shelf, transition and upper-shelf regimes. Various data setsderived from TWI archives were used for validation purposes. Comparisons focused on the two correlationsincluded in PD 6493 Appendix B, a lower-shelf / transition correlation derived from the ASME KIR curve, andan upper-shelf correlation, see Figs 4 and 5. It was concluded that the application of these two correlationsis generally conservative; however, the application of correlations to heat-affected zones (HAZs) of structuralsteels is of particular concern, together with Ni alloyed steels. Several published correlations were shownto be potentially unsafe.
With respect to Cv - K correlations for upper-shelf regime, it should be noted that although the definition ofupper shelf is clearly quantified, as far as upper shelf impact toughness is concerned, this is notnecessarily the case in fracture toughness testing. Therefore, regarding fracture toughness testing it shouldbe indicated precisely, what is meant by "upper shelf", i.e. is it actually defined as a point where initiation oftearing starts, or is it some other level of fracture toughness in the corresponding R-curve.
MANUFACTURING TECHNOLOGY 17.03.1997 22(72)
TWI has considerable experience in the application of fitness-for-purpose assessment methods in a widerange of industrial applications. At TWI, PD 6493 correlations are generally applied, together with Cv-temperature correlations (e.g. BS 5500 Appendix D: 1.5 J/oC, 20 J < Cv < 47 J). The followingrecommendations are derived from the general approach adopted at TWI for structural integrityassessments:
1) Charpy-toughness correlations should be applied with extreme caution when used for theassessment of safety critical welded joints.
2) Assessments which are based on Charpy-toughness correlations should include additional safetyfactors (e.g. PD 6493 Level 1).
3) Where possible, correlations should be validated by fracture mechanics testing of data obtainedfrom the literature or archives.
In addition, NE has provided a confidential supplement to R/H/R6 - Revision 3 Appendix 1 [12] concentratingalso on indirect methods of estimating fracture toughness and Charpy energy - fracture toughnesscorrelations, as contribution to SINTAP sub-task 3.3. As the Appendix 1 [12] at the moment is of confidentialnature, the policy of its further distribution outside the consortium should be clearly stated.
3.3 Potential problems with correlations
The potential problems and sources of inaccuracy associated with Charpy - fracture toughness (Cv - K)correlations are briefly outlined.
3.3.1 Differences in test methods
A comparison of the Charpy impact and fracture toughness tests [21] highlights several important areas ofdifference which are briefly summarised here:
i) Fracture toughness specimens are fatigue pre-cracked and contain a sharp crack, whereasCharpy specimens have a blunt V-notch with 0.25 mm root radius. Hence, the two specimen willshow different propensity to brittle fracture.
ii) Full thickness specimens are usually tested for fracture toughness testing whereas small (10 x 10x 55 mm) square samples are used for Charpy tests. Difference in constraint will lead to shifts intemperature transition curves relative to one another. Furthermore, thicker specimens will, ifWeakest Link theory applies potentially sample more fracture-initiating features leading to anincreased fracture probability.
iii) Fracture toughness is usually measured quasi-statically at low strain rates, whereas Charpyenergy is measured under impact conditions at high strain rates. This can cause a shift in the twotransition curves relative to each other.
iv) Generally, fracture toughness tests used to correlate K to Cv provide a measure of initiationtoughness, while Charpy impact energy initially includes both initiation and propagation energiesof fracture. Thus, fracture toughness tests are usually more sensitive to local inhomogeneitiescausing variations in toughness.
For direct Charpy - fracture toughness correlations, it was found that the variation in predicted toughness islarge for lower shelf correlations and very large for upper shelf correlations, Figs 13 and 17. It is obviousthat good direct correlations are obtained only in certain toughness ranges. Considering this could lead to aconclusion that more reliable correlations are to be expected for the lower shelf / lower transition regimes,compared with the upper shelf regime. It is known that close to the lower transition regime the fractureprocess also in the Charpy specimen is largely dominated by the energy required for fracture initiationaccompanied by a negligible amount of ductile fracture and plastic deformation. This means thatsubsequent fracture propagation and the associated energy for it becomes less significant.
Although the range of predicted fracture toughness levels is somewhat greater for upper shelf correlationsthan that obtained in the comparison of the lower shelf correlations, the range of toughness variation

MANUFACTURING TECHNOLOGY 17.03.1997 23(72)
should always be considered in relation to the absolute toughness values. It is seen that not only the rangeof variation but also the absolute toughness values for upper shelf are much greater than those for thelower shelf, Figs 13 and 17. Therefore, no statement regarding the accuracy of the correlations for lowershelf and upper shelf is appropriate. There is no evidence that the initial reliability of the correlations wouldbe greater on the lower transition regime, compared with the upper shelf.
3.3.2 Changes in Charpy transition behaviour of modern steels
For structural steels, improvements in processing methods over the last twenty years have given steels withleaner compositions: less alloying elements, lower residual element levels, as well as with finer grain size.As a result of this, lean composition steels, and particularly those produced via the thermomechanicalprocessing (TMCR/TMCP, AcC) or quenching & tempering (Q&T) route, have different Charpy behaviour toolder steels and a different relationship between the Charpy and fracture toughness transition curves. Thefollowing trends are evident for modern steels as compared to their older counterparts:
- Lower Charpy transition temperatures [63,64].
- Narrower transition temperature range.
- Higher upper shelf values [63-65].
- Less correlation between Charpy impact energy and % crystallinity on fracture surface [25,65]
- Potentially higher Charpy energy for a given % crystallinity [25,65].
- Higher Charpy energy associated with fracture initiation, in particular [63-65]
- Different relative positions of Charpy and fracture toughness transition curves [26]
The change in the relationship between Charpy impact energy and % crystallinity for structural steels in thepast 20ÿyears is shown in Fig. 8. Furthermore, there has been a change in relative positions of Charpy andfracture toughness transition curves with composition and steel type. Modern steel processing hasimproved the fracture toughness to a lesser extent than the Charpy energy [63,64]. The impact energyrequired for fracture initiation, in particular, is significantly greater for modern low-impurity, low-carbonsteels than for conventional CMn steels [65]. All the above factors contribute to the necessity to take intoconsideration the steel type or composition, when using correlations. One parameter used to quantifycompositional aspects is [10 (% S) + % C], as used by Graville [22,54]. The Charpy 40 J transitiontemperature shows a different dependence on [%C+10 (%S)] than the CTOD 0.25 mm transitiontemperature, Fig. 9.
3.3.3 Shape of transition curves
Since the relative positions of the Charpy impact and fracture toughness transition curves are not fixed therecan be no direct correlation between the parameters over the full transition curve. Only correlations basedon temperature shift approaches (Sanz [27], Barsom et al [28] and Wallin [29]) can take this phenomenoninto account. It is therefore expected that direct correlations will yield good results only in certain toughnessranges; for this reason most correlations can be divided into a range of applicability, namely lower shelf,transition and upper shelf. The definition of the three parts of the Charpy transition curve is a potentialproblem area; definitions based on % crystallinity may lead to different definitions for different steels, seesection 3.3.2, and this information is in practice rarely available. Further evidence on the relationshipbetween % crystallinity and Charpy energy to be material dependent was found recently, as reported in [65].
3.3.4 Prediction of Charpy and fracture toughness values at a range of temperatures
Where a Charpy energy or fracture toughness value is known at one temperature it is often useful to be ableto estimate an equivalent value at another temperature. For Charpy impact energy an often used factor is1.5 J / °C. In some cases the use of this gradient is only recommended for average impact energiesbetween 20 and 47 J [30] whereas in others [31] values between 5 and 101 J are addressed, Fig. 10(a).

MANUFACTURING TECHNOLOGY 17.03.1997 24(72)
For fracture toughness, the most widely documented method for estimating the temperature dependencefor lower shelf and transition areas is that due to Wallin [32], Fig. 10(b) and now forming part of an ASTMdraft procedure [33]. The expression has already been given in, Eq. (4), section 2.3.2.2.
Other approaches [34] reference the KIC value to the Nil Ductility Transition Temperature (NDTT), althoughthis approach is likely to be of limited use in most applications, where NDTT is not available.
3.3.5 Relationships between fracture toughness parameters
Charpy fracture toughness correlations in the literature are for predominantly based on fracture toughness,K, although some CTOD (δ) correlations exist. Steel type, temperature and thickness affect the choice oftoughness parameter. The principal factors affecting the relationship between the three parameters K, Jand δ are: i) a fracture toughness test standard in question, ii) type of test result (critical, unstable ormaximum) and iii) constraint.
K-based fracture toughness can be determined using sufficiently large specimens, leading to a KIC value,or from the elastic-plastic J-integral, leading to a KJ value, or if critical, a K value:
K = J.E / (1 - vJ2 ) ........................................................................(12)
where E is Young's Modulus and n Poisson's Ratio.
The relationship between K and J has been found to become less accurate with increasing plasticity. Thisis because of large scale yielding.
The relationship between J and δ is given by:
J = λ σy δ ................................................................................(13)
where for high constraint, plane strain conditions leading to δc type behaviour, λ ≈ 2 and for low constraint,plane stress conditions leading to δu or δm type behaviour, λ ≈ 1. The exact value of λ depends onconstraint level and the material's strain hardening behaviour. The value of λ has been found [35] to beindependent of specimen geometry and post weld heat treatment (PWHT). In the case of welded joints,notch location has been found to affect λ with cracks located in the HAZ of overmatched joints, givingreduced λ values on account of reduced constraint arising from the presence of lower strength material onone side of the notch [35].
From Equations (12) and (13) the relationship between K and d becomes:
δλσ
=K
E
2
y1 ...................................................................................(14)
where for plane stress λ = 1 and E/= E, and for plane strain λ=2 and E/=E/(1- ν2)
Equations (12), (13), and (14), therefore, provide relationships to correlate fracture mechanics parameters,although their accuracy depends on the degree of plasticity in the test. Furthermore, thickness adjustmentis usually required when behaviour is brittle.
3.3.6 Effect of thickness
The Charpy impact test specimen has standard dimensions whereas a fracture toughness specimenusually has not. In fact, the fracture toughness specimen has no special relationship to the sectionthickness, except in the special case of the recommended dimensions for the CTOD test. In such a case,the specimen thickness is usually related to the component or plate thickness in a way that full thicknessspecimens are required, regardless of the plate thickness [64]. Offshore applications, for instance,frequently require the use of full thickness specimens.

MANUFACTURING TECHNOLOGY 17.03.1997 25(72)
The effect of thickness on KIC can be expressed as [36]:
(KIC)4 B = constant ..........................................................................(15)
Where B = specimen thickness. Since δ ≡ K2, the equivalent expression for CTOD is:
δ2 B = constant .............................................................(16)
It is considered important that for any correlation the effect of thickness on toughness is incorporated tonormalise the results. If this is not used the sensitivity of fracture toughness to thickness may limit theusefulness of correlations.
Regardless of whether KIC or KJC results are obtained, the results of tests on one specimen thickness canbe equated to another using Equation (3) given in section 2.3.2.1 [37].
3.3.7 Statistical aspects
As a final consideration, the use of a statistical approach in correlations can overcome the conservatism ofusing a lower bound correlation or estimates. Since all correlations have inherent data scatter it isadvantageous to be able to define the correlation parameters with a given level of statistical confidence asdescribed in section 3.5.2.1
3.4 Direct correlations between Charpy impact energy and fracture toughness
This section reviews the direct Charpy energy - fracture toughness (Cv - K) correlations available in theliterature. Although many of the correlations presented here frequently refer to KIC, it is seldom clearly statedwhether fracture toughness actually relates to i) initiation of tearing, ii) J or KJ after some tearing, or iii) someindeterminate level. In this respect, the correlations may hence lack credibility. Regarding correlations forupper shelf (section 3.4.3) it should be stressed that due to its unclear definition, KIC usually is not anappropriate parameter for upper shelf behaviour at all, although many of the available correlationsfrequently refer to it.
The units used in the Cv - K correlations are summarised in Appendix 1 Tables 1 - 3. Except wherespecifically noted, the correlations apply to base material only.
3.4.1 Generic correlations
Correlations applicable to the lower shelf and to the lower shelf/transition areas usually take the form:
KIC= aCvb .............................................................................................(17)
where Cv is the Charpy V-notch energy and a and b constants. The fracture toughness parameter may alsobe described in terms of CTOD and the expression presented in linear form as:
log δc = a + b log Cv ..................................................................(18)
Numerous values for the constants a and b have been forwarded; these are covered in more detail later. Inaddition, the KIC is sometimes normalised by the yield stress.
Transition correlations invariably follow the form:
K = aCvICb2
.............................................................................................(19)
The square factor accounts for the sharp increase in toughness as the transition temperature is reached.Equation (19) reduces to Equation (17) by taking the square root.
Upper shelf correlations usually incorporate the yield stress and typically take the form:

MANUFACTURING TECHNOLOGY 17.03.1997 26(72)
K
aC
+ bIC
y
v
yσ σ
=
2
.............................................................(20)
3.4.2 Specific correlations for lower shelf and lower transition regions (Units: MPa√m,MPa, J)
3.4.2.1 Chaudhuri et al [38]
Chaudhuri et al [38] have developed CTOD - Cv correlations for API X52 line pipe steel in 10 mm thickness,Fig. 11. Three correlations are proposed:
log δc = 1.14 log Cv - 2.33 [mm, J] .......................................................(21)
log δc = 1.30 log Cv - 2.58 [mm, J] .......................................................(22)
log δc = 1.06 log Cv - 2.24 [mm, J] .......................................................(23)

MANUFACTURING TECHNOLOGY 17.03.1997 27(72)
Equations (21) and (22) are applicable to HAZs with ductile or brittle fracture, respectively. Equation (23) isfor weld metal. Charpy impact energy values for the correlations varied between 18 and 64 J, respectively.
3.4.2.2 Girenko et al [39]
Girenko and Lyndin [39] have assessed a range of pressure vessel and ship steels with Charpy energiesin the range 2 to 150 J, giving a correlation of:
KIC = 17 Cv0.5 .......................................................................................(24)
3.4.2.3 Imai et al [40]
Imai et al [40] give a correlation for the lower shelf/transition range covering Charpy energies from 5 to 200J. The proposed correlation is a lower bound of 65 data points and incorporates the yield strength, Fig. 12.:
K
2.5 CvIC 0.52
σ= .............................................................................................(25)
3.4.2.4 Logan et al [41]
Logan et al [41] have derived a lower shelf/lower transition correlation using high strength engineeringsteels with yield strengths in the range 820-1420 N/mm2 and Charpy energies of 7 - 37 J:
KIC = 20.3 Cv0.5 ..................................................................................(26)
3.4.2.5 Sailors and Corten [42]
A similar expression to Equation (26) has been derived by Sailors and Corten [42] using steels in the yieldstrength range 410 - 815 N/mm2:
KIC = 14.6 Cv0.5 ...............................................................................(27)
3.4.2.6 Barsom, Rolfe and Novak [28,43,44]
Work on steels in the yield strength range 270 - 1700 N/mm2 by Barsom et al [43,44] has led to twocorrelations, the first being derived for Charpy energies in the range 4 - 82 J, the second for a range of 31 -121 J:
KIC = 45.1 Cv3/2 .................................................................(28)
K
0.64C
+ 0.01IC
y
V
yσ σ
=
2
....... .........................................................(29)
The figure 0.01 in Equation (29) was revised to 0.02 by Roberts et al [23] to represent a 95% confidencelimit.
3.4.2.7 Exxon Fitness for Service Guide [30]
Section 5 of EXXON's Fitness for Service Guide [30] provides the correlation for conservative estimation offracture toughness:
K650 C E
ICV=
1000 .............................................................................................(30)

MANUFACTURING TECHNOLOGY 17.03.1997 28(72)
3.4.2.8 Comparison of lower shelf / lower transition correlations
A summary of the correlations described is given in Table 1, and a comparison of the predictions of the KIC
correlations for Charpy impact energies in the range 5-50 J is given in Fig. 13. It should be noted that noneof these data are thickness adjusted.
The majority of the correlations follow lines of similar gradient except for that due to Imai [40], Equation (25).Such correlations for lower shelf / lower tail transition behaviour are therefore suitably described by anEquation (17) of the form:
KIC = aCvb ...........................................................................................(17)
where a and b are factors to be determined which depend on strength, composition, thickness etc.
The most conservative correlation is from the EXXON Fitness for Service Guide [30], Equation (30), whichhas the lowest value of "a" in Equation (17) of 11.6 while the least conservative is that due to Logan et al[41], Equation (26), which has "a" of 20.3.
The two correlations incorporating yield stress, Equations (25) and (29), give significantly different KIC
values for a doubling of yield strength from 350 to 700 MPa, with the higher strength steel giving a higherpredicted fracture toughness value.It is noted [21] that Roberts and Newton [23] have fitted a lower bound to many lower shelf correlations andfound that for Equation (17), a = 8.47 and b = 0.63.
3.4.3 Specific correlations for upper transition and upper shelf regions (Units: MPa√m, MPa, J)
3.4.3.1 Ito et al [45]
Ito et al [45] have assessed a number of Q&T steels with Charpy impact energy in the range 5 - 160 J whichmay be applicable to the full transition curve. Altogether, 82 data points were used to derive the correlation.
K 2.9 x 10 C IC
5 V
y
2 =
σ ............................................................................(31)

MANUFACTURING TECHNOLOGY 17.03.1997 29(72)
3.4.3.2 Norris et al [46]
Norris et al [46] have derived one of the few correlations relating JIC to Charpy impact energy. Altogether, 23data points obtained for A533B steels formed the basis of the correlation with Charpy energies in the rangeof 22-192 J, Fig. 14.
J C +1600]
IC V
y=
[σ
1300 ..............................................................................(32)
3.4.3.3 Priest et al [47]
Priest et al [47] assessed parent plate and weld metals with yield strengths in the range 190 - 450 MPa andCharpy impact energies up to 120 J. The correlation given is:
K
aC
bIC
Y
V
Yσ σ
=
−
2
............................................................................(33)
where, for parent plate, a = 1.622 and b = 0.011, Fig. 15, and for weld metal, a = 0.65 and b = 0.00637.
3.4.3.4 Thorby et al [48]
Thorby et al [48] have derived a correlation based on the results of tests on HY60 and titanium treatedexperimental steels with yield strengths in the range 400-600 N/mm2 and Charpy energies up to 85 J. It isexpressed as:
KIC = 16.9 Cv0.534 .....................................................................(34)
3.4.3.5 Witt [49]
Witt [49] has developed several lower bound correlations for Charpy upper shelf behaviour of A508, A533and A516 steels. A simple least squares fit to the data gives:
KIC = 2.78 Cv - 3.93 ....................................................................(35)
3.4.3.6 BS PD 6493-2 [1]
The correlation given in PD 6493 for upper shelf behaviour were derived for steels of yield strength below480 MPa. The definition of upper shelf, however, is not defined.
Kic = 0.54 Cv + 55 .......................................................................(36)
The resultant correlation is shown in Fig. 16(a). The correlation is generally conservative although certainmodern TMCP plate steels with low C and S levels can give unconservative results [26] when the Charpytransition temperature lies below the fracture toughness transition temperature, Fig. 16(b). This effect wasonly observed at low temperatures (below -50°C) and for cases where [% C + 10 (% S)] was less than0.16%, see section 3.3.2.
3.4.3.7 Comparison of upper transition / upper shelf correlations
A summary of the correlations is given in Table 2, and a comparison of the predictions from them for Charpyenergies in the range 50 - 160 J is given in Fig. 17. Similar gradients are obtained for all correlations exceptthat due to Witt [49]. The current PD 6493 correlation gives the lowest predicted fracture toughness for allCharpy energies. There is a significant variation between the different correlations suggesting that thecurrent range of available correlations do not in any way compare well. Indeed, the range of predictedfracture toughness levels is significantly greater than that obtained in the comparison of the lower shelf

MANUFACTURING TECHNOLOGY 17.03.1997 30(72)
correlations, Fig. 13. The range of toughness variation, however, should always be considered in relation tothe absolute toughness values. Not only the range of variation but also the absolute toughness values forupper shelf are much greater than those for the lower shelf, Figs 13 and 17. Therefore, the differencebetween accuracy of correlations for lower shelf and upper shelf may not be so great, after all.Nevertheless, no statement regarding the accuracy of the correlations for lower shelf and upper shelf isappropriate. There is no evidence that the initial reliability of the correlations would be greater on the lowertransition regime, compared with the upper shelf.
3.5 Correlations involving reference temperatures
The direct correlations presented above are all empirically based and are all generally conservative, butgive large differences in their predicted fracture toughness values, Figs 13 and 17. Finding one empiricalequation capable of universal application is difficult and may not be possible [50,51]. Of course, since theyare all conservative one could simply take the correlation that most often predicts the highest values of themall, but that is hardly the idea of structural optimisation, or a sensible basis for any recommendation. Due todifferences in the Charpy-V impact and fracture toughness test methods, the empirical correlations areusually very case dependent. Similarly to section 3.4, except where noted, the correlations are for the basematerial, whilst only few actually apply to HAZ/weld metal.
Because of these problems, recently developed correlations have tended towards the use of a referencetemperature approach. In this method the positions of the Charpy and fracture toughness transition curvesare referenced to each other using a 'normalisation' method by which specific temperatures on each of thetwo transition curves are compared. The types of temperatures used include temperatures correspondingto:
- A specific Charpy energy (e.g. 27 J)
- A specific fracture toughness (e.g. KIC = 100 MPa√m, δc = 0.1 mm)
- A specific Charpy fracture appearance temperature (e.g. 50% FATT)
- A non-fracture mechanics reference temperature (e.g. Pellini NDTT).
A number of such correlations are reviewed in the following with particular emphasis on the approach ofSanz [52] which has been extensively developed by Wallin [32,37] and now forms the basis of the Eurocode3 draft fracture avoidance clauses.

MANUFACTURING TECHNOLOGY 17.03.1997 31(72)
3.5.1 Specific correlations involving temperature shifts (Units: MPa√m, MPa, J, °C, mm)
3.5.1.1 ASME-PVRC [34]
The Pressure Vessels Research Committee have developed a method for determining lower-boundtoughness from the Pellini nil-ductility temperature [34], Fig. 18.
KIR + 1.333exp. [0.0261 (NDTT + 89) ] + 29 ................(37)
The correlation was developed for steels of yield strength below 621 N/mm2. KIR is a lower-bound of KIC, KID
and KIa. The correlation relies on knowledge of NDTT (which is rarely known for the majority of cases), theprediction of which from Charpy energy is unreliable. Although widely validated the correlation is of relativelylimited practical use since Pellini NDTT is a standard test requirement for only a limited range of steels.The correlation has also been modified for static fracture toughness [53].
3.5.1.2 BS PD 6493-1 [1]
A modified version of Equation (37) forms the basis of the PD 6493-1 correlation where NDTT is taken asthe temperature for a Charpy energy of 40 J, Fig. 19.
KIC = 1.333exp. [0.0261 (T-T40J + 89)] + 29 ..................................(38)
The correlation has been shown to represent a lower bound for ferritic structural steels, Fig. 20, althoughthe equivalence of T40 J to NDTT has been questioned. While such a correlation may exist for steels with [%C + 10 (% S)] > 0.25%, the equivalence is questioned for modern steels [54]. That no universal, constantrelationship between T40 J and NDTT exists when comparing conventional CMn steel and modern low-carbon low-impurity TMCP steel with [% C + 10 (% S)] = 0.13% has been also demonstrated in Ref. [63].Indeed, the equivalence can be easily shown to be incorrect for modern steels where low S and C lead tovery low Charpy transition temperatures but not such a significant effect on Pellini NDTT, Fig. 21. Acomparison of predictions using Equations (37) and (38) is shown for a range of structural steels in Fig. 22.
3.5.1.3 Barsom [55]
Barsom [55] has described a method for relating Charpy impact energy to static fracture toughnessaccounting for strain rate effects by shifting the temperature transition curves. The KIC is then correlated tothe Charpy energy at a higher temperature.
KIC2 = 105 Cv .........................................................................(39)
with ∆T = 119 - 0.12σy .............................................................(40)
for σy between 250 and 965 N/mm2, otherwise ∆T = 0.
The correlation was derived for yield strengths in the range 250 to 1700 N/mm2.

MANUFACTURING TECHNOLOGY 17.03.1997 32(72)
3.5.1.4 Matsumoto et al [56]
Matsumoto et al [56] have derived a correlation for the lower shelf and transition regime on electroslagwelded turbine steels, Fig. 23. The correlation was derived for parent plate, weld metal and HAZs:
KIC = 1.615 exp. [0.038 (T - FATT + 140)] + 31 ..........................(41)
where FATT is the Charpy 50% FATT and T is the temperature at which the KIC is to be evaluated.
3.5.1.5 Oda [57]
Oda [57] has developed two correlations for CTOD based on the results of tests on steels in the yieldstrength range 276 to 834 N/mm2 and with Charpy impact energies in the range 5 to 200 J, Fig. 24. Thecorrelation incorporates a shift which accounts for the fact that the Charpy and CTOD transition curves aresimilar qualitatively but not quantitatively. Two expressions are proposed:
δc= 3.44 . 10-2 In (256 Cv/ σy) (brittle) .............................................(42)
δc = 1.8 (Cv / σy) - 0.1 (ductile) .............................................(43)
To evaluate δc at a temperature T, the Charpy impact energy is evaluated at a temperature T + ∆T where ∆Tis given by:
∆T = FATT - Tf ............................................................. ....... (44)
where FATT is the Charpy 50% FATT and Tf is the temperature for brittle fracture initiation in the Charpy test(equivalent to Tδi = 0.16 mm).
As what comes to the uncertainties when using KIC in ductile fracture regime (see section 3.4), the sameapplies also to δc in Equation 43 in that it is not clear what δc actually refers to. This makes the use ofEquation 43 somewhat difficult.
3.5.1.6 Braid [58]
Braid [58] has carried out Charpy and CTOD tests on SMAW, FCAW and SAW welds and correlated CTODvalues at -10 and -35 °C with the 35 J Charpy transition temperature. Equations of the following form areproposed but values of A0 and A1 are not given.
log δ = A0 + A1 log (T35 J) ........................................................................(45)
3.5.2 Development of the approach for use in Eurocode 3 (Units: MPa√m, MPa, J, °C, mm)
With the development of the fracture avoidance clauses of Eurocode 3, Annex C [59] a method forcorrelation of Charpy impact energy with fracture toughness was required. Due to the differences betweenCharpy impact energy and fracture toughness a direct correlation was considered to be inappropriate. Areference temperature on both the Charpy impact and fracture toughness transition curves was thereforechosen. The Charpy impact energy at the reference temperature should correspond to the increasing part ofthe transition curve and be relevant to material test standards. The fracture toughness at the referencetemperature should be low enough to preclude ductile tearing and to eliminate any effects of extensiveplasticity, which are treated differently in different test standards. The temperatures originally chosen byMarandet and Sanz [52] use the temperatures for Cv = 28 J (T28 J) and KIC = 100 MPa√m.
The correlation is of the form:
T KIC 100 = a T Cv 28 J + b [°C] ................................................(46)
where KIC has subsequently been modified to KJC, the fracture toughness data are thickness adjusted for B= 25 mm, and a and b are constants, originally given values of 1.37 and +9. Subsequent studies by Wallin

MANUFACTURING TECHNOLOGY 17.03.1997 33(72)
et al [60] and DiFant et al [61] have given values of (a, b) of (1.0, -18) and (1.15, -8), respectively. A value of a≈ 1.0 is further supported by a number of projects.
The basic approach has been extensively examined, validated and refined by Wallin et al [60].
3.5.2.1 Development of method
The original concept of Marandet has been modified [60] to incorporate:
- The effect of thickness.
- The effect of temperature.
- Scatter.
The fracture toughness can either be determined using large specimens applying linear-elastic formulae orit can be derived from the elastic-plastic critical J-integral value corresponding to brittle fracture withEquation (12).
Regardless whether KIC or KJC is used, the results can, in the case of brittle fracture, be thickness adjustedwith Equation (3) given in section 2.3.2.1:
KB2 = (KB1 - Kmin)(B1/B2)1/4+Kmin .....................................................(3)
where Kmin is the lower bound fracture toughness, which for steels is close to 20 MPa√m. B for surfacecracks is equivalent to the crack length, 2c.
The above equation has been validated for a large number of both low and high strength structural steelsand for specimen thicknesses ranging from 10 mm to 200 mm. Even though definitive proof of a statisticalmodel is very difficult, the successful application of the model for more than 100 materials might beconsidered as a comparatively strong validation.
The scatter of brittle fracture toughness results can be described with Equation (2) given in section 2.3.2.1 :

MANUFACTURING TECHNOLOGY 17.03.1997 34(72)
P exp (-K KK Kf
1 min
min
= −−−
1
0
4
) ..............................................................................(2)
where Pf is the cumulative failure probability at a stress intensity factor level KI and K0 is a specimenthickness and temperature dependent normalisation parameter.
The temperature dependence of K0 in MPa√m can be described by:
K0 = α = β . exp[γ.(T - T0)] .........................................................................(47)
where α + β = 108 MPa√m, T0 is the temperature (in °C) at which the mean fracture toughness is 100MPa√m = TK(100 MPa√m), and is a material constant.
Experimentally it has been found that the shape of the fracture toughness transition curve for ferriticstructural steels is only slightly material and yield strength dependent. Therefore the values of α, b and λare practically material independent. The resulting equation for the temperature dependence of K0,corresponding to 25 mm thickness, is:
K0 = 31 + 77 exp [0.019(T - T0)] .....................................................................(4)
This expression is shown graphically in Fig. 10(b). The relationship between Charpy 28 J and fracturetoughness 100 MPa√m transition temperatures TK28 J and TK100 MPa√m , respectively, is given by:
TK TK -18 C( 15 C)JC 100 MPa m 28J
o o= ± .............................................................(48)
A further modification allows for strain rate effects but this is not addressed here. By combining Equations(3) (= thickness effect), (2) (= scatter effect), (4) (= shape of transition curve) and (48) (= relationshipbetween Charpy and fracture toughness reference temperatures), the fracture toughness transition curvecan be described for brittle fracture based on knowledge of the Charpy 28 J transition temperature (≈ 27 J)using the following expression:
K = 20 + {11+ 77.exp(0.019.[T - TK + 18 C])}.25B
In1
1- PIC 28 Jo
f
1 4 1 4/ /
. ..........(49)
Std deviation = 13°C
3.5.2.2 Validation
The relationship between TK28 J and TK100 MPa√m , Equation (48), has been extensively validated by Wallin fora wide range of steels in the yield strength range 300-1500 MPa; Fig. 25 shows the relationship for 25 mmspecimens and for a range of specimen thicknesses with size adjusted KJC. Figure 26 shows therelationship for LEFM conditions and for high strength steels [60]. Other studies [62] have confirmed theexistence of a correlation between the two parameters but with different fitting constants, Fig. 27. It is widelyaccepted that the gradient of the relationship is ~1 but values of the y-intercept vary. However, -18°C isconsidered appropriate.
The expression describing the shape of the fracture toughness transition curve, Equation (4), has beenverified for a number of pressure vessel steels and welds, Fig. 28. The curve described by the formulaagrees closely with that proposed by other workers, Fig. 29.
The correlation described by Equation (49) has also been expressed in the form of reference curves withthe scatter already incorporated. The desired fracture probability is then selected and the KIC modifiedaccording to the defect length 2c. Comparison of these curves with the ASME PVRC reference curve,Equation (37), is shown in Fig. 30. The ASME curve, based on Pellini NDTT, gives a less conservativeestimate of fracture toughness in the transition region. Correlation between Charpy transition temperature
MANUFACTURING TECHNOLOGY 17.03.1997 35(72)
and Pellini NDTT is relatively poor [55] and the suitability of NDTT for such purposes has been questioned,e.g. Ref. [63].
Overall, the method described above is the most promising of the more sophisticated correlation methodsand is widely validated. It should form the basis of the most detailed level of correlations as described in thefollowing sections.
3.6 Industrial requirements
The principal difficulties in the use of Charpy fracture toughness correlations in industrial applications are:
- The often limited data availability.
- Uncertainty in the validity range of a particular correlation (yield strengths, range of impactenergies, fracture appearance).
- Selecting the best correlation from those available.
- Quantifying the confidence of a particular correlation.
- Allowing for the effect of steel type (composition etc.) on the correlation.
- Allowing for the thickness effect.
It is therefore suggested that the most appropriate approach for correlations in a structural integrity code willbe to have three routes based on data availability. These should be:
(i) Direct correlation between Charpy energy and fracture toughness; to be used for verylimited data availability and to represent a consistently conservative estimate; one for lower shelf,one for upper shelf.
(ii) Direct correlation between Charpy energy and fracture toughness but with variablecorrelation parameters to allow for effect of steel type, tensile properties, composition andstatistical confidence; one for lower shelf, one for upper shelf. The approach should allowconversion between K and CTOD data with appropriate formulae.
(iii) Correlation based on the relationship between transition temperatures for Charpy energy28 J (≈27 J) and K 100 MPa√m, incorporating adjustments for thickness, temperature and forprobability of failure.
Of these three routes, the most preferable - and sophisticated - one is naturally item (iii). Therefore theitems (i) and (ii) should be used only in those cases where insufficient data prevents the use of item (iii). Asummary of the proposed format is shown as a flow chart in Fig. 31.
3.7 Future work
Expressions are available for the prediction of the variation with temperature of both Charpy and fracturetoughness for the lower shelf and lower transition region. Any proposed correlation should incorporate athickness adjustment for the fracture toughness data, and ideally a method for statistical definition of thecorrelations for the given levels of failure probability.
It is proposed that the subject of correlations in a code should be treated by a three part approach outlinedin the previous chapter (3.6), by moving towards higher item (items (i)...(iii)) with increasing data availabilityand sophistication. Consequently, future work to be carried out in SINTAP Task 3 in the area of Charpyfracture toughness correlations should consider the following aspects:
1. Further development of the proposed three part approach for selecting an appropriate correlation(c.f. Fig. 31), see section 3.6.

MANUFACTURING TECHNOLOGY 17.03.1997 36(72)
2. Generation of generic correlations for lower and upper shelf based on existing publishedcorrelations. This should be followed by determination of specific correlation parameters based onaspects such as steel type and composition.
3. Systematic study of the influence of C and S levels and yield strength on correlation accuracy.
4. Generation of a SINTAP data set for assessment of existing correlations and validation of modifiedor newly proposed correlations.
5. Documentation of appropriate expressions for conversion between fracture toughness parametersand for predicting the temperature dependence of K, CTOD and Charpy transition curves.
6. Provide further validation for the method used in Eurocode 3 (Sanz,Wallin), including application tohigh strength structural steels and different product forms (plates, sections and bar).
7. Provide guidance on treatment of sub-size Charpy data (thin material).
8. Investigation on the effect of strain rate of Charpy and fracture toughness data.
9. Ensure the final procedures are workable in an industrial environment.
In addition, TWI will contribute to a related issue in Task 2 of SINTAP (constraint effects), where models forthickness corrections will be developed, including predictions from Charpy data (see Summary ReviewSINTAP/TWI/002).
It is recommended that guidance be included in the procedures developed within SINTAP to reflect therecommendations set out in Section 2 of the TWI summary report, section 3.2 in the present report.
4. NON-DESTRUCTIVE EVALUATION GUIDANCE FOR FITNESS FOR PURPOSE ASSESSMENTS
This section of the review provides information on statistical treatment of NDE data, as well as guidance onissues relating to the interaction between NDT and fracture mechanics assessment, including probability ofdetection and sizing errors. Industrial problems, gaps in current knowledge, as well as means and ways ofaddressing the gaps are discussed. Next, recommendations for the implementation of probabilistic failureassessment diagram (FAD) -based fracture assessment procedures are included. Methods for selectingan appropriate NDT method and statistically quantifying reliability of flaw size measurements are brieflyoutlined. Finally, examples of what can be obtained from existing databases (PISC) are given.
4.1 Industrial problems and issues
Industry needs reliable information to make sound engineering judgements, in the form of fitness-for-purpose (FFP) assessments, on the future serviceability and safety of a component, or whole plant. Animportant issue for FFP assessments is the availability of reliable NDT methods, techniques andprocedures which are capable of providing the required quantitative information on weld fabrication flaws, orservice induced flaws in the component, or plant, in question. Indeed, determining a suitable defect densityand size distribution is one of the most difficult aspects of calculating probabilities of failure for any structureor component.
In the context of NDT, "reliable" usually means a high probability of detection of the flaws of concern. Also,"quantitative information" means accurate position and sizes of flaws, together with uncertainties in thesemeasurements. Other information sometimes required from NDT, relates to the flaw orientation (withrespect to the principal stress), and the flaw type (whether volumetric or planar).
The general requirement for application of FFP, is for better guidance on the selection of appropriate NDTmethods, techniques and procedures, and the availability of quantitative information on their performanceand reliability for detection, location and sizing of flaws.
4.2 Current status of knowledge
MANUFACTURING TECHNOLOGY 17.03.1997 37(72)
The current status of knowledge may be described as follows.
Much data is available on the performance and reliability of selected NDT methods for detection and sizingweld flaws in particular component geometries. These have been mainly generated by industrycollaborative programmes which have carried out "round robin" trials on series of test blocks containingflaws, for example PISC [66-68], NORDTEST [69,70], UCL POD/POS [71,72] and TWI/AERE/CEGB [73,74]trials. These NDT performance and reliability data have been generally presented in a variety of differentformats [75], some of which are more appropriate to FFP assessments than others. A question often askedis, how applicable are these data to given real situations, where component geometries and NDTprocedures may be slightly different?.
Information is contained in existing FFP guidance documents which provides details of the flawmeasurements required for assessments, Fig. 32. Also contained in these documents are guidance fordealing with flaw measurement uncertainties, either through the use of "partial safety factors" e.g. BSI PD6493 [1], or tabulated values of measurement uncertainties for specific NDT methods e.g. IIW SST-1157-90[76]. A general problem for deterministic FFP analyses is that these "worst case" estimates of flaw size cansometimes be overly conservative. A very small tolerable flaw size also makes it difficult to find, which mayyield structures uneconomic to build and operate.
TWI is currently conducting a Group Sponsored Project (GSP) into the subject of interfacing NDT with FFPassessments as applied to pressure systems [77]. This work is very relevant to SINTAP and it is hoped thatthe sponsors will agree to publish the confidential project information. A further source of information arethe numerous technical papers have been published on the subject of NDT and FFP assessments, forexample [78].
4.3 Gaps in current knowledge
The gaps in current knowledge can be summarised as follows.
FFP assessments can be carried out during the design, fabrication and/or service phases of a componentor plant. Exactly when FFP assessments are carried out, has implications on the specific requirements forNDT. For example, if FFP has been carried out prior to fabrication, it will influence the minimum size of flawsthat need to be reported by NDT during fabrication. Further, the type of assessment, whether a deterministicanalysis, or a probabilistic analysis of a single flaw, or a probabilistic analysis of (or part of) an entirestructure, has implications on the parameters required to be provided by NDT. Both these issues affect theoverall specification of NDT requirements. A more detailed discussion of particular requirements follows.
The relationship between the various decision thresholds for flaw sizes are shown in Fig. 33. Prior tocarrying out NDT we need to specify the flaw sizes of concern for subsequent FFP assessments, since thismay affect the minimum size of flaw to be reported and characterised. Should this be:
i) Flaw sizes which exceed a NDT reporting threshold as specified in the applicable NDT standard?
ii) Flaws sizes which are not acceptable in accordance with the relevant quality control or "goodworkmanship" criteria?
iii) Flaws sizes which are not acceptable when assessed by the appropriate FFP procedures?
There is a need to specify an appropriate probability of detection (POD) for the flaw sizes of concern, sincethis affects the selection of NDT methods, techniques and procedures. Should an appropriate value be:
i) A minimum POD of 90%, at a specified confidence level?
ii) Some other higher (or lower) minimum POD value?
iii) POD as a function of flaw size?
Having selected a POD value (or function), should this be simply treated as a specification requirement forthe NDT, or can this parameter be used, for example, in probabilistic FFP assessments?

MANUFACTURING TECHNOLOGY 17.03.1997 38(72)
There is a need to specify the required flaw measurement accuracy for the flaws of concern, sinceuncertainties in the measured position and size of flaws will have an affect on the outcome of subsequentFFP assessments. How should the accuracy be determined, by experiment, by theoretical considerations,or by referring to guidelines? Also, in what format should flaw measurement accuracy best be specified?,examples are:
i) Best estimate 10 mm ± 2mm at 95% two-sided confidence
ii) Upper bound 12 mm at 97.5% one-sided confidence (uncertainty of ± 2 mm allowed for)
To enable selection of NDT methods and techniques, quantitative information is needed on theirperformance for detection, location and sizing of flaws in a variety of weld geometries and materialthicknesses. This information should, ideally, be backed up by evidence from practical trials, orexperiments. Such information should be included in FFP guidance documents.
4.4 Addressing the gaps
TWI and JRC will address the gaps in current knowledge by providing information as follows:
i) A review of the implications on NDT requirements for FFP assessments carried out at differentphases of a component or plant (design, fabrication or service phases).
ii) A review of the required parameters to be measured by NDT for the different types of FFPassessment (deterministic, probabilistic etc.).
iii) A review of existing methods for presenting data on the performance and reliability of NDTtechniques which are appropriate to FFP applications.
iv) A review of currently available information on the performance of different NDT techniques fordetection, location and sizing of flaws in different weld geometries and material thicknesses.
v) Merging of all information into a unique database to get information and distributions on a widerange of components, materials, defects and NDT techniques.
vi) Guidance on the selection of appropriate NDT methods, techniques and procedures for FFPapplications.
In addition, SAQ will contribute to NDT aspects by developing a new defect size distribution as an inputrandom parameter to their probabilistic safety evaluation method (see section 5.3).
4.5 Examples of what can be obtained from existing databases (PISC)
Weld and base material inspection does not produce absolute expertise results. The effectiveness of NDEis limited. Inspection performance depends on the NDT techniques selected for their effectiveness.Industrial experiments and laboratory studies have quantified or are still evaluating the effectiveness of NDTtechniques. The present state of the art allows optimism. In several cases where access to the componentis not restricted and when "external" effects, like compressive stresses on a thin fatigue crack, do notreduce the NDT technique effectiveness, one can state that relevant defects could be detected andsentenced in accordance with the requirements of structural integrity assessment schemes [86].Unfortunately, in several cases, the pressure component was not designed for easy access of NDTtechniques, and frequently the characteristics of the material selected were not suitable for NDE.
In other cases, the suitable NDT solutions are judged to be too costly or not yet adapted to industrialapplications. Performing reliable inspection of some components still involves feasibility studies,measurements, cost and acceptability [87].
The concept of "Effectiveness" is related to the overall probability of detecting a defect and characterising itcorrectly, taking into account all factors other than those related to equipment failures and human errors.This concept of "Effectiveness" comprises "Capability". Capability is defined as the performance ofdetection and characterisation of a particular flaw depending on the inherent physical limitations of the NDTmethod.

MANUFACTURING TECHNOLOGY 17.03.1997 39(72)
An important requirement in view of inspection effectiveness is qualification. This qualification processinvolves several elements like [88]:
- Critical study of procedures. identification and evaluation of human factors that can reduce theperformance of NDT techniques;
- Reliability evaluation of automatic tools and robots;
- Technical justification of the suitability of the NDT techniques;
- Performance demonstration on suitable test assemblies.
4.5.1. Overall effectiveness of inspection techniques of reactor pressure vessel welds
4.5.1.1. Overall NDT effectiveness evaluation in the PISC programme
The PISC, programme [89] has the general objective of assessing procedures and techniques in use forthe inspection of pressure components (in particular the vessel and piping). PISC (carried out since 1974under the auspices of the CEC/JRC and the OECD/NEA) is a major international effort to better assess theeffectiveness of non-destructive inspection procedures used on structural components. Three projects arecentred on the CEC, Joint Research Centre, Ispra Establishment which in its role as Operating Agent,Reference Laboratory and Referee Group manages the programme and provides with the participant of ECcountries approximately half of the programme funding. The other half comes via contributions from non-ECparticipating countries. The OECD/NEA provides the Secretariat of the PISC Management Board, consistingof representatives of 14 countries (8 EC and 6 non-EC countries). The programme is now in its third phase(PISC III).
These series of collaborative exercises brought conclusions that were generally accepted. Theseconclusions induced code and standard bodies like ASME to revise the corresponding procedures.
PISC II results, published in 1986 can be summarised as follows [90,91]: procedures in the spirit of theASME Code Section XI appeared to perform better if specific techniques were used for surface defectdetection and if the recording level was low (high sensitivity).
The high performance of some procedures which were applied in PISC II has to be noted. Theseprocedures were often complex combinations of standard and advanced techniques.
Sizing quality was dependent on the defect position in the thickness of the plate. Subsurface defects were,on average, oversized. The chances of undresising defects were greater for defects located near the cladsurface.
The error on defect size was dependent on the size of the defect itself. The major chances of undresisingexisted for rejectable defects.
When considering defects characteristics such as the crack tip aspect and surface roughness, it waspossible to divide all defects in the PISC II plates into three categories:
i) smooth cracks with sharp crack edges (fatigue cracks);
ii) rough cracks and cracks which had crack tip aspects atypical of real cracks;
iii) volumetric defects (slags and porosities).
Category i) "smooth cracks with sharp crack tips" appeared to be the most difficult case and, consequently,it was concluded that future qualification work should be conducted on test assemblies containing suchdefects.
The first results of PISC (PISC I, 1979) led to parametric studies [92] being oriented towards the validationof mathematical models; this work also continues in the PISC-III programme. The importance of defectcharacteristics such as tip aspects, tilt angle and skew angle is being demonstrated.
MANUFACTURING TECHNOLOGY 17.03.1997 40(72)
PISC-III started in 1987; it is the third phase of the PISC series [93]. It emphasised the demonstration ofNDT techniques capability through Round Robin Tests in which use is made of assemblies containingrealistic defects. This methodology is extended to all major parts of the primary circuit of LWR's.
In action No. 2 of PISC III (Full-Scale Vessel Tests) results obtained by procedures in the PISC II exercisewere validated in realistic inspection conditions . The installation existing at the StaatlicheMaterialprufungsanstalt (MPA), Universitaet Stuttgart, Federal Republic of Germany was used.
Seven teams participated in 1988 and 1989 in phase 1, studying the sizing of selected defects in order toestablish the capability of sizing techniques. Sizing results show that correct sizing on RPV can be achievedby several techniques, if the flaws are volumetric ones or discrete planar ones such as fatigue cracks. Forcomplex flawed areas which combine volumetric and planar flaws, combinations of techniques arenecessary to detect and characterise all individual components of the flawed area [94].
Validation of ASME type procedures and of some national procedures was conducted by an internationalteam using an ISI mechanised scanner offered by RWE and MAN to PISC for the period of the exercise.Globally, PISC II results are confirmed, however a homogeneous data base is now available for moredetailed studies.
This exercise gave the opportunity to compare scanning in parallel and orthogonal directions to the defectextension with a conclusion of equivalence. It appeared clearly that sensitivity of 20% DAC is not sufficientfor standard 45° angle probes (or as well as 60°) to detect crack like defects perpendicular to the scansurface. However, 10% DAC generally leads to bad signal to noise for the above combination of probes anddefects. More clearly than it was the case in FISC II, the need for specific and capable techniques is wellestablished, e.g. 70° angle probes for near surface cracks, tandem probes for sub surface cracks or lack offusion, full skip when possible more advanced techniques if well qualified for each application.
Effectiveness evaluation through the validation programme of the IVC [95] confirmed the PISC results. Mostof the industrial countries developed verification exercises of the ISI capability of RPVs [96]. Not all resultswere published but generally their conclusions agreed with the ones of the PISC exercise.
4.5.1.2. Challenging inspection problems in RPV
The overall evaluation of the effectiveness of inspection techniques, as reviewed here above, considers onlygeneric cases of accessible standard RPV welds. The pressure vessel has also to be inspected whereaccess is restricted and weld design not standard. Pressure vessel parts and internals represent the mostdifficult inspection problems. Each of them requires a specific study, special inspection tools, a separateeffectiveness evaluation and performance demonstration mock-ups. However, not all of them are equallyrelevant with regard to safety assessment.
To complement the results presently available, two other groups of studies are necessary which aresuggested or sponsored by several Safety and Licensing Authorities:
i) The identification of all the RPV regions and components which are to be inspected for safetyassessment purposes, and the ranking of these components in safety relevance [97].
ii) The identification of inspection procedures suitable for each region or component of the RPVrecognised as relevant for safety.
Technical developments were recently made by plant manufacturers, owners and inspection companies forproper instrumented inspection of particularly difficult situations such as control rod penetrations [98, 99].

MANUFACTURING TECHNOLOGY 17.03.1997 41(72)
4.5.1.3. Conclusions
The PISC exercise and other national exercises have shown that ISI can be effective in the general case ofthe major RPV welds. Certain conditions have to be fulfilled, like: the correct selection of techniques, thecorrect access to the area to be inspected and the necessary qualification of these techniques. It isessential to classify flaws before sizing them. Mechanised scanning is a requirement. More work isnecessary for specific RPV areas or components.
4.5.2. Primary piping inspection effectiveness
4.5.2.1. Introduction
From the safe-end weld to the pressure vessel nozzle up to the steam generator and back to the vessel, thepipe work of a reactor contains welds which connect various components, deviations and pipe sectionsmade of different materials. Very often, austenitic steels are present (e.g. 316L) which are manufactured bydifferent processes: wrought steel, centrifugally cast steel, static cast steel...
Often, base and weld materials are very different and pose inspection problems.
4.5.2.2. Inspectability of Safe-ends
Since 1982, results were published of exercises on pipe sections containing various flaws induced byservice such as IGSCC, thermal and mechanical fatigue cracks [100]. Such results highlighted the lack ofeffectiveness of inspection methods in the eighties. PISC [101] but also national programmes are stillevaluating the effectiveness of new or redeveloped inspection techniques.
The exercise conducted on safe-ends and first homogeneous welds of the primary circuit led to resultswhich highlight the difficulties of some situations [102].
The conclusions of this PISC exercise are as follows:
- there is a general difficulty to detect and evaluate flaws in the weld material;
- a large spread in flaw sizing is shown;
- high sensitivity is necessary and recording at 50% DAC is insufficient;
- in general, detection of flaws becomes uncertain for flaws smaller than 5% T;
- false calls are generally present mainly when mechanised scanners are used;
- difficult flaws for UT are also the difficult ones for X-rays;
- the evaluation made at the level of individual UT techniques allows to conclude that sometechniques are capable of a high detection rate but that the overall performance given by a fullprocedure is generally not obtained by a single technique.
MANUFACTURING TECHNOLOGY 17.03.1997 42(72)
4.5.2.3. Inspectability of wrought stainless-steel primary piping
The PISC III Action on primary piping contained 3 capability studies: wrought-to-wrought, cast-to-cast andwrought-to-cast. The wrought -to-wrought capability study involved piping welds (diameter 320 mm, wallthickness 10 - 25 mm), typical of BWR primary piping [103].
Six wrought-to-wrought stainless-steel (AISI 304) assemblies were provided by the Japanese Atomic PowerEngineering and Inspection Corporation (JAPEIC) and by the Nuclear Regulatory Commission (NRC).Intergranular stress corrosion cracks, mechanical and thermal fatigue cracks, surface-breaking andembedded electro-discharge erosion (EDM) PISC type A flaw and lack-of-weld root penetration werepresent in the welds.
The best results for detection, correct classification and false calls were obtained by teams that usedmechanised inspection equipment and that worked at noise level. Reliable detection (probability > 0.9) isonly achieved for flaws with a through-wall extent larger than 30% of the wall thickness.
Much more detailed information can be found in reference [103]. In conclusion, good capability exists toinspect these assemblies but sizing performance can be quite poor though the teams that were able todetect crack tip diffraction did well. The study has also shown the importance of false calls.
4.5.2.4. Inspectability of cast stainless-steel primary piping
In the second capability study cast-to-cast welds typical of PWR primary piping were studied. Two cast-to-cast stainless-steel assemblies (diameter 31 inch, wall thickness 68 mm) were manufactured at ENSA(Spain) in co-operation with JRC Ispra. The third assembly was contributed by Japan (JAPEIC) to the PISCProgramme. The assemblies contained four different types of flaws: mechanical fatigue cracks, PISC type Aflaws, EDM slots and lack of fusion flaws [103].
In general it can be concluded that the detection performance of the flaws considered in these assemblieswas very good. The depth sizing performance, however was poor. None of teams was able to size the depthof the flaws correctly. Most teams made few false calls leading to incorrect rejections.
PISC has also given indications on design aspects that would greatly improve inspection. Corrects featuresof the counterbore were proposed some time ago and are again identified by PISC.
Diversity of techniques and software for on line display of results are of importance.
4.5.2.5. Inspectability of components made of cast and wrought stainless steel
In the third capability study wrought-to-cast-steel welds typical of PWR primary piping were studied. Oneassembly was offered by Japan, the other was based on offers of France, Spain and JRC. Theseassemblies contained PISC type A and lack of fusion flaws. These 2 assemblies were inspected by 10teams from 9 different countries. Most teams used an automated inspection system and worked at noiselevel.
In general one can conclude that the detection performance, especially for the rejectable flaws (through wallextent larger than 10% of the wall thickness), was good. The wrought to statically cast weld proved to be thelarge grain size of the wrought statically cast stainless steel and the varying wall thickness along the weld.The depth sizing performance was poor. Only one team that used focusing probes achieved a satisfactorydepth sizing performance.
The PISC III Action 4 on austenitic steel testing provides thus an excellent data base that provides usefulinsights into the inspection capabilities of artificial and real flaws in wrought and cast stainless steel piping.Much more information can be found in the detailed PISC reports and already published papers on PISC IIIAction 4 [103].
4.5.2.6. Large stainless steel castings inspection
Inspection of thick walled castings or of thick austenitic steel welds used in earlier design of PWR coolantpump bowls represent a very challenging problem for volumetric inspection techniques. As radiographyturned out to be inadequate with regard to plant operation contingencies, ultrasonic methods weredeveloped and qualified [104]. Field experience shows [105] that ultrasonic in-service inspection of these

MANUFACTURING TECHNOLOGY 17.03.1997 43(72)
particular casing welds were successfully and reliably carried out with focused beam transducers, withouthaving to disassemble and drain the primary recirculation pump.
4.5.2.7. Inspection of non pressure retaining components
Several components, often not part of the regular ISI programmes, are important for plant availability andsafety. A good example is the primary pump shaft which could show cracking.
Techniques have still to be developed or qualified for the inspection [106] of such components withoutimposing complete disassembling.
4.5.3. Steam generators inspection effectiveness
In recent years a number of steam generators showed multiple degradation mechanisms such asintergranular attacks, stress corrosion cracking and fatigue cracking. Cracks seen on pulled tubes inFrance, Japan, USA, Belgium, FRG, ... were circumferential, axial or complex ones.
To detect those multiple defects, complex inspection is required in many cases. Multi channel Eddy Currentequipments are used with a large variety of probes, specialised for the detection and evaluation of familiesof flaws [107].
Ultrasonic inspection of steam generator tubes is also applied and particular techniques are still underdevelopment [108]. Data acquisition, treatment and comparison with information on the steam generatorresulting from previous inspections are essential elements of inspection effectiveness and reliability.
A programme conducted in the USA 10 years ago: the SURRY programme [109] showed a very largedispersion of results.
The PISC III programme [110] involved an important RRT on steam generator tubes containing realistic andartificial flaws of the corrosion and fatigue crack type. First results were available at the end of 1994. Thepresent trends shown by the evaluation of results of this exercise are as follows:
- the probability of flaw detection in general does not reach 80%, where results from ultrasonictesting (UT) or from eddy current testing (ET) can be the best or the worst in several particularsituations; combined procedures gave often results in the upper range of capability;
- dispersion of results is very high;
- corrosion defects were generally not safely detected (less than 50%) if the through thickness depthwas not greater than 40%,
- IGA type defects are never safely detected;
- presence of fatigue defects in areas of denting is often not detected;
- deposits have a negative influence on detection of defects, capability is often reduced by a factor 2;
- flaw sizing results are showing large dispersion and specific techniques have to be used;
- some procedures based on correct combinations showed inspection capability.
4.5.4. Qualification of Inspection Procedure
Methodologies for demonstrating ultrasonic effectiveness have been developed in the UK and the USA. TheUK approach has already been applied to the fabrication inspections for Sizewell B and will be applied to in-service inspection [95]. The USA approach is at an advanced stage of planning with applications to in-service inspection of all nuclear plants in the USA currently scheduled to begin in mid-1993 [111].
The US and UK approaches have much in common, though there are important differences and a greatdeal has been learned in both countries about the difficulty, time and cost of implementation. Many othercountries with nuclear plants are currently considering their own approach to inspection qualification and
MANUFACTURING TECHNOLOGY 17.03.1997 44(72)
are carefully assessing experience to date before making a decision on the use of performancedemonstration to qualify the procedures.
A question is whether one can propose appropriate and affordable test pieces to be used in the techniquescapability test performance demonstration. Such test pieces have to contain defects which simulate bothcommonly occurring situations and limiting cases that could be imagined during actual plant inspections.The whole PISC experience and, in particular, PISC for the RPV supports this concept [112].
To be convincing, however, this approach must demonstrate a good correlation between the artificial"realistic" defects and a number of real defects [113,114].
4.5.5. Human factors
Besides qualification of techniques and of whole procedures, the aspects of human interaction with theprocedure have to be considered. Mechanised scanners, software for the operation of ISI tools and datarecording are now used to eliminate human errors. However, interpretation of inspection results remainsan essential aspect of ISI where human interference is frequent.In the case of difficult inspections like the ones of austenitic steel welds or of steam generator tubes,human expertise remains a key of success. PISC studies [115] are demonstrating that several factorsinfluence seriously the human behaviour when performing NDT. Such an influence has also to beconsidered for the evaluation of inspection when decisions are made at the moment of the inspection.
Software developed to conduct the inspection, and to visualise results are key elements of an ISI systemthat has to eliminate as much as possible the human factors [116, 117].
4.5.6. Performance diagrams
4.5.6.1. Introduction
The population of defects observed in a component (fabrication control, pre-service inspection, in-serviceinspection) depends on the capability of detection or, in a more precise manner, on the chances of missinga particular defect. This chance depends upon the type of defect, and on its position and size.
Examples made during the PISC exercise, where inspection results were used in an objective manner,revealed that experts and inspectors can often present a biased flaw size distributions for a component,when compared to a DE defect inventory made after the event.
The inspection exercise on safe-ends was a clear demonstration of this point [128]. Fig. 35, (assembly No.24) demonstrates that the distribution of flaws obtained by NDT (experts results) differs from that obtainedby destructive examination, this deviation occurring mainly in the range of defect sizes of most concern forstructural integrity assessment. A reliance on experts declarations can thus introduce a bias to PSA. Thisresult also holds for the case where a large number of experts were consulted; in the case of Fig. 35, twentyindependent inspection results are considered.
4.5.6.2. Missing defects as a function of their size
The depth of a defect is a variable often utilised for the presentation of results. If one accepts that, by the useof the population of defects present in some PISC assemblies, one can speak of probabilities of non-detection of these flaws in the assemblies, it is possible to draw indicative curves describing these trends.
Fig. 36 translates average results for a nozzle to shell weld, when inspected using a variety of inspectionprocedures. These curves should be understood to be no more than general trends but they do indicatethat, even for rather large defects, there exists a potential for a defect to be missed.
In order to guarantee a very low probability of missing a flaw while utilising the advanced ISI procedures,presently applied in several countries, the maximum flaw depth would have to be approx. 20% of the wallthickness of the component examined. Inspections, conducted along the lines of ASME Section XI, edition1986, would on average exhibit no limiting defect size such that even a through wall crack would be missed.Inspection results of ASME Section XI conducted at 50% DAC (e.g. editions 1974 and 1977) lead to verypessimistic assumptions.

MANUFACTURING TECHNOLOGY 17.03.1997 45(72)
In the case of safe-ends and austenitic piping [121-126], similar diagrams can be drawn from the PISCdata base.Fig. 37 shows that for Safe-end Components, non-detection of flaws is very unlikely if, on average, theseflaws are of 50% of the wall thickness. For easily accessible flaws (wrought steel and ferritic steel) thetrends might suggest a limiting size of 20% of wall thickness. It should be remembered that someprocedures performed better than others and Fig. 37 is simply an indication of the type of information whichone could draw from the PISC data, based on the inspection of Safe-end Components.
Fig. 38 shows an average non-detection curve for primary piping welds, for relatively easy to inspectwrought stainless steel material. Again the trends suggest that the limiting defect size which would have tobe considered in order to realise a low probability of non-detection (always only valid for the PISC exercise)would be approximately 90% of wall thickness.
Statistical analysis of the PISC data is possible along the lines of Fig. 39 Simonen et al. [129]. PISCconcerned itself with full evaluation of results at the level of 1) Procedures (All teams considered separately)and of 2) Techniques. A diagram such as that presented in Fig. 39 can be drawn for all PISC assemblies, ifrigorous statistical methods are applied to the existing data sets.
Such results can also be obtained for steam generator tubes inspections and a global evaluation of theresults [127] might be expected to lead to similar trends.
4.5.6.3. Importance of the type of defect
The PISC II exercise emphasised the concept of defect categories [130]. In ISI, sharp, planar and smoothdefects (category A) are of the greatest concern from a structural integrity viewpoint. The need to optimiseinspection procedures for the detection of such defects was indicated by the PISC II results. However, oneimportant aspect which has to be underlined, is that even if techniques are assembled for the detection(and possibly sizing) of category A defects, it is essential that the procedures include an effective validationprocedure. As shown in Fig. 40, setting up a system using the current calibration blocks which containvolumetric defects (family C in Fig. 40) will not afford reliable detection of a fatigue crack (family A in Fig. 40).The current calibration block is valid for the equipment calibration but cannot verify the performance of aprocedure.
The PISC II exercise, had as its singular objective, the evaluation of performance capability. It should not beoverlooked that reliability aspects need also to be taken into account.
By utilising these results and performing a simple averaging of the data, curves similar to those presentedin Fig. 41 may be drawn. These indicate a distinct chance of detecting the presence of both planar (cracktype) and volumetric defects.
Similarly, in primary piping, distinctions were made between the defect types associated with IGSCC andnon-IGSCC. Here again the average results suggest a different chance of detection for these two defectcategories. In Fig. 38, the limit of non-detection for non-IGSCC flaws could be as good as 10% of the wallthickness for the best procedures. In the case of steam generators, results are also available.
4.5.7. Errors of defect evaluation leading to under-estimation
The probability of under-estimation of defects, leading to the erroneous acceptance of rejectable defects isnot negligible. In the case of pressure vessel components, the results of PISC were fully discussed and theconclusions can be summarised by Fig. 42. This again assumes that it is permissible to speak ofprobabilities on the basis of a limited defect sample set. [130-132].
Evaluations of the same type are possible for primary piping inspection results and for steam generatortube inspections [132].
Different variables can be used for the presentation of such results: flaw size expressed as a function ofdepth, or length (steam generator), or flaw position (near to the inside surface) and flaw type (cracks, poresetc.).
4.5.8. Probability of defect presence after ISI

MANUFACTURING TECHNOLOGY 17.03.1997 46(72)
As shown above, true distributions of fabrication imperfections, can be skewed by errors in detection andevaluation, characteristic of the applied inspection procedure.
Results established from PISC exercises, on pressure vessel weld inspections, lead to the conclusion thatdefects of depths in the order of 10 mm can frequently be missed. In the safe-end exercises, 25% T defectswere either missed or, undersized and accepted [132].
Using the PISC data, as it is currently available, and treated using the BTB Code, it is possible to provideanswers to a variety of questions relating to the presence of defects in structures. This can be realised byan analysis of representative examples generated by very realistic inspections.
4.6 Future work
Further guidance has to be provided on issues relating to the interaction between NDT and fracturemechanics assessment, including probability of detection and sizing errors and statistical treatment of NDTdata. Prior to carrying out NDT, the flaw sizes of concern for subsequent FFP assessments needs to beaccurately specified, since this may affect the minimum size of flaw to be reported and characterised. Next,an appropriate probability of detection (POD) for the flaw sizes of concern has to be specified, since thisaffects the selection of NDT methods, techniques and procedures. Finally, the required flaw measurementaccuracy for the flaws of concern should be specified, since uncertainties in the measured position andsize of flaws will have an affect on the outcome of subsequent FFP assessments.
The next stages require information to be provided on i) the implications on NDT requirements for FFPassessments, ii) the required parameters to be measured by NDT for the different types of FFPassessments, iii) existing methods for presenting data on the performance and reliability of NDTtechniques to FFP applications and iv) the selection of appropriate NDT methods, techniques andprocedures for FFP applications.
To enable selection of NDT methods and techniques, quantitative information is needed on theirperformance for detection, location and sizing of flaws in a variety of weld geometries and materialthicknesses. This information should, ideally, be backed up by evidence from practical trials, orexperiments. Such information should be included in FFP guidance documents.

MANUFACTURING TECHNOLOGY 17.03.1997 47(72)
5. SAFETY FACTORS AND RISK ASSESSMENT
This final section of the review concentrates on probabilistic safety evaluation models. It begins with anintroduction to current problems regarding the determination of safety margins in structural safetyassessment. It then discusses the aspects of a probabilistic safety evaluation model developed by SAQquantifying different margins of safety using relevant distributions of the input quantities instead ofdeterministic safety factors. Comparison is then made between the new method and the conventionaldeterministic methods. The background knowledge for a basic framework for a probabilistic safetyevaluation model has been collated and presented. Some potential problems are also raised andsuggestion for the further work given.
5.1 Industrial problems and issues
From the different organisations involved in European industry, there is an increasing demand to be able toquantify different margins of safety in a more optimal way. Typical issues mentioned by the organisationsare:
- The margins of safety are sometimes lowered for a short period, mainly based on qualitativedeterministic arguments.
- The safety factor which is used in a deterministic analysis does not have any explicit correlationwith the failure probability of a specific component.
- An interest to include stable crack growth as an increased margin of safety.
- A need for a better understanding on how different intervals of inspections affects the margin ofsafety (both for initiation and failure).
- A wish to be able to benefit from a better knowledge (for example in the material data) in the safetyevaluation.
A more realistic evaluation of a components performance can be conducted only if the uncertainty in theinput data (i.e. structural loads, flaw sizes, material properties etc.), and hence the responses are taken intoaccount.
All this leads to the need of a revision and extension of the present deterministic methods of safetyassessment (which often are based on ASME or the R6 method). This new method should be based on aprobabilistic philosophy, and the goal for this sub task would be to develop a Probabilistic Safety Evaluationmodel.
5.2 A probabilistic model
In principle, the reliability of a structure may be quantified directly using a probabilistic approach. A majorimponderable in probabilistic methods is in defining an acceptable failure probability. One of the ways to dothis is to reinterpret it in terms of safety factors. However, difficulties in defining the defect size and materialproperties distributions may mean that in some cases the benefits of calculations are in providing relativefailure probabilities for ranking assessment locations rather than for estimating true failure probabilities[84].
Fig. 34 presents a schematic representation of a simple probabilistic assessment where only loadings aredistributed.
A probabilistic safety evaluation model can be based on different kinds of probabilistic assumptions andrelations. Structural reliability methods are in general divided into levels, characterised by the extent ofinformation about the structural problem that is used and provided [79]. A short description of typical levelsfollows:
- Reliability methods that employ only one characteristic value of each uncertain parameter arecalled level I methods.

MANUFACTURING TECHNOLOGY 17.03.1997 48(72)
- Reliability methods that employ two values of each uncertain parameter (commonly mean andvariance), supplemented with a measure of the correlation between the parameters (usuallycovariance), are called level II methods.
- Reliability methods that employ probability of failure as a measure, and therefore require aknowledge of the joint distribution of all uncertain parameters, are called level III methods.
This classification of reliability methods is not exhaustive. For example, a method could employ moreinformation than a level II method and yet not employ the complete distribution information of a level IIImethod, etc. The purpose of the analysis is one of the facts to consider when to chose an appropriate levelof analysis.
It is also important to clearly define if one is using linear or non-linear fracture mechanics in theprobabilistic safety evaluation model. More recent approaches use an elastic-plastic assessmentprocedure based on the R6 method [80-82]. The R6 procedure is widely used to assess the structuralintegrity of defective structures. The procedure itself is rather more deterministic than probabilistic in that anassessment is carried out using specific values for each input parameter rather than their probabilitydensity functions. The variations in quantities of the parameters are usually taken into account by the use ofconservative values for each input parameter and adequate reserve factors (or margins) are requiredbetween the assessed conditions and the limiting conditions which would cause failure. In general, thehigher the reserve factor (margin) the lower the failure probability and, conversely, the higher the reliability orintegrity of the structure [84].
To be of practical use the methodology must take account of certain effects which are met in practice. Theseinclude fatigue crack growth, stable tearing, leak-before-break, fault loading, pre-service proof tests,competing ductile and cleavage fracture mechanisms etc. The incorporation of these may add considerablyto the complexity of the actual expressions to be evaluated, but the basic principles remain the same. Asummary of a study which takes many of the effects into account follows below:
5.2.1 An example of a mixed level elastic-plastic analysis
In order to aid discussions about allocation of in-service inspection (ISI) in nuclear power plants, a simpleprobabilistic fracture mechanics (PFM) model was developed [81]. The critical event was taken as unstablecrack growth without any ensuing crack arrest. For the determination of crack growth instability J-approximations based on option 1 of the R6-method were employed. The model was then used toinvestigate whether different regions of a specific BWR vessel exhibit significant differences in fractureprobability. In the analysis the loading was taken as deterministic while the fracture properties of thematerial was assumed to be controlled by a scalar parameter J0 which was a random variable. Furtherrandomness was introduced by assuming the size of pre-service defects to be distributed according to theOCTAVIA distribution.
Crack growth initiation, leakage and fracture probabilities were calculated for different regions and anumber of load cases (transients). The fracture probabilities were very dependent on the chosen fracturetoughness distribution (Weibull or lognormal). The ranking between the different regions was, however,relatively insensitive to the precise assumptions. Ranking the regions with respect to the crack growthinitiation probabilities did, however, yield quite different results.
Thus, the choice of critical event was considered crucial to discussions about the order of priority of ISI. Theresults seemed furthermore to indicate that consequence considerations are not of a discriminating nature,since the probabilities of limited leakage was in general much smaller than the probabilities of fracture. Themain conclusion was that probabilistic models are of use when planning how to select targets for in-serviceinspections.
5.2.2 Which approach to choose
Some of the models (levels) mentioned are more computationally demanding than others, and they all canbe based on different kind of probabilistic assumptions and relations.
- A rigorous analysis, where one needs complete knowledge of all the relevant parameters.

MANUFACTURING TECHNOLOGY 17.03.1997 49(72)
- A more simplified analysis, where one only needs to know the mean and the standard deviation ofthe different random distributions.
In this project we propose to use a more simplistic approach, where one makes a comparison with arigorous analysis to be able to estimate the errors introduced.
5.3 Some unresolved issues
Determining a suitable defect density and size distribution is one of the most difficult aspects of calculatingprobabilities of component failure. In a recent study [83], a simulation model was used to get detailedinformation on flaw distributions, that cannot be provided by current generic flaw distributions (as the oneused in [81]). This model [83] could address the effects of welding details such as joint geometry, weldprocess and also the inspection method used. If this turns out to be successful, it is possible to generateflaw distributions appropriate to specific type of welds.
It can be shown that there is not a unique relationship between a safety factor obtained using adeterministic approach and failure probability [84]. This has the disadvantage, that it is difficult to make asimple comparison between a Probabilistic Safety Evaluation method and the deterministic methods mostcommonly used today. Despite the absence of a unique relationship between a reserve factor and failureprobability, there is a dependence on factors such as the location of the assessment point on the R6diagram (i.e. whether the failure is fracture dominated or plastic collapse dominated) and the widths of thematerial property distributions. As a result, approximate estimates of failure probability can be obtainedprovided a deterministic R6 analysis is performed for mean material properties and the coefficients ofvariation for the material properties are known [84].
Even so, there are still other unresolved issues which are often discussed, among which one can mention:
- How should an analysis be interpreted when the distribution tail gives a substantial contribution tothe result of the analysis?
- It is understood that sometimes it is necessary to assume input data distributions due to lack ofrelevant data. How should the distributions be chosen?
5.4 Proposed work within SINTAP
The proposed work of SAQ will consist of providing information on the following aspects covered in sections5.4.1-5.4.4. In addition, an up-to-date version of R/H/R6 approach Appendix 10 has been provided by NE[80] and a brief description of the R6 method from a probabilistic viewpoint by NE is included in Appendix 1.
5.4.1 The probabilistic model by SAQ
Within sub-task 3.5, SAQ intends to develop a probabilistic model using a simplistic approach, where onemakes a comparison with a rigorous analysis to be able to estimate the errors introduced.
In principle, a probabilistic fracture mechanics methodology, can handle a large number of variables andallow for correlation between some parameters. If one assume that the model consists of three mainassessment parameters, fracture toughness, defect size and flow stress and the related probability densityfunctions are known (ƒKIc(KIc), ƒa(a), ƒσ(σ)), then the failure probability Pƒ may be stated in the form [80]:
( )P (K K .IC
0
wall thickness
f a IC ICf a f f K d d da= ∫∫∫ ( ) . ). .σ σ σ ...........................................(50)
This expression can then easily be expanded into more random parameters.
5.4.2 Choice of random parameters
The proposed Probabilistic Safety Evaluation method could take the following random parameters intoaccount.

MANUFACTURING TECHNOLOGY 17.03.1997 50(72)
- Fracture toughness (both brittle and ductile fracture).- JR-curve.- Constraint effects (only qualitatively).- NDT.- Accuracy in the calculations.- Fatigue, da/dN-data.- Fatigue, threshold data.- Stress corrosion cracking.- Loading.- Yield strength and ultimate strength.- Effects of irradiation.- Defect size.
However, it has been decided within the project that we should only consider the most importantparameters in this study. It was decided to include fracture toughness, the JR-curve, yield strength, NDTand defect size. A new defect size distribution will be developed within this sub task, the other parametersare then the responsibility of the other sub-tasks within Task 3.
To find appropriate data is most important for the success of Task 3. It is essential that one finds all therelevant random data needed in the implementation of the probabilistic model (given as probability densityfunctions).
5.4.3 A computer program
It is also important that a computer program is developed in parallel with other parts of the project (relatingto Task 3). SAQ suggests that it should be a PC-program based on MS Windows. The main purpose of thisprogram is for internal verification of the proposed Probabilistic Safety Evaluation method, but it could alsobe used in sub-task 5.4 (validation of procedures and software).
5.4.4 A comparison with deterministic methods
When implementing a new safety evaluation model, acceptance is needed from relevant organisations ofthe European industry involved. This is especially true when the proposed method is somewhat new to theindustry, as in the case of a probabilistic model.
Therefore, it is essential to make a comparison between this new Probabilistic Safety Evaluation methodand the deterministic methods most commonly used today. As reference cases two different geometry'smay be chosen such as an axial or circumferential crack in a cylinder.
5.5 Future work
The work this far has emphasised the need of a revision and extension of the present deterministicmethods of safety assessment, which often are based on ASME or the R6-method. This requires thedevelopment of a new method based on a probabilistic approach.
The relevance of the work here to SINTAP will be a newly developed Probabilistic Safety Evaluation model.This will include the main assessment parameters (i.e. fracture toughness, defect size and flow stress,together with their probability density functions) and choice of random parameters, all combined in the formof a computer program. A new defect size distribution will also be developed within this sub-task. Finally, acomparison between the new method and the most common deterministic ones is proposed.

MANUFACTURING TECHNOLOGY 17.03.1997 51(72)
CONCLUSIONS
The main conclusions of this technical review and the relevance to SINTAP are summarised as follows:
Task 3.2: Optimised Treatment of Data
Fracture mechanics data from group sponsored projects co-ordinated by TWI has been presented. Themain importance of these data, covering parent plate, heat-affected zone (HAZ) and weld metal, are that itpresents a large, well characterised fracture toughness data set on a structural grade steel which can beused for future statistical and probabilistic fracture mechanics analyses.
The HAZ data were further used to develop a weakest link model in which fracture toughness was shown todepend on the length of brittle HAZ (i.e. LBZ) material present at the crack tip. The model was used topredict HAZ fracture toughness distributions in through-thickness notched specimens, which tested mixedmicrostructures (i.e. LBZ and tough material), from surface notched specimens which sampled either allLBZ or tough material. The relevance of this work to SINTAP is that it provides a well defined HAZ data setfor further analysis, and it illustrates the problems of conducting probabilistic defect assessments inwelded components.
Two models, a probabilistic fracture mechanics analysis method developed at TWI and a statistical brittlefracture model developed at VTT have been reviewed. The relevance of the TWI model to SINTAP is that itcan be used to assess probability of failure and to help define partial safety factors for use in deterministicfracture mechanics analyses. The statistical brittle fracture model by VTT, in turn, can be applied to derivestatistically defined safety factors applicable for structural integrity assessment. The safety factors areconnected to maximum likelihood estimates of either the fracture toughness or the transition temperatureallowing for the analysis of randomly censored data. For macroscopically inhomogeneous materials theestimates can also be based on the lowest measured fracture toughness value. A simple procedure fordetermination of the measuring capacity of a test specimen from experimental data has been presented.These approaches will be further developed with particular emphasis in using existing data sets fromEuropean Round Robin exercises.
Task 3.3: Charpy - Fracture Toughness Correlations
A review of available Charpy - fracture toughness correlations for use in structural integrity assessmentshas been carried out by British Steel and TWI. The aims were to summarise the potential problemsassociated with such correlations, to review existing correlations for ferritic structural steels, to assessindustrial requirements and to provide a framework for the development of this area within SINTAP.
The major problem with applying fracture mechanics is data availability, and of these data fracturetoughness is the most rarely known. Available Charpy data are usually in the form of a minimum specifiedrequirement, or a value at the specified temperature, and rarely in the form of a full transition curve.
The principal differences between Charpy and fracture toughness tests are; notch acuity, specimen sizeand strain rate. Furthermore, Charpy measures initiation and propagation, fracture toughness measuresinitiation. For modern steels, lowering C and S has reduced the Charpyÿtransition temperature to a greaterextent than the fracture toughness transition temperature. As a result, the relationship between Charpy andfracture toughness transition temperatures has changed. The parameter [% C + 10 (% S)] can be used toquantify this effect.
Two principal correlation formats are used: direct correlation between Charpy energy and fracturetoughness and correlation of specific reference transition temperatures. The former method gives goodcorrelations only in certain toughness ranges. A definition of lower shelf and upper shelf is needed forappropriate selection of correlation. For direct correlations, it was found that the variation in predictedtoughness is large both for lower shelf and upper shelf correlations. Correlations involving transitiontemperatures are numerous, the most widely documented being: TKJC 100 = a TCv28 J - b.
Expressions are available for correction of CTOD to K. These are useful and should be incorporated in acode with appropriate guidance on limits and selection of the factor λ. Correlations involving Charpyenergies from pre-cracked specimens are largely irrelevant for practical situations in which suchspecimens are never used. Correlations involving the definition of a Charpy fracture appearancetemperature (50% FATT) are of limited use since this factor is not often known. Pellini NDTT is an

MANUFACTURING TECHNOLOGY 17.03.1997 52(72)
inappropriate parameter for correlation with fracture toughness. Any reference to KIC should be replacedwith the term KJC, determined from the elastic-plastic critical J-integral.
Expressions are available for the prediction of the variation with temperature of both Charpy and fracturetoughness for the lower shelf / lower transition region. The former is linear, the latter exponential. Both typesof expressions should be included in an assessment code following further validation. Any proposedcorrelations should incorporate a thickness adjustment for the fracture toughness data, and ideally amethod for statistical definition of the correlation for given levels failure probability.
It is proposed that the subject of correlations in a code should be treated by a three-part approach, withincreasing data availability and sophistication.
(i) Direct correlations; one for lower shelf, one for upper shelf, but both conservative.
(ii) Direct generic correlations; one for lower shelf and one for upper shelf, but with variable correlationparameters to allow for thickness, steel type, composition, strength and statistical confidence.
(iii) Correlation based on the relationship between transition temperature for Charpy energy 27/28 Jand that for KJC 100 MPa√m allowing for thickness effect and probability of failure.
Task 3.4: Non Destructive Evaluation Guidance
Guidance has been provided on issues relating to the interaction between NDT and fracture mechanicsassessment, including probability of detection and sizing errors and statistical treatment of NDT data.
It was stated that TWI is currently conducting a group sponsored project into the subject of interfacing NDTwith fitness-for-purpose (FFP) assessments as applied to pressure systems. This work is relevant toSINTAP and it is hoped that the sponsors will agree to publish the confidential project information. A furthersource of information are the numerous technical papers that have been published on the subject of NDTand FFP assessments. The contribution from JRC, for instance, consisted of various examples of what canbe obtained from existing databases (PISC).
An important issue for FFP assessment is the availability of reliable NDT methods, techniques andprocedures which are capable of providing the required quantitative information on weld fabrication flaws, orservice induced flaws in the component, or plant, in question. Determining a suitable defect density andsize distribution is one of the most difficult aspects of calculating probabilities of failure for any structure orcomponent. It was pointed out that information is contained in existing FFP guidance documents whichprovide details of the flaw measurements required for FFP assessments. Also contained in thesedocuments are guidance for dealing with flaw measurement uncertainties, either through the use of "partialsafety factors" e.g. BSI PD6493, or tabulated values of measurement uncertainties for specific NDTmethods, e.g. IIW SST-1157-90. A general problem for deterministic FFP analyses is that these "worstcase" estimates of flaw size can sometimes be overly conservative. A very small tolerable flaw size alsomakes it difficult to find, which may yield structures uneconomic to build and operate.
Prior to carrying out NDT, the flaw sizes of concern for subsequent FFP assessments needs to beaccurately specified, since this may affect the minimum size of flaw to be reported and characterised. Next,an appropriate probability of detection for the flaw sizes of concern has to be specified, since this affects theselection of NDT methods, techniques and procedures. Finally, the required flaw measurement accuracyfor the flaws of concern should be specified, since uncertainties in the measured position and size of flawswill have an affect on the outcome of subsequent FFP assessments.
To enable selection of suitable NDT methods and techniques, quantitative information is needed on thedetection, location and sizing of flaws in a variety of weld geometries and material thicknesses. Thisinformation should, ideally, be backed up by evidence from practical trials, or experiments. Such informationshould be included in FFP guidance documents.
Task 3.5. Safety Factors and Risk Assessment
Current problems regarding the determination of safety margins in structural safety assessment have beenoutlined. The aspects of a probabilistic safety evaluation model quantifying different margins of safety usingrelevant random parameters instead of deterministic safety factors were then discussed. Comparison has

MANUFACTURING TECHNOLOGY 17.03.1997 53(72)
been made between the new method and the deterministic methods. Some potential problems are raisedand suggestions for further work are given.
Earlier work on these issues has emphasised the need of a revision and extension of the presentdeterministic methods of safety assessment which are often based on ASME or the R6 method. Thisrequires the development of a new method that should be based on a probabilistic philosophy.
The reliability of the structure may be quantified directly using a probabilistic approach. A majorimponderable in probabilistic methods is in defining an acceptable failure probability. One of the ways to dothis is to reinterpret it in terms of safety factors. However, difficulties in defining the distributions for defectsize and material properties may mean that in some cases the benefits of calculations are in providingrelative failure probabilities for ranking assessment locations rather than for estimating true failureprobabilities. It was stressed that a more realistic evaluation of a components performance can beconducted only if the uncertainty in the input data (i.e. structural loads, flaw sizes, material properties etc.),and hence the responses are taken into account. Determining a suitable defect density and size distributionis one of the most difficult aspects of calculating probabilities of component failure. SAQ will contribute tothis sub-task, as well as to NDT aspects, by developing a new defect size distribution as an input randomparameter to their probabilistic safety evaluation method.
The relevance of this work to SINTAP will be the development of a Probabilistic Safety Evaluation model bySAQ. This will include the main assessment parameters: i) fracture toughness, ii) defect size and iii) flowstress, together with their probability density functions; and choice of random parameters, all combined into a computer program. A comparison between the new model and the most commonly used deterministicmodels is proposed.
MANUFACTURING TECHNOLOGY 17.03.1997 54(72)
REFERENCES
[1] British Standard BSI PD6493:1991: 'Guidance on methods for assessing the acceptability of flaws in fusionwelded structures'. British Standards Institute, London, 1991.
[2] 'Unstable fracture' D404. Veritas Offshore Standards, recommended practice. DnV, Høvik, Norway, 1988.
[3] Plane, C. A., Cowling, M. J., Nwegbu, V. and Burdekin, F. M.: 'The determination of safety factors for defectassessment using reliability analysis methods'. Integrity of Offshore Structures - 3. Publ. Elsevier AppliedScience, 1988.
[4] Towers, O. L., Williams, S. and Harrison, J. D.: 'ECSC collaborative elastic-plastic fracture toughnesstesting and assessment methods'. The Commission of the European Communities Agreement No.7210/KE/805. Working Group F5.1/78, TWI Report 3571/10M/8h, June 1984.
[5] Anderson, T. L. and Williams, S.: 'Assessing the dominant mechanism for size effects in the ductile-to-brittletransition region'. ASTM 17th National Symposium on Fracture Mechanics, Albany, New York, 7 - 9 August1984.
[6] Pisarski, H. G. and Jutla, T.: 'Statistical correlation of large- and small-scale fracture toughness testsnotched into weld HAZs'. Int. Conf. on Weld Failures, London. The Welding Institute, 21-24 November 1988.
[7] Pisarski, H. G. and Slatcher, S.: 'Probabilistic assessment of low HAZ fracture toughness in offshorestructures'. TWI Report 5590/12/91, November 1991.
[8] Pisarski H. G. and Slatcher, S.: 'Assessment of the significance of LBZs in steels using a probabilisticmodel'. Offshore Mechanics and Arctic Engineering Conference, Glasgow, Scotland 1993, ASME Vol.II, pp.89-97.
[9] Hadley, I. and Dawes, M. G.: 'Collaborative fracture mechanics research on scatter in fracture tests andanalyses on welded joints in steel'. European Commission, Contract 7210-KE/817, Report EUR 15998EN,1995. Also to be published in Fatigue and Fracture of Engineering Materials and Structures, 1996.
[10] Beremin, F.M.: Met. Trans, 14A (1983), p. 2277.
[11] Wallin, K.: 'Statistical Modelling of Fracture in the Ductile to Brittle Transition Region', MechanicalEngineering Publications, "Defect Assessment in Components - Fundamentals and Applications",ESIS/EGF9, London, England, 1991.
[12] R/H/R6 - Revision 3: Appendix 1: 'Determination of Fracture Toughness Values', Nuclear Electric(Confidential), 1993.
[13] Wallin, K.: Engng. Fracture Mech., 19 (1984), p. 1085.
[14] Wallin, K.: Engng. Fracture Mech., 22 (1985), p. 149.
[15] Wallin, K.: J. Phys. IV (1993), Coll. C7, supp. J. Phys. III, 3, p. 575.
[16] Wallin, K.: Int. J. P. V. P, 55 (1993), p. 61.
[17] Moscovic, R.: Engng. Fracture Mech., 44 (1993), p. 21.
[18] Wallin, K.: 'Validity of Small Specimen Fracture Toughness Estimates Neglecting Constraint Corrections',American Society for Testing and Materials, "Constraint Effects in Fracture: Theory and Applications",ASTM STP 1244, Philadelphia, USA, 1995.
[19] Wallin, K. and Hauge, M.: 'Improved Methodology to Determine Lower Bound HAZ CTOD Toughness',Engineering Materials Advisory Services Ltd., "ECF9 Reliability and Structural Integrity of AdvancedMaterials, Vol. II", Warley, West Midlands, England, 1992.

MANUFACTURING TECHNOLOGY 17.03.1997 55(72)
[20] Nevalainen, M. and Dodds, R.H.: 'Numerical Investigation of 3-D Constraint Effects on Brittle Fracture inSE(B) and C(T) Specimens', Structural Research Series No. 598, UILU -ENG-95-2001, Department of CivilEnginering, University of Illinois at Urbana-Champaign, Urbana, Illinois, USA, 1995.
[21] Pisarski, H.G.: 'A Review of Correlations Relating Charpy Energy to KIC', The Welding Institute ResearchBulletin, December 1978, pp. 362-367.
[22] Phaal, R., Macdonald, K.A. and Brown, P.A.: 'Critical Examination of Correlations Between FractureToughness and Charpy Impact Energy', The Welding Institute, Report 5605/6/92, March 1992 (andassociated software, Cv K).
[23] Roberts, R. and Newton, C.: 'Interpretive Report on Small Scale Test Correlations with KIC Data'. WeldingResearch Council Bulletin No. 265, 1981, pp. 1-18.
[24] Rosenfield, A.R. and Marshall, C.W.: 'Fracture Mechanics Based Failure Analysis', Engng. Fracture Mech.,45, 3, 1993, pp. 333-338.
[25] Laures, J.P.: 'Changes in Charpy Impact Properties of Pressure Vessel Steels Over the Past 25 Years',The Welding Institute, Report No. 5583/3/1989.
[26] Bannister, A.C.: 'Charpy Fracture Toughness Correlations for Modern Structural Steels and TheirImplications to Defect Assessment Procedures', British Steel plc, Swinden Technology Centre, Report No.SL/EM/R/S1196/63/94/C, 8th March 1994.
[27] Marandet, B. and Sanz, G.: 'Evaluation of the Toughness of Thick Medium Strength Steels by Using LinearElastic Fracture Mechanics and Correlations Between KIC and Charpy V-Notch', Flaw Growth and Fracture,ASTM STP 631, American Society for Testing and Materials, Philadelphia, 1977, pp. 71-95.
[28] Barsom, J.M. and Rolfe, S.T.: 'Correlations Between KIC and Charpy V-Notch Test Results in the TransitionTemperature Range', ASTM STP 466, 1970, pp. 281-302.
[29] Wallin, K.: 'Innovative Approaches to Irradiation Damage and Fracture Analysis', PVP, Vol. 170, D.L. Marriot,T.R. Mayer and W.H. Bamford, (Eds.), ASME, 1989, pp. 93-100.
[30] EXXON Chemical: 'Fitness for Service Guide', Part B, Section 5, Material Property Data, Rev. 4, February1995.
[31] British Standard BS 5950-Part 1: 'Structural Steelwork Design', British Standards Institute, 1990.
[32] Wallin, K.: 'A Simple Theoretical Charpy V-KIC Correlation for Irradiation Embrittlement' InnovativeApproaches to Irradation Damage and Fracture Abalysis, PVP-Vol. 170, ASME, pp. 93-100.
[33] ASTM: 'Test Practice (Method) for Fracture Toughness in the Transition Range', Draft 10, Rev. 6-12-95,American Society for Testing and Materials, 1995.
[34] 'PVRC Recommendations on Toughness Requirements for Ferritic Materials', PVRC Group on ToughnessRequirements, WRC Bulletin 175, August 1972.
[35] Burget, W. and Blauel, J.G.: 'Fracture Toughness of Welding Procedure Qualification and Component WeldsTested in SENB and C-Specimens', The Fracture Mechanics of Welds, EGF Pub. 2, J.G. Blauel and K.-HSchwalbe (Eds.), 1987, Mechanical Engineering Publications, London, pp. 19-47.
[36] Wallin, K.: 'The Size Effect in KIC Results', Engineering Fracture Mechanics, 22 (1986), pp. 149-163.
[37] Wallin, K.: 'Relevance of Fracture Mechanical Material Properties for Structural Integrity Assessment',Proceedings ECF10, K.-H. Schwalbe and C. Berger (Eds.), 20-23 September 1994, EMAS Pub., pp. 81-95.
[38] Chaudhuri, S.K., Ojha, S.N. and Ramaswamy, V.: 'Fracture Toughness Evaluation of Weldments andCorrelations with the Charpy Data of a Microalloyed Steel', Int. J. of Pressure Vessels and Piping, 22 (1986),pp. 23-30.

MANUFACTURING TECHNOLOGY 17.03.1997 56(72)
[39] Girenko, V.S. and Lyndin, V.P.: 'Relationship Between the Impact Strength and Fracture Mechanics CriteriaδIC and KIC of Structural Steels and Welded Joints in Therm', Automatic Welding, 13-19 September, 1985.
[40] Imai, J., Nakaya, I., Yajima, H., Tada, M., Yamayata, S. and Deguchi, A.: 'Safety Evaluation of LNG StorageTanks of 9% Ni Steel Based on Fracture Analysis', Proc. "Transport and Storage of LPG and LNG", Brugge,7-10 May 1984, pp. 91-100.
[41] Logan, J.G. and Crossland, B.: 'The Fracture Toughness of En25 and a 3% Ni-Cr-Mo-V Steel at VariousStrength Levels Together with Charpy Impact Data', Practical Applications of Fracture Mechanics toPressure Vessel Technology, Institution of Mechanical Engineers, 1971, pp 148-155.
[42] Sailors, R.H. and Corten, H.T.: 'Relationship Between Material Fracture Toughness Using FractureMechanics and Transition Temperature Tests', ASTM-STP-514, 1973, pp 164-191.
[43] Barsom, J.M. and Rolfe, S.T.: 'Correlations Between KIC and Charpy V-Notch Test Results in the TransitionTemperature Range', ASTM-STP-466, 1970, pp. 281-302.
[44] Rolfe, S.T. and Novak, S.T.: 'Slow bend KIC Testing of Medium Strength High Toughness Steels', ASTM-STP-463, 1970, pp. 124-159.
[45] Ito, T., Tanatka, K. and Sato, M.: 'Study of Brittle Fracture Initiation from Surface Notch in Welded FusionLine', IIW Doc. No. X-707-73, 1973.
[46] Norris, D.M., Reaugh, J.E. and Server, W.L.: 'A Fracture Toughness Correlation Based on Charpy InitiationEnergy', Fracture Mechanics 13th Conference, ASTM-STP-743, R. Roberts (Ed.), ASTM, 1981, pp. 207-217.
[47] Priest, A.H., Charnock, W. and Stewart, A.T.: 'The Effect of Accelerated Irradiation on Fracture Behaviour',"Effects of Radiation on Materials", 11th Conference, ASTM-STP-782, H.R. Brager and J.S. Perrin (Eds.),ASTM, 1982, pp. 475-491.
[48] Thorby, P.N. and Ferguson, W.G.: 'The Fracture Toughness of HY60', Materials Science and Engineering,22, 1976, pp. 177-184.
[49] Witt, F.J.: 'Relationship Between Charpy Impact Shelf Energies and Upper Shelf KIC Values for ReactorPressure Vessell Steels', Int. J. Pressure Vessels and Piping, 11, 1983, pp. 47- 63.
[50] Schindler, H.J. and Morf, U.: 'A Closer Look at Estimation of Fracture Toughness from Charpy V-NotchTests', Int. J. Pressure Vessels and Piping, 55, 2, 1993, pp. 203-212.
[51] Burdekin, F.M.: 'Further Aspects of Selection of Steels to Avoid Brittle Fracture', IIW Doc. X-1281-93, 1993.
[52] Sanz, G.: 'Essai de Mise au Point d'une Méthode Quantitative de Choix des Qualités d'aciers vis-à-vis duRisque de Rupture Fragile', Revue de Metallurgie, CIT, Juillet, 1980.
[53] Chivigos, J.N. and Meyer, T.A.: 'Influence of Material Property Variations on the Assessment of StructuralIntegrity of Nuclear Components', J. Testing and Evaluation, 6, 5, 1978, pp. 289-295.
[54] Graville, B.A.: 'Correlations Between Charpy Properties and the Nil-Ductility Transition Temperature', Project1-1, CSA Verification Program for the Offshore Structures Code, quoted in Reference (22).
[55] Barsom, J. M.: 'Development of the AASHTO Fracture Mechanics Requirements for Bridge Steels',Engineering Fracture Mechanics, 7, 1975, pp. 605-618.
[56] Matsumoto, K. et al: 'Effect of Post Weld heat Treatment on Fracture Mechanics Properties of ElectroslagWelded Joints of Low Carbon Steel Plates', 3rd Int. Symp. of Japan Welding Society. Criteria for PreventingService Failures in Welded Structures', 26-28 September, 1978, Tokyo, JWS, pp. 167-172.
[57] Oda, I.: 'Influence of Critical COD from Charpy V Test Result', Engng. Fracture Mech., 29 6, 1988, pp. 663-671.

MANUFACTURING TECHNOLOGY 17.03.1997 57(72)
[58] Braid, J.E.M.: 'Weld Metal Charpy CTOD Correlations for Cold Marine Application', Proc. Int. Symp. onFracture Mechanics, Winnipeg, Canada, W.R. Tyson and B. Mukherjee (Eds.), 1987, pp. 227-239.
[59] Eurocode 3: 'Design Against Brittle Fracture', Design of Steel Structures, CEN. Env. 1993-1-1, Annex C,February 1992.
[60] Wallin, K.: 'Methodology for Selecting Charpy Toughness Criteria for Thin High Strength Steels: Part 1 -Determining the Fracture Toughness', Jernkontorets Forskning, Report No. T040-29, December 1994.
[61] DiFant, M., Kaplan, D., Sartini, J.C., Bourges, Ph., Gauthier, M. and Menigault, J.: 'Extension des Méthods deDimensionnement en Rupture Fragile aux Aciers Soudables à Haute Limite d'elasticité', Commission deCommunatés Européannes, Recherche CECA No. 7210/KA/324/F1, March 1996.
[62] Langenberg, P., Dahl, W., Sedlacek, G., Stötzel, G. and Stranghöner, N.: 'Annex C, Material Choice for theAvoidance of Brittle Fracture in Eurocode 3', Abstracts of 2nd International Symposium on Mis-Matching ofWelds, GKSS Research Centre, 24 - 26 April, 1996.
[63] Kortelainen, O., Nevasmaa, P., Wallin, K. and Porter, D.: 'Effect of Cold Forming before Welding on HAZMechanical Properties and Strain Ageing Resistance in High Strength Thermomechanically ProcessedSteel S460ML', Report No VALB72, VTT Manufacturing Technology, Espoo 1995.
[64] Nevasmaa, P., Kortelainen, O., Wallin, K. and Porter, D.: 'Fracture Toughness Assessment and HAZ StrainAgeing Resistance of Thermomechanically Processed Steel subjected to Cold Forming before Welding',6th Int. Conf of Int. Soc. of Offshore and Polar Engineers (ISOPE 96), Los Angeles, 26 - 31 May, 1996, Vol IV.Pp 154-159.
[65] Nevasmaa, P., Kortelainen, O. and Wallin, K.: 'The Role of LBZs in Evaluating HAZ Toughness Test Data inLow-Impurity TMCP Steels', 2nd Int. Conf. of Instituto Italiana della Saldatura, "Eurojoin 2", Florence, 16-18May, 1994, pp. 983-991.
[66] PISC I Programme, CEC JRC-Ispra report EUR 6371 EN, I-VI, OECD NEA-Paris CNSI Report No. 48, 1979.
[67] PISC II Programme, CEC JRC-Ispra reports S.P./1.07.C1.86. 51 to 66, OECD NEA-Paris CNSI Report No.s117-121, 1986.
[68] Third programme for the inspection of steel components, CEC JRC-Ispra/Petten PISC III Report No.s 1-42,1987-1995.
[69] Forli, O., Hansen, B., Kjellander, S., Pettersen, B. and Åström, T.: 'A comparison of radiographic andultrasonic NDE'. Final report NORDTEST Project 72-76, Helsinki, 1983.
[70] Forli, O. and Pettersen, B.: 'The performance of conventional ultrasonic and radiographic weld examination'.Brit J NDT 27 (1985) 6, pp 364-366.
[71] Dover, W. D. and Rudlin, J.: 'Underwater inspection reliability trials'. Proc IOCE 92 Conf., Aberdeen, 1992.
[72] Dover, W. D. and Rudlin, J.: 'Results of probability of detection trials'. Proc IOCE 92 Conf., Aberdeen, 1992.
[73] Jessop, T. J., Mudge, P. J., Charlesworth, J. P., Silk, M. G., Clare, A.B., Short, K. A. and Bowker, K. J.: 'Sizemeasurement and characterisation of weld defects by ultrasonic testing - Part 1: Non-planar defects inferritic steels'. Publ. The Welding Institute, Abington, Cambridge, 1979.
[74] Jessop, T. J., Mudge, P. J., Harrison, J. D., Charlesworth, J. P., Aldridge, E. E., Silk, M. G., Coffey, J. M.,Bowker, K. J., Wrigley, J. M. and Denby, D.: 'Size measurement and characterisation of weld defects byultrasonic testing - Part 2: Planar defects in ferritic steels'. Publ. The Welding Institute, Abington, Cambridge,1982.
[75] Kenzie, B. W., Mudge, P. J. and Pisarski, H. G.: 'A methodology for dealing with uncertainties in NDE datawhen used as inputs to fracture mechanics analyses'. Proc. ASM 13th Int. Conf. on NDE in nuclear andpressure vessel industries, Kyoto, 1995.
MANUFACTURING TECHNOLOGY 17.03.1997 58(72)
[76] IIW/IIS SST-1157-90: 'Guidance on assessment of the fitness-for-purpose of welded structures'. Int. Inst. ofWelding, Paris, 1990.
[77] Kenzie, B. W. and Pisarski, H. G.: 'Interfacing non-destructive testing with engineering critical assessmentsas applied to pressure systems'. TWI progress reports, Group Sponsored Project 5656, 1994-1996.
[78] Mudge, P. J. and Williams, S.: 'Statistical aspects of defect sizing using ultrasonics'. Proc. TWI Int. Conf. onNDT in the fitness for purpose of welded constructions, London, 1984.
[79] Madsen, H.O., Krenk, S. and Lind, N,C.: Methods of structural safety, 1986.
[80] R/H/R6 - Revision 3: Appendix 10: 'Probabilistic fracture mechanics procedure'. Nuclear Electric(Confidential), 1995.
[81] Dillström, P., Nilsson, F., Brickstad, B. and Bergman, M.: 'Probabilistic fracture mechanics analysis of anuclear pressure vessel for allocation of In-Service Inspection', Int. J. of Pres. Ves. & Piping, 54, 1993, pp.435-463.
[82] Wilson, R.: A users guide to the probabilistic fracture mechanics computer code STAR6 Version 2.2,Nuclear Electric Memorandum TEM/MEM/0005/95, 1995.
[83] Chapman, O. J. V., Khaleel, M. A. and Simonen, F. A.: 'A simulation model for estimating probabilities ofdefects in welds', ASME PVP Conference, Montreal, Canada, 1996.
[84] Wilson, R., Mitchell, B.J. and Ainsworth, R.A.: 'Relationship between conditional failure probabilities andcorresponding reserve factors derived from the R6 failure assessment diagram', ASME PVP Conference,Montreal, Canada, 1996.
[85] Phaal, R., Macdonald, K.A. and Brown, P.A.: 'Correlations between fracture toughness and Charpy impactenergy'. TWI Core Research Programme Report N:o 504/1994. The Welding Institute, Cambridge, 1994.
[86] Gardner, W. (Ed.): 'Improving the Effectiveness and Reliability of NDT'. Pergamon Press, 1992.
[87] Nichols, R.W.: 'A Review of Work Related to Defining the Reliability of NDT'. Final Report CEC Contract NoECI- 1460-B-7221-86 UK, (Nov. 1987).
[88] Whittle, J.: 'Building Confidence in Ultrasonic Inspection'. J. Nuclear Eng. International. January 1993, pp.35-38.
[89] Crutzen, S.: 'PISC I and PISC II: Evolution of NDT techniques for a higher reliability of pressure components'.Nucl. Eng. and Design 86, 197, 1985.
[90] Nichols, R.W. and Crutzen, S. (Eds): 'Ultrasonic Inspection of Heavy Section Steel Components' - The PISCII Final Report. Elsevier Applied Science Publ. Ltd, London, 1988.
[91] Crutzen, S.: 'The Major Results of the PISC II Exercise'. 9th SMIRT Conference, Lausanne, August 1987.
[92] Crutzen, S., Murgatroyd, R., Certo, M. and Dombret, Ph.: 'Summary of the PISC Parametric Studies on theEffect of Defect Characteristics'. PISC III Report No 8 (1988); to be published as EUR-Report in 1989.
[93] Crutzen, S., Nichols, R.W., Miller, A.: 'PISC III. A Status Report'. MPA Stuttgart, SMIRT 12, Division G, Stuttgart,August 1993.
[94] PISC III Report No 26; 'Evaluation of the Sizing Results of 12 Flaws of the Full Scale Vessel Installation'.EUR 15371 EN.
[95] Lloyd, G.J.: 'Experience in Validating Inspection of UK Nuclear Plant'. The 10th Conf. of NDE in the NuclearIndustry, Glasgow, 1989.
[96] Nichols, R.W., Crutzen, S.: 'The Impact of PISC Results on Codes and Standards', CSNI Report No. 10,PISC III report, 1992 to be published as EUR Report, 1993.
MANUFACTURING TECHNOLOGY 17.03.1997 59(72)
[97] Nilsson, F., Skanberg. L., Bystedt, P.: 'New Swedish Regulations for Safety of Pressurized Components',Proc. of the 9th Int. Conf. on NDE in the Nuclear Industry, Tokyo, Japan, 25 - 28 April 1988.
[98] Martinez-Ona, R., and Ortega, J.H.: 'Ten years experience of ISI On BWR Vessel Stub Tubes'. EuropeanJournal of NDT, Vol. 2, Number 2, October 1992.
[99] Baero, G., D'Annucci, F., Rylander, L.: 'Meeting the Upper-vessel Head Challange with ET and UT'. J.Nucl.Eng. Int., January 1993.
[100] Doctor, S.R., Selby, G.P, Haesler, P.G., Becker, F.L. 'Effectiveness and Reliability of ISI, a RRT'. Proc. 5th Int.Conf. on NDE in the Nuclear Industry. San Diego, May 1992 (ASM).
[101] Bates, D.J., Doctor, S.R., Haesler, P.G., Burck, E.: 'Stainless Steel RRT on Centrifugally Cast Material'. PISCIII Report No. 3, JRC Ispra S.P.I.87.24; PNL-6266; /CR-4970; September 1987.
[102] Dombret, Ph., Crutzen, S., F Champigny SMIRT 12, PISC III Action 3: Executive Summary. Post ConferenceSeminar No. 2, Paris, August 1993.
[103] Doctor, S. and Lemaitre, P.: 'PISC III - UT capability studies in wrought stainless steel', Proc. of the ASMEPVP Conference, Minneapolis (USA), June 20 - 24, 1994.
[104] Tomlinson, J.R., Hanstock, D.J., Gilroy, K.S., Shipp, R.: 'Development and Validation of Ultrasonic Inspectionfor Austenitic Components of the Sizewell B PWR'. The 10th Conf. of NDE in the Nuclear Industry, Glasgow,1989.
[105] Verspeelt, D., Maes, G., Dombret, P.: 'Field experience gained from the UT examination of PWR coolantpump casings'. Proc. of 11th Int. Conf. on NDE in the Nuclear and PV Industry. Albuquerque, April 1992(ASM).
[106] Krull, R., Tobles, R., Gribi, M.: 'Experience with recirculation pump shaft inspections'. European Journal ofNDT, Vol. 2, Number 3, January 1993.
[107] Shimizu, N., Miyake, Y., Sawaragi, K., Iwahoshi, Y., Marimoto, K.: 'Field application of newly developedmultichannel digital Eddy Current instrument'. Proc. of 11th Int. Conf. on NDE in the Nuclear and PV Industry.Albuquerque, April 1992 (ASM).
[108] Gondard, C., Roy, O.: 'Improvements of the SG tubes UT inspection using a rotating probe and dataprocessing'. Albuquerque, April 1992 (ASM).
[109] Bradley, E.R., Doctor, P.G., Ferris, R.H., Buchanan, J.A.: Steam Generator Group, Project-Task 13: FinalReport, NDE Validation, PNL-6399 (1988), USA.
[110] Birac, Cl.: The PISC Programme on Defectives Steam Generator Tubes Inspection. A Status report IAEAOECD CEC Specialists' Meeting, Petten, 8 - 10 March 1994.
[111] Spanner, J.C., Becker, L., Ammirato, F., Bilanin, W., Q'Brian, J.: 'Performance demonstration for ISI ofnuclear power plant components'. Proc. of 11th Int. Conf. on NDE in the Nuclear and PV Industry .Albuquerque, April 1992 (ASM).
[112] Nichols, R.W., Crutzen, S., Jehenson, P. and McDonald, N.S: 'Work in the PISC Programme Relevant toQualification and Performance Demonstration of NDE Techniques'. Proc. 9th Int. Conf. on NDE in theNuclear Industry, Tokyo, (April 1988).
[113] Crutzen, S.: 'Influence of Defect Characteristics on Inspection Performance', Proc. of the 8th Conf. on NDE inthe Nuclear Industry, Orlando, USA, 1986.
[114] Cowfer, D.: Basis Background for ASME Code Section XI proposed Appendix VIII: 'Ultrasonic ExaminationPerformance Demonstration'. ASME Pressure Vessels and Piping Conference, Honolulu, Hawaii, July 23-27, 1989.
[115] Murgatroyd, R., Crutzenl, S.: ASME PVP Conference, Denver USA, July 25-27, 1993.
MANUFACTURING TECHNOLOGY 17.03.1997 60(72)
[116] Benoist, P.: 'New French approach to RPV inspection'. SMIRT 11, Post Conf. Seminar No. 3, Monterey, USA,August 1989.
[117] Fischer, E., Sessoms, S., Gottfried, R., Rathgeb, W.: 'A new approach for the ISI of BWR RPV's'. Proc. of 11thInt. Conf. on NDE in the Nuclear and PV Industry. Albuquerque, April 1992 (ASM).
[118] PISC III Report No. 17: Summary of the 3 phases of the PISC programme.
[119] PISC II Report No. 3: Destructive examination of the PISC II Plates, Sept. 1986.
[120] PISC III Report No. 26: Evaluation of the sizing results of 12 flaws of the Full Scale Vessel installation. EUR15371 EN.
[121] PISC III Report No. 20: Report on the evaluation of the inspection results of the PISC III Safe-end assemblyNo. 20. EUR 15558 EN.
[122] PISC III Report No. 24: Report on the evaluation of inspection results of the Safe-end areas of the PISC IIIassembly No. 24. EUR15369 EN.
[123] PISC III Report No. 25: Evaluation of the inspection results of the PISC III Safe-end assembly No. 25, EUR15370 EN.
[124] PISC III Report No. 33: Report on the evaluation of the inspection results of the wrought-to-wrought PISC IIIassemblies nos. 31, 32, 33, 34, 35 & 36. EUR 15663 EN.
[125] PISC III Report No. 34: Report on the evaluation of inspection results of the cast-to-cast PISC III assembliesNos. 41, 42, and weld B of assembly No. 43. EUR 15664 EN.
[126] PISC III Report No. 35: Report on the evaluation of inspection results of the wrought-to-cast PISC IIIassembly No. 51 and weld A of assembly No. 43. EUR 15665 EN.
[127] PISC III Report No. 41: PISC III Action 5 Inspection of Steam Generator Tubing.
[128] PISC III Summary on Action 3: Nozzles and Dissimilar Welds Testing.
[129] Simonen, F.A. and Hatchell, B.K.: 'The sensitivity study of piping reliability predictions to input parametersand modelling assumptions', Reliability and Risk in Pressure Vessels and Piping, PVP-vol.251, ASME,1993.
[130] PISC III Report No. 5: PISC II: Parametric studies. Parametric studies on the effect of defect characterisationon their detection and sizing by ultrasound.
[131] PISC III Report on Action 2 on Full Scale Vessel Testing.
[132] PISC III Summary Report No. 42: Lessons learned from PISC III.
[133] Denys, R.: 'The future of Wide Plate testing in welding research', Proc. of the Int. Conf. "Welding 90", IITT-International, Gournay-Sur-Marne, 1990. Pp. 321-333.
[134] deLede, F. & Dahl, W.: 'Auswirkungen von Bereichen unterschiedlicher Härte in der Wärmeeinflusszonehochfester, niedriglegierter Stähle auf das Bautailverhalten', Dok.Nr. 7210-KE/121 (F 5.8/87), RWTH/IEHK,Aachen 1991. 30 p. + App.
[135] Denys, R.: 'The implications of LBZs - Part 3', Welding Design & Fabrication (1991): March. Pp. 38-42.
[136] Denys, R.: 'The implications of LBZs - Part 4', Welding Design & Fabrication (1991): July, pp. 46-49.
[137] Pisarski, H.G.: 'A review of HAZ toughness evaluation methods for steels', The Welding Institute ResearchReport 7056.01/90/681.2. The Welding Institute, 1991. 20 p. + Figs.
[138] Denys, R.: 'Fracture control and local brittle zones, a general appraisal', Proc. of the Int. Conf. on WeldFailures, London 1988, The Welding Institute, Paper N:o 44. Pp. P44-1 - P44-17.
MANUFACTURING TECHNOLOGY 17.03.1997 61(72)
[139] Thaulow, C.: 'The effect of HAZ brittle zones in controlling the fracture toughness', The Norwegian Institute ofTechnology, Trondheim, 1990. 9 p. + Figs.
[140] Denys, R.: 'Use of high strength steels: put the brakes on toughness testing', Dillinger Offshore Letter 2/93,Ed. F. Martin, Dillinger Hütte GTS, Dillingen, 1993. 4 p.
[141] Webster, S.E. & Bateson, P.H.: 'Significance of local brittle zones to structural behaviour', Materials Scienceand Technology 9 (1993): January, pp. 83 -90.
[142] Denys, R.: 'Weld metal yield strength mis-match effects on structural integrity', Proc. of the "Fracture '94"Conf., University of the Witwatererand, Johannesburg, 23 - 24 November, 1994 (repr. vers.). 31 p.
[143] Moskovic, R. & Neale, B.K.: 'Treatment of fracture toughness data in the transition regime', Fatigue, Fract.Engng. Mater. Struct. 16 (1993), pp. 1175-1185.
[144] Heerens, J., Zerbst, U. and Schwalbe, K.-H.: 'Strategy for characterizing fracture toughness in the ductile tobrittle transition regime', Fatigue, Fract. Engng. Mater. Struct. 16 (1993), pp. 1213-1230.
[145] Kocak, M., Schwalbe, K.-H., Chen, L. and Gnirss, G.: 'Effect of notch position and weld metal matching onCTOD of HAZ', GKSS Report No GKSS 88/E/74, GKSS, Geesthacht 1988. 10 p.
[146] Kocak, M. and Denys, R.: 'CTOD and wide plate testing of welds with particular emphasis on mis-matchedwelded joints', GKSS Report No GKSS 94/E/69, GKSS, Geesthacht 1994. 24 p.
[147] Rak, I., Kocak, M., Golesorkh, M. and Heerens, J.: 'CTOD toughness evaluation of hyperbaric repair weldswith shallow and deep notched speciemens', GKSS Report No GKSS 92/E/69, GKSS, Geesthacht 1992. 12p.

TABLE 1SUMMARY OF LOWER SHELF AND LOWER TRANSITION CORRELATIONS
Correlation Title ReferenceNo.
FormulaNo.
Correlation Yield StrengthRange
(N/mm2)
Charpy EnergyRange
(J)
Units
Chaudhuri et al 21 log δc = 1.14 log CV - 2.33(1) 40-63 mm, J38 22 log δc = 1.30 log CV - 2.58(2) 520 24-35
23 log δc = 1.06 log CV - 2.24(3) 18-40
Girenko et al 39 24 KIC = 2.5 CV0.5 200-1700 2-150 MPa√m, J
Imai et al 40 25K
CIC
yV0.5
σ= 2 5.
(4) 5-215 MPa√m, J, Mpa
Logan et al 41 27 KIC = 20.3 CV0.5 820-1420 7-37 MPa√m, J
Sailors and Corten 42 27 KIC = 14.6 CV0.5 410-815 7-70 MPa√m, J
Barsom et al 28, 43, 44 28 K = 45.1CIC2
V32
270-1700 4-82 MPa√m, J, MPa
29K
= 0.64
C
IC
Y
V
Yσ σ
−
2
0 01.270-1700
31-121 MPa√m, J, MPa
EXXON 30 30
KC E
1000ICV=
6505( ) (4) (4) MPa√m, J, MPa
Notes (1) HAZ, ductile fracture(2) HAZ, brittle fracture(3) Weld metal(4) Not Known(5) Claimed to be always conservative.
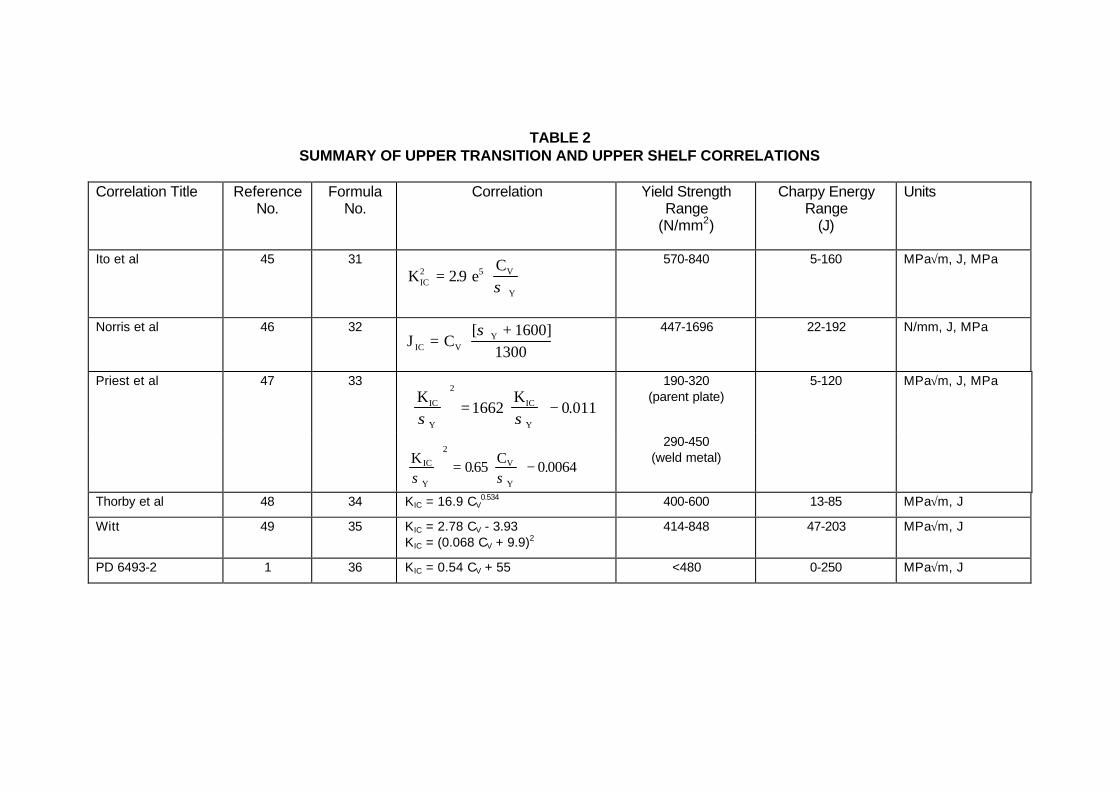
TABLE 2SUMMARY OF UPPER TRANSITION AND UPPER SHELF CORRELATIONS
Correlation Title ReferenceNo.
FormulaNo.
Correlation Yield StrengthRange
(N/mm2)
Charpy EnergyRange
(J)
Units
Ito et al 45 31K e
C IC
2 5 V
Y
=
29.
σ
570-840 5-160 MPa√m, J, MPa
Norris et al 46 32J C
+ 1600]IC V
Y=
[σ1300
447-1696 22-192 N/mm, J, MPa
Priest et al 47 33K KIC
Y
IC
Yσ σ
=
−
2
1662 0 011.
190-320(parent plate)
5-120 MPa√m, J, MPa
K CIC
Y
V
Yσ σ
=
−
2
065 0 0064. .
290-450(weld metal)
Thorby et al 48 34 KIC = 16.9 CV0.534 400-600 13-85 MPa√m, J
Witt 49 35 KIC = 2.78 CV - 3.93KIC = (0.068 CV + 9.9)2
414-848 47-203 MPa√m, J
PD 6493-2 1 36 KIC = 0.54 CV + 55 <480 0-250 MPa√m, J

TABLE 3SUMMARY OF CORRELATIONS INVOLVING TEMPERATURE SHIFTS
Corrolation Title ReferenceNo
FormulaNo
Correlation Yield StrengthRange
(N/mm2)
Charpy EnergyRange
(J)
Units
ASME-PVRC 34 37KIC = 1.333 exp [0.0261 (T-NDTT + 89)] + 29
<621 NA MPa√m,°C
BS PD 6493:1 1 38 As above but with NDTT = T40 J <480 NA MPa√m, °C
Barsom 55 39, 40 KIC2 = 105 CV
∆T = 119-0.12 σY (σY<965 N/mm2)250-1700 3-61 MPa√m, J
Mpa, °C
Matsumoto 56 41 KIC = 1.615 exp[0.038(T-ATT+140)]+31 Not specified NA MPa√m, °C
Oda57 42
δσC
-2 V
Y
x10 In 256C
=
344.
276-834 3-50 (brittle) mm, J, MPa
43
δσC
V
Y
C=
−18 01. .
50-200 (ductile)
44 ∆T = FATT - Tf
Sanz 52 46 TK 100 MPa√m = 1.37 TCV 28 J + 9KIC = 19 CV
0.5274-820 5-50 MPa√m, J
Wallin 60 41 TK100 MPa√m = TK27 J - 18 300-1500 NA °C
Wallin 60 4 K0 = 31 + {77.exp(0.019[T0])} 300-1500 T = +20 to -109°C
MPa√m, °C
Wallin 60 49
K IC T - T28J In1
1 - Pf
= + + +
20 11 77 0 019 18
25
8
1 4 1 4
{ . exp( . [ ]).
/
.
/ 3000-1500 NA MPa√m, °C, mm