review report for the six months ended - reliance capital
TRANSCRIPT
Review report for six months ended September 30, 2008 1
Reliance Capital Limited Review report on the results for the six months ended September 30, 2008 (Unaudited) October 31, 2008
Review report for six months ended September 30, 2008 2
Safe Harbor This report and the discussion that follows may contain “forward looking statements” by Reliance Capital Limited (“RCL”) that are not historical in nature. These forward looking statements, which may include statements relating to future results of operation, financial condition, business prospects, plans and objectives, are based on the current beliefs, assumptions, expectations, estimates, and projections of the directors and management of RCL about the business, industry and markets in which RCL operates. These statements are not guarantees of future performance, and are subject to known and unknown risks, uncertainties, and other factors, some of which are beyond RCL’s control and difficult to predict, that could cause actual results, performance or achievements to differ materially from those in the forward looking statements. Such statements are not, and should not be construed, as a representation as to future performance or achievements of RCL. In particular, such statements should not be regarded as a projection of future performance of RCL. It should be noted that the actual performance or achievements of RCL may vary significantly from such statements. General Risk Investment in equity and equity related securities involve a degree of risk and investors should not invest any funds in this Company unless they can afford to take the risk of losing their investment. For taking an investment decision, investors must rely on their own examination of RCL including the risks involved. Convenience translation We publish our financial statements in Indian Rupees. All references herein to “Indian Rupees” and “Rs.” are to Indian Rupees and all references herein to “US dollars” and “US$” are to United States dollars. All translations from Indian Rupees to United States dollars were made (unless otherwise indicated) using the rate of Rs. 42.77 = US $1.00 for H1 FY09 and Rs. 43.75 = US $ 1.00 for Q2 FY09 profit and loss items and the rate of Rs. 46.77 = UD$1 for balance sheet items as on September 30, 2008. All amounts translated into United States dollars as described above are provided solely for the convenience of the reader, and no representation is made that the Indian Rupees or United States dollar amounts referred to herein could have been or could be converted into United States dollars or Indian Rupees respectively, as the case may be, at any particular rate, the above rates or at all. Any discrepancies in any table between totals and sums of the amounts listed are due to rounding off.

Review report for six months ended September 30, 2008 3
Table of contents Section 1 – Reliance Capital at a glance Section 2 – An overview Section 3 – Financial and operating highlights Section 4 – Key Industry developments Section 5 – Stock market highlights

Review report for six months ended September 30, 2008 4
SECTION 1 RELIANCE CAPITAL – PERFORMANCE AT A GLANCE (Rs. Million)
Year ended March 31, Particulars 2006 2007 2008
Half Year ended September 30, 2008
(Unaudited) Total Revenues 9,470 21,579 49,192 28, 671 Net Profits 5,713 7,032 10,091 5,725 Networth 42,052 52,973 65,078 70,682 Reliance Mutual Fund Assets under Management (Rs.billion)
246.7 463.1 909.4 791.8
Reliance Life Insurance New business premium
1,940 9,320 27,510 14,731
Reliance General Insurance Gross written premium
1,630 9,120 19,460 9,862
Reliance Money Revenues 0 0 2,385 1,713 Reliance Consumer Finance Loan book size 0 0 71,200 95,130 + All the financial highlights given are based on consolidated audited results

Review report for six months ended September 30, 2008 5
SECTION 2 AN OVERVIEW Introduction: Reliance Capital is one of India’s leading and fastest growing private sector financial services companies, and ranks among the top 3 private sector financial services and banking groups, in terms of networth. Reliance Capital is a part of the Reliance - Anil Dhirubhai Ambani Group and is now ranked amongst the 25 most valuable private companies in India and is also listed in Forbes Global 2000 (World’s largest 2000 public companies). Reliance ADA group is amongst India’s top 3 business houses with a market cap of over US$ 23 billion and 150 million customers. It has a strong presence across a wide array of high growth consumer- facing businesses of Telecom, Financial Services, Energy, Power, Infrastructure and Media and Entertainment. Reliance Capital has interests in asset management and mutual funds, life and general insurance, private equity and proprietary investments, stock broking, depository services, distribution of financial products, consumer finance and other activities in financial services. Reliance Capital Asset Management Reliance Mutual Fund
• Reliance Mutual Fund has, over the years, built for itself a great name in the market by offering to its investors not just consistently high returns but also a highly innovative and diversified portfolio of products and services, and an unmatched track record of integrity.
• Reliance Mutual Fund (RMF) has maintained its leadership position in the country. It
further cemented its leadership position by increasing its market share to 16.3% at the end of September 2008 as against the market share of the second largest player being only 9.8%
• The AUM as at September 30, 2008 increased to Rs. 791.8 billion (US$ 17 billion) from
Rs. 679.1 billion at the end of September 30, 2007, an increase of 17%. During the same period, the AUM of the entire Indian mutual fund industry increased from Rs. 4.7 trillion to Rs. 5.3 trillion (US$ 113 billion), growth of 11%. (Source: AMFI website).
• The number of investors in RMF increased to 7.2 million as at the end of September 30,
2008 as against 4 million investors at the end of September 30, 2007. • As on September 30, 2008, there were a total of 33 schemes - 17 equity oriented
schemes, 14 debt oriented schemes and 2 exchange traded schemes
• RCAM further expanded its presence during the first half of FY09. It established its presence in 400 locations as against 300 of at the end of March 31, 2008
• In this year, Reliance Mutual Fund has won the "Most Trusted Mutual Fund Brand" for the
third year, in succession by Economic Times - AC Nielsen ORG-MARG survey
• The number of Systematic Investment Plan Investors has crossed 1 million.

Review report for six months ended September 30, 2008 6
Portfolio Management Services
• Reliance Portfolio Management Services is a premium financial service for select investors from the portfolio management division of Reliance Capital Asset Management Ltd. This division creates customized portfolios for high net-worth individuals keeping in mind their risk return preferences and endeavors to generate superior returns
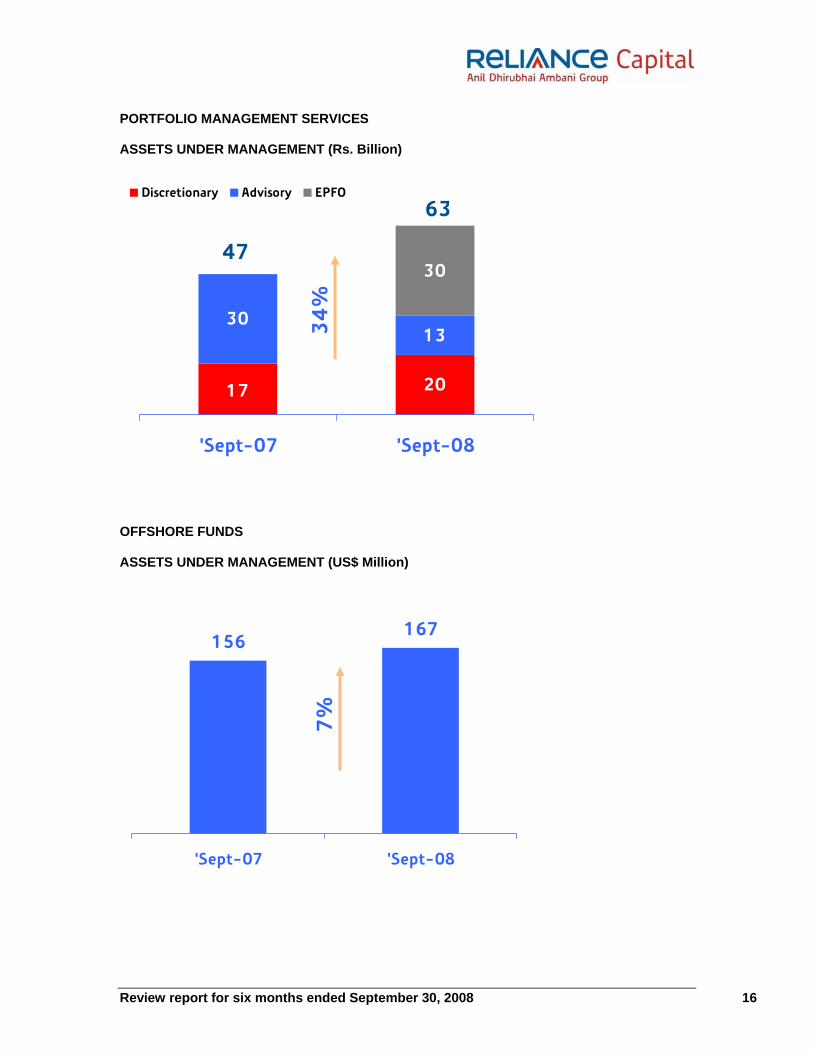
• The AUM as at end of September 30, 2008 increased to Rs. 63.1 billion (US$ 1.3 billion)
from Rs. 47 billion as at September 30, 2007, growth of 34%
• Reliance Capital Asset Management Company (RCAM) has been appointed this year as one of the fund managers by the Employees Provident Fund Organization (EPFO).
A hugely prestigious account, EPFO has entrusted over Rs 60 billon (US$ 1.3 billion) to RAMC, to begin with, for investment management. The current corpus of the account is Rs. 2.4 trillion (US$ 51 billion).
Reliance Asset Management (Singapore) Pte Ltd.
• Reliance Asset Management (Singapore) Pte Ltd, a wholly owned subsidiary of Reliance Capital Limited (through Reliance Asset management Company). It started operations in Februrary 2007. It currently manages 3 India dedicated funds viz. – India Equity Growth Fund, India Equity Long Term Fund and India Equity Derivative Fund.
• Its AUM as on September 30, 2008 stood at US$ 167 million as against US$ 156 million
as on September, 2007, demonstrating a growth of 7%
Other developments
• RCAM also received approval from Financial Services Authority in United Kingdom to commence investment advisory operations in United Kingdom
Reliance Life Insurance
• Reliance Life Insurance (RLIC) offers you products that fulfill savings and protection needs of customers. Reliance Life offers 30 products, of which 23 are targeted at individuals and 7 at group business. Reliance Life is committed to emerge as a transnational Life Insurer of global scale and standard and attaining leadership rankings in the industry within the next few years
• Reliance Life Insurance is amongst the top four private sector insurance companies in
India (in terms of monthly new business premium) • New business premium for the six months ended September 30, 2008 was Rs. 14.7
billion (US$ 344 million) as against Rs. 6.5 billion, an increase of 125%. During the period from August 2007 to August 2008, the new business premium of the entire Indian life insurance fund industry decreased by 5%, from Rs. 279 billion to Rs. 265 billion (US$ 6 billion). (Source: IRDA website)
• The revenue during the period from Single premium policies was 19 % as against 26 % in
the previous period.

Review report for six months ended September 30, 2008 7
• Total numbers of policies in force as on September 30, 2008 were 2,039,077 as against
1,448,176 as on September 30, 2007. An increase of 41%.
• RLIC is one of the fastest growing Indian life insurance companies growing @ 125 % year on year. It is ranked 4th amongst private sector players with a market share of 9.20% of the private sector.
• During the six month period, 3 new life insurance policies were launched, viz. Reliance
Super Invest Assure plan, Group Savings Linked Insurance Plan and Group Credit life insurance.
• The distribution network has been increased to 744 branches at the end of September
30, 2008 against 339 branches at the end of September 30, 2007. In October 2008, RLIC received approval from Insurance Regulatory & Development Authority (IRDA) to start additional 400 branches. The current branch strength is 1,144.
• The numbers of agents at the end of September 30, 2008 were 211,293 as against
137,446 in the previous period, an increase of 54%.
• The total funds under management increased to Rs.47.5 billion (US$ 1 billion) as at September 30, 2008 against Rs. Rs.20 billion as at September 30, 2007
Reliance General Insurance
• Reliance General Insurance (RGI) offers property insurance, engineering insurance, auto insurance, health insurance, travel insurance, marine insurance, commercial insurance and other specialty insurance products
• RGI is one of the top three private sector General insurance companies in India (in terms
of business premium). It has a market share of 6.3% of the general insurance market in India.
• Gross Written Premium for the six months ended September 30, 2008 was Rs 9.8 billion
(US$ 231 million)as against Rs. 9.5 billion in the corresponding previous period, an increase of 4%
• The distribution network composed of 200 branches and over 7,800 intermediaries at the
end of September 30, 2008 Reliance Money
• Reliance Money is a comprehensive financial services and solutions provider, providing customers with access to equities, equity options and commodities futures, mutual funds, IPOs, life and general insurance products, offshore investments, credit cards, money transfer, currency exchange and gold coins.
• Reliance Money is the largest brokerage and distributor of financial products in India with
more than 2.7 million customers and the largest distribution network of 10,052 outlets in 5,165 locations.
• Reliance Money generated revenues of Rs. 1.7 billion (US$ 40 million) for the six months
ended September 30, 2008 as against Rs. 0.5 billion of the corresponding previous

Review report for six months ended September 30, 2008 8
period, an increase of 337 %. It also achieved a net profit of Rs. 254 million (US$ 6 million) for the same period.
• Reliance Money has tied up with global partners like Reuters, Vasco, Valcambi,
Webaroo, optionsXpress Holdings, Goldride Securities, World Gold Council and Wincor Nixdorf, to facilitate better access to wider world class choices to its customers
• Reliance Money has established its presence in the Middle East, Hong Kong, Nigeria and
Ireland.
• In addition to the home-grown portfolio of products and services that Reliance Capital has to offer, Reliance Money also distributes a variety of third party financial products. It also assists millions of investors in creating customized individual portfolios based on their diverse investment needs and risk profiles.
• It is amongst the leading Mutual fund distributors of the country distributing products of 17
AMCs. It is the the largest private sector partner for Western Union Money Transfer in India, crossing the 150,000 transactions per month mark
• Reliance Money is targeting the low level of retail penetration in Indian equities market.
Retail participation in equities in India, is amongst the lowest in the world, with less than 10% of household sector financial savings invested in equity/equity related assets
• Reliance Money has tied up with India Post and World Gold Council to sell gold coins
through the entire post office network of around 155,000 offices across the country.
• Reliance Money has obtained Category I Merchant Banking License from the Securities and Exchange Board of India. This new license allows Reliance Money to provide a wide range of investment banking services such as Issue Management, Underwriting, Private Equity Advisory/ Syndication and Corporate Finance services in India.
• Reliance Money is taking its first steps into the Commodities Exchange business and is in
the process of acquiring a 15 per cent stake in Hong Kong Mercantile Exchange (HKMEx). With this holding, Reliance Money becomes the second-largest shareholder in the commodity exchange and will have a board membership. Reliance Money is the first Indian firm to acquire a stake in an international exchange.
It has also obtained approval from the Ministry of Consumer Affairs for acquiring 10% stake in the National Multi-Commodity Exchange of India Ltd. (NMCE). Reliance Money proposes to acquire a total of upto 26 per cent stake in NMCE in two phases.
Reliance Consumer Finance
• Reliance Consumer Finance offers a wide range of products which include Personal loans, Vehicle loans (cars and commercial vehicles), Home loans, Loan against property and SME loans
• Our focus in this business is not just growth of credit per se but the quality of credit.
Backed by our long-standing conservative approach, we have developed in-house stringent credit risk management systems to ensure the highest quality of credit.
• As on September 30, 2008 Reliance Consumer Finance had a loan book of Rs. 95.1
billion (US$ 2 billion) with 120,000 customers spread across 23 locations. The loan book as on September 30, 2007 was Rs.22 billion

Review report for six months ended September 30, 2008 9
• Reliance Consumer Finance generated revenues of Rs.5.8 billion (US$ 136 million) for
the six months ended September 30, 2008, as against Rs. 0.6 billion for the corresponding previous period. It achieved a profit of Rs. 209 million (US$ 5 million) for the same period.
• Reliance Capital has filed an application with National Housing Bank to set up a separate
housing finance subsidiary and with Reserve Bank of India to set up a separate NBFC subsidiary for consumer finance business
Reliance Asset Reconstruction
• Reliance Asset Reconstruction has formally commenced business operations this quarter. The company is in the business of acquisition, management and resolution of distressed debt/ assets
Reliance Capital Services
• The Reliance ADA Group offers a diverse range of products and services: from telecom to financial services, from power and infrastructure to media and entertainment. This means that we have a huge pool of customers across our different businesses, who are not using all our products and services.
• A Reliance mobile user may not have a Reliance Money demat account or a Reliance
Mutual Fund account. A Reliance Power shareholder may not be buying insurance from Reliance Life or General Insurance.
• We see tremendous opportunity in cross selling Reliance Capital products across the
entire customer universe of the Reliance ADA Group.
• To capitalize on this opportunity, in July 2008 we have set up Reliance Capital Services, a company that will cross sell Reliance Capital products to the 150 million strong family of the Reliance ADA Group, comprising shareholders, customers and other stakeholders.
• Cross selling will lower our cost of customer acquisition and further improve profitability.
• It has commenced operations with over 1,000 employees and associates across 25
locations in India Reliance Equities International
• Reliance Equities International Private Limited (REIPL) is the institutional stock broking subsidiary of Reliance Capital. REIPL has been set up to complement Reliance Capital’s current financial services businesses
• Reliance Equities started business in August 2008.It aims is to add value to our clients
investment decision making process with thematic and differentiated research, access to corporate managements and lateral input providers and the highest standards of client servicing.

Review report for six months ended September 30, 2008 10
Reliance Equity Advisors (India) Limited (REAL)
• Reliance Equity Advisors (India) Limited (REAL), has been set up with the objective of raising a third party, sector agnostic private equity fund. The fund will primarily focus on acquisition financing, growth and consolidation capital in India.
• A team consisting of 12 professionals with extensive private equity and M&A background
having combined experience of 30+ years and participation in over 40 transactions across sectors is in place.

Review report for six months ended September 30, 2008 11
SECTION 3 FINANCIAL AND OPERATING HIGHLIGHTS Key Highlights for the six months ended September 30, 2008
• Total operating income of Rs. 28.6 billion (US$ 668 million) against Rs. 21.3 billion in the corresponding period – an increase of 34%
• Net profit of Rs. 5.7 billion (US$ 134 million) against Rs. 5.2 billion in the corresponding period – an increase of 9%
• Networth of Rs. 72.9 billion (US$ 1.5 billion) as on September 30, 2008 • Total assets of Rs.221 billion (US$ 4.7 billion) as on September 30, 2008
Summary of Consolidated Financial Statements (Rs. Million) H1 FY09
(Unaudited) H1 FY08 FY08
Total operating income 28,563 21,277 49,140 Staff costs 2,834 1,582 4,032 Other expenditure 5,953 6,184 13,319 Reinsurance premium ceded 3,313 3,716 7,665 Claims incurred 4,230 2,578 7,507 Interest & financial charges 5,266 910 4,100 Depreciation 243 126 412 Profit before tax 6,831 6,192 12,157 Profit after tax 5,768 5,207 10,102 Net Profit after Minority Interest & share of profit of associates
5,725 5,253 10,091
Diluted EPS (Rs) 23.31 21.20 41.08

Review report for six months ended September 30, 2008 12
Segmental Performance (Rs. Million) H1 FY09
(Unaudited) H1 FY08 FY08
Finance & Investments Revenue 9,021 8,451 16,852 Profit before tax 5,943 6,000 11,896 Capital employed 72,492 57,480 68,741 Asset Management Revenue 2,241 1,467 4,558 Profit before tax 776 568 1,931 Capital employed 1,083 580 677 General Insurance Revenue 10,948 10,686 23,461 Profit before tax (84) (203) (1,628) Capital employed 4,834 2,990 4,938 Consumer Finance Revenue 5,808 627 3,946 Profit before tax 209 55 59 Capital employed 390 92 59 Others Revenue 654 63 747 Profit before tax 52 (85) 140 Capital employed 2,343 158 223 Total income: RCL’s consolidated income from operations for the six months ended September 30, 2008 increased to Rs.28.6 billion (US $ 668 million) from Rs.21.2 billion in the corresponding period previous year, registering a growth of 34%. This was largely due to the growth of the consumer finance, asset management and general insurance business. Operating expenses: Staff costs for the six months ended were Rs. 2.8 billion (US$ 66 million) as against Rs. 1.6 billion in the corresponding period previous year, an increase of 79%, largely due to the increase in number of employees. Selling, general & administrative expenses were Rs. 6 billion (US$ 140 million) as against Rs. 6.2, a decrease of 4 %. This decrease was achieved inspite of an increase in scale of operations of the businesses. The decrease was achieved as a result of optimization of costs, improvement in operational efficiency and utilizing a healthy mix of own and third party distribution reach.
Review report for six months ended September 30, 2008 13
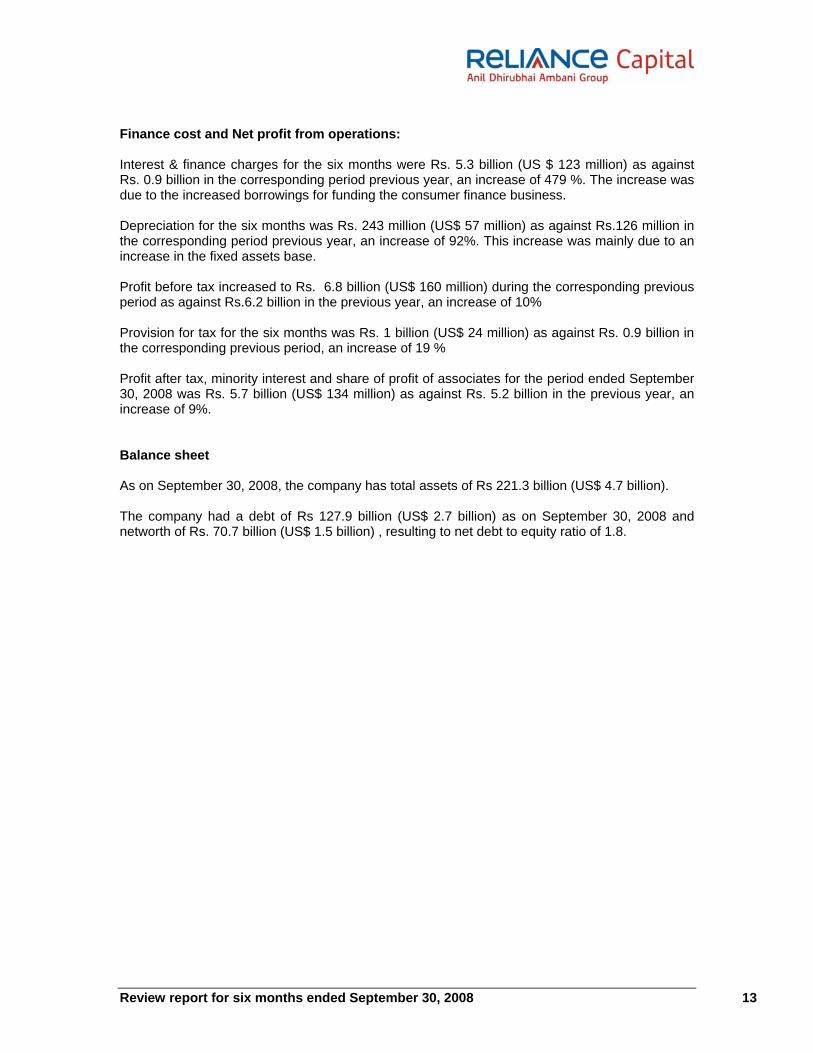
Finance cost and Net profit from operations: Interest & finance charges for the six months were Rs. 5.3 billion (US $ 123 million) as against Rs. 0.9 billion in the corresponding period previous year, an increase of 479 %. The increase was due to the increased borrowings for funding the consumer finance business. Depreciation for the six months was Rs. 243 million (US$ 57 million) as against Rs.126 million in the corresponding period previous year, an increase of 92%. This increase was mainly due to an increase in the fixed assets base.
Profit before tax increased to Rs. 6.8 billion (US$ 160 million) during the corresponding previous period as against Rs.6.2 billion in the previous year, an increase of 10% Provision for tax for the six months was Rs. 1 billion (US$ 24 million) as against Rs. 0.9 billion in the corresponding previous period, an increase of 19 % Profit after tax, minority interest and share of profit of associates for the period ended September 30, 2008 was Rs. 5.7 billion (US$ 134 million) as against Rs. 5.2 billion in the previous year, an increase of 9%. Balance sheet As on September 30, 2008, the company has total assets of Rs 221.3 billion (US$ 4.7 billion). The company had a debt of Rs 127.9 billion (US$ 2.7 billion) as on September 30, 2008 and networth of Rs. 70.7 billion (US$ 1.5 billion) , resulting to net debt to equity ratio of 1.8.

Review report for six months ended September 30, 2008 14
BUSINESS WISE PERFORMANCE RELIANCE CAPITAL ASSET MANAGEMENT MUTUAL FUND TOTAL ASSETS UNDER MANAGEMENT
(Rs. Billion)
Particulars As at 30 Sept 2008
As at 30 Sept 2007
As at 31 Mar 2008
Mutual Funds - Equity 273.3 254.0 318.7 - Debt 518.5 425.0 589.4 TOTAL 791.8 679.0 908.1 Portfolio Management Services - Discretionary 19.9 16.6 20.1 - Advisory 12.7 30.3 48.9 - EPFO 30.5 - - TOTAL 63.1 46.9 69.0 Offshore Funds (US$ million) 167 156 200
COMPETITIVE STANDING – INDIAN MUTUAL FUNDS As at 30 Sept 2008 As at 30 Sept 2007 As at 31 Mar 2008 Rank #1 #1 #1 Market Share 16% 15% 17% (Source: AMFI website) DISTRIBUTION REACH As at 30 Sept 2008 As at 30 Sept 2007 As at 31 Mar 2008 Branches 189 99 118 Resident Representatives
211 101 161
TOTAL LOCATIONS 400 200 279

Review report for six months ended September 30, 2008 15
FINANCIAL PERFORMANCE (Rs. Million)
H1 FY09
(Unaudited) H1 FY08 FY08
Income 2,437 1,467 4,741 Personnel costs 621 289 873 Marketing expenses 412 291 1,060 Administration & other expenses 467 318 755 Profit before tax 937 568 2,054 Profit after tax 663 376 1,497 Discussion of financial performance Total income: RCAM’s income from its operations for the six months ended September 30, 2008 increased to Rs. 2,437 million (US $ 57 million) from Rs. 1,467 million in the corresponding period previous year, registering a growth of 66%. This was largely due to the growth in the assets under management of the mutual fund, portfolio management services and offshore funds. Operating expenses: Staff costs for the six months ended were Rs. 621 million (US$ 15 million) as against Rs. 289 million in the corresponding period previous year, an increase of 115%, largely due to the increase in number of employees to 1,178 (as on September 30, 2008) from 786 (as on September 30, 2007). Selling, general & administrative expenses were Rs. 878 million (US$ 21 million) as against Rs. 609, an increase of 44%. This increase was primarily due to increase in the scale of operations and expansion of our distribution network. Profit after tax for the period ended September 30, 2008 was Rs. 663 million (US$ 16 million) as against Rs. 376 million in the previous year, an increase of 77%.
Review report for six months ended September 30, 2008 16
PORTFOLIO MANAGEMENT SERVICES ASSETS UNDER MANAGEMENT (Rs. Billion) OFFSHORE FUNDS ASSETS UNDER MANAGEMENT (US$ Million)
3013
30
20170
1 0
2 0
3 0
4 0
5 0
6 0
7 0
'Sept-07 'Sept-08
Discretionary Advisory EPFO
34%
47
63
156167
'Sept-07 'Sept-08
7%

Review report for six months ended September 30, 2008 17
RELIANCE LIFE INSURANCE FINANCIAL PERFORMANCE
(Rs. Million) H1 FY09
(Unaudited) H1 FY08 FY08
First year premium 11,894 4,847 18,440 Single premium 2,837 1,693 9,071 Total new business premium 14,731 6,539 27,511 Total premium 19,089 7,749 32,133 No of policies issued 763,727 277,511 1,073,715 No of branches 744 339 744 No of agents 211,293 137,446 184,194 Funds under management
Policyholders 43,789 19,234 35,545 Shareholders 3,779 920 2,222
Policyholders funds under management
Equity 29,390 12,907 21,954 Debt (incl Tbills) 14,399 6,327 13,591
Capital infused 6,850 3,200 8,500
• Capital infused till date – Rs. 22 billion COMPETITIVE STANDING – INDIAN LIFE INSURANCE INDUSTRY As at 31 Aug 2008 As at 31 Aug 2007 As at 31 Mar 2008 Rank (Private Life Insurance Industry)
# 4 # 6 # 4
Market Share (Private Sector Life Insurers)
9.2% 6.1% 8.1%
Overall Market Share 4.2% 1.7% 3.0% (Source: IRDA website)

Review report for six months ended September 30, 2008 18
DISTRIBUTION BREAK UP – well diversified
Agents, 67%
Channel development associates,
16%
Third party distributors/
corporate brokers, 10%
Others, 7%
PRODUCT MIX
• Top 5 products to 80% of new business premium viz. Automatic Investment Plan, Golden Years Plan, Reliance Super Invest Assure Plan, Total Investment Plan and Total Investment Plan- Pension

Review report for six months ended September 30, 2008 19
RELIANCE GENERAL INSURANCE FINANCIAL PERFORMANCE
(Rs. Million)
H1 FY09 (Unaudited)
H1 FY08 FY08
Gross Written Premium 9,862 9,464 19,464 Net Written Premium 6,124 3,717 9,600 Commission earned 535 738 1,316 Investment Income 542 480 1,041
Claims 4,230 2,578 7,507 Management expenses 2,744 2,270 5,632 Commission paid 315 285 512
Underwriting result (accounting) (279) (420) (2,061) Profit before tax (84) (195) (1,628)
Combined ratio (accounting) 110% 118% 129%
Networth 4,834 2,988 4,939
Reserve for Unexpired Risk 7,154 4,980 6,723
Capital infusion 0 600 4000
Investment book Equity 1,307 889 1,072 Debt 11,085 8,144 12,036 Total 12,392 9,033 13,107
COMPETITIVE STANDING – INDIAN GENERAL INSURANCE INDUSTRY As at 31 Aug 2008 As at 31 Aug 2007 As at 31 Mar 2008 Rank (Private General Insurance Industry)
# 3 # 3 # 3
Market Share (Private Sector Life Insurers)
15.1% 17.5% 17.3%
Overall Market Share 6.3% 6.9% 6.9% (Source: IRDA website)

Review report for six months ended September 30, 2008 20
SCALE OF OPERATIONS H1 FY09 H1 FY08 FY08 No of branches 200 85 200 No of intermediaries
Motor dealers 3,221 1,751 3,000 Agents 4,600 3,386 3,860
No of policies issued (millions) 1.3 1.7 3.7 No of policies in force (millions) 2.8 2.7 3.7 No of claims handled 211,650 144,643 321,820 SEGMENT WISE BREAK UP
• Premium contribution
As at Sept 30, 2008
As at Sept 30, 2007
As at Mar 31, 2008
Motor 55% 60% 65% Health 21% 16% 14% Fire 8% 9% 7% Engineering 5% 6% 5% Others 11% 10% 8% Total 100% 100% 100%

Review report for six months ended September 30, 2008 21
Discussion of financial performance
• Gross Written Premium for the six months ended September 30, 2008 was Rs 9.8 billion (US$ 231 million)as against Rs. 9.5 billion in the corresponding previous period, an increase of 4%. The pace of growth was deliberately slowed down in order to focus and improve profitability
• Net Written Premium for the six months ended September 30, 2008 was Rs 6.1 billion
(US$ 143 million)as against Rs. 3.7 billion in the corresponding previous period, an increase of 65%, translating to an improvement in the retention ratio from 39% to 62%
• Adequate measures have been implemented to restore profitability in general insurance.
Various areas have been identified where the claims experience was adverse and accordingly appropriate measures were taken to re-price the risk. As a result of this, the combined ratio has improved from 129% in FY08 to 110% for H1 FY08.

Review report for six months ended September 30, 2008 22
RELIANCE MONEY FINANCIAL PERFORMANCE
(Rs. Million)
H1 FY09 (Unaudited)
H1 FY08 FY08
Broking Income 892 204 1,112 Distribution Income 520 153 1,062 Others 302 182 211 Total Income 1,714 538 2,385
Sub brokerage 230 71 440 Personnel Costs 560 262 602 Other expenses 580 383 1,342
Profit before tax 344 (178) 1
Profit after tax 254 (178) 1
SCALE OF OPERATIONS
As at Sept 30, 2008
As at Sept 30, 2007
As at Mar 31, 2008
No. of touch points 20,750 6,700 15,000
No of outlets Franchisees 9,785 2,050 8,279 Owned 267 137 233 No. of Kiosks 2,400 110 2,450
No. of broking accounts 970,000 150,000 713,636
Total no. of customers 2,720,000 300,000 2,000,000
Daily average stock exchange turnover (Rs. Billion)
22 2 20

Review report for six months ended September 30, 2008 23
Discussion of financial performance
• Reliance Money generated revenues of Rs. 1.7 billion (US$ 40 million) for the six months ended September 30, 2008 as against Rs. 0.5 billion of the corresponding previous period, an increase of 337 %. This increase was primarily due to the aggressive expansion of the distribution network resulting in a 9-fold jump in its customer base
• The revenue mix is well balanced with broking contributing to 52% of the total revenues
and distribution of financial products & other services (money transfer, currency changing & precious metal retailing) contribute to the balance 48%
• It achieved a net profit of Rs. 254 million (US$ 6 million) for the six months ended
September 30, 2008, as against a loss of Rs. 178 million of the corresponding previous period. Reliance Money commenced full- fledged commercial operations only in April 2007 and within one year of its operations, it has emerged to be India’s largest broker and distributor of financial products and services

Review report for six months ended September 30, 2008 24
RELIANCE CONSUMER FINANCE LOAN BOOK DETAILS – AMOUNT OUTSTANDING
(Rs. Billion)
H1 FY09 % H1 FY08 % FY08 % Mortgages 30.7 32% 5.7 25% 20.6 29% Personal Loans 12.5 13% 4.3 19% 10.8 15% Commercial Vehicles 15.4 16% 2.3 10% 12.6 18% Auto Loans 18.6 20% 3.8 17% 13.5 19% SME Loans 17.9 19% 6.6 29% 13.7 19%
Total 95.1 100% 22.8 100% 71.2 100%
FINANCIAL PERFORMANCE
(Rs. Million)
H1 FY09 (Unaudited)
H1 FY08 FY08
Interest Income 5,480 417 3,371 Other Income 328 202 575
Total Income 5,808 619 3,946
Personnel Costs 511 163 629 Interest expenses 3,614 222 2,017 Other expenses 983 179 1,172 Provisions 490 - 69
Profit before tax 209 55 59
Note: The above P&L does not include the impact of allocation of equity funding Discussion of financial performance
• Reliance Consumer Finance generated revenues of Rs.5.8 billion (US$ 136 million) for the six months ended September 30, 2008, as against Rs. 0.6 billion for the corresponding previous period, an increase of 838%. This was due to increase in the loan book to Rs. 95.1 billion (US$ 2 billion) from Rs.22 billion as on September 30, 2007
• The Gross non-performing loans were Rs.887 million as on September 30, 2008
comprising 0.93% of the outstanding loan book. Provisions till date of Rs.559 million have been made against this, resulting in a coverage ratio of 63%.
• It achieved a profit of Rs. 209 million (US$ 5 million) for the six months ended September
30, 2008, as against Rs. 55 million of the corresponding previous period, an increase of 279%. This was largely due to decrease in the cost to income ratio from 83% to 63%
Review report for six months ended September 30, 2008 25
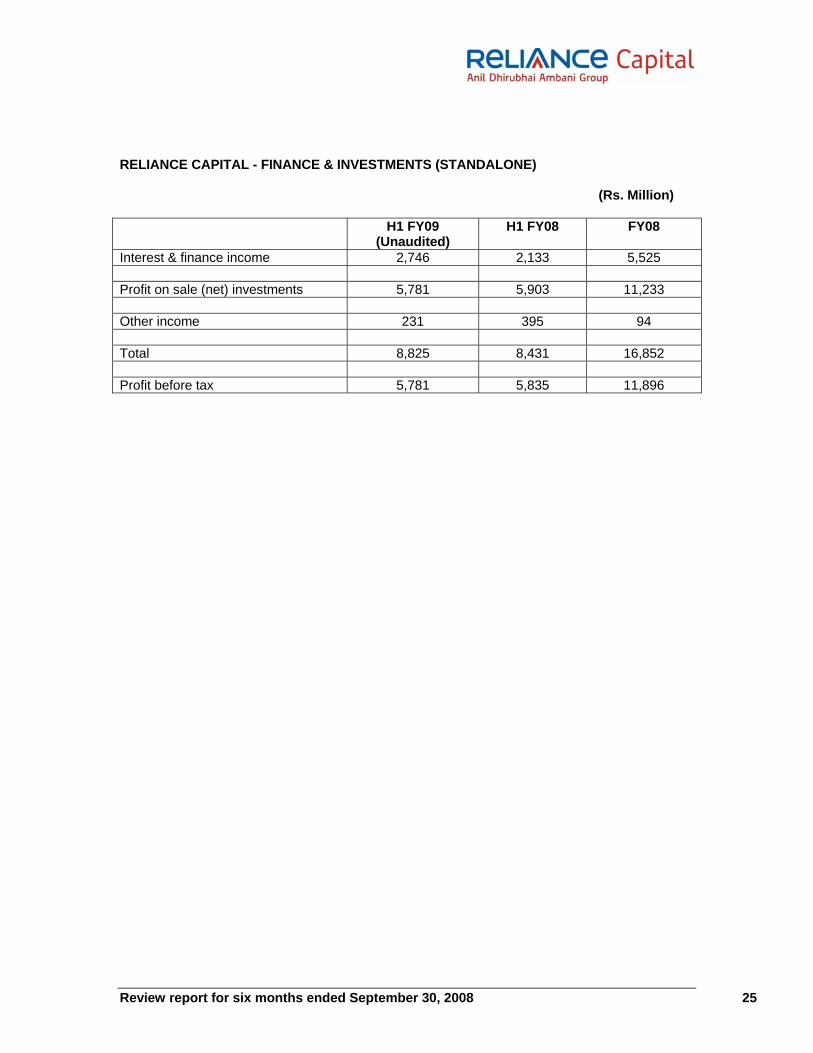
RELIANCE CAPITAL - FINANCE & INVESTMENTS (STANDALONE) (Rs. Million) H1 FY09
(Unaudited) H1 FY08 FY08
Interest & finance income 2,746 2,133 5,525 Profit on sale (net) investments 5,781 5,903 11,233 Other income 231 395 94 Total 8,825 8,431 16,852 Profit before tax 5,781 5,835 11,896

Review report for six months ended September 30, 2008 26
HUMAN RESOURCE ANALYSIS Employees on payroll:
As on Sept 30, 2008
As on Sept 30, 2007
Asset Management 1,178 786 General Insurance 2,519 2,307 Life Insurance 28,670 9,630 Reliance Money 2,968 1,000 Consumer Finance 1,372 672 Other Businesses 573 17 Reliance Capital 97 209
Total 37,377 14,621
• Average age of 29 years • Sales to Non Sales Employees ratio is 81:19 • Gender Diversity : 12% of the workforce are women
• Experience profile of payroll employees
Particulars No. of Employees % of Employees 0 - 02 Years 10,978 29% 02 - 05 Years 12,175 33% 06 - 10 Years 10,125 27% 10 - 15 Years 2,885 8%
More than 15 Years 1,214 3%
Total 37,377 100%
Review report for six months ended September 30, 2008 27
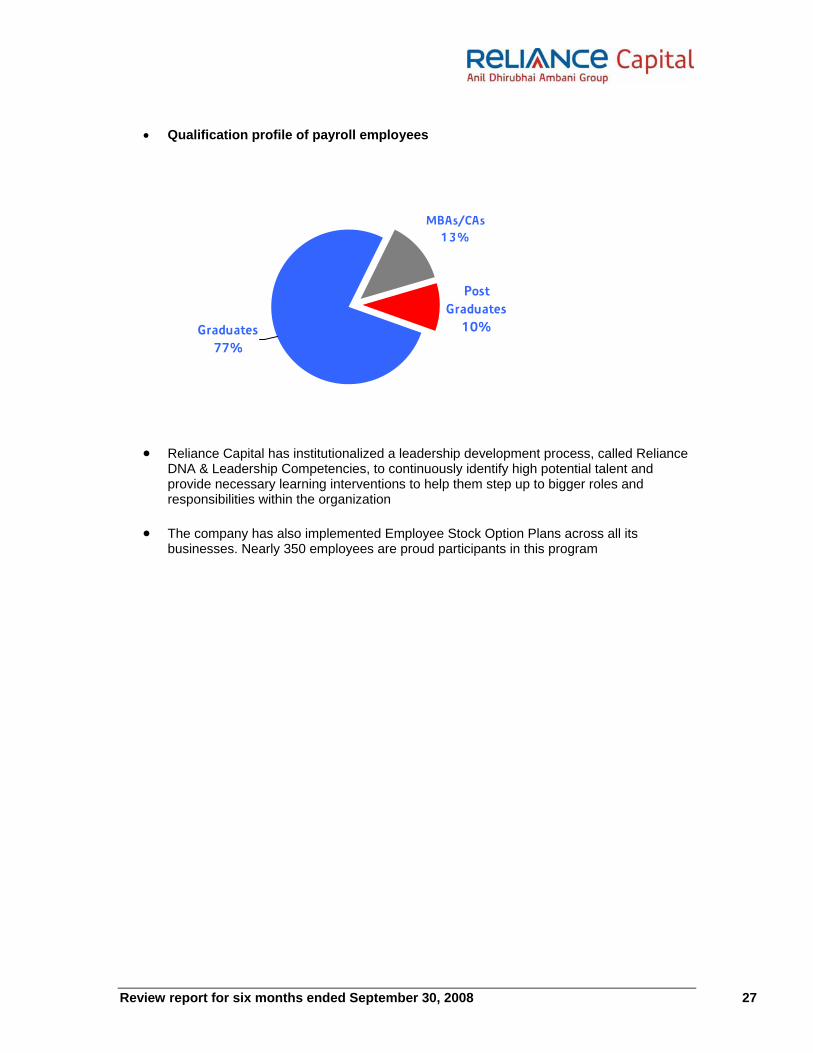
• Qualification profile of payroll employees
• Reliance Capital has institutionalized a leadership development process, called Reliance
DNA & Leadership Competencies, to continuously identify high potential talent and provide necessary learning interventions to help them step up to bigger roles and responsibilities within the organization
• The company has also implemented Employee Stock Option Plans across all its
businesses. Nearly 350 employees are proud participants in this program
Post Graduates
10%Graduates 77%
MBAs/CAs 13%
Review report for six months ended September 30, 2008 28
• SECTION 4 KEY INDUSTRY DEVELOPMENTS MUTUAL FUNDS
• During the period from September 2007 to September 2008, the AUM of the entire Indian mutual fund industry increased from Rs. 4.7 trillion to Rs. 5.3 trillion (US$ 113 billion), growth of 11%. (Source: AMFI website)
• As on March 31, 2008 there were a total number of 43 million investor’s accounts. Out of
a total of 43 million investors accounts in the mutual funds industry, 28 million i.e. 65% of the total investors accounts were in private sector mutual funds whereas the balance 15 million i.e. 35% investors accounts were with the public sector mutual funds
• During the period from September 2007 to September 2008, 4 new asset management
companies were given licenses to commence operations, taking the total number of mutual funds in India to 36. The industry is highly fragmented and the top 5 players account for 51% of the AUM
LIFE INSURANCE
• During the period from August 2007 to August 2008, the new business premium of the entire Indian life insurance fund industry decreased by 5%, from Rs. 279 billion to Rs. 265 billion (US$ 6 billion). (Source: IRDA website)
• During the period from August 2007 to August 2008, 4 new life insurance companies
were given licenses to commence operations, taking the total number of life insurance companies in India to 20. The industry is highly fragmented and the top 5 players account for 82% of the new business premium (April 2008 to August 2008)
GENERAL INSURANCE
• During the period from August 2007 to August 2008, the gross written premium of the entire Indian general insurance fund industry increased by 12%, from Rs. 118 billion to Rs. 132 billion (US$ 3 billion). (Source: IRDA website)
• During the period from August 2007 to August 2008, 3 new general insurance companies
were given licenses to commence operations, taking the total number of life insurance companies in India to 15. The industry is highly fragmented and the top 5 players account for 71% of the gross written premium (April 2008 to August 2008)
BROKING AND DISTRIBUTION
• During the period from April 2008 to September 2008, the total turnover on the Stock Exchange Mumbai (BSE), was Rs. 6,865 billion (US$ 161 billion) as compared to Rs. 7,393 billion in the corresponding previous period, a decrease of 7%. The total turnover on the National Stock Exchange (NSE) was Rs. 75,698 billion (US$ 1.8 trillion) as compared to Rs. 66,253 billion in the corresponding previous period, an increase of 14%

Review report for six months ended September 30, 2008 29
CONSUMER FINANCE
• In June 2008, RBI tightened the capital adequacy and disclosure norms for Non Banking Finance Companiesn (NBFCs) expressing concerns over their highly leveraged borrowings and reliance on short-term funds.Non-deposit taking NBFCs with asset size of Rs.1 billion and above will have to maintain capital to risk weighted assets ratio (CRAR) of 12% compared to 10 % required earlier, which would be subsequently increased to 15% from April 2009.In case of difficulties in meeting CRAR requirements, RBI will look into individual representations by NBFCs and approve reasonable transition plans
• RBI has also extended the system of half yearly reporting to systemically important non-
deposit taking NBFCs which until now this was only applicable only to deposit taking NBFCs. They will also have to make additional disclosures in their balance sheets from the year ending March 31, 2009 relating to CRAR, risk exposure to derivatives, exposure to real sector and maturity pattern of assets and liabilities
• RBI reduced the reserve requirements through a cut in CRR and SLR by 150 bps to 7.5%
and 100 to 24% bps respectively. This cut was purely aimed at easing the liquidity pressures in the financial markets

Review report for six months ended September 30, 2008 30
• SECTION 5 STOCK MARKET HIGHLIGHTS General information Shareholding and Financial data as on September 30, 2008
Code/ Exchange 500111/ BSE RELCAPITAL/ NSE
Bloomberg/ Reuters RCFT / RLCP.NS No of share outstanding (Sep.30, 2008) 245,732,800 Closing market price (Rs.) (Sept 30, 2008) 1,142.65 Combined volume (NSE & BSE) (for the quarter) (No. in million/ day)
5.5
Combined value (NSE & BSE) (for the quarter) (Rs. billion / day)
21.7
F& O volume (NSE – for the quarter) (No. in million/ day)
11.5
F& O value (NSE – for the quarter) (Rs. in billion/ day)
13.6
Weightage of Reliance Capital in indices: Junior Nifty MSCI
7.3% 1.7%
Stock Beta (for the quarter) 1.8 Market capitalization (Rs bn) 280.7 Market capitalization (US$ bn) 6.0 Book value per equity share (Rs.) 287.8 Summarized shareholding pattern as of September 30, 2008 Category No of shares Shareholding % Reliance Dhirubhai Ambani Group 13,13,82,274 53.49% Foreign investors – FIIs, GDRs, NRIs, and others
6,21,72,979 25.31%
Domestic institutions/ Banks / Mutual funds 86,29,659 3.51% Indian public 4,34,47,888 17.69% Total 24,56,32,800 100.00%

Review report for six months ended September 30, 2008 31
Reliance Capital daily stock price (BSE) & volume (combined of BSE & NSE) movement
Comparison of Reliance Capital stock movement with peer groups
40
50
60
70
80
90
100
110
120
Apr-
08
Apr-
08
Apr-
08
May
-08
May
-08
Jun-
08
Jun-
08
Jul-
08
Jul-
08
Aug-
08
Aug-
08
Sep-
08
Sep-
08
Sep-
08
Sensex RCap ICICI Bank HDFC HDFC Bank Kotak IDFC