review - university of marylandterpconnect.umd.edu/~yakovenk/papers/2016.moteshar... · review...
TRANSCRIPT

REVIEW National Science Review3: 470–494, 2016
doi: 10.1093/nsr/nww081Advance access publication 11 December 2016
MULTIDISCIPLINARY
Modeling sustainability: population, inequality,consumption, and bidirectional coupling of the Earthand Human SystemsSafa Motesharrei1,∗,†, Jorge Rivas2,†, Eugenia Kalnay1,†, Ghassem R. Asrar3,Antonio J. Busalacchi4, Robert F. Cahalan5,6, Mark A. Cane7,Rita R. Colwell1, Kuishuang Feng1, Rachel S. Franklin8, Klaus Hubacek1,Fernando Miralles-Wilhelm1,3, Takemasa Miyoshi1,9, Matthias Ruth10,Roald Sagdeev1, Adel Shirmohammadi1, Jagadish Shukla11, Jelena Srebric1,Victor M. Yakovenko1, and Ning Zeng1
1University ofMaryland, CollegePark, MD 20742, USA;2Institute for GlobalEnvironment andSociety, Rockville, MD20852, USA; 3JointGlobal ChangeResearch Institute,College Park, MD20740, USA;4University Corporationfor AtmosphericResearch, Boulder, CO80307, USA; 5JohnsHopkins UniversityApplied PhysicsLaboratory, Laurel, MD20723, USA; 6NASAGoddard Space FlightCenter, Greenbelt,MD 20771, USA;7Lamont–DohertyEarth Observatory ofColumbia University,Palisades, NY 10964,USA; 8SpatialStructures in the SocialSciences / PopulationStudies and TrainingCenter, BrownUniversity, Providence,RI 02912, USA; 9RIKENAdvanced Institute forComputationalScience, Kobe650-0047, Japan;10School of PublicPolicy and UrbanAffairs, andDepartment of Civiland EnvironmentalEngineering,NortheasternUniversity, Boston,MA 02115, USA; and11Department ofAtmospheric, Oceanic,and Earth Sciences,George MasonUniversity, Fairfax,VA 22030, USA
†Equally contributed tothis work.∗Correspondingauthor. E-mail:[email protected]
Received 7 July 2016;Revised 7 October2016; Accepted 23October 2016
ABSTRACTOver the last two centuries, the impact of the Human System has grown dramatically, becoming stronglydominant within the Earth System in many different ways. Consumption, inequality, and population haveincreased extremely fast, especially since about 1950, threatening to overwhelm the many critical functionsand ecosystems of the Earth System. Changes in the Earth System, in turn, have important feedback effectson the Human System, with costly and potentially serious consequences. However, current models do notincorporate these critical feedbacks. We argue that in order to understand the dynamics of either system,Earth SystemModels must be coupled with Human SystemModels through bidirectional couplingsrepresenting the positive, negative, and delayed feedbacks that exist in the real systems. In particular, keyHuman System variables, such as demographics, inequality, economic growth, and migration, are notcoupled with the Earth System but are instead driven by exogenous estimates, such as United Nationspopulation projections.This makes current models likely to miss important feedbacks in the realEarth–Human system, especially those that may result in unexpected or counterintuitive outcomes, andthus requiring different policy interventions from current models.The importance and imminence ofsustainability challenges, the dominant role of the Human System in the Earth System, and the essentialroles the Earth System plays for the Human System, all call for collaboration of natural scientists, socialscientists, and engineers in multidisciplinary research and modeling to develop coupled Earth–Humansystemmodels for devising effective science-based policies and measures to benefit current and futuregenerations.
Keywords: Earth and Human SystemModels, population, migration, inequality, data assimilation,bidirectional couplings and feedbacks, sustainability
SIGNIFICANCE STATEMENTTheHuman System has become strongly dominantwithin the Earth System in many different ways.However, in current models that explore the fu-ture of humanity and environment, and guide policy,key Human System variables, such as demograph-ics, inequality, economic growth, and migration, are
not coupled with the Earth System but are insteaddriven by exogenous estimates such as United Na-tions (UN) population projections. This makes themodels likely tomiss important feedbacks in the realEarth–Human system that may result in unexpectedoutcomes requiring very different policy interven-tions. The importance of humanity’s sustainabil-ity challenges calls for collaboration of natural and
C©TheAuthor(s) 2016. Published byOxfordUniversity Press on behalf of China Science Publishing&Media Ltd.This is anOpen Access article distributed under the terms of the CreativeCommons Attribution License (http://creativecommons.org/licenses/by/4.0/), which permits unrestricted reuse, distribution, and reproduction in any medium, provided the originalwork is properly cited.
REVIEW Motesharrei et al. 471
social scientists to develop coupled Earth–Humansystem models for devising effective science-basedpolicies and measures.
HIGHLIGHTS(1)The Human System has become strongly domi-nantwithin theEarth System inmanydifferentways.
(a) Consumption, inequality, and populationhave increased extremely fast, especially since∼1950.
(b)Thecollective impact of these changes threat-ens to overwhelm the viability of natural systems andthe many critical functions that the Earth Systemprovides.(2) Changes in the Earth System, in turn, have im-portant feedback effects on theHuman System, withcostly and serious consequences.(3)However, currentmodels, such as the IntegratedAssessment Models (IAMs), that explore the futureof humanity and environment, and guide policy, donot incorporate these critical feedbacks.
(a) Key Human System variables, such as demo-graphics, inequality, economic growth, and migra-tion, are instead driven by exogenous projections,such as the UN population tables.
(b) Furthermore, such projections are shown tobe unreliable.(4) Unless models incorporate such two-way cou-plings, they are likely to miss important dynamicsin the real Earth–Human system that may result inunexpected outcomes requiring very different policyinterventions.(5) Therefore, Earth System Models (ESMs) mustbe bidirectionally coupled with Human SystemModels.
(a) Critical challenges to sustainability callfor a strong collaboration of both earth andsocial scientists to develop coupled Earth–HumanSystem models for devising effective science-basedpolicies and measures.
(b)We suggest usingDynamicModeling, Input–Output (IO)models, andDataAssimilation to buildand calibrate such coupled models.
DESCRIPTION OF SECTIONSThe First Section, entitled ‘Dominance of the Hu-man Systemwithin the Earth System’, describesma-jor changes in the relationship between the EarthSystemand theHumanSystem, andkeyHumanSys-tem factors driving these changes.
The Second Section, entitled ‘Inequality, con-sumption, demographics, andother keyHumanSys-tem properties: projections vs. bidirectional cou-pling’, provides examples of fundamental problemsin the exogenous projections of key Human Systemfactors used in current models.
The Third Section, entitled ‘Human Systemthreatens to overwhelm the Carrying Capacity andecosystem services of Earth System’, describes ex-amples of changes in the Earth System that may im-pact the Human System seriously, as well as missingfeedbacks from the Earth System onto the HumanSystem.
The Fourth Section, entitled ‘Bidirectional cou-pling of Human System and Earth System Modelsis needed. Proposed methodology: Dynamic Mod-eling, Input–Output models, Data Assimilation’, ar-gues for the need to bidirectionally couple both sys-tems in order to model the future of either systemmore realistically, andproposes practicalmethods toimplement this coupling.
DOMINANCE OF THE HUMAN SYSTEMWITHIN THE EARTH SYSTEMHumans impact the Earth System by extracting re-sources and returningwaste and pollution to the sys-tem, and simultaneously altering land cover, frag-menting ecosystems, and reducing biodiversity.1
The level of this impact is determined by extrac-tion and pollution rates, which in turn, are deter-mined by the total consumption rate. Total con-sumption equals population multiplied by averageconsumption per capita, both of which are recog-nized as primary drivers of human environmentalimpact.2
1 Planet Earth has been the habitat of humans for hundreds of thousandsof years. Human life depends on the resources provided by the EarthSystem: air from the Earth’s atmosphere; water from the atmosphereand rivers, lakes, and aquifers; fruits from trees;meat and other productsfrom animals; and over the past 10,000 years, land for agriculture, andmetals and other minerals from the Earth’s crust. Until about 200 yearsago, we used renewable biomass as the major source of materials andenergy, but over the course of the past two centuries, we have insteadbecome heavily dependent on fossil fuels (coal, oil, and natural gas)and other minerals for both materials and energy. These nonrenewableresources made possible both of the revolutions which drove the thegrowth in consumption per capita and population: the Industrial Rev-olution and the Green Revolution. Our relationship with our planet isnot limited to consuming its resources. Waste is an inevitable outcomeof any production process; what is produced must return to the EarthSystem in some form.Wastewater goes back to the streams, rivers, lakes,oceans, or into the ground; greenhouse and toxic gases go into the atmo-sphere, land, and oceans; and trash goes into landfills and almost every-where else.
2 Using gross domestic product (GDP) per capita as a rough measure ofconsumption per capita, the extent of the impact of the Human Systemon the Earth System can be estimated from the total population and theaverage consumption per capita.This can be also seen from the definingequation for GDP per capita, i.e., GDP per capita = GDP/Population.Onemay rewrite this equation asGDP=Population×GDPper capita.By taking variations, we get:
δGDPGDP = δPopulation
Population + δGDP per capitaGDP per capita
This equation simply means that the relative change in the total GDP iscomprised of two components, i.e., the relative changes in populationand GDP per capita. A graphical demonstration of this decompositioncan be seen in the inset of Fig. 1. Data from [229], with updates from theMaddisonProject, 2013(for theunderlyingmethodologyof theupdatessee [228]). Population data for the inset from [230].
472 Natl Sci Rev, 2016, Vol. 3, No. 4 REVIEW
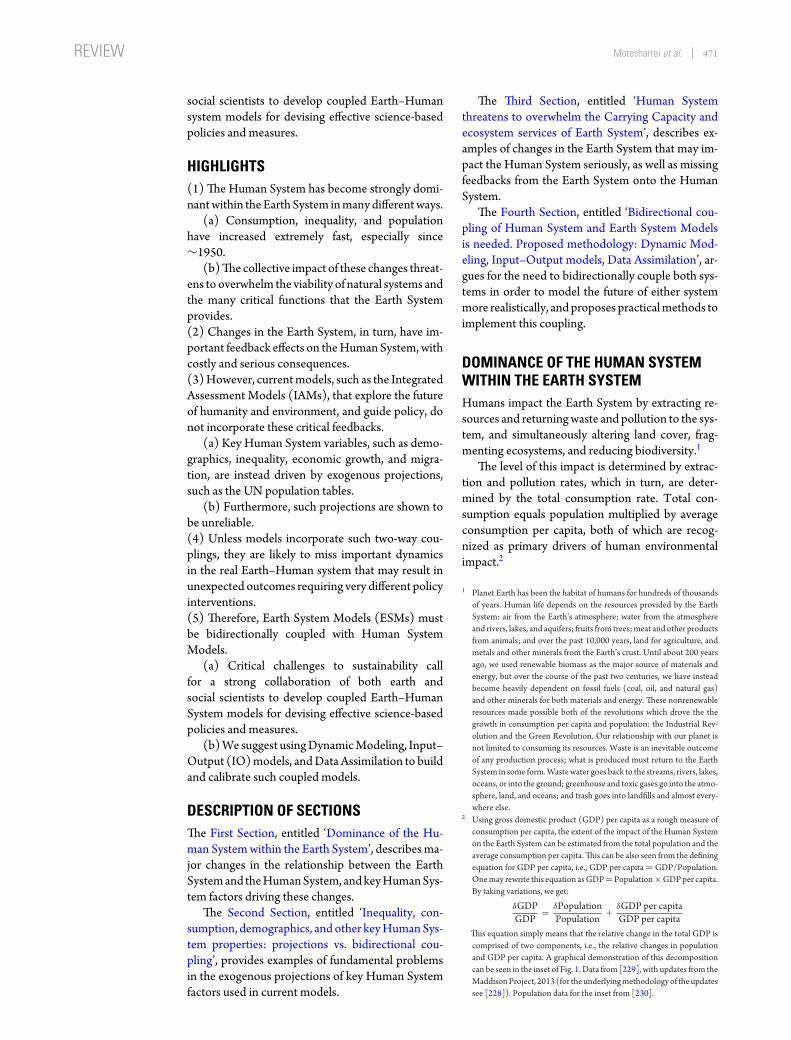
Population and GDP per capita (in the main graph) from year 1 to 2010 AD. The total human impact is their product.
Inset: Annual Growth of Total Consumption (Total GDP)from 1950 to 2010 as the sum of contributions fromPopulation Growth and GDP per capita Growth.
Figure 1.World population and GDP per capita from year 1 to 2010 AD. The total human impact is their product. The insetshows the relative annual change of each between 1950 and 2010 [228–230]. Their averages were 1.69% and 2.21%, respec-tively, out of a total of ∼4% (average annual change in GDP). Therefore, growth in population and consumption per capitahave both played comparably important roles in the remarkable increase of human impact on planet Earth. This ∼4% totalgrowth corresponds to doubling the total impact every ∼17 years. Note that the contribution from population growth hasbeen relatively steady, while the contribution from the relative change in GDP per capita has been much more variable fromyear to year (even negative for some years). See Footnote 2 for a description of the mathematical formula used to generatethe inset and sources of data.
The rapid expansion of the Human System hasbeen a remarkably recent phenomenon (see Fig. 1).For over 90% of human existence, world popula-tion remained less than 5 million. After the Agri-cultural Revolution, it still took ∼10,000 years toreach 1 billion, around the year 1800. About a cen-tury later, the second billion was reached, around1930. Thereafter, in less than a century, 5 billionmore humans were added (within a single humanlifetime). The peak in the rate of growth occurred
in the 1960s, but because of the larger total pop-ulation, the peak in absolute growth has persistedsince the early 1990s [1]. To go from 5 to 6 bil-lion took ∼12 years (1987–1999), and from 6 to 7billion also took ∼12 years (1999–2011). The de-cline in the rate of growth over the past few decadeshas not significantly reduced the absolute numbercurrently added every year, ∼80 million (e.g., 83million in 2016), equivalent to the population ofGermany [2,3].

REVIEW Motesharrei et al. 473
A similar pattern holds for GDP per capita, butwith the acceleration of growth occurring evenmorerecently (see Fig. 1) and with the distribution ofconsumption becoming much more unequal. Thus,until the last century, population andGDPper capitawere low enough that the Human System remaineda relatively small component of the Earth System.However, both population and GDP per capita ex-perienced explosive growth, especially after ∼1950,and the product of these two growths—total humanimpact—has grown from relatively small to domi-nant in the Earth System.
Contrary to popular belief, these trends still con-tinue for both population and consumption percapita. The world is projected to add a billion peo-ple every 13–15 years for decades to come.The cur-rent UN medium estimate expects 11.2 billion peo-ple by 2100, while the high estimate is 16.6 billion.3
Similarly, while the highest rates of growth of globalper capita GDP took place in the 1960s, they are notprojected to decline significantly from their currentrates (so that estimates of annual global growth until2040 range from 3.3% (IMF and IEA) to 3.8% (USEIA), implying a doubling time of∼20 years).4
Two major factors enabled this demographic ex-plosion. First, advances in public health, sanitation,and medicine significantly reduced mortality ratesand lengthened average lifespan. Second, the rapidand large-scale exploitationof fossil fuels [4]—avaststock of nonrenewable resources accumulated byNature over hundreds of millions of years that arebeing drawn down in just a few centuries—and theinvention of theHaber–Bosch process to use naturalgas to produce nitrogen fertilizer [5,6] enabled in-creasingly higher levels of food and energy produc-tion. All these factors allowed for this fast growth ofthe Human System [7,8].5
Technological advances also allowed for therapid increase in consumption per capita (seeFig. 1). This increase was made possible by adramatic expansion in the scale of resource extrac-
3 In fact, the UN’s 2015 Population Revision has already raised the globaltotal in 2100 by 360 million to 11.2 billion just from the last estimatepublished in 2013 [1].
4 While there has been some reduction of the energy intensity and emis-sions intensity of economic growth in wealthy countries, one has to becautious about extrapolating recent improvements, as small as theymaybe, because these improvements have been at least partly due to the out-sourcing of energy-intensive sectors to poorer countries [122–130,231–233], and because there are basic physical limits to further efficiency im-provements, especially in the use of water, energy, food, and other natu-ral resources [113,114,234–236].
5 For example, between 1950 and 1984, the production of grains in-creased by 250% due to the use of fossil fuels for fertilization, mecha-nization, irrigation, herbicides, and pesticides [237]. These technologi-cal advances, together with the development of new seed varieties, arereferred to as the ‘Green Revolution’ that allowed global population todouble in that period [238].
tion, which, by providing a very large increase inthe use of inputs, greatly increased production, con-sumption, throughput, and waste. During the fos-sil fuel era, per capita global primary energy andper capita global materials consumption have sig-nificantly increased over time. Despite tremendousadvances in technological efficiencies, world energyuse has increased for coal, oil, gas, and electricitysince 1900, and global fossil fuel use per capita hascontinued to rise over the last few decades. Thereis no empirical evidence of reduction in use percapita, nor has there been an abandonment or long-term decline of one category through substitutionby another. The same applies to global per capitause of materials for each of the major materials cate-gories ofminerals—industrial, construction,materi-als for ores, and materials derived from fossil energycarriers.6
The rapidly growing size and influence of theHu-man System has come to dominate the Earth Sys-tem in many different ways [9–12]. Estimates of theglobal net primary production (of vegetation) ap-propriated by humans range as high as 55%, and thepercentage impacted, not just appropriated, is muchlarger [13–23]. Human activity has also had a netnegative effect on total global photosynthetic pro-ductivity since the most productive areas of land aredirectly in the path of urban sprawl [24]. Humanuse of biomass for food, feed, fiber, fuel, and mate-rials has become a primary component of global bio-geochemical cycles of carbon, nitrogen, phospho-rous, and other nutrients. Land use for biomass pro-duction is one of the most important stressors onbiodiversity, while total biomass use has continuedto grow and demand is expected to continue grow-ing over the next few decades [25]. Global food de-mand alone has been projected to double or morefrom 2000 to 2050 due to both rising populationand rising incomes [26]. Most agriculturally usableland has already been converted to agriculture [27].Most large mammals are now domesticated ani-mals [28,29]. Soils worldwide are being eroded, fish-eries exhausted, forests denuded, and aquifers drawndown, while desertification due to overgrazing, de-forestation, and soil erosion is spreading [30–33].Deforestation, in turn, affects local climate throughevapotranspiration and albedo [34,35]. Since cli-mate change is expected tomake subtropical regionsdrier, desertification is expected to further increase,
6 Thus, while the rate of materials intensity of GDP growth has declined(very slowly: 2.5 kg/$ in 1950, 1.4 kg/$ in 2010), the per capita ratecontinues to increase. The only materials category whose per capita usehas remained relatively stable is biomass [4,132], probably reflecting thephysical limits of the planet’s regenerating natural resources to continueto provide humans with ever-growing quantities of biomass [239,240].(See [134] for a conceptual model of regenerating natural resources.)
474 Natl Sci Rev, 2016, Vol. 3, No. 4 REVIEW
especially due to bidirectional albedo–vegetationfeedback [22].
At the same time, greenhouse gases (GHGs)from fossil fuels, together with land-use change,have become the major drivers of global climatechange [10,36,37]. Atmospheric levels of carbondioxide, methane, and nitrous oxide not only ex-ceed pre-industrial concentrations by∼40%, 150%,and 20%, respectively, they are now substantiallyabove their maximum ranges of fluctuation over thepast 800,000 years7 [36] while total carbon diox-ide emissions continue to grow at a rapid rate [38].Arctic sea ice, Antarctic and Greenland ice sheets,global glacier mass, permafrost area, and NorthernHemisphere snow cover are all decreasing substan-tially, while ocean surface temperatures, sea level,and ocean acidification are rising [36]. Arctic sea iceis decreasing at an average rate of 3.0 ± 0.3 m2 permetric tonofCO2 emissions and at the current emis-sions rate of 35 gigaton per year could completelydisappear by 2050 during Septembers [39].The rateof ocean acidification, in particular, is currently esti-mated to be at least 100 times faster than at any othertime in the last 20 million years [12].
The Human System dominates the global nitro-gen cycle, having produced a 20% rise in nitrous ox-ide (N2O) in the atmosphere, now the third largestcontributor to global warming, and a tripling of am-monia (NH3) in the atmosphere due to humanactivities [40]. In total, human processes producemore reactive nitrogen than all natural processescombined [12,41–45], altering the global nitrogencycle so fundamentally that Canfield et al. [41] es-timate the closest geological comparison occurred∼2.5billionyears ago.Nitrogenandphosphorus fer-tilizer runoff, along with nitrogen oxides from fossil-fuel combustion (which is then deposited by rainover land and water) are causing widespread eu-trophication in rivers, lakes, estuaries, and coastaloceans, and creating massive Dead Zones with lit-tle or no oxygen, which are increasing in numberand size in coastal waters and oceans globally, killinglarge swaths of sea life and damaging or destroyingfisheries. This may be compounded further by po-tentially dangerous positive feedbacks between hy-poxia, ocean acidification, and rising sea tempera-tures [12,41,46–52].
Human activities also dominate many regionalhydrological cycles [53–60], with more than half ofall accessible surface freshwater being used by hu-mans, to such an extent that some major rivers arebeing so excessively depleted that they sometimesno longer reach the sea, while some major inlandfresh and saltywater bodies, such asLakeChad,Lake
7 In some estimates, as much as 10–15 million years for carbon [241].
Urmia, Lake Poopo, and Aral Sea, are drying up.In many of the principal aquifers that support theworld’s agricultural regions and in most of the ma-jor aquifers in the world’s arid and semi-arid zones,groundwater extraction is occurring at far greaterrates than natural recharge.This includes aquifers inthe US High Plains and Central Valley, the NorthChina Plain, Australia’s Canning Basin, the North-west Sahara Aquifer System, the Guarani Aquiferin South America, and the aquifers beneath muchof the Middle East and northwestern India [61–68]. Climate change can increase the frequency andseverity of extreme weather events, such as hot andcold temperature extremes, heat waves, droughts,heavy precipitation, tropical cyclones, and storms[69–74]. In addition, more impervious surfaces to-gether with other land cover changes increase runoffsignificantly, hence intensifying the adverse impactsof extreme hydrological events [75–77].
Many other socioeconomic trends and their im-pacts on the Earth System have accelerated syn-chronously since the 1950s with little sign of abate-ment [78,79]. For example, human processes playa major role in virtually every major metal cycle,leading to atmospheric and direct contamination ofterrestrial and aquatic environments by trace-metalpollutants. Coal combustion is the major source ofatmospheric Cr, Hg, Mn, Sb, Se, Sn, and Tl emis-sions, oil combustion of Ni and V, and gasolinecombustion of Pb, while nonferrous metal produc-tion is the largest source of As, Cd, Cu, In, andZn [80]. Surface mining has also become a dom-inant driver of land-use change and water pollu-tion in certain regions of the world, where moun-taintop removal, coal and tar sands exploitation,and other open pit mining methods strip land sur-faces of forests and topsoils, produce vast quan-tities of toxic sludge and solid waste, and oftenfill valleys, rivers, and streams with the resultingwaste and debris [81]. All of these trends can havean impact on other species, and while the exactcauses are difficult to establish, current animal andplant species extinction rates are estimated to be atleast 100 times the natural background rate [33,82–84]. Furthermore, ecosystems worldwide are ex-periencing escalating degradation and fragmenta-tion, altering their health and provision of importantecosystem functions and services for humans andother species.8
8 Rates of deforestation and agricultural expansion have acceleratedin recent years with extensive new infrastructure providing con-duits for settlement, exploitation, and development. Even within theremaining habitat, fragmentation is causing rapid species loss or alter-ation, and is producing major impacts on biodiversity, regional hydrol-ogy, and global climate, in particular in tropical forests, which con-tain over half of Earth’s biodiversity and are an important driver in the
REVIEW Motesharrei et al. 475
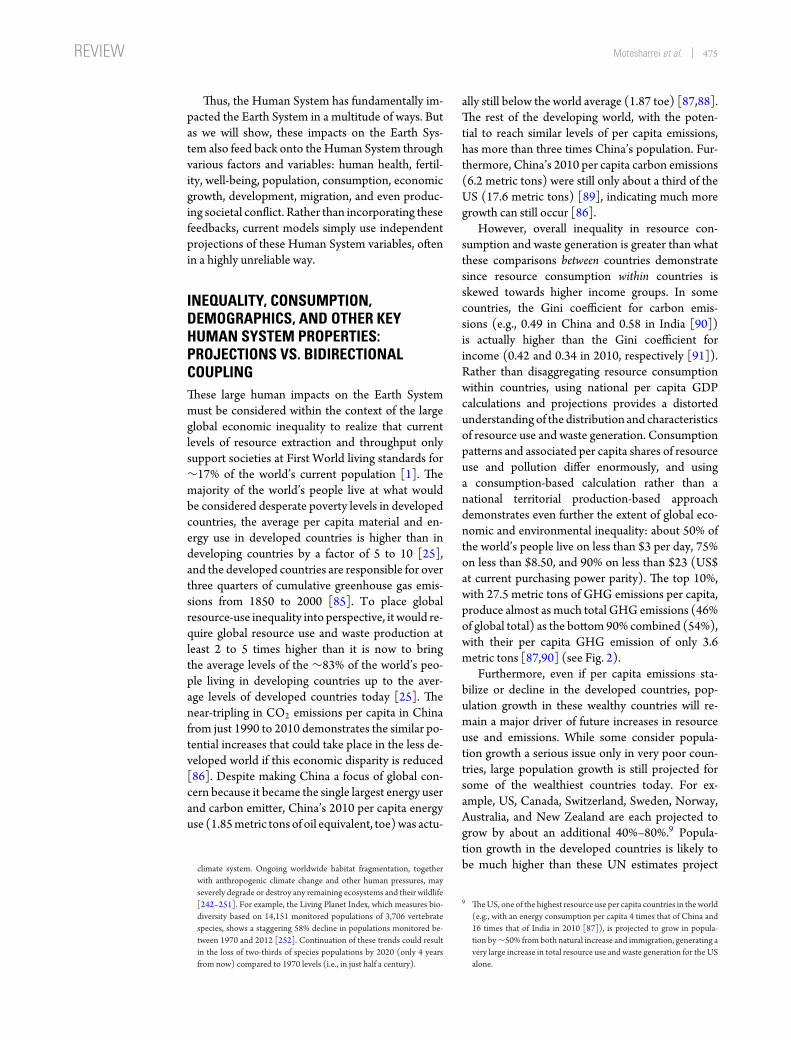
Thus, the Human System has fundamentally im-pacted the Earth System in a multitude of ways. Butas we will show, these impacts on the Earth Sys-tem also feed back onto theHuman System throughvarious factors and variables: human health, fertil-ity, well-being, population, consumption, economicgrowth, development, migration, and even produc-ing societal conflict. Rather than incorporating thesefeedbacks, current models simply use independentprojections of these Human System variables, oftenin a highly unreliable way.
INEQUALITY, CONSUMPTION,DEMOGRAPHICS, AND OTHER KEYHUMAN SYSTEM PROPERTIES:PROJECTIONS VS. BIDIRECTIONALCOUPLINGThese large human impacts on the Earth Systemmust be considered within the context of the largeglobal economic inequality to realize that currentlevels of resource extraction and throughput onlysupport societies at First World living standards for∼17% of the world’s current population [1]. Themajority of the world’s people live at what wouldbe considered desperate poverty levels in developedcountries, the average per capita material and en-ergy use in developed countries is higher than indeveloping countries by a factor of 5 to 10 [25],and the developed countries are responsible for overthree quarters of cumulative greenhouse gas emis-sions from 1850 to 2000 [85]. To place globalresource-use inequality into perspective, it would re-quire global resource use and waste production atleast 2 to 5 times higher than it is now to bringthe average levels of the ∼83% of the world’s peo-ple living in developing countries up to the aver-age levels of developed countries today [25]. Thenear-tripling in CO2 emissions per capita in Chinafrom just 1990 to 2010 demonstrates the similar po-tential increases that could take place in the less de-veloped world if this economic disparity is reduced[86]. Despite making China a focus of global con-cern because it became the single largest energy userand carbon emitter, China’s 2010 per capita energyuse (1.85metric tons of oil equivalent, toe)was actu-
climate system. Ongoing worldwide habitat fragmentation, togetherwith anthropogenic climate change and other human pressures, mayseverely degrade or destroy any remaining ecosystems and their wildlife[242–251]. For example, the Living Planet Index, which measures bio-diversity based on 14,151 monitored populations of 3,706 vertebratespecies, shows a staggering 58% decline in populations monitored be-tween 1970 and 2012 [252]. Continuation of these trends could resultin the loss of two-thirds of species populations by 2020 (only 4 yearsfrom now) compared to 1970 levels (i.e., in just half a century).
ally still below the world average (1.87 toe) [87,88].The rest of the developing world, with the poten-tial to reach similar levels of per capita emissions,has more than three times China’s population. Fur-thermore, China’s 2010 per capita carbon emissions(6.2 metric tons) were still only about a third of theUS (17.6 metric tons) [89], indicating much moregrowth can still occur [86].
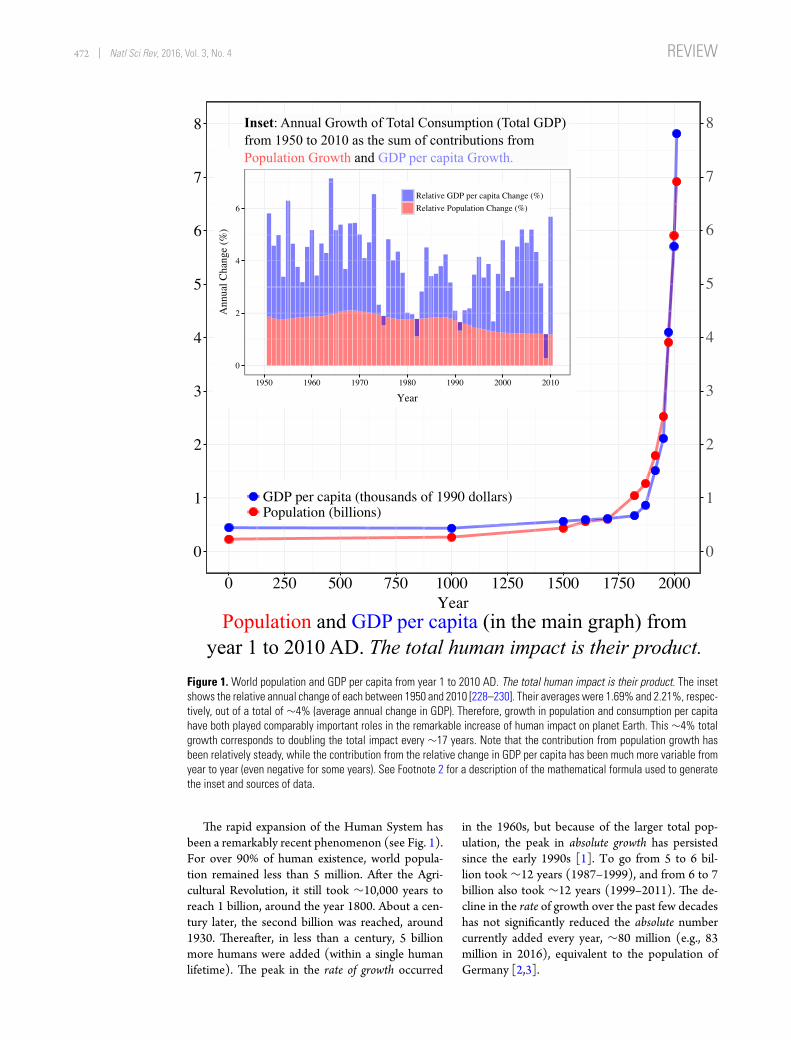
However, overall inequality in resource con-sumption and waste generation is greater than whatthese comparisons between countries demonstratesince resource consumption within countries isskewed towards higher income groups. In somecountries, the Gini coefficient for carbon emis-sions (e.g., 0.49 in China and 0.58 in India [90])is actually higher than the Gini coefficient forincome (0.42 and 0.34 in 2010, respectively [91]).Rather than disaggregating resource consumptionwithin countries, using national per capita GDPcalculations and projections provides a distortedunderstanding of the distribution and characteristicsof resource use and waste generation. Consumptionpatterns and associated per capita shares of resourceuse and pollution differ enormously, and usinga consumption-based calculation rather than anational territorial production-based approachdemonstrates even further the extent of global eco-nomic and environmental inequality: about 50% ofthe world’s people live on less than $3 per day, 75%on less than $8.50, and 90% on less than $23 (US$at current purchasing power parity). The top 10%,with 27.5 metric tons of GHG emissions per capita,produce almost as much total GHG emissions (46%of global total) as the bottom90% combined (54%),with their per capita GHG emission of only 3.6metric tons [87,90] (see Fig. 2).
Furthermore, even if per capita emissions sta-bilize or decline in the developed countries, pop-ulation growth in these wealthy countries will re-main a major driver of future increases in resourceuse and emissions. While some consider popula-tion growth a serious issue only in very poor coun-tries, large population growth is still projected forsome of the wealthiest countries today. For ex-ample, US, Canada, Switzerland, Sweden, Norway,Australia, and New Zealand are each projected togrow by about an additional 40%–80%.9 Popula-tion growth in the developed countries is likely tobe much higher than these UN estimates project
9 TheUS, one of the highest resource use per capita countries in theworld(e.g., with an energy consumption per capita 4 times that of China and16 times that of India in 2010 [87]), is projected to grow in popula-tion by∼50% from both natural increase and immigration, generating avery large increase in total resource use and waste generation for the USalone.

476 Natl Sci Rev, 2016, Vol. 3, No. 4 REVIEW
90%
54%
10%
46%
0%
10%
20%
30%
40%
50%
60%
70%
80%
90%
100%
Population (by Income)
Total GHG Emissions
Top 10% of World Population by Income (above $23/day) Bottom 90% of World Population by Income (below $23/day)
3.6 Tons
27.5 Tons
0
5
10
15
20
25
Greenhouse Gas (GHG) Emissions per Capita
An Example of Global Inequality in Resource Use:
Resource use by the wealthiest 10% of world population produces almost as much GHG emissions as the bottom 90%. To raise everyone to the average standard of living of those earning >$23/day would require ~5 times total GHG emissions.
Figure 2. Global inequality in greenhouse gas emissions.
because these estimates include arbitrary projec-tions of very low future immigration from less devel-oped countries.10 A model that uses these UN pop-
10 For example, while Africa’s population is projected to rise over 6-foldfrom 366 million in 1970 to 2.4 billion in 2050, the UN’s projection ofannual net emigration from Africa remains about constant until 2050,at ∼500,000, similar to the average from 1970 to 2000, thus the pro-jected percentage emigrating declines sharply. (For comparison, be-tween 1898 and 1914, ∼500,000 people emigrated each year just fromItaly alone, when its population was only 30–35 million.) Then, from2050 to 2100, the annual net emigration is arbitrarily projected tosmoothly decline to zero, even as Africa’s projected population contin-ues rising to over 4 billion [3]. However, recent international migrationhas increased on average with global population [253] and net migra-tion to thedeveloped countries has increased steadily from1960 to2010[3] and more explosively recently. Thus, the UN projection of emigra-tion seems unrealistically low, both relative to its increasing populationand in the context of a rapidly aging, and supposedly shrinking, popula-tion in the developed countries, as well as recentmigration pattern alter-ations following conflicts and associated social disruptions. The UnitedNations High Commissioner on Refugees estimates that by the end of2015, a total of 65.3 million people in the world were forcibly displaced,increasing at a rate of ∼34,000 people per day. There are 21.3 millionrefugees worldwide, with more than half from Afghanistan, Syria, andSomalia [254]. Yet, this figure only reflects refugees due to persecutionand conflict but does not include refugees as a result of climate change,famines, and sea level rise. Netmigration in 2015 toGermany alone was1.1 million [255].The UN’s 2012 projections of migration for other re-gions are similarly arbitrary and unrealistic. Net annual emigration fromLatin America is projected to decline from nearly 1.2 million in 2000–2010 to∼500,000by2050, and thendecline to zeroby2100.Net annualimmigration to Europe rose from 41,000 in 1960–1970 to almost 2 mil-lion in 2000–2010, and explosively today due to increasing social strife,
ulation projections incorporates these arbitrary andunrealistic assumptions into their projections, un-dermining its reliability. This is one reason why it isessential to project demographic variables endoge-nously within the models. One result of such unre-alistically low projections of future migration to thedeveloped countries is to produce lower estimatesof future total emissions of the developed countries,which means the developed countries are not re-quired to make as much effort today to lower theirown emissions.11
Furthermore, the UN projections of a relativelystable population for the whole of the developedworld depend on dramatic, and highly unlikely, de-clines projected in a handful of key countries. Japan,for example, must decline by ∼34%, Germany by∼31%, and Russia by ∼30% for the projected sta-bility in total developed country population to beborn out.12 In addition, countries often highlightedfor their low birth rates, like Italy and Spain, are notprojected to decline by even 1% for decades. Smallincreases in fertility and/or immigration could ex-tend that period for decades longer. Even withoutthose increases in fertility or immigration, the totalpopulation of developed countries is not projectedby the UN to peak until about 2050, and trajectoriesbeyond that are very difficult to predict given theirhigh dependence on future policies.13
Since population is stabilizing in some countries,it is often thought that the human population explo-sion of the 20th century (growing by a factor of∼4)
and yet, the UN’s projection for 2010–2050 is a continuous decline innet immigration down to only 900,000 by 2050, and then a decline tozeroby2100 [3]. Even theUNPopulationDivision itself admits, ‘We re-alize that this assumption is very unlikely to be realized but it is quite im-possible to predict the levels of immigration or emigration within eachcountry of the world for such a far horizon’ [3].
11 In order to limit the total increase in average global temperatureswithin the context of current climate change negotiations over carbonbudgets, there is amaximum total amount of carbon that can be emittedglobally, thus carbon emissions must be apportioned across countriesand across time. Lower estimates of migration to developed countriesmeans lower estimates of emissions in the future in developed countries,whichmeans the developed countries are not required tomake asmucheffort today to lower their own emissions [104].
12 These dramatic declines appear highly unlikely given that countries likeJapan and Germany have not yet declined by more than ∼1% [3], andalready their governments have enacted a series of policies to encouragehigher birth rates. In fact, there is evidence for the efficacyof various fam-ily policies in the recent fertility rebounds observed in several developedcountries [97]. Similarly, Russia, which saw its fertility rate plunge after1989 (reaching a low of 1.19 in 1999 from2.13 in 1988), enacted prona-talist policies and liberalized immigration.The fertility rate has since re-bounded, and the population decline reversed in 2009.
13 Despite widespread talk of population decline, it is important to empha-size that the only countries in theworld to have experienced anydeclinesbeyond∼1% have all been associated with the special circumstances ofthe collapse of the former Soviet Bloc (and some microstates, such as afew island nations), and even in these cases, migration has played a ma-jor role in population changes.This is even true within Germany, wherethe only Lander (provinces) which have declined significantly in popu-lation are all from the former East Germany.

REVIEW Motesharrei et al. 477
is over, and since rates of growth have been declin-ing, family planning and population growth are nolonger concerns. However, the UN projections of astabilization in global population [3] are so far intothe future (after 2100) that the projections are unre-liable [8] and global stabilization itself is highly un-certain [92]. In fact, alternate projection method-ologies suggest with muchmore certainty that stabi-lization is unlikely to occur [93]. Furthermore, eventhe UN projections are based on large assumed de-creases in fertility rates inmuch of theworld. If thoseprojected decreases in fertility rates are off by only0.5 births per woman (an error of less than 10% inmany high-fertility countries), the date at which theworld reaches 11 billion will occur five decades ear-lier andwill raise the global total population by 2100tonearly 17billion and still rapidly growing [3].Cur-rent projections should be understood in the con-text of past projections that have overestimated fer-tility declines.14 Pastmistakenprojections reflect theuse of highly questionable assumptions about fertil-ity rate declines in developing countries [92] thattend to reproduce a ‘natural’ decline following thetrajectory of more developed countries. Yet, the em-pirical record shows that reductions (or increases) infertility rates reflect a complex range of sociodemo-graphic, economic, and policy conditions [94–100].If those conditions are not present, the projected de-clines will not necessarily occur, as can be seen incountries like Niger (7.4 births per woman in 1970,7.6 in 2012) [101,102]. Needless to say, the use ofdemographic projections with overestimated fertil-ity declines again produces underestimated projec-tions of future resource use and emissions.
Even with these assumptions of large fertility de-clines in the projections, each additional billion hu-mans added will not be spread evenly across theplanet. The vast majority of the growth will be con-centrated in countries that today continue to havevery high rates of fertility (∼25 countries above 5,∼45 above 4, and ∼65 above 3). These countriesare also the lowest income countries in the world,with the lowest resource use per capita, whichmeansthat themajority of populationgrowth is takingplaceprecisely in regions with the highest potential forgrowth in resource use per capita over the coming
14 For example, the 1999 UN projections significantly overestimated thetime it would take to add the next billion people [256]. Worse still, the2015estimate for theworld’s total population in2100 [1]has goneupbyover 2 billion just since the 2004 estimate [257]. Even the 2010UNpro-jections had to be revised upwards in 2012because previous estimates oftotal fertility rates in a number of countries were too low, and in some ofthe poorest countries the level of fertility appears to have actually risenin recent years [3,258,259], and the 2012 estimates have again been re-vised upwards in 2015 [1]. To put all this in perspective, the 2004 es-timates projected a peak in world population of 9.22 billion, but in the2015 projection, 9.22 billion will be reached as early as 2041, and willstill be followed by at least another six decades of growth.
decades [87], and the growth of the total impactis the product of the two. For example, the lowest-income continent, Africa, which had 230 millionpeople in 1950 and over a billion in 2010 (a 4-foldincrease in one lifetime) is currently on track toadd another 3 billion in the next 85 years (an-other 4-fold increase in one lifetime). Nigeria, by it-self, is projected to reach almost 1 billion people.These high projections already assume very large de-creases in fertility rates from their current averagelevels of approximately 5 children/woman in Sub-Saharan Africa. (Without this projected decreasein fertility rates, Africa alone would add 16 billionrather than 3 billion more people by 2100 [3].)The UN medium range projections show that thedeveloping world (not including China) will growby an additional 2.4 billion people in just the nextthree and a half decades, and a total of an addi-tional 4 billion by 2100. Due to these uneven pop-ulation growth rates, ∼90% of the world’s popula-tion will be living in today’s less developed coun-tries, with most of the growth in the poorest of thesecountries [3].15
Current projections of future resource use andgreenhouse gas emissions used in the Intergovern-mental Panel on Climate Change (IPCC) reportsand Integrated Assessment Models (discussed fur-ther in the third Section) also depend heavily ona continuation of high levels of global economicinequality and poverty far into the future. Projec-tions that global resource use and emissions will notrise very much due to rapid population growth inthe poorest countries are based on the assumptionthat those countries will remain desperately poorby the standards of developed countries. (This as-sumption again provides the added benefit for to-day’s wealthy countries that the wealthy countrieshave to make less effort today to reduce their ownemissions. Given total global carbon emissions tar-gets, projections of low economic growth in poorcountries translate into less stringent carbon reduc-tion requirements in wealthy countries [103,104].)However, China’s recent rapid rise in emissions percapita shows this is a potential future path for the restof thedevelopingworld.Toargueotherwise requiresassuming that today’s developing countries will
15 Poorer populations are expected to bemore heavily impacted by climatechange and other mounting environmental challenges despite havingcontributed much less to their causes [136,166,167,260]. Internationaland internal migration is increasingly being seen as an important com-ponent of adaptation and resilience to climate change and a responseto vulnerabilities from other environmental risks. Given the aging socialstructures in some parts of theworld, policies that support increasedmi-gration could be important not only for environmental adaptation, butalso for the realization of other socioeconomic and demographic goals.Thus, migration will help both the sending and receiving countries. Ofcourse, given the scale of projected population growth, migration aloneis unlikely to be able to balance the regional disparities.
478 Natl Sci Rev, 2016, Vol. 3, No. 4 REVIEW
remain in desperate poverty, and/or will adopt tech-nologies that the developed countries themselveshave yet to adopt. Real-world CO2 emissions havetracked the high end of earlier emissions scenarios[105], and until the currently wealthy countries canproduce a large decline in their own emissions percapita, it is dubious to project that emissions percapita in the less developed countries will not con-tinue on a trajectory up to the levels of currentlywealthy countries.16
As we will show, all of these points raise thecritical issue of the accuracy and reliability of theassumptions underlying the projections of key Hu-man System variables, such as inequality, popula-tion, fertility, health, per capita GDP, and emissionsper capita.These are the central elements inmany ofthe standardmodels used to explore the future of hu-manity and the environment, such as various IAMsused to guide policy, and models used by the IPCCwhose output guides international negotiations onenergy use and emissions. Common to thesemodelsis their deficiency in capturing dynamic bidirectionalfeedbacks between key variables of the Human Sys-tem and the Earth System; instead, they simply useindependentprojectionsofHumanSystemvariablesin Earth SystemModels.
HUMAN SYSTEM THREATENS TOOVERWHELM THE CARRYING CAPACITYAND ECOSYSTEM SERVICES OF EARTHSYSTEMEconomic theories that endorse limitless growth arebased on a model of the economy that, in essence,does not account for the resource inputs and waste-absorption capacities of the environment, and the
16 The scientific community has urged limiting the global mean surfacetemperature increase relative to pre-industrial values to 2◦C. The eco-nomic challenges of staying on a 2◦C pathway are greater, the longeremission reductions are postponed [261]. Given the role that devel-oped countries have played historically in the consumption of fossilfuels, and their much higher per capita carbon emissions today, it isimperative that the developed countries lead the way and establish asuccessful track record in achieving such reductions. Thus, it is positivethat at the United Nations Framework Convention on Climate ChangeConference of the Parties (COP21) in Paris in December 2015, gov-ernments crafted an international climate agreement indicating theircommitments to emissions reduction for the near term (to 2025 or2030). Most importantly, the US committed to reduce economy-wideGHG emissions below 2005 levels by 26%–28% in 2025, and the EUhas committed to reduce 2030 GHG emissions relative to 1990 by 40%(excluding emissions from land-use changes). Assuming that the goalsof the Intended Nationally Determined Contributions (INDCs) arefulfilled, the results in [262] and [261] show that a successful Parisagreement on near-term emissions reductions will be valuable in re-ducing the challenges of the dramatic long-term transformations re-quired in the energy system to limit global warming to 2◦C. The Parisframework will succeed even further if it enables development of sub-sequent pathways leading to the required additional global emissionsreductions.
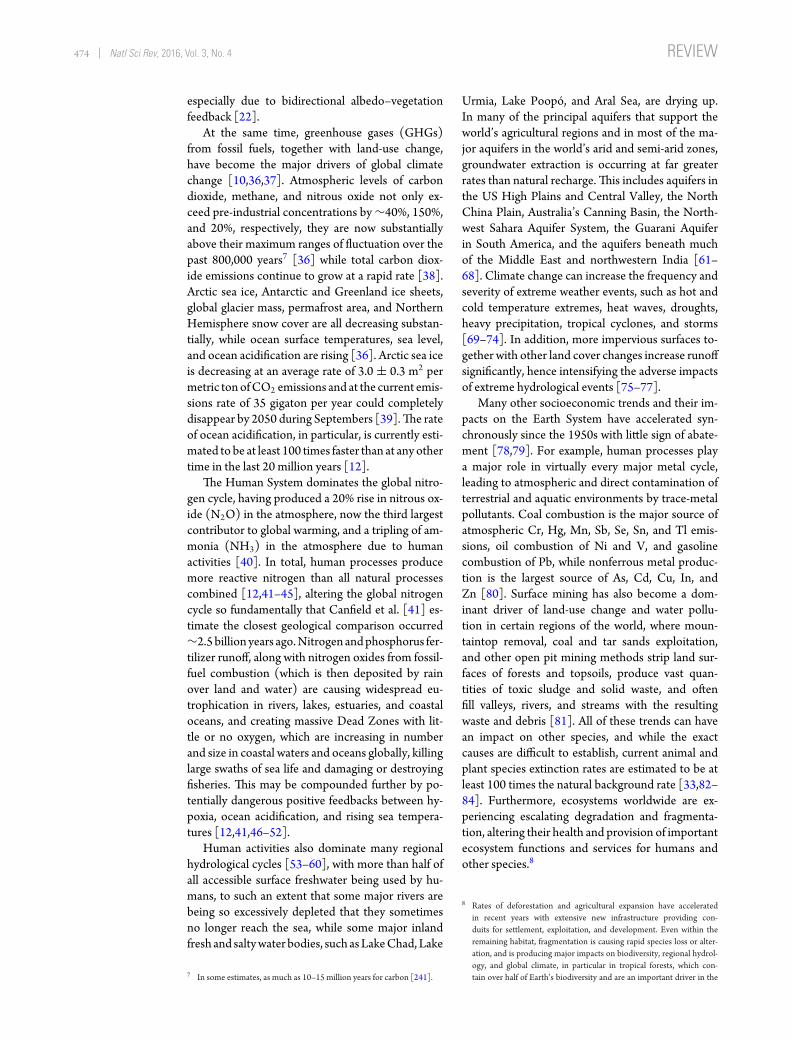
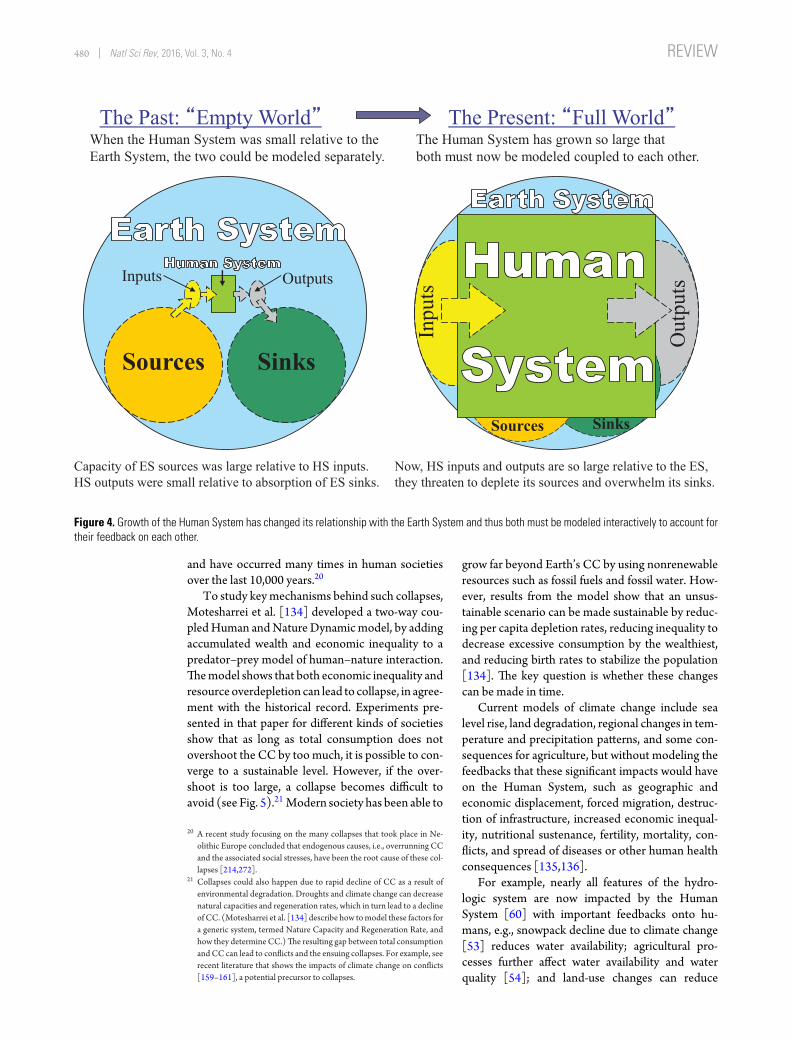
limitations of technological progress and resourcesubstitutability. In other words, these theories es-sentially model the economy as a perpetual motionmachine [106]. But in the real world, economic ac-tivity both consumes physical material and energyinputs and produces physical waste outputs. TheEarth System performs the functions (‘ecosystemservices’) of providing both the sources of these ma-terial and energy inputs to the human economy, aswell as the sinkswhich absorb and process the pollu-tion and waste outputs of the human economy. SeeFigs 3 and4 [20,106–109]. Since the scale of theHu-man System has grown dramatically relative to theEarth System’s capacity to provide these ecosystemservices, the problems of depletion and pollution havegrown dramatically.
HermanDaly has pointed out that themagnitudeand growth rates of resource input and waste out-put are not sustainable: ‘We are drawing down thestock of natural capital as if it was infinite’ [110].For example, the rapid consumption of fossil fu-els is releasing vast stocks of carbon into the at-mospheric and ocean sinks at a rate about a mil-lion times faster than Nature accumulated these car-bon stocks.17 Furthermore, while certain sectors ofglobal society have benefited from the growth of thepast 200 years, the environmental consequences areglobal in their impact, and the time scale of degrada-tion of the resulting waste products (e.g., emissions,plastics, nuclearwaste, etc.) is generallymuch longerthan they took to produce or consume. Contrary tosome claims within the field of Economics, physicallaws do place real constraints on the way in whichmaterials and energy drawn from the Earth Systemcan be used and discharged by the Human System[111–114]. To be sustainable, human consump-tion and waste generation must remain at or belowwhat can be renewed and processed by the EarthSystem.
It is often suggested that technological changewill automatically solve humanity’s environmen-tal sustainability problems [115–117]. However,there are widespread misunderstandings about theeffects of technological change on resource use.There are several types of technological changes,and these have differing effects on resource use.While some changes, such as in efficiency tech-nologies, can increase resource-use efficiency, otherchanges, such as in extraction technologies and con-sumption technologies, raise the scale of resourceextraction and per capita resource consumption. Inaddition, absent policy effects, even the increased
17 As another example, millions of metric tons of plastic enter the oceansevery year and accumulate throughout the world’s oceans, especially inall subtropical gyres [263,264].

REVIEW Motesharrei et al. 479
Factors: Population, Affluence, Technology, Policies Key Variables: Fertility, Migration, GDP/cap, Health, Materials & Energy/cap, Waste & Emissions/cap, etc. (Levels, Rates of Change, Distributional Inequalities)
Sectors: Water, Agriculture, Energy, Industry, Construction, Transportation, Trade
Sources Non-Renewable Stocks, Regenerating Stocks, Renewable Flows
Sinks Atmosphere, Ocean, Rivers Lakes, Land
Inputs Energy Coal, Oil, Gas, Nuclear, Renewables, Biofuels, etc. Materials Water, Biomass, Soils, Minerals, Chemicals, etc.
Outputs Emissions CO2, CH4, N2O, SOx, NOx, etc.
Wastes Garbage, Toxics, Wastewater, Nuclear, etc.
Land-Use Desertification, Deforestation, Urbanization, etc.
Human System-Earth System Relationship
The Human System is within the Earth System: - ES provides the sources of the inputs to HS. - HS outputs must be absorbed by ES sinks.
However, current models are not bidirectionally coupled.
Figure 3. Relationship of the Human System within the Earth System, not separatefrom it (after [110]). The Earth System provides the sources of the inputs to, and thesinks that absorb the outputs of, the Human System.
technological efficiencies in resource use, are oftencompensated for by increases in consumption asso-ciated with the ‘Rebound Effect’ [118–121 ]. Fur-thermore, advances in production technologies thatappear to be increases in productivity are insteadvery often due to greater energy andmaterial inputs,accompanied by greater waste outputs. While themagnitude and even the sign of the effect of tech-nological change on resource use varies greatly, theempirical record shows that the net effect has been acontinued increase in global per capita resource use,waste generation, andemissionsdespite tremendoustechnological advances.
While per capita emissions of developed coun-tries appear to be stabilizing when measured withinthe country of production, this is largely due tothe shift in the location of energy-intensive man-ufacturing to developing countries, and estimatesof developed countries’ per capita emissions mea-sured based on their consumption show that theycontinued to grow [122–130]. Even if today’s in-dustrialized societies can stabilize their resourceuse (at probably already unsustainable levels), large
parts of the world are in the midst of this in-dustrial transition and the associated technologi-cal regime shift from agrarian to industrial soci-ety that greatly increases per capita resource useand waste production [131,132].18 For example,from just 1971 to 2010, total primary energy useper capita in Korea increased by a factor of 10,from 0.52 to 5.16 toe [88]. Therefore, techno-logical advancement can add to the problems ofglobal sustainability, rather than solve them. Thequestion is not only whether technology can helpsolve environmental sustainability challenges, butalso what policies and measures are required todevelop the right technologies and adopt them intime. Technological advances could, and should, bepart of the solutions for environmental and sustain-ability problems, for example, by transitioning torenewables, increasing use efficiency, and fosteringbehavioral changes to cut resource use and emis-sions, particularly in the high-resource-using coun-tries. But these technological solutions do not justhappen by themselves; they require policies basedon scientific knowledge and evidence to guide andsupport their development and adoption.
An important concept for the scientific study ofsustainability is Carrying Capacity (CC), the to-tal consumption—determined by population, in-equality, and per capita consumption—that the re-sources of a given environment can maintain overthe long term [110,133].19 Consumption of naturalresources by a population beyond the rate that na-ture can replenish overshoots the Carrying Capacityof a given system and runs the risk of collapse. Col-lapses in population are common in natural systems
18 The effect of technological change can be observed in the transitionfrom agrarian to industrial society. This industrialization raised agricul-tural yields largely due to increasing inputs, thereby allowing rapid Hu-man System expansion, but it also generated a societal regime shift thatgreatly increased per capita resource use and waste generation [131].
19 One can generalize the definition of Carrying Capacity to any subsys-tem with different types of natural resources coupled with sociodemo-graphic variables. For example, the subsystems for water, energy, andagriculture—each coupled bidirectionally to human sociodemographicvariables and to each other—result inWater CC, Energy CC, and Agri-culture CC.Water CC can be defined as the level of population that canbe sustained at a particular per capita consumption and a given level ofwater sources and supply in the areaunder study. In general, this level de-pends on both human and natural factors. For example,Water CC is de-terminedby thenatural flowrateofwater into andoutof the area, precip-itation and evaporation, withdrawal rate fromwater sources, dispensingtechnology, recycling capacity, etc. Moreover, Water, Energy, or Agri-culture CC in a certain area can be imported from other regions to tem-porarily support a larger population and consumption [123,265,266].Recent literature has emphasized the integrated nature of agricultural,energy, andwater resources, andmodeling the interactions of these sub-systems is essential for studying the food–energy–water nexus [267–271]. In order to understand andmodel eitherHumanorEarth Systems,wemustmodel all these natural andhuman subsystems interactively andbidirectionally coupled.
480 Natl Sci Rev, 2016, Vol. 3, No. 4 REVIEW
Sinks:Sources:
Sinks
When the Human System was small relative to the Earth System, the two could be modeled separately.
The Human System has grown so large that both must now be modeled coupled to each other.
Inpu
ts
Out
putsInputs Outputs
Sources
Sources Sinks
Capacity of ES sources was large relative to HS inputs. HS outputs were small relative to absorption of ES sinks.
Now, HS inputs and outputs are so large relative to the ES, they threaten to deplete its sources and overwhelm its sinks.
Figure 4. Growth of the Human System has changed its relationship with the Earth System and thus both must be modeled interactively to account fortheir feedback on each other.
and have occurred many times in human societiesover the last 10,000 years.20
To study keymechanisms behind such collapses,Motesharrei et al. [134] developed a two-way cou-pledHuman andNature Dynamicmodel, by addingaccumulated wealth and economic inequality to apredator–prey model of human–nature interaction.Themodel shows that both economic inequality andresource overdepletion can lead to collapse, in agree-ment with the historical record. Experiments pre-sented in that paper for different kinds of societiesshow that as long as total consumption does notovershoot the CC by toomuch, it is possible to con-verge to a sustainable level. However, if the over-shoot is too large, a collapse becomes difficult toavoid (see Fig. 5).21 Modern society has been able to
20 A recent study focusing on the many collapses that took place in Ne-olithic Europe concluded that endogenous causes, i.e., overrunning CCand the associated social stresses, have been the root cause of these col-lapses [214,272].
21 Collapses could also happen due to rapid decline of CC as a result ofenvironmental degradation. Droughts and climate change can decreasenatural capacities and regeneration rates, which in turn lead to a declineof CC. (Motesharrei et al. [134] describe how tomodel these factors fora generic system, termed Nature Capacity and Regeneration Rate, andhow they determineCC.)The resulting gap between total consumptionandCC can lead to conflicts and the ensuing collapses. For example, seerecent literature that shows the impacts of climate change on conflicts[159–161], a potential precursor to collapses.
grow far beyond Earth’s CC by using nonrenewableresources such as fossil fuels and fossil water. How-ever, results from the model show that an unsus-tainable scenario can be made sustainable by reduc-ing per capita depletion rates, reducing inequality todecrease excessive consumption by the wealthiest,and reducing birth rates to stabilize the population[134]. The key question is whether these changescan be made in time.
Current models of climate change include sealevel rise, land degradation, regional changes in tem-perature and precipitation patterns, and some con-sequences for agriculture, but without modeling thefeedbacks that these significant impacts would haveon the Human System, such as geographic andeconomic displacement, forced migration, destruc-tion of infrastructure, increased economic inequal-ity, nutritional sustenance, fertility, mortality, con-flicts, and spread of diseases or other human healthconsequences [135,136].
For example, nearly all features of the hydro-logic system are now impacted by the HumanSystem [60] with important feedbacks onto hu-mans, e.g., snowpack decline due to climate change[53] reduces water availability; agricultural pro-cesses further affect water availability and waterquality [54]; and land-use changes can reduce

REVIEW Motesharrei et al. 481
Figure 5. Example results from [134]. (Left panel) A type-N (Nature) collapse due to both overdepletion of Nature and inequality. (Right panel) A type-L(Labor) collapse: after an apparent equilibrium, population collapses due to overexploitation of Labor, although Nature eventually recovers.
groundwater recharge [77].Thus many populationsface both reduced water availability and increasedflood frequency and magnitude [76]. Furthermore,chemicals used in hydraulic fracturing, which in-volves cracking shale rock deep underground to ex-tract oil and gas, can contaminate groundwater re-sources [137–139]. In addition, the injection ofwastewater from oil and gas operations for disposalinto deep underground wells is also altering thestresses of geologic faults, unleashing earthquakes[140].22 Increases in the frequency and magnitudeof extreme weather events can impact agricultureand ecosystems [71,141].
Changes in the structure and functions of theecosystem can also pose important threats to hu-man health in many different ways [142]. Climate,climatic events (e.g., El Nino), and environmen-tal variables (e.g., water temperature and salinity)can play a fundamental role in the spread of dis-eases [143–146]. A recent report by the US GlobalChange Research Program illustrates how climatechange could affect human health through vari-ous processes and variables such as temperature-related death and illness, air quality, extreme events,vector-borne diseases, water-related illness, foodsafety and nutrition, and mental health and well-being [147].23 Environmental catastrophes can re-sult in the decline of national incomes for a fewdecades [148], andhigher temperatures can severelyaffect human health [149] and reduce economicproductivity [150]. This effect is in addition to the
22 For example, ‘Until 2008not a single earthquakehad ever been recordedby the U.S. Geological Survey from the Dallas-Fort Worth (DFW)area...Since then, close to 200 have shaken the cities and their imme-diate suburbs. Statewide, Texas is experiencing a sixfold increase inearthquakes over historical levels. Oklahoma has seen a 160-fold spikein quakes...In 2014 the state’s earthquake rate surpassed California’s’.[273].
23 TheUSGCRP report states that ‘Current and future climate impacts ex-pose more people in more places to public health threats...Almost all ofthese threats are expected to worsen with continued climate change’.
well-established reduction in agricultural yields dueto higher temperatures [151–156]. Climate couldalso be a strong driver of civil conflicts [157–161].Environmental change is also a known trigger of hu-man migration [162–164]. These, in turn, will sig-nificantly increase the unrealistically small futuremi-gration projections described in the second Sectionof this paper. In fact, climate change alone couldaffect migration considerably through the conse-quences of warming and drying, such as reducedagricultural potential, increased desertification andwater scarcity, and other weakened ecosystem ser-vices, as well as through sea level rise damagingand permanently inundating highly productive anddensely populated coastal lowlands and cities [165–168]. Furthermore, the impacted economic activi-ties and migration could then feed back on humanhealth [169]. Bidirectional coupling is required toinclude the effects of all of these feedbacks.
BIDIRECTIONAL COUPLING OF HUMANSYSTEM AND EARTH SYSTEMMODELSIS NEEDED. PROPOSED METHODOLOGY:DYNAMIC MODELING, INPUT–OUTPUTMODELS, DATA ASSIMILATIONCoupled systems can reveal new and com-plex patterns and processes not evident whenstudied separately. Unlike systems with onlyunidirectional couplings (or systems that justinput data from extrapolated or assumed pro-jections), systems with bidirectional feedbacksoften produce nonlinear dynamics that canresult in counterintuitive or unexpected out-comes [170]. Nonlinear systems often featureimportant dynamics which would be missed ifbidirectional interactions between subsystems arenot modeled. These models also may call for verydifferent measures and policy interventions forsustainable development than those suggested
482 Natl Sci Rev, 2016, Vol. 3, No. 4 REVIEW
by models based on exogenous forecasts of keyvariables.
The need for bidirectional coupling can beseen from the historical evolution of Earth Systemmodeling. In the 1960s, atmospheric scientists de-veloped thefirstmathematicalmodels tounderstandthe dynamics of the Earth’s climate, starting with at-mospheric models coupled to simple surface mod-els (e.g., [171]). Over the following decades, newcomponents such as ocean, land, sea-ice, clouds,vegetation, carbon, and other chemical constituentswere added to make Earth System Models morephysically complete. These couplings needed to bebidirectional in order to include feedbacks [171].The importance of accounting for bidirectional feed-backs is shown by the phenomenon of El Nino-Southern Oscillation (ENSO), which results fromthe coupleddynamicsof theocean–atmosphere sub-systems. Until the 1980s, atmospheric and oceanmodels were unidirectionally coupled (in a simple,‘one-way’ mode): the atmospheric models were af-fected by sea surface temperatures (SST) but couldnot change them, and ocean models were drivenby atmospheric wind stress and surface heat fluxes,but could not change them. Such unidirectional cou-pling could not represent the positive, negative, anddelayed feedbacks occurring in nature that produceENSO episodes. Zebiak and Cane [172] developedthe first prototype of a bidirectional coupled ocean–atmosphere model.This model, for the first time, al-lowed prediction of El Nino several seasons in ad-vance [173]. Similarly, improving the modeling ofdroughts requires bidirectional coupling of the at-mosphere and land submodels (see, for example,[174]). Most current climate models have sinceswitched to fully coupled atmosphere–ocean–land–ice submodels.This example shows that we canmissvery important possible outcomes if the model failsto consider bidirectional feedbacks between differ-ent coupled components of systems that the modelrepresent. Since the Human System has becomedominant, it is essential to couple the Earth andHu-man Systemsmodels bidirectionally in order to sim-ulate their positive and negative feedbacks, better re-flecting interactions in the real world.24
24 Such interactions take place not just at a global scale but also at theecosystem and local habitat scales. Ecosystems at the regional and lo-cal scales provide critical habitat for wildlife species, thus preservingbiodiversity, and are also an essential source of food, fiber, and fuelfor humans, and forage for livestock. Ecosystem health, composition,function, and services are strongly affected by both human activi-ties and environmental changes. Humans have fundamentally alteredland cover through diverse use of terrestrial ecosystems at the lo-cal scale, which then impact systems at the global scale. Additionalchanges have taken place as a result of climate change and variabil-ity [274]. Furthermore, human pressures are projected to have ad-ditional repercussions for species survival, biodiversity, and the sus-
This coupling process has taken place to a cer-tain extent, but the coupling does not include bidi-rectional feedbacks between the Human and EarthSystems. Energy and Agriculture sectors have beenadded to ESMs creating comprehensive IntegratedAssessment Models. There are now several impor-tant, advanced IAMs, including MIT’s IGSM, USDOE’s GCAM, IIASA’s MESSAGE, the Nether-lands EAA’s IMAGE, etc25 [175–180 ]. However, inthe IAMs, many of which are used in producing theIPCC reports, population levels are obtained froma demographic projection like the UN’s populationprojections discussed in the first and second Sec-tions, which do not include, for example, impactsthat climate changemay have on theHuman System[181].
In today’s IAMs, tables of projecteddemographicand socioeconomic variables determine changes inresource use and pollution/emission levels, which inturn can determine Earth System variables such asatmospheric temperature. However, changes in re-source levels, pollution, temperature, precipitation,etc. estimated by the IAMs cannot, in turn, impactlevels of these Human System variables and proper-ties because they are exogenous to the IAMs.This istrue even for the scenarios of the IPCC, which areconstructed without full dynamic coupling betweenthe human and natural systems. Although there arecertain IAMs that include some couplings withinhuman subsystems, critical feedbacks from naturalsystems onto demographic, economic, and humanhealth variables are missing, so that the coupling
tainability of ecosystems, and in turn feedback on humans’ foodsecurity and economic development [141]. Thus, a key challengeto manage change and improve the resilience of terrestrial ecosys-tems is to understand the role that different human and environ-mental forces have on them, so that strategies that target the actualdrivers and feedbacks of coupled components of change can be de-veloped and implemented. Understanding how terrestrial ecosystemsfunction, how they change, andwhat limits their performance is criticallyimportant to determine theirCarryingCapacity for accommodating hu-man needs as well as serving as a viable habitat for other species, espe-cially in light of anticipated increase in global population and resourceconsumption for the rest of this century and beyond. Biodiversity andecosystem services in forests, farmlands, grazing lands, and urban land-scapes are dominated by complex interactions between ecological pro-cesses and human activities. In order to understand such complexity atdifferent scales and the underlying factors affecting them, an integratedHuman–Earth systems science approach that couples both societal andecological systems is needed. Humans and their activities are as impor-tant to the changing composition and functionof theEarth systemas theenvironmental conditions and their natural variability. Thus, coupledmodels are needed to meet the challenges of overcoming mismatchesbetween the social and ecological systems and to establish newpathwaystoward ‘development without destruction’ [242–248,250,251].
25 MIT:Massachusetts Institute of Technology; IGSM: IntegratedGlobalSystem Modeling framework; US DOE: United States Department ofEnergy; GCAM: Global Change Assessment Model; IIASA: Interna-tional Institute forAppliedSystemsAnalysis;MESSAGE:Model forEn-ergy Supply Systems And their General Environmental impact; EAA:Environmental Assessment Agency; IMAGE: Integrated Modelling ofGlobal Environmental Change.

REVIEW Motesharrei et al. 483
between human subsystems and the Earth System inmost current modeling is unidirectional, whereas inreality, this coupling is bidirectional [181].
Without including suchcoupled factors, the inde-pendent projections of population levels, economicgrowth, and carbon emissions could be based on in-consistent or contradictory assumptions, and hencecould be inherently incorrect. For example, theUN’spopulation projections assume fertility declines intoday’s lowest-income countries that follow trajec-tories established by higher-income countries.How-ever, the economic growth projections and, there-fore, per capita carbon emission projections, assumetoday’s poorest countries will not grow close to any-where near the level of today’s wealthy countries.The 45 lowest income countries are projected togrow to∼$6,500GDP per capita by 2100 [104] butthe average GDP per capita of today’s high-incomecountries is ∼$45,000. Rather than relying on pro-jections, the demographic component of any cou-pledmodelmust include the factors that contributedto the demographic transition in other countries,such as education, family planning, health care, andother government policies and programs [98,182–184].
Projections of key variables in a realistic modelshould not be based on mechanistic temporal ex-trapolations of those variables but rather on the in-trinsic internal dynamics of the system. Specifically,key parameters of the Human System, such as fer-tility, health, migration, economic inequality, unem-ployment, GDP per capita, resource use per capita,and emissions per capita, must depend on the dy-namic variables of the Human–Earth coupled sys-tem.26 Not including these feedbacks would be liketrying tomakeElNinopredictions usingdynamic at-
26 Furthermore, the use of GDP as a key measure and determinant inthese future projections is itself highly problematic, because it is avery weak measure of human well-being, economic growth, or societalprosperity [275]. GDP neither accounts for the value of natural capi-tal nor human capital, ignores income and wealth inequality, neglectsboth positive and negative externalities, and only captures social costsand environmental impacts to the extent that prices incorporate them.Any economic activity, whether deleterious or not, adds to GDP as longas it has a price. For example, labor and resources spent to repair or re-place loss due to conflicts or environmental damages are counted as ifthey add to—rather than subtract from—total output. Alternativemea-sures, such as the Genuine Progress Indicator, the Sustainable SocietyIndicator, the Human Development Index, and the Better Life Index ofthe Organization for Economic Co-operation and Development, havebeen developed [276–278].These measures show that, especially sincethe 1970s, the large increases in GDP in the developed countries havenot beenmatchedby increases inhumanwell-being. Integrated and cou-pled Human–Earth system models will allow for the development ofmuch more accurate and realistic measures of the actual productivity ofeconomic activity and its costs and benefits for human well-being. Suchmeasures will allow for the valuation of both natural and human capitaland for defining and developing sustainability metrics that are inclusiveof the wealth of natural and human capital.They will also bring togetherthe current disparate debates on environment/climate, economics, de-mographics, policies, andmeasures to put theHuman–Earth System ona more sustainable path for current and future generations.
mosphericmodels butwith sea surface temperaturesas an external input basedon futureprojections inde-pendently produced (e.g., by the UN) without feed-backs.
To address the above issues, the developmentof coupled global Human–Earth System frame-works that capture and represent the interactivedynamics of the key subsystems of the coupledhuman–nature system with two-way feedbacks areurgently needed. The global Human–Earth Sys-tem framework we propose, and represent schemat-ically in Fig. 6, combines not only data collec-tion, analysis techniques, and Dynamic Modeling,but also Data Assimilation, to bidirectionally cou-ple an ESM containing subsystems for Global At-mosphere, Land (including both Land–Vegetationand Land-Use models) and Ocean and Ice, to aHuman SystemModel with subsystems for Popula-tion Demographics, Water, Energy, Agriculture, In-dustry, Construction, and Transportation. The De-mographics subsystem includes health and publicpolicy factors that influence key variables such asfertility, disease, mortality, and immigration rates,while theWater, Energy, Agriculture, Industry,Con-struction, and Transportation subsystems includecross-national input–output modeling to providethe consumption-based resource-input and waste-output ‘footprint’ accounting analyses missing fromthe territorial-based methods.27
The need for global Earth System frameworkscoupled to population drivers has been recom-mended since the 1980s, in the pioneering report bythe Earth System Sciences Committee of the NASAAdvisory Council, chaired by Francis P. Brether-ton [185]. While Earth System components and
27 Input–Output analysis can account for the flows of resource inputs, in-termediate and finished goods and services, andwaste outputs along theproduction chain [279,280]. By accounting for the impacts of the fullupstream supply chain, IO analysis has been used in life-cycle analysis[281] and for linking local consumption to global impacts along globalsupply chains [122,127,282,283]. IO models can be extended with en-vironmental parameters to assess different environmental impacts fromproduction and consumption activities, including water consumption[123,284,285], water pollution [285,286], carbon dioxide emissions[287–289], land-use and land-cover change [130,290,291], and biodi-versity [283]). Such models have been developed and applied at vari-ous spatial and temporal scales. Since emissions embodied in trade havebeen growing rapidly, resulting in an increasing divergence betweenterritorial-based and consumption-based emissions, territorialmeasuresalone cannot provide a comprehensive and accurate analysis of the fac-tors driving emissions nor the effectiveness of reduction efforts [292].IOmodels can provide these consumption-based calculations and havebeen employed to identify and quantify key drivers for emissions andenergy consumption (such as population growth, changes of consump-tion patterns, and technical progress [288,293,294]) as well as the en-vironmental impacts of social factors (such as urbanization and migra-tion) reflecting consumption patterns of different categories of house-holds with high spatial detail [282,295]. IO analysis can also be used forsimulating potential future states of the economy and the environment(e.g., [296]), through dynamically updating technological change andfinal demand, or employing recursive dynamics to explore explicit sce-narios of change.

484 Natl Sci Rev, 2016, Vol. 3, No. 4 REVIEW
Schematic of Earth System - Human System Feedbacks
Fisheries
(Region n)
Migration
Land (Region n)
Crop-landand
Grazingland
Leaf, root, wood, soil carbon poolsLand-Vegetation Model
EnergyNon-Renewable
RenewableRegenerating
Water(Region n)Oceans, Rivers, Lakes, Aquifers, Glaciers, Arctic Ice
WasteEmissions
Industry
Agriculture
WasteWater
Pollution
Effects and FeedbacksPolicies
Population
Pollution
Risk Factors
Trade
Land-Use Model
Others
Temperature, Wind, Fluxes, Rain, CO2
Surface Water
Fresh WaterSupply
Ground Water
Food
Desalination
River RoutingModule
UrbanAreas
Precip. & Evap.
RechargeFertility
Health
Affluence
Recycling
Inequality
n oi tadargeD
& noit atnemga rF
mets yso cE
Global Atmosphere
Loss of Speciesand
Biodiversity
Population Dem
ographics
Construction
Transportation
Forest
Grassland
Desert
Policies
Figure 6. Schematic of a Human–Earth System with drivers and feedbacks.
needed feedbacks were described and interaction ofthe Earth System and theHuman Systemwas shownin the report,multiple subsystemsof theHumanSys-tem and feedbacks between those subsystems andwith the Earth System were not fully included. Thecoupled framework proposed here includes the ma-jor subsystems and components of the Human Sys-tem as well as their major feedbacks and risks, andexplicitly recognizes policies as a major driver of thefull system.
ESMs have long been based on integrating theirdynamical equations numerically (e.g., numericalweather prediction models used by Weather Ser-vices). For Human Systems, Dynamic Modeling isalso a powerful tool that scientists have success-fully applied to many systems across a range of eco-nomic, social, and behavioral modeling [113,186–189]. The ability of dynamic models to capturevarious interactions of complex systems, their po-tential to adapt and evolve as the real systemchanges and/or the level of the modelers’ under-standing of the real system improves, their ability tomodel coupled processes of different temporal and
spatial resolutions and scales, and their flexibility toincorporate and/or couple tomodels based on otherapproaches (such as agent-basedmodeling, stochas-ticmodeling, etc.) render themas a versatile and effi-cient tool to model coupled Earth–Human Systems[190–193]. Since ESMs are already dynamic, a dy-namic modeling platform would be a natural choiceto model coupled Earth–Human Systems. Figure 7is a schematic showing an example of amodel to cou-ple energy and water resources at the local and re-gional scales to human population.28
28 Many of the variables in such a model are affected by processes at theglobal scale, while decisions are often made at a local scale. Choos-ing variables from the subsystems depends on the specific goals of themodel. Reconciling various scales spatially or temporally can be donethrough downscaling, aggregating, and averaging for variables definedat smaller scales.Moreover, theHuman System strongly influences con-sumption even at these smaller local scales. For example, Srebric et al.[297] show that not only population size but also behavior of peopleat the community scale strongly affects local energy consumption. Thisexample shows that coupled Human System models are needed at var-ious scales to project consumption patterns, especially for energy andwater. We thank the anonymous Reviewer No. 2 for emphasizing theimportance of coupling across various scales, and formany other helpfulcomments.

REVIEW Motesharrei et al. 485
Figure 7. An example of a model schematic integrating water and energy resources with human population and health at the local and regional scales,coupled to an ESM at the global scale.
Amajor challenge in implementing such a frame-work of a coupled Earth–Human System is thatit requires tuning many parameters to approxi-mately reproduce its past observed evolution. Thistask has become easier over the last decade withthe development of advanced methods of DataAssimilation commonly used in atmospheric sci-ences to optimally combine a short forecast withthe latest meteorological observations in orderto create accurate initial conditions for weatherforecasts generated several times a day by theNational Weather Services (e.g., [194–198]). Themost methods (known as 4D-Var and EnsembleKalman Filter) are able to go over many years of ob-servations using a dynamic forecasting model andestimate the optimal value of model parameters forwhich there are no observations (e.g., [199–206]).
Uncertainty is another important challenge inproducing future behavior and scenarios with mod-els. This problem has been addressed successfully
in meteorology by using, instead of a single fore-cast, an ensemble of typically 20–200 model fore-casts created by adding perturbations in their ini-tial conditions and in the parameters used in themodels.These perturbations are selected to be com-patible with estimated uncertainties of the param-eters and initial conditions [207–210]. The intro-duction of ensemble forecasting in the early 1990sprovided forecasters with an important measure ofuncertainty of the model forecasts on a day-to-dayand region-to-region basis. This made it possible toextend the length of the US National Weather Ser-vices weather forecasts made available to the pub-lic from 3 days to 7 days (e.g., [196]). A similar ap-proach, i.e., running ensembles ofmodel projectionswith perturbed parameters, could be used with cou-pled Earth–Human System models to provide poli-cymakerswith an indicator of uncertainty in regionalor global projections of sustainability associatedwithdifferent policies andmeasures.Calibration and

486 Natl Sci Rev, 2016, Vol. 3, No. 4 REVIEW
tuning of coupled Human–Earth System models, asindicated above, could take advantage of optimal pa-rameter estimation using advanced Data Assimila-tion, rather than following the more traditional ap-proachof tuning individual parameters or estimatingthem from available observations.
Our proposed framework, together with DataAssimilation techniques, allows developing, test-ing, and optimizing measures and policies that canbe implemented in practice for early detection ofcritical or extreme conditions that will lead to ma-jor risks to society and failure of supporting sys-tems and infrastructure, and aid in the estima-tion of irreversible thresholds or regime-shiftingtipping points [211–213]. Moreover, it allows fordetecting parameters and externalities (such asinadequate measures or policies) that may playa significant role in the occurrence of catastro-phes and collapses [214–217]. By adjusting thevalues of those parameters found to be influen-tial through numerical experiments and simulations,short-term and long-term policy recommendationsthat can keep the system within optimum levelsor sustainable development targets (e.g., Millen-nium Development Goals or the Post-2015 Devel-opment Agenda) can be designed and tested. Thisapproach would allow policies and measures thathave been found to be successful in specific casesto be modeled under different conditions or moregenerally.29 Effective policies and measures areneeded for all sectors of the Human–Earth Sys-temModel described above [184,218]. A dynamical
29 There are numerous examples of policies successfully tackling many ofthe challenges identified in this paper. For example, the province of Mi-siones, Argentina, with policies for forest protection and sustaining lo-cal incomes, stands out by having very high, remotely sensed values ofNDVI (vegetation index) compared to the neighboring regions [298].Thestate ofKerala, India, despite a very lowGDPper capita (under $300until 1990s), through policies expanding access to education and medi-cal care, enjoys higher life expectancy, lower birth rates, lower inequality,and superior education compared to the rest of India [299–301]. For-mal primary, secondary, and tertiary education can also reduce societalinequalities and improve economic productivity [98,182,184,302]. Ed-ucation itself can also be offered in other forms. For example, educationthrough mass media can be influential for changing long-term culturaltrends and social norms, as can be seen in the successful attempt to re-duce fertility rates in Brazil using soap operas [303]. There have alsobeen other extremely successful noncoercive family planning policies,e.g., inThailand,Mexico, and Iran [94,99,183,304–308]. A recent paperin PNAS [309] showed that slowing population growth could provide16%–29%of the emissions reductions neededby2050 andby37%–41%by 2100, and a study byWire [310] shows family planning is four timesas efficient as adopting low-carbon technologies for reducing carbon inthe atmosphere and ocean. Successful local and regional policies on airquality includeCalifornia sharply reducingNO2 inLosAngeles by 6.0±0.7% per year between 1996 and 2011 through strict policies on vehicu-lar emissions [311].Maryland succeeded in reducing SO2 emissions perunit energy produced from power plants by ∼90% [312]. Regulationshave reduced levels of SO2 and NO2 over the eastern US by over 40%and 80%, respectively, between 2005 and 2015. Over a similar periodin India, these levels grew by more than 100% (SO2) and 50% (NO2),showing the possible dangers ahead absent effective policies [313].
model of such systems should be capable of testingthe effects of various policy choices on the long-termsustainability of the system [215].
The track record until recently on climate changeshows policy inaction is both dangerous and can bevery costly [168,193,219]. And yet, despite a longhistory of scientific warnings (please see Footnote30 for a detailed description30), the many currentecological and economic impacts and crises, the fu-ture risks and dangers, the large number of interna-tional meetings and conferences on the urgent needfor climate policies and measures, and the adop-tion of some national and regional climate policies,growth in global CO2 emissions from fossil fuels andcement has not only remained strong but is actuallyaccelerating.The average annual rate of growth from2000–2009(∼2.9%)was almost triple the rateof theprevious two decades, 1980–1999 (∼1.1%), whilethe most recent years, 2010–2012, have been evenhigher (∼3.4%) [127,220].
The sobering fact is that very little has beenaccomplished in establishing effective carbonreduction policies and measures based on science.The development and implementation of poli-cies promoting sustainable technologies for thefuture (e.g., renewable energy sources) becomeseven more challenging because of interventionand obstruction by a number of vested interestsfor continued and expanded use of their existingnonrenewable technologies and resources (e.g.,some in the coal, oil, and gas industries). This is
30 Anthropogenic climate change driven by carbon emissions, water vapor,and surface albedo was theorized as early as the 19th century, and anempirical warming trend was measured by the 1930s. Scientists cameto understand the fundamental mechanisms of climate change by the1950s and 60s (e.g., [314,315]). The first international scientific Con-ference on the Study of Man’s Impact on Climate was held in 1971 andissued a report warning about the possibilities of melting polar ice, re-duced albedo, and other unstable feedbacks that could lead to acceler-ated climate change ‘as a result of man’s activities’ [316]. By 1979, a USNational Academy of Sciences panel, chaired by Jule Charney, issued areport confirming the findings of climate changemodels [317], and overthe course of the 1980s, the empirical evidence confirming ongoing cli-mate change grew very rapidly. In 1988, James Hansen testified beforethe US Congress about the near certainty of climate change. The firstIPCCAssessment Report was completed in 1990, and the Fifth in 2014,with each report successively warning of the increasingly grave conse-quences of our current trajectory. The latest report warns that withoutnew and effective policies and measures, increases in global mean tem-perature of 3.7◦C–4.8◦Care projected by 2100 relative to pre-industriallevels (median values; the range is 2.5◦C–7.8◦C) [318]. Other nationaland global institutions have also warned of the disastrous consequencesof suchwarming (e.g., [274]). As a recentWorld Bank assessment [261,p. xvii] states, ‘The data show that dramatic climate changes, heat andweather extremes are already impacting people, damaging crops andcoastlines and putting food, water, and energy security at risk...The taskof promoting human development, of ending poverty, increasing globalprosperity, and reducing global inequality will be very challenging ina 2◦C [increase] world, but in a 4◦C [increase] world there is seriousdoubt whether this can be achieved at all...the time to act is now’. Sci-entists have also long warned about the consequences of climate changefor international security (e.g., [319–321]).

REVIEW Motesharrei et al. 487
further complicated by some political rejectionof science-based future climate projections andunwillingness to consider alternative economicdevelopment pathways to lowering the emission ofcarbon dioxide and other GHGs from the Human–Earth systems. However, the commitments toreduce carbon emissions by the vast majority of theworld’s countries in the recent agreement from theCOP21 in Paris could signify a major policy turningpoint.31
One of the anonymous reviewers pointed outthat the failure of policymakers to react sufficientlyto the scientific understanding of global warming isparalleled by a similar failure with regard to scien-tific knowledge about population trajectories. Fam-ily planning policies have been pushed off policyagendas for the last few decades, and the subject ofpopulation has even become taboo. There are nu-merous non-evidence-based barriers that separatewomen from the information and means necessaryto plan childbirths. The total fertility rate remainshigh in many countries not because women wantmany children but because they are denied thesetechnologies and information, and often even theright to have fewer children. Access to family plan-ning information and voluntary birth control is a ba-sic human right and should be treated as such byinternational institutions and policy frameworks.Similarly, there is also an urgent need for improvededucational goals worldwide. While these goals arerepeatedly supported by both researchers and pol-icymakers, policy implementation continues to belacking. As a recent report by the Royal Society (theUK National Academy of Sciences) explains, im-proved education (especially for women) andmeet-ing the large voluntary family planningneeds that arestill unmet in both developed and developing coun-tries are fundamental requirements of future eco-nomic prosperity and environmental sustainability.This again emphasizes the critical need for science-based policies [98,182,184,218,221–227].32
31 Withmore than 180 countries, covering∼90%of global emissions, hav-ing committed to submit INDCs, the Paris framework forms a systemof country-level, nationally determined emissions reduction targets thatcan be regularly monitored and periodically escalated. While analysis[262] of the INDCs indicates that, if fully implemented, they can reducethe probability of reaching the highest levels of temperature change by2100 and increase the probability of limiting global warming to 2◦C,achievement of these goals still depends on the escalation of mitigationaction beyond the Paris Agreement. Even if the commitments arefulfilled, they are not enough to stay below the 2◦C pathway[261,262,322], but the Paris framework is an important start for aneventual transformation in policies andmeasures.Thus, the INDCs canonly be a first step in a deeper process, and the newly created frameworkmust form an effective foundation for further actions on emissionsreductions.
32 We thank anonymous Reviewer No. 1 for guiding us to add all the im-portant points in this paragraph and the associated citations.
The importance and imminence of sustainabilityproblems at local and global scales, the dominantrole that the Human System plays in the Earth Sys-tem, and the key functions and services the EarthSystem provides for the Human System (as well asfor other species), all call for strong collaborationof earth scientists, social scientists, and engineersin multidisciplinary research, modeling, technologydevelopment, and policymaking. To be successful,such approaches require active involvement acrossall disciplines that aim to synthesize knowledge,models, methods, and data. To take effective actionagainst existing and potential socio-environmentalchallenges, global society needs scientifically-baseddevelopment of appropriate policies, education thatraises collective awareness and leads to actions, in-vestment to build new or improved technologies, andchanges in economic and social structures. Guidedby such knowledge, with enough resources and ef-forts, and only if done in time, human ingenuitycan harness advances in science, technology, engi-neering, and policy to develop effective solutions foraddressing the challenges of environment and cli-mate, population, and development. Only throughwell-informed decisions and actions can we leavea planet for future generations in which they canprosper.
ACKNOWLEDGEMENTWe benefited from helpful discussions with many colleagues in-cluding ProfessorsMikeWallace, JimCarton, Inez Fung, DeliangChen, Jim Yorke, Ross Salawitch, Margaret Palmer, Russ Dicker-son, Paolo D’Odorico, and Steve Penny.
We thankMr IanMunoz andDr PhilippeMarchand for tech-nical assistance in producing Fig. 1.
As is the casewith all independentpeer-reviewed research, theviews and conclusions in the paper are those of the authors alone.The funding organizations did not have any role in writing the pa-per and did not review it.
FUNDINGThis work was supported by the University of Maryland Coun-cil on the Environment 2014 Seed Grant (1357928). The au-thors would like to acknowledge the following grants and in-stitutions: SM, KF, and KH: National Socio-EnvironmentalSynthesis Center (SESYNC)—US National Science Founda-tion (NSF) award DBI-1052875; JR: The Institute of GlobalEnvironment and Society (IGES); GRA: Laboratory DirectedResearch and Development award by the Pacific Northwest Na-tional Laboratory, which is managed by the BattelleMemorial In-stitute for the US Department of Energy; MAC: Office of NavalResearch, research grantMURIN00014-12-1-0911; FMW:NSFaward CBET-1541642; VMY: The Institute for New EconomicThinking (INET).
488 Natl Sci Rev, 2016, Vol. 3, No. 4 REVIEW
REFERENCES1. United Nations. TheWorld Population Prospects: 2015 Revision, Key Findingsand Advance Tables. Working Paper ESA/P/WP.241. United Nations, Depart-ment of Economic and Social Affairs, Population Division, 2015.
2. Christenson M. Global population growth. Technical report. US Census Bu-reau. 2002.
3. United Nations. World Population Prospects: The 2012 Revision, Highlightsand Advance Tables. Working Paper ESA/P/WP.228. United Nations, Depart-ment of Economic and Social Affairs, Population Division, 2013.
4. Krausmann F, Gingrich S and Eisenmenger N et al. Growth in global materialsuse, GDP and population during the 20th century (data updated in 2011). EcolEcon 2009; 68: 2696–705.
5. Erisman JW, Sutton MA and Galloway J et al. How a century of ammoniasynthesis changed the world. Nat Geosci 2008; 1: 636–9.
6. Smil V. Enriching the Earth: Fritz Haber, Carl Bosch, and the transformation ofworld food production. Cambridge, MA, USA; London, UK: MIT press, 2004.
7. Smil V. Detonator of the population explosion. Nature 1999; 400: 415.8. Warren SG. Can human populations be stabilized? Earth Future 2015; 3:2014EF000275.
9. Barnosky AD, Hadly EA and Bascompte J et al. Approaching a state shift inEarth’s biosphere. Nature 2012; 486: 52–8.
10. Crutzen PJ. Geology of mankind. Nature 2002; 415: 23.11. Crutzen PJ. The “Anthropocene”. In: Ehlers E and Krafft T (eds). Earth System
Science in the Anthropocene. Berlin, Heidelberg: Springer, 2006, 13–8.12. Rockstrom J, Steffen W and Noone K et al. Planetary boundaries: exploring
the safe operating space for humanity. Ecol Soc 2009; 14: 32.13. Foley JA, DeFries R and Asner GP et al. Global consequences of land use.
Science 2005; 309: 570–4.14. Haberl H, Erb KH and Krausmann F et al. Quantifying and mapping the human
appropriation of net primary production in earth’s terrestrial ecosystems. ProcNatl Acad Sci USA 2007; 104: 12942–7.
15. Haberl H, Erb KH and Krausmann F et al.Global bioenergy potentials from agri-cultural land in 2050: sensitivity to climate change, diets and yields. BiomassBioenerg 2011; 35: 4753–69.
16. ImhoffML, Bounoua L and Ricketts T et al.Global patterns in human consump-tion of net primary production. Nature 2004; 429: 870–3.
17. Krausmann F, Erb KH and Gingrich S et al. Global human appropriation of netprimary production doubled in the 20th century. Proc Natl Acad Sci USA 2013;110: 10324–9.
18. Lauk C and Erb KH. Biomass consumed in anthropogenic vegetation fires:Global patterns and processes. Ecol Econ 2009; 69: 301–9.
19. Liu Y, Li Y and Li S et al. Spatial and temporal patterns of global NDVI trends:correlations with climate and human factors. Remote Sens. 2015; 7: 13233–50.
20. Millennium Ecosystem Assessment. Ecosystems and HumanWell-being: Syn-thesis, Vol. 5. Washington, DC: Island Press, 2005.
21. Rojstaczer S, Sterling SM and Moore NJ. Human appropriation of photosyn-thesis products. Science 2001; 294: 2549–52.
22. Zeng N and Yoon J. Expansion of the world’s deserts due to vegetation-albedofeedback under global warming. Geophys Res Lett 2009; 36.
23. Zeng N, Zhao F and Collatz GJ et al. Agricultural Green Revolution as a driverof increasing atmospheric CO2 seasonal amplitude.Nature 2014; 515: 394–7.
24. Imhoff ML, Tucker CJ and LawrenceWT et al. The use of multisource satelliteand geospatial data to study the effect of urbanization on primary productivityin the United States. IEEE Trans Geosci Remote Sens 2000; 38: 2549–56.
25. Krausmann F, Erb KH and Gingrich S et al. Global patterns of socioeconomicbiomass flows in the year 2000: a comprehensive assessment of supply, con-sumption and constraints. Ecol Econ 2008; 65: 471–87.
26. Tilman D, Balzer C and Hill J et al. Global food demand and the sustainableintensification of agriculture. Proc Natl Acad Sci USA 2011; 108: 20260–4.
27. Tilman D, Cassman KG and Matson PA et al. Agricultural sustainability andintensive production practices. Nature 2002; 418: 671–7.
28. Kareiva P, Watts S andMcDonald R et al. Domesticated nature: shaping land-scapes and ecosystems for human welfare. Science 2007; 316: 1866–9.
29. Lyons SK, Smith FA and Brown JH. Of mice, mastodons and men: human-mediated extinctions on four continents. Evol Ecol Res 2004; 6: 339–58.
30. Gleeson T. Regional strategies for the accelerating global problem of ground-water depletion. Nat Geosci 2012; 5: 853–61.
31. Doll P, Muller Schmied and Schuh C et al. Global-scale assessment of ground-water depletion and related groundwater abstractions: combining hydrologi-cal modeling with information from well observations and GRACE satellites.Water Resour Res 2014; 50: 5698–720.
32. Scholes MC and Scholes RJ. Dust unto dust. Science 2013; 342: 565–6.33. Vitousek PM,Mooney HA and Lubchenco J et al. Human domination of Earth’s
ecosystems. Science 1997; 277: 494–9.34. Li Y, Zhao M and Motesharrei S et al. Local cooling and warming effects of
forests based on satellite observations. Nat Commun 2015.35. Li Y, De Noblet-Ducoudre N and Davin EL et al. The role of spatial scale and
background climate in the latitudinal temperature response to deforestation.Earth Syst Dynamics 2016; 7: 167–81.
36. Ciais P, Sabine C and Bala G et al. Carbon and other biogeochemical cy-cles. In: Climate Change 2013: The Physical Science Basis. Contribution ofWorking Group I to the Fifth Assessment Report of the IntergovernmentalPanel on Climate Change. Cambridge, UK: Cambridge University Press, 2013,465–570.
37. Hansen J, Kharecha P and Sato M et al. Assessing “Dangerous ClimateChange”: required reduction of carbon emissions to protect young people, fu-ture generations and nature. PLoS One 2013; 8: e81648.
38. Marland G, Boden TA and Andres RJ. Global, regional, and national fossil fuelCO2 emissions. Technical report. Carbon Dioxide Information Analysis Center,Oak Ridge National Laboratory US Department of Energy 2012.
39. Notz D and Stroeve J. Observed Arctic sea-ice loss directly follows anthro-pogenic CO2 emission. Science 2016; aag2345.
40. Galloway JN, Dentener FJ and Capone DG et al. Nitrogen cycles: past,present, and future. Biogeochemistry 2004; 70: 153–226.
41. Canfield DE, Glazer AN and Falkowski PG. The evolution and future of Earth’snitrogen cycle. Science 2010; 330: 192–6.
42. Gruber N and Galloway JN. An Earth-system perspective of the global nitro-gen cycle. Nature 2008; 451: 293–6.
43. Holtgrieve GW, Schindler DE and HobbsWO et al. A coherent signature of an-thropogenic nitrogen deposition to remote watersheds of the northern hemi-sphere. Science 2011; 334: 1545–8.
44. Howarth R, Swaney D and Billen G et al. Nitrogen fluxes from the landscapeare controlled by net anthropogenic nitrogen inputs and by climate. Front EcolEnviron 2012; 10: 37–43.
45. Vitousek P, Aber J and Howarth R et al. Human alteration of the globalnitrogen cycle: sources and consequences. Ecol Appl 1997; 7: 737–50.WOS:A1997XQ08100002.
46. Cai WJ, Hu X and Huang WJ et al. Acidification of subsurface coastal watersenhanced by eutrophication. Nat Geosci 2011; 4: 766–70.

REVIEW Motesharrei et al. 489
47. Carstensen J, Andersen JH and Gustafsson BG et al. Deoxygenation of theBaltic Sea during the last century. Proc Natl Acad Sci USA 2014; 111: 5628–33.
48. Ekstrom JA, Suatoni L and Cooley SR et al. Vulnerability and adaptation of USshellfisheries to ocean acidification. Nat Clim Change 2015; 5: 207–14.
49. Melzner F, Thomsen J and Koeve W et al. Future ocean acidification will beamplified by hypoxia in coastal habitats.Mar Biol 2012; 160: 1875–88.
50. Rabotyagov S, Kling C and Gassman P et al. The economics of dead zones:causes, impacts, policy challenges, and a model of the Gulf of Mexico hypoxiczone. Rev Environ Econ Policy 2014; 8: 58–79.
51. Tilman D, Fargione J andWolff B et al. Forecasting agriculturally driven globalenvironmental change. Science 2001; 292: 281–4.
52. Vaquer-Sunyer R and Duarte CM. Thresholds of hypoxia for marine biodiver-sity. Proc Natl Acad Sci USA 2008; 105: 15452–7.
53. Barnett TP, Pierce DW and Hidalgo HG et al. Human-induced changes in thehydrology of the Western United States. Science 2008; 319: 1080–3.
54. Gordon LJ, Peterson GD and Bennett EM. Agricultural modifications of hydro-logical flows create ecological surprises. Trends Ecol Evol 2008; 23: 211–9.
55. Grasby S. World water resources at the beginning of the 21st century. GeosciCanada 2004; 31.
56. Meybeck M. Global analysis of river systems: from Earth system controls toAnthropocene syndromes. Philos Trans R Soc 2003; 358: 1935–55.
57. Molden D. Water for Food, Water for Life: A Comprehensive Assessment ofWater Management in Agriculture. London, UK; Sterling, VA, USA: Earthscan,2007.
58. Molle F, Wester P and Hirsch P. River basin closure: processes, implicationsand responses. Agric Water Manag 2010; 97: 569–77.
59. Vorosmarty CJ, Green P and Salisbury J et al. Global water resources: vulner-ability from climate change and population growth, Science 2000; 289: 284.
60. Wagener T, SivapalanM and Troch PA et al. The future of hydrology: an evolv-ing science for a changing world.Water Resour Res 2010; 46: W05301.
61. Castle SL, Thomas BF and Reager JT et al. Groundwater depletion duringdrought threatens future water security of the Colorado River Basin. GeophysRes Lett 2014; 41: 2014GL061055.
62. Famiglietti JS. The global groundwater crisis. Nat Clim Change 2014; 4:945–8.
63. Famiglietti JS, LoM and Ho S et al. Satellites measure recent rates of ground-water depletion in California’s Central Valley. Geophys Res Lett 2011; 38:L03403.
64. Famiglietti JS and Rodell M. Water in the balance. Science 2013; 340:1300–1.
65. Konikow LF. Groundwater Depletion in the United States (1900-2008). US Ge-ological Survey Scientific Investigations Report 20135079, US Department ofthe Interior, US Geological Survey, 2013.
66. Rodell M, Velicogna I and Famiglietti JS. Satellite-based estimates of ground-water depletion in India. Nature 2009; 460: 999–1002.
67. Scanlon BR, Faunt CC and Longuevergne L et al. Groundwater depletion andsustainability of irrigation in the US High Plains and Central Valley. Proc NatlAcad Sci USA 2012; 109: 9320–5.
68. Voss KA, Famiglietti JS and Lo M et al. Groundwater depletion in the Mid-dle East from GRACE with implications for transboundary water manage-ment in the Tigris-Euphrates-Western Iran region.Water Resour Res 2013; 49:904–14.
69. Cai W, Borlace S and Lengaigne M et al. Increasing frequency of extreme ElNino events due to greenhouse warming. Nat Clim Change 2014; 4: 111–6.
70. Cai W, Wang G and Santoso A et al. Increased frequency of extreme La Ninaevents under greenhouse warming. Nat Clim Change 2015; 5: 132–7.
71. Easterling DR, Meehl GA and Parmesan C et al. Climate Extremes: observa-tions, modeling, and impacts. Science 2000; 289: 2068–74.
72. Meehl GA and Tebaldi C.More intense, more frequent, and longer lasting heatwaves in the 21st century. Science 2004; 305: 994–7.
73. Mei W and Xie SP. Intensification of landfalling typhoons over the northwestPacific since the late 1970s. Nat Geosci 2016.
74. Wuebbles D, Meehl G and Hayhoe K et al. CMIP5 Climate model analy-ses: climate extremes in the United States. Bull Am Meteorol Soc 2013; 95:571–83.
75. Arnold CL and Gibbons CJ. Impervious surface coverage: the emergence of akey environmental indicator. J Am Plan Assoc 1996; 62: 243–58.
76. Di Baldassarre F, Castellarin A and Brath A. Analysis of the effects of leveeheightening on flood propagation: example of the River Po, Italy. Hydrol Sci J2009; 54: 1007–17.
77. Scanlon BR, Keese KE and Flint AL et al. Global synthesis of groundwaterrecharge in semiarid and arid regions. Hydrol Processes 2006; 20: 3335–70.
78. Steffen W, Sanderson RA and Tyson PD et al. Global Change and the EarthSystem: A Planet Under Pressure. Berlin, Germany; Heidelberg, Germany;New York, USA: Springer Science & Business Media, 2006.
79. Steffen W, Broadgate W and Deutsch L et al. The trajectory of the Anthro-pocene: the great acceleration. Anthropocene Rev 2015.
80. Pacyna JM and Pacyna EG. An assessment of global and regional emissionsof trace metals to the atmosphere from anthropogenic sources worldwide.Environ Rev 2001; 9: 269–98.
81. Palmer MA, Bernhardt ES and Schlesinger WH et al. Mountaintop MiningConsequences. Science 2010; 327: 148–9.
82. Kolbert E. The Sixth Extinction: AnUnnatural History, 1st edn. NewYork: HenryHolt and Co., 2014.
83. Mace GM, Masundire H and Baillie J. Biodiversity. In: Hassan R, Scholes RJand Ash N (eds). Ecosystems and HumanWell-being: current state and trends.Vol. 1. Washington, DC: Island Press, 2005, pp. 77–122.
84. Regan HM, Lupia R and Drinnan AN et al. The currency and tempo of extinc-tion. Am Nat 2001; 157: 1–10.
85. Baumert KA, Herzog T and Pershing J. Navigating the numbers: Greenhousegas data and international climate policy. USA: World Resources Institute,2005.
86. Balatsky AV, Balatsky GI and Borysov SS. Resource demand growth and sus-tainability due to increased world consumption. Sustainability 2015; 7: 3430–40.
87. Lawrence S, Liu Q and Yakovenko VM. Global inequality in energy consump-tion from 1980 to 2010. Entropy 2013; 15: 5565–79.
88. OECD. OECD Factbook 2014. Paris: Organisation for Economic Co-operationand Development, 2014.
89. World Bank. World development indicators 2014, Table 3.8: energy depen-dency, efficiency and carbon dioxide emissions. Technical report. World Bank.2014.
90. Hubacek K, Baiocchi G and Feng K et al. Global income inequality and carbonfootprints: can we have the cake and eat it too? In Dejuan O and Cadarso MA(eds). Environmental and economic impacts of decarbonization. Input-outputstudies on the consequences of the 2015 Paris agreements Abingdon, UK:Routledge, 2017 In press.
91. World Bank. World development indicators 2014. Technical report. WorldBank 2014.

490 Natl Sci Rev, 2016, Vol. 3, No. 4 REVIEW
92. Heilig GK, Buettner T and Li N et al. Future Population Trends Found to beHighly Uncertain in Least Developed Countries. 2010.
93. Gerland P, Raftery AE and Sevcıkova H et al. World population stabilizationunlikely this century. Science 2014; 346: 234–7.
94. Bongaarts J. Development: Slow down population growth. Nature 2016; 530:409–12.
95. CampbellM, Sahin-Hodoglugil NN and PottsM. Barriers to fertility regulation:a review of the literature. Stud Fam Plan 2006; 37: 87–98.
96. CampbellMM, Prata N and PottsM. The impact of freedom on fertility decline.J Fam Plan Reprod Health Care 2013; 39: 44–50.
97. Luci-Greulich A and Thevenon O. The impact of family policies on fertilitytrends in developed countries. Eur J Popul 2013; 29: 387–416.
98. Lutz W, Butz WP and KC S (eds).World Population and Human Capital in theTwenty-First Century. Oxford, UK: Oxford University Press, 2014.
99. Potts M. Sex and the birth rate: human biology, demographic change, andaccess to fertility-regulation methods. Popul Dev Rev 1997; 23: 1–40.
100. Potts M. Getting family planning and population back on track. Glob Health,Sci Pract 2014; 2: 145–51.
101. Potts M, Gidi V and Campbell M et al. Too little, too late. Int Perspect SexReprod Health 2011; 95–101.
102. PRB. World population data sheet. Technical report. Population Reference Bu-reau 2014.
103. Raupach MR, Davis SJ and Peters GP et al. Sharing a quota on cumulativecarbon emissions. Nat Clim Change 2014; 4: 873–9.
104. Stanton EA. Development without carbon: climate and the global econ-omy through the 21st Century. Technical report. Stockholm EnvironmentInstitute—US Center 2011.
105. Friedlingstein P, Andrew RM and Rogelj J et al. Persistent growth of CO2emissions and implications for reaching climate targets. Nature Geoscience2014; 7: 709–15.
106. Daly HE. Beyond Growth: The Economics of Sustainable Development. Boston,MA, USA: Beacon Press, 1996.
107. Daily G. Nature’s Services: Societal Dependence On Natural Ecosystems.Washington, DC, USA: Island Press, 1997.
108. Daily GC, Polasky S and Goldstein J et al. Ecosystem services in decision mak-ing: time to deliver. Front Ecol Environ 2009; 7: 21–8.
109. Kareiva P, Tallis H and Ricketts TH et al. Natural Capital: Theory and Practice ofMapping Ecosystem Services. New York, USA: Oxford University Press, 2011.
110. Daly HE and Farley J. Ecological Economics: Principles And Applications, 1stedn. Island Press, 2003.
111. Cleveland CJ and RuthM.When, where, and by howmuch do biophysical lim-its constrain the economic process?: a survey of Nicholas Georgescu-Roegen’scontribution to ecological economics. Ecol Econ 1997; 22: 203–23.
112. Georgescu-RoegenN. The Entropy Law and the Economic Process. Cambridge,MA, USA: Harvard University Press, 1971.
113. Ruth M. Integrating Economics, Ecology and Thermodynamics, Vol. 3 of theBook Series Ecology, Economy & Environment. Netherlands: Springer, 1993.
114. Ruth M. A quest for the economics of sustainability and the sustainability ofeconomics. Ecol Econ 2006; 56: 332–42.
115. NordhausWD, Houthakker H and Solow R. The allocation of energy resources.Brook Pap Econ Act 1973; 1973: 529–76.
116. Simon JL. The Ultimate Resource. Princeton, NJ: Princeton University Press,1981.
117. Solow RM. The economics of resources or the resources of economics. AmEcon Rev 1974; 64: 1–14.
118. Greening LA, Greene DL and Difiglio C. Energy efficiency and consumption—the rebound effect—a survey. Energy Policy 2000; 28: 389–401.
119. Polimeni JM, Mayumi K and Giampietro M et al. The Jevons Paradox and theMyth of Resource Efficiency Improvements. London, UK; Sterling, VA, USA:Earthscan, 2008.
120. Ruth M. The nature of the beast and the beast in nature: broadening the per-spective of technology. Bull Sci, Technol Soc 2009; 29: 374–82.
121. Smil V. Long-range energy forecasts are nomore than fairy tales.Nature 2008;453: 154.
122. Davis SJ and Caldeira K. Consumption-based accounting of CO2 emissions.Proc Natl Acad Sci USA 2010; 107: 5687–92.
123. Feng K, Chapagain A and Suh S et al. Comparison of bottom-up and top-downapproaches to calculating the water footprints of nations. Econ Syst Res 2011,23: 371–85.
124. Quere CL, Moriarty R and Andrew R et al. Global carbon budget 2014. EarthSyst Sci Data Disc 2014; 7: 521–610.
125. Peters GP, Davis S and Andrew R. A synthesis of carbon in international trade.Biogeosciences 2012; 9: 3247–76.
126. Peters GP. From production-based to consumption-based national emissioninventories. Ecol Econ 2008; 65: 13–23.
127. Peters GP, Minx JC and Weber CL et al. Growth in emission transfers viainternational trade from 1990 to 2008. Proc Natl Acad Sci USA 2011; 108:8903–8.
128. Sathaye J, Lucon O and Rahman A et al. Renewable energy in the contextof sustainable energy. In: Edenhofer O, Pichs-Madruga R and Sokona Y et al.(eds). IPCC Special Report on Renewable Energy Sources and Climate ChangeMitigation. Cambridge, United Kingdom and New York, USA: Cambridge Uni-versity Press, 2011.
129. Weber CL, Peters GP and Guan D et al. The contribution of Chinese exports toclimate change. Energ Policy 2008; 36: 3572–7.
130. Yu Y, Feng K and Hubacek K. Tele-connecting local consumption to global landuse. Glob Environ Change 2013; 23: 1178–86.
131. Krausmann F, Schandl H and Sieferle RP. Socio-ecological regime transitionsin Austria and the United Kingdom. Ecol Econ 2008; 65: 187–201.
132. Schaffartzik A, Mayer A and Gingrich S et al. The global metabolic transition:regional patterns and trends of global material flows, 19502010. Glob EnvironChange 2014; 26: 87–97.
133. CattonWR. Overshoot: The Ecological Basis of Revolutionary Change. Urbanaand Chicago, IL, USA: University of Illinois Press, 1980.
134. Motesharrei S, Rivas J and Kalnay E. Human and nature dynamics (HANDY):modeling inequality and use of resources in the collapse or sustainability ofsocieties. Ecol Econ 2014; 101: 90–102.
135. Guzman JM, Martine G and McGranahan G et al. Population Dynamics andClimate Change. New York, USA; London, UK: UNFPA and IIEE, 2009.
136. Ruth M and Ibarraran M. Distributional Impacts of Climate Change and Disas-ters: Concepts and Cases. Cheltenham, UK; Northampton, MA, USA: EdwardElgar Publishing, 2009.
137. DiGiulio DC and Jackson RB. Impact to underground sources of drinking wa-ter and domestic wells from production well stimulation and completionpractices in the Pavillion, Wyoming, Field. Environ Sci Technol 2016; 50:4524–36.
138. Jackson RB, Lowry ER and Pickle A et al. The depths of hydraulic fracturingand accompanying water use across the United States. Environ Sci Technol2015; 49: 8969–76.
139. Vaidyanathan G. Fracking can contaminate drinking water. Sci Am 2016.

REVIEW Motesharrei et al. 491
140. Shirzaei M, Ellsworth WL and Tiampo KF et al. Surface uplift and time-dependent seismic hazard due to fluid injection in eastern Texas. Science2016; 353: 1416–9.
141. Rosenzweig C, Iglesias A and Yang X et al. Climate change and extremeweather events; implications for food production, plant diseases, and pests.Glob Change Hum Health 2001; 2: 90–104.
142. Myers SS, Gaffikin L and Golden CD et al. Human health impacts of ecosystemalteration. Proc Natl Acad Sci USA 2013; 110: 18753–60.
143. Colwell RR. Global climate and infectious disease: the Cholera Paradigm. Sci-ence 1996; 274: 2025–31.
144. Lipp EK, Huq A and Colwell RR. Effects of Global Climate on Infectious Dis-ease: the Cholera Model. Clin Microbiol Rev 2002; 15: 757–70.
145. Lobitz B, Beck L and Huq A et al. Climate and infectious disease: use of remotesensing for detection of Vibrio cholerae by indirect measurement. Proc NatlAcad Sci USA 2000; 97: 1438–43.
146. PascualM, Rodo X and Ellner SP et al. Cholera dynamics and El Nino-Southernoscillation. Science 2000; 289: 1766–9.
147. Crimmins A, Balbus J and Gamble Jl et al. The Impacts of Climate Changeon Human Health in the United States: A Scientific Assessment. Washington,DC: United States Global Change Research Program, 2016.
148. Hsiang SM and Jina AS. The Causal Effect of Environmental Catastrophe onLong-Run Economic Growth: Evidence From 6,700 Cyclones. Working Paper20352. National Bureau of Economic Research, 2014.
149. Romeo Upperman C and Parker J et al. Frequency of extreme heat event as asurrogate exposure metric for examining the human health effects of climatechange. PLOS One 2015; 10: e0144202.
150. Hsiang SM. Temperatures and cyclones strongly associated with economicproduction in the Caribbean and Central America. Proc Natl Acad Sci USA2010; 107: 15367–72.
151. Lobell DB and Field CB. Global scale climate-crop yield relationships and theimpacts of recent warming. Environ Res Lett 2007; 2: 014002.
152. Lobell DB, Schlenker W and Costa-Roberts J. Climate trends and global cropproduction since 1980. Science 2011; 333: 616–20.
153. Moore FC and Lobell DB. The fingerprint of climate trends on European cropyields. Proc Natl Acad Sci USA 2015; 112: 2670–5.
154. Peng S, Huang J and Sheehy JE et al. Rice yields decline with highernight temperature from global warming. Proc Natl Acad Sci USA 2004; 101:9971–5.
155. Schlenker W and Lobell DB. Robust negative impacts of climate change onAfrican agriculture. Environ Res Lett 2010; 5: 014010.
156. Schlenker W and Roberts MJ. Nonlinear temperature effects indicate severedamages to U.S. crop yields under climate change. Proc Natl Acad Sci USA2009; 106: 15594–8.
157. Ban K. A Climate Culprit In Darfur. The Washington Post, June 2007.158. Burke MB, Miguel E and Satyanath S et al.Warming increases the risk of civil
war in Africa. Proc Natl Acad Sci USA 2009; 106: 20670–4.159. Hsiang SM, Meng KC and Cane MA. Civil conflicts are associated with the
global climate. Nature 2011; 476: 438–41.160. Hsiang SM, Burke M and Miguel E. Quantifying the influence of climate on
human conflict. Science 2013; 341: 1235367.161. Kelley CP, Mohtadi S and Cane MA et al. Climate change in the Fertile Cres-
cent and implications of the recent Syrian drought. Proc Natl Acad Sci USA2015; 112: 3241–6.
162. Barbieri AF, Domingues E and Queiroz BL et al. Climate change and populationmigration in Brazil’s Northeast: scenarios for 2025-2050. Popul Environ 2010;31: 344–70.
163. Feng S, Krueger AB and Oppenheimer M. Linkages among climate change,crop yields and Mexico-US cross-border migration. Proc Natl Acad Sci USA2010; 107: 14257–62.
164. Myers N. Environmental refugees: a growing phenomenon of the 21st century.Philos Trans Royal Soc 2002; 357: 609–13.
165. Houghton JT, Callander BA and Varney SK. Climate change 1992: the supple-mentary report to the IPCC scientific assessment. Cambridge University Press,1992.
166. IPCC. Climate Change 2001: The Scientific Basis. Contribution of WorkingGroup I to the Third Assessment Report of the Intergovernmental Panel onClimate Change. Cambridge, UK: Cambridge University Press, 2001.
167. IPCC. Climate change 2007: Synthesis Report. Contribution ofWorking GroupsI, II and III to the Fourth Assessment Report of the Intergovernmental Panelon Climate Change. Geneva, Switzerland: IPCC, 2007.
168. Stern N. The Economics of Climate Change: The Stern Review. New York,USA: Cambridge University Press, 2007.
169. Ruiz GM, Rawlings TK and Dobbs FC et al. Global spread of microorganismsby ships. Nature 2000; 408: 49–50.
170. Liu J, Dietz T and Carpenter SR et al. Complexity of coupled human and naturalsystems. Science 2007; 317: 1513–6.
171. Manabe S, Smagorinsky J and Strickler RF. Simulated climatology of a gen-eral circulation model with a hydrologic cycle. Mon Weather Rev 1965; 93:769–98.
172. Zebiak SE and Cane MA. A model El Nino-Southern oscillation.MonWeatherRev 1987; 115: 2262–78.
173. Cane MA, Zebiak SE and Dolan SC. Experimental forecasts of El Nino. Nature1986; 321: 827–32.
174. Koster RD, Guo Z and Yang R et al. On the nature of soil moisture in landsurface models. J Clim 2009; 22: 4322–35.
175. Calvin K, Wise M and Clarke L et al. Implications of simultaneously mitigatingand adapting to climate change: initial experiments using GCAM. Clim Change2013; 117: 545–60.
176. Edmonds JE, Wise MA and MacCracken CN. Advanced energy technologiesand climate change: An analysis using the global change assessment model(GCAM). Fondazione ENI Enrico Mattei, 1994.
177. MNP. Integrated Modelling of Global Environmental Change. An Overview ofIMAGE 2.4. Bilthoven, the Netherlands: Netherlands Environmental Assess-ment Agency (MNP), 2006.
178. Nakicenovic N and Riahi K. Model runs with MESSAGE in the Context of theFurther Development of the Kyoto-Protocol. FINAL REPORT submitted to theSecretariat of the German Advisory Council on Global Change Contract Nr.WBGU II/2003; IIASA Contract No. 03-116, International Institute for AppliedSystems Analysis (IIASA), Laxenburg, Austria, 2003.
179. Prinn R, Jacoby H and Sokolov A et al. Integrated global system model forclimate policy assessment: feedbacks and sensitivity studies. Clim Change1999; 41: 469–546.
180. Sokolov AP, Schlosser CA and Dutkiewicz S et al.MIT integrated global sys-temmodel (IGSM) version 2: model description and baseline evaluation. Tech-nical report. MIT 2005.
181. Nobre C, Brasseur GP and Shapiro MA et al. Addressing the complexity of theEarth System. Bull Am Meteorol Soc 2010; 91: 1389–96.
182. Cohen JE. Make secondary education universal. Nature 2008; 456: 572–3.183. Potts M and Marsh L. The population factor: How does it relate to climate
change. Clim Adapt 2010.184. Sulston J, Bateson P and Biggar N et al. People and the planet. Technical
Report 01/12. The Royal Society Science Policy Centre 2012.
492 Natl Sci Rev, 2016, Vol. 3, No. 4 REVIEW
185. NASA. Earth System Science: A Closer View. National Aeronautics and SpaceAdministration, Washington, DC, 1988.
186. Hannon B and Ruth M. Dynamic Modeling of Diseases and Pests. Springer,2009.
187. Hannon B and RuthM.Modeling Dynamic Biological Systems. Springer, 2014.188. RuthMand Davidsdottir B. Changing Stocks, Flows and Behaviors in Industrial
Ecosystems. Cheltenham, UK; Northampton, MA, USA: Edward Elgar Publish-ing, 2009.
189. Ruth M and Hannon B. Modeling Dynamic Economic Systems, 2nd edn.New York: Springer, 2012.
190. Costanza R and Ruth M. Using dynamic modeling to scope environmentalproblems and build consensus. Environ Manag 1998; 22: 183–95.
191. Hannon BM and Ruth M. Dynamic Modeling, 1st edn. Berlin, New York:Springer, 1994.
192. Meadows DH. Thinking in Systems: A Primer. White River Junction, VT, USA:Chelsea Green Publishing, 2008.
193. Sterman J, Fiddaman T and Franck T et al. Climate interactive: the C-ROADSclimate policy model. Syst Dynamics Rev 2012; 28: 295–305.
194. Anderson JL. An ensemble adjustment Kalman filter for Data Assimilation.Mon Weather Rev 2001; 129: 2884–903.
195. Hunt BR, Kostelich EJ and Szunyogh I. Efficient data assimilation for spa-tiotemporal chaos: a local ensemble transform Kalman filter. Physica D 2007;230: 112–26.
196. Kalnay E. Atmospheric Modeling, Data Assimilation and Predictability. Cam-bridge University Press, first edition, 2003.
197. Lorenc AC. The potential of the ensemble Kalman filter for NWP—a compar-ison with 4D-Var. Q J R Meteorol Soc 2003; 129: 3183–203.
198. Whitaker JS and Hamill TM. Ensemble Data Assimilation without perturbedobservations.Mon Weather Rev 2002; 130: 1913–24.
199. Annan JD and Hargreaves JC. Efficient parameter estimation for a highlychaotic system. Tellus A 2004; 56: 520–6.
200. Annan JD, Lunt DJ and Hargreaves JC et al. Parameter estimation in an atmo-spheric GCM using the Ensemble Kalman Filter.Nonlinear Processes Geophys2005; 12: 363–71.
201. Evensen G. The ensemble Kalman filter for combined state and parameterestimation. IEEE Control Sys 2009; 29: 83–104.
202. Kang JS, Kalnay E and Liu J et al. “Variable localization” in an ensembleKalman filter: application to the carbon cycle data assimilation. J GeophysRes 2011; 116: D09110.
203. Kang JS, Kalnay E and Miyoshi T et al. Estimation of surface carbon fluxeswith an advanced data assimilation methodology. J Geophys Res 2012; 117:D24101.
204. Liu Y, Liu Z and Zhang S et al. Ensemble-based parameter estimation in acoupled general circulation model. J Clim 2014; 27: 7151–62.
205. Liu Y, Liu Z and Zhang S et al. Ensemble-based parameter estimation in acoupled GCM using the adaptive spatial average method. J Clim 2014; 27:4002–14.
206. Ruiz JJ, Pulido M and Miyoshi T. Estimating model parameters withensemble-based data assimilation: a review. J Meteorol Soc Japan Ser II2013; 91: 79–99.
207. Buizza R, Tribbia J and Molteni F et al. Computation of optimal unstable struc-tures for a numerical weather prediction model. Tellus A 1993; 45: 388–407.
208. Buizza R, Milleer M and Palmer T. Stochastic representation of model uncer-tainties in the ECMWF ensemble prediction system. Q J RMeteorol Soc 1999;125: 2887–908.
209. Toth Z and Kalnay E. Ensemble forecasting at NMC: the generation of pertur-bations. Bull Am Meteorol Soc 1993; 74: 2317–30.
210. Tracton MS and Kalnay E. Operational ensemble prediction at the NationalMeteorological Center: practical aspects.Weather Forecast 1993; 8: 379–98.
211. Lenton TM, Held H and Kriegler E et al. Tipping elements in the Earth’s climatesystem. Proc Natl Acad Sci USA 2008; 105: 1786–93.
212. Nobre CA and Borma LDS. ‘Tipping points’ for the Amazon forest. Curr OpinEnviron Sustain 2009; 1: 28–36.
213. Schellnhuber HJ. Tipping elements in the Earth System. Proc Natl Acad SciUSA 2009; 106: 20561–3.
214. Downey SS, Haas WR and Shennan SJ. European Neolithic societies showedearly warning signals of population collapse. Proc Natl Acad Sci USA 2016;113: 9751–6.
215. Ruth M, Kalnay E and Zeng N et al. Sustainable prosperity and societal tran-sitions: long-term modeling for anticipatory management. Environ Innov SocTrans 2011; 1: 160–5.
216. Scheffer M and Carpenter SR. Catastrophic regime shifts in ecosystems: link-ing theory to observation. Trends Ecol Evol 2003; 18: 648–56.
217. Scheffer M, Carpenter S and Foley JA et al. Catastrophic shifts in ecosystems.Nature 2001; 413: 591–6.
218. Brundtland GH, Ehrlich P and Goldemberg J et al. Environment and develop-ment challenges: the imperative to act. Technical report. Barefoot College,Conservation International, International institute for Environment and Devel-opment, and International Union for the Conservation of Nature 2012.
219. Ruth M. Economic and social benefits of climate information: assessing thecost of inaction. Procedia Environ Sci 2010; 1: 387–394.
220. Boden TA, Marland G and Andres RJ. Global, regional, and national fossil fuelCO2 emissions. Technical report. Carbon Dioxide Information Analysis Center,Oak Ridge National Laboratory US Department of Energy 2013.
221. NAS. The Growth of World Population: Analysis of the Problems and Recom-mendations for Research and Training. National Academy of Sciences, Com-mittee on Science and Public Policy. Washington, D.C.: National AcademiesPress, 1963.
222. NAS. Rapid Population Growth: Consequences and Policy Implications. Na-tional Academy of Sciences, Office of the Foreign Secretary. Baltimore: TheJohns Hopkins University Press, for the National Academy of Sciences, 1971.
223. NAS. Population Growth and Economic Development: Policy Questions. Na-tional Academies of Sciences, Engineering, andMedicine, Committee on Pop-ulation, Division of Behavioral and Social Sciences and Education, NationalResearch Council. Washington, D.C.: National Academies Press, 1986.
224. NAS. Population and Land Use in Developing Countries: Report of a Work-shop. National Academy of Sciences, Committee on Population, Division ofBehavioral and Social Sciences and Education, National Research Council.Washington, D.C.: National Academies Press, 1993.
225. NAS. Critical Perspectives on Schooling and Fertility in the DevelopingWorld.National Academy of Sciences, Committee on Population, Division of Behav-ioral and Social Sciences and Education, National Research Council. Wash-ington, D.C.: National Academies Press, 1999.
226. NAS and Royal Society. The Royal Society and the National Academy of Sci-ences on population growth and sustainability: population growth, resourceconsumption, and a sustainable world. Popul Dev Rev 1992; 18: 375–8.
227. Turner A. Population priorities: the challenge of continued rapid populationgrowth. Philos Trans Royal Soc 2009; 364: 2977–84.
228. Bolt J and van Zanden JL. The Maddison Project: collaborative research onhistorical national accounts. Econ Hist Rev 2014; 67: 627–51.

REVIEW Motesharrei et al. 493
229. Maddison A. The World Economy: A Millennial Perspective. Paris: Develop-ment Centre of the Organisation for Economic Co-operation and Development,2001.
230. United Nations.World Population Prospects: The 2012 Revision, DVD Edition.Working Paper ESA/P/WP.228. United Nations, Department of Economic andSocial Affairs, Population Division, 2013.
231. Bruckner M, Giljum S and Lutz C et al. Materials embodied in internationaltrade – global material extraction and consumption between 1995 and 2005.Glob Environ Change 2012; 22: 568–76.
232. Munoz P, Giljum S and Roca J. The RawMaterial Equivalents of InternationalTrade. Journal of Industrial Ecology 2009; 13: 881–97.
233. Wiedmann TO, Schandl H and Lenzen M et al. The material footprint of na-tions. Proc Natl Acad Sci USA 2015; 112: 6271–6.
234. Ruth M. Information, order and knowledge in economic and ecological sys-tems: implications for material and energy use. Ecol Econ 1995; 13: 99–114.
235. Ruth M. Thermodynamic constraints on optimal depletion of copper and alu-minum in the United States: a dynamic model of substitution and technicalchange. Ecol Econ 1995; 15: 197–213.
236. Turral H, Svendsen M and Faures JM. Investing in irrigation: reviewing thepast and looking to the future. Agric Water Manag 2010; 97: 551–60.
237. Kendall HW and Pimentel D. Constraints on the expansion of the global foodsupply. Ambio 1994; 198–205.
238. Ramankutty N, Foley JA and Olejniczak NJ. People on the land: changes inglobal population and croplands during the 20th century. AMBIO 2002; 31:251–7.
239. Cleveland CJ and Ruth M. Indicators of dematerialization and the materialsintensity of use. J Indu Ecol 1998; 2: 15–50.
240. Seppelt R,Manceur AMand Liu J et al. Synchronized peak-rate years of globalresources use. Ecol Soc 2014; 19: 50.
241. Tripati AK, Roberts CD and Eagle RA. Coupling of CO2 and ice sheet stabilityover major climate transitions of the last 20 million years. Science 2009; 326:1394–7.
242. Bierregaard RO, Lovejoy TE and Kapos V et al. The biological dynamics oftropical rainforest fragments. BioScience 1992; 42: 859–66.
243. Ferraz G, Russell GJ and Stouffer PC et al. Rates of species loss from Amazo-nian forest fragments. Proc Natl Acad Sci USA 2003; 100: 14069–73.
244. Gibson L, LynamAJ and Bradshaw JA et al.Near-complete extinction of nativesmall mammal fauna 25 years after forest fragmentation. Science 2013; 341:1508–10.
245. Hanski I, Zurita GA and Bellocq MI et al. Species–fragmented area relation-ship. Proc Natl Acad Sci USA 2013; 110: 12715–20.
246. Laurance WF. Rapid land-use change and its impacts on tropical biodiversity.In: Defries RS, Asner GP and Houghton RA (eds). Ecosystems and Land UseChange. American Geophysical Union, 2004, 189–99.
247. Laurance WF, Laurance SG and Ferreira LV et al. Biomass collapse in Amazo-nian Forest fragments. Science 1997; 278: 1117–8.
248. Laurance WF, Vasconcelos HL and Lovejoy TE. Forest loss and fragmentationin the Amazon: implications for wildlife conservation. Oryx 2000; 34: 39–45.
249. Laurance WF, Lovejoy TE and Vasconcelos HL et al. Ecosystem decay of Ama-zonian Forest fragments: a 22-year investigation. Conservation Biology 2002;16: 605–18.
250. Lewis SL, Edwards DP and Galbraith D. Increasing human dominance of trop-ical forests. Science 2015; 349: 827–32.
251. Powell LL, Zurita G and Wolfe JD et al. Changes in habitat use at rain forestedges through succession: a case study of understory birds in the BrazilianAmazon. Biotropica 2015; 47: 723–32.
252. WWF. Living Planet Report 2016. Risk and resilience in a new era. Gland,Switzerland: World Wildlife Fund International, 2016.
253. Abel GJ and Sander N. Quantifying Global International Migration Flows. Sci-ence 2014; 343: 1520–2.
254. UNHCR. Global trends: forced displacement in 2015. Technical report. UnitedNations High Commissioner for Refugees 2016.
255. DESTATIS. Annual Report 2015. Technical report. Federal Statistical Office ofGermany 2016.
256. United Nations. The World at Six Billion. Working Paper ESA/P/WP.154.United Nations, Department of Economic and Social Affairs, Population Di-vision, 1999.
257. United Nations. World Population to 2300. Working PaperST/ESA/SER.A/236. United Nations, Department of Economic and So-cial Affairs, Population Division, 2004.
258. Lesthaeghe R. The fertility transition in Sub-Saharan Africa into the 21stcentury. Technical Report. Population Studies Center, University of Michigan2014.
259. NAS. The Determinants of Recent Trends in Fertility in Sub-Saharan Africa:A Workshop Summary. National Academies of Sciences, Engineering, andMedicine, Committee on Population, Division of Behavioral and Social Sci-ences and Education. Washington, D.C.: National Academies Press, 2016.
260. World Bank Group. Turn down the heat: confronting the new climate normal.Technical report. World Bank 2014.
261. Iyer GC, Edmonds JA and Fawcett AA et al. The contribution of Paris to limitglobal warming to 2◦C. Environ Res Lett 2015; 10: 125002.
262. Fawcett AA, Iyer GC and Clarke LE et al. Can Paris pledges avert severe cli-mate change? Science 2015; 350: 1168–9.
263. Cozar A, Echevarrıa F and Gonzalez-Gordillo JI et al. Plastic debris in the openocean. Proc Natl Acad Sci USA 2014; 111: 10239–44.
264. Jambeck JR, Geyer R and Wilcox C et al. Plastic waste inputs from land intothe ocean. Science 2015; 347: 768–71.
265. ReesWE. Revisiting carrying capacity: area-based indicators of sustainability.Popul Environ 1996; 17: 195–215.
266. Wurtenberger L, Koellner T and Binder CR. Virtual land use and agriculturaltrade: estimating environmental and socio-economic impacts. Ecol Econ 2006;57: 679–97.
267. Bazilian M, Rogner H and Howells M et al. Considering the energy, water andfood nexus: towards an integrated modelling approach. Energy Policy 2011;39: 7896–906.
268. Dale VH, Efroymson RA and Kline KL. The land use–climate change–energynexus. Landsc Ecol 2011; 26: 755–73.
269. Hussey K and Pittock J. The energy-water Nexus: managing the links betweenenergy and water for a sustainable future. Ecol Soc 2012; 17.
270. Khan S and Hanjra MA. Footprints of water and energy inputs in foodproduction—Global perspectives. Food Policy 2009; 34: 130–40.
271. Waughray D.Water Security: The Water-Food-Energy-Climate Nexus. Wash-ington, DC, USA: Island Press, 2011.
272. Shennan S, Downey SS and Timpson A et al. Regional population collapse fol-lowed initial agriculture booms in mid-Holocene Europe. Nat Commun 2013;4: 2486.
273. Kuchment A. Drilling for Earthquakes. Scientific American, 2016.274. Melillo JM, Richmond TTC and Yohe GW. Climate Change Impacts in the
United States: The Third National Climate Assessment. Washington, DC: USGlobal Change Research Program, 2014.
275. Costanza R, Kubiszewski I and Giovannini E et al. Development: time to leaveGDP behind. Nature 2014; 505: 283–5.

494 Natl Sci Rev, 2016, Vol. 3, No. 4 REVIEW
276. Anand S and Sen A. Human Development Index: Methodology and Measure-ment. Human Development Occasional Papers (1992-2007) HDOCPA-1994-02,Human Development Report Office (HDRO), United Nations Development Pro-gramme (UNDP), 1994.
277. Talberth J, Cobb C and Slattery N. The genuine progress indicator 2006. Tech-nical report. 2007.
278. Van de Kerk G and Manuel AR. A comprehensive index for a sustainable so-ciety: The SSI — the Sustainable Society Index. Ecol Econ 2008; 66: 228–42.
279. Miller RE and Blair PD. Input-Output Analysis: Foundations and Extensions.New York, USA: Cambridge University Press, 2009.
280. Murray J and Wood R. The Sustainability Practitioner’s Guide to Input-outputAnalysis. Champaign, IL, USA: Common Ground Pub., 2010.
281. Hendrickson C, Horvath A and Joshi S et al. Peer reviewed: economic input-o models for environmental life-c assessment. Environ Sci Technol 1998; 32:184A–191A.
282. Hubacek K, Feng K and Minx JC et al. Teleconnecting consumption to envi-ronmental impacts at multiple spatial scales. J Ind Ecol 2014; 18: 7–9.
283. Lenzen M, Moran D and Kanemoto K et al. International trade drives biodiver-sity threats in developing nations. Nature 2012; 486: 109–12.
284. Feng K, Hubacek K and Minx J et al. Spatially explicit analysis of water foot-prints in the UK.Water 2011; 3: 47–63.
285. Guan D and Hubacek K. Assessment of regional trade and virtual water flowsin China. Ecological Economics 2007; 61: 159–70.
286. Guan D and Hubacek K. A new and integrated hydro-economic accountingand analytical framework for water resources: a case study for North China.J Environ Manag 2008; 88: 1300–13.
287. Feng K, Hubacek K and Guan D et al. Distributional effects of climate changetaxation: the case of the UK. Environ Sci Technol 2010; 44: 3670–6.
288. Guan D, Peters GP and Weber CL et al. Journey to world top emitter: an anal-ysis of the driving forces of China’s recent CO2 emissions surge. Geophys ResLett 2009; 36: L04709.
289. Hertwich EG and Peters GP. Carbon footprint of nations: a global, trade-linkedanalysis. Environ Sci Technol 2009; 43: 6414–20.
290. Hubacek K and Sun L. A scenario analysis of China’s land use and landcover change: incorporating biophysical information into input-output mod-eling. Struct Change Econ Dynamics 2001; 12: 367–97.
291. Weinzettel J, Hertwich EG and Peters GP et al. Affluence drives the globaldisplacement of land use. Glob Environ Change 2013; 23: 433–8.
292. Barrett J, Peters G and Wiedmann T et al. Consumption-based GHG emissionaccounting: a UK case study. Climate Policy 2013; 13: 451–70.
293. Feng K, Siu YL and Guan D et al. Analyzing drivers of regional carbon dioxideemissions for China. J Ind Ecol 2012; 16: 600–11.
294. Guan D, Hubacek K andWeber CL et al. The drivers of Chinese CO2 emissionsfrom 1980 to 2030. Glob Environ Change 2008; 18: 626–34.
295. Baiocchi G, Minx J and Hubacek K. The impact of social factors and consumerbehavior on carbon dioxide emissions in the United Kingdom. J Ind Ecol 2010;14: 50–72.
296. Duchin F. The Future of the Environment: Ecological Economics and Techno-logical Change. New York, USA: Oxford University Press, 1994.
297. Srebric J, Heidarinejad M and Liu J. Building neighborhood emerging proper-ties and their impacts onmulti-scale modeling of building energy and airflows.Build Environ 2015; 91: 246–62.
298. Izquierdo AE, Angelo CD and Aide TM. Thirty years of human demography andland-use change in the Atlantic Forest of Misiones, Argentina: an evaluationof the Forest Transition Model. Ecol Soc 2008; 13.
299. Jeffrey R. Politics, Women and Well-being: How Kerala Became “a Model”.Macmillan Press Houndsmills, 1992.
300. Singh P. We-ness and welfare: a longitudinal analysis of social developmentin Kerala, India.World Dev 2011; 39: 282–93.
301. Susuman AS, Lougue S and Battala M. Female literacy, fertility decline andlife expectancy in Kerala, India: an analysis from Census of India 2011. J AsianAfr Stud 2016; 51: 32–42. Published online before print on July 14, 2014.
302. Lutz W and Samir Kc. Global human capital: integrating education and popu-lation. Science 2011; 333: 587–92.
303. La Ferrara E, Chong A and Duryea S. Soap operas and fertility: evidence fromBrazil. Am Econ J 2012; 4: 1–31.
304. Abbasi-Shavazi MJ, McDonald P and Hosseini-Chavoshi M. The Fertility Tran-sition in Iran: Revolution and Reproduction. Dordrecht, Netherlands: Springer,2009.
305. Lutz W, Cuaresma JC and Abbasi-Shavazi MJ. Demography, education, anddemocracy: global trends and the case of Iran. Popul Dev Rev 2010; 36:253–81.
306. Pritchett LH. Desired fertility and the impact of population policies. Popul DevRev 1994; 20: 1–55.
307. Roudi-Fahimi F. Iran’s Family Planning Program: Responding to a Nation’sNeeds. Washington, DC: Population Reference Bureau, 2002.
308. Vahidnia F. Case study: fertility decline in Iran. Popul Environ 2007; 28:259–66.
309. O’Neill BC, Dalton M and Fuchs R et al. Global demographic trends and futurecarbon emissions. Proc Natl Acad Sci USA 2010; 107: 17521–6.
310. Wire T. Fewer emitters, lower emissions, less cost: reducing future carbonemissions by investing in family planning. Technical report. London School ofEconomics 2009.
311. Hilboll A, Richter A and Burrows JP. Long-term changes of tropospheric NO2overmegacities derived frommultiple satellite instruments.Atmos Chem Phys2013; 13: 4145–69.
312. He H, Vinnikov KY and Li C et al. Response of SO2 and particulate air pollutionto local and regional emission controls: a case study inMaryland. Earth Future2016; 4: 2015EF000330.
313. Krotkov NA, McLinden CA and Li C et al. Aura OMI observations of regionalSO2 and NO2 pollution changes from 2005 to 2015. Atmos Chem Phys 2016;16: 4605–29.
314. Budyko MI. The heat balance of the Earth’s Surface. Sov Geogr 1961; 2: 3–13.315. Manabe S and Wetherald RT. Thermal equilibrium of the atmosphere with a
given distribution of relative humidity. J Atmos Sci 1967; 24: 241–59.316. Matthews WH, Kellogg WW and Robinson G. Man’s Impact on the Climate.
Cambridge, MA: MIT press, 1971.317. Charney JG, Arakawa A and Baker DJ et al. Carbon Dioxide and Climate: A
Scientific Assessment.Washington, DC: National Academy of Sciences, 1979.Report of an Ad Hoc Study Group on Carbon Dioxide and Climate,Woods Hole,Massachusetts, July 23-27, 1979 to the Climate Research Board, Assembly ofMathematical and Physical Sciences, National Research Council.
318. IPCC. Climate Change 2014: synthesis report. In: Core writing team PachauriRK and Meyer LA (eds). Contribution of Working Groups I, II and III to theFifth Assessment Report of the Intergovernmental Panel on Climate Change.Geneva, Switzerland: 2014.
319. Barnett J. Security and climate change. Glob Environ Change 2003; 13: 7–17.320. Brown N. Climate, ecology and international security. Survival 1989; 31: 519–
32.321. Sagdeev RZ and Eisenhower S. The global warming problem: a vital concern
for global security. In: Minger TJ (ed.). Greenhouse Glasnost: The Crisis ofGlobal Warming, 1st edn. New York; Salt Lake City, UT: Ecco Press, 1990,261–68.
322. Kintisch E. After Paris: the rocky road ahead. Science 2015; 350: 1018–9.