reviewing a decade of school desegregation 1966 … s. flemming, chairman stephen horn, vice...
TRANSCRIPT

REVIEWING ReportA DECADE OF NATIONAL SURVEYSchool °F SCHOOL SUPERINTENDENTS
DESEGREGATION
1966-1975 Staff Report U.S. Commission on Civil rightsJanuary 1977
I K K4755
UM31I.JG77 __

U.S. COMMISSION ON CIVIL RIGHTS
The U.S. Commission on Civil Rights is a temporary,independent, bipartisan agency established by Congress in1957 and directed to:
• Investigate complaints alleging that citizens arebeing deprived of their right to vote by reason oftheir racer color, religion, sex, or nationalorigin, or by reason of fraudulent practices;
• Study and collect information concerning legaldevelopments constituting a denial of equalprotection of the laws under the Constitutionbecause of race, color, religion, sex, or nationalorigin, or in the administration of justice;
• Appraise Federal laws and policies with respect toequal protection of the laws because of race, color,religion, sex, or national origin, or in theadministration of justice;
• Serve as a national clearinghouse for information inrespect to denials of equal protection of the lawsbecause of race, color, religion, sex, or nationalorigin;
• Submit reports, findings, and recommendations to thePresident and the Congress.
MEMBERS OF THE COMMISSION
Arthur S. Flemming, ChairmanStephen Horn, Vice ChairmanFrankie M. FreemanRobert S. RankinManuel Ruiz, Jr.Murray Saltzman
John A. Buggs, Staff Director

REVIEWING A DECADE OF SCHOOL DESEGREGATION
1966-75
Report
of a
National Survey of School Superintendents
A Staff Report of theUnited States Commissionon Civil RightsJanuary 1977

KF4755
. R4811977

CONTENTS
Page
I. INTRODUCTION 1Nature of Study 1Major Conclusions 3Limitations of the Data 8
II. SOURCE OF PRESSURE TO DESEGREGATE 12Introduction 12Type of Intervention, By Years 15Type of Intervention By Region 19Means of Intervention, By Type of District . 23Conlusions 32
III. MEANS OF DESEGREGATION 35Reassignment 36Busing to Desegregate 42Conclusions 50
IV. EXTENT OF DESEGREGATION 54Conclusions 67
V. WITHDRAWAL OF WHITE STUDENTS 70Background ....• 70Withdrawal of Whites by Type ofIntervention 74
Conclusions 77
VI. DESEGREGATION, DISRUPTIONS, AND ACCEPTANCE ... 82Disruptions 82Acceptance of Desegregation by Parentsand Leaders 87
Acceptance of Desegregation by SchoolOfficials and Staff 97
Conclusions 102
APPENDICESA. Research Appendix 105
B. Superintendents' Questionnaire 132
iii

TABLE Page
2.1 Distribution of school districts, by superintendent'sreport of major source of intervention, for districtsthat desegregated before 1966 or took no substantialsteps to desegregate .................... 16
2.2 Districts that desegregated, by source of interventionand year of greatest desegregation ............. 18
2.3 Regional distribution of significant steps to desegregateschool districts, by source of intervention, fordistricts desegregated 1966-75 ............... 22
2. U Distribution of school districts by region and year ofgreatest desegregation, for districts desegregatedunder pressure from the courts ............... 24
2.5 Distribution of school districts, by source ofintervention and proportion black enrollment, fordistricts desegregated 1966-75 ............... 26
2.6 Number and distribution of school districts, by sizeof community and source of intervention for districtsdesegregated 1966-75 .................... 28
2.7 Distribution of school districts, by level ofsegregation in 1968, and by source of intervention,for districts desegregated, 1966-75 ............. 31
3.1 Average unweighted percent reassignment of studentsat time of desegregation, by region and by sourceof intervention, for districts desegregated 1966-75 ..... 38
3.2 Average unweighted percent reassignment of studentsat time of desegregation by percent black and bysource of intervention for districts desegregated1966-75 .......................... 40
3.3 Average unweighted percent of minority and whitestudents bused, in the year before desegregation,and in year of desegregation, for districtsdesegregated 1966-77, by region ............... 44
3.U Average unweighted percent of minority and whitestudents bused by source of intervention fordistricts desegregated 1966-76 ............... 45
3.5 Average unweighted percent of minority and white
iv

students bused, in year before and followingdesegregation, by degree of black enrollment, fordistricts desegregated 1966-75 46
U. 1 Percent distribution of 1,157 sampled schooldistricts, by level of segregation 1968-72, andby region 56
U.2 Percent distribution of U93 sampled desegregatedschool districts, by level of segregation and bysource of intervention, 1968-75 58
i». 3 Projected number of students (in thousands) bylevel of segregation 1968 and 1972, and by region,for 2,750 districts with at least 5 percent minoritystudents and more than 1,500 enrollment 59
U,U Projection of number of students (in thousands) bylevel of segregation 1968 and 1972, and by sourceof intervention 1966-75, in 2,750 school districtswith at least 5 percent minority students and morethan 1,500 enrollment 61
4.5 Average index of segregation, 1968 and 1972, byregion and by source of intervention, for schooldistricts desegregated, 1966-75 63
U. 6 Average index of segregation, 1968 and 1972, byproportion black and by source of intervention,for school districts desegregated, 1966-75 65
U.7 Average index of segregation, 1968 and 1972, bysize of city, and by source of intervention, forschool districts desegregated 1966-75 66
5.1 Number of districts and their average reduction inproportion white, 1968-72, by form of desegregation1966-75, and by proportion black in 1968. Averagereduction is shown in percentage points 75
5.2 Number of districts and their average reduction inproportion white, 1968-72, by form of desegregation,1966-75, and by community size and type. Averagereduction is shown in percentage points 78
6.1 Proportion of desegregated school districts seriouslydisrupted, by source of intervention, 1966-75 andby proportion black, 1968 85
6.2 Proportion of desegregated school districts seriously
v

disrupted, by source of intervention and size ofcommunity 86
6.3 Proportion of desegregated school districts seriouslydisrupted, by source of intervention and by changein level of segregation 88
6. U Percent distribution of local business leaders1 supportfor desegregation immediately before desegregationand now, by source of intervention, 1966-75, asreported by school superintendents 93
6.5 Percent distribution of nonminority parents1 supportfor desegregation immediately before desegregationand now, by source of intervention, 1966-75, asreported by school superintendents 94
6.6 Percent distribution of minority parents' supportfor desegregation, immediately before desegregationand now, by source of intervention, 1966-75,as reported by school superintendents 95
6.7 Percent distribution of support for desegregation byteachers and counselors, immediately beforedesegregation and now, by source of intervention,1966-75, as reported by school superintendents 99
6.8 Percent distribution of school board support fordesegregation, immediately before desegregation andnow, by source of intervention, 1966-76, as reportedby school superintendents 100
6.9 Proportion of desegregated school districts seriouslydisrupted, by source of intervention, 1966-75 and bysupport of school board for desegregation immediatelybefore implementation, as reported by school superintendents ..101
A-1 Sampling rates for Office for Civil Rights Surveyof School Districts, and for U.S. Commission on CivilFights Survey of school District Superintendents 107
A-2 Number of districts and number of students, byminority status, in nation, in sampling universe,in sample drawn, and in responding districts, 1972 108
A-3 Weights used in Section IV to project from sample of874 districts to 2,750 districts, based upon samplingproportion, size of district, and proportion blackenrollment 112
vi

A-U Comparison of two measures of desegregationintervention: "Major Source of Pressure" and"Highest Type of Intervention" 120
A-5 Students bused at public expense 124
A-6 Examples of levels of segregation indicated by indexof segregation in hypothetical school districts withvarying proportions of black and white students inschools 127
A-7 Sampling errors for estimated percentages (at 95percent confidence level) 129
MAP
2,1 Regional areas included in Commission's national survey ... 21
FIGURES
6.1 Business leaders: general response to schooldesegregation, just before desegregation and in1976, in districts that desegregated 1966-75, asreported by school superintendents 92
6.2 Nonminority parents: general response to schooldesegregation, just before desegregation and in1976, in districts that desegregated 1966-75, asreported by school superintendents 92
vii


ACKNOWLEDGMENTS
This report was written by John Williams, who alsoconducted the data analysis with the assistance of RichardTaborf Beverly White, and Lloyd Temme. The design of thestudy, the questionnaire, and data collection were under thegeneral supervision of Gregg Jackson, with the assistance ofDolores Bartning, Jeannette Johnson, and Claudette Brown.Ki-Taek Chun prepared the sample from a tape provided byHEW1s Office for Civil Rights. Jeana Wirtenberg and SandraTangri participated in initial pretesting of thequestionnaire.
The Commission is indebted to the following staff whoconducted the telephone interviews: Delores Bartning,Norman Bober, Claudette Brown, Henry Dawson, CynthiaFreeman, Elda Gordon, David Grim, Kenneth Harriston,Jeannette Johnson, Martha Jones, Joyce Long, David Pales,Martha Proctor, Zenobia Purry, Carolyn Reid, PatriciaReynolds, Aloen Townsend, and Loretta Ward.
Mailing out and logging in of questionnaires was doneby Ki-Taek Chun, Diane Hiligh, Pamela Proctor, Cathy Somers,and Beverly White. Cathy Somers typed the first draft.Final production was the responsibility of VivianWashington, Deborah Harrison, Vivian Hauser, and RitaHiggins, supervised by Bobby Wortman, in the Commission*sPublications Support Center.
We appreciate the assistance of the following reviewersof the first draft of the report: Caroline Gleiter, EleanorJenkins, Jim Lyons, Gene Mornell, Gary Orfield, ThomasPettigrew, Ray Rist, and Al Smith. Gregg Jackson, who leftthe Commission before the study was completed, also reviewedthe report.
The report was prepared under the overall supervisionof Sandra Tangri, Director, Office of Research.
ix


I. INTRODUCTION AND SUMMARY
NATURE OF STUDY
In November of 1975, the U.S. Commission on Civil
Rights announced a series of projects designed to provide a
national assessment of school desegregation. These projects
included formal hearings, open meetings, case studies, and
this national survey. The report Fulfilling the Letter and
Spirit of the Law presents the findings and conclusions of
these projects, and was released in August 1976. This
survey is part of that broader effort to increase the
accuracy and comprehensiveness of information on school
desegregation and to promote further understanding of the
processes of desegregation.
The objective of the national survey was to collect
factual and attitudinal data on recent experience with
school desegregation from superintendents in a
representative sample of 1,292 school districts which
constitute 47 percent of all school districts in the country
having at least 5 percent minority enrollment and a student
enrollment of 1,500 or more. The superintendents were asked
to describe selected aspects of the nature and timing of
steps taken to desegregate the schools and the degree of
acceptance of the desegregation by school staff, parents,
and community leaders. Usable responses were obtained from
1

996 school superintendents, representing 77 percent of the
samp ed school districts.* Data from the questionnaires
were merged with demographic data on the school districts as
collected by the Office for Civil Rights (OCR) of the
Department of Health, Education, and Welfare (HEW) for the
years 1968, 1970, and 1972.2 These years bracket the period
of maximum desegregation activity.
The study fills a void in the analysis of school
desegregation policy by presenting both demographic data and
superintendents1 reports of the processes and consequences
of desegregation for a large and nationally representative
body of school districts. Individual case studies have
highlighted the problems and successes of individual school
districts without providing a convincing national view of
the totality of the experience with desegregation.3 Previous
studies based solely on Office for Civil Rights data have
not had access to data on the nature and timing of
desegregation policy and action,4 and have been limited
primarily to an examination of "white flight." Other
studies that have merged OCR data with other data have been
geographically limited, as in a study of 86 northern school
districts.s
The major analytic variable of this study is the nature
and timing of steps to desegregate. Such steps may follow a
2

Federal court order; they may be imposed through the threat
of withdrawal of Federal funds by the HEW Office for Civil
Rights; or they may be a consequence of State or local
pressures from State officials, local school boards, civil
rights groups, or concerned citizens. The study focuses
upon an analysis of which source of desegregation pressure
was applied in what kinds of situations; how these pressures
were translated into desegregation steps; how effective
these steps for desegregation were; and what some of their
consequences were.
MAJOR CONCLUSIONS
The major conclusion that emerges from this survey is
that desegregation actions taken over the last 10 years were
effective in achieving sweeping reductions in the isolation
of racial and ethnic minorities within numerous school
districts. For the most part, major desegregation actions
were accomplished with minimal disruption of the educational
process. Whereas the superintendents report that strong
opposition to desegregation existed prior to its
implementation, they say that today a majority of school
staff, students, parents, and community leaders accept
school desegregation in most districts that took substantial
steps to desegregate. The conclusion holds true for
districts desegregated under a court order, those that
3

desegregated under HEW pressure, and those that desegregated
under State or locally-developed pressure.
Extent of Desegregation Actions
Substantial steps to desegregate schools during the
period 1966-75 are reported in an estimated 1,UOO school
districts. While these districts represent a small
proportion of the 19,000 school districts in the country,
they encompass about half of the minority public school
children in the country. Although the actions to
desegregate were most heavily concentrated in the Southern
and Border States, such actions were found in moderate
number in the Northern and Western States.
Nature of Pressure to Desegregate
Approximately 37 percent of the districts that
desegregated were described by the superintendents as
desegregating primarily because of intervention from the
courts, 26 percent from HEW pressures, and 37 percent from
local or State pressure. Districts which desegregated under
local pressures generally had low initial levels of
segregation and low proportions of minority students. Among
the remaining districts, HEW pressure was described as
primary in smaller cities and rural areas in the South that
had high initial levels of segregation and moderate
proportions of black students (10 to 40 percent) . Court
4

orders were most often reported in districts with high
levels of segregation in 1968 and with high proportions of
minority students.
Reassignment and Busing to Desegregate
Desegregation required the reassignment of large
numbers of students. Among those districts that
desegregated during the last 10 years, an average of 30
percent of the students were reported reassigned in the year
of maximum desegregation. Despite the large proportions of
students reassigned, there was only a 5 percent increase
reported in proportion bused in the desegregating districts,
implying that a high degree of physical desegregation was
attainable in the affected districts with a rather modest
increase in busing. There was no evidence to suggest that
court intervention resulted in any greater increase in
proportion of students bused than desegregation that
resulted from HEW or local pressure.
Reduction of Segregation Within School Districts
The extent of segregation within districts diminished
sharply during the period 1968-72. Among larger districts
with at least a 5 percent minority enrollment, 38 percent
had an index of segregation greater than 0.50 in 1968,
indicating a high level of segregation; such a high level
was found in only 7 percent of these districts in 1972. The
5

changes were greatest in the Southeast, which had a smaller
proportion of highly segregated districts in 1972 than any
region of the country.
Those districts that desegregated primarily under
pressure from the courts had enrollments of 7.5 million
students in 1972. These districts reduced their average
index of segregation from 0.74 (high) in 1968 to 0.15
(relatively low) in 1972. Not only did the courts intervene
in districts that had high levels of segregation initially,
but they intervened with great effect.
Withdrawal of White Students
Very little variation is evident in the average
reduction of proportion of white students between the
districts that have desegregated and those that have not; or
between those that have desegregated by court order, by HEW
pressure, or by local initiative. These data, therefore, do
not support the inference that there is a general
relationship between desegregation actions and withdrawal of
white students.
The reduction in the percentage of white students does
appear to be related to the proportion of black students,
but this is irrespective of whether desegregation has taken
place. In the 4 years 1968-72, districts that had greater
than 40 percent black enrollments in 1968 experienced a
6

reduction of 15 percentage points in the proportion of white
students, a much greater drop than in districts with lower
proportions of black enrollment.
Although these data do not exclude the possibility or
even likelihood that some individual white families do
withdraw their children from public schools as a consequence
of desegregation, these individual decisions do not occur
with sufficient frequency to create a discernible nationwide
pattern of association between desegregation and relative
loss of white students. The drop in proportion of whites
has been greatest in the larger central cities, an
historical trend that antedates the desegregation of
schools.
Disruption and Acceptance of Desegregation
Serious disruptions of the educational process were
reported in less than one-fifth of the districts that took
substantial steps to desegregate over the last 10 years.
The implementation of desegregation was followed by
substantial positive changes in reported community-wide
attitudes toward school desegregation in a majority of
school districts. Teachers and counselors in the school
system strongly support the desegregation. In only 5
percent of the desegregated districts do school
7

superintendents see school staff to be generally opposed to
the desegregation.
LIMITATIONS OF THE DATA
The basic data for this study are the responses of
school superintendents to a relatively short questionnaire.
These data provide a general statistical description of the
nature and impact of school desegregation based on a few
indicators that provide a consistent and uniform body of
data. School desegregation is complex; its implementation
varies considerably from one community to another, and the
outcomes of desegregation are difficult to measure in any
one location, let alone in school districts throughout the
country.
The superintendents' reports of desegregation actions
and outcomes are not necessarily fully objective or accurate
descriptions of the desegregation process as it actually
occurred in each community. In some school districts, the
reports were filled out by the superintendent's staff rather
than the superintendent. One-fifth of the superintendents
were not living in the school district at the time of
desegregation. In some cases, superintendents' reports of
the means of desegregation (such as number of students bused
to desegregate) were based upon best estimates rather than
hard data. The superintendents' responses may contain
8

multiple biases. Superintendents may have provided more
favorable reports on outcomes of desegregation insofar as
they were not likely to provide negative assessments of
steps they had implemented. On the other hand, it has also
been suggested that some superintendents may present a
negative assessment in hopes that such judgments would be
used to oppose desegregation efforts. Both such biases
could be either intentional or subconscious. It is
difficult to determine the degree to which these biases
affect the collected information. The safest presumption is
that both occurred to some extent and that one bias will
partly compensate for the other. The biases would most
seriously affect the responses about disruptions of the
educational process or acceptance of desegregation. The
data on increased community acceptance would be more
convincing if a sample of parents or business leaders had
been surveyed just before desegregation and 3 years after
desegregation.
Nevertheless, school superintendents are probably the
respondents who can most accurately describe desegregation
steps in their districts. They have, as a group, a broad
picture of the incidents and pressures that preceded
desegregation. They are aware of actions taken in the
community to oppose or support desegregation actions. While
9

the reports of the school superintendents must be
interpreted with due caution, we believe that, as a group,
they provide a representative picture of the nature of
desegregation as it has occurred over the last 10 years.
10

Notes to Section I
1. For detailed discussion of sampling plan andmethodology, see appendix A. A copy of the questionnaireused is included in appendix B.
2. A technical description of the OCR survey data is givenin appendix A. Data collected by OCR for 1974 were notavailable at the time this study was made.
3. For a description of case studies prepared by thisCommission, see U.S., Commission on Civil Rights, Fulfillingthe Letter and Spirit of the Law (1976) .
4. See, for example, James S. Coleman, Sara D. Kelly, andJohn A. Moore, Trends in School Segregation, 1968-73(Washington, D.C.: Urban Institute, August 1975). AlsoReynolds Farley, "School Integration and White Flight"(paper presented at the Symposium on School Desegregationand white Flight, Brookings Institution, Washington, D.C. ,August 1975).
5. Christine H. Rossell, "School Desegregation and WhiteFlight," Political Science Quarterly, vol. 90, no. 4 (Winter1975-76), pp. 675-95.
11

II. SOURCE OF PRESSURE TO DESEGREGATE
INTRODUCTION
The term "Source of Pressure to Desegregate" refers to
the response given by school superintendents who were asked
in the questionnaire to indicate "which was the single most
important source of pressure for initiation of
desegregation" in their district. The superintendents
checked one of the following: the courts, HEW, civil rights
organizations, local school officials. State boards of
education; or they specified another source of pressure. It
must be remembered that the analysis is based upon the
reports of school superintendents as to the single most
important source of pressure to desegregate. In fact, in
many districts, desegregation was a process that came as a
result of pressures from many sources.
Strictly speaking, the courts are never a "source of
pressure" to desegregate. They have in fact served as a
means of last resort. When all else has failed, local
parents and civil rights groups have brought suit to achieve
their rights. In some cases, the United States Attorney
General has taken the desegregation case into the courts as
required by the Civil Rights Act of 1961. In such cases,
the resulting court orders may be perceived as the primary
12

"source of pressure11 and clearly the major impetus to the
following desegregation of some school districts.
The desegregation activity that took place during the
10 years after 1965 may be contrasted with that of earlier
years. Voluntary plans and "deliberate speed" were no
longer acceptable to HEW or to the courts. Many districts
took steps overnight that changed the school systems from
being predominantly segregated to predominantly
desegregated. These steps were often taken following direct
HEW threat to cut off Federal funds or subsequent to a
specific court order. The analysis in this section groups
the desegregated districts by major source of pressure to
desegregate: courts, HEW, or local.
The category "local pressure" is used in this report to
refer to districts whose superintendents report that the
primary pressure for desegregation was from local school
officials, State boards of education, local civil rights
groups, or other local pressures. About a fifth of the
responding superintendents reported that their districts
desegregated primarily under the impetus of local pressures.
This is not to say that the "local" desegregation was
voluntary. Many districts that describe their desegregation
as locally initiated may have been influenced by HEW. The
threat of cutoff of funds and the possibility of Justice
13

Department litigation can create the sense of inevitable
change that makes the development of a local plan seem
advisable. As shown later, two-thirds of the districts with
locally-initiated plans had less than 20 percent black
enrollments, compared to one-third of those pressured by HEW
and one-fifth of those where the primary impetus is said to
have come from the courts. The grouping of the districts
into the three categories was analytically useful.
Districts that, according to superintendents, desegregated
under pressure from the courts, those pressured by HEW, and
those with locally initiated plans were relatively distinct
groups of districts, as discussed below.
While pressure to desegregate often came from all three
sources within a district, during this 10-year period one of
the sources of pressure was usually reported as primary.
Starting in 1965, HEW started to play a decisive role in
initiating enforcement in hundreds of highly segregated
districts. This enforcement continued until 1970, when the
administration withdrew substantial support from the
desegregation effort. The courts played a more substantial
role in 1970 and 1971.» In those districts in which
desegregation did not result from local pressures or HEW*s
enforcement activities, local citizens turned to the courts.
14

This section describes the number and kinds of
districts that took substantial steps to desegregate during
the 10 years starting in 1966r the major perceived source of
pressure to desegregate, and the situations in which these
pressures were applied. The superintendents are a
knowledgeable group for judging the source of pressure. It
may be noted that 79 percent of the superintendents said
they were living in the district at the time of maximum
desegregation. Those who were not living in the area also
answered the questionnaires, and the response to the source
of pressure is presumably based upon what they learned in
the community after moving to the district. In some cases,
the questionnaires are known to have been completed by other
school staff, who are presumed to be knowledgeable about
desegregation in their respective districts.
TYPE OF INTERVENTION, BY YEARS
As seen in table 2.1, approximately 20 percent of the
responding school superintendents reported that their school
districts had desegregated under primary pressure by the
courts; 14 percent under pressure from HEW; and 20 percent
under plans developed at the local or State level. The
remaining 46 percent had either already desegregated before
1966 or took no substantial steps to desegregate during this
period. Previously collected data on the level of
15

Table 2.1 Distribution of school districts, by superintendentsreport of major source of intervention, for districts thatdesegregated 1966-75, and for districts that desegregated before1966 or took no substantial steps to desegregate.
* These 31 districts were reported to havetaken steps to desegregate, but superintendents failedto report either the year of maximum desegregation, majorsource of intervention, or both.
16

segregation in 1968, 1970, and 1972 were available for
districts in the Commission's sample. These data indicate
that the level of segregation and changes in the level for
1968-72 were about the same in the districts that returned
the questionnaire and those that failed to return them.
Based on this information, it is estimated that more than 50
percent of the 2,750 school districts with at least 5
percent minority students and enrollments greater than 1,500
took substantial steps to desegregate during the last 10
years.
For the districts sampled, superintendents reported
that approximately two-thirds had taken substantial steps to
desegregate; of these, 85 percent experienced the most
desegregation during the 1966-75 period. As seen in table
2.2, the desegregation activity was highly concentrated
during 1968-71; 56 percent of all desegregated districts
undertook their greatest desegregation during that U-year
period.
The role of the courts is seen to be relatively small
until 1968. In only 20 out of 160 districts that
experienced their greatest reduction of segregation before
1968 did the courts provide major desegregation pressure.
Implicit in the data is the hesitancy of the courts to force
major shifts in school segregation for 14 years after the
17

Table 2.2 Districts that desegregated, by source of intervention andby year of greatest desegregation.
Source of Intervention
Time period Courts HEW State-local TotalNo. % No. % NO. % Nov %
1901-53 * * * * 6 3 6 11954-65 12 6 18 12 52 21 82 131966-67 8 U 19 12 45 18 72 121968-69 53 26 42 28 34 13 129 211970-71 107 51 61 40 46 18 214 351972-73 12 6 5 3 38 15 55 91974-75 15 7 7 5 31 12 53 9
Total 207 100 152 100 252 100 611** 100
Percent 34* 25% 41% 100%
* None in sample.
**Five cases are missing because of lack of data ontime period.
18

1954 Brown decision. Court action on school desegregation
was greatest during the years 1968-71; 77 percent of the
court-pressured desegregation occurred during that period.
HEW pressure was greatest during the period 1966-71.
Only 12 superintendents in school districts that undertook
desegregation after 1971 perceived that HEW was the most
important source of pressure. Locally-initiated
desegregation actions were more uniformly distributed
throughout the period, showing no sharp variation from year
to year during the last decade.
After 1972, there was a sharp decline in the number of
districts initiating desegregation. If anything, the courts
and HEW have become relatively inactive as a major source of
pressure to desegregate. Since 1972, the initiation of
substantial steps to desegregate has been taking place at a
slower rate than at anytime since 196U.
TYPE OP INTERVENTION, BY REGION
There is great variation in the pace of desegregation
by region. Before 1965, most school districts in the
Southeastern and West South Central States could be
described as highly segregated, while a majority of
districts in the Northeastern, North Central, and Western
States were not highly segregated and did not have to
undergo extensive desegregation.
19

Map 2.1 shows the delineation of the regions used in
this analysis. The regions used roughly parallel census
regions, except that the border region consists of Delaware,
Maryland, Kentucky, and West Virginia, which are taken from
two census regions: South Atlantic and East South Central.
The remaining states in these two regions are labelled
"Southeast." The New England and Middle Atlantic census
regions form the Northeast region; the East and West North
Central regions are brought together for the "North Central"
region; and the Mountain and Pacific States and Alaska form
the "West" region. Hawaii, which did not have major
desegregation during the decade, was excluded from the
study.
As seen in table 2.3, more than half of the respondents
in the Northeastern, North Central, and Western regions
indicated that their districts had not taken substantial
steps to desegregate. Only 16 out of 300 responding
superintendents in the Southeast indicated that their
districts had not taken substantial steps to desegregate.
The courts and HEW have been primarily active in
intervention in the Southern States. Within the sample, 90
percent of the cases in which courts were perceived to be
the most important source of pressure were located in the
Southeast or West South Central regions. Ninety-five
20

21

22

percent of those districts in which HEW was perceived as
most important were in these regions also. Local
initiatives were more evenly distributed throughout the
regions. Of the districts that took substantial steps to
desegregate during the last decade, 71 percent were located
in the Southeast and West South Central regions.
While desegregation has been concentrated in the South,
the data show desegregation activity taking place in other
regions as well. Out of 526 school districts that
desegregated during the last decade 148 were located outside
of the South, and within 124 of these, the primary source of
pressure to desegregate was considered to be local or state
pressure. Within the sample, there are very few cases of
perceived court or HEW pressure outside of the South. There
is no support for the belief that the courts are now turning
their attention to northern school districts in any
concentrated way. As may be seen in table 2.4, there were
only 25 districts desegregated between 1972 and 1975 in
which the courts were considered the primary source of
pressure to desegregate, and within these 25 districts, only
7 were outside of the Southern and Border States.
MEANS OF INTERVENTION, BY TYPE OF DISTRICT
The means of intervention is by no means randomly
distributed in school districts. Very marked patterns of
23

24

characteristics describe those districts in which courts
were perceived as the most important pressure for
desegregation. Similarly, those that desegregated under
State or local pressure have a corresponding set of
distinguishing characteristics. The demographic
characteristics examined in this study were: geographic
region, proportion black, size of district, size of
community or city, and the index of segregation.
In the overall sample, more than two-thirds of the
sampled school districts with enrollments more than 40
percent black were located in the Southeast, and 83 percent
of them were in the Southeastern and West South Central
regions. These districts were least likely to be
desegregated by local initiative or HEW pressure and were
most likely to be desegregated under pressure from the
courts. As seen in table 2.5, more than half of the court
interventions took place in districts with enrollments above
UO percent black, compared to 23 percent of the HEW-
pressured districts and 11 percent of the locally-initiated
plans. On the other hand, among 99 districts that
desegregated after 1965 and that had enrollments of less
than 10 percent black in 1968, 75 desegregated under local
initiative and only 8 desegregated under court pressure.
HEW was most likely to be reported as the major pressure
25

26

where the proportion of minority students was 20 to 40
percent, although within this group there were many
districts that were under a court order and a moderate
number that desegregated under local pressure.
The interventions differed considerably by the size and
type of community desegregated. Most strikingly, the
intervention of HEW was concentrated heavily outside of
metropolitan areas. As is seen in table 2.6, 99 out of the
133 districts that desegregated under pressure from HEW were
in small towns or rural areas. In only 8 out of 103 large
desegregated cities over 50,000 was HEW described as the
primary source of desegregation pressure. The focus of HEW
was found particularly in the smaller districts in the South
that had less than UO percent minority students.
Local initiatives were most frequently cited as the
major source of pressure in large cities and suburban areas
when the proportion black was less than 20 percent. HEW was
less important in such areas, at least as viewed by the
school superintendents.
The size of the district measured in terms of student
enrollment was not strongly associated with source of
desegregation pressure. The type of community and
proportion black were more significant factors.
27

28

To measure the extent to which desegregation was
actually achieved within a school district, a previously
developed index of segregation2 was computed for 1968, 1970,
and 1972. The data used to compute the index came from the
Office for Civil Rights (HEW) surveys of 1968, 1970, and
1972. The index ranges from zero (no segregation) to 1.0
(complete segregation). It measures the extent to which
minority pupils are evenly distributed among the schools in
a district. For instance, if the proportion of minority
pupils is the same in every school in the district, the
index would be zero (no segregation). The more disparate
the proportions of minority pupils are in the various
schools, the higher the index will be; so that if some
schools have 100 percent minority enrollment and all the
others have no minority enrollment, the index would be 1.0.
If the index of segregation is below 0.20, the level of
segregation may be described as relatively low. If the
index ot segregation is greater than 0.50, the degree of
segregation in the district is substantial.3
Although the index of segregation is calculated in the
same manner as that used in previous studies, the average
levels differ for three reasons. First, the sampling frame
is different. Coleman1s recent study (1975) of trends in
segregation provided the regional levels of segregation for
29

the 8,000 districts covered by the OCR survey, whereas this
study covers a sample of 1,292 districts selected from the
2,750 districts that had at least 1,500 students and at
least a 5 percent minority enrollment.4 Second, data for
1968 are not as complete as for 1972. For 10 percent of the
districts in the 1972 sample, no data are available for
1968. The lack of data is primarily a consequence of
changed boundaries or consolidation of school districts.
Third, data presented in some tables are limited to those
districts from which responses were obtained from the
superintendents. No major differences in levels of
segregation were found between responding and nonresponding
districts.
In 1968, 38 percent of the sampled districts had an
index of segregation of 0.5 or higher. Among the
respondents surveyed, 87 percent of these districts were
reported to have taken substantial steps to desegregate
during the last 10 years. As seen in table 2.7, the
emphasis of the courts was almost exclusively on this group
of districts. Of districts desegregated under court
pressure during the last 10 years, 87 percent had an index
of segregation greater than 0.50 in 1968. Some of those
that had a low level of segregation in 1968 had already
30

31

desegregated during the 1966-68 period. However, as seen in
table 2.2, most of the desegregation took place after 1968.
HEW efforts were similarly concentrated in districts
that had high levels of segregation. Sixty-one percent of
the districts that desegregated under pressure from HEW had
high levels of segregation in 1968, and 25 percent had
medium levels of segregation.
However, where local initiatives to desegregate were
reported to provide the major source of pressure, initial
levels of segregation were generally low or moderate.
Within these districts, 52 percent had a low level of
segregation in 1968 (index less than 0.2), and only 23
percent had an index of segregation greater than 0.50.
CONCLUSIONS
While it is often argued that desegregation under local
impetus is preferable to Federal intervention from the
courts or HEW, local efforts to desegregate the schools in
the last 10 years were generally reported as most important
only in districts that had low initial levels of.
segregation, low proportions of minority students, and were
in cities or metropolitan areas. These may be the districts
with the least resistance to desegregation.
Among the remaining districts, HEW pressure was
primarily found in districts in smaller cities and rural
32

1areas in the South that had high initial levels of
segregation and moderate proportions of black students.
Court orders were most often reported in districts with high
levels of segregation in 1968 and were particularly
concentrated in districts that had high proportions of black
students. These are probably the districts having the
greatest degree of resistance to desegregation. Immediate
and effective desegregation in these districts could
apparently be achieved only under court order.
33

1. Most of the court cases throughout the country weredeveloped in the Federal district courts. Three SupremeCourt decisions had a substantial impact upon districtcourts as well as local school officials. These were Greenv. County Board of Education, 391 U.S. 430 (1968), Alexanderv. Holmes County, 396 U.S. 19 (1969) (per curiam) , and Swannv. Charlotte-Mecklenberg Board of Education, 402 U.S. 1(1971). In the first two cases, the Court pointed out that"deliberate speed" and "freedom of choice" as means todesegregate were no longer constitutionally permissible,respectively. In the Swann case, the Supreme Court grantedthe district courts considerable leeway in devising remediesfor de -jure segregation. These decisions had impact ondesegregation actions, even if the actions were perceived bysuperintendents as precipitated by HEW or local pressures.
2. James S. Coleman, Sara D. Kelly, and John A. Moore,Trends in School Segregation, 1968-73 (Washington, D.C.: TheUrban Institute, 1975). For details on technicaldefinition, see appendix A. The index of segregationcorrelates +0.88 over 2,400 school districts with a morestandard dissimilarity index of school segregation, asdescribed in Barbara Zolotch, "An Investigation ofAlternative Measures of School Desegregation," in Institutefor Research on Poverty Discussion Papers (Madison:University of Wisconsin, 1974).
3. Table A-6 in appendix A describes hypothetical racialdistributions in three different school systems thatcorrespond to an index of segregation of 0.50, 0.20, and0.02.
4. See description of sampling design in appendix A.
34
Notes to Section II

III. MEANS OF DESEGREGATION
Desegregation requires the reassignment of some
children to new schools. Many school systems responded to
the necessity of desegregation by reorganizing the entire
school system. For example, junior high schools became
elementary schools; obsolete school buildings were phased
out; new schools were constructed. In some smaller
districts, a districtwide high school was built, replacing
several smaller and antiquated schools. In some districts
the reorganization resulted in the reassignment of 100
percent of the students. In other districts, less than 10
percent of the students were reassigned as a means of making
minor adjustments of the racial distribution within the
school system.
Superintendents reported on the questionnaire the
percentage of students reassigned in the year of maximum
desegregation. The questionnaire did not provide an
opportunity for more detailed explanation of the reasons
behind the reassignment or the particular problems and
solutions that evolved in developing the desegregation plan.
The reassignment of students was associated with
changes in the extent of busing. In a number of districts
busing actually decreased following the year of greatest
desegregation, and integration made it possible for some
35

students to attend schools closer to home. Reassignment of
students to achieve desegregation more typically brought
increases in the percentage of students bused. The data
show that the increases in busing among white students were
generally small, and minority children typically bore a
disproportionate share of the increased busing.
REASSIGNMENT
The reassignment of students provides one measure of
the extent of administrative action required to desegregate
a school district. The greater the percentage of students
reassigned, the greater the change in previous attendance
patterns. In fact, one study defines school desegregation
as "the reassignment of black or white students by a local
governmental body or court for the purposes of school
integration.111 A measure of reassignment proved to be
highly related to type of action to desegregate.
Superintendents were asked to report the percentage of
students reassigned in the year of maximum desegregation.
In some school districts, the superintendents had not
calculated or did not know the number of students
reassigned, so that in these school districts, the figures
are estimates rather than calculations from school records.
However, the number and percentage of students reassigned
has so often been a point of contention in desegregation
36

plans that most school systems had determined that
statistic, and most superintendents did reply to the
question. Among those districts in which superintendents
reported a primary source of pressure to desegregate, and
indicated that desegregation took place during the last 10
years, 99 percent also reported the percentage of students
reassigned.
Table 3.1 shows the reported percentage of students
reassigned by type of intervention and by region. Overall,
in 518 districts desegregated during the decade, an average
of 31 percent of the students were reassigned in the year of
greatest reduction in segregation.
The percentage reassigned was very much related to the
form of intervention. For locally-initiated plans,
approximately 20 percent of the students were reassigned.
For HEW plans, 3U percent were reassigned; and court
intervention was followed by 40 percent reassignment. These
differences among the sources of intervention obtained in
most regions.
Reassignment was greatest in Southern school districts.
In the Southeast, an average of 40 percent of the students
was reassigned at the time of desegregation; 29 percent in
the West South Central region. Within other regions of the
37

38

country, about 16 to 20 percent of the students were
reassigned.
As seen in table 3.2, there was a strong relationship
between the percentage of students reassigned and the
proportion black enrollment. The greater the percentage of
black students in a school system, the more students were
reassigned to achieve desegregation. Within the 201 sampled
desegregated districts with less than 20 percent black
enrollment, an average of 16.5 percent of the students was
reassigned in the year of maximum desegregation. But in 140
districts that had at least 40 percent black students, an
average of 49 percent of the students was reassigned in the
year of maximum desegregation. When nearly half of a
district1s students are reassigned to desegregate a school
system, a change of major proportions is indicated,
affecting large numbers of families with school-age
children.
Reassignment of students was also greater where courts
were the primary intervention than where other interventions
were primary. This appears to be primarily a consequence of
the greater likelihood of court intervention in districts
with high proportions of minority students (and greater
initial segregation; see table 4.2). Among districts with
20 to 40 percent black students, 31 percent of the students
39

40

were reassigned under court pressure, whereas 37 percent
were reassigned where HEW was considered to be the most
important source of pressure. Among districts with
enrollments more than 40 percent black, the degree of
reassignment of students was slightly less for court
intervention than for HEW intervention (but more than for
local intervention). These data show that court orders do
not appear to have reguired more reassignment than
desegregation plans approved by HEW when black enrollment is
greater than 20 percent.
Desegregation plans that developed under local
pressures resulted in somewhat less reassignment than those
developed under pressure from the courts or HEW. However,
there was substantial reassignment of students in these
districts also. Approximately 20 percent of the students
were reassigned in order to desegregate these districts.
Two-thirds of the districts that desegregated under local
initiatives had enrollments less than 20 percent black and
used less reassignment to desegregate than did the courts or
HEW in districts with less than 20 percent black enrollment.
The proportion of black students was more strongly related
to the number of students reassigned than was the form of
intervention. But the relationship between proportion black
and number reassigned is mediated by a third variable,
41

initial level of segregation. If segregation was greater in
districts with higher black enrollments, more reassignment
would be needed to achieve a given level of desegregation.
This is in fact the case, since districts with high levels
of black enrollment were more segregated than districts with
low levels of black enrollment, and court "pressured"
districts had the highest initial levels of segregation (see
table a.6).
BUSING TO DESEGREGATE
Court-ordered busing to desegregate the schools has
been a favorite target for those opposed to the use of
Federal pressure to achieve desegregation, and previous
surveys show that even people who accept the necessity of
desegregation sometimes oppose the use of busing.2 This
study represents a first national attempt to gather detailed
data on the numbers of white and minority children bused
before and after desegregation in order to determine how
much increase in busing has occurred.
Data on busing are difficult to obtain and present
problems for analysis. Many school districts do not keep
data on the numbers of students bused at public expense or
do not have the data in such a form that they can readily
supply the numbers of minority and nonminority children
bused. Superintendents in the sampled districts were asked
42

to report the number of minority and nonminority students
bused in the year immediately before desegregation and in
the year of desegregation. Nearly one-third of the
superintendents reported the percentage of students bused
rather than the number. The merging of the data for those
who responded in percentages with those who responded with
number of students proved difficult.3 Usable responses were
obtained from about half of the desegregated districts.
There were problems in the analysis of the data,
particularly in those school districts that have experienced
rapid demographic changes. In school districts that lost
substantial proportions of white students, there might be
decreases in the number of white students bused, but
increases in the proportion of white students bused.
Because of the difficulty of analyzing such data, the tables
present data for only those districts with a'measure of
demographic stability; those with no greater than 12 percent
reduction in the proportion of white students during the 4
years 1968-72.
The totals in tables 3.3-3.5 cover only those districts
which maintained demographic stability and for which
complete data are available on: Percentages of minority and
white students bused both before and after desegregation,
means of intervention, and demographic data for both 1968
43

Table 3.3. Average unweighted percent of minority and whitestudents bused, in the year before desegregation, and in year ofdesegregation, for districts desegregated 1966-75, by region.*
Minority WhiteProportion bused Proportion bused
Region Before After Before After
Northeast 17.4 34.6 35.4 38.4
North Central 25.5 38.5 32.5 33.7
Border 60.7 64.5 73.4 73.8
Southeast 53.7 62.1 55.6 59.0
West South Central 46.5 54.8 47.7 51.0
West 26.8 33.2 26.2 30.6
All districts 47.1 55.9 50.0 53.2
(sample size) (229) (229) (229) (229)
*For those districts which have demographic stability, i.e. lessthan 12 percent loss of proportion of white students, 1968-72.
44

Table 3.4. Average unweighted percent of minority and whitestudents bused by source of intervention for districtsdesegregated 1966-76.
Minority WhiteProportion bused Proportion bused
Intervention Before After Before After
Court 56.3 64.5 56.4 59.4
HEW 50.0 58.1 53.3 57.2
Local 33.9 44.1 39.6 42.2
All districts 47.1 55.9 50.0 53.2
(sample size) (229) (229) (229) (229)
45

Table 3.5. Average unweighted percent of minority and whitestudents bused, in year before and following desegregregation, bydegree of black enrollment, for districts desegregated 1966-75.
Minority WhiteProportion bused Proportion bused
Proportion black, 1968 Before After Before After
0-2056 36.0 a?.9 40.6 44.3
20-40% 45.4 54.9 49.2 53.7
40-100% 64.6 68.1 64.1 64.6
All districts 47.1 55.9 50.0 53.2
(sample size) (229) (229) (229) (229)
46

and 1972. The data on students bused are based on
superintendents* reports and may in some districts be
estimates rather than actual figures derived from records.
For a large national survey, the superintendents are
probably the best source of such data. Usable responses
that met all criteria were received from superintendents in
only 43 percent of the districts described as having
desegregated during the decade. Nonresponse was often a
consequence of the fact that superintendents had not kept
readily accessible records on numbers of students bused by
race. HEW reporting forms had asked for numbers of students
bused but not broken out by race. The degree of nonresponse
raises the question of the degree to which the data may be
biased. It may be noted that there is considerable
similarity in the changes in proportion bused in the year of
greatest desegregation for different regions, different
means of intervention, and different proportions of black
student enrollment, providing greater confidence in the
ability to generalize from the sample. The figures in the
tables are unweighted averages of the percentage of students
bused in school districts.
As seen in table 3.3, within 229 districts desegregated
during the last decade, the increase in the average
percentage of white students bused during the year of
47

greatest desegregation was about 3 percentage points. About
50 percent were bused during the year before desegregation,
and 53 percent were bused during the year after
desegregation. At the same time, the percentage of minority
students bused increased from about 47 percent to 56
percent, an increase of 9 percentage points. Although
minority and white students were both somewhat more likely
to be bused as a consequence of desegregation action, the
burden of the increase fell disproportionately upon minority
children.
The increases in minority students bused were greatest
in the Northeast and North Central regions. In the
Northeast region the percentage of minority students bused
increased from 17 to more than 34 percent. The increase in
percentage of whites bused was no more than 4 percentage
points in any region, and there was little variation in the
change from one region to another.
It is interesting to note that before desegregation a
larger percentage of white students was bused than minority
students in all regions of the country except the West.
However, after desegregation the percentage of minority
students who were bused was generally greater.
In the year of maximum desegregation, an average of 30
percent of the students were reassigned, but the average
48

increase in busing was only 5 percentage points. The data
suggest that many of the students reassigned were already
being bused, and the increase in busing was very small in
contrast to the percentage reassigned. It would appear that
sensitivity to the busing issue has successfully minimized
the increase in busing as a means of school desegregation.4
Table 3.U shows the proportion of students bused by
source of desegregation intervention. In general, more
students were already being bused before desegregation took
place in districts where there was court intervention, and
there was less busing before desegregation in districts
where there were local desegregation initiatives. The
increases in busing at the time of desegregation did not
vary by source of intervention. No matter whether the
impetus for desegregation came from the courts, HEW, or
local groups, there was an 8 to 10 percentage point increase
in proportion of minority students bused and about a 3
percentage point increase in proportion of white students
bused.
Table 3.5 shows the variation in percentage of students
bused by proportion of black student enrollment. The
increase was greatest for minority students in those
districts that had a smaller proportion of black enrollment.
This is surprising since these are the districts with the
49

lowest initial levels of segregation. The increase in
busing is least for white students in districts that had a
high proportion of black enrollment. This finding is also
surprising—that there was no significant increase in
proportion of whites bused in those districts that had high
proportions of blacks. These districts also showed the
least increase in proportion blacks bused. Since these are
also the most segregated districts initially, these findings
suggest that a great deal of prior busing was used to
maintain segregation.
Data on student reassignments and busing were collected
in reference to the year of greatest desegregation in each
district. Some districts phased their desegregation plans
over several years; hence the data do not take account of
the cumulative magnitude of reassignments and busing for the
purposes of desegregation. The cumulative magnitudes are
probably marginally greater, but the data do not support any
estimates apart from the year of maximum desegregation.
CONCLUSIONS
Desegregation of schools marked by racial and ethnic
isolation of students requires the reassignment of many
students to different schools. Among those districts that
desegregated during the last 10 years, an average of 30
percent of the students were reassigned in the year of
50

maximum desegregation. Some of the students were reassigned
to schools that were farther from their homes and, hence,
school authorities in many districts had to provide
additional school buses for transportation.
The busing of children to schools more distant from
their homes has become one of the major issues of school
desegregation. Data developed from this study indicate that
the increase in busing is less than popularly presumed, and
the overwhelming burden of the busing increase is borne by
minority children, not by white children. Whereas 30
percent of students were reassigned, approximately 5 percent
of the students in the desegregating districts were bused to
desegregate, in addition to those already bused.
Several major conclusions are derived with regard to
the reassignment of students at the time of desegregation:
• There was a strong relationship between the proportionblack in a school district and the proportion ofstudents reassigned to desegregate: the higher theproportion black, the higher the proportion reassigned.
• While the reassignment of students was greatest inthose districts where the courts intervened, thisappears to be primarily a consequence of the greaterproportions of black students and higher initial levelsof segregation in court-pressured districts. The courtorders do not appear to have required more reassignmentthan desegregation plans approved by HEW when thepercentage black is greater than 20 percent.
• Desegregation plans that developed under local pressureresulted in less reassignment, and (as seen in sectionV) resulted in less desegregation.
51

The increases in proportion bused were relativelyindependent of the source of pressure to desegregate orthe proportion black in a school district. In generalthere was an increase of about 9 percentage points inthe percentage of minority children bused, and 3percentage points in the percentage of white childrenbused in the year of maximum desegregation.
There is no evidence to suggest that court interventionresulted in any greater increase in proportion ofstudents bused than desegregation that resulted fromHEW or local pressure.
52

Notes to Section III
1. Christine H. Rossell, "School Desegregation and WhiteFlight," Political Science Quarterly, vol. 90, no. 4 (Winter1975-76), pp. 675-95.
2. U.S., Commission on Civil Rights, Public Knowledge andBusing Opposition; An Interpretation of a New NationalSurvey (1973); also. Your Child and Busing (1972).
3. See appendix A.
4. Two mutually offsetting considerations affect thesedata. See discussion on busing in appendix A.
53

IV. EXTENT OF DESEGREGATION
This section describes how much desegregation was
achieved in school districts that took substantial steps to
desegregate during the 1966-75 decade. The data show the
regional variation in desegregation activity; the
differential in desegregation resulting from interventions
by the courts, HEW, or local bodies; and the variation by
proportion of black enrollment and by size of city.
The measure used to examine the effectiveness of
desegregation is the index of black-white segregation within
each school district calculated from Office for Civil Rights
(OCR) data for 1968 and 1972.* Most of the tables in this
section are derived from the sample of 874 districts for
which complete responses are available from the
superintendents1 questionnaires about the year of
desegregation and major source of pressure to desegregate,
and complete OCR data are available for both 1968 and 1972.
Of the 1,292 districts in the overall sample, OCR data are
available for both years for only 1,157 districts. Of
these, no usable questionnaires were received from the
superintendents in 283 districts. Of the remaining 874
districts, 493 desegregated during the period, 84
54

desegregated before 1966, and 297 districts had not taken
substantial steps to desegregate.
The index of segregation used throughout this section
is independent of the proportion of black students and is
calculated within each school district. The index does not
measure segregation between districts. If a center-city
school district has 90 percent of its enrollment black and
its suburbs are 90 percent white, each school district may
have a low index of segregation as determined by the racial
distribution within each district, even though the inter-
district segregation is considerable. If the two districts
had merged into one district (the metropolitan solution),
the data would be lost, for there would be no measure for
the new district over two periods in time. Thus, boundary
changes in school districts make analysis of time trends
more difficult.
The number of districts with high levels of segregation
diminished greatly between 1968 and 1972. As seen in table
4.1, 37.7 percent of the sampled districts had an index of
segregation greater than 0.50 in 1968, indicating a
substantial level of segregation. By 1972, only 6.8 percent
of the districts had levels of segregation greater than
0.50. The change was greatest in the Southeast: Out of 360
districts, 74 percent had a high level of segregation in
55

56

1968, while only 2.5 percent were highly segregated in 1972.
In 1972 the Southeast had a smaller proportion of highly
segregated districts than any other part of the country.
Most desegregation was occurring in the South, but some
districts in other regions also desegregated.
Within 493 districts that took steps to desegregate
during the decade, segregation was reduced to very low
levels. As seen in table 4.2, 55.5 percent of these
districts had high levels in 1968; only 5.3 percent were
still highly segregated in 1972. The change was greatest in
the districts whose superintendents reported that the court
was the primary source of pressure to desegregate. Eighty-
seven percent of the court-pressured districts had high
levels of segregation in 1968. In only 8.7 percent of these
districts, was court intervention not followed by a
reduction in the index of segregation to a level below 0.50.
By 1972 most (73 percent) of the court-pressured districts
had achieved low levels of segregation.
Table 4.3 shows the estimate projected from the sample
of how many students were affected by the desegregation that
occurred between 1968 and 1972 within the 2,750 districts
that enrolled 5 percent minority and at least 1,500
students. Such districts account for 60 percent of the
57

58

59

Nation1s 42.8 million public school students and 94 percent
of the minority students.
The desegregation activity that took place in these
2,750 districts that had at least 5 percent minority
students is not the only desegregation that took place in
the Nation. There are about 19,000 school districts
altogether in the country, but the districts not considered
in this study enroll altogether less than 10 percent of the
Nation's minority students. The overwhelming majority of
all minority students who experienced desegregation actions
were enrolled in these 2,750 districts.
The number of students attending schools in highly
segregated school districts fell from about 14 million to
about 4.6 million, a decrease of 9.4 million. Reductions
were found in every region except the Northeast. About 18
million students attended schools in districts that have
taken substantial steps to desegregate during the years
1968-75. Those districts desegregated under court order had
enrollments of approximately 7.5 million students in 1972.
(See table 4.4.) They enrolled half of the students in the
2,750 districts that had a high level of segregation in
1968. HEW pressure led to the desegregation of districts
that enrolled 3.2 million students, and local initiatives
60

61

were primary in desegregated districts enrolling 7.1 million
students.
Among the 874 districts for which there was OCR data
for two points in time and usable responses from the school
superintendents, the average level of segregation fell from
0.37 in 1968 to 0.12 in 1972. (See table 4.5.) For
districts that desegregated under court pressure, the
average fell from 0.74 to 0.15 during the 4-year period.
Not only did the courts intervene in districts that had
unusually high levels of segregation initially, but they
intervened with great effect, particularly in the southern
regions. But substantial reductions also took place where
courts intervened in other regions: from 0.61 to 0.35 over
4 years in the North Central region, and from 0.39 to 0.24
in the West.
The districts in which HEW was the primary source of
intervention had an average index of segregation of 0.56 in
1968 and 0.09 in 1972. Districts that desegregated under
HEW pressure showed substantial reductions in the North
Central and Border States as well as in the South.
Districts desegregated under local initiatives showed
smaller but still substantial reductions. Even districts
described by the superintendents as not having taken steps
to desegregate showed modest reductions in the index in the
62

63

South; much of this desegregation was apparently unplanned.
However, few of these districts had levels of segregation
greater than 0.50 in 1968.
The index of segregation was reduced in all types of
districts. As seen in table 4.6, the greatest reductions
occurred in districts with the most black students. The
index fell from 0.78 to 0.17 for those districts that had
more than 40 percent black enrollment in 1968. Districts
that had less than 20 percent black enrollment in 1968 had a
lower initial level of segregation, but even so their index
was almost halved in 4 years.
School districts located outside of metropolitan areas
and those in smaller cities or suburban areas within
metropolitan areas desegregated more than districts in
larger cities. For these large districts with more than
50,000 population, the index of segregation fell from 0.46
to 0.25 during the 4 years 1968-72. Even so, these larger
cities still contain the most segregated districts in the
Nation. As seen in table 4.7, the average index of
segregation outside of the larger cities is quite small,
less than 0.09 in nonmetropolitan areas. Desegregation
actions in smaller towns and municipalities were implemented
more effectively. Large cities with large concentrations of
64

65

66

minority children and ensuing logistical problems proved
more resistant to complete desegregation.
CONCLUSIONS
The extent of segregation within districts diminished
sharply during the period 1968-72. Among larger districts
with at least 5 percent minority students, 37.7 percent had
an index of segregation greater than 0.50 in 1968, compared
to only 6.8 percent in 1972. The changes were greatest in
the Southeast, which in 1972 had a smaller proportion of
highly segregated districts than any region in the country.
Of the districts that took substantial steps to
desegregate during the decade, only 5 percent remained
highly segregated in 1972. The number of students in school
districts marked by a high degree of segregation as measured
by the index of segregation fell from about 14 million in
1968 to less than 5 million in 1972.
Those districts desegregated under primary impetus from
the courts had enrollments of approximately 7.5 million
students in 1972. HEW pressure was reported as the primary
source of pressure for the desegregation of districts
enrolling 3.2 million students. Local pressures were cited
for the desegregation of districts enrolling 7.0 million
students, but over half of these students were in districts
with fairly low levels of segregation in 1968.
67

The districts where the courts intervened had an
average index of segregation of 0.74 in 1968, and 0.15 in
1972. Not only did the courts intervene in districts that
had unusually high levels of segregation initially, but they
intervened with great effect, particularly in the South.
Desegregation was most complete outside of metropolitan
areas and in smaller cities or in suburban areas within
metropolitan areas. The remaining within-district
segregation of students is found almost exclusively in large
city school districts.
68

Note to section IV
1. For a technical definition of the index of segregation,see appendix A.
69

V. WITHDRAWAL OF WHITE STUDENTS
BACKGROUND
Several studies have recently been published on the
question: Does desegregation of schools lead to withdrawal
of white schoolchildren? James Coleman and his colleagues
have argued that desegregation in the 20 largest central-
city school districts (and to a lesser extent in the next 46
largest) has accelerated the withdrawal of whites.1 A
reanalysis of Coleman1s data suggested that the loss of
whites associated with desegregation in the largest 20
cities was primarily a consequence of the withdrawal of
white students in two Southern cities: Atlanta and Memphis.2
Further analysis by Gregg Jackson of the U.S. Commission on
Civil Rights suggested that several other factors, in
association with proportion black enrollment, predicted the
decline in white enrollment more effectively than did the
reduction of school segregation.3 Reynolds Farley, in an
independent analysis of the Office for Civil Rights survey
data, found no significant changes in student enrollment
associated with school desegregation.4 Studies in Florida
and California found no increased withdrawal of white
students following desegregation.5
70

Coleman has further suggested that massive
desegregation ordered by the courts is not appropriate
governmental action and that such actions themselves will
increase the number of whites leaving the cities. Christine
Rossell* pointed out that there was no court-ordered
desegregation in the 1968-70 period in any of the 20 cities
that form the basis of Coleman^s policy conclusions.
Coleman, in responding to his critics, points out that
they confound the differences between metropolitan-wide or
county-wide desegregation and central-city desegregation.
The controversy has raged over exactly what was happening in
the 20 largest central-city school districts and how changes
in enrollments were related to desegregation policies and
actions.
This survey provides no new data to add to the
discussion of what has transpired in the 20 largest central-
city school districts. Other studies of those districts
have collected data in greater detail than did this survey.
However, these data provide some insight into the nationwide
desegregation actions that have occurred in the last 10
years in the 2,750 school districts that have substantial
numbers and proportions of minority students. The major
analytic variable is the source of pressure to desegregate
as reported by the school superintendents, and how these
71

pressures were related to changes in enrollment of white
students. The data do not lend themselves to an examination
of the central city versus the metropolitan-wide or county-
wide desegregation plans.7
Surveys of people who have recently changed residence
indicate that most moves in a metropolitan area are either
job-related or are made to upgrade housing services8 and
that moves made primarily to enroll children in different
schools are rare. A study of people who moved at the time
of school desegregation in the Norfolk area failed to show
school desegregation as a factor related to moving.9
During the 4-year period for which data are available,
most of the school districts in the sample showed a
reduction in proportion white, regardless of desegregation
status. For the 874 districts with data from responding
superintendents and OCR for both 1968 and 1972, the average
reduction in proportion white was 5.7 percentage points.
This reduction may be a consequence of several factors such
as:
• A higher birth rate among minorities.
• A movement of minorities into districts
previously almost all white.
• A greater increase in minority enrollment
than of white enrollment in central-city
72

school districts.
• The historic pattern preceding desegregation
of the movement of white families from central
cities to suburbs.
• Withdrawal of white children to private
schools or more exclusive suburban areas to
avoid desegregation.
It is often only the last factor to which reductions in
proportion white enrollment are attributed. It is not
possible with the Commission's data set to separate out the
different factors. The analysis in this section focuses on
simply the reduction in proportion white over time in
relationship to the different intervention strategies. The
Commission prefers the use of the change in proportion white
over the "percentage loss of whites" for two reasons.
First, the proportion of minority students has proved to be
a significant variable for most of the analysis undertaken
here, and changes in that proportion would appear to be
significant. Secondly, the use of a percentage loss of
white students results in an increasing statistic, even if
there is a constant outflow from the system annually,
because the base from which the percentage is calculated
declines.
73

There are, however, disadvantages to using the change
in proportion of whites. For example, the actual number of
white students may have increased, while the proportion
white may have decreased. Similarly, some districts that
lost both black and white children could have an increase in
proportion white while having a decrease in number of white
children. However, the proportion white is itself a
variable of interest, and changes in the proportion white
are salient to the satisfaction with schools as seen by
parents, both black and white.
WITHDRAWAL OF WHITES BY TYPE OF INTERVENTION
Referring to table 5.1, within the 874 districts that
make up the sample for which data are available, the average
reduction in proportion white over 4 years was six
percentage points. The loss from the districts desegregated
under pressure from the courts was nine percentage points,
which is greater than the loss in other districts, but the
differential disappears if there is a control for the
proportion black. The reduction in proportion white was
least in those districts desegregated under pressure from
HEW, even less than in districts desegregated before 1966 or
not desegregated at all. The reduction within districts
desegregated under local pressures (eight points) was almost
as high as in those desegregated under court pressure.
74
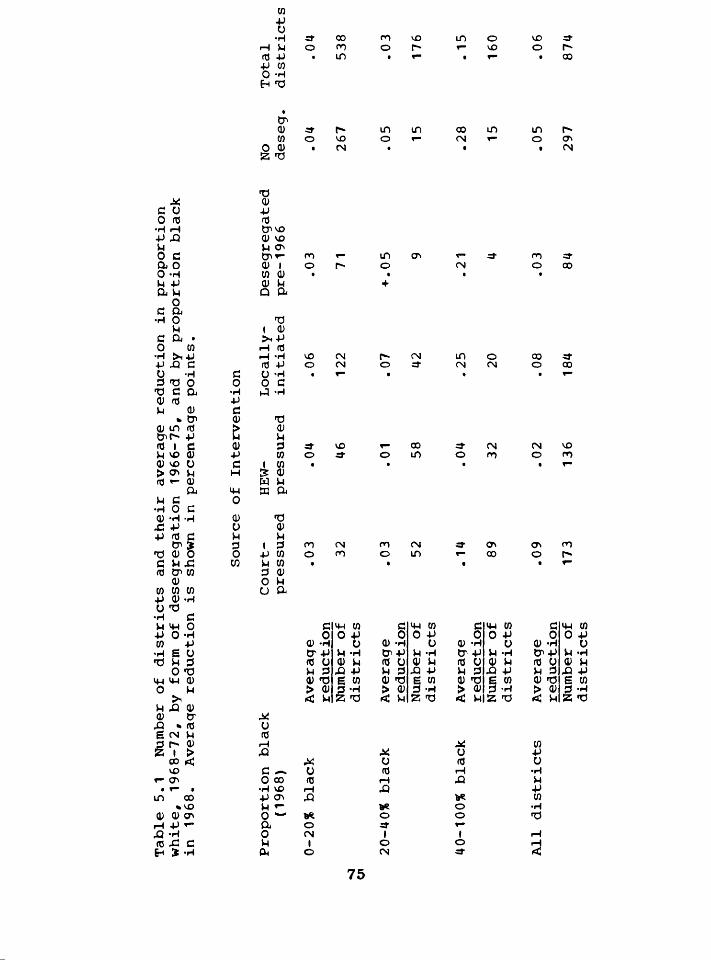
75

These data also show that there was a relative loss of white
enrollment in districts desegregated, but no more so than
for those districts that took no steps to desegregate.
As shown in section II, the court-pressured districts
were more likely to have a high proportion of black
enrollment than districts desegregated through other means.
The relative loss of white students was greatest in those
districts that had a higher proportion of black enrollment.
Among the districts that had at least a 40 percent black
enrollment, the average reduction in proportion white was 15
points in 4 years, representing a substantial relative loss
of whites. Court-desegregated districts within this group
showed no greater relative loss of white students than
districts desegregated primarily by local initiative or
districts that reported no substantial efforts to
desegregate.
The data suggest that when the black enrollment of a
school district exceeds 40 percent, there is, indeed, a
larger relative loss of white students, but this has taken
place regardless of desegregation interventions or court
pressures. While individual families may withdraw their
children from schools after a court order, that loss is not
sufficient to create measurable trends that would
distinguish districts desegregated under court pressure from
76

other districts. This finding is consistent with those of
most researchers in the area.10, ll
Table 5.2 shows the reductions in proportion white by
community size and type. Overall, the relative loss of
white students is greatest in those cities with populations
greater than 50,000. Over the U-year period 1968-72, these
cities had a reduction of 0.10 in the proportion of white
students. However, the large cities that desegregated had
very nearly the same reduction as those that did not; the
differences are very small. The reductions in proportion
white in smaller communities were somewhat less.
CONCLUSIONS
Very little variation is evident in the average
reduction in proportion of white students between the
districts that have desegregated and those that have not; or
between those that have desegregated under court pressure,
by HEW pressure, or by local initiative. These data,
therefore, do not support the inference that there is a
general relationship between desegregation actions and
withdrawal of white students.
The proportion of black students does appear to be
related to the reduction in the percentage of white
students. In the U years 1968-72, districts that had more
than 40 percent black enrollment in 1968 experienced a
77

Table 5.2 Number of districts and their average reduction in proportion white,1968-72, by form of desegregation, 1966-75, and by community size and type.Average reduction is shown in percentage points.
Source of Intervention
Community Court HEW Local Deseg. No deseg. TotalSize pre-66
Metropolitan
AverageReduction .11 .12 .08 .07 .09 .10
50,000+Number ofDistricts 45 8 50 9 34 146
Average10,000-50,000 Reduction .08 .02 .09 .12 .05 .06
in SMSA Number ofDistricts 19 17 26 11 63 136
AverageReduction +.09 +.04 .07 .00 .04 .03
SuburbanNumber ofDistricts 6 9 3 3 1 7 6 2 1 2 7
Nonmetropolitan
Average10,000-50,000 Reduction .11 .03 .07 .02 .03 .05
Non-SMSA Number ofDistricts 31 38 39 18 49 175
AverageReduction .08 .01 .10 .01 .04 .05
RuralNumber ofDistricts 71 63 35 26 88 283
AverageReduction .09 .02 .08 .03 .05 .06
All DistrictsNumber ofDistricts 172 135 183 81 296 867
78

reduction of 15 percentage points in the proportion of white
students, a significantly greater loss than experienced by
districts with lower proportions of black enrollment.
These data do not exclude the possibility or even
likelihood that some individual white families do withdraw
their children from public schools when desegregation occurs
or is expected to occur. But these individual decisions are
not of sufficient magnitude to create a discernible pattern
of association between desegregation and loss of white
students. The relative loss of whites has been greatest in
the larger central cities, an historical trend that
antedates the desegregation of schools.
79

Notes to Section V
1. James S. Coleman, Sara D. Kelley, and John A. Moore,Trends in School Desegregation, 1968-73 (Washington, D. C.:Urban Institute, 1975).
2. Thomas F. Pettigrew and Robert L. Green, "SchoolDesegregation in Large cities: A Critique of the Coleman•White Flight' Thesis," Harvard Educational Review, vol. 46fno. 1 (1976), pp. 1-53.
3. Gregg Jackson, "Peanalysis of Coleman's 'Recent Trendsin School Integration'," Educational Researcher, November1975, pp. 21-25.
4. Reynolds Farley, "School Integration and White Flight"(paper presented at the Symposium on School Desegregationand White Flight, Brookings Institution, Washington, D. C.,August 1975) .
5. Jane R. Mercer and Terrence M. Scout, "The Relationshipbetween School Desegregation and Changes in the RacialComposition of California School Districts, 1963-1973"(unpublished paper, Sociology Department, University ofCalifornia, Riverside, 1974); Everett F. Cataldo and others,"Desegregation and White Flight," Integrated Education, vol.13 (1975), pp. 3-5.
6. Christine Rossell, "School Desegregation and WhiteFlight," Political Science Quarterly, 90, Winter 1975-76,675-695.
7. Such districts are rarely found outside of Florida.
8. Martin Meyerson, Barbara Terrett, and William L. C.Wheaton, Housing, People, and Cities (New York: McGraw-Hill, 1962) .
9. Real Estate Research Corp., "Survey of Recent Movers,"in Special Studies, vol. III of Regional Housing Study(prepared for Southeastern Virginia Planning DistrictsCommission, 1974 ).
10. James S. Coleman similarly concluded that "any effectsof desegregation on white loss in suburbs, rural districtsand independent towns over the country as a whole weresufficiently small that we will not detect it." James S.
80

Coleman, "Presentation on School Desegregation and WhiteFlight" (paper read at the American Sociologist Association,Sept. 1, 1976.)
11. The data in table 5.1 are for school districts thatdesegregated during 1966-75, while the student enrollmentdata were for 1968 and 1972. A reanalysis of the data wasmade (1) for districts desegregated 1968-72, and (2) fordistricts desegregated 1968-70. The reduction in proportionof white students is not essentially altered by changing thesample to control for year of desegregation. In fact,neither the year of desegregation nor the implementation ofdesegregation actions appears to have a major impact onrelative loss of white students. See additional discussionof this in appendix A.
81

VI. DESEGREGATION, DISRUPTIONS, AND ACCEPTANCE
This section presents the superintendents' reports on
some of the outcomes in the community following
desegregation of the schools. Earlier sections of this
report analyzed the demographic characteristics of districts
where the courts or HEW intervened; how desegregation was
achieved; how effective the interventions were in reducing
segregation; and how desegregation was related to changes in
the proportion of nonminority children. This section
explores some of the more qualitative outcomes: Disruptions
of the educational process and changes in the support of
community leaders and parents for desegregation.
DISRUPTIONS
Disruption of the educational process that has
sometimes accompanied the implementation of desegregation
plans has received much publicity. Ideally, desegregation
should not occasion disruption of education or violence and
should not polarize the community. The degree to which
there are no serious disruptions provides one measure of
successful outcomes. To gather data on this dimension
school superintendents were asked: "Did the initiation of
desegregation in this district result in serious disruptions
82

to the educational process for more than a total of two
weeks?" They responded by checking "yes" or "no."
This item provides a subjective measure of disruptions
as perceived by the superintendent. It is noteworthy that
82 percent of the superintendents of desegregated school
systems say that their district did not experience serious
disruptions. It must also be remembered that in some school
districts that did experience disruptions, the disruptions
were confined to a very few schools and did not necessarily
affect a majority of the students. The measure is
imprecise, but it provides a rough measure for comparing
outcomes from different modes of intervention in different
kinds of districts. Data are not available on how severe
the disruptions were or how long they endured beyond the
initial 2-week period.
Within 518 districts that desegregated during the last
10 years, 18 percent of the districts were described by the
superintendents as experiencing such serious disruptions to
the educational process. Tables 6.1 and 6.2 show what kinds
of districts were more likely to experience disruptions.
Districts that had large proportions of black enrollment
(and which were generally more segregated) had to undergo
greater change in the process of desegregation, and such
districts were more likely to experience disruption. As
83

seen in table 6.1, about one-third of the districts with
enrollments more than 40 percent black reported serious
disruptions, as compared to only 6 percent of the districts
that had less than 20 percent black enrollment. If black
students comprised less than one-fifth of the student body,
serious disruptions were rare. Large cities and rural
areas, as seen in table 6.2, were more likely to experience
disruptions than smaller cities and towns.
Tables 6.1 and 6.2 also show that school districts that
reported desegregation by court intervention were far more
likely to experience disruptions than those that
desegregated under HEW or local pressures. Almost one-third
of the districts where courts intervened experienced
disruptions, as compared to one-sixth of the HEW-pressured
districts. Disruptions were rare in districts desegregated
with local initiatives. As seen in sections II S IV, courts
intervened in districts where desegregation was most
difficult to achieve. Desegregation of those districts
appears to have entailed greater disruption of the
educational process.
Disruption was also reported more frequently where
desegregation brought about the greatest changes. The
greater the reduction in the index of segregation, the more
likely the school system was to experience disruptions of
84

Table 6.1. Proportion of desegregated school districts seriouslydisrupted, by source of intervention, 1966-75 and by proportionblack, 1968.*
Source of Intervention
Proportion black, 1968 Courts HEW Local Total
0-20% .12 .11 .02 .06(sample size) (32) (46) (122) (200)
20-40% .25 .17 .12 .18(sample size) (52) (58) (42) (152)
40-100% .41 .22 .15 .33(sample size) (88) (32) (20) (140)
All Districts .31 .16 .06 .18(sample size) (172) (136) (184) (492)
*Sample size is reduced because of missing data for 1968 onproportion black, as collected by OCR.
85

Table 6.2 Proportion of desegregated school districts seriouslydisrupted, by source of intervention and size of community.
Source of Intervention
Size of Community Courts HEW Local Total
Metropolitan
50,000+ .38 .00 .10 .21(sample size) (45) (8) (50) (103)
10,000-50,000 .24 .18 .08 .16(sample size) (21) (17) (26) (64)
Suburban .33 .33 .08 .16(sample size) (9) (9) (37) (55)
Nonmetropolitan
10,000-50,000 .26 .09 .00 .11(sample size) (34) (35) (40) (109)
Rural .32 .19 .08 .22(sample size) (84) (64) (39) (187)
All districts .32 .16 .07 .18(sample size) (193) (133) (192) (518)
86

the educational process. Table 6.3 shows the proportion of
districts that experienced disruptions of the educational
process, by degree of desegregation. Districts that had a
reduction of at least 0.50 in the index underwent a change
from a highly segregated school district to a moderately or
less segregated system. Of these districts, 27 percent had
serious disruptions, whereas only U percent of the 181
districts with a small change in segregation experienced
disruption. Again, the court-ordered districts were more
likely to be disrupted than other districts.
ACCEPTANCE OF DESEGREGATION BY PARENTS AND LEADERS
There has been much discussion about a loss of support
for desegregation among national political leaders, as well
as among some researchers who have recently taken public
positions against court-ordered desegregation or busing to
desegregate. Journalistic accounts of school desegregation
and busing have frequently portrayed growing resistance to
attempts to achieve desegregation. Very few systematic
studies have been made of the level of support for or
opposition to desegregation on the part of members of the
community.
Although the survey did not ascertain these attitudes
directly, school superintendents were asked to rate the
degree of support for or opposition to desegregation within
87

Table 6.3 Proportion of desegregated school districtsseriously disrupted, by source of intervention and by changein level of segregation.
Source of Intervention
Change in levelof segregation* Courts HEW Local Total
Small change .14 0 .03 .04(sample size) (22) (28) (131) (181)
Medium change .27 .22 .09 .21(sample size) (33) (41) (22) (96)
Great change .35 .19 .16 .27(sample size) (117) (67) (31) (215)
All districts .31 .16 .06 .17(sample size) (172) (136) (184) (492)
*A small change in the index of segregation is a change from1968 to 1972 of less than 0.2. A great change is a changegreater than 0.5.
88

selected community groups. A direct measure of the
attitudes of these groups, taken before and after
desegregation would, of course, have been preferable. It
was notr however, feasible within the scope of this study.
The data, therefore, suffer from three major shortcomings:
(1) The superintendents themselves may have a biased view of
the community's acceptance of desegregation; (2) they may
report to this commission a more positive or more negative
view of desegregation than they perceive; and (3) the data
for the period before desegregation are retrospective and
may thus be inaccurate. However, there is some basis for
confidence in the general validity of the superintendents'
reports in the following: (1) The opinions expressed by the
superintendents were consistent with and supported by
preliminary tabulations of the limited responses received
from other respondents: NAACP chapter presidents, heads of
chambers of commerce, and mayors; (2) the superintendents—
being in the middle of the conflict between those wanting
and not wanting to desegregate—are probably in the best
position to know how different groups in the community feel;
and (3) their reports tend to be consistent with some of the
major studies of racial attitude change.1
A massive review of the research which assesses changes
in racial attitudes resulting from interpersonal contact is
89

provided by Thomas F. Pettigrew.2 it is of interest to note
that significant attitudinal change is reported in these
data, even though the optimal conditions for achieving
attitudinal change, as discussed by Gordon Allport,3 do not
obtain in many desegregated districts. It is also not clear
what the relationship might be between attitudes toward
school desegregation and racial attitudes. Other studies
have provided equivocal findings on the contact hypothesis.4
Another line of research in the social sciences argues
that under certain conditions an individual engaging in
behavior that conflicts with his or her attitudes will
change those attitudes in a direction more consistent with
his or her behavior. Thus, someone who is sending children
to a desegregated school and who professes opposition to
desegregation is likely to shift his or her attitude toward
desegregation in a direction more consistent with his or her
behavior; that is, toward greater support.5 The conditions
considered necessary to produce this kind of attitudinal
change probably do not exist in most school districts. Yet,
the superintendents1 reports of significant positive changes
in attitudes toward school desegregation on the part of
parents, children, and others in the community cannot be
dismissed even if there may be some upward bias owing to the
reasons stated before.
90

As shown in figures 6.1 and 6.2, general opposition to
desegregation by business leaders and nonminority parents
prior to implementation was found more frequently than
support. In 42 percent of the districts, the general
response of business leaders to desegregation just before
the major plan was implemented was reported to be
opposition, as compared to only 13 percent in 1976. The
proportion of communities where business leaders are seen
generally to support desegregation has increased from 18 to
48 percent in the sampled desegregated districts. The
changes reported among white parents are even greater than
among business leaders. Whereas superintendents described
general opposition among white parents in 59 percent of the
districts before desegregation, such opposition is now seen
in only 18 percent of the districts.
The increased acceptance reported for white parents was
greater than expected. Whereas resistance to change was
great at the outset, these data indicate that in district
after district general opposition to desegregation has now
been replaced by acceptance. The school districts that are
still characterized as having general opposition represent a
small proportion of the desegregated districts.
Tables 6.4, 6.5, and 6.6 describe the changes in
attitudes, as seen by the superintendents, for the different
91

92

93

94

95

sources of intervention. The greatest reduction of
opposition is found in districts where the courts
intervened. The proportion of court-desegregated districts
in which business leaders were generally opposed to
desegregation has fallen from 61 to 22 percent; for white
parents, the proportion fell from 78 to 26 percent. These
data suggest a strong, positive change in community-wide
acceptance of desegregation in districts that had
desegregated. General opposition is still found in 20 to 25
percent of the court-ordered districts, but the opposition
reported by the superintendents has dropped sharply.
Among minority parents, the reported change has also
been positive but not nearly as great, partly because they
started out with more positive attitudes. Sixty-three
percent of the districts reported general support by
minority parents before desegregation, as compared to 79
percent now. It has been hypothesized that support for
desegregation would not increase among minority parents and
students because minority students bear the brunt of the
busing, or because they usually become a minority in all
schools. Such a hypothesis is not supported by these data.
96

ACCEPTANCE OF DESEGREGATION BY SCHOOL OFFICIALS AND STAFF
The superintendents were asked to report the general
support for or opposition to desegregation perceived within
the school board and the school staff. The school board
itself has a key leadership role in the desegregation
process. This Commission's in-depth study of 34 school
districts concluded that the actions and attitudes of
community leaders, particularly the school board, on school
desegregation were highly significant elements of the
desegregation process.* where the school board played a
positive role in developing the desegregation plan and
supporting it before the community, the implementation of
desegregation was more successful. Where the school board
opposed the desegregation and attempted to block it,
desegregation was implemented with greater difficulty.
The increased support by school boards over the last
few years is shown in table 6.8. In 56 percent of the
court-desegregated districts the school board was seen by
the superintendents as opposed to desegregation immediately
before desegregation. Today, only 12 percent of these
districts are seen to have school boards opposed to
desegregation.
The support of the teachers and counselors for
desegregation is also a key indicator of successful
97

outcomes. The teachers have to live in the resulting
classrooms. Where opposition persists among teachers and
counselors, surely desegregation cannot proceed
successfully.
According to the superintendents, in most districts the
teachers and counselors in the desegregated schools
generally support desegregation. (See table 6.7.) In only
5 percent of the school districts were teachers seen to be
generally opposed to desegregation at the present time. The
positive changes reported among teachers speak well for the
desegregation achievements of the last 10 years.
Table 6.9 shows the relationship between support of the
school board for desegregation and disruption of the
educational system upon implementation of a desegregation
plan. As described by the superintendents, only 6 percent
of the school districts where the school board supported
desegregation experienced disruption of the educational
process lasting more than 2 weeks. However, 38 percent of
the districts where desegregation was opposed by the school
board experienced such disruptions. In the superintendents'
reports, disruptions were strongly associated with
opposition by the school board thus supporting the
hypothesis that positive leadership by the school board led
to more successful outcomes.^
98

99

100

Table 6.9 Proportion of desegregated school districtsseriously disrupted, by source of intervention, 1966-75 andby support of school board for desegregation immediatelybefore implementation, as reported by schoolsuperintendents.
Source of Intervention
School Board's AttitudeToward desegregation Court HEW Local Total
Support .11 .07 .04 .06(sample size) (36) (58) (141) (235)
Neutral .23 .10 .13 .17(sample size) (48) (29) (30) (107)
Oppose .42 .32 .23 .28(sample size) (106) (46) (13) (165)
Total .32 .16 .07 .19(sample size) (190) (133) (184) (507)
101

CONCLUSIONS
The data from this survey lead to three major
conclusions for those school systems that took substantial
steps to desegregate over the last 10 years.
• Serious disruptions in the educational process
took place in less than one-fifth of the school
districts that desegregated.
• The desegregation was followed by substantial
positive changes in community-wide attitudes
toward school desegregation in a majority of
school districts.
• Teachers and counselors in the school systems
strongly support desegregation. In only 5 percent
of the desegregated districts do school
superintendents see teachers as generally opposed
to desegregation.
The data from the survey suggest that the imposition of
interacial contact within the educational system through the
force of law or other pressure has been followed by an
improvement in at least one major area of race attitudes:
support for school desegregation. Community opposition to
desegregation that is aimed at school authorities has
diminished sharply. The desegregated schools have become
institutionalized and accepted in most communities.
102

Teachers within the school system support the desegregation,
and this acceptance of desegregation is also seen among most
students and parents. The data support the notion that the
behavioral changes that result from desegregation are
becoming accepted and provide some hope that these
behavioral changes will further improve racial attitudes.
103

Notes to Section VI
1. See Morton Deutsch and M. E. Collins, InterracialHousing (Minneapolis: University of Minnesota Press, 1951).Also D. M. Wilner, R. P. Walkley, and S. W. Cook, HumanRelations in Interracial Housing; A Study of the ContactHypothesis (Minneapolis: University of Minnesota Press,1955).
2. Thomas F. Pettigrew, Racially Separate or Together (NewYork: McGraw Hill, 1971). Pettigrew concludes from asummary of data that positive attitudinal changes may ensuefrom racial contact.
3. Gordon W. All port. The Nature of Prejudice (Reading,Mass.: Addison-Wesley, 1954).
4. See E. Q. Campbell, "Some Social PsychologicalCorrelates of Direction in Attitude Change," Social Forces,vol. 36 (1958), pp. 335-40; and S. W. Webster, "TheInfluence of Interracial Contact on Social Acceptance in aNewly Integrated School," Journal of Educational Psychology,vol. 52 (1961), pp. 292-96.
5. Leon Festinger, A Theory of Cognitive Dissonance(Evanston, Ill.: Harper and Row, 1957).
6. U.S., Commission on Civil Rights, Fulfilling the Letterand Spirit of the Law (1976), p. 92.
10U

Appendix A
Research Methodology
SAMPLE DESIGN
The sample for this survey was a stratified random
multistage sample of the 19,000 school districts in the
United States, excluding Hawaii and the District of
Columbia. The eligible universe for the sample consisted of
approximately 2,750 districts that had at least 1,500
students and 5 percent or more minority pupil enrollment.
Minority pupils were defined as: blacks, Spanish surnamed
Americans, Native Americans, and Asian Americans. The final
sample included 91 of the largest 100 school districts in
the United States, plus half of those districts with student
enrollment between 3,000 and 35,799 in 1972 and at least 5
percent minority enrollment, plus 37.5 percent of the 240
districts with enrollment of 1,500 to 3,000 and at least 5
percent minority enrollment. The sample as drawn therefore
consisted of 1,292 districts, or 47 percent of the 2,750
eligible districts.
Method of Selecting Districts from those Eligible
The sample was drawn from a 1972 listing of school
districts prepared by HEWfs Office for Civil Rights (OCR).
This listing was stratified by size. It included all
eligible districts with at least 3,000 enrollment, plus 75
105

percent of all districts with enrollments between 1,500 and
3,000 in 1972. It also included samples of smaller-sized
districts, which we did not use. From this listing every
second eligible district was systematically selected, giving
each such district a probability of one in two of inclusion.
Those districts among the 100 largest which had not been
selected were added to the sample. Table A-1 shows the
sampling rates for the OCR sample of districts and for the
sample in this study, by size of enrollment.
The 1972 OCR survey was preceded by similar surveys in
1968 and 1970. A subsequent survey in 1974 is not yet
available for analysis, and it appears that the survey may
not be repeated in 1976. Special sample surveys of a subset
of the districts were made in 1971 and 1973. The data in
this study were limited to data collected in 1968, 1970, and
1972.
The sampling plan included all of the 50 States except
Hawaii, which was not required to participate in the OCR
survey under the regulations of Title VI of the Civil Rights
Act of 1964. Ninety-five school districts were excluded
from the 1968 survey following termination of Federal funds
owing to noncompliance.
Table A-2 provides a summary of the number of school
districts and number of students, by minority status, in the
106

107

108

nation, in the universe from which the sample was drawn, in
the sample as drawn, and in the districts from which usable
responses were obtained from the superintendents. The OCR
survey covered about 44 percent of all school districts and
about 91 percent of all public school children. The U.S.
Commission on Civil Rights sample of districts as drawn
covered about 8 percent of all school districts,
approximately 41 percent of all public school students in
the country, but 69 percent of all minority students in the
country (who tend to be concentrated in larger school
districts). Districts from which usable responses were
obtained from the school superintendents enrolled 10,900,000
students, approximately 25 percent of all students in the
country, but 40 percent of all minority students in the
country. The last column in table A-2 gives the usable
responses as a percentage of the sample drawn.
The nonresponding districts differed from the
responding districts in two major respects: They were
larger and they had greater proportions of black students.
The average size of the nonresponding districts was 20,700,
as compared to 13,500 for the entire sample. The proportion
black was 43 percent among the nonresponding ones, as
compared to 38 percent among the responding districts.
There was no major difference in the index of segregation in
109

1968 or in 1972 between responding and nonresponding
districts.
Subsets of the Data
The data collection forms used by the OCR differed
somewhat from year to year. No questions on busing were
asked in 1968 or 1970, but were asked in 1972. However, the
1972 busing data were not broken down by race. Also, two
types of forms were used: Form OS/CR-101 for data on the
entire school district, and form OS/CR-102 for reporting
individual school data. For all districts in the sample,
data were available for 1972 on minority and nonminority
student enrollments by school. Such data for 1968 were not
available for 10 percent of the districts; hence, changes in
the index of segregation over time were available for only
1,157 of the 1,292 districts. Therefore, some analyses have
a sample size of 1,292, others 1,157, and others vary
depending on missing data.
Most of the analyses in the report are based upon the
usable responses of superintendents from the 996 districts.
For a subsample of 874 districts, data are available from
the OCR data for both 1968 and 1972, as well as complete
responses to several questions on steps taken to
desegregate, their timing, and form. Inferences are made
110

from this subset of 87U districts to the universe from which
the sample was drawn of 2,750 districts.
Method Used for Calculating Projections from the Sample
Weights were calculated for each district based upon
the sampling proportions, size of district, and percentage
black enrollment in order to estimate the total number of
students affected by different sources of intervention
within the 2,750 districts that provided the universe for
the sample. The weights applied to make projections for the
2,750 districts from the 874 districts are shown in table A-
3. These weights were applied in section IV to estimate the
number of students affected by desegregation.
Weights were calculated in the following fashion: The
student enrollments of the 87U districts from which
relatively complete data were obtained and the 1,292
districts in the sample as drawn were allocated 'to the nine
cells shown in table A-3. The ratio of the enrollments from
subsets of the 1,292 districts to the 874 districts was
calculated for each cell. These in turn were multiplied by
the inverse of the sampling proportion. For districts with
less than 3,000 students, the sampling proportion was 0.375;
for districts with 3,000 to 35,799 students, the sampling
proportion was 0.5; and for the largest districts, the
sampling proportion was 1.0 as shown in table A-1.
Ill

112

Attempts to Survey Other Classes of Respondents
An attempt was also made to survey the mayors, the
executive directors of the chambers of commerce, the
presidents of the local NAACP chapters, and the presidents
of district-wide school parent advisory councils for the
areas covered by school district boundaries. A number of
difficulties were encountered:
• Municipal or county boundaries frequently do not
coincide with school district lines, making it
difficult to identify a mayor, chamber of
commerce, or NAACP chapter that serves a school
district.
• Some of those sampled served two or more school
districts and received only one questionnaire.
• Some districts apparently were not served by an
NAACP chapter or by a chamber of commerce.
• Full lists of parent advisory councils were
obtained from only 32 States.
• The questionnaires to these groups were not
adequately pretested, which resulted in a high
rate of nonresponse. For these groups, the usable
response rate varied from about 20 percent from
mayors to about 35 percent from NAACP chapter
presidents.
113

For all these reasons, the samples of these respondents were
considered insufficient to make valid inferences to the
national total of 2,750 eligible school districts, and no
attempt was made to analyze the responses, except to compare
them briefly with responses from the superintendents.
MAILINGS AND FOLLOWUPS
The questionnaires were mailed to the superintendents
in mid-January, and those who had not responded by the end
of January were sent a second copy of the questionnaire with
a cover letter urging their cooperation. By late February,
those who had not responded to the mailing or had responded
with incomplete data were called by telephone. More than 50
percent of the respondents completed the questionnaires
without being called by telephone. Approximately 600
superintendents were reached by telephone. A number of the
final questionnaires were completed by telephone interview,
but most of those who were called filled out the
questionnaires and mailed them to the Commission.
The 296 nonresponding districts included four different
groups. A significant number of these districts were no
longer identifiable districts, as their geographical
boundaries had changed through consolidation with other
school districts. Because some of these were never reached,
exactly how many were in this category is unknown. Some of
114

the district superintendents returned questionnaires that
were not included because of the many questions that were
incomplete. A clear refusal to participate in the survey
was obtained from about 5 percent of the districts sampled.
CONCEPTUALIZATION
The questionnaires to the superintendents were designed
to elicit two types of information:
(1) Factual information
Substantial steps taken to desegregate
Year of maximum desegregation
Primary source of pressure to desegregate
Proportion of students reassigned to desegregate
Numbers of students bused before and after
desegregation
Serious disruptions of the educational process
Changes in quality of schools
(2) Attitudinal information
Support of parents for desegregation
Support of community leaders for desegregation
Support of school board and staff for desegregation
The questionnaires were pretested during December 1975. The
questionnaires were kept as short as possible so as to
maximize the response rate.
115

VALIDITY CHECKS
At different stages of the research, attempts were made
to validate the responses. During the telephone followup,
superintendents who had left portions of the questionnaire
unanswered were contacted by telephone. Some probing was
made of the reasons for the hesitancy to respond. Based
upon the responses of superintendents, a number of questions
were dropped from the analysis plan because the
interpretation of the responses was ambiguous.
Responses were also obtained for the attitudinal
questions from NAACP leaders, political leaders, business
leaders, and heads of parent advisory councils. These
responses, too incomplete in themselves for extensive
inferences, were compared with the responses of the school
superintendents and provided increased confidence in the
superintendents1 reports of the increased support of the
community for desegregation.
Survey data were merged with those from the Office for
Civil Rights. The 1972 OCR survey collected data on total
number of students bused, which were compared with the data
collected from this survey and provided validation for the
busing data. However, the OCR data were collected from the
same source. The OCR data also gave an independent measure
of changes in level of segregation from 1968-72. The
116

reductions in level of segregation for districts reported to
have taken substantial steps to desegregate provided
increased confidence in those responses.
Finally, there was a limited degree of duplication of
content within the questionnaire that provided a reliability
check. Questions 5, 21, and 22 provided busing data.
Questions 10 and 13 provided descriptions of interventions
to desegregate. Questions 10 and 11 gave dates for
desegregation. The general comments at the conclusion of
the questionnaire also provided an explanation of apparent
inconsistencies that were found.
By and large, the questions referred to above formed
the central questions for most of the analysis in this
report. Some of these consistency checks are described
below.
SOURCE OF PRESSURE TO DESEGREGATE
Two measures were designed to examine the source of
pressure to desegregate. Superintendents were first asked
if indeed their district had taken substantial steps to
desegregate. If it had, they were then asked to indicate
the year of any court-ordered plan(s), HEW-approved plan(s),
or other locally- or State-initiated plan. This provides
one measure of source of pressure to desegregate ("highest
intervention"). After indicating the year of maximum
117

desegregation, the superintendents were asked to report "the
single most important source of pressure for initiation of
desegregation." This provides a second measure of source of
pressure to desegregate ("primary" or "most important
intervention").
The ordering of questions worked best for those school
districts that had a clear and single point in time when
desegregation occurred, owing to one primary source of
pressure, such as a court order or immediate threat of
cutoff of Federal funds. In many districts, desegregation
was a process that occurred over a period of time in stages
and under pressure from multiple sources of intervention.
In many districts, desegregation took place following
multiple court orders; earlier ineffectual court orders were
followed by stricter court orders. In a number of
districts, the superintendents were unable to report a
"single most important source of pressure," either because
the superintendents did not live in the district at the time
of desegregation, or because of the multiplicity of sources
of pressure.
If the superintendents checked two sources of "primary"
pressure, or gave years for multiple interventions, a coding
rule was followed that established which source took
priority for coding; courts took priority over HEW, and HEW
118

took priority over State and local sources of pressure.
This priority rule was used for both measures.
The first measure, "highest intervention," has the
problem of not distinguishing effective from ineffective
interventions: for example, districts in which an earlier
ineffectual court plan was followed by effective pressure
from HEW, the former, being the "highest intervention,"
would be coded rather than the latter.
Table A-4 shows the relationship between the two
measures, which may be taken as an internal consistency
check. The consistency is greatest for the court cases. In
94 percent of the cases in which the superintendents
reported the courts to be the most important source of
pressure, they also reported a specific year of a court-
ordered plan. The consistency was least with regard to HEW
as a source of pressure. In 22 districts, a court-ordered
plan was reported but the superintendents reported that HEW
rather than the court was the primary source of
desegregation pressure. The analysis in this report is
based on the second of the two measures—the
superintendents1 perception of the single most important (or
"primary") source of pressure to desegregate—for three
reasons: (1) the data are more complete; (2) the
interpretations of the data are more straightforward; and
119

120

(3) less manipulation of the data was required to derive the
source of intervention. Most of the analyses by source of
intervention were restricted to those districts that
reported their major year of desegregation to have occurred
after 1965, including four districts reporting desegregation
in 1976.
BUSING DATA
The superintendents were asked to report the number of
minority and nonminority students bused in the year before
and in the year in which the district desegregated, in order
to develop estimates on how much additional busing was
required to desegregate.1 About one-third of the
respondents replied with percentages bused rather than
absolute numbers. These data were converted into equivalent
forms. Approximately half of the superintendents in the 530
districts that desegregated replied with complete data for
both groups of students for both points in time. Others
either did not have all the data or did not respond.
Among these who did respond, two different problems
developed in the analysis. First, some superintendents
reported the percentage of those bused who were minority or
white. For example, if the superintendent reported 40
percent for minorities and 60 percent for whites, the data
were not used because they indicated the racial distribution
121

of students who were bused, rather than how many students of
each race were bused. Secondly, those districts that had
striking demographic instability were excluded. For
example, one district lost all but 14 of its white students
when it desegregated; 50 percent of its white students were
bused before desegregation. The number of whites bused
dropped from about 400 to 1. The rule used for such cases
was that if the proportion of white students dropped by more
than 12 percentage points over the 4 years 1968 to 1972,
such districts (amounting to about 20 percent of the total)
were excluded from the analysis of change in proportions
bused. They were included in all other analyses.
Percentages bused were calculated (when superintendents
provided numbers) by dividing the numbers of students by the
student enrollment in 1972. The 1972 data were used rather
than the 1970 data primarily because they were more
complete. - The analysis could have been made by calculating
the estimated number of students in the year before and the
year of maximum desegregation through interpolation of the
enrollment data. However, approximately 10 percent of the
sample would then have been lost owing to additional
incomplete data. By limiting the analysis to those
districts that had a degree of demographic stability, minor
122

changes in enrollments in one year should not make much
change in the data.
Finally, the changes in percentage of students bused in
the year of maximum desegregation may underestimate the
amount of such busing to the extent that some desegregation
occurs over a period of time rather than within one year.
This bias is in part counterbalanced by the historical trend
toward an increase in numbers of students bused, as seen in
table A-5. Just between the years 1970 and 1972, the
number of students bused in the Nation increased 7 percent.
Some proportion of the increase reported at the time of
desegregation may thus be attributable to the general
increase in level of busing that has taken place over the
last 25 years.
THE MEASURE OF INTERRACIAL SCHOOL CONTACT
Data collected by OCR included number of students and
instructional staff, by minority or nonminority status, for
each school. For each school district for 1968, 1970, and
1972, the following data were extracted and calculated:
Number of whites
Number of blacks
Number of Spanish surnamed
Total number of students
Measure of interracial school contract: Sbw
123

Table A-5. Students bused at public expense.
Year Number
1950 6,900,0001960 12,200,0001966 15,500,0001970 18,200,0001972 19,500,000
Percent
2838404346
Source: Statistical Abstract 1974 of the United
States, 1974.
124

Measure of segregation: Rbw
The Measure of Interracial School Contact (Sbw) is the
same measure developed in a previous study, from which this
definition is taken.2
The measure of interracial school contact may beconstructed as follows: If we number the schoolsin the system 1, . ..k, . ..n, and consider thefirst school, there is a given proportion ofwhites in this school. Call this P1w. There area certain number of Blacks in the school. Callthis N1b. Then for this number of Blacks, theproportion of whites in their school is P1w. Ifwe average this proportion over all schools,weighting by the number of Blacks, we obtain thedesired measure, which we may call Sbw, theproportion of white children in the school of theaverage black child....
& n PSbw = k kb^kw (1)
rKbTHE STANDARDIZED MEASURE OF SEGREGATION
The Standardized Measure of Segregation (Rbw) is that
used in previous studies and is a function of the measure of
interracial school contact and the proportion of white
children in the school district, i-f the same proportion of
white children were in each school, then Sbw, the measure of
interracial school contact defined above, would be equal to
Pw, the proportion white. If the black and white children
were each in schools by themselves, then Sbw would be zero.
Thus, the measure of segregation may be constructed to
125

indicate how far Sbw is from Pw, or the degree to which
segregation among schools within a district is responsible
for the value of Sbw. Hence, Rbw is defined as:
Rbw = Pw - Sbw
Pw
Table A-6 shows racial distributions in schools in
three hypothetical school districts that have values of the
index of segregation of 0.5, 0.2, and 0.02, respectively.
ANALYSIS OF REDUCTION IN PROPORTION WHITE
Section V reports the changes in the proportion white
for all school districts, for districts that desegregated by
form of intervention, and for districts that did not
desegregate. The data in tables 5.1 and 5.2 describe the
reduction in proportion white in the U-year period 1968-72
for all districts that desegregated during the 10-year
period 1966-75. Two-thirds of the districts that
desegregated experienced their maximum desegregation during
the U-year period, about 14 percent desegregated in 1966-67
and about 20 percent desegregated in 1972-75. To the extent
that white flight is associated with school desegregation,
the tables as presented do not separate out the
conseguential effects (shortly after desegregation) , the
126

Table A-6. Examples of levels of segregation indicated by index ofsegregation in hypothetical school districts with varying proportionsof black and white students in schools.*
System 1 System 2 System 3
School black white black white black white% % % % % %
1 100 0 70 30 35 652 80 20 50 50 35 653 20 80 UO 60 35 654 20 80 30 70 30 705 20 80 30 70 30 706 10 90 20 80 30 707 10 90 20 80 25 758 10 90 15 85 20 809 10 90 5 95 20 8010 0__ 100 0 100 20 _ 80
System 28 72 28 72 28 72
Sbw=.357 Sbw=.575 Sbw=.707
index of segregation
Rbw=.SOU Rbw=.201 Rbw=.0 2
*Assumes that all schools have egual number of totalstudents, and each system has 28 percent black enrollment.Sbw is the measure of interracial school contact, theproportion of white children in the school of the averageblack child. Rbw is the index of segregation.
127

direct effects (during desegregation), and the anticipatory
effects (prior to desegregation).
A reanalysis of the data was made for the subset of
districts desegregated 1968-72, during the U-year period for
which demographic data are available on white student
enrollment. The reduction in proportion of white students
is not altered by changing the sample to control for year of
desegregation. In fact, neither the implementation of
desegregation plans nor the year of maximum desegregation
appear to have a major impact on withdrawal of white
students.
SAMPLING ERROR OF PERCENTAGE DISTRIBUTIONS
The reliability of percentages derived from the study
may be judged by how close these percentages should
reasonably be (95 percent confidence) to the results of a
tabulation for the 2,750 school districts in the universe
from which the sample is drawn. An approximate measure of
such reliability may be determined from table A-1, given the
number of districts shown as the base for the given
percentage. The sampling errors are those used to make
inferences to a hypothetical infinite universe of districts,
whereas there are only 2,750 districts in the universe.
Hence the measures provided by the table understate the
reliability of the percentages.
128

Table A-7. Sampling errors for estimatedpercentages (at 95 percent confidence level).
Different Value ofEstimated Percentages *
10% 25% 50%
or or
Total Number of 90% 75%sampled elements
1200 1.7 2.4 2.8
800 2.1 3.0 3.5
400 2.9 4.2 4.9
200 4.2 6.0 6.9
TOO 5.9 8.5 9.8
*Sampling errors computed from samples taken randomly froman infinite population.
129

The reliability measures for percentages presented in
table A-7 are approximations based upon the binomial
distribution, on the assumption of a random sample. The
selection of every other district systematically frdm the
OCR listing of districts may be equated with simple random
selection. It may also be pointed out that eligible
districts with over 35,800 students were selected with
certainty, substantially increasing the reliability of the
tabulations.
130

Notes to Appendix A
1. See questions 21 and 22 on superintendent'squestionnaire in appendix B.
2. James S. Coleman, Sara D. Kelly, and John A. Moore,ibid., p. 8.
131

OMB 115S75001Appendix B Expires July 76
Superintendent's Questionnaire
NAME OF DISTRICT:
CCR Form 203AOffice of ResearchU.S. Commission on
Civil Rights1121 Vermont AvenueWashington, D. C. 20425
132

Superintendent's Questionnaire
1. This district is best described as
a. a large city (50,000 or more persons)b. a small or medium city (10,000-50,000 persons) in a
standard Metropolitan statistical areac. a small or medium city (10,000-50,000 persons) not
in a standard Metropolitan statistical area.d. a suburban community(not a city) in a standard
Metropolitan statistical area.e. rural area
2. What is your own opinion of each of these aspects of thedistrict's present schools?
excellent good fair poor
a. general quality ofeducation
b. student achievementc. interactions among pupils
of different races orethnic groups
d. disciplinee. attendancef. holding power (lack of
dropouts)g. pupil participation in
extracurricularactivities | \ |
3. Since January 1970 has this district had a district-widemultiracial or multiethnic committee to review textbooks for themanner in which various racial and ethnic groups are portrayed inthe textbooks?
a. Yesb. No
4. Since January 1970 has this district had a multiracial ormultiethnic committee which reviewed disciplinary issues andrecommended disciplinary policies and practices for the district?
a. Yesb . No
5. At present, what percentage of your pupils use school buses orpublic transportation to get to and from school?
a. percent
133

6. At present, what is the average duration of a one way trip of achild who is bused in your district?
a. minutes
7. At present, what percentage of your district's total annualbudget is spent on busing? (Base the estimate on the amortizedannual cost of the buses and annual bus operating expenses.)
a. %
8. Has this district taken steps to substantially reduce oreliminate racial and ethnic isolation in the school district?
a. Yesb. No
If you answered "No" to question number 8 you are finished withthe questionnaire. If you answered "Yes" please read thefollowing instructions and answer all remaining questions.
You may not have been the superintendent of this district when itdesegregated. If that is so please continue to fill out the restof the questionnaire anyway, based upon the best information youhave about that period in the history of this district.
9. Did you live or work in the general area of this school districtat the time it desegregated?
a. Yesb. No
10. Indicate the years in which this district has implemented any ofthe following desegregation plans (indicate as many asappropriate):
Year implemented
a. Court ordered desegregation planb. HEW approved comprehensive desegregation
plan eliminating racial and ethnicisolation throughout the whole district
c. HEW approved desegregation planeliminating racial and ethnic isolationonly in certain parts of the district?
d. A district-wide desegregation plan thatwas initiated at the discretion of thedistrict and required the mandatory re-assignment of students to certain schools
e. Other (specify )
134

11. In which of the above indicated years did the greatest reductionof racial and ethnic isolation occur within this school district?
a. Year
If this district has implemented more than one desegregation planplease answer all of the following questions in reference to theplan which brought about the greatest reduction in the racial andethnic isolation in the year of its implementation (the planimplemented in the year indicated in question 11).
12. About what percentage of all students in the district were givennew school assignments as a result of this desegregation?
percent
13. Which was the single most important source of pressure forinitiation of desegregation? (check only 1)
a. Courtsb. HEW (U.S. Department of Health, Education,
and Welfare)c. State Department of Educationd. Local school officialse. Civil rights groupsf. Other (specify:)
14. If your district's desegregation plan was court-ordered, did theschool board appeal the decision?
a. Yesb. Noc. Not a court-ordered plan
15. In the first school board election after the implementation ofdesegregation} what fraction of the school board members who hadfavored desegregation did not run for re-election or lost in theelection?
a.
16. In your opinion, during the desegregation of this district didpublic misunderstanding about the desegregation interfere withthe superintendent's efforts to successfully implement it?
a. Yesb. No
135

17. Thinking back to the period just before desegregation took place,how would you describe the general response of most of thepeople in each of the following groups to desegregation of thedistrict's schools?
a. Minority parentsb. Non-minority parentsc. Local business Leadersd. Local political Leaderse. Local religious Leadersf. The Mayorg. School board membersh. School principalsi. Teachers, counselorsj. Minority pupilsk. Non-minority pupils1. Yourself (mark N.A. in
the first column if youwere not in the districtat that time, but evenin such a case, answera - k above)
*by actively we mean attended with substantial numbers of persons orsent representatives to public or private meetings which dealt withthe Impending desegregation, or frequently contacted school boardmembers or the superintendent about the matter.
18. Were improvements in the school buildings specifically made aspart of the preparation for the initiation of desegregation?
a. Yesb. No
19. Did the initiation of desegregation in this district result inserious disruptions to the educational process for more than atotal of two weeks?
a. Yesb. No
136

20. How would you describe the general response of the majority of peoplIn each of the following groups to the desegregation of the districtschools now?
a. Minority parentsb. Non-minority parentsc. Local business Leadersd. Local political Leaderse. Local religious Leadersf. The Mayorg. School board membersh. School principalsi. Teachers, counselorsj. Minority pupilsk. Non-minority pupils1. Yourself (mark N.A. in
the first column if youwere not in the districtat that time, but evenin such a case, answera - 1 above)
21. In the year immediately prior to that in which this districtdesegregated, approximately what number of minority pupilsand nonminority pupils were bused?
a. minority pupilsb. nonminority pupils
22. In the year in which this district actually desegregatedapproximately what number of minority and nonminority pupils werebused?
a. minority pupilsb. nonminority pupils
137

23. About how much planning prior to the implementation ofdesegregation was given to the following areas?
a. student assignments toschools
b. transportation needsc. teacher assignments to
schoolsd. the training of principals,
teachers and counselorse. securityf. communications with parentsg. Other (specify:)
24. Which of the following groups were actively involved in suchplanning? (Check as many as are applicable.)
a. Minority parentsb. Non-minority parentsc. Local business leadersd. Local political leaderse. Local religious leadersf . School board membersg. School principalsh. Teachers and counselorsi. Minority pupilsj . Non-minority pupilsk. Yourself (mark N.A. in the blank of you were
not in the district at this time)1. Law enforcement officials.m. HEW (U.S. Department of Health, Education
and Welfare) and DOJ (U.S. Department ofJustice) officials
n. Others (specify:)
138

25. Was the level of student suspensions noticeably higher in thethird thru twelth month of desegregation than in the comparableperiod during the year Immediately prior to Implementingdesegregation?
a. Yesb. No
26. During the first year of desegregation were municipal, county, orState police assigned to school campuses for full work shifts innumbers exceeding whatever the assignments may have been in theprevious year?
a. Yesb. No
27. If you answered the preceding question with "Yes", for about howmany calendar days were such assignments made?
a. daysb. answered no to preceeding question
28. What was your own opinion of each of the following aspects of thedistricts schools immediately prior to the implementation ofdesegregation?
excellent good fair poor
a. general quality of education .b. student achievementc. interactions among pupils
of different races orethnic groups
d. disciplinee. attendancef. holding power (lack of
dropouts)g. pupil participation in
extracurricular activities
29. Are there any comments you wish to make about your above answers,about other aspects of desegregation in this district, or aboutthis questionnaire Itself?
(continued)
139

Thank you very much for filling in this questionnaire. Please returnit to us in the attached self-addressed envelope.
140


U. S. COMMISSION ON CIVIL RIGHTSWASHINGTON, D. C. 20425
OFFICIAL BUSINESSPENALTY FOR PRIVATE USE, $300
POSTAGE & FEES PAID
U. S. COMMISSION ON CIVIL RIGHTS