revised elaa proposal - european...
TRANSCRIPT

1
Revised ELAA Proposal
16 June 2006
Executive Summary
In the event that the Council decides to abolish the current Block Exemption for liner conferences as contained in Regulation 4056/86, the ELAA is submitting this Revised Proposal for the forthcoming Commission Guidelines.1
At the core of the Revised ELAA Proposal is a desire to create an environment of shared knowledge and improved communication embracing both service provider and end-user. Although we feel that conferences have proved their worth to world trade, we recognise the need to change. We want to propel ourselves into an age of shared knowledge, which will assist the functioning of a highly efficient, modern and transparent liner shipping industry.
The principles of the Revised Proposal are:
• A port-to-port aggregated volume database, based on aggregated figures provided by the carriers to an independent data service, with safety mechanisms to ensure that individual carrier figures cannot be identified. Practical delays in producing data mean that data can be published immediately when available without influencing competition, although it is conceivable that carriers will come up with a better system whereby the delay could be reduced and the ELAA firmly believes that the IDS should be allowed to publish data as it becomes available. This kind of information will not influence pricing negotiations and cannot be used as a tool for collusion;
• An industry supply and demand forecast produced with the help of an independent expert, based on accurate aggregated supply figures provided by the carriers to the independent data service, as well as demand figures and other information available in the public domain;
• A system of industry-wide consultation organised by a Liner Shipping Association, with an integrated system of carrier consultations as well as consultations with all other industry stakeholders to interpret, discuss and improve the forecast and better predict supply and demand developments as well as other issues relevant to the efficient management of a complex logistics chain;
• A simple aggregated price index by trade direction;
• Publication of information from the public domain to increase transparency of cost elements related to liner shipping such as bunkering, canal dues and port charges;
• Publication of information related to carrier currency costs; and
• All information generated will be made available to the general public.
The ELAA maintains that all these elements, which are explained in detail below, are absolutely necessary to maintain the stability of supply and regular liner shipping services to and from Europe when Regulation 4056/86 no longer applies. The ELAA Proposal does not allow any form of discussion between service providers on price, limitation of capacity or individual lines’ strategies.
Liner shipping is the engine room of globalization and a prerequisite for the maintenance and development of the European economy. Stability of supply and regularity of liner shipping
1 The ELAA submits this Revised ELAA Proposal without prejudice to its position, (as articulated during the
Commission’s review process) that DG Comp has not received or produced sufficient evidence that Regulation 4056/86 fails to satisfy the conditions of Article 81(3) EC and should be abolished.
2
services are the critical beneficial features of the current system that must be preserved in the new system, because they are crucial to almost every European business. The ELAA Proposal constitutes the least restrictive way to achieve those benefits in a fiercely competitive market.
But the ELAA is concerned about the potential implications of the Commission’s stated policy goal of abolishing the current Block Exemption for liner conferences as contained in Regulation 4056/86, not least on the international scene. Whilst agreeing on the need to create openness and transparency, the industry is faced with a regulatory world which is becoming more complex and more non-convergent by the day. This poses considerable threat to stability and unnecessary and unhelpful complication to the liner shipping industry. Regulatory authorities have to prevent this from happening.
The conference system has created stability in an otherwise volatile market. A comparison with the bulk market shows a large discrepancy; the bulk market has been significantly more volatile over the years. Abolition without an appropriate replacement would put the liner shipping industry at risk of becoming as volatile as the bulk market, an effect that will be further reinforced assuming the abolition of conference THCs. This would not only result in highly volatile freight rates but also in instability of supply. Rate fluctuations will result in uncertainty of the viability of future investment, and a risk of significant under-investment – putting efficient global trade in jeopardy. The first signs are already there with fear of insufficient supply in 2009. Regulation 4056/86 will be abolished, but the ELAA requests that the safeguards for stability as contained in this Proposal are provided. Global trade cannot afford to gamble with the stability of supply of liner shipping services.
The experience of liberalization and deregulation in other industries shows that the most diligent approach is one of caution. Unleashing uncontrolled competition in important network industries has led to damaging results in the past; as an example, the US is currently struggling with its major air carriers moving in and out of bankruptcy. The ELAA hopes that the European Commission, as in air transport (we refer to Annex 9 where the differences between liner shipping and aviation is described in detail), will take a more careful and sensitive approach than its US counter-parts did when deregulating the air carrier industry.
Information is a tool of competition. By making all information public, the Revised Proposal creates a level playing field with equally well-informed carriers, transport users and other industry stakeholders. Thus, the Revised ELAA Proposal is pro-competitive, as, in the words of Commissioner Reding, “only a well-informed consumer is a well-armed consumer”.2
2 Commission Press Release IP/05/1217, 4 October 2005 (regarding the Commission programme to publish
mobile roaming tariffs).

3
1. Introduction
1. On 6 August 2004, the European Liner Affairs Association (ELAA)3 submitted a Proposal for a new regulatory structure for the liner shipping industry (the Original ELAA Proposal). The Original ELAA Proposal was complemented by an in-depth assessment under Article 81 EC, submitted on 10 March 2005 (ELAA Article 81 EC Assessment). The Original ELAA Proposal represented, as does this Revised ELAA Proposal, a bona fide effort by the liner shipping industry to produce an alternative to the current Regulation 4056/86 regime, compatible with the Lisbon Agenda, which would enable the industry to continue delivering consumer welfare benefits in a post-conference world, whilst minimizing restrictions of competition. Since the submission of the Original ELAA Proposal, the consultation process has enabled the ELAA to consider its position and refine its suggestions to take into account comments that have been made. Extensive dialogue between DG Comp, DG Tren, shippers, freight forwarders and the ELAA has made this possible, and the ELAA is particularly grateful for DG Comp’s willingness to devote considerable resources and provide its comments in an open and transparent manner, which has enabled us to explain in detail why this Revised ELAA Proposal is necessary for the industry, and to make refinements in response to concerns raised by DG Comp. The ELAA explains the key elements of this Revised Proposal and their rationale in Annex 1.
2. The ELAA welcomes the Commission’s statement in its Explanatory Memorandum to the 14 December 2005 Proposal to repeal Regulation 4056/86 to issue Commission Guidelines on the application of competition rules to the maritime sector and in particular its commitment to include each item of the ELAA Proposal in those Guidelines.4
3. The ELAA’s position (as in all its previous submissions) is based on three pillars which characterize the liner shipping industry:
• The non-collusive market structure (whereto we note that the liner shipping market will become even more competitive after Regulation 4056/86 is abolished, and conferences, conference surcharges and ancillary charges will disappear);
• Its unique blend of characteristics; and
• The importance of stability of supply.
4. As misconceptions appear to remain – we refer to the DG Comp impact assessment based on the GI Study, published on the 14 December 2005 – the ELAA finds it necessary to reiterate the main aspects of these three pillars in Annex 2.
5. In particular, we note that stability of supply and reliability of liner shipping services is crucial for world trade. The industry characteristics have an inherent tendency to result in instability because of the high fixed costs needed for the provision of regular scheduled international services, rate fluctuations and fluctuating demand which the industry cannot control without an appropriate instrument to accurately forecast demand and supply. The
3 The world’s main liner shipping companies are comprised in the ELAA’s Members and their subsidiaries:
A.P. Møller/Maersk Sealand, Atlantic Container Line AB (Grimaldi), China Shipping (Group) Company, CMA-CGM Group, COSCO, CSAV (Compaňia Sud-Americana de Vapores S.A.), Evergreen Marine Corp. (Taiwan) Ltd., Hamburg Südamerikansiche Dampfschiffahrtsgesellschaft KG, Hapag Lloyd, Hanjin Shipping Co. Ltd., Hyundai Merchant Marine Co., Ltd., Kawasaki Kisen Kaisha, Ltd., Malaysia International Shipping Corporation (MISC), Mediterranean Shipping Co. S.A. (MSC), Mitsui OSK Lines, APL Co. Pte. Ltd., NYK Line (Nippon Yusen Kaisha Line), Orient Overseas Container Line Ltd., United Arab Shipping Co. (SAG), Yang Ming Marine Transport Corp., and Zim Integrated Shipping Services Ltd.
4 Proposal for a Council Regulation repealing Regulation (EEC) 4056/86 and amending Council Regulation (EC) 1/2003, COM(2005) 651 final, 14 December 2005, Explanatory Memorandum at 43. Therefore, the ELAA, having taken the comments made by DG Comp and other stakeholders into account, submits this Revised Proposal for review. The ELAA would like to stress that this is not a new Proposal, but a compilation of clarifications and modifications resulting from the consultation process; it contains no fundamental changes that would render the previously submitted ELAA Article 81 EC Assessment invalid, but rather less restrictive elements that would ensure compatibility with Article 81 EC.

4
essential welfare benefit generated by the current regime is stability of supply, defined as the matching of supply to demand, which seeks to ensure a relatively stable environment for an inherently unstable industry, as per the main objective of Regulation 4056/86.
6. Overall, the ELAA believes the Revised Proposal achieves this benefit while remaining fully in line with Article 81 EC, and clearly much less restrictive than the existing system. In particular, the ELAA would like to stress the following crucial differences with the current system as contained in Regulation 4056/86. The Revised Proposal:
• Contains no provision for discussion on price or capacity management;
• Contains no provision for jointly agreed surcharges and ancillary charges and no joint discussions on the topic;
• Contains no provision for carriers to be able to take uniform decisions or strategies on commercial issues whatsoever;
• Contains no provision for exchange of individual sensitive carrier information, either through data exchange or discussions, but only aggregated and general information; and
• Explicitly ties the other industry stakeholders into the information exchange and discussions to ensure that true consultation emerges and all market participants can benefit.
7. DG Comp has stated that the Revised ELAA Proposal aims for “more than what is available today”. Although the ELAA agrees that the envisaged data would be of higher quality and have wider market coverage than today, it is not true that we are asking for more than what is currently available. Carriers today are allowed to discuss rates, regulate capacity and exchange individualised data and set surcharge and ancillary charges. The JoC data published on US trades, resulting from the need to file cargo information under OSRA, is significantly more detailed and recent than what the ELAA is proposing. A comparative overview of the differences between the current system and the Revised Proposal is presented in Annex 3.
8. The ELAA has during the consultation process made significant refinements to comply with DG Comp’s requirements, as outlined below in Table 1, by abandoning Trade Committees and the jointly agreed surcharges and ancillary charges, further delaying and aggregating data and by increasing transparency and the influence of other industry stakeholders.

5
Table 1: Comparison between the Original and the Revised ELAA Proposal
Original ELAA Proposal Changes in the Revised ELAA Proposal
Exchange and discussion between carriers of aggregated capacity utilization and market size data by trade and on a region/zone to region/zone basis (historic data with a month delay).
The exchange will be further aggregated at carrier level and the discussion will take place between carriers as well as with all industry stakeholders and regulators in a forum; data will be split by trade and port pairs or a range of ports in a trade zone); data which can be disaggregated will not be provided and solid safety mechanisms against disaggregation have been imposed; all information would be made publicly available. The data will remain sufficiently delayed, and the current delay will be a minimum of eight weeks.
Exchange, discussion and evaluation of commodity developments by trade (based on data aggregated with a month delay).
There will be no exchange of data split by commodity, but merely split by 20’ dry, 40’ dry and reefer containers (in the case of North-South trades provided only on a trade basis); the exchange will be further aggregated at carrier level; commodity developments will be discussed based on data from other sources, such as specific trade associations; all information would be made publicly available.
Discussion and evaluation of aggregate supply and demand data by trade/commodity. Forecasts of demand by trade and commodity would be published.
The industry forecast report will be produced with the help of an independent, external consultant, and then discussed and improved by the consultation process; there will be no commodity forecast; all information would be made publicly available.
Carriers will obtain their own market share by trade, by region and by port (data aggregated with a month delay).
No market share data of cargo carried will be provided.
Price index differentiated by type of equipment (reefer, dry) and trade direction (data aggregated with a quarterly delay). This information would be made publicly available.
The price index will not be differentiated by equipment type, but will be one index figure for the whole trade direction, which will continue to be publicly available. The index would continue to be provided monthly with a quarterly delay, but cover a whole quarter period.
Surcharges and ancillary charges based on publicly available and transparent formulae; the details of which would be discussed with shippers.
The Liner Shipping Association would publish the cost factors which constitute the stevedoring charge (THC) and publicly available information regarding other cost factors such as details of purchase price of fuel at various locations around the world, average fuel consumption, canal dues and port charges.
Based on the average aggregated cost structure of carriers, the Liner Shipping Association would publish the fluctuation of the US dollar compared to the average percentage attributed to each currency per TEU on a trade.
The envisaged system of information exchange would be based upon one or more industry body(ies) or agreements and committees per trade.
The trade committees have been replaced by an integrated system of industry-wide consultation, including carrier consultation and trade forums open to all stakeholders, split by trade; all information would be made publicly available.

6
9. Similarly significant are the differences between the Commission’s stated policy goal of abolition of Regulation 4056/86 and what the regulatory regimes of EU’s major trading partners allow. In fact, many of these seem to be on a different path from the EU. In particular:
• Japan is continuing to support the conference system and carrier consultation in general;
• The US has secured consultation through the Ocean Shipping Reform Act (“OSRA”) and very detailed statistics through the Journal of Commerce (JoC);
• Singapore has recently announced its intention to introduce a block exemption for conferences and other liner agreements5; and
• India is currently contemplating a system of significant transparency of data, even individualised, and will most likely accept liner conferences.
10. In Annex 4, the ELAA describes the importance of international comity and how this Revised ELAA Proposal can help overcome the problems created by the abolition of Regulation 4056/86 envisaged by the Commission.
11. In sum, the Revised Proposal signifies the end of commercial cooperation and transparency of carrier strategies, and introduces a new system that, in the ELAA’s view, significantly improves the information available to the market; a necessity in today’s knowledge based economy. It eliminates the facilitators of collusion but maintains, to the greatest extent possible, the means to provide stable and reliable liner shipping services in a fiercely competitive market. Without the Revised ELAA Proposal, there will be no regime to replace the information generated by conferences today; the industry stakeholders would have to act blind-folded.
12. Almost all useful trade volume statistics (except for on US trades) are generated by the conference secretariats. Without conferences, there will be no reliable data available to industry stakeholders unless an appropriate replacement regime is put in place. This crucial factor has been overlooked in the impact assessments carried out by the Commission services and their consultants.
2. Why Are Guidelines Appropriate?
13. Article 81 EC incorporates a sliding scale. The more significant the restrictions of competition, the more significant the efficiencies and the consumer benefits generated must be.6 The assessment of the Revised Proposal under EC competition law is in essence an evaluation of the increased risk for collusion, if any, measured against the increased stability of supply. Although the Revised Proposal should not be salami-sliced but rather looked at as a whole (as also recognised by DG Comp), we will describe the key elements and the functioning of the envisaged system, and prove how for each element the benefits clearly outweigh any restrictions on competition. As a whole, the Revised Proposal as it now stands is clearly compatible with Article 81 EC.
14. The benefits of the ELAA Proposal cannot be fully appreciated by isolating and analyzing each element separately and out of context. Below, we first describe the benefits of the system as a whole. The benefits of each element will then be described in turn.
5 See Media Release of the Competition Commission Singapore, Competition Commission Consults on
Proposed Block Exemption Order (BEO) for Liner Shipping Agreements in the Maritime Industry, 6 April 2006, and Proposed Competition Act Order of the same date.
6 Commission Notice, Guidelines on the application of Article 81(3) of the Treaty, [2004] OJ C 101/97, at 90.
7
Short-Term Needs
15. Carriers, and all other service providers in the liner shipping industry, are committed to further improving the efficiency of the already successful global transportation and logistics system.7
16. Clearly, this entails a need to listen to market demands. Our customers’ profitability relies on keeping stock at a minimum level, but at the same time never being short of supply:
• Liner shipping ensures just-in-time delivery and stability of supply, both well-recognized efficiencies;8
• Actions by any one carrier have positive “network externalities”, conferring benefits on customers generally, and not just those customers that use their own service (for example, extra capacity allows for adjustment of existing schedules); and
• Also, customers can reduce their stock, which is a crucial cost saving to allow for “just-in-time” delivery.
17. Current trade data and trends are needed for effective planning of ocean carrier service capabilities. This is a challenging task, which cannot be performed without sufficient knowledge to ensure that all components of the supply chain work effectively together, and to be flexible and find fast solutions in case they do not:
• Liner carriers need to know where the demand is, and where it is likely to be;
• Liner carriers need to know the trades that suffer from over or under capacity in order to deploy their vessels where they are most needed to ensure constantly stable and reliable services across the globe;
• Liner carriers need to know where port and terminal congestion can be expected and need to discuss with all stakeholders how to overcome the problems we face; and
• It is also a benefit to customers to be able to plan in advance, which in turn gives rise to market demand for scheduled services at pre-determined prices.
18. The result would be an efficient adjustment of capacities resulting from efficient independent decisions taken by each carrier. Prices could be affected in so far as the capacity adjustments prevent a capacity shortage and, hence, steeply rising prices in light of a growing demand. This ultimately benefits the shippers and guarantees that vessels are allocated efficiently between different routes. If demand falls, there is no risk that carriers would jointly withdraw capacity, as capacity management falls outside the ELAA Proposal and is explicitly prohibited.
19. The concept of stability of supply and reliability of services is also closely interlinked with environmental issues. Apart from the fact that vessels operating at low utilisation
7 The Commission agrees in its Proposal to repeal Regulation 4056/86: “Maritime transport services are key to
the development of the EU economy”; Proposal for a Council Regulation repealing Regulation (EEC) 4056/86 and amending Council Regulation (EC) 1/2003, COM(2005) 651 final, 14 December 2005, Explanatory Memorandum, at 1. The success of the industry in ensuring sufficient capacity is made available to meet increasing demand whilst investing in innovation and reducing costs is recognised at para 828 of the GI report: “The industry is healthy, and growing; Global Insight, ISL and TU Berlin, The Application of Competition Rules to Liner Shipping, Final Report to DG Comp, 26 October 2005, at 828.
8 See e.g. Regulation 4056/86, [1986] OJ L 378/4, recital 8. For full references of the recognition of benefits of stability in the maritime sector, see ELAA Technical Paper: Precedents Drawn from Case Law Regarding the Concept of Stability, submitted for the Oral Hearing, December 2003. See also Article 81 EC Guidelines, at 68 and 82; and Case 26/76 Metro SB-Grossmärkte v Commission, [1977] ECR 1875; as well as EC Commission Decisions Sicosav [1999] OJ L 004/27; and Whitbread [1999] OJ L 88/26.
8
levels are a waste of resources, in particular port congestion is highly detrimental to the environment for the following reasons:
• Having vessels waiting to call outside a port seriously increases port pollution;
• As a result of port congestion, vessels will have to go at higher speed to keep up with the schedule, again increasing pollution and risk of accidents; and
• As counter-measure to avoid congestion, vessels will call at fewer ports, thereby increasing the need for overland transport, which is drastically less environmentally friendly than sea transport.
20. The system envisaged by the ELAA Proposal should ensure more and better information is available to avoid or at least alleviate such issues.
Long-Term Needs
21. To enable individual carriers to make sound investment decisions, data needs to be put into its market context and inferences for the prediction of future market developments have to be made. Although the task of obtaining and processing accurate and complete data is significant, this forecasting exercise is perhaps the most crucial, and certainly the most challenging, of the whole investment exercise. Many factors need to be taken into account, and these considerations require a complete knowledge of the industry. Allowing experts from liner shipping companies, with additional input from all other stakeholders of the industry within the forums, to engage in discussions on general topics (i.e. discussions of common issues which do not relate to the individual behaviour of carriers) that may influence future supply and demand would enable all participants to develop an accurate and informed view of trade developments. It would also generate substantial savings of cost and time in terms of research, etc. A better understanding of where capacity is needed most – i.e. based on a more accurate forecast of demand – brings significant benefits to carriers, shippers and ultimately consumers in this essentially cyclical industry.
22. The GI Report confirmed what the ELAA has constantly held, that chartering vessels is not an option in times of high demand as in those market circumstances “virtually no vessels are available.”9 The availability of reliable information is critical in order to enable carriers to make sound and efficient individual deployment and investment decisions. The best, and in fact only, source of relevant and useful data must come from carriers, which today happens through the conference secretariats. Should in the future these data providers not have information currently generated by the conferences under Regulation 4056/86, their basis for data analysis would be removed and they would be left with almost nothing (except for volume data on US trades). That would not constitute a useful basis for investment decisions.
Overall Position
23. In sum, all the elements of the Revised ELAA Proposal are needed for carriers in order to provide stability of supply, in particular to:
• Ensure the smooth running of a complex logistics chain;
• Fulfil the service requirements of our customers;
• Improve vessel and container deployment; and
• Make as accurate forecasts as possible of future supply and demand in order to make sound investment decisions (in particular given the size of the investments concerned).
9 Global Insight, ISL and TU Berlin, The Application of Competition Rules to Liner Shipping, Final Report to
DG Comp, 26 October 2005, at 117.

9
24. Our customers – shippers, freight forwarders – have recognized the importance of this type of data gathering and industry consultation, and we believe that the time has finally come for effective participation of all stakeholders in the way the industry is run (a theoretical possibility that was already contained in the old conference system through “consultation”, which works well with many of our major trade partners, e.g. Australia, Japan, South Africa, etc.).
25. The ELAA believes its Revised ELAA Proposal responds to what all stakeholders ultimately demand from a new framework for the liner shipping industry.
26. To achieve the benefits of the envisaged system, it is important that as many carriers as possible join the system contained in the ELAA Proposal. This has also been recognized in shipper responses to the Commission’s White Paper.10
27. A diagram in Annex 5 summarizes the key elements of the proposed system of effective industry-wide consultation. Data exchange and bilateral contacts between carriers, customers, ports, stevedores, etc, go a long way in achieving a market-oriented system of industry-consultation, but they do not go the whole way. Hence, the Revised ELAA Proposal introduces forums for discussions involving all stakeholders, with everyone able to participate: carriers, customers, ports, stevedores, governments, regulators, etc.
3. The Revised ELAA Proposal – Industry-Wide Consultation
28. The Revised ELAA Proposal is set up as an integrated system of industry-wide data exchange and consultation, organized around major regional trading areas and by direction (e.g. Africa, Asia, North and South America, Oceania).
29. Divided into distinct steps, the Revised ELAA Proposal would amount to the following; a detailed description of all steps is contained in Annex 6.
3.1. Step 1 – Carrier Submission to the Independent Data Service (IDS)
Volume Data
30. Figures inputted: The ELAA foresees structuring the submission of data to the IDS in the following way: individual carriers submit a monthly summary of volumes (TEU loadings) per port pair and equipment type to the Independent Data Service (IDS). The “monthly summary of volume” is an aggregation of volumes on a bill of lading port/port basis that were carried by a line during the previous calendar month for all cargo by 20’ dry, 40’ dry and reefer containers carried on a trade in the previous calendar month by direction and port-pair.
31. Timing of input: The data will be inputted to the IDS from individual carriers’ financial databases once a month will cover all completed shipments for a calendar month. However, given the pre-shipment logistics, the length of the voyage and the time required to complete the voyage accounts, the data will naturally be delayed by at least seven weeks before it is even received by the IDS although for most trades, the delay will be one to two weeks longer as a result of the lengthier voyages.
32. The Revised Proposal results in carriers aggregating data to the largest extent possible before submitting to the IDS, so that in effect the only thing the IDS does is aggregate the selected data from all carriers and apply the safety mechanisms against disaggregation (see below at Step 2).
10 Michelin, Comment on the EC Commission White Paper, at p 6.

10
Capacity Data
33. Carriers would enter in a separate spreadsheet their current and forecast capacity per trade and submit to the IDS. The forecast input will only be made quarterly, for quarterly periods over the next 18 months. This data is derived by each carrier on the basis of which vessels are going to be deployed by that carrier on a trade. The capacity figure would come from the nominal quarterly capacity of the vessels to be deployed.
34. The ELAA would like to stress that the envisaged supply forecast and data from the past will only be provided in terms of slots to be provided / that were provided on a trade direction and not by port-pair. The carrier submission of planned future trade capacity to be further aggregated by the Independent Data Service was not specified in the Original ELAA Proposal. There is an increasing demand for accurate information. As is generally accepted, container tonnage is expensive to build and to ensure that the correct amount of space is put on a trade, one needs to look at both supply and likely demand. Otherwise valuable assets in terms of container space might go underused in one trade when they are needed in another, or even worse, there may be undersupply generally or in a particular trade. This goes to the very purpose of the ELAA Proposal, i.e. to ensure the continued stability of supply.
35. The ELAA notes that the Commission has previously allowed for similar supply forecast schemes11 and most trade associations engage in information exchange in some form.
Currency Cost Information
36. The carriers would input, at yearend, the percentage of currencies used for their costs per trade. Example: Carrier X’s would, as soon as the annual figures are available, submit to the IDS the percentage of costs attributable to the Euro, the Great Britain Pound, the Yen, the US Dollar, the Australian Dollar, etc, for each trade. This figure would be updated once a year.
3.2. Step 2 – IDS Processing of Data
37. Based on the carrier input, the IDS will produce two kind of reports:
• A monthly report of aggregated volume and utilisation figures with at least 8 weeks’ delay and a price index (see below at Step 5) covering a quarter with at least 3 months’ delay;
• A quarterly report on aggregated estimated supply figures per trade over the forthcoming 18 months split by quarter. The IDS will not produce a demand forecast; and
• A yearly report on aggregated percentage of cost attributable per currency, per trade or region and per TEU transported. The IDS would aggregate these figures and give them weighting according to the volumes of each carrier on the trade or region in the same time period. The IDS would then produce a “currency basket” which would show the average percentage of each currency attributable for the cost per TEU of the services in the trade or region in question. We refer to Table 3 below, as well as Step 7, where the methodology of currency cost information is further described.
11 For example, see Commission Notice pursuant to Article 19(3) of Council Regulation 17/62 Cartonboard
[1996] OJ C 310/3, at 12, and Commission Notice pursuant to Article 19(3) of Council Regulation 17/62 European Wastepaper Information Service [1987] OJ C 399/7, at 5 and 9. For a detailed discussion on the cases, see Annex 6.
11
38. The IDS – envisaged as a fully independent group of data analysts – would be a separate undertaking contracted by the Liner Shipping Association, which will provide the appropriate software and maintain the database.12
39. The IDS would aggregate the data according to a coherent standard, based on information available in the public domain. ‘Coherent standard’ means that each line would submit information using a template to ensure consistency, i.e. the ‘coherent standard’ will be applied already at the carrier input level. As pointed out by Dynamar in their response to the Commission, there is currently no such ‘coherent standard’ applied worldwide.13
40. The IDS would produce a monthly report for each trade, showing TEU volume and capacity split by 20’ dry, 40’ dry and reefer containers per trade and origin-destination port pair or a range of ports in the same geographic area and a price index per trade leg split by dry and reefer. In terms of methodology of aggregation, supply data will be provided only by trade direction and volume data by trade and port, unless an additional safety mechanism to prevent disaggregation of data as outlined below at para 43 is triggered. In that case, data will be further aggregated by the IDS, by clustering a number of ports in the same geographic area on either or both sides of the trade into a range of ports, such as for example one country or shared hinterland.
41. Splitting data by 20’ and 40’ containers would enable carriers to identify most of their equipment needs without the knowledge of certain commodity volumes and at the same time ensure a high level of aggregation. For reefer containers, 20 foot containers are scarce and on their way out of the market. As a response to DG Comp concerns that a split between 20’ and 40’ reefer containers could help identifying figures of individual carriers or customers, all reefer containers will be aggregated.
42. The IDS would not collect commodity data.
43. The IDS must ensure that the data cannot be disaggregated. Each data point from the IDS will only be provided if the following data aggregation safety mechanisms are fulfilled:
• There are at least four independent operators14 serving the segment which the data point in question relates to;
• The three largest independent operators’ combined share of the segment the data point relates to does not exceed 80 percent;
• Equipment-specific information on North-South trades would only be made available on a total trade (per direction) basis and not on a port pair basis, so as to ensure that individual shipper identities cannot be traced;
• On very thin trades (defined as trades with a total annual volume below 150,000 TEUs in both trade directions), data will not be provided at all or be grouped with a neighbouring trade so that data cannot be disaggregated. The same applies on other trades if data aggregated up to trade level still trigger one of the safety mechanisms; and
12 The IDS will be a small entity, and as requested in the GI Report, “an institution with the highest possible
level of independence”. Its only role will be to aggregate the data in a database, to double-check data which appears to be incorrect (both automatically and manually), to apply the safety mechanisms to ensure sufficient aggregation, etc.
13 Dynamar response to Commission White Paper, at p 3. 14 For the purpose of applying the safety mechanisms only, a carrier participating (in the trade in question) in a
cooperation agreement such as a consortium allowing for information exchange of volumes and capacity would not be considered an “independent operator”. In other words, for those trades where such a cooperation agreement exists, the parties to the cooperation agreement will on the trade in question be viewed as one carrier for the purposes of the application of the safety mechanisms. For that reason, each participating carrier must notify the IDS of all cooperation agreements it has entered into with other carriers that allow for information exchange of volumes and capacity. This is without prejudice to the position that the ELAA strongly maintains that there is significant internal competition between consortium members, and that the internal competition will increase even further with the repeal of Regulation 4056/86.
12
• In addition, the data will only cover specific ports if the port for the preceding year had total TEU liftings of at least 500,000 and is not considered a pure transhipment / relay port (defined as a port with at least 85 percent transhipment).15 Ports with lower volumes will be further aggregated by clustering a number of ports in the same geographic area into a range of ports, such as for example one country or shared hinterland until the aggregate TEU liftings reach the appropriate level.
44. The ELAA refers to the Commission approval of the UK Tractor16 information exchange, where the Commission accepted a rule of minimum three suppliers. With a minimum of four suppliers and the additional safety mechanism ensuring a sufficient dispersion of shares between carriers, a minimum liftings per port and provision of port pair figures broken down by equipment only on the largest trades, the ELAA proposes a safeguard mechanism that goes far beyond Commission practice in UK Tractor, and ensures that data in practice can never be disaggregated.
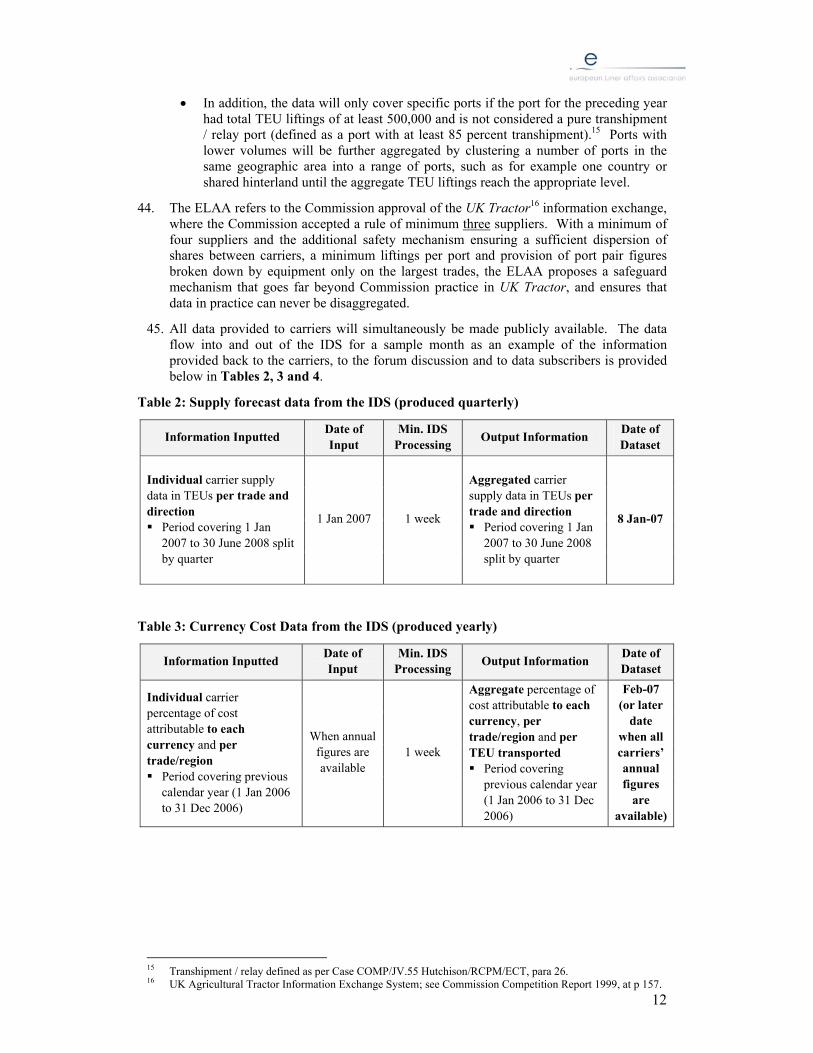
45. All data provided to carriers will simultaneously be made publicly available. The data flow into and out of the IDS for a sample month as an example of the information provided back to the carriers, to the forum discussion and to data subscribers is provided below in Tables 2, 3 and 4.
Table 2: Supply forecast data from the IDS (produced quarterly)
Information Inputted Date of Input
Min. IDS Processing Output Information Date of
Dataset
Individual carrier supply data in TEUs per trade and direction Period covering 1 Jan
2007 to 30 June 2008 split by quarter
1 Jan 2007 1 week
Aggregated carrier supply data in TEUs per trade and direction Period covering 1 Jan
2007 to 30 June 2008 split by quarter
8 Jan-07
Table 3: Currency Cost Data from the IDS (produced yearly)
Information Inputted Date of Input
Min. IDS Processing Output Information Date of
Dataset
Individual carrier percentage of cost attributable to each currency and per trade/region Period covering previous
calendar year (1 Jan 2006 to 31 Dec 2006)
When annual figures are available
1 week
Aggregate percentage of cost attributable to each currency, per trade/region and per TEU transported Period covering
previous calendar year (1 Jan 2006 to 31 Dec 2006)
Feb-07 (or later
date when all carriers’ annual figures
are available)
15 Transhipment / relay defined as per Case COMP/JV.55 Hutchison/RCPM/ECT, para 26. 16 UK Agricultural Tractor Information Exchange System; see Commission Competition Report 1999, at p 157.

13
Table 4: Actual data of the past from the IDS (Produced monthly)
Trade Latest Date of
Contract
Min. Pre-shipment
Period
Min. Voyage Period
Min. Post-shipment
Period Information Inputted Min. IDS
Processing
Voyage Completion
Period
Output Information
Date of Dataset
Min. delay
N. Europe – Far East 22 Oct-06 4 weeks 10 weeks
N. Europe – India 22 Oct-06 4 weeks 10 weeks
N. Europe – W. Africa 1 Nov-06 3 weeks 9 weeks
Transatlantic19 8 Nov-06
1 week
2 weeks
4 weeks
Individual carrier port-port volumes from financial data bases in TEUs per port-pair and direction 20’ dry17 40’ dry Reefer
1 week Nov 2006
Aggregated port-port18 volumes in TEUs per port-pair and direction 20’ dry 40’ dry Reefer
8 Jan-07
8 weeks
N. Europe – Far East NA NA NA NA NA NA
N. Europe – India NA NA NA NA NA NA
N. Europe – W. Africa NA NA NA NA NA NA
Transatlantic NA NA NA NA
Individual carrier supply data In TEUs per trade and direction
NA
4th quarter 2006
Aggregated supply data (average per month in the quarter) In TEUs per trade and direction
8 Jan-07
NA
N. Europe – Far East 22 Sep-06 4 weeks 3 weeks 22 Dec-06 3 months
N. Europe – India 22 Sep-06 4 weeks 3 weeks 22 Dec-06 3 months
N. Europe – W. Africa 1 Oct-06 3 weeks 4 weeks 1 Jan-07 3 months
Transatlantic 8 Oct-06
1 week
2 weeks
4 weeks
Average individual carrier $/TEU ocean rate including surcharges and ancillaries, irrespective of ports and equipment, inland excluded 5 weeks
Aug-Oct 2006
Rolling Quarterly Price Index (one index figure per trade direction for whole quarter)
8 Jan-07 3 months
17 For North-South trades, input as well as output per equipment type would be provided on a trade basis only. 18 Or, alternatively, a range of ports in one geographic area, should the port volumes not meet the safeguards against disaggregation (see above at 43 et seq). At present, port-port volumes are
taken from the lines’ financial information. This is the most accurate information currently available, but it is only produced at the end of each voyage, or in some cases round voyages. The projected 10 weeks for the East/West trades, for example, are in line with what we have at the moment.
19 For Transatlantic volumes a faster system is available through the Journal of Commerce statistics.

14
Competition Law Assessment of Steps 1 & 2
46. Steps 1 & 2 amount to the envisaged system of information exchange, on the basis of which carriers can make their individual decisions. As explained in great detail in the ELAA Article 81 EC Assessment, accurate data from the past is a crucial element for capacity planning.20 ELAA Members have identified a need to obtain this information by trade and by port pair. Such a level of detail is required to enable carriers to optimally adjust their capacities to important regional differences in infrastructure (e.g. facilities, feeder operations, access to ports). The carriers need to carefully monitor shifts in demand in different ports, as for example the relocation of a manufacturing plant will need careful planning in advance in respect of carrying capacity, slots, container type, etc. Accurate data is also necessary to match segments of the supply chain – to the benefit of all stakeholders in the industry. The GI Report in the assessment of the Original Proposal found that “[t]he information exchange concept by itself would appear to have possible benefits in terms of efficiency.”21
47. All the data provided would be sufficiently aggregated and delayed, although it is conceivable that carriers will come up with a better system whereby the delay could be reduced to 4 or 5 weeks and the ELAA firmly believes that the IDS should be allowed to publish data as it becomes available, as this kind of information will not influence pricing negotiations and cannot be used as a tool for collusion. The ELAA has previously explained in detail how contracting works in the liner shipping industry.22 What happened in the past is of little relevance for the pricing negotiations, but is crucial for the lines’ management of their business in order to ensure a reliable and efficient service around the globe, with a well-balanced supply and demand situation. The ELAA believes that the Revised ELAA Proposal is sufficiently flexible to deal with market developments.
48. The efficiencies envisaged are created in a manner that will not restrict competition. In order to have all relevant information gathered in an efficient way, one functional data service must have sole responsibility. The use of several data centres naturally leads to incompleteness, or at the very least to inefficient duplication of work. Moreover, as recognized in the GI Report, the publication of data “avoids” or has the capability of “perhaps dulling any collusive utility”.23 The ELAA therefore suggests the creation of a single Independent Data Service to gather the data:24
• The liner shipping market is a knowledge economy and at the moment it is running with insufficient, inaccurate information. Global trade is too important to be left to chance. The shipping industry has a real opportunity to conduct a proper analysis of container cargo moving to and from Europe, with the ability to accumulate timely and accurate port-to-port information for the first time;
• The supply and demand figures are must-haves for carriers in order to provide the services their customers’ demand, i.e. stable supply and reliable, efficient and cheap liner services across the globe. The restrictions of competition, if any, are very limited and definitely not appreciable, as no data will enable the identification of individual carrier strategies; and
20 See in particular paras 595-599. 21 Global Insight, ISL and TU Berlin, The Application of Competition Rules to Liner Shipping, Final Report to
DG Comp, 26 October 2005, at 825. 22 ELAA Article 81 EC Assessment, at 264-307 and in Annex 2 to this submission. 23 Global Insight, ISL and TU Berlin, The Application of Competition Rules to Liner Shipping, Final Report to
DG Comp, 26 October 2005, at 73 and 772. 24 See ELAA Article 81 EC Assessment, at 594.

15
• In addition, the information generated will make the logistic planning of shippers easier, as concluded in the GI Report.25 Shippers will have access to data from the immediate past that will enable them to plan their just-in-time business with the lowest possible inventory without ever being short of supply, which in turn will lead to cost-reductions that are passed on to the end-consumer. The users of liner shipping have a major interest in ensuring that there is better data in the liner shipping market. Several comments on the Commission White Paper confirm that.26
49. As far as currency cost information is concerned, we refer to Step 7 below.
3.3. Step 3 – Industry Specialist Analysis
50. Simultaneously with the carriers and other subscribers, the IDS reports (the monthly volumes and utilisation figures as well as the quarterly supply forecast) will be passed on to an independent group of experts for analysis. The demand data provided to the forecaster by the IDS will amount to the sufficiently delayed volume figures as they become publicly available. The forecaster group could be a university or a consultancy group with industry specialization, which could be selected by an open tender to operate on a time-limited retainer. On a quarterly basis and in advance of the carrier and industry wide consultations, the experts will:
• Compare the data with other statistics available, such as data compiled by industry consultants and others, US FMC data as published by JoC, trade statistics from various industries, etc.;
• Keep track of industry news such as public announcements of capacity increases or withdrawals, regulatory restrictions such as import bans, etc;
• Contact individual carriers and customers with follow-up questions; and
• Based on all the collected information, produce a quarterly report including a supply and demand forecast per quarter over the next 18 months.
51. Both supply and demand would be calculated by trade direction, i.e. not on port level. The final trade definition is yet to be determined, but as a working assumption, trades will be defined in line with EC case law. The main task of the forecaster is to analyze the demand situation in comparison to the supply forecast provided by the IDS, as well as non-member supply. The report will be provided to all members of the Liner Shipping Association for the trades to which they have inputted data, and to whomever subscribes to it. Non-subscribers attending the forum discussions will receive sufficient data for a fruitful discussion; all data will be provided simultaneously to subscribers (from a pick-and-choose menu) on fair, reasonable and non-discriminatory terms.
52. The forecaster is independent, which means naturally its view cannot be ascribed to the carriers. Rather, it is an outsider’s view, which will form the basis for the next step of the Proposal, i.e. the industry-wide consultation, where carriers and transport users will get the opportunity to comment on and improve the independent forecast report, and produce an industry view.
25 Loc cit., at 809, “Additionally, it might provide valuable information for shippers and other interested
parties”. 26 See ELAA Article 81 EC Assessment, at 618 and the responses of Höganäs (at p 5), VA Tech Hydro (at pp 3-
5) and Volkswagen (at p 6).

16
3.4. Step 4 – Consultation
53. The ELAA envisages two integrated forms of consultation in order to improve the prospects for stability of supply in the liner shipping market:
• Meetings between carriers active in a trade; and
• Meetings between carriers and other industry stakeholders in industry-wide trade forums.
54. The carrier consultations are a necessary preparation and a prelude to the industry-wide forums. The carrier consultations as well as the industry wide consultations are envisaged to be quarterly (save for exceptional circumstances such as war risks, major strikes, etc) on big trades and bi-annual on smaller trades. The purpose of both of them is to improve the knowledge of the carriers, the transport users and the other industry stakeholders on the issues facing the industry and the likely development of supply and demand.
Carrier Consultation – Structure and Scope
55. Member carriers will meet quarterly to discuss supply and demand per trade, within the framework of the Liner Shipping Association. Carriers will convene to discuss and interpret the forecast report in preparation for the industry-wide forums.27
56. The consultations would be organised by the Liner Shipping Association and governed by the Liner Shipping Association’s statutes. There could be different consultations per, for example, Europe / Asia, Transatlantic, etc.
57. It is important to state that neither the Liner Shipping Association nor the consultation participants will in any way be involved in the collection of carrier data, and discussions will not touch upon issues such as individual data or strategies, pricing or capacity management. In preparation of the industry-wide consultations, the clear focus of the discussions would be expected demand developments. The carrier consultations are envisaged to:
• Deal with trade-specific and technical issues;
• Security on vessels;
• Major events such as war, strikes, major port congestions and natural disasters;
• Government decisions on above matters to be applied in certain areas; and
• Discuss supply/demand developments.
58. The Liner Shipping Association will publish after each consultation a report on the discussion of the above matters, including comments of the independent forecast report and other industry expert views which normally collect information from carriers but not necessarily deliver correct information. This report will form the basis for the industry-wide forum discussions.
59. The consultations will be facilitated by a representative from the Liner Shipping Association to ensure compliance with its statutes and legal provisions (such as antitrust compliance), and a lawyer will be present at all times. DG Comp will be notified in
27 The GI Report’s main criticism against what were the Trade Committees in the Original Proposal was that
they would act as a “club” and that the only “police” against collusion would be club’s own lawyers. The issue that gave rise to this fear is removed in the Revised ELAA Proposal, as interested industry stakeholders will get access to data and be invited to participate in industry-wide consultation (see below at 60 et seq.) Likewise, there are no discussion on surcharges and ancillary charges, no carrier votes on a forecast report which the GI Report (inaccurately) described as “agreements on common business goals”; Global Insight, ISL and TU Berlin, The Application of Competition Rules to Liner Shipping, Final Report to DG Comp, 26 October 2005, at 709, 793 and 799.

17
advance and on reasonable notice of consultations, and a written report would be submitted to DG Comp after the meeting (DG Comp has declined the ELAA’s suggestion to be invited to attend the meetings).
Industry-Wide Forum Discussions – Structure and Scope
60. Consultation between carriers and other industry stakeholders are envisaged to follow the carrier meetings and provide the necessary customer input to finalise the conclusions of the supply and demand developments. Given the number of participants envisaged, the discussions would be more general, and give shippers and other stakeholders the opportunity to comment on and discuss the forecast reports and the carrier consultation reports. In particular, this would give an opportunity for smaller shippers to hear the industry view and to be heard.
61. The industry acknowledges that consultation with shipper organizations in Europe has not been particularly successful in the recent past, whereas it has been successful in other jurisdictions such as, for example, Australia, Japan, and South Africa. But there is fresh thinking in the industry, and the ELAA submits that the envisaged system of industry-wide consultation is designed to be useful and effective. Recent statements by the ESC and FTA show signs of a new attitude and commitment to make consultation work.28 The ELAA Members are equally committed, and have recently started to engage in extensive consultation with customers to identify the needs and wishes of transport users. That is why the forums together with the carrier consultations have replaced the envisaged Trade Committees in the Original ELAA Proposal. The forums differ significantly from the Trade Committees as they are based on open participation of all industry stakeholders. Obviously, the industry cannot oblige anyone, carriers or other stakeholders, to participate, but the broader the participation, the better for the industry as a whole. The ELAA has during the course of the review of Regulation 4056/86 urged shippers, freight forwarders and their representatives to come forward and explain how they would like consultation to work for the future. Below, we outline how such forums could operate, but this is, of course, also subject to agreement with other industry stakeholders.
Carrier Meetings and Industry-Wide Forums – What Would Not Be Discussed?
62. Neither carrier meetings nor forum discussions would include any of the following items:
• Prices (current, past or future) or discussion on what the price index translates into;
• Individual carrier or shipper future demand;
• Relationship between demand forecasts and individual expectation of the aggregate supply position;
• Any form of capacity management on a trade;
• Current individual carrier capacity utilization;
• Shipper auctions, tenders, individual contracts, etc.;
• Industry views of trade rate development; or
• Surcharges and ancillary charges.
Article 81 EC Assessment of Carrier Consultations
63. The main object of carrier consultation is to refine the independent expert forecast and to achieve better know-how to understand the supply and demand figures in order to
28 Messrs. Filip Beckers, ESC, and Andrew Traill, FTA, Shipper Forum 2005, Hamburg, see Lloyd’s List of 7
October 2005.

18
improve carriers’ knowledge as a better basis for individual decision-taking and crucially in order to improve the prospects for a fruitful industry-wide forum discussion.
64. There will be no discussion of individual data. Hence, the influence on market behaviour resulting from the meetings, once the consultation process including the forum discussions is completed, will be that individual decisions by shippers and carriers are taken on a better informed basis and thus reduce the risk of misinterpretation, which ultimately could lead to disruptions in service and cost increases. All actions will be individual; there will be no joint action.
65. It has been argued that the carrier discussions are unnecessary if there are effective industry-wide consultations. The carrier meetings will be regulated by strict antitrust compliance rules, which will be monitored by a lawyer and DG Comp will be invited to attend. As the carriers will not exchange business sensitive information, there will be no secrecy of the meetings at all. The reason why the ELAA believes that industry-wide consultations must include carrier meetings is three-fold:
• First, as preparation for the industry-wide forums. Shippers at the industry-wide forums will ask for a common industry position. This may not be possible, but at least carrier meetings in advance of the forums may serve to avoid confusing messages because of different industry forecasts. The problem with analyst reports is that even if carriers and analysts have the same data, analysts tend to come up with different results.29 Carriers need to discuss why there is such a difference. Carriers will also have different views internally, but will make an effort to come up with a consensus.
• Secondly, there are limits to how many people can join a discussion before it loses its focus. The ELAA does not believe that a fruitful meeting to interpret a forecast report is possible in an open-to-all meeting; and
• Thirdly, there is a clear risk that a forum discussion on the forecast could break down into discussions between individual carriers and individual customers when both carriers and customers are participating. This must be avoided as it is not the purpose of the meeting, and would risk distracting from the main point of the meeting, which is a discussion on what has happened and might happen on a trade.
66. Narrowing down the inherently speculative element of investment by providing carriers with a proper foundation to forecast supply and demand is an efficiency which is difficult to quantify. However, one can only imagine the cost for society in the case of insufficient liner shipping capacity in the world.30
• Carriers would not be able to satisfy all shippers’ needs for transportation, leading to high rates and the exclusion of customers that could otherwise be served;
• Cargo would not move, or would move very slowly and at a very high rate;
• Moreover, manufacturers would need to consider moving manufacturing facilities to otherwise less cost-efficient locations, if that were at all possible; and
• Undertakings would not be able to sustain “just-in-time” or similar type manufacturing and distribution models which depend on the availability of regular and predictable logistics services, of which liner shipping is a key component.31
29 The FEFC predictions of demand developments have over time been significantly more accurate than other
information providers’ forecasts. Illustrative examples can be found when comparing the FEFC forecasts to Drewry in May 2005, the GI and the FEFC predictions for 2005.
30 The reverse situation would also be very serious. The continuation of globalization would be seriously impeded with irreparable damages to developing countries and overall trade.
31 See ELAA Response to the DG Comp consultation paper of 18 June 2003, at 9.
19
67. Another objection against the need for carrier consultation has been that given the improved data exchange envisaged by the ELAA Proposal, there would be no need to further interpret the data. Nothing could be more wrong. The information provided by the IDS for the first time provides a clear view of the recent past of the industry, on which the forecaster will base its predictions. But it does not mean that the crystal ball for the future is clear. There are still significant uncertainties about the future.
68. The carrier consultations are therefore creating additional efficiencies to the industry which are indispensable to the attainment of stable liner shipping service in all European trades.
Article 81 EC Assessment of Forum Discussions
69. Various participants in the wider transport community require accurate, regular, and reliable information to assist them in the development and management of transport infrastructure and planning. Within the context of expanding world trade, increasing transportation infrastructure capacity challenges and complex supply chains, it is in the future incumbent on the liner industry to provide a forum in which these matters can be discussed and understood and in which accurate assessments shared with interested parties.
70. The demand for and use of accurate trade data is increasingly important as international shipping and logistics grows and becomes more complex, as the efficient flow of international trade becomes even more important to the European economy, and as transportation infrastructure challenges to the effective and efficient management of supply chains proliferate. Accurate and reliable trade information requires the collective input, analysis and understanding of the wider industry.
71. Shippers, freight forwarders, government, Commission, ports – all stakeholders collect useful information that determine supply & demand for liner shipping – which (if appropriately aggregated) adds further knowledge to the platform; normally the meeting would not be open to the public.
3.5. Step 5 – Price Index
72. Furthermore, the ELAA understands that shippers, freight forwarders and carriers alike, as well as Governments and research institutions, wish to have a historical benchmark of how prices have been developing. The ELAA believes that the envisaged price index (as contained in the Original ELAA Proposal) could fulfil that need if provided directly from the IDS to the industry stakeholders participating in the trade forum.
73. Carriers will submit their average revenue per TEU (i.e. there will be no port-specific pricing data), defined as all charges on the carriers’ bills of lading (including surcharges and ancillary charges) except charges for inland haulage), per trade to the IDS. The average revenue will be calculated using a template and the information will stem directly from carriers’ individual financial data bases. The IDS will collect all the prices and calculate a simple index per trade direction. The index would be published monthly but with a minimum delay of three months. An important change compared to the Original ELAA Proposal is that the price index will not be split by dry and reefer. Moreover, the index will cover a whole quarter rather than a month only, which means that the index will be based on figures between three and six months old, as suggested by the Commission consultants in the GI report.32 Such an index, which does not show any specific prices at all and hence does not enable carriers to identify even past strategies of
32 Global Insight, ISL and TU Berlin, The Application of Competition Rules to Liner Shipping, Final Report to
DG Comp, 26 October 2005, at 774.
20
competitors, cannot be anything other than compatible with EC competition law. The main reasons for this are the following33:
• The data is sufficiently delayed. How prices moved a quarter ago will not influence either spot or contract pricing negotiations – as recognised by DG Comp’s consultants;34
• The data is aggregated from at least three independent operators but in the vast majority of cases from numerous independent operators;
• The index produced by the IDS will not refer to any amount in currency (i.e. no US$ amounts, etc.), and it will not be split up by equipment type, commodity, region or port. It will be the summary of numerous pricing points of a carrier on each port pair, multiplied by the number of port pairs served and the number of carriers. It will include all elements of the rates apart from the inland leg(s), i.e. ocean freight rates, surcharges and ancillary charges;
• The only split that will be made is by trade direction (westbound/eastbound or northbound/southbound). Given significant imbalances of trades, such a split is necessary to provide relevant aggregate information; and
• The price index would also be made available to shippers and the wider public.
74. A price index constructed in this way cannot be used to facilitate collusion. The GI Report found that “it is doubtful whether a price index can be used as a good monitoring variable”, and that “consumers (shippers) may to some extent benefit, in this instance, perhaps dulling any collusive utility to some extent”.35 In the Revised TACA decision,36 the Commission held that the exchange of commercially sensitive information concerning prevailing prices is compatible with Article 81 EC if there is a sufficient level of aggregation of data and the individual data is disclosed neither to other members of the agreement nor to the secretariat, but only to an independent third party.37
3.6. Step 6 – Public Information Regarding Cost Elements Related to Liner Shipping
75. The Original ELAA Proposal suggested that carriers after discussion with shippers should agree on joint formulae for surcharges and ancillary charges. Despite what the ELAA conceives are significant benefits of such formulae through operational and administrative efficiencies and order in the terminals, DG Comp has consistently held during the discussions with the ELAA that such formulae would amount to price recommendations and would not be acceptable under EC competition law. Although the ELAA contests this finding, it has substantially changed its proposal and abandoned the envisaged formulae concerning cost elements related to liner shipping. This Revised Proposal merely envisages the following Liner Shipping Association activity in relation to cost elements related to liner shipping:
• The publication of the general terminal cost elements, for transparency and reference for shippers and carriers alike in individual negotiations of Terminal Handling Charges (THCs);
• The publication of the bunker cost and consumption that is already publicly available; and
33 See further ELAA Article 81 EC Assessment, at 49, 165 et seq. and 604-605. 34 Global Insight, ISL and TU Berlin, The Application of Competition Rules to Liner Shipping, Final Report to
DG Comp, 26 October 2005, at 68. 35 Global Insight, ISL and TU Berlin, The Application of Competition Rules to Liner Shipping, Final Report to
DG Comp, 26 October 2005, at 762 and 772. 36 Revised TACA [2003] OJ L 26/53, Commission Decision of 14 November 2002. 37 Loc cit., at para 71.
21
• Port charges and canal dues on trades to and from Europe, i.e. publicly available information on the charges due to carriers, for transparency and reference for shippers and carriers alike in individual negotiations of appropriate pass-on of these charges.
76. There will be no more agreement or even discussion between carriers on cost elements related to liner shipping under the ELAA Proposal. They will not form part of the carrier consultations or the forum discussions. The ELAA believes this may have unsettling effects on business, some of which can be overcome by at least ensuring transparent information of the cost elements behind this charges, so that shippers will understand what the charges are based on and negotiation of the charges will be founded on knowledge and not on speculation. In the following, the ELAA outlines the risks of total abolition of THCs and BAFs and how these to some extent could be overcome by increased transparency of cost factors.
THCs
77. THCs reflect a pure cost element. Conference THCs in Europe have in fact remained unchanged in Europe for the last 6-7 years, despite an increase in average terminal handling costs levied on the carriers. Today conference carriers only charge the shippers 80 percent of their terminal handling costs38 by way of THC and pay the remaining 20 percent out of the ocean freight revenue that they earn.
78. The idea behind a rule like the 80/20 rule is to make a fair split between the land and the sea part of the charge. The 80/20 split is based on the agreement between conferences and shipper association of 1989 (the CENSA agreement, see Annex 7), where the elements of the terminal costs were listed and defined as 24 items (plus some extra items for special containers and dangerous goods), out of which three items were attributed to the carrier39 and two split equally between carriers and shippers.40
79. The advantages of publishing the general terminal cost elements are significant:
• It is the perception of the industry that customers do not wish to negotiate and pay this charge individually to the stevedore, and the THC pass-on has therefore been seen as a negotiation service from the carriers, in particular to smaller customers against a consolidated and congested stevedore market with significant bargaining power.41 For this reason, the Commission did not object to joint fixing of the charges. In addition, carriers pay the full terminal handling cost upfront and give shippers a credit period of approximately 60 days; and
• By abolishing the 80/20 split carriers will have to negotiate individually with each shipper and there may be different rules applying to different shippers, resulting in a much more cumbersome procedure in the terminals and less control of the location of containers in the terminals. Some carriers may decide that it is not worthwhile to provide this service and credit period to shippers, and let each shipper deal with the terminals individually. This will potentially create chaos in the terminals, where each shipper will need to track its container from gate to vessel.
38 A charge per TEU corresponding to 80 percent of the average TEU cost of the conference members in that
port and on that trade. 39 Move of container from ship’s rail into ship’s cell (including ship’s hold or deck), opening and closing of the
hatch covers including unsecuring and securing, and movement of hatch-covers from bay to bay or to quayside and v.v as well as the lashing of the container.
40 Physical and clerical terminal planning, etc, as well as overtime or public holiday extra working costs. 41 Even in 2002, when the stevedores were less concentrated, the Commission recognized in its Revised TACA
decision that “[t]ransport users, particularly those with only small volumes to be shipped, may benefit from this situation as carriers will generally have greater bargaining power vis-à-vis terminal operators and will be able to negotiate a price that is substantially lower than that which might have been obtained by the shipper”; Revised TACA, [2003] OJ L 26/53, Commission Decision of 14 November 2002, at para 96.
22
80. In sum, abolition of the conference THC risks to create uncertainty in ports and significant bargaining power for the large shippers and terminal operators to the detriment of smaller players. This will likely lead to less efficient terminal handling, a more complex security clearance, higher risk of dislocation of cargo, higher and more volatile THCs and foreclosure of smaller actors. Admittedly, the solution in this Revised ELAA Proposal does not cover all these risks, but at least it will provide greater clarity and transparency of the charges currently levied upon carriers by the terminal operators. This will hopefully lead to a smoother negotiation of the level of the THCs or integration of THCs in the freight rate, and hence better chances for a continuation of efficient handling of goods port terminals.
Cost of Bunkering Vessels
81. Under the terminology used today, the cost of bunkering vessels is generally regulated in contracts by Bunker Adjustment Factors (BAFs). BAFs are adjustment factors for bunker costs. The purpose of BAFs is to hedge the risks for sharp fluctuations in bunker cost for carriers as well as transport users, which will serve to mitigate fluctuations in the overall freight rate. Today, the conference BAFs are a calculation of the increase or decrease in fuel cost per TEU on the trade in question, calculated on a formula based on a start date, average fuel price and average consumption per carried TEU. Based on this, the increase or decrease in the fuel price is calculated. Hence, the BAF is not always a positive charge, but an adjustment factor (that can be a negative charge) to take into account the fluctuation in fuel price.
82. There is no BAF equivalent in the ELAA Proposal. However, the ELAA anticipates a need for shippers and carriers alike of transparency in the calculation of costs of bunkering vessels. The ELAA therefore anticipates to publish regularly the price of fuel over time (IFO 180 and 380) in the most common locations for bunkering (essentially Rotterdam in Europe and key bunkering locations on the other leg of the European trades), as well as publicly available information on average fuel consumption for different standard vessel types so that an average cost per TEU can be calculated. This will increase transparency as to the cost of fuel, and facilitate individual negotiations of compensation for fluctuating bunkering costs.
3.7. Step 7 – Cost of Currency
83. Under the terminology used today, the currency risks of liner shipping are generally regulated in contracts by Currency Adjustment Factors (CAFs). CAFs are adjustment factors for currency costs. The purpose of CAFs is to hedge the risks for sharp fluctuations in currency costs for carriers as well as transport users, which will serve to mitigate fluctuations in the overall freight rate. For the convenience of transport users, carriers traditionally charge their customers in US dollars. However, the cost basis of carriers is generally more influenced by other currencies. Naturally, the spread of costs would be different on different trades and regions. This means that carriers need to hedge against the considerable currency risks they are facing due to the fluctuation of the US dollar. Just like the BAF, the CAF is not always a positive charge, but an adjustment factor (that can be a negative charge) to take into account the fluctuation of the US dollar in a more transparent and fair way than merely building the currency risk into the freight rate.
84. There is no CAF equivalent in the ELAA Proposal. However, the ELAA anticipates a need for shippers and carriers alike of transparency in the calculation of currency costs. The ELAA therefore envisages publishing the fluctuation of the US dollar compared to the average percentage attributed to each currency per TEU on a trade or region. The system would work in the following way (see also Table 3 above):

23
• Carriers input to the IDS the average percentage of costs in the trade or region in question attributable to each currency for the previous year;
• The IDS aggregates the percentage figures as soon as they become available (usually when all carriers have completed their annual accounting), and gives them a weighting corresponding to the volumes carried in the trade or region by each carrier in the previous year (usually the volume figures will since long be made public before the closing of each participating carrier’s annual accounts);
• Based on this information, the IDS can calculate an average attribution per currency and TEU on a trade or region. This information, a “currency basket”, will be produced annually and be placed in the public domain by the Liner Shipping Association without delay;
• The Liner Shipping Association would then continuously monitor the fluctuation between the US dollar and the “currency basket”, provided as a percentage of the revaluation or devaluation of the US dollar in relation to the “currency basket”, as a plus or minus figure compared to a historic reference point;
• The percentage figure would provide transport users and carriers alike better knowledge of the importance of currency fluctuations in future individual contract negotiations.
85. There is an undoubted currency risk in liner shipping, as carriers as a customer service rely entirely on the US dollar on the income side, whereas the cost side depends more on the trade or region of operation. Liner shipping would not be a valid business unless carriers had a possibility to hedge against these considerable currency risks. Having an arrangement to mitigate the currency risks, as a positive or negative charge, results in shippers sharing part of this risk, but also leads to cost savings for shippers when the charge is negative.
86. In light of the transparency to shippers of this Revised ELAA Proposal, the ELAA submits that a reference point for this pass-on is beneficial to all industry stakeholders. The envisaged information of currency fluctuations would not be a charge, but result in shared knowledge of the average impact of the fluctuation of the US dollar in comparison to the “currency basket” which is characteristic for the trade or region in question.
4. The Revised ELAA Proposal Merits Full Recognition in Commission Guidelines
87. In sum, the ELAA is confident that this Revised ELAA Proposal clearly conforms with EU Competition policy and Merits Full Recognition in Commission Guidelines.
• The Revised ELAA Proposal relies on its being valid in all EU Member States. Commission Guidelines, although a very strong influence, are not binding on national courts. The liner shipping industry will therefore not benefit from the same degree of legal certainty with Guidelines as it does with the current block exemption;
• That makes it all the more important that the Commission provide clear and unambiguous Guidelines. If a court in a Member State found the Revised ELAA Proposal incompatible with competition law, the whole Revised ELAA Proposal would fall; and
• If DG Comp and the liner shipping industry agree on the legality of the Revised ELAA Proposal, it would be logical to cement the rules rather than leaving them open to interpretation by others who will not have had the opportunity to gain as much knowledge about the industry at a global and European level as DG Comp and DG Tren.

24
88. The functioning of the liner shipping industry is complex. The ELAA appreciates the effort by the DG Comp case team to understand the market and review the ELAA Proposal and welcomes the commitment in the Explanatory Memorandum to its recent legislative Proposal to provide Guidelines based on the ELAA Proposal. The Commission has an opportunity to provide legal certainty to the industry. Hopefully, it can have a worldwide leverage and put an end to years of litigation to the detriment of all industry stakeholders.
25
Table of Annexes
Annex 1: Key Elements of the Revised ELAA Proposal and Their Rationale
Annex 2: Special Characteristics of the Liner Shipping Industry and An Economics-Based Critique of the DG Comp Consultant Report of October 2005 of Nils von Hinten-Reed, CRA
Annex 3: A Comparative Overview of the Differences Between the Current System and the Revised Proposal
Annex 4: The Importance of International Comity to the Liner Shipping Industry
Annex 5: Diagram: Overview of a Forum
Annex 6: The Revised Proposal: Industry-wide Consultation (A 6-Step Process)
Annex 7: Annex 1 to the 1989 CENSA Agreement
Annex 8: Trade information and port statistics April 2006
Annex 9: Comparison with the Air Transport Industry
Annex 10: The Tramp Shipping Market: Produced by Clarkson Research Studies, April 2004
Annex 11: Survey on Terminal Handling Charges and Currency and Bunker Adjustment Factors, MEL, Erasmus University, November 2005
1
Revised ELAA Proposal
16 June 2006
Annex 1: Key Elements of the Original ELAA Proposal
1. The ELAA has explained during the review process that the conference system is a low-cost way of achieving pricing based on long run marginal or average costs, in a high fixed cost industry where the opposite would lead to destructive competition and, consequently, to unreliable services. The system was intended to provide greater stability in a market prone to serious instability. Recent years have seen a series of cases brought by the Commission which, combined with judgments of the European Courts, have resulted in significant narrowing of the scope of application of the system authorized by the Council in Regulation 4056/86. The current regime, resulting from the compromise set out in the Carrier Agreement of 1998 and in the Revised TACA individual exemption Decision1 has proven workable and the current legal position is relatively clear.
2. Although the ELAA maintains the views summarized above, it has always sought to participate in the Commission’s ongoing review process in a constructive manner and to engage in a worthwhile discussion with the Commission and its services. Throughout three years of review, the ELAA has listened carefully to DG Comp’s concerns and comments by other stakeholders in this review process, and has taken into account various concerns raised by DG Comp and others.
3. The ELAA’s position (as in all its previous submissions) is based on three pillars which characterize the liner shipping industry:
• The non-collusive market structure (whereto we note that the liner shipping market will become even more competitive after Regulation 4056/86 is abolished, and conferences, conference surcharges and ancillary charges will disappear);
• Its unique blend of characteristics; and
• The importance of stability of supply.
4. Based on the three pillars above, the Original ELAA Proposal was developed as an alternative to the current system, aiming to be (a) acceptable from the perspective of EC competition policy and (b) able to preserve the stability of supply, without reference either to price fixing or the regulation or limitation of supply or capacity (as is still the case under Regulation 4056/86). The Original ELAA Proposal may be summarized as follows2:
• Exchange through an independent data service (IDS) and discussion between carriers of aggregated capacity utilization and market size data by trade and on a region/zone to region/zone basis (historic data with a month delay);
• Exchange, discussion and evaluation of commodity developments by trade;
• Discussion and evaluation of aggregate supply and demand data by trade/commodity. Forecasts of demand by trade and commodity would be published;
1 Revised TACA [2003] OJ L 26/53, Commission Decision of 14 November 2002. 2 Original ELAA Proposal, at pp 3-4.

2
• Carriers would obtain their own market share by trade, by region and by port (data aggregated with a month delay);
• Price index differentiated by type of equipment (reefer, dry) and trade direction (data aggregated with a quarterly delay). This information would be made publicly available;
• Surcharges and ancillary charges based on publicly available and transparent formulae; the details of which would be discussed with shippers;
• The envisaged system of information exchange would be based upon one or more industry body(ies) or agreements and committees per trade.
Why a Revised ELAA Proposal?
5. During the review process undertaken by DG Comp, the ELAA Proposal has been subject to extensive scrutiny by antitrust/maritime regulators and other governmental institutions, industry stakeholders and other commentators over the past year and a half. Most commentators have generally seen the ELAA Proposal as a positive step forward to modernize the industry, including:
• The Commission in its recent legislative proposal and in the accompanied memorandum regarding the proposal to repeal the liner shipping conference block exemptions, stating that “[t]he Commission remains committed to continuing the dialogue with the ELAA with a view to assisting it in developing an alternative system compliant with EU competition rules. It has acknowledged that exchanges of information leading to greater market transparency may contribute to the improvement in the way liner services are provided, in the interest of carriers, transport users and the public in general3;
• DG Comp (Director Ms. Lowri Evans at the EMLO Conference, London, 14 October 2005, and repeated again in Ms. Evans’ speech at the CI Conference, London, 27 April 2006, stating that DG Comp is “grateful to the ELAA for having come forward with a proposal to replace the conference system with an exchange of information that does not involve the setting of a common tariff”4); this has been further developed during fruitful and constructive discussions with the DG Comp case team;
• DG Comp’s second set of consultants (a consortium consisting of Global Insight, Institut für Seeverkehrswirtschaft und Logistik, and TU Berlin), who have made positive statements on the ELAA Proposal both before finalizing their report for DG Comp, see A.I. Czerny & K. Mitusch, “Cooperation and Competition in the Cargo Liner Shipping Industry”, working paper dated 7 March 2005; as well as in the report itself “The Application of Competition Rules to Liner Shipping” (the GI Report), dated 26 October 2005, for example at 65, 825 and 906;
• A number of Member States, in their response to the White Paper, such as Denmark (at p 1), Greece (although, like ELAA, also questioning whether there is a need to repeal the current Regulation) and Germany (at p 5)5;
3 Proposal for a Council Regulation repealing Regulation (EEC) 4056/86 and amending Council Regulation
(EC) 1/2003, COM(2005) 651 final, 14 December 2005, Explanatory Memorandum, and Commission Memorandum Memo/05/480 of 14 December 2005.
4 Full comments available at the DG Comp website. 5 Full comments available at the DG Comp website.

3
• The European Parliament, Resolution on the application of EC competition rules to maritime transport (2005/2033(INI)), adopted on 1 December 2005, concluding that “the proposal of the ELAA contains interesting points, including the introduction of a price index and the creation of discussion forums for carriers, shippers and other industry players, which should be taken up by the Commission, pursuant to competition rules, in drafting any amending regulation”, at p 12. The support of the ELAA initiative and the need for Guidelines before the repeal of Regulation 4056/86 have been re-emphasised at the 19 April 2006 ECON and TREN Committee Discussions, see Draft Reports 2005/0264(CNS) and COM(2005)0651 of 28 March 2006 (amendments were considered on 1 June 2006, TRAN/6/32796);
• The ECOSOC, Opinion COM(2004) 675 Final of 16 December 2004, at 3.4;
• The Committee of the Regions, Opinion of 13 April 2005, [2005] OJ C 231/38, see in particular at 3.8 “The Committee of the Regions takes the view that the Proposal put forward by [the ELAA], to continue to make provision for the exchange, on a non-discriminatory basis, of particular data not linked to named enterprises and aggregated with a delay should be examined in a favourable light. In the final analysis, freely available market information may lead to greater transparency and thus also promote competition. A price index accessible to all market participants would be a key component part of the system, the aim being to take over the guideline role played by existing conference tariffs”, and 4.4 “The Committee of the Regions takes the view that the Proposal put forward by [the ELAA] provides an effective basis for future regulatory measures”; and
• Shipper Associations (Messrs. Filip Beckers, ESC, and Andrew Traill, FTA, Shipper Forum 2005, Hamburg, see Lloyd’s List of 7 October 2005), as well as the Federation of German Industries (response to the White Paper, at 3).
6. However, there have also been more cautious and indeed negative views expressed on certain aspects of the ELAA Proposal. The ELAA treats these comments very seriously, in particular when they come from our customers.
7. In this Revised ELAA Proposal those parts of the Original ELAA Proposal over which customers have expressed concern have been refined. The ELAA also notes that the DG Comp case team has provided very useful guidance during the review which we have sought to take into account in preparing this Revised ELAA Proposal, and which we gratefully acknowledge. This submission contains a comprehensive discussion of the Revised ELAA Proposal; the response to DG Comp’s concerns is contained in Annex 3.
8. In particular, this Revised ELAA Proposal now clearly defines:
• How all industry stakeholders can have access to the information produced by the Independent Data Service, and the industry’s ideas of creating a platform for constructive consultation between shippers’ organisations and carriers;
• Why the data exchange and discussion is needed primarily in order to keep the logistics chain running smoothly and to create stability of supply and reliable liner shipping services in the short as well as in the long term. The industry perceives that the smooth running of supply chains and the stability of supply are central demands of our customers;
• How the envisaged system of carrier trade committees is to be replaced by consultation in the form of an integral system of carrier consultations and industry-wide forums, open to all industry stakeholders;

4
• How the forecast will initially be prepared by outside experts and improved by discussions involving all industry stakeholders;
• Which data is needed to efficiently manage a trade and with which frequency it needs to be exchanged in a post-conference world, where in the absence of a replacement regime there would be trades with virtually no reliable data. In relation to this, ELAA has modified the Original ELAA Proposal to cover data exchange not on commodities but simply on equipment type (20’ dry, 40’ dry and reefer containers), and clarified that data that could be disaggregated will never be distributed. This is ensured through safety mechanisms against disaggregation that go beyond what has been required in precedent case law. In this respect, the ELAA re-emphasizes that the Commission has never prohibited an information exchange of sufficiently aggregated data, irrespective of the frequency with which data has been exchanged, as it is impossible to use as a tool for collusion. Moreover, the ELAA Proposal goes into significantly less detail, and uses a much higher level of aggregation than the system applied to Revised TACA, which after a party resolution was found compatible with Article 81(3) EC. In Revised TACA, information could be exchanged on a weekly basis6;
• How the price index function to the benefit of the whole liner shipping industry, giving our customers the possibility to form their commercial strategies based on accurate sufficiently delayed information, and carriers to make efficient investment decisions and re-deployment decisions. Carriers are also requested by governments to provide information on the movement of pricing; and
• How the publication of information from the public domain of cost elements related to liner shipping will serve to increase transparency of the elements of the charges, to the benefit of all and without in anyway involving any discussion on the topic.
9. The Revised ELAA Proposal is also aligned with the Global Insight (GI) impact study of the Original ELAA Proposal, commissioned by DG Comp. The GI report claimed that, when assessing the Original ELAA Proposal, they found that the global trade association made “a lot of sense”, and that a “truly independent information exchange system could bring benefits”.7 It also considered that “[p]ublication of all data provided to carriers by the system of information exchange is helpful to avoid collusion”8. Its main objection against the system contained in the ELAA Proposal as a whole was that it would be “shared on a limited-circulation-basis, only within a ‘club’ of members”.9 It considered that any risks resulting from the publication of a price index “can be considerably reduced by lowering the detail and frequency only a bit”10 and in the case of surcharges and ancillary charges that “[t]he danger is compounded if they are unilaterally created and imposed by carriers acting collectively”.11 Although the ELAA challenges many of the conclusions in the GI report (see Annex 2), it is pleased to see that those elements of the Original ELAA Proposal over which the consultants expressed concern are precisely those that the ELAA had already decided – based on the consultation process – to clarify and refine in this Revised ELAA Proposal.
10. The ELAA is of the opinion that this submission provides a comprehensive discussion of the Revised ELAA Proposal. We note, however, that this submission does not amount to
6 No public version of the Resolution available. ELAA counsel has received a copy from the TACA counsel. 7 Global Insight, ISL and TU Berlin, The Application of Competition Rules to Liner Shipping, Final Report to
DG Comp, 26 October 2005, at 906. 8 Lot cit., at 73 and 809. 9 Loc cit., at 709. 10 Loc cit., at 68. 11 Loc cit., at 74.
5
a fully-fledged legal and economic assessment under Article 81 EC. For this, reference is made to the previous ELAA Article 81 EC Assessment. For those aspects of the Proposal where the Commission has requested further legal clarification, however, the ELAA has further explained why the Proposal is compatible with Article 81 EC. The ELAA believes the modifications to the Original ELAA Proposal are such that the Article 81 EC Assessment is still valid; if anything, its findings would be strengthened as the current submission contains even less – if any – aspects that would fall foul of Article 81(1) EC. Rather, the purpose of the present submission is to describe why industry cooperation is necessary and can be achieved in a competitive market through the envisaged Revised ELAA Proposal. Moreover, the ELAA seeks to clarify in detail how the Revised ELAA Proposal will work and how it will benefit all industry stakeholders. This submission will also describe the concerns raised by, in particular, our customers and DG Comp, and how the industry has dealt with those to form an appropriate system to build a foundation for the forthcoming Commission Guidelines.
11. The ELAA believes that the additional detail provided in this submission should convince DG Comp of the viability of the envisaged system of carrier and industry-wide consultation, to the benefit of all stakeholders in our industry, compatible with the requirements of international comity, and deserving the legal certainty offered by comprehensive Commission Guidelines.
1
Revised ELAA Proposal
16 June 2006
Annex 2: Special Characteristics of the Liner Shipping Industry
1. The ELAA’s position (as in all its previous submissions) is based on three pillars which characterize the liner shipping industry: its non-collusive market structure, its uniqueness and the importance of stability of supply. As misconceptions appear to remain – we refer to the DG Comp impact assessment based on the GI Study, published on the 14 December 2005 – the ELAA finds it necessary to reiterate the main aspects of these three pillars.
2. The liner shipping industry is not prone to either explicit or tacit collusion. The ELAA has always argued that the liner shipping industry today is highly competitive. The ELAA Article 81 EC Assessment provided significant detail about the day-to-day functioning of the industry, together with numerous facts and data relating to its competitive nature. The ELAA has developed its submissions and indeed the Proposal, taking account of the current state of affairs in the industry:1
• Absent tariff setting, which does not happen today and which is completely abandoned in the ELAA Proposal, there is no viable mechanism for collusion in the liner shipping industry;
• Concentration is low even at port pair level, which makes collusion highly unlikely. The ELAA described the market situation per major trade in its Article 81 EC Assessment.2 In Annex 8, the ELAA also describes how plenty of carriers are active in each of the major ports;
• The market structure is simply not conducive to collusion. Carriers are unable to reach terms of coordination given the complex and unstable environment they operate in; demand conditions are unstable; demand patterns are volatile; carriers engage in confidential service contracting or rate agreements, while the spot market is increasing in importance3; there are low barriers to entry and low switching costs; market shares are asymmetric and vertical integration is asymmetric;
• In addition, the liner shipping market lacks essential aspects that would allow detection and punishment of collusion. Absent such features, generally accepted economic thinking holds that collusion cannot successfully occur. This is also recognized in the precedent case law by the Commission and the European Courts;4
• Pricing is not transparent and divergent market behaviour is difficult to detect as a result of confidential pricing, numerous pricing points for each carrier per port pair and low concentration;
1 See in particular, Original ELAA Proposal, at pp 4-6, and ELAA Article 81 EC Assessment, at 500 et seq. 2 ELAA Article 81 EC Assessment, at 394 et seq. 3 There is currently no precise data available to identify the ratio between spot and contract cargo worldwide or
per trade, but it is ELAA’s understanding that DG Comp intends to issue requests for information to gain a better understanding in this respect. The ELAA welcomes and supports such a request, and will be happy to work with DG Comp to identify an appropriate definition of spot and contract cargo, to ensure the highest possible accuracy of the data provided.
4 See e.g. Case T-342/99 Airtours v Commission [2002] ECR II-2585, at 62.
2
• Effective retaliation tools in the form of capacity increase (a lead time of three years) or “fighting ships” strategies (market not sufficiently concentrated) are not available;
• Within consortia, competition is fierce between carriers. In the ELAA Article 81 EC Assessment, it was shown how consortia members regularly compete to gain market shares from each other.5 Moreover, carriers often belong to different consortia on different trades, and relay services thus often result in goods being transported by two different consortia. The internal competition between consortium members will be even more apparent once the conference system is abolished (the perception in the Commission’s merger decisions is that the issue with consortia today is to a large degree that they are intertwined with the conferences). In a post-conference world, consortium cooperation will be limited to operational cooperation only, with different objectives and benefits than conferences. This has been recognised by the Commission in the past.6 When the Commission in its previous merger decisions has regarded consortia as one undertaking for competition law purposes, it has done so mainly for the reason of the perceived complex links with conferences.7 In a post-conference world, such links would no longer exist;
• It also cannot be ignored that customers today are more powerful and sophisticated than ever before. Carriers mainly deal with large shippers and freight-forwarders that have the ability to exert significant bargaining power and generally have a more learned view on market pricing than carriers. Therefore, any publication on the supply and demand situation has increasingly less influence on price;
• Finally, the liner shipping market will become even more competitive after Regulation 4056/86 is abolished as conferences and in particular conference surcharges and ancillary charges will disappear. The whole rate will be up for negotiation – a crucial fact which needs to be taken into account fully when assessing the ELAA Proposal.
3. For those reasons, the ELAA challenges the statement in the GI Report that the (Original) ELAA Proposal could lead to collusion as theoretically flawed and ignoring day-to-day reality.
4. The ELAA has requested Nils von Hinten-Reed of CRA to analyse the GI Report. His analysis is enclosed at the end of this Annex.
5. The liner shipping industry has a unique blend of characteristics. As the ELAA has pointed out, the liner shipping industry has a unique blend of characteristics8, including but not limited to: the combination of high fixed costs, inelastic and asymmetric demand, inelastic and lumpy supply, high risk and low barriers to entry, which makes the market inherently and chronically unstable. This chronic instability – market failure – manifests itself through high fixed costs for the provision of regular scheduled international services, rate fluctuations and fluctuating demand which the industry cannot control without an appropriate instrument to accurately forecast demand and supply. The ELAA considers that the special characteristics of the liner shipping industry warrant continued
5 ELAA Article 81 EC Assessment, at 394 et seq. 6 Communication of the EC Commission, “Report on the possibility of a group exemption for consortia
agreement in liner shipping”, COM(1990) 260 final, page 11. 7 See e.g. Case COMP/M.3863 TUI/CP Ships, Commission Decision of 12 October 2005, at 21. 8 See, e.g., ELAA Issues Paper for the Oral Hearing, 3 December 2003, para 7.15 and 8.9; ELAA Post Hearing
Submission, 20 February 2004, annex 2; Original ELAA Proposal, at p 2; ELAA Article 81 EC Assessment, at 42, 184 et seq., 554 and 620.

3
sector-specific treatment to ensure stability of supply, and therefore welcomes the commitment by the Commission to provide Guidelines on the compatibility of the Revised ELAA Proposal with EC competition law. The ELAA contests the statement of the Commission in its recent legislative proposal that the liner shipping industry “is not unique as its cost structure does not differ substantially from that of other industries”.9
6. DG Comp has made analogies to the air transport sector and suggested that the liner shipping industry does not differ from other industries as their cost-basis are similar. Although looking at other industries can be a useful exercise, any analogies would be imperfect as the liner shipping industry has a unique blend of characteristics that make it significantly different from air transport in a number of material aspects. In Annex 9, the ELAA provides an overview of the differences with the air transport sector for the purposes of the Revised ELAA Proposal. In sum, we describe how the main needs for the Revised ELAA Proposal (effective management of logistics, capacity deployment planning and capacity investment planning) are not present to the same extent in the airline sector.10
7. Stability of supply and reliability of liner shipping services is crucial for world trade. The essential welfare benefit generated by the current regime is stability of supply, defined as the matching of supply to demand, which seeks to ensure a relatively stable environment for an inherently unstable industry, as per the main objective of Regulation 4056/86.11 The Commission’s review has repeatedly confirmed that the liner shipping industry provides regular, reliable, high-quality scheduled services, with ample competition, no switching costs and low barriers to entry. Stability of supply was and remains a valid objective for regulation in this industry.12 Efficient investment and deployment decisions are vital for the provision of sufficient capacity to meet future demand at all times and at all destinations,13 particularly as the building price and container price has risen remarkably over recent years. Likewise, the liner shipping industry cannot deliver reliable and stable services to its customers to facilitate the globalized supply chain unless each element of the logistics machinery works effectively (e.g. sufficient and appropriate liner capacity, boxes and container availability, port and terminal availability, particularly as larger ships – which are becoming the industry standard – allow for less flexibility). No chain is stronger than its weakest link.
8. The ELAA Article 81 EC Assessment showed that contracting does not provide stability in the market.14 In all trades, the balance of supply and demand dictates rate movements and rate negotiation is frequent, leading to high rate volatility. In US Trades, there are some restrictions in the short-term swings due to the higher number of service contracts,
9 Proposal for a Council Regulation repealing Regulation (EEC) 4056/86 and amending Council Regulation
(EC) 1/2003, COM(2005) 651 final, 14 December 2005, Explanatory Memorandum at 26. 10 The main distinctions are (1) that air cargo traffic does not face the same logistics complexity as liner
shipping due to the size of the cargo and the vessels, and (2) that the driver of aircraft investment and deployment is passenger traffic, as this is by far the most important business, and aircraft are interchangeable. Passenger traffic demand is easier to predict than cargo as very detailed data is available today through MIDT database information and alliance cooperation, and the relevant markets are highly concentrated. Moreover, getting the demand forecast right in the airline industry is less crucial, as demand is more elastic, and unlike the liner shipping industry short-term chartering of aircrafts is a viable option. The DG Comp consultants recognize that “virtually no vessels are available.” Global Insight, ISL and TU Berlin, The Application of Competition Rules to Liner Shipping, Final Report to DG Comp, 26 October 2005, at 117.
11 See further ELAA Post Hearing Submission of 20 February 2004, at 3. 12 The ELAA refers to previous ELAA submissions, in particular ELAA Issues Paper of 3 December 2003, at
7.8; and ELAA Technical Paper: Precedents drawn from case law regarding the concept of stability, 3 December 2003.
13 See also ELAA Response to the DG Comp consultation paper, 18 June 2003, at 5.10 et seq., ELAA Issues Paper of 3 December 2003, at 7.24 et seq.; the Original ELAA Proposal, at p 2; and ELAA Article 81 EC Assessment, at 261, 294, 510 and 552 et seq.
14 ELAA Article 81 EC Assessment, at 297-299.

4
but carriers have confirmed that shippers will generally renegotiate the terms of their service contracts if rates fall to any appreciable extent (and in any event, rates are set for short-term only). The reverse (i.e. that carriers would manage to increase rates midterm if the market is going up) is rare, however. In other trades, switching is not ameliorated by the occurrence of service contracts. It cannot come as a surprise that the spot market is on the rise in all trades.
9. Contrary to the EC Commission’s assumptions15 and arguments made by the European Shippers’ Council16, service contracts are not a viable alternative to the conference system as contained in Regulation 4056/86.17 Contracts have emerged as a regulatory creation on US trades, and low minimum volume commitments are a way for shippers to undermine the potential penalties for breach of contractual volume requirements. In essence, service contracts are little more than framework contracts.
• First, neither shippers nor carriers seem to have a deep interest in long-term contracting which binds the parties to serious volume commitments and fixed rates. Rather, shippers rely on low minimum quantities in their contracts to circumvent the obligation to pay “dead freight”.18 When was dead freight last paid by customers on trades to and from Europe? Shippers want to have the possibility to switch between carriers, inter alia in order to strengthen their bargaining power towards carriers, and the trend is rather that shippers commit to lower and lower volumes. Liner shipping rates are driven by supply and demand, and long-term contracting is not in reality a practicable option;
• Secondly, if long-term contracting with serious volume commitments dominated the market, that would inevitably lead to certain foreclosure effects, as shippers would be tied up by those volume commitments, which would make entry more difficult;
• Thirdly, in a market dominated by such long-term contracting, the rates for the additional goods would be extremely sensitive to demand fluctuations as they would always be “on the margin”, and hence be subject to serious rate volatility;
10. For all the assertions made by DG Comp and the European Shippers’ Council, there is no evidence whatsoever to support the argument that (a) the stability of supply we see in the market is due, in whole or in part, to contracting, or (b) that long-term contracting will provide the requisite degree of stability should Regulation 4056/86 be abolished without a replacement as outlined in this Revised Proposal.
11. The stability of supply is also closed linked to environmental efficiencies.
12. Knowledge of what happens in the industry is a prerequisite for stable liner shipping services. Almost all useful trade volume statistics (save for on US trades) are generated by the conference secretariats. Without conferences, there will be no reliable data available to industry stakeholders unless an appropriate replacement regime is put in place. This crucial factor, the main fear of carriers, has been overlooked in the impact assessments carried out by the Commission services and their consultants.
15 See EC Commission White Paper Annex, at 41: “The Commission has explicitly recognized that service
contracts provided benefits for shippers, e.g., they allow for special services tailored to particular needs”. 16 European Shippers’ Council Response to the DG Comp consultation paper, at p 7: “Global contracting by
large and medium sized shippers is a dominant feature of liner shipping in today’s market”. 17 See further ELAA Post Hearing Submission of 20 February 2004, at 5.7-5.11. 18 Dead freight is a charge due in case of freight volumes below the contractual commitment.
5
The Application of Competition Rules to Liner Shipping by Global Insight
An Economics-Based Critique
Nils von Hinten-Reed, CRA
In October 2005, DG Comp published a report by Global Insight on the application of competition rules to liner shipping (the “GI Study”).19
The purpose of the GI Study was to, see para 3-4, consider the impact of two distinct policy options, i.e. (i) abolishment of Regulation 4056/86 with no replacement and (ii) abolishment of Regulation 4056/86 and replacement with the ELAA Proposal, and to:
“both theoretically and empirically assess the economic impact of both policy options regarding competition, investment decisions, reliability of services, competitiveness of EU liner shipping, trade and commodity flows, innovation with respect to transport services and infrastructure, employment, and other relevant factors such as port congestion”
This was a tough assignment but an important one. In effect, what is the economic impact of removing the exemption contained in Regulation 4056/86 from competition rules on the operation of liner shipping markets? There are two aspects:
• Analysis of the impact on prices / service quality of removal of the exemption for conferences contained in Regulation 4056/86;
• Analysis of the ELAA proposal’s economic benefits and costs given that post-abolishment of Regulation 4056/86 the activities allowed by Regulation 4056/86 would no longer exist.
The GI Study tries to analyse the impact of the removal of Regulation 4056/86 by looking at the economic effects of the alternative regulatory regimes by means of a game theoretic model of the liner industry. We are told that the model incorporates the economic structure of the liner industry and that the GI Study is able to model three scenarios: No-Conference, Conference-Independents and No-Independents. The Conference-Independents scenario is said to correspond to the current situation in the market and the No-Conference scenario is a contestable market where price competition generates the “market price.” It is important for the overall evaluation of the economic welfare impact of the reform of Regulation 4056/86 that the scenarios accurately reflect the current market situation and likely market impact.
In utilising a theoretical model of liner shipping competition, however, the authors of the GI Study make a number of fundamental errors that could only have been rectified by a more robust assessment of actual markets, a fact which the authors themselves allude to but, apparently, failed to ask DG Comp to help them with, even though that latter organisation has all the means to obtain actual data on the basis of properly formulated requests for information.
Bottom line: the GI Study does not even get to the foothills of the assignment it set out to consider and utilises a “straw man” comparison that does not do justice to how Regulation 4056/86 actually operates in the light of the extensive litigation between the industry and the European Commission. The comparison assumes, in effect, that the liner industry does not
19 The Application of Competition Rules to Liner Shipping, Final Report 26 October 2005 by Global Insight in
association with the Institute of Shipping Economics and Logistics and the Workgroup for Infrastructure Policy and Berlin Institute of Technology, available on the DG Comp website.

6
compete today through (a) no analysis of how conference carriers actually price and (b) no appreciation of how lines whether conference members or not compete in the market.
In the following, we set out why the GI Study cannot be used to assess the important economic policy question posed. We concentrate on the GI Study’s discussion of competitive effects, rather than its more useful discussion of the potential efficiency benefits of the ELAA Proposal.
The Use of Theoretical Models in Policy Evaluation
1. Economists use theoretical models to try to make sense of how different parameters to an economic issue impact on each other. For example:
• The use of the theory of the empty core was an attempt by maritime economists to explain the actual behaviour of liner shipping markets. Like every theoretical model there are simplifications and we agree that the “empty core” approach does not model how competition actually works in liner shipping markets;
• The same is true of the industrial organisation approach opted for in the GI Study, but for different reasons. Economists know that oligopoly theory (utilising game theoretic tools) can be used to show collusion or contestable markets depending on the assumptions used. Economists also know that we use the Cournot and Bertrand models of competition not because they are right, but because they are tractable and can be used to illustrate particular features of markets. In itself, the use of game theoretic models can illustrate the economic issue at hand but they can be no basis in themselves for providing policy advice on the impact of the abolishment of Regulation 4056/86 on actual practice.
2. The fundamental error contained in the theoretical setup of the GI Study is that it fails completely to correspond to reality and, in particular, the nature of price setting in liner shipping markets today. Without taking full account of the actual realities on the market no simplified theoretical representation is going to accurately model whether prices are likely to fall below current levels and hence you cannot then conclude on the basis of the model what the likely economic welfare effects are. It may well be the case that prices actually charged by individual lines today reflect contestable conditions – there is after all little explanation how the conference – independent scenario of prices above marginal cost could be sustainable in the face of free entry without (a) the nature of competition being different or (b) conferences acting as a monolithic block with sufficient market share (and market power). Both of these assumptions need to be tested and, in our view, neither holds water.
Fundamental Error: The Nature of Conferences Today
3. In para 614 of the GI Study, the authors note that conferences today do not act as traditional price cartels and operate alongside non-conference lines. The authors also point out that there is free entry and that together these aspects question the ability of conferences today to exert market power and the ability of conferences to achieve stability between conference members and independent carriers.
4. We agree that these aspects would lead any policy maker to question the presumption of conference market power, but the authors then assume away the problem in para 615 by suggesting the role of conferences as a means of signalling to conference and non-conference the appropriate price and for conference members to stick to it. Reference is

7
made to another simplistic oligopoly model, namely the Stackelberg leader – follower model to illustrate the role of conferences.
5. The use of a particular oligopoly model makes the economic issue tractable but it fails to take proper account of what actually happens (and described in the first part of the GI Study at least for the Trans-Atlantic). Para 341-347 of the GI Study describe the impact of individual service contracts have been introduced on the Trans-Atlantic route. However, the GI Study should also have noted that following the EC Commission’s own Revised TACA case20 there has been individual contracting, in one form or another, on many of the other trades. For example, CRA detailed the contracting model used in the Europe – Far East trade in their report entitled “A Study on the Impact of the FEFC in the North Europe – Asia trade”.21 This is important factual information that should have influenced the modelling of theoretical scenarios and we will return to this issue later in this paper.
Using price to model competition…
6. In para 609, the GI Study makes a fundamental error in assuming the competition in the market should be modelled on the basis of price because the primary aim of liner shipping conferences is to fix prices. Conference members may jointly fix the headline (“maximum”) rate and publish it because they have been told by the EC Commission that they must do so.
7. Moreover, in transport markets there is no basis for suggesting that they should be modelled solely on the basis of price competition when capacity decisions in the system to all intents and purposes seem to have a lot of explanatory power for the changes in average prices seen in the diagrams describing the various trades.22 The fact that capacity models cannot capture all the facets of the liner industry is also no basis for preferring a more tractable price competition model that does not fit the market characteristics.
Using the Wrong Price to Model Conference Behaviour…
8. The fact that shippers can conclude individual agreements with line(s) should have alerted the authors of the GI Study to the error in assuming conferences are a monolithic block. The conditions for collusion (outside of institutional collusion imposed by Regulation 4056/86) are simply not met in liner markets. Today, price setting is opaque and all lines have every incentive to deviate from any “collusive” price set by conferences. This is exactly what happens in the market place. Shippers are able to negotiate and re-negotiate on rates (and surcharges) – as noted in the GI Study23 – either through individual contracts or through spot markets.
9. The GI Study should have gone into great detail as to how prices are set. Two aspects should have been noted:
• First, individual agreements with shippers have been a feature of EU and US trades since 1999. Yet there is a discussion on the Trans-Atlantic but no mention of similar agreements on trades to Asia. The GI Study should have noted the way in which contracts are negotiated and how they break down when general price pressure is
20 Revised TACA [2003] OJ L 26/53. 21 CRA, “Shipping Conferences: A Study on the Impact of FEFC in the North Europe-Asia Trade”, prepared by
Nils von Hinten-Reed, Tasneem Chipty and Fiona Scott Morton (2004). 22 See Tables contained in GI Study IV 1-34. 23 Para 553 of the GI Study.
8
downward – in other words shippers like longer contracts when rates are rising due to fundamental supply and demand factors but also like to re-negotiate contracts when prices fall. Both elements occur independent of the setting of the conference tariff;
• Second, the GI Study should also have considered the implications of the existence of spot markets. Namely, the conference tariff is not the market price and therefore any comparison between prices today and post-Regulation 4056/86 would need to take account of (a) how prices are set today and (b) how Regulation 4056/86 currently impedes changes in structure that may impact on price levels tomorrow. It is interesting to note that if one took the theoretical approach advocated in the GI Study seriously, one should have also recognized that most oligopolistic models suggest that consolidation post Regulation 4056/86 would lead to price rises unless there were corresponding efficiency improvements.
The Conference – Independent Scenario Is Inappropriate…
10. In short, the GI Study has failed to establish why prices today are higher than otherwise would be the case in the absence of Regulation 4056/86. The conditions for actual collusion (without conference tariff, etc.) on trades are not met and because pricing is opaque lines have every incentive to “deviate” and compete and do so. Today’s reality consists of contracting (in whatever form it comes) and spot market, and this has changed the old conference model forever.
11. Now, what may be important for the liner industry is the need to have better information on which to plan increased capacity. This is evident from the content of the ELAA Proposal. What really matters for the development of prices is how much capacity comes on line, when and where. With high fixed costs, capacity utilization is key to maintaining profitability and we see in the market that yield management techniques are deployed to change prices when capacity has not been filled.
12. The GI Study is very interesting on one point. It illustrated the Europe – South America (East Coast) trade where it appears the conference has broken down and noted that nothing much has changed.24 If we are right and capacity determination is key then it may be of no surprise that the formal dissolution of headline conference tariff setting has not lead to changes in rates. Either the authors argue that prices are currently at a collusive level based on tacit collusion or they are at the contestable level already. We tend to think that if it is the former the GI Study is wrong to base its conclusions on price and if it is the latter then the conference – independent scenario is simply wrong.
The GI Study’s Analysis of the ELAA Proposal
13. In para 694 to 830, the GI Study contains an evaluation of the ELAA Proposal submitted to DG COMP in August 2004 and supplemented by the Article 81 EC Assessment in March 2005.
14. One of the main competition concerns is that the information exchange in the ELAA proposal may facilitate collusion. For the analysis of collusive oligopoly, three aspects are of particular significance:
24 Pages 98 to 107 of the GI Study.

9
• Collusion represents a deviation from firms’ short-term profit-maximising strategy. Hence, given the behaviour of its rivals, each firm has an incentive to undercut its competitors;
• From (1) it follows that collusion can only be maintained if the long-term profits from collusion for each firm are higher than the profits from deviating from the collusive price level, which would be followed by ‘punishment’ by the other firms;
• The incentive to cheat on the other firms is larger if the market conditions do not allow firms to observe if their competitors deviate from the collusive behaviour. In such non-transparent markets, collusion usually cannot be maintained.
15. It follows that information exchange may help collusion if it
• Facilitates a common understanding on the terms of coordination;
• Helps the coordinating firms in monitoring whether the terms of coordination are being followed;
• Improves the ability or reduces the cost of punishing a deviator.
16. The GI Study contains a similar framework for the analysis of collusion. However, the GI Study fails to note that in applying this framework to liner shipping, post-abolition of Regulation 4056/86 the following holds:
• For collusion to occur, all elements (agreement, monitoring, punishment) must be fulfilled. The three elements are necessary but not sufficient conditions for collusion;
• Analysis of the ELAA proposal needs to take place in a world where the conference system contained in Regulation 4056/86 no longer exists. In other words, the GI Study needed to show how the production and exchange of information led to the necessary and sufficient conditions for (tacit) collusion to hold. It cannot be assumed that because lines had all the instruments for collusion in their hands under Regulation 4056/86, that this situation continues post-abolition of Regulation 4056/86.
17. In general, for collusion to occur information needs to be firm-specific rather than on an industry basis and there needs to be some communication between lines to ensure that they all understand what the game is and how to play. The GI Study contains an Annex listing existing data sources. Some of the most relevant items in the Annex that describe the existing transparency or otherwise of how competition works include:
• Information on freight rates, where Para 33 of the GI Study holds: “Effective freight rates diverge in most cases considerably from the official tariffs or indices published by the conferences. Effective freight rates are not published nor revealed by the carriers and shippers, they are confidential. Effective door-to-door freight rates may be influenced by several tariff components, not just ocean freight only; they usually include several surcharges”;
• Investment, where para 37 of the GI Study holds: “Investment in ships is in general well-documented: capacity, numbers, technical details and values derive mainly from detailed information of order books. Similar information is usually available for the second hand and demolition markets. Most data is available on a monthly or quarterly basis. (…) Historical investment related data is therefore very well-documented, timely and readily available, information in general is sufficient for benchmarking ship prices and the estimation of global capacity developments by

10
vessel type and size class as well as for individual investment decisions concerning the fleet. The order book of forthcoming new vessels is well known”.
18. The task for the GI Study was to see if the information produced and exchanged as part of the ELAA Proposal is sufficient and necessary to sustain (tacit) collusion and to specify the mechanism by which the communication between lines would lead to tacit collusion.
19. Upfront, we note that to the extent that any information is transparent to the market already, the conclusion must be that any meeting between competitors cannot add to that transparency and, hence, cannot lead to tacit collusion.
20. The GI Study’s analysis of the ELAA proposal begins by making some general comments about plus factors (higher concentration, competitors meeting). In and of themselves these plus factors are not sufficient to conclude that collusion is going to happen and the speculative view that competitors’ meeting encourages collusion would make any trade association suspect, when an appropriate analysis needs to specify what is being discussed between competitors and how this impacts on market outcomes (reducing output or quality / raising price).
21. When the GI Study then goes into a discussion of the price index it concludes that if there is sufficient aggregation then collusion is unlikely but then assumes that a drop in the price index can be ascribed to “cheating” by a particular member (and leading directly to its punishment) and distinguished from a general drop in demand. Of course, as detailed in the Annex, individual shipper information is confidential and nothing in the ELAA Proposal makes it any more transparent. This is the relevant test for the ELAA Proposal: how does the proposal make pricing / capacity decisions of individual lines any more transparent? If the ELAA proposals do not allow for the exchange of confidential line information and there is no discussion of individual pricing plans then it is hard to see how the production and exchange of information envisaged can lead to the fulfilment of the necessary and sufficient conditions for (tacit) collusion.
Conclusion
22. The GI Study comes in two (distinct and divorced) parts: first, a description of various trades which contains data on average rates and specifics of the trade and then, second, a economic impact assessment that contains a comparison of the experiences of reform of other modes of US transportation and a theoretical comparison of a “straw man” version of today’s current state of liner competition with a perfectly contestable future.
23. In order to make the comparison tractable, the GI Study has failed to take account of the state of competition on the various trades analysed, in particular, the implication briefly discussed in para 552 of the GI Study that conferences have today lost their pricing power due to confidential contracting. The theoretical model outlined in the GI Study therefore compares a straw man version of Regulation 4056/86 scenario with a contestable market. This neglects the fact set out in para 552 of the GI Study that rates charged to shippers are confidential and any analysis of actual data of lines would have shown that there is a wide dispersion of rates. In other words headline tariff fixing has not had the anti-competitive effects on actual bargaining between lines and shippers. The lines should not be blamed for the absence of any analysis of actual price data – the consultants were employed by DG Competition and could have asked them to use their powers to request lines to produce suitable data.
24. The GI Study should have analysed the impact of the ELAA proposal (absent the institutional tariff setting contained in Regulation 4056/86) and asked how it would make
11
firm-specific information more transparent and how this would have led to tacit collusion. The conditions for collusion are stringent and cumulative. Failure to meet one of the conditions means that collusion should not be assumed. Neither should it have been assumed that because the industry had all the collusive toys in the (distant) past to play with, that this carries into the future and necessarily colours any assessment of the benefits and costs of the ELAA Proposal. The GI Study errs in failing to look at the proposal in the light of the underlying competitive situation found in the marketplace and therefore cannot be a basis for rejecting the industry’s proposal which the GI Study acknowledges has potential efficiency benefits.

1
Revised ELAA Proposal
16 June 2006
Annex 3: The Revised ELAA Proposal – Comparison with the Current Systems
Information Exchange
1. As the ELAA has previously explained, conferences today exchange information, within the boundaries of precedent case law, including the Revised TACA exemption decision, where the parties made a declaration on information exchange.
2. Below, we have used the IPBCC conference as and the TACA conference as examples but please note that different information is exchanged depending on the conference. However, the fact on all other trades to and from Europe is that most reliable volume data derive from conferences.
3. In respect of the US, please note that carriers do not only have access to the Piers data, but also to data derived from (a) conferences and (b) discussion agreements, where such exists.
4. For the reasons above, we find the most useful means of providing the information requested is to split it between Piers/TACA, the Europe-India Conference and the ELAA Proposal.
Data Detail Piers1/TACA IPBCC ELAA Revised
Proposal
1 This information is based on input from the TACA Secretariat. There is more information available, and if requested,
the ELAA commits to further investigate.
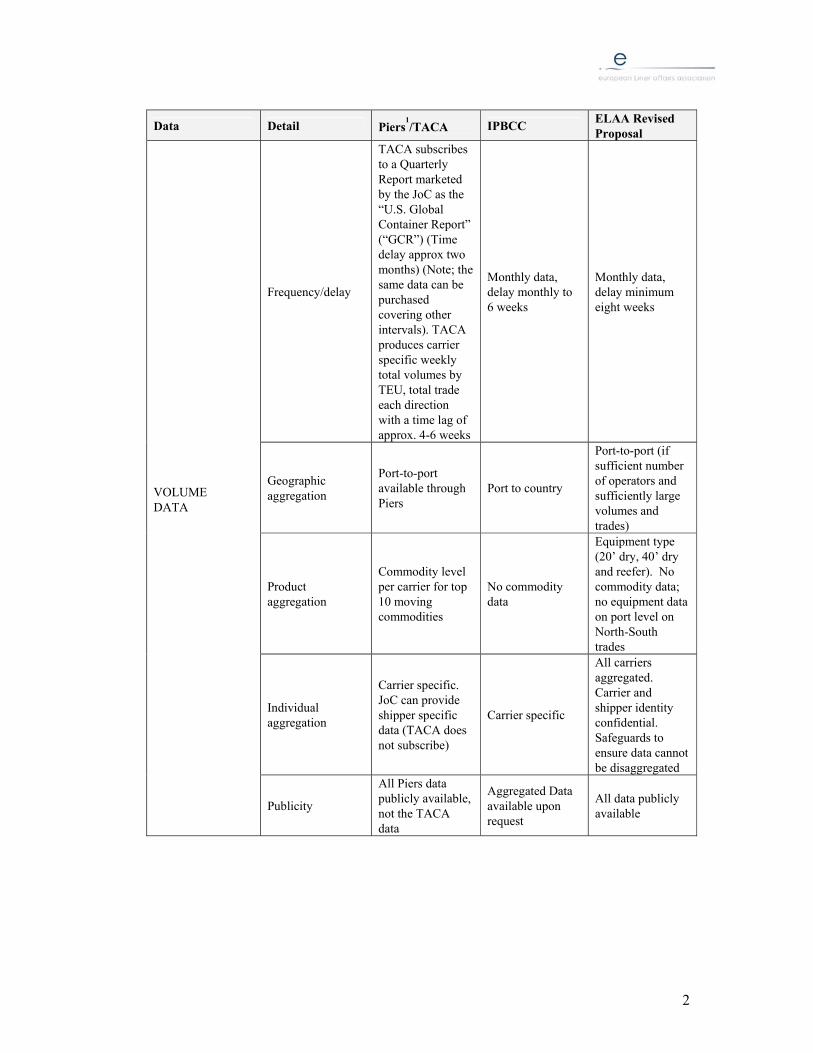
2
Data Detail Piers1/TACA IPBCC ELAA Revised
Proposal
Frequency/delay
TACA subscribes to a Quarterly Report marketed by the JoC as the “U.S. Global Container Report” (“GCR”) (Time delay approx two months) (Note; the same data can be purchased covering other intervals). TACA produces carrier specific weekly total volumes by TEU, total trade each direction with a time lag of approx. 4-6 weeks
Monthly data, delay monthly to 6 weeks
Monthly data, delay minimum eight weeks
Geographic aggregation
Port-to-port available through Piers
Port to country
Port-to-port (if sufficient number of operators and sufficiently large volumes and trades)
Product aggregation
Commodity level per carrier for top 10 moving commodities
No commodity data
Equipment type (20’ dry, 40’ dry and reefer). No commodity data; no equipment data on port level on North-South trades
Individual aggregation
Carrier specific. JoC can provide shipper specific data (TACA does not subscribe)
Carrier specific
All carriers aggregated. Carrier and shipper identity confidential. Safeguards to ensure data cannot be disaggregated
VOLUME DATA
Publicity
All Piers data publicly available, not the TACA data
Aggregated Data available upon request
All data publicly available

3
Data Detail Piers1/TACA IPBCC ELAA Revised
Proposal
Frequency/delay
TACA discusses supply developments in meetings approximately every 8-12 weeks using publicly available information
18-months forecast split by quarter, plus historic information
18-months forecast split by quarter, plus historic information
Geographic aggregation By trade direction By trade direction By trade direction
Individual aggregation
TACA discussions cover reports in the public domain, such as Dynamar, which generally publishes individualised data
Carrier specific
All carriers aggregated. Carrier and shipper identity confidential. Safeguards to ensure data cannot be disaggregated
SUPPLY DATA
Publicity Data generally not publicly available
Data generally not publicly available
All data publicly available
Frequency/delay
TACA agrees on tariff GRIs as and when needed, although generally it has been on a quarterly basis
IPBCC agrees on tariff GRIs as and when needed, although generally it has been on a quarterly basis
Not applicable
Geographic aggregation By trade direction By zone/country Not applicable
Individual aggregation
No individual rates exchanged or discussed
No individual rates exchanged or discussed
Not applicable
RATE DATA
Publicity Data generally not publicly available
Data generally not publicly available Not applicable
Frequency/delay Quarterly Monthly 6-8 weeks in arrears
Quarterly with 3 month delay
Geographic aggregation By trade direction By zone /trade
direction By trade direction
Product aggregation None None One simple index
per trade
Individual aggregation
See above, rate data See above
All carriers aggregated. Carrier and shipper identity confidential. Safeguards to ensure data cannot be disaggregated
PRICE INDEX
Publicity See above, rate data Not publicised All data publicly
available
4
5. The ELAA would like to stress the following from the table above.
• Piers data is individualised. The Piers information is solely about volumes of cargo moving into and out of the USA by origin or destination – and identifies shippers, commodity, etc. All the ELAA is asking for is information on an aggregated port-by-port basis, which is far less than in the US. The ELAA Proposal may contain aspects not published in Piers, but it never goes into such detail as to reveal figures and strategies of individual lines.
• Second, the fact that data that is only available to conference members today become public will benefit all industry stakeholders. Today, conference/discussion agreement members on US trades have access to a combination of conference data and Piers data. The level of detail of this combined factor in this respect is far higher than for the ELAA proposal.
Consultations with shippers
6. Most regular discussions are taking place in Japan, but there are examples also from Europe. For instance:
• The European Coffee Federation has bi-annual meetings with the Conferences involved in Coffee shipping (ESPM/FEFC/EWATA);
• There are regular bi-annual meetings with the Cocoa Boards, West Africa, and importers in Europe;
• There are meetings in South Africa between the South Africa Fruit Exporters’ Association and carriers;
• The FEFC is in regular correspondence with the European Rubber Federation about imports into Europe.
7. In Australia, under Part X of trade Practices Act 1974, there are designated peak shipper bodies (PSBs) and designated secondary shipper bodies declared to be treated as peak shipper bodies for negotiation purposes. The Minister declares DSBs according to criteria set out in Regulations established under Part X.
8. The PSBs are the Australian Peak Shippers Association in respect of exports and the Importers Association of Australia in respect of imports. The Declared PSBs are the Australian Meat Industry Council in respect of meat to North America only and the Australian Horticultural Exporters’ Association for exports to most destinations. There are also secondary designated shipper bodies which provides an exemption for their individual members to collectively negotiate with the Lines. Examples would be the Wool Commodity Group, the Cotton Exporters Association, Federal Chamber of Automotive Industries, etc.
9. The essential difference is that parties to Agreements registered under part X must give PSBs 30 day’s notice of changes to negotiable shipping arrangements and when reasonably requested, negotiate with them including providing information reasonably necessary for those negotiations. Secondary shipper bodies are usually approached by the same parties (i.e. liner carriers) to negotiate an overall arrangement. In other words carriers could refuse to negotiate with these secondary shipper bodies without ramification if they wanted to.
10. The above examples are just a few of the meetings the ELAA has been informed of. Most likely, the list is much longer.
1
Revised ELAA Proposal
16 June 2006
Annex 4: The Importance of International Comity to the Liner Shipping Industry
1. There are significant differences between the Commission’s stated policy goal of abolition of Regulation 4056/86 and what the regulatory regimes of EU’s major trading partners allow. In fact, many of these seem to be on a different path from the EU. In particular:
• Japan is continuing to support the conference system and carrier consultation in general;
• The US has secured consultation through the Ocean Shipping Reform Act (“OSRA”) and very detailed statistics through the Journal of Commerce (JoC);
• Singapore has recently announced its intention to introduce a block exemption for conferences and other liner agreements1; and
• India is currently contemplating a system of significant transparency of data, even individualised, and will most likely accept liner conferences.
• The only jurisdiction that appears to pursue the Commission’s route of abolishing conferences is Australia, although their review process is not yet at the same advanced stage as the EU’s.
2. As the repeal of Regulation 4056/86 has been adopted as Commission policy, it is for the EU regulator to work out how best to avoid problems arising from divergent regimes. The Commission has pointed out that the abolition of conferences would not create a conflict of laws, as no antitrust regime currently requires carriers to be members of conferences. While this is correct, it is by far not the only unfortunate situation that could arise as a result of divergent antitrust regimes. One has to distinguish between three principle problems:
• A conflict of laws. This would be the case if, for example, data required to make public under US law would be deemed illegal to make public under EC law. This situation makes it impossible for the operating carrier to provide the service without being in breach of the laws in at least one jurisdiction. Such a situation must be avoided by all means, and if it happens must be resolved through, for example, a bilateral agreement between the countries or a special exemption in one country.
• A “mismatch” of laws. This situation occurs when two jurisdictions have chosen different ways of for example ensuring a balance between competition and reliable liner shipping services, and the regulations together become either to strict on one party, or inefficient taking the two jurisdictions’ obligations and conditions together. An example of such a situation could be if one country allows for discussion agreements but prohibits conferences, and the other does the opposite. Both jurisdictions have acknowledged the value of carrier discussions and cooperation in order to ensure stable supply of liner shipping services, but the two
1 See Media Release of the Competition Commission Singapore, Competition Commission Consults on
Proposed Block Exemption Order (BEO) for Liner Shipping Agreements in the Maritime Industry, 6 April 2006, and Proposed Competition Act Order of the same date.

2
different approaches render commercial cooperation impossible. This situation is also most unfortunate.
• Most restrictive regulation takes precedent. This is the most common situation. If the laws of one jurisdiction are stricter than those of the other, carriers need to comply with the stricter jurisdiction. This could relate to the level of detail of information exchange, the rules for capacity regulation, etc.
3. Currently, all major trading jurisdictions accept conferences, and most accept discussion agreements. Post-abolition of Regulation 4056/86, the EU regulation would stand out and although the change does not appear to result in any conflict of laws, the other two unfortunate situations may occur. The ELAA believes that this Revised Proposal, if accepted by the Commission and adopted on principle in the forthcoming Guidelines, would not only serve to balance the needs for a competitive market and the stability of supply and reliable services. It could also build a bridge between the EU and other jurisdictions so as to ensure a broad consensus towards a coherent approach of the application of competition laws to the maritime sector.

Forum
(Discussion)
External Consultant (prepares
forecast report)
Annex 5:
System of effective industry-wide consultation
Overview of a trade forum
Aggregated carrier data on volume, capacity as
well as price index
Freight
Forwarders
Governmentsand other
Regulators
Ports
Other Trade Associations
Shippers
Liner Shipping
Association
Carriers (aggregates individual
data)
Meeting minutes including
comments on report forecasts
Independent Data Service (aggregates carrier data)
Industry Forecast Report
1
Revised ELAA Proposal
16 June 2006
Annex 6: The Revised ELAA Proposal – Industry-Wide Consultation
1. The Revised ELAA Proposal is set up as an integrated system of industry-wide data exchange and consultation, organized around major regional trading areas and by direction (e.g. Africa, Asia, North and South America, Oceania).
2. Divided into distinct steps, the Revised ELAA Proposal would amount to the following:
1. Step 1 – Carrier Submission to the Independent Data Service (IDS)
Volume Data
3. Figures inputted: The ELAA foresees structuring the submission of data to the IDS in the following way: individual carriers submit a monthly summary of volumes (TEU loadings) per port pair and equipment type to the Independent Data Service (IDS). The “monthly summary of volume” is an aggregation of volumes on a bill of lading port/port basis that were carried by a line during the previous calendar month for all cargo by 20’ dry, 40’ dry and reefer containers by direction and port-pair. In other words, for each port-pair and trade direction for a month there will be three figures. An example of how the information could be provided to the IDS is contained in Table 3. This information would normally be obtained from the summary of key components of the bills of lading contained in the carrier’s central financial database and submitted electronically to the IDS.
4. Timing of input: The data will be inputted to the IDS from individual carriers’ financial databases once a month and will cover all completed shipments for a calendar month. However, given the pre-shipment logistics, the length of the voyage and the time required to complete the voyage accounts, the data will naturally be delayed by at least seven weeks before it is even received by the IDS. An example of a submission to the IDS from the date of contract is described below:
• A freight forwarder contacts a carrier on 1 November 2006 and agrees on a price for a shipment of chemicals from the Ruhr area in Germany to West Africa, with Antwerp – Lagos as the ocean leg of the shipment. The time required to receive the container, load it, transport it to the port and load it onto the vessel (even if the port in question does not apply a so-called ‘24-hour rule’ whereby goods can not be loaded during the first 24 hours in the port) will be at least seven days, and often more;
• The vessel sails on 8 November and just manages to arrive in Lagos before the closing of the month. Had it arrived on 1 December, the data would have been delayed by another month;
• The carrier processes the voyage accounts for November during the month of December. By the end of the month, the accounts on the financial database are completed and data is transmitted to the IDS.
5. Although for most trades the delay will be one to two weeks longer as a result of the lengthier voyages. The further delay for all trades caused by the processing of the IDS is described below under Step 2 and in Table 3.
6. The Revised Proposal results in carriers aggregating data to the largest extent possible before submitting to the IDS, so that in effect the only thing the IDS does is aggregate the selected data from all carriers and apply the safety mechanisms against disaggregation (see below at Step 2).

2
Carrier volume data is of course collected in different ways by different carriers, but will always include a breakdown per customer, commodity, weight and special equipment (such as flat racks), etc. This information will not go into the IDS, but only the selected information covered by the ELAA Proposal, aggregated at carrier level. The aggregation of the data at carrier level before the submission to the IDS is a response to DG Comp’s previously expressed concern about providing data directly from the bills of lading to the IDS. Despite the additional aggregation, the ELAA is confident that there will be a high level of accuracy in the data provided. The reasons for this are the following:
• First, carriers wishing to attain an efficient system for the provision of data (including all ELAA Members and most likely all other carriers) do not have the incentive to submit inaccurate information. As explained in the ELAA response to the July 2005 AdCom paper1, the carriers have every incentive to provide accurate data to the IDS, as there will be set standards as to what to submit, and no risk of data leakage to competitors. If carriers distort the data by submitting inaccurate information, this would make the inaccuracy of the forecast obvious, and the system would break down. This is not in the interest of any party. Moreover, if the hypothetical data manipulator succeeded, the likely result would be supply/demand imbalances over trades, with loss making as a result in oversupplied trades and unhappy customers requiring an effective global network on the undersupplied trades. It is therefore in the individual interest of every carrier to submit accurate data and compete on the basis of accurate information;
• Secondly, experience shows that if carriers only get output if they give accurate input, they usually comply. Therefore, we do not foresee penalties for submission of inaccurate data;
• Thirdly, as information is submitted to the IDS from computer databases, it is very difficult to input deliberately inaccurate data, as software specifically designed for this purpose is provided to Member Carriers, so that aggregated data is submitted straight from the carriers’ databases. That means that carriers would need to manipulate their own core data in order to manipulate the submission to the IDS;
• Fourthly, the IDS will track inaccuracies in individual submissions and has the right to ask for individual resubmission if necessary; and
• Fifthly, when the aggregated information is passed to the Liner Shipping Association and others, then comparisons can be made with previous monthly outputs. Subscribers and in particular the liner consultation meetings as well as the forums are encouraged to report serious discrepancies, and the Liner Shipping Association could then refer back to the IDS who would ask all members in the relevant trade to resubmit, pointing out the areas where the Liner Shipping Association thinks that there has been incorrect input. Carriers would also have the ability to correct previous inputs if they found there were mistakes.
Capacity Data
7. Carriers would enter in a separate spreadsheet their current and forecast capacity per trade and submit to the IDS. The forecast input will only be made quarterly, for quarterly periods over the next 18 months. This data is derived by each carrier on the basis of which vessels are going to be deployed by that carrier on a trade. The capacity figure would come from the nominal quarterly capacity of the vessels to be deployed. Carriers plan the capacity to be put on a trade 12 to 18 months in advance. Each carrier’s capacity for each trade is defined by determining the vessels to be deployed in that trade: the nominal capacity of those vessels and the portion of that nominal capacity that is allocated to each trade. For instance, a new 8,000 TEU vessel may be deployed in the Europe-Asia trade but the carrier may decide that 1,000 TEU will be used for the Europe-Australia trade. The nominal capacity of the vessel will be modified to take into account trade characteristics. For instance, for Asia-Europe it can be claimed that a vessel could be used to
1 ELAA Response to DG Comp Discussion Paper of 27 July 2005, at 9.3.
3
maximum capacity but for Europe-Asia to only 80 percent capacity, as this is a weight-trade, i.e. the goods transported in this direction are generally heavier cargo such as chemicals. On a quarterly basis carriers would be expected to update their supply forecast in the light of new expectations on demand on particular trade routes. A carrier may decide to put additional capacity on a trade due to strong output. Alternatively, a carrier might consider that for instance the Europe-Australia trade is more profitable than Europe-Asia and that a greater proportion of the vessel should be allocated to the Europe-Australia trade. Carriers also have to plan regular dry dockings of vessels (usually every 2 years) and this has to be planned well in advance and is included in the forecast of supply.
8. The ELAA would like to stress that the envisaged supply forecast and data from the past will only be provided in terms of slots to be provided / that were provided on a trade direction and not by port-pair. The carrier submission of planned future trade capacity to be further aggregated by the Independent Data Service was not specified in the Original ELAA Proposal. There is an increasing demand for accurate information. The ELAA believes that the exchange of such data on capacity allocation as foreseen in the Revised ELAA Proposal is fully justified. As is generally accepted, container tonnage is expensive to build and to ensure that the correct amount of space is put on a trade, one needs to look at both supply and likely demand. Otherwise valuable assets in terms of container space might go underused in one trade when they are needed in another, or even worse, there may be undersupply generally or in a particular trade. This goes to the very purpose of the ELAA Proposal, i.e. to ensure the continued stability of supply. DG Comp has in previous position papers accepted that supply data is necessary, in particular in order to enable better informed investment decisions: “It can be accepted that there is a direct causal link between the proposal and the alleged efficiencies with regards to quality of the information exchanged on capacity and commodity forecasting. As explained by the ELAA and confirmed by information providers, despite the extensive exchange of information carried out in conferences there is scope for improvement on the quality of information presently available to carriers. The proposed way in which information would be exchanged would most likely result in better and more precise information”.2 The Revised ELAA Proposal presents the best method available to ensure that a reliable supply forecast would become available to all industry stakeholders, while ensuring that data cannot be disaggregated. The ELAA finds it hard to understand why DG Comp has recently mooted a second best method (i.e. the collection of data from the past, to be combined with the often inaccurate data provider compilations of individual carrier announcements). The issue is too important for world trade to prevent the aggregation of the most accurate data.
9. In addition, we note there is already much information in the public domain of individual lines’ plans for vessel building, and vessel purchase. As the ELAA has previously explained, consultants already use this information to reach and publish their own supply projections for trades as it is recognized that this information is vital to the global shipping community.3 However, experience shows that mistakes are made and even small errors can cause confusion and uncertainty. Therefore, it is essential that the carriers provide the figures for the forecast themselves to ensure it will be done based on accurate figures.
10. The ELAA notes that the Commission has previously allowed for similar supply forecast schemes. In the revised and cleared Cartonboard agreement, the exchange of information included consumption forecast figures per country for the current year based on “educated guesses” from several members.4
11. In the European Wastepaper Information System notice, the information exchange covered bi-annual information regarding expected capacity usage and consumption trends and “such other information as may be considered relevant for the purposes of [the trade association’s]
2 Discussion Paper on the Review of Regulation 4056/86 for the ad hoc Advisory Committee Meeting, 13 July 2005, at
272. 3 ELAA Article 81 EC Assessment, e.g. at 564. 4 Commission Notice pursuant to Article 19(3) of Council Regulation 17/62 Cartonboard [1996] OJ C 310/3, at 12.

4
objectives”. In respect of price trends, the information would only be passed on to the membership in the form of aggregated averages. The trade association would also advise on the building up and maintenance of minimum stocks by members, as well as non-binding recommendations to the members from the Advisory Board or the Managing Director.5
12. Most trade associations engage in information exchange in some form. The extent to which other industries today engage in activities similar to the ELAA Proposal is difficult to measure for the ELAA, as statistics sites generally require a membership login. However, during the course of negotiations, the ELAA has provided numerous examples to DG Comp that provide a fair view of the various forms of information exchange engaged in by other industries – often more far-reaching than those envisaged in the Revised ELAA Proposal. On 28 February, the ELAA submitted a list of document regarding information exchange and forecasting in other industries retrieved through a simple web search. As the absolute scope of the information exchange was impossible to identify due to the log-in requirements, the example below from the steel industry is therefore merely an indicative sample and incomplete. The ELAA also provided information from the cruise ship markets, the chemical industry, commodity markets, the food industry and the pulp and paper industry, but this is of course by no means a complete listing of the wide and diverse span of trade associations active in the EU. DG Comp would be in a better position to survey the current level of information exchange in trade associations in other industries.
13. Example from the Steel industry: Two associations, International Steel Trade Association (ISTA) and Eurometal, organise the collection and dissemination of information relevant to their members. ISTA publishes a regularly updated set of Standard Terms and Conditions of Sale for use by its members. Eurometal commits to make available all needed information to the member associations on a regular basis or on request.
14. Information available on up-to-date website, quarterly newsletter and press releases. Although their database appear to be inferior to the one envisaged by the ELAA (plus collection of data mainly through direct contacts with producers and customers, no safety mechanisms, etc), their activities go far beyond the scope of the Revised ELAA Proposal as they link supply and demand forecasting with pricing, and include price and capacity recommendations:
• Market coverage: ISTA has 80 members. According to a market survey of planned capacity expansions conducted by Eurometal, the market coverage was 91%, i.e. similar to the ELAA market coverage;
• Supply forecast: Planned crude steel expansions from 2004 to 2010, covering 91% of the market, alerting build up of overcapacity as well as short-term forecasts;
• Demand forecast: Growth figures and forecast up to 2025 as well as short-term forecasts;
• Pricing data: Analysis of prices by the Steel Business Briefing (which is linked to ISTA through their website). Prices are split by flat, long, semi-finished products, scrap, stainless and raw materials and split by region. The information provided on a monthly basis). Eurometal produces price graphs as well;
• Producer consultation and industry forums: ISTA, through its executive committee of traders, “aims to enable the steel trading industry to have a collective voice which is recognised and respected”. Eurometal Steel Net Forum is “a privileged meeting point for steel customers, producers and distributors, giving outstanding presentations, views and positions about trends, developments and strategies of all steel market stakeholders”;
• Market comments on the evolution of supply, demand and pricing: Extracts, May 2005: Discussion on the expectation of stock reduction; September 2005: “Market Situation: cuts-back in Europe and North America denoted positive effects towards a better
5 Commission Notice pursuant to Article 19(3) of Council Regulation 17/62 European Wastepaper Information Service
[1987] OJ C 399/7, at 5 and 9.

5
balance in supply-demand”; “feeling that prices will now be set to steady and might be again upward oriented and, in fact, prices raised of Euro 20-30/t are announced by major mills”; “Sellers finally understand that lowering prices will not produce any new business or order”; “Eurometal anticipates scrap prices may decrease again in the fourth quarter”; November 2005: Price variation over “last weeks”; November 2005: “Eurometal strongly recommends its members to stay cautions on inventory levels for the rest of the year and to avoid speculative over-buying”; Meeting of the European Service Center Industry (22 November 2005): (…) “Exchange views about actual Market Situation and Outlook”; “the outlook for the Steel demand over the period 2006 to 2008 is expected to be modest with projected annual growth increases of 2% to 3% per year in the construction industry. (…) most European mills are now fully booked to the year end and beyond despite the August and September price increases. Concern was expressed by some structural steel stockists that producers have not yet fully implemented recently announced Q4 price increases of around EUR 30/t”; March 2005, Working Program: “Steel futures - Increasing price volatility requires market instruments to hedge price and volume risks.”
15. There are no indications that this example from the steel industry is particularly far-reaching or beyond what trade associations in other industries engage in. Yet, we note that this indeed goes far beyond the scope of information exchange envisaged in the Revised ELAA Proposal, in particular as the information exchange system envisaged by the ELAA would prohibit any pricing information exchange and forecasting (and be limited to an aggregated sufficiently aged index), and contain no recommendations for future market conduct. Moreover, the ELAA Proposal introduces detailed and sophisticated safety mechanisms which go far beyond what has been required by precedent case law.
Currency Cost Information
16. The carriers would input, at yearend, the percentage of currencies used for their costs per trade. Example: Carrier X’s would, as soon as the annual figures are available, submit to the IDS the percentage of costs attributable to the Euro, the Great Britain Pound, the Yen, the US Dollar, the Australian Dollar, etc, for each trade. This figure would be updated once a year.
2. Step 2 – IDS Processing of Data
Output and Standard
17. Based on the carrier input, the IDS will produce two kind of reports:
• A monthly report of aggregated volume and utilisation figures with at least 8 weeks’ delay and a price index (see below at Step 5) covering a quarter with at least 3 months’ delay;
• A quarterly report on aggregated estimated supply figures per trade over the forthcoming 18 months split by quarter. The IDS will not produce a demand forecast; and
• A yearly report on aggregated percentage of cost attributable per currency, per trade or region and per TEU transported. The IDS would aggregate these figures and give them weighting according to the volumes of each carrier on the trade or region in the same time period. The IDS would then produce a “currency basket” which would show the average percentage of each currency attributable for the cost per TEU of the services in the trade or region in question. We refer to Table 2 below, as well as Step 7, where the methodology of currency cost information is further described.
18. The IDS – envisaged as a fully independent group of data analysts – would be a separate undertaking contracted by the Liner Shipping Association, which will provide the appropriate software and maintain the database. The ELAA will encourage the Member use of such software to ensure the highest level of accuracy of the aggregated information withdrawn from the individual carriers’ financial databases.

6
19. The IDS would aggregate the data according to a coherent standard, based on information available in the public domain. ‘Coherent standard’ means that each line would submit information using a template to ensure consistency, i.e. the ‘coherent standard’ will be applied already at the carrier input level. The ‘coherent standard’ will be ensured through template rules for input, to regulate issues such as:
• Bill of lading as basis for Origin and Destination ports;
• Time classification of containers (data input cut-off point rules for containers under transportation, etc); and
• Submission of actual supply (taking into account weight-restrictions, lost slots, etc, and not merely stating the theoretical capacity of vessels).
20. As pointed out by Dynamar in their response to the Commission, there is currently no such ‘coherent standard’ applied worldwide.6
Safety mechanism
21. The IDS would produce a monthly report for each trade, showing TEU volume and capacity split by 20’ dry, 40’ dry and reefer containers per trade and origin-destination port pair or a range of ports in the same geographic area and a price index per trade leg split by dry and reefer. In terms of methodology of aggregation, supply data will be provided only by trade direction and volume data by trade and port, unless an additional safety mechanism to prevent disaggregation of data as outlined below at para 24 is triggered. In that case, data will be further aggregated by the IDS, by clustering a number of ports in the same geographic area on either or both sides of the trade into a range of ports, such as for example one country or shared hinterland. The ELAA will provide an indicative list illustrating how ports will be clustered if any of the safety mechanisms are triggered.
22. Splitting data by 20’ and 40’ containers would enable carriers to identify most of their equipment needs without the knowledge of certain commodity volumes and at the same time ensure a high level of aggregation. For reefer containers, 20 foot containers are scarce and on their way out of the market. As a response to DG Comp concerns that a split between 20’ and 40’ reefer containers could help identifying figures of individual carriers or customers, all reefer containers will be aggregated. It is important for carriers to have the split between the main container types in order to ensure that the right number of containers will be available, as certain commodities require a certain container type. Every trade has equipment imbalances of some type, and most trades globally are highly imbalanced in reefer equipment, due to the imbalances (hardly any reefer goods are southbound) and seasonality (for fruits, etc) of cargo. There are dry equipment imbalances as well. For example, Asia-Europe is heavily dependent on 40’ containers, whereas Europe-Asia has a much higher proportion of 20’ cargo, as this is a trade relying on heavyweight goods such as chemicals. This means that carriers are constantly positioning empty 40’ containers to Asia and empty 20’ containers to Europe.7 A better understanding of actual demand and the origin port of that demand will allow carriers to encourage equipment substitution or modify cargo marketing plans to mitigate the cost of moving empty containers. In order to ensure sufficient aggregation, data will not be split into such detail as flat racks, etc, which would indeed have been useful information. DG Comp has expressed concern that port-specific equipment information on thin trades could make it possible to identify customer-specific information. As a response to this, equipment-specific information on North-South trades would only be made available on a total trade (per direction) basis. Only on the large European trades, i.e. the Transatlantic and the Europe-Asia trades, will port-specific equipment information be made available (provided that the other safety mechanism requirements are met).
6 Dynamar response to Commission White Paper, at p 3. 7 See also Global Insight, ISL and TU Berlin, The Application of Competition Rules to Liner Shipping, Final Report to
DG Comp, 26 October 2005, at 259.
7
23. The IDS would not collect commodity data. Industries like, for example, cotton and rubber know the volumes they have shipped and projected volumes. Carriers would respond to shippers’ presentations on commodities and the forum discussions are envisaged to provide customers with specific demands with a good idea of how supply and demand will match in the future.
24. The IDS must ensure that the data cannot be disaggregated. Each data point from the IDS will only be provided if the following data aggregation safety mechanisms are fulfilled:
• There are at least four independent operators8 serving the segment which the data point in question relates to. Example: One of four independent operators serving between Antwerp and Lagos withdraws from the route. The IDS will stop providing specific data on this port pair, and instead provide data aggregated for Antwerp – West Africa, where there are plenty of independent operators;
• The three largest independent operators’ combined share of the segment the data point relates to does not exceed 80 percent;
• In addition, the data will only cover specific ports if the port for the preceding year had total TEU liftings of at least 500,000 and is not considered a pure transhipment / relay port (defined as a port with at least 85 percent transhipment).9 Ports with lower volumes will be further aggregated by clustering a number of ports in the same geographic area into a range of ports, such as for example one country or shared hinterland until the aggregate TEU liftings reach the appropriate level.
25. The ELAA refers to the Commission approval of the UK Tractor10 information exchange, where the Commission accepted a rule of minimum three suppliers. With a minimum of four suppliers and the additional safety mechanism ensuring a sufficient dispersion of shares between carriers, a minimum liftings per port and provision of port pair figures broken down by equipment only on the largest trades, the ELAA proposes a safeguard mechanism that goes far beyond Commission practice in UK Tractor, and ensures that data in practice can never be disaggregated.
26. During the consultation process, DG Comp has raised concerns in particular for thin trades. The ELAA maintains that the safety mechanisms apply to thin trades as well, but has responded to DG Comp’s concerns in the following ways.
• As described above at 22, equipment-specific information on North-South trades would only be made available on a total trade (per direction) basis; and
• On very thin trades (defined as trades with a total annual volume below 150,000 TEUs in both trade directions), data will not be provided at all or be grouped with a neighbouring trade so that data cannot be disaggregated. The same applies on other trades if data aggregated up to trade level still trigger one of the safety mechanisms.
27. The ELAA submits that, in particular with these extra safety mechanisms for thin trades in place, the exchange of data on thinner trades would not pose a problem and a collusive agreement would not be easy to sustain.
8 For the purpose of applying the safety mechanisms only, a carrier participating (in the trade in question) in a
cooperation agreement such as a consortium allowing for information exchange of volumes and capacity would not be considered an “independent operator”. In other words, for those trades where such a cooperation agreement exists, the parties to the cooperation agreement will on the trade in question be viewed as one carrier for the purposes of the application of the safety mechanisms. For that reason, each participating carrier must notify the IDS of all cooperation agreements it has entered into with other carriers that allow for information exchange of volumes and capacity. This is without prejudice to the position that the ELAA strongly maintains that there is significant internal competition between consortium members, and that the internal competition will increase even further with the repeal of Regulation 4056/86.
9 Transhipment / relay defined as per Case COMP/JV.55 Hutchison/RCPM/ECT, para 26. 10 UK Agricultural Tractor Information Exchange System; see Commission Competition Report 1999, at p 157.
8
• First, when it comes to current supply and supply in the past, the data tells nothing new to the carriers. The number of current calls is public information which competing carriers of course will be fully aware of;
• Secondly, when it comes to utilisation, the large carriers will – before they receive the data from the IDS – know that they have lost volumes, and how much. The only added information from the IDS is the total volume (as there will be no supply data per port pair, utilisation data will only be available on a trade basis; on a port pair basis, the carrier would only be able to calculate his own market share), but neither the reason why one or several carriers are gaining market share or who the carrier or carriers are will be identified. If the reason for the market movement is a low-pricing campaign, the carriers will most likely be informed of this by customers before there is any indication in the IDS data;
• Thirdly, supply forecast data will only be provided on a trade basis, where of course the number of players active in the market is generally high. For longer-term capacity planning, it is not possible to tell whether the increase in the trade is planned by one of the active carriers or a new entrant;
• Fourthly, a collusive agreement is never easy to sustain in liner shipping due to the inevitable demand fluctuations and the high fixed costs;
• Fifthly, there is no retaliatory mechanism available against a short-term low-pricing campaign, and definitely not at the time the IDS data is published; capacity increases in the short-term are known publicly, and to the extent it is unknown in the longer-term, the IDS will provide no information as to who the new entrant can be of all the liner carriers in the world.
28. This is corroborated by the fact that, as explained elsewhere in this submission (see main submission and in Annex 2:
• Concentration levels are sufficiently low to avoid disaggregation;
• The existence of relay carriers and indirect services make the number of customer options much higher than the limited number of carriers offering direct scheduled services on the trade. Any carrier issuing a bill of lading should be considered an equal competitor in the trade. This is best explained with the illustration of the Europe-West Africa trade. Although only a limited number of carriers serve the trade directly (e.g. Maersk/Safmarine, MOL, MSC and Grimaldi), other carriers such as Nile Dutch serve West Africa on route to South Africa, while others such as CSAV serve West Africa on route to South America; and
• With the abolition of Regulation 4056, the link between consortia and conferences will be gone, and the Commission has every reason to re-assess the stance taken in case law that consortia for competition law purposes are seen as one unit. Even today, consortium members compete internally and gain market shares from each other. Moreover, as services are often indirect, a carrier is often a member of different consortia on different legs of the voyage, which makes the grouping of consortium members together even more far-fetched. The ELAA recognises that the Consortia Block Exemption allows for some more integrated cooperation, such as temporary capacity management. However, in reality, there is a wide range of consortia, and the levels of cooperation differ significantly. In accordance with the Commission Guidelines on Article 81(3), the burden is on the Commission to, in the specific case and on the basis of proper market analysis, show that a cooperation agreement (that does not have the object to restrict competition, such as consortia) restricts competition to an appreciable extent.11 The Commission has not done so in the past, probably primarily due to the links between conferences and consortia. In a
11 Commission Notice, Guidelines on the application of Article 81(3) of the Treaty, [2004] OJ C 101/97, at 24.

9
post-conference world, there is absolutely no justification for generally stating that a liner shipping consortium should be seen as one undertaking in competition law terms should be viewed as one undertaking.
29. All data provided to carriers will simultaneously be made publicly available. An example of the information provided back to the carriers, to the forum discussion and to data subscribers is provided in Tables 1, 2 and 3 below.
IDS Functioning
30. The IDS will be a small entity, and as requested in the GI Report, “an institution with the highest possible level of independence”.12 Its only role will be to aggregate the data in a database, to double-check data which appears to be incorrect (both automatically and manually), to apply the safety mechanisms to ensure sufficient aggregation, etc. The IDS would be contracted by the Liner Shipping Association. Whatever the form of the IDS will be, the contract with the IDS will ensure that:
• All personnel involved are independent from the Liner Shipping Association, the carriers, and any other industry stakeholder;
• All personnel of the IDS will sign a confidentiality agreement that provides that individual confidential carrier data will not be shared with anyone outside the IDS;
• All IDS personnel will undergo regular antitrust compliance education; and
• The number of carriers active in a regional trading area should be sufficient to keep the data anonymous.
31. The Liner Shipping Association will possess the intellectual property rights to the data and the report, but the data will be distributed directly by the IDS. Members will receive data free of charge only on those trades where it has inputted data. At the same time, non-members attending the forum discussions will receive all the IDS data they request without remuneration, in order to ensure a fruitful discussion. If any entity, a government, organization or undertaking not participating in the forums wanted more detail then what is published by the Liner Shipping Association, that data would be provided to them on fair, reasonable and non-discriminatory terms (from a pick-and-choose menu). The policy would be to provide all information requested to anyone who requests it.
12 Global Insight, ISL and TU Berlin, The Application of Competition Rules to Liner Shipping, Final Report to DG
Comp, 26 October 2005, at 72.
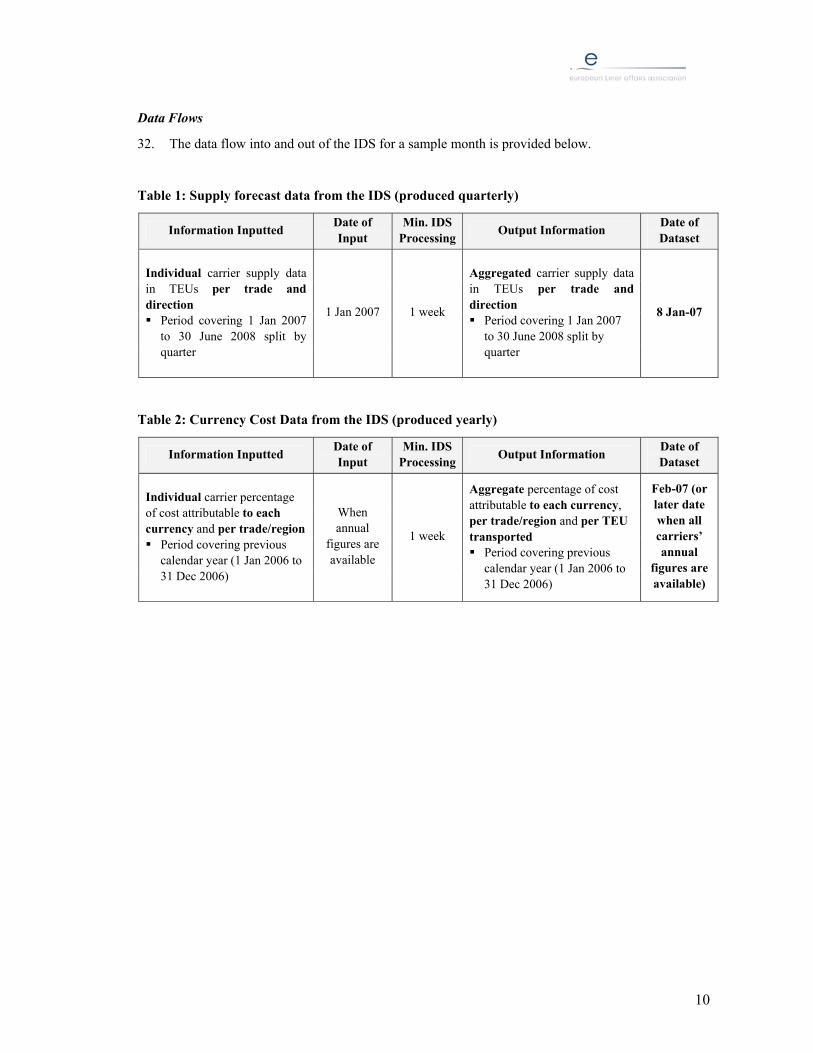
10
Data Flows
32. The data flow into and out of the IDS for a sample month is provided below.
Table 1: Supply forecast data from the IDS (produced quarterly)
Information Inputted Date of Input
Min. IDS Processing Output Information Date of
Dataset
Individual carrier supply data in TEUs per trade and direction Period covering 1 Jan 2007
to 30 June 2008 split by quarter
1 Jan 2007 1 week
Aggregated carrier supply data in TEUs per trade and direction Period covering 1 Jan 2007
to 30 June 2008 split by quarter
8 Jan-07
Table 2: Currency Cost Data from the IDS (produced yearly)
Information Inputted Date of Input
Min. IDS Processing Output Information Date of
Dataset
Individual carrier percentage of cost attributable to each currency and per trade/region Period covering previous
calendar year (1 Jan 2006 to 31 Dec 2006)
When annual
figures are available
1 week
Aggregate percentage of cost attributable to each currency, per trade/region and per TEU transported Period covering previous
calendar year (1 Jan 2006 to 31 Dec 2006)
Feb-07 (or later date when all carriers’ annual
figures are available)

11
Table 3: Actual data of the past from the IDS (produced monthly)
Trade Latest Date of Contract
Min. Pre-shipment Period
Min. Voyage Period
Min. Post-shipment Period
Information Inputted Min. IDS Processing
Voyage Completion Period
Output Information
Date of Dataset
Min. delay
N. Europe – Far East 22 Oct-06 4 weeks 10 weeks
N. Europe – India 22 Oct-06 4 weeks 10 weeks
N. Europe – W. Africa 1 Nov-06 3 weeks 9 weeks
Transatlantic15 8 Nov-06
1 week
2 weeks
4 weeks
Individual carrier port-port volumes from financial data bases in TEUs per port-pair and direction 20’ dry13 40’ dry Reefer
1 week Nov 2006
Aggregated port-port14 volumes in TEUs per port-pair and direction 20’ dry 40’ dry Reefer
8 Jan-07
8 weeks
N. Europe – Far East NA NA NA NA NA NA
N. Europe – India NA NA NA NA NA NA
N. Europe – W. Africa NA NA NA NA NA NA
Transatlantic NA NA NA NA
Individual carrier supply data
In TEUs per trade and direction
NA
4th quarter 2006
Aggregated supply data (average per month in the quarter) In TEUs per trade and direction
8 Jan-07
NA
N. Europe – Far East 22 Sep-06 4 weeks 3 weeks 22 Dec-06 3 months
N. Europe – India 22 Sep-06 4 weeks 3 weeks 22 Dec-06 3 months
N. Europe – W. Africa 1 Oct-06 3 weeks 4 weeks 1 Jan-07 3 months
Transatlantic 8 Oct-06
1 week
2 weeks
4 weeks
Average individual carrier $/TEU ocean rate including surcharges and ancillaries, irrespective of ports and equipment, inland excluded 5 weeks
Aug-Oct 2006
Rolling quarterly price index (one index figure per trade direction for whole quarter)
8 Jan-07 3 months
13 For North-South trades, input as well as output per equipment type would be provided on a trade basis only. 14 Or, alternatively, a range of ports in one geographic area, should the port volumes not meet the safeguards against disaggregation (see above at 24 et seq. At present, port-port volumes are
taken from the lines’ financial information. This is the most accurate information currently available, but it is only produced at the end of each voyage, or in some cases round voyages. The projected 10 weeks for the East/West trades, for example, are in line with what we have at the moment.
15 For Transatlantic volumes a faster system is available through the Journal of Commerce statistics.

12
Competition Law Assessment of Steps 1 & 2
33. Steps 1 & 2 amount to the envisaged system of information exchange, on the basis of which carriers can make their individual decisions. As explained in great detail in the ELAA Article 81 EC Assessment, accurate data from the past is a crucial element for capacity planning.16 ELAA Members have identified a need to obtain this information by trade and by port pair. Such a level of detail is required to enable carriers to optimally adjust their capacities to important regional differences in infrastructure (e.g. facilities, feeder operations, access to ports). The carriers need to carefully monitor shifts in demand in different ports, as for example the relocation of a manufacturing plant will need careful planning in advance in respect of carrying capacity, slots, container type, etc. Accurate data is also necessary to match segments of the supply chain – to the benefit of all stakeholders in the industry. The GI Report in the assessment of the Original Proposal found that “[t]he information exchange concept by itself would appear to have possible benefits in terms of efficiency.”17
34. All the data provided would be sufficiently aggregated and delayed, at least eight weeks old, although the ELAA firmly believes that the IDS should be allowed to publish data as it becomes available, as this kind of information will not influence pricing negotiations and cannot be used as a tool for collusion. The ELAA has previously explained in detail how contracting works in the liner shipping industry.18 For the purposes of understanding the speed by which data becomes sufficiently delayed, we will reiterate the basics of contracting in the industry.
35. There are in principle three broad categories of customers in liner shipping. Direct accounts, spot market and freight-forwarders. None of the pricing negotiations with these customers will be affected by the envisaged information exchange in any other way than that both shipper and carrier will have a more learned view of the actual market situation.
• Direct Accounts: These accounts are usually governed by annual contracts whereby lines agree a certain level of volume commitments at a certain price level. The agreements are often negotiated in the Far East – Europe Trade at the turn of the year. Direct account customers are very well informed. They are professional, know what prices are available in the marketplace, know what ships are going to be delivered and are aware of the likely market growth. These customers seek tenders from lines, who all have their own views on what is going to happen in the year. The tenders are discussed bilaterally between the customer and the individual lines, and a market price is formed. Successful lines know the market price, as do the unsuccessful ones because by their failure they know they are too expensive. At the next negotiation with another customer they will accordingly adjust downward.
• Spot Market: A forwarder in Europe in the scrap or paper market or an Asian C&F freight forwarder would have a different view of supply and demand. These customers are not looking for long-term prices but for prices in the next couple of weeks. They will talk to the line they usually deal with and seek prices for particular parcels of cargo to be shipped in one or two weeks’ time. Again a market price is formed. Spot markets in general and in liner shipping in particular are by nature volatile given their extreme sensitivity to the real-time supply and demand situation. If vessels are not full, carriers will offer low prices even down to
16 See in particular paras 595-599. 17 Global Insight, ISL and TU Berlin, The Application of Competition Rules to Liner Shipping, Final Report to
DG Comp, 26 October 2005, at 825. 18 ELAA Article 81 EC Assessment, at 264-307 and Annex 2.
13
marginal price, which is very low given that most costs in liner shipping are fixed. If vessels are full or almost full, the prices will raise sharply as the carrier knows the few spots available will be very attractive. The best way to limit the volatility of the spot market is to keep supply and demand in harmony. The information exchange envisaged in this Proposal is absolutely critical for carriers and transport users in order to mitigate the volatility of the growing spot market.
• Freight Forwarders are often entering into quarterly agreements with lines. What is important to them is the perception of supply and demand for the three months ahead. Of course one of the factors taken into account will be the forward forecast of supply and demand and one of the factors influencing their view is the historical market situation in which they are operating.
36. What happened in the past is of little relevance for the pricing negotiations, but is crucial for the lines’ management of their business in order to ensure a reliable and efficient service around the globe, with a well-balanced supply and demand situation. Issues have been raised as to how the information could be crucial for trade management, but at the same time not influence pricing. As explained above, the prices are determined by perception of current and future supply and demand balance. What happened in the past is of little relevance. If there is any relevance, it is that transport users and carriers will have a better ability to assess the actual supply and demand situation, which will lead to pricing closer to the market reality. However, for the provision of reliable services, i.e. trade management and planning purposes, recent figures are absolutely necessary. This could relate to short-term allocation of special equipment, planning on inland transport, etc. For example, a carrier recently lagged behind schedule after having loaded too much cargo in Shanghai. Once a carrier is off schedule, port services will become less efficient, further delays will be caused and the whole logistics chain will suffer. The importance of running the logistics chain smoothly in order to provide just-in-time services is further explained in Annex 2, and is unrelated to the pricing of liner shipping services.
37. It should be understood that the market is constantly evolving, and at times these distinctions given above become blurred. For instance, freight forwarders are now asking lines for annual rates because their logistical customers require these. The ELAA believes that the Revised ELAA Proposal is sufficiently flexible to deal with market developments.
38. The efficiencies envisaged are created in a manner that will not restrict competition. The liner shipping market is a knowledge economy and at the moment it is running with insufficient, inaccurate information. Global trade is too important to be left to chance. The shipping industry has a real opportunity to conduct a proper analysis of container cargo moving to and from Europe, with the ability to accumulate timely and accurate port-to-port information for the first time. This is at the heart of the ELAA Proposal.
39. The supply and demand figures are must-haves for carriers in order to provide the services their customers’ demand, i.e. stable supply and reliable, efficient and cheap liner services across the globe. The restrictions of competition, if any, are very limited and definitely not appreciable, as no data will enable the identification of individual carrier strategies.
40. If liner carriers are not allowed to use the appropriate tools for gathering and assessing the necessary data, there is a significant risk that the liner shipping industry will be as volatile as the bulk industry. In Annex 10, an overview of rate volatility in the bulk industry is provided. Deregulation without an appropriate replacement to ensure a solid supply and demand forecast would very likely make the liner industry as volatile as the bulk industry, which would not be in the interest of either customer or carrier. Moreover, such volatility would likely result in liner carriers behaving more like the tramp industry, i.e. more like a

14
taxi service and less like a bus service, and could jeopardise the current stable and regular service pattern all over the world. It would also lead to significant hesitance in the profitability of vessel investment. Already today, there is considerable concern about the supply in 2008-2009. After having full order books, carriers and investors are now reluctant to invest in liner shipping vessels. The graph below is illustrative:
Container Ship Supply
Source: Clarkson, Container Intelligence Monthly, Volume 8, No 5, May 2006.
41. In addition, the information generated will make the logistic planning of shippers easier, as concluded in the GI Report.19 Shippers will have access to data from the immediate past that will enable them to plan their just-in-time business with the lowest possible inventory without ever being short of supply, which in turn will lead to cost-reductions that are passed on to the end-consumer. The users of liner shipping have a major interest in ensuring that there is better data in the liner shipping market. Several comments on the Commission White Paper confirm that.20 Both carriers and shippers will enhance the efficiency of their respective businesses.
42. In order to have all relevant information gathered in an efficient way, one functional data service must have sole responsibility. The use of several data centres naturally leads to incompleteness, or at the very least to inefficient duplication of work. Moreover, as recognized in the GI Report, the publication of data “avoids” or has the capability of “perhaps dulling any collusive utility”.21 The ELAA therefore suggests the creation of a single Independent Data Service to gather the data.22
43. As far as currency cost information is concerned, we refer to Step 7 below.
19 Loc cit., at 809, “Additionally, it might provide valuable information for shippers and other interested
parties”. 20 See ELAA Article 81 EC Assessment, at 618 and the responses of Höganäs (at p 5), VA Tech Hydro (at pp 3-
5) and Volkswagen (at p 6). 21 Global Insight, ISL and TU Berlin, The Application of Competition Rules to Liner Shipping, Final Report to
DG Comp, 26 October 2005, at 73 and 772. 22 See ELAA Article 81 EC Assessment, at 594.
15
3. Step 3 – Industry Specialist Analysis
44. Simultaneously with the carriers and other subscribers, the IDS reports (the monthly volumes and utilisation figures as well as the quarterly supply forecast) will be passed on to an independent group of experts for analysis. The demand data provided to the forecaster by the IDS will amount to the sufficiently delayed volume figures as they become publicly available. The forecaster group could be a university or a consultancy group with industry specialization, which could be selected by an open tender to operate on a time-limited retainer. On a quarterly basis and in advance of the carrier and industry wide consultations, the experts will:
• Compare the data with other statistics available, such as data compiled by industry consultants and others, US FMC data as published by JoC, trade statistics from various industries, etc.;
• Keep track of industry news such as public announcements of capacity increases or withdrawals, regulatory restrictions such as import bans, etc;
• Contact individual carriers and customers with follow-up questions; and
• Based on all the collected information, produce a quarterly report including a supply and demand forecast per quarter over the next 18 months.
45. Both supply and demand would be calculated by trade direction, i.e. not on port level. The final trade definition is yet to be determined, but as a working assumption, trades will be defined in line with EC case law. The main task of the forecaster is to analyze the demand situation in comparison to the supply forecast provided by the IDS, as well as non-member supply. The report will be provided to all members of the Liner Shipping Association for the trades to which they have inputted data, and to whomever subscribes to it. Non-subscribers attending the forum discussions will receive sufficient data for a fruitful discussion; all data will be provided simultaneously to subscribers (from a pick-and-choose menu) on fair, reasonable and non-discriminatory terms, see above at 31.
46. The independent forecaster is independent, which means naturally its view cannot be ascribed to the carriers. Rather, it is an outsider’s view, which will form the basis for the next step of the Proposal, i.e. the industry-wide consultation, where carriers and transport users will get the opportunity to comment on and improve the independent forecast report, and produce an industry view.
47. The necessity of an accurate forecast is described in detail below at Step 4. In this section, it suffices to say that, as DG Comp has agreed, using an independent expert to create a forecast is a non-restrictive method in order to produce a better understanding of the expected future market developments.
4. Step 4 – Consultation
48. The ELAA envisages two integrated forms of consultation in order to improve the prospects for stability of supply in the liner shipping market:
• Meetings between carriers active in a trade; and
• Meetings between carriers and other industry stakeholders in industry-wide trade forums.
49. The carrier consultations are a necessary preparation and a prelude to the industry-wide forums. The carrier consultations as well as the industry wide consultations are envisaged

16
to be quarterly (save for exceptional circumstances such as war risks, major strikes, etc) on big trades and bi-annual on smaller trades. The purpose of both of them is to improve the knowledge of the carriers, the transport users and the other industry stakeholders on the issues facing the industry and the likely development of supply and demand.
Carrier Consultation – Structure and Scope
50. Member carriers will meet quarterly to discuss supply and demand per trade, within the framework of the Liner Shipping Association. Carriers will convene to discuss and interpret the forecast report in preparation for the industry-wide forums.
51. The GI Report’s main criticism against what were the Trade Committees in the Original Proposal was that they would act as a “club” and that the only “police” against collusion would be club’s own lawyers.23 The issue that gave rise to this fear is removed in the Revised ELAA Proposal, as interested industry stakeholders will get access to data and be invited to participate in industry-wide consultation (see below at 61 et seq. Likewise, there are no discussion on surcharges and ancillary charges, no carrier votes on a forecast report which the GI Report (inaccurately) described as “agreements on common business goals”.24
52. The consultations would be organised by the Liner Shipping Association and governed by the Liner Shipping Association’s statutes. There could be different consultations per, for example, Europe / Asia, Transatlantic, etc.
53. It is important to stress that neither the Liner Shipping Association nor the consultation participants will in any way be involved in the collection of carrier data, and discussions will not touch upon issues such as individual data or strategies, pricing or capacity management. The clear focus of the discussions would be expected demand developments. The carrier consultations are envisaged to:
• Deal with trade-specific and technical issues;
• Security on vessels;
• Major events such as war, strikes, major port congestions and natural disasters;
• Government decisions on above matters to be applied in certain areas; and
• Discuss supply/demand developments.
54. The Liner Shipping Association will publish after each consultation a report on the discussion of the above matters, including comments of the independent forecast report and other industry expert views which normally collect information from carriers but not necessarily deliver correct information. This report will form the basis for the industry-wide forum discussions.
55. The consultations will be facilitated by a representative from the Liner Shipping Association to ensure compliance with its statutes and legal provisions (such as antitrust compliance), and a lawyer will be present at all times. DG Comp will be notified in advance and on reasonable notice of consultations, and a written report would be submitted to DG Comp after the meeting (DG Comp has declined the ELAA’s suggestion to be invited to attend the meetings).
23 Global Insight, ISL and TU Berlin, The Application of Competition Rules to Liner Shipping, Final Report to
DG Comp, 26 October 2005, at 709 and 793. 24 Loc cit., at 799.
17
56. The meeting chairman will lead a roundtable discussion. The chairman will inform every attendant what he/she can or cannot say for compliance reasons and control that these rules are abided by at all times.
57. The Liner Shipping Association staff will take minutes of all discussions. The minutes will be circulated to all meeting participants for revision and acceptance.
58. The main purpose of the meeting is to prepare for the following industry-wide forums. Meeting participants would discuss supply/demand developments (with a strong weighting on the demand side) in order to ensure a structured discussion on the topic at the following industry-wide forums:
• Interpret the capacity utilization and market size data provided by the IDS Reports as well as the forecast report, in combination with public source information available, such as IMF, WTO and OECD as well as independent information provider reports;
• Discuss information that comes out of the envisaged system (i.e. trade patterns and trends in demand, given historic patterns) to understand market developments better;
• Comment on the independent expert’s forecast report. It is envisaged that such comments would make the report more robust, accurate and useful in comparison to what is available today and would be used by each individual carrier as a guide to market conditions, and would also be shared with customers. There would be no coordination, consultation or discussion between carriers on matters that are to be decided at individual company level (i.e. rates, capacity, investment, deployment, etc.), or at consortium level;
• The comments on the forecast report would not contain any form of recommendation on future strategies, but merely reflect an informed view of where the market is likely to go. As there would be no discussion of individualized data, the forecast cannot be seen as a facilitator of collusion, and neither can it be used for signalling what competitors intend to do.
59. Examples of consultation discussions would be:
• Members compare industry reports for a trade region (including the independent forecast report), such as for example Korea. The comparison shows a significant variance in the growth and expected future growth of the Korean manufacturing economy. A comparison of this data with the data provided in the Monthly Briefing provided by the Independent Data Service shows that one of the industry reports has corresponded very well over time with the development of volumes shipped between Korea and Europe. The Committee concludes that this report may be more valuable as a reference point than the others;
• A number of announcements of new production sites of large manufacturers in China focus on goods going to the Northern European Continent, and not to the US or the Mediterranean. This may lead to a larger trade growth between China and Northern Europe than is forecasted in the market reports. As capacity utilization is already very high despite a 5% increase in capacity between China and Northern Europe over the last year, it can be assumed that market growth will be even greater for the coming year, whereas growth to the Mediterranean can be expected to be more stable;
• The Monthly Briefing provided by the Independent Data Service shows a decline in the transport of reefer containers from Australia/New Zealand to Northern Europe.
18
However, this is likely to be the result of temporary import restrictions, and the decline is therefore not expected to have an impact on future demand.
60. A hypothetical agenda for a meeting could include the following items:
• The chairman opens the meeting and reminds the participants of the implications of EC and other applicable competition laws;
• Discussion on current demand and supply situation by country / region (discussion on the basis of IDS data, the independent expert forecast and other published statistics to put them into context. Discuss information about trade patterns and trends in demand to improve understanding on market developments, such as outside factors that may have influenced exceptionally high or low utilization in certain zones. The discussions will be limited to a general exchange of ideas which do not imply individual figures or strategies, e.g. “China looks as though it will grow better than the IMF forecast” or “what is the impact on the Europe-Far East trade of temporary quotas”);
• Standards and technical issues;
• Capacity;
• Security on vessels
• Major events such as war, strikes, major port congestions and natural disasters;
• Regulatory developments;
• Equipment needs;
• Interpretation of demand forecast report (comment on the forecast report on trade size, capacity deployed and specific volumes split by 20’ dry, 40’ dry and reefer containers; and
• Future outlook (What are the issues facing the industry in the future? Which ports are facing serious congestion? Where are the bottlenecks in the logistics chain? Can these be overcome? Are there alternative ports with less congestion problems?);
Industry-Wide Forum Discussions – Structure and Scope
61. Consultation between carriers and other industry stakeholders are envisaged to follow the carrier meetings and provide the necessary customer input to finalise the conclusions of the supply and demand developments. Given the number of participants envisaged, the discussions would be more general, and give shippers and other stakeholders the opportunity to comment on and discuss the forecast reports and the carrier consultation reports. In particular, this would give an opportunity for smaller shippers to hear the industry view and to be heard.
62. The industry acknowledges that consultation with shipper organizations in Europe has not been particularly successful in the recent past, whereas it has been highly successful in other jurisdictions such as, for example, Australia, Japan, and South Africa. But there is fresh thinking in the industry, and the ELAA submits that the envisaged system of industry-wide consultation is designed to be useful and effective. Recent statements by the ESC and FTA show signs of a new attitude and commitment to make consultation work.25 The ELAA Members are equally committed, and have recently started to engage
25 Messrs. Filip Beckers, ESC, and Andrew Traill, FTA, Shipper Forum 2005, Hamburg, see Lloyd’s List of 7
October 2005.

19
in extensive consultation with customers to identify the needs and wishes of transport users. That is why the forums together with the carrier consultations have replaced the envisaged Trade Committees in the Original ELAA Proposal. The forums differ significantly from the Trade Committees as they are based on open participation of all industry stakeholders. Obviously, the industry cannot oblige anyone, carriers or other stakeholders, to participate, but the broader the participation, the better for the industry as a whole. The ELAA has during the course of the review of Regulation 4056/86 urged shippers, freight forwarders and their representatives to come forward and explain how they would like consultation to work for the future. Below, we outline how such forums could operate, but this is, of course, also subject to agreement with other industry stakeholders.
63. The forum chairman will lead a roundtable discussion. The chairman will inform every attendant what he/she can or cannot say for compliance reasons and will ensure that these rules are abided by at all times.
64. The Liner Shipping Association staff will take minutes of all discussions. The minutes will be circulated to all forum participants for revision and acceptance.
65. A hypothetical agenda for a meeting could include the following items:
• The chairman opens the meeting;
• Discussion on current demand and supply situation by country / region (discussion on the basis of IDS data, the independent expert forecast, carrier consultation comments and other published statistics to put them into context. Discuss information about trade patterns and trends in demand to understand market developments better;
• Shipper concerns;
• Capacity;
• Major events such as war, strikes, major port congestions and natural disasters;
• Regulatory developments;
• Equipment needs;
• Interpretation of demand forecast report (comment on the forecast report on trade size, capacity deployed and specific volumes split by 20’ dry, 40’ dry and reefer containers; and
• Future outlook (What are the issues facing the industry in the future? Which ports are facing serious congestion? Where are the bottlenecks in the logistics chain? Can these be overcome? Are there alternative ports with less congestion problems?).
66. The envisaged trade forums will not have a legal personality. They will be quarterly scheduled discussions organized by the Liner Shipping Association. The Liner Shipping Association statutes will regulate the trade forums under general fair principles such as that all participants will have the right to have their say and have their comments noted in the minutes.
67. The number and types of forums need to be discussed with industry stakeholders. They probably need to be wider in scope than current conferences, but the following non-exhaustive list could be the relevant forums for Europe:
• The Africa Forum;

20
• The Asia Forum;
• The North America Forum;
• The South America Forum; and
• The Oceania Forum.
68. Each forum will invite in good time all industry stakeholders to the discussion forum. That includes:
• Shippers;
• Freight Forwarders;
• Trade Associations (the envisaged “Liner Shipping Association” as well as ESC, FTA, etc.) and specific customer associations (Rubber Association, Coffee Association, etc.);
• Governments and regulators;
• Port Authorities;
• Stevedores; and
• Other industry stakeholders.
Carrier Meetings and Industry-Wide Forums – What Would Not Be Discussed?
69. Neither carrier meetings nor forum discussions would include any of the following items:
• Prices (current, past or future) or discussion on what the price index translates into;
• Individual carrier or shipper future demand;
• Relationship between demand forecasts and individual expectation of the aggregate supply position;
• Any form of capacity management on a trade;
• Current individual carrier capacity utilization;
• Shipper auctions, tenders, individual contracts, etc.;
• Industry views of trade rate development; or
• Surcharges and ancillary charges.
Article 81 EC Assessment of Carrier Consultations
70. The main object of carrier consultation is to refine the independent expert forecast and to achieve better know-how to understand the supply and demand figures in order to improve carriers’ knowledge as a better basis for individual decision-taking and crucially in order to improve the prospects for a fruitful industry-wide forum discussion. As supply figures will be provided by the IDS and be complemented by the independent expert forecast report, the discussion will focus on the demand side. The carriers will jointly review the (aggregated) data available and discuss what the past tells about future demand trends, and flag issues such as congestion, stevedore strikes, imposition or liftings of quota restrictions, new customs restrictions, factory downtime or expansions, manufacturer replacement, etc, which will influence demand and logistics and which may or may not have been accurately described in the expert report. Carriers would opine on

21
issues such as: is this figure realistic based on previous experience or is it a mere fillip? There could be plenty of temporal factors that have influenced the market, such as temporary production changes at certain important shipper sites, strikes, customs and other regulatory changes; in short, anything that may cause temporary disruption is important to take into account. For example, the ongoing football world cup tournament in Germany will probably lead to a decrease in European exports. Having all this information, and interpreting it correctly, is absolutely necessary for accurate forecasting. Comments on the forecast report will be added to the expert report for the final version, which will be made publicly available and published on the Liner Shipping Association website and be used as a framework for discussion at the industry-wide forums.
71. There will be no discussion of individual data. Hence, the influence on market behaviour resulting from the meetings, once the consultation process including the forum discussions is completed, will be that individual decisions by shippers and carriers are taken on a better informed basis and thus reduce the risk of misinterpretation, which ultimately could lead to disruptions in service (if misinterpretation is made by a majority of market players) / cost increases. All actions will be individual; there will be no joint action.
72. The resulting efficiency is a more streamlined business; the information will not be used to squeeze consumers, but to compete harder. Carriers have to have a full understanding of the trade in order to take action which keeps supply and demand in balance and avoids supply and demand imbalances for the future that would lead to disruptions in supply and/or cost per TEU increases. The aim is to get as close as possible to a perfect supply and demand match. For a service to run economically soundly there should be a 90-95% match; this would lower the cost per TEU, a benefit that would be passed on to consumers in the form of price decreases and continued investment in new capacity. If a forecast assumption on a major trade is 1% inaccurate, it makes an enormous difference. The closer and better the feeling is, the less the risk of misinterpretation.
73. It has been argued that the carrier discussions are unnecessary if there are effective industry-wide consultations. Before responding to that concern, it must first be stressed that the envisaged carrier meetings have nothing in common with the traditional idea of locked door competitor discussions in smoke-filled rooms. The carrier meetings will be regulated by strict antitrust compliance rules, which will be monitored by a lawyer and DG Comp will be invited to attend. As the carriers will not exchange business sensitive information, there will be no secrecy of the meetings at all. The reason why the ELAA believes that industry-wide consultations must include carrier meetings is three-fold:
• First, as preparation for the industry-wide forums. Shippers at the industry-wide forums will ask for a common industry position. This may not be possible, but at least carrier meetings in advance of the forums may serve to avoid confusing messages because of different industry forecasts. The problem with analyst report is that even if carriers and analysts have the same data, analysts tend to come up with different results.26 Carriers need to discuss why there is such a difference. Carriers will also have different views internally, but will make an effort to come up with a consensus.
• Secondly, there are limits to how many people can join a discussion before it loses its focus. The ELAA does not believe that a fruitful meeting to interpret a forecast report is possible in an open-to-all meeting; and
26 The FEFC predictions of demand developments have over time been significantly more accurate than other
information providers’ forecasts. Illustrative examples can be found when comparing the FEFC forecasts to Drewry in May 2005, the GI and the FEFC predictions for 2005.

22
• Thirdly, there is a clear risk that a forum discussion on the forecast could break down into discussions between individual carriers and individual customers when both carriers and customers are participating. This must be avoided as it is not the purpose of the meeting, and would risk distracting from the main point of the meeting, which is a discussion on what has happened and might happen on a trade.
74. The carrier consultations are therefore creating additional efficiencies to the industry which are indispensable to the attainment of stable liner shipping service in all European trades.
75. Questions have also been raised as to why carriers are not making this assessment individually, but need to meet together. Except for the necessity of carriers to meet in advance of forum discussions, which was explained above at 73. The simple version of the answer is that “20 people think better than one”. Forecasts are not unique to liner shipping. Output data on which the forecast is made will never be perfect, but industry stakeholders will recognise the IDS data as ‘as good as it gets’, while carrier meetings will serve to review this data and refine the independent forecast report. Meetings always lead to better understanding. Carriers feel they need to be listened to, it helps stabilise the market for both shippers and carriers. Carriers meeting together to discuss the market forecast would result in an absolute expert information on supply and demand from the people that know the trade issues better than anyone else; the main expertise of the industry would be the carrier representatives attending the meeting. This could be described as a “Gold Standard”. As an outsider aggregates the data, there may be various indications in the data set that do not necessary reflect real life, e.g.:
• A Chinese carrier may have better market indications about the Chinese market than anyone else. If this Chinese carrier gives his views of the Chinese market, this ‘forecast’ will be recognised as being more sophisticated than others. The same applies to the Japanese and other “home market” carriers;
• As analysts had predicted 2006 to be a disastrous year, prices dropped considerable in the beginning of the year. However, it turned out the vessels are fairly full, and now prices are recovering. These fluctuations are hugely damaging to the industry.
76. Another objection against the need for carrier consultation has been that, given the improved data exchange envisaged by the ELAA Proposal, there would be no need to further interpret the data. Nothing could be more wrong. The information provided by the IDS for the first time provides a clear view of the recent past of the industry, on which the forecaster will base its predictions. But it does not mean that the crystal ball for the future is clear. There are still significant uncertainties about the future:
• Will global trade continue to grow?
• Is the trade deficit in the US sustainable?
• Could the US become protectionist?
• Will Europe keep spending?
• Will China remain politically stable?
• Etc.
77. In a knowledge economy, the ELAA firmly believes that carriers will compete better with more information, which will lead to cost efficiencies and hence more investment and lower transport prices. Likewise, the customers will be able to plan their logistical business better and get the right price with market transparency, as explained in Annex 2.
23
78. All the above questions will hugely impact on the liner shipping industry. The question is how, and that is why the carrier consultation is absolutely critical. The risks of misinterpretation are larger in liner shipping than in other industries. A disruption in other industries could be compensated by imports from elsewhere, but liner vessels must always be available. Therefore it is crucial to the economy at large that carriers do their best to get their forecasts and business planning right to the greatest extent possible.
79. Narrowing down the inherently speculative element of investment by providing carriers with a proper foundation to forecast supply and demand is an efficiency which is difficult to quantify. However, one can only imagine the cost for society in the case of insufficient liner shipping capacity in the world.27
• Carriers would not be able to satisfy all shippers’ needs for transportation, leading to high rates and the exclusion of customers that could otherwise be served;
• Cargo would not move, or would move very slowly and at a very high rate;
• Moreover, manufacturers would need to consider moving manufacturing facilities to otherwise less cost-efficient locations, if that were at all possible; and
• Undertakings would not be able to sustain “just-in-time” or similar type manufacturing and distribution models which depend on the availability of regular and predictable logistics services, of which liner shipping is a key component.28
80. Globalization has led to an efficient division of labour across countries and across continents. Liner shipping has provided vital transport services at ever decreasing cost, bringing benefits to carriers, shippers and consumers alike. Just-in-time production requires reliable delivery of components in order to be a rational strategy. These welfare-improving business strategies have been feasible thanks to the availability of reliable and regularly scheduled maritime transport services. Consumers are benefiting from reliable liner shipping services as well, offering them a variety of products at affordable prices which are produced in another part of the world. A container of rotten bananas or bananas grown in the forests of Scandinavia? None of the options are very appetizing. Miscalculations in the other direction are not much better. A market with significant over-supply would not be able to operate profitably. Rates would collapse and the few surviving carriers would not have the resources to invest in product and service development. The evolution of the industry would come to a halt.
81. The risk of this event materializing cannot be calculated, and one can only see in hindsight how accurately forecasts turn out. However, it must be clear to all that finding a way, without facilitating collusion, which provides carriers with the best possible information platform on which to base their individual investment decisions, would significantly decrease the risk of the industry suffering from substantial over- or under-supply.
82. The issue of capacity deployment is perhaps less dramatic but still very important. The efficiencies of an effective means to rapidly react to demand fluctuations are perhaps easier to grasp. Liner shipping services will continue to be efficient when capacity is deployed where it is needed the most. It will avoid temporary capacity shortages and keep rates more stable. Information is vital for efficient deployment decisions.29
27 The reverse situation would also be very serious. The continuation of globalization would be seriously
impeded with irreparable damages to developing countries and overall trade. 28 See ELAA Response to the DG Comp consultation paper of 18 June 2003, at 9. 29 Fluctuation of supply and demand – leading to either a need for or a surplus of capacity – may prompt a
carrier to redeploy its vessels to trades to ensure optimal utilization of the assets.
24
• Consultation through “gentlemen’s agreement”
• A window for shippers and carriers
• Agreement through non-binding consensus – no agreement but a useful framework for understanding in individual negotiations
• Particular interest of small shippers – opportunity to hear what the industry has to say and to be heard
• Always preceded by pre-meetings between carriers – and shippers (primarily represented by Japanese Shipping Counsel)
• Without pre-meetings, meetings would be “a mess” and a lot of value lost
83. In addition to the injury to European trade at large in case of supply disruption, the environment will suffer, as explained in Annex 2. Issues such as how to avoid congestion in ports, etc, are not straight-forward from a data exchange. They need discussion between the carriers to avoid inefficient and environmentally damaging bottlenecks in congested ports.
Article 81 EC Assessment of Forum Discussions
84. Various participants in the wider transport community require accurate, regular, and reliable information to assist them in the development and management of transport infrastructure and planning. Within the context of expanding world trade, increasing transportation infrastructure capacity challenges and complex supply chains, it is in the future incumbent on the liner industry to provide a forum in which these matters can be discussed and understood and in which accurate assessments shared with interested parties.
85. The demand for and use of accurate trade data is increasingly important as international shipping and logistics grows and becomes more complex, as the efficient flow of international trade becomes even more important to the European economy, and as transportation infrastructure challenges to the effective and efficient management of supply chains proliferate. Accurate and reliable trade information requires the collective input, analysis and understanding of the wider industry.
86. Shippers, freight forwarders, government, Commission, ports – all stakeholders collect useful information that determine supply & demand for liner shipping – which (if appropriately aggregated) adds further knowledge to the platform; normally the meeting would not be open to the public.
87. One example where consultation where consultation is successful is Japan. The following box highlights the core aspects of consultation in Japan.
Box 1: Core aspects of consultation in Japan
Who Benefits from Consultation?
88. Step 4 brings together the industry stakeholders in order to engage in effective consultation. The structure should allow a constructive focus on the relevant commodity issues (i.e. bananas have other issues to cars, rubber, consumer electronics, etc.) and have the necessary knowledge and expertise to assess particular trade volumes (e.g. Europe-Africa trade) or equipment type markets (e.g. reefer trades). The ELAA perceives a demand from shippers and freight forwarders, as well as from carriers, to discuss the
25
forecast report on trade size, capacity deployment and commodity-specific volumes. Such discussion could be improved by inputs from all stakeholders involved in the relevant trade forum. The structure of the envisaged forums was further described above at 63 et seq.
89. Naturally, all industry stakeholders will benefit from a well-functioning logistics chain and a more informed view of the past as well as expectations for the future. In addition, all stakeholders will gain the following particular benefits:
• Carriers. Carriers will save significant costs by participating in talks with carriers and other service providers in order to get the supply chain working. Moreover, they will learn more about the current needs of its customers and the expectation of demand for the future. The demand forecast and the discussion of it will enable better investment and deployment decisions;
• Shippers and freight forwarders. Customers will have an excellent opportunity to influence the development of the industry. Besides, as was recently stated by Commissioner Reding, “only a well-informed consumer is a well-armed consumer”.30 In addition to enjoying excellent and efficient services, transport-users will have access to useful information to improve their bargaining position;
• Other supply chain service providers. Terminal operators must, like carriers, plan their activities very carefully to ensure that they have enough equipment and labour available in peak times (which can occur in holiday seasons), etc.;
• Trade Associations. Other trade associations will get access to liner service data, and have the opportunity to discuss market needs for their particular commodity directly with carriers;
• Banks and investors. Reliable forecasts are crucial for any investor to assess the viability of their clients’ business plans. The support of banks and investors to keep the liner shipping market up to speed with market growth cannot be overstated, and there is already today a hesitance in the market to order more vessels. The situation for 2008-2009 looks very worrying;
• Governments. Governments need access to data to track the performance of their export industry, and need to invest to ensure that necessary imports and exports do not go elsewhere as a result of congestion or undeveloped facilities in the ports. A direct line of communication with carriers on expected trade patterns will improve the chance of every country to get the right level and type of supply to its ports;
• Port Authorities and Stevedores. Ports have a heavy burden to sort out congestion problems and sudden unexpected developments such as strikes, import restrictions, security issues, etc. They need to keep in constant contact will all clients at the port, and to have a clear view of future demand. This cannot effectively be achieved without grouping the communication in particular with carriers;
• Consultants. Without the conference system, there would be no reliable volume and price movement information on the vast majority of trades. Consultants will be able to purchase the data as well as the improved forecast from the forum discussions. Today, only FMC trades generate reliable data outside the conference system. With the ELAA Proposal, information providers will finally have a solid basis to operate from in all trades. Without it, the struggle of external information
30 Commission Press Release IP/05/1217, 4 October 2005 (regarding the Commission programme to publish
mobile roaming tariffs).

26
providers would not only continue, but would be intensified. The ELAA Proposal will therefore be key to the business of external information providers. In response to direct questions asked by the ELAA, all the four major information providers in the industry, Drewry, Containerisation International, Global Insight and Dynamar have confirmed that today’s data is insufficient, particularly in terms of port figures, which for example do not separate between intra-European traffic and transhipment. One of them stated that “[t]he lack, or rather, absence of reliable statistics is a nuisance”, and all confirmed that the statistics envisaged by the ELAA Proposal, in particular port pair data, would be very useful for their work;31 and
• The end-consumers. The stability of supply ensures that consumer goods will be available at all times and places in Europe.
90. The ELAA perceives a demand from all these stakeholders to engage in the forum discussion. To date, the ELAA has information that at least the UK Government (HM Treasury) has requested data from FEFC, in order to assist the Government in various studies. The requests relate to data which is not in the public domain, but which FEFC makes available to those who ask for it. Actual examples of data that have been requested are:
• Volumes of TEU into UK ports, as well as a request for any information on future growth;
• Requests for details of China/UK volumes and freight rates; an exercise to consider the competitive costs of Shipping from China to the UK. The FEFC was unable to assist the UK Government with freight rate information;
• Port of London Authority: details of volumes from the Far East; and
• FEFC has also recently been approached by UNCTAD, i.e. an inter-Governmental organisation, for data related to average prices of commodities.
Conclusions Regarding Consultation
91. The ELAA considers that the envisaged system of carrier and industry-wide consultation deals with DG Comp’s concern about the originally proposed Trade Committees, as the consultations will not take away individual carriers’ uncertainty about the future, nor allow for any other form of collusion. All stakeholders will take their own individual commercial decisions according to their own strategies, but with a clearer view on how best to use capacity to meet their respective demands. The allegation that, despite all the safeguards already proposed by the ELAA, carriers could use the discussions to agree on prices and collude in other aspects was never accurate. With the further changes such concerns can no longer have any relevance due to the inclusion of customers and indeed antitrust enforcers and regulators attending or at least invited to attend the meetings.
92. The envisaged carrier consultations and forum discussions – while in line with international comity and systems in place with Europe’s major trade partners – will put the data available in the appropriate context, in order to find solutions to problems common to the industry. Currently, and most likely for the future as well, the most important task is to find solutions to logistics problems. The discussions are beneficial to all as they will smooth the operation of the industry and provide for faster, cheaper, environmental-friendly and more reliable liner shipping services.
31 See further ELAA Article 81 Assessment of 10 March 2005, at 634 et seq.

27
93. Absent conferences, there is no forum for discussion in the industry. Without discussion with the industry stakeholders, carriers are unable to meet the demands of their customers – to ensure fast, reliable and stable transportation services at all times.
94. The ELAA Proposal is carefully structured to ensure that carriers will not be able to track the behaviour or strategy of individual carriers. It has been refined to respond to concerns raised by DG Comp. The above is the carriers’ idea and we continue to reach out in this to customers and their representative bodies, and we would be open to modify and improve consultation in line with their thinking.
5. Step 5 – Price Index
95. Furthermore, the ELAA understands that shippers, freight forwarders and carriers alike, as well as Governments and research institutions, wish to have a historical benchmark of how prices have been developing. In particular, Governments regularly request similar data from carriers and conferences for their investment plans in infrastructure, etc. We note that the replies to the Commission’s questionnaires show that some shippers have an interest in such a price index.32 The ELAA believes that the envisaged price index (as contained in the Original ELAA Proposal) could fulfil that need if provided directly from the IDS to the industry stakeholders participating in the trade forum.
96. Carriers will submit their average revenue per TEU (i.e. there will be no port-specific pricing data), defined as all charges on the carriers’ bills of lading (including surcharges and ancillary charges) except charges for inland haulage), per trade to the IDS. The average revenue will be calculated using a template and the information will stem directly from carriers’ individual financial data bases. The IDS will collect all the prices and calculate a simple index per trade direction. The index would be published monthly but with a minimum delay of three months. An important change compared to the Original ELAA Proposal is that the price index will not be split by dry and reefer. Moreover, the index will cover a whole quarter rather than a month only, which means that the index will be based on figures between three and six months old, as suggested by the Commission consultants in the GI report.33 Such an index, which does not show any specific prices at all and hence does not enable carriers to identify even past strategies of competitors, cannot be anything other than compatible with EC competition law. The main reasons for this are the following34:
• The data is sufficiently delayed. How prices moved a quarter ago will not influence either spot or contract pricing negotiations – as recognised by DG Comp’s consultants35 (regarding why the information exchanged is sufficiently delayed, see further above at 34 et seq.;
• The data is aggregated from at least three independent operators but in the vast majority of cases from numerous independent operators;
32 Höganäs AB, Comment on the Commission White Paper, at p 6, states that the “price index” information as
envisaged by the ELAA “might be shipper oriented”. Likewise, Volkswagen Transport GmbH & Co., Comment on the Commission White Paper, at p 7, answers to the question whether the price index as envisaged by the ELAA Proposal may be to the benefit of shippers “[d]epending on the quality of the input it could [be] of value.”
33 Global Insight, ISL and TU Berlin, The Application of Competition Rules to Liner Shipping, Final Report to DG Comp, 26 October 2005, at 774.
34 See further ELAA Article 81 EC Assessment, at 49, 165 et seq. and 604-605. 35 Global Insight, ISL and TU Berlin, The Application of Competition Rules to Liner Shipping, Final Report to
DG Comp, 26 October 2005, at 68.
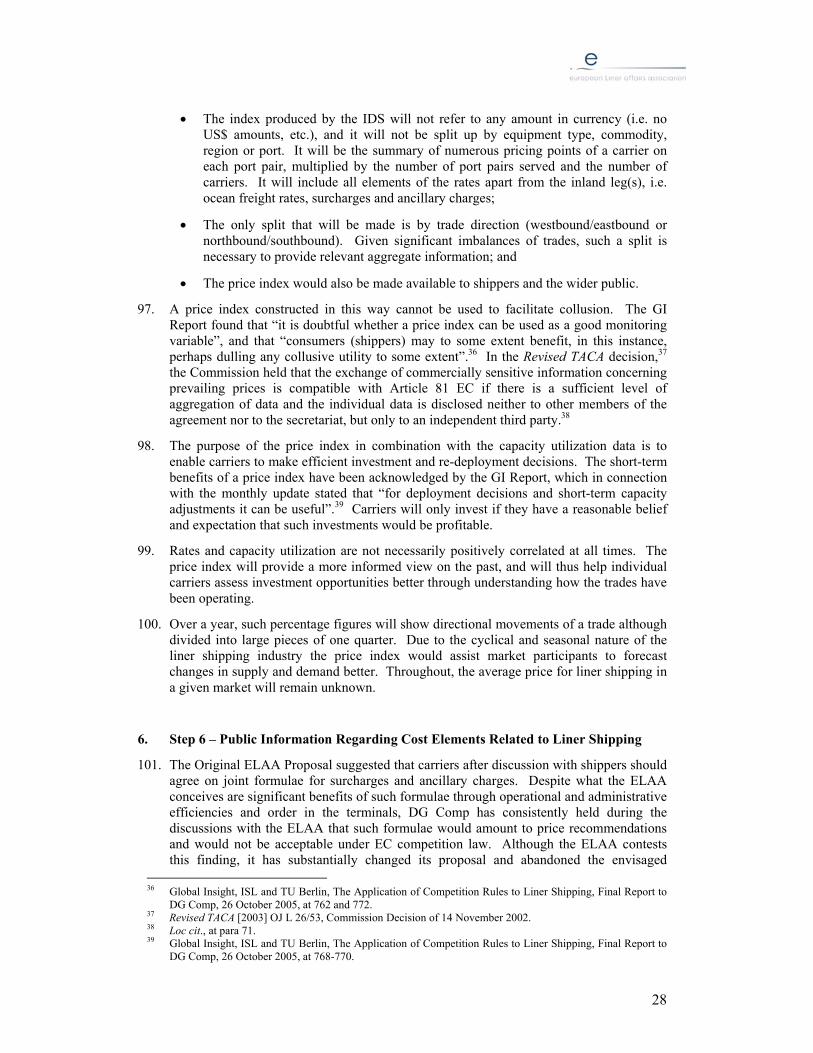
28
• The index produced by the IDS will not refer to any amount in currency (i.e. no US$ amounts, etc.), and it will not be split up by equipment type, commodity, region or port. It will be the summary of numerous pricing points of a carrier on each port pair, multiplied by the number of port pairs served and the number of carriers. It will include all elements of the rates apart from the inland leg(s), i.e. ocean freight rates, surcharges and ancillary charges;
• The only split that will be made is by trade direction (westbound/eastbound or northbound/southbound). Given significant imbalances of trades, such a split is necessary to provide relevant aggregate information; and
• The price index would also be made available to shippers and the wider public.
97. A price index constructed in this way cannot be used to facilitate collusion. The GI Report found that “it is doubtful whether a price index can be used as a good monitoring variable”, and that “consumers (shippers) may to some extent benefit, in this instance, perhaps dulling any collusive utility to some extent”.36 In the Revised TACA decision,37 the Commission held that the exchange of commercially sensitive information concerning prevailing prices is compatible with Article 81 EC if there is a sufficient level of aggregation of data and the individual data is disclosed neither to other members of the agreement nor to the secretariat, but only to an independent third party.38
98. The purpose of the price index in combination with the capacity utilization data is to enable carriers to make efficient investment and re-deployment decisions. The short-term benefits of a price index have been acknowledged by the GI Report, which in connection with the monthly update stated that “for deployment decisions and short-term capacity adjustments it can be useful”.39 Carriers will only invest if they have a reasonable belief and expectation that such investments would be profitable.
99. Rates and capacity utilization are not necessarily positively correlated at all times. The price index will provide a more informed view on the past, and will thus help individual carriers assess investment opportunities better through understanding how the trades have been operating.
100. Over a year, such percentage figures will show directional movements of a trade although divided into large pieces of one quarter. Due to the cyclical and seasonal nature of the liner shipping industry the price index would assist market participants to forecast changes in supply and demand better. Throughout, the average price for liner shipping in a given market will remain unknown.
6. Step 6 – Public Information Regarding Cost Elements Related to Liner Shipping
101. The Original ELAA Proposal suggested that carriers after discussion with shippers should agree on joint formulae for surcharges and ancillary charges. Despite what the ELAA conceives are significant benefits of such formulae through operational and administrative efficiencies and order in the terminals, DG Comp has consistently held during the discussions with the ELAA that such formulae would amount to price recommendations and would not be acceptable under EC competition law. Although the ELAA contests this finding, it has substantially changed its proposal and abandoned the envisaged
36 Global Insight, ISL and TU Berlin, The Application of Competition Rules to Liner Shipping, Final Report to
DG Comp, 26 October 2005, at 762 and 772. 37 Revised TACA [2003] OJ L 26/53, Commission Decision of 14 November 2002. 38 Loc cit., at para 71. 39 Global Insight, ISL and TU Berlin, The Application of Competition Rules to Liner Shipping, Final Report to
DG Comp, 26 October 2005, at 768-770.

29
formulae concerning cost elements related to liner shipping. This Revised Proposal merely envisages the following Liner Shipping Association activity in relation to cost elements related to liner shipping:
• The publication of the general terminal cost elements, for transparency and reference for shippers and carriers alike in individual negotiations of Terminal Handling Charges (THCs);
• The publication of the bunker cost and consumption that is already publicly available; and
• Port charges and canal dues on trades to and from Europe, i.e. publicly available information on the charges due to carriers, for transparency and reference for shippers and carriers alike in individual negotiations of appropriate pass-on of these charges.
102. Annex 11 contains the findings of a survey commissioned by the ELAA on surcharges and ancillary charges.40 The survey highlights the high level of uncertainty that would follow with abolition of Regulation 4056/86 without replacement:
• There is no clear understanding of how surcharges and ancillary charges are calculated today; and
• There is no agreement within or between the main groups of terminal operators, carriers and shippers / consignees as to how these charges should preferably be calculated in the future. There are different views about who should pay whom, and the views cover most possible options.
103. There will be no more agreement or even discussion between carriers on cost elements related to liner shipping under the ELAA Proposal. They will not form part of the carrier consultations or the forum discussions. The ELAA believes this may have unsettling effects on business, some of which can be overcome by at least ensuring transparent information of the cost elements behind these charges, so that shippers will understand what the charges are based on and negotiation of the charges will be founded on knowledge and not on speculation. In the following, the ELAA outlines the risks of total abolition of THCs and BAFs and how these to some extent could be overcome by increased transparency of cost factors.
THCs
104. THCs reflect a pure cost element. Conference THCs in Europe have in fact remained unchanged in Europe for the last 6-7 years, despite an increase in average terminal handling costs levied on the carriers. Today conference carriers only charge the shippers 80 percent of their terminal handling costs41 by way of THC and pay the remaining 20 percent out of the ocean freight revenue that they earn.
105. The idea behind a rule like the 80/20 rule is to make a fair split between the land and the sea part of the charge. The 80/20 split is based on the agreement between conferences and shipper association of 1989 (the CENSA agreement, see Annex 7 where the elements of the terminal costs were listed and defined as 24 items (plus some extra items for
40 Erasmus University, Survey on terminal handling charges and currency and bunker adjustment factors, 7
November 2005. 41 A charge per TEU corresponding to 80 percent of the average TEU cost of the conference members in that
port and on that trade.

30
special containers and dangerous goods), out of which three items were attributed to the carrier42 and two split equally between carriers and shippers.43
106. The advantages of publishing the general terminal cost elements are significant:
• It is the perception of the industry that customers do not wish to negotiate and pay this charge individually to the stevedore, and the THC pass-on has therefore been seen as a negotiation service from the carriers, in particular to smaller customers against a consolidated and congested stevedore market with significant bargaining power.44 For this reason, the Commission did not object to joint fixing of the charges. In addition, carriers pay the full terminal handling cost upfront and give shippers a credit period of approximately 60 days;
• Another benefit of an 80/20 split is that it applies equally between shippers, which avoids discrimination of smaller shippers with less bargaining power; and
• By abolishing the 80/20 split carriers will have to negotiate individually with each shipper and there may be different rules applying to different shippers, resulting in a much more cumbersome procedure in the terminals and less control of the location of containers in the terminals. Some carriers may decide that it is not worthwhile to provide this service and credit period to shippers, and let each shipper deal with the terminals individually. This will potentially create chaos in the terminals, where each shipper will need to track its container from gate to vessel.
107. In sum, abolition of the conference THC risks to create uncertainty in ports and significant bargaining power for the large shippers and terminal operators to the detriment of smaller players. This will likely lead to less efficient terminal handling, a more complex security clearance, higher risk of dislocation of cargo, higher and more volatile THCs and foreclosure of smaller actors. Admittedly, the solution in this Revised ELAA Proposal does not cover all these risks, but at least it will provide greater clarity and transparency of the charges currently levied upon carriers by the terminal operators. This will hopefully lead to a smoother negotiation of the level of the THCs or integration of THCs in the freight rate, and hence better chances for a continuation of efficient handling of goods port terminals.
Cost of Bunkering Vessels
108. Under the terminology used today, the cost of bunkering vessels is generally regulated in contracts by Bunker Adjustment Factors (BAFs). BAFs are adjustment factors for bunker costs. The purpose of BAFs is to hedge the risks for sharp fluctuations in bunker cost for carriers as well as transport users, which will serve to mitigate fluctuations in the overall freight rate. Today, the conference BAFs are a calculation of the increase or decrease in fuel cost per TEU on the trade in question, calculated on a formula based on a start date, average fuel price and average consumption per carried TEU. Based on this, the increase or decrease in the fuel price is calculated. Hence, the BAF is not always a positive
42 Move of container from ship’s rail into ship’s cell (including ship’s hold or deck), opening and closing of the
hatch covers including unsecuring and securing, and movement of hatch-covers from bay to bay or to quayside and v.v as well as the lashing of the container.
43 Physical and clerical terminal planning, etc, as well as overtime or public holiday extra working costs. 44 Even in 2002, when the stevedores were less concentrated, the Commission recognized in its Revised TACA
decision that “[t]ransport users, particularly those with only small volumes to be shipped, may benefit from this situation as carriers will generally have greater bargaining power vis-à-vis terminal operators and will be able to negotiate a price that is substantially lower than that which might have been obtained by the shipper”; Revised TACA, [2003] OJ L 26/53, Commission Decision of 14 November 2002, at para 96.
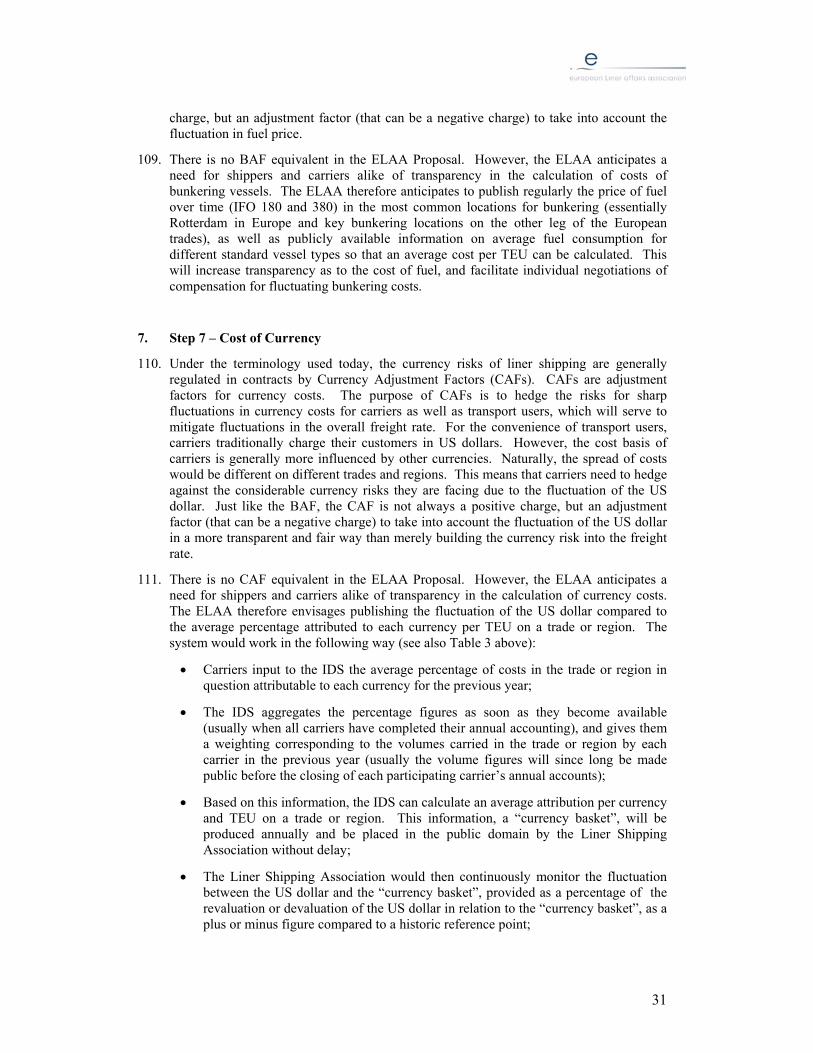
31
charge, but an adjustment factor (that can be a negative charge) to take into account the fluctuation in fuel price.
109. There is no BAF equivalent in the ELAA Proposal. However, the ELAA anticipates a need for shippers and carriers alike of transparency in the calculation of costs of bunkering vessels. The ELAA therefore anticipates to publish regularly the price of fuel over time (IFO 180 and 380) in the most common locations for bunkering (essentially Rotterdam in Europe and key bunkering locations on the other leg of the European trades), as well as publicly available information on average fuel consumption for different standard vessel types so that an average cost per TEU can be calculated. This will increase transparency as to the cost of fuel, and facilitate individual negotiations of compensation for fluctuating bunkering costs.
7. Step 7 – Cost of Currency
110. Under the terminology used today, the currency risks of liner shipping are generally regulated in contracts by Currency Adjustment Factors (CAFs). CAFs are adjustment factors for currency costs. The purpose of CAFs is to hedge the risks for sharp fluctuations in currency costs for carriers as well as transport users, which will serve to mitigate fluctuations in the overall freight rate. For the convenience of transport users, carriers traditionally charge their customers in US dollars. However, the cost basis of carriers is generally more influenced by other currencies. Naturally, the spread of costs would be different on different trades and regions. This means that carriers need to hedge against the considerable currency risks they are facing due to the fluctuation of the US dollar. Just like the BAF, the CAF is not always a positive charge, but an adjustment factor (that can be a negative charge) to take into account the fluctuation of the US dollar in a more transparent and fair way than merely building the currency risk into the freight rate.
111. There is no CAF equivalent in the ELAA Proposal. However, the ELAA anticipates a need for shippers and carriers alike of transparency in the calculation of currency costs. The ELAA therefore envisages publishing the fluctuation of the US dollar compared to the average percentage attributed to each currency per TEU on a trade or region. The system would work in the following way (see also Table 3 above):
• Carriers input to the IDS the average percentage of costs in the trade or region in question attributable to each currency for the previous year;
• The IDS aggregates the percentage figures as soon as they become available (usually when all carriers have completed their annual accounting), and gives them a weighting corresponding to the volumes carried in the trade or region by each carrier in the previous year (usually the volume figures will since long be made public before the closing of each participating carrier’s annual accounts);
• Based on this information, the IDS can calculate an average attribution per currency and TEU on a trade or region. This information, a “currency basket”, will be produced annually and be placed in the public domain by the Liner Shipping Association without delay;
• The Liner Shipping Association would then continuously monitor the fluctuation between the US dollar and the “currency basket”, provided as a percentage of the revaluation or devaluation of the US dollar in relation to the “currency basket”, as a plus or minus figure compared to a historic reference point;

32
• The percentage figure would provide transport users and carriers alike better knowledge of the importance of currency fluctuations in future individual contract negotiations.
112. There is an undoubted currency risk in liner shipping, as carriers as a customer service rely entirely on the US dollar on the income side, whereas the cost side depends more on the trade or region of operation. Liner shipping would not be a valid business unless carriers had a possibility to hedge against these considerable currency risks. Having an arrangement to mitigate the currency risks, as a positive or negative charge, results in shippers sharing part of this risk, but also leads to cost savings for shippers when the charge is negative.
113. In light of the transparency to shippers of this Revised ELAA Proposal, the ELAA submits that a reference point for this pass-on is beneficial to all industry stakeholders. The envisaged information of currency fluctuations would not be a charge, but result in shared knowledge of the average impact of the fluctuation of the US dollar in comparison to the “currency basket” which is characteristic for the trade or region in question.
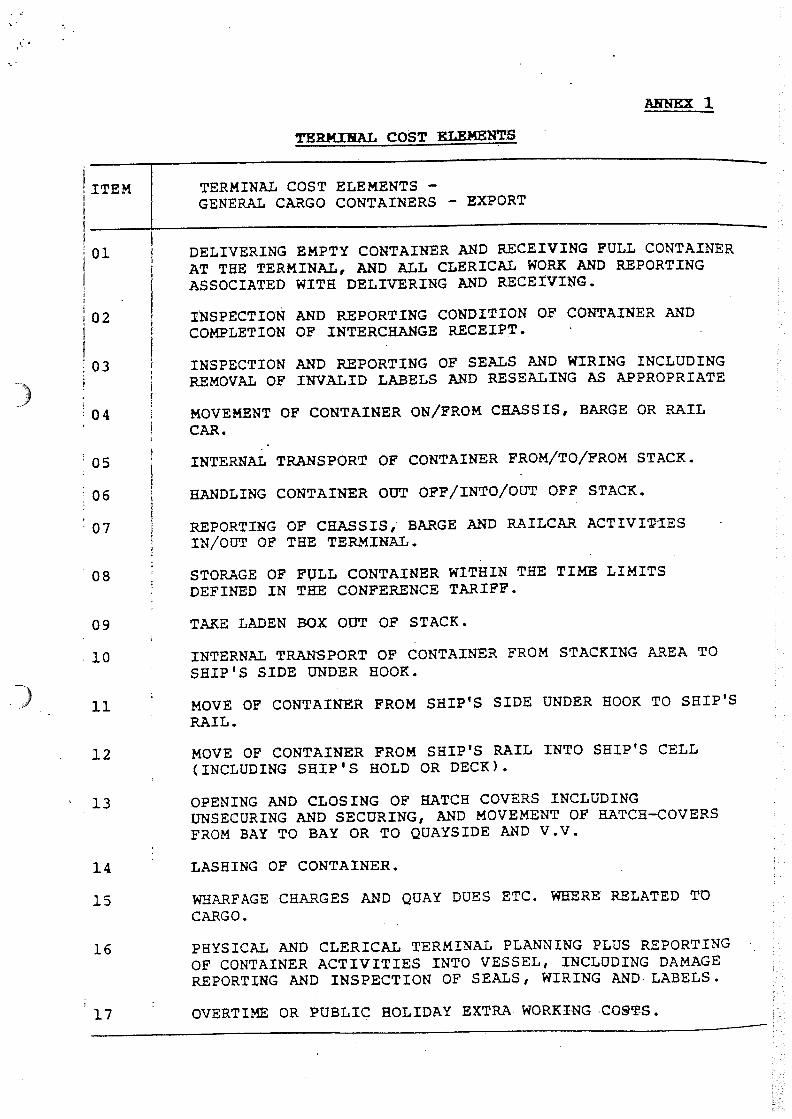

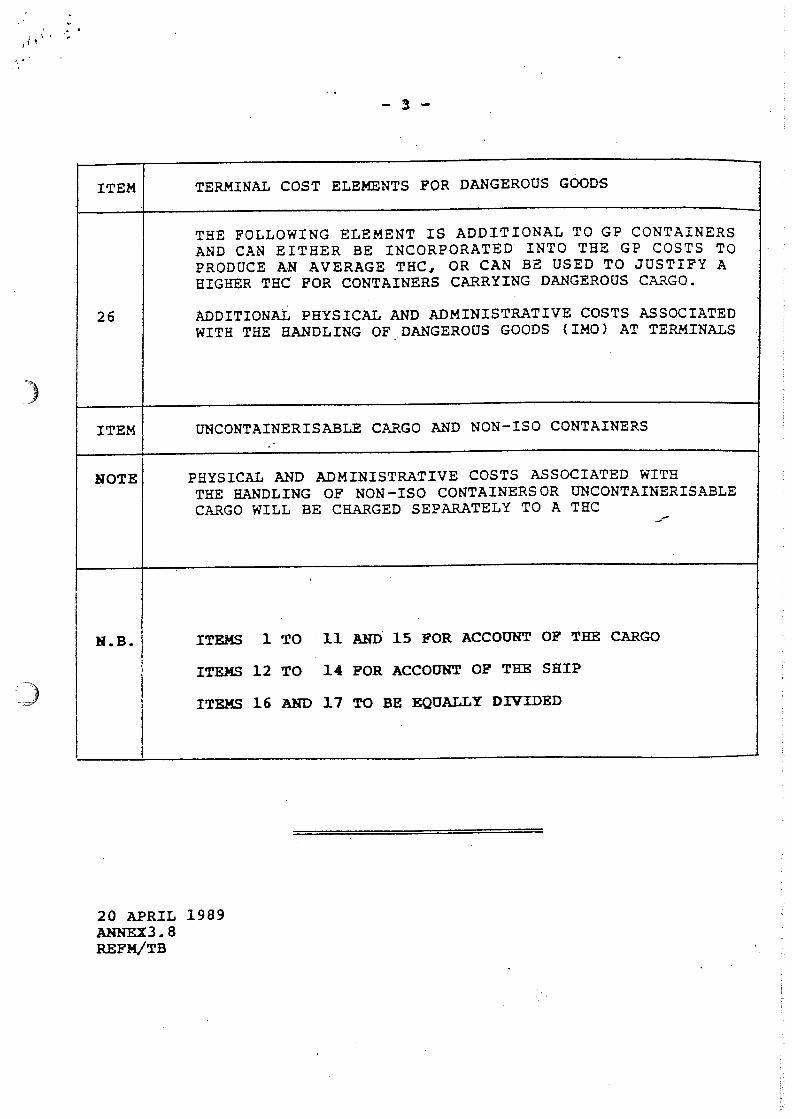

1
Revised ELAA Proposal
16 June 2006
Annex 8: Trade Information and Port Statistics
Port of Laem Chabang Lines advertising services
1. Samudera Indonesia Group is a wholly owned Indonesian company clients include COSCON, Evergreen, Hanjin, Hapag Lloyd, Maersk and UASC;
2. Evergreen services SLH and TH2 linking into Pelepas, they also share a service with
Safmarine, i.e. they use multiple feeder services including Safmarine and their own;
3. MEX (Middle East Express) is a joint service by PIL and CSC from Laem Chabang, linking in to Hong Kong and Singapore;
4. The Dragon Service is owned and run by NYK offering services to other lines including
HMM goes to Hong Kong;
5. The Grand Alliance1offers three weekly services from Laem Chabang – one to the US East Coast, one to the US West Coast and one into North Europe. All three link in to Singapore;
6. The New World Alliance2 offers a service into Singapore; 7. CMA offers a joint service to Pelepas with HUB Line – a Malaysian owned line which
operates on the intra-Asia market;
8. ACL offers a service to Singapore;
9. SYMS an Asia only carrier provides services into Hong Kong; 10. AAT provide a service to West Coast USA;
1 NYK, Hapag Lloyd, OOCL, MISC, 2 APL, MOL, HMM, CMA CGM,
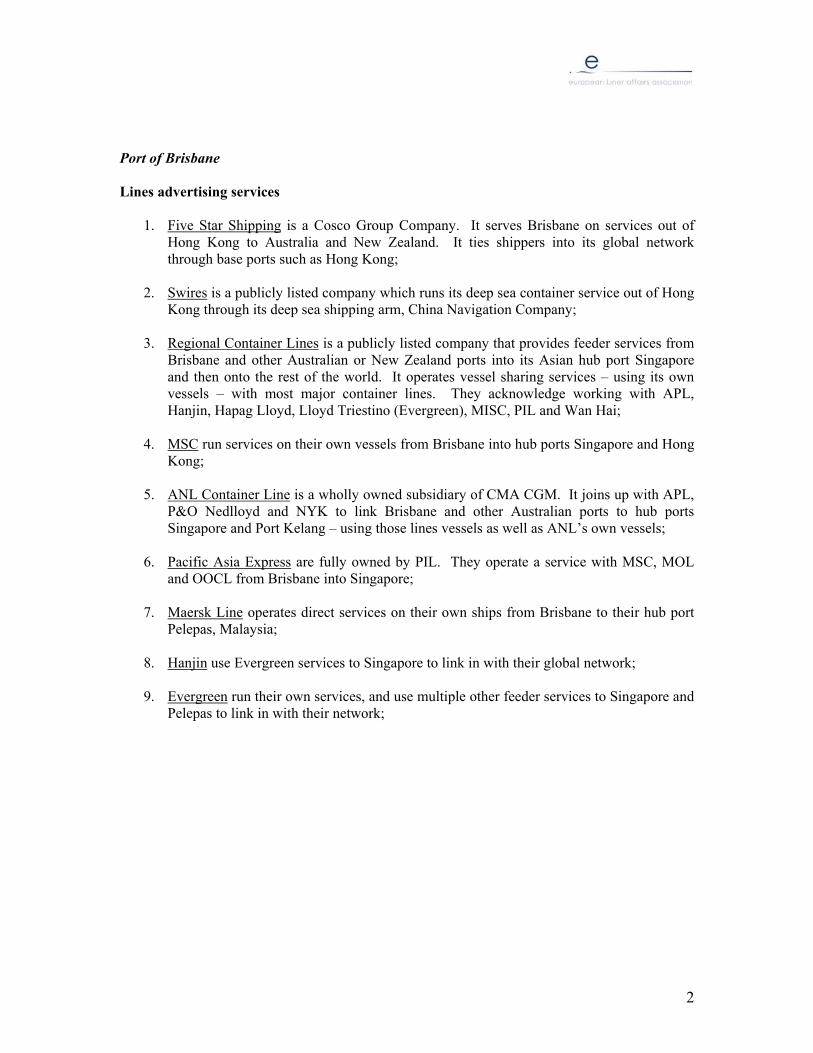
2
Port of Brisbane Lines advertising services
1. Five Star Shipping is a Cosco Group Company. It serves Brisbane on services out of Hong Kong to Australia and New Zealand. It ties shippers into its global network through base ports such as Hong Kong;
2. Swires is a publicly listed company which runs its deep sea container service out of Hong
Kong through its deep sea shipping arm, China Navigation Company;
3. Regional Container Lines is a publicly listed company that provides feeder services from Brisbane and other Australian or New Zealand ports into its Asian hub port Singapore and then onto the rest of the world. It operates vessel sharing services – using its own vessels – with most major container lines. They acknowledge working with APL, Hanjin, Hapag Lloyd, Lloyd Triestino (Evergreen), MISC, PIL and Wan Hai;
4. MSC run services on their own vessels from Brisbane into hub ports Singapore and Hong
Kong; 5. ANL Container Line is a wholly owned subsidiary of CMA CGM. It joins up with APL,
P&O Nedlloyd and NYK to link Brisbane and other Australian ports to hub ports Singapore and Port Kelang – using those lines vessels as well as ANL’s own vessels;
6. Pacific Asia Express are fully owned by PIL. They operate a service with MSC, MOL
and OOCL from Brisbane into Singapore; 7. Maersk Line operates direct services on their own ships from Brisbane to their hub port
Pelepas, Malaysia; 8. Hanjin use Evergreen services to Singapore to link in with their global network; 9. Evergreen run their own services, and use multiple other feeder services to Singapore and
Pelepas to link in with their network;

3
Port of Charleston Lines advertising services
1. MSC provides services from Charleston to Europe, South Africa, Australia, New Zealand, South America;
2. COSCO offers services to main ports in Asia and Europe, and provides space for a
number of other carriers as seen below; 3. K Line provides services to Hong Kong into its global network, and to China and Japan
using COSCO vessels; 4. Hanjin uses feeder services provided by Senator line to other North American ports then
onto its network; it provides direct connections to Pusan;
5. CMA CGM has a weekly joint service with APL from India and Sri Lanka into Charleston and other US East Coast ports; they have a weekly joint service with China Shipping from North Europe;
6. Evergreen runs a number of services out of Charleston into Hong Kong, using its own
vessels, as well as those of MOL, APL and Zim; they also run direct, regular services from the US West Coast, through Charleston, the US East Coast and into North Europe;
7. APL runs services to North Europe and Asia out of Charleston, linking into its major
hubs;
8. Wallenius Wilhelmsen offers weekly services to and from North Europe;
9. Maersk offers direct services to hubs in Hong Kong and Rotterdam 10. CSAV offers services to Rotterdam; 11. NYK offers services via Savannah into major hubs around the world; 12. Alianca/ Hamburg Sued offer services to South America East and West Coasts, and
through Savannah to ports around the world; 13. Hapag Lloyd offers services to hubs in Europe with the Grand Alliance; 14. Hyundai Merchant Marine offers services to hubs in Europe and Asia, using MOL, APL,
Maersk and its own vessels; 15. OOCL offers services to main ports in Europe;
16. Yang Ming offers services to hub ports in Asia using COSCO vessels;
17. Zim offers services to hub ports in Asia;

4
Port of Santos Lines advertising services
1. APL offers services to North America, linking into its global network through hubs in New York and Savannah;
2. China Shipping offers services to its hub in Hong Kong;
3. CMA CGM offers services, using China Shipping vessels to Hong Kong, using
Hamburg Sued vessels to Rotterdam, and further services out of the Mediterranean;
4. CSAV offers services to main ports in Europe;
5. Evergreen offers services to Singapore and Shanghai, to New York and Charleston 6. Hapag Lloyd offers services to hubs in Europe and Asia;
7. K Line offers services to North American main ports using vessels operated by MOL,
Zim;
8. MSC offers services to main ports in Europe and North America;
9. NYK offers services to main ports in Europe using its own and CSAV vessels;

5
Port of Durban
1. CMA CGM offers services to hubs in China; 2. Evergreen offers services to hubs in China; 3. Hamburg Sued offers services to hubs in China;
4. MISC offers services to hubs in China with the Grand Alliance;
5. MSC offers services to main ports in the sub-continent, in Europe, in Asia, in Oceania,
America and Asia;

6
Port of Antwerp Lines advertising services
1. APL/NOL offers services to Hong Kong and Singapore; 2. CMA CGM offers services to hubs in Asia using China Shipping vessels, to the Middle
East and Sub-continent, to Japan on MOL vessels; 3. COSCO offers services to hubs in China; 4. Evergreen offers services to hubs in China using China Shipping vessels; 5. Hamburg Sued offers services to Australia and New Zealand, to the sub-continent on a
slot charter with CMA CGM; 6. Hanjin offers services to China using COSCO vessels, it also offers services to its global
network through feeder services to Rotterdam; 7. Hapag Lloyd offers services to the sub-continent and into Rotterdam to link into its
global network; 8. Hyundai Merchant Marine offers services to its hub in Rotterdam and into its global
network;
9. K Line offers services to North American main ports using COSCO and Zim vessels;
10. MISC offers services to hub ports in Asia and onto its global network;
11. MSC offers services to ports in all continents;
12. NYK offers services to hub ports in Asia, and other continents;
13. OOCL offers services to North America and to Asia;
14. UASC offers services through Giao Tauro into its global network
15. Yang Ming offers services to mainland ports in China using COSCO vessels, or using its own vessels through Rotterdam;
16. Zim offers services to hub ports in Asia;
17. Another thirty or so medium to small sized carriers offer services out of Antwerp,
including feeder services to other major European ports’
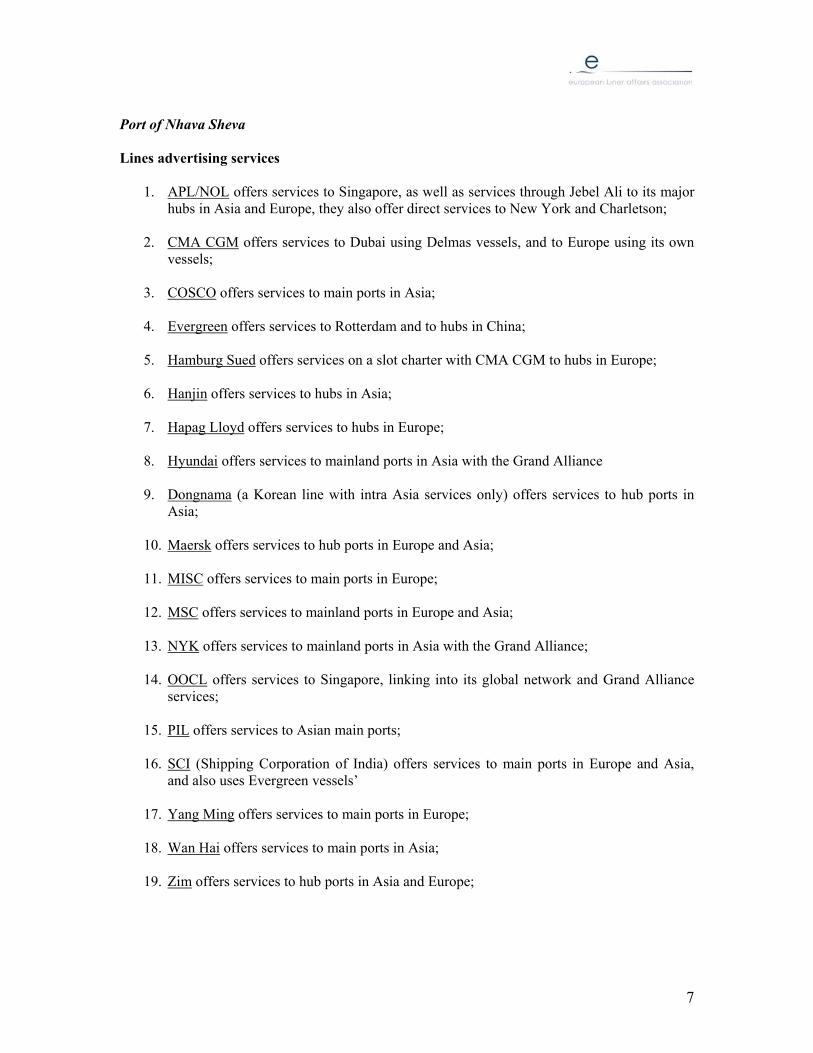
7
Port of Nhava Sheva Lines advertising services
1. APL/NOL offers services to Singapore, as well as services through Jebel Ali to its major hubs in Asia and Europe, they also offer direct services to New York and Charletson;
2. CMA CGM offers services to Dubai using Delmas vessels, and to Europe using its own
vessels;
3. COSCO offers services to main ports in Asia; 4. Evergreen offers services to Rotterdam and to hubs in China; 5. Hamburg Sued offers services on a slot charter with CMA CGM to hubs in Europe; 6. Hanjin offers services to hubs in Asia; 7. Hapag Lloyd offers services to hubs in Europe;
8. Hyundai offers services to mainland ports in Asia with the Grand Alliance 9. Dongnama (a Korean line with intra Asia services only) offers services to hub ports in
Asia;
10. Maersk offers services to hub ports in Europe and Asia;
11. MISC offers services to main ports in Europe;
12. MSC offers services to mainland ports in Europe and Asia;
13. NYK offers services to mainland ports in Asia with the Grand Alliance;
14. OOCL offers services to Singapore, linking into its global network and Grand Alliance services;
15. PIL offers services to Asian main ports;
16. SCI (Shipping Corporation of India) offers services to main ports in Europe and Asia,
and also uses Evergreen vessels’ 17. Yang Ming offers services to main ports in Europe;
18. Wan Hai offers services to main ports in Asia;
19. Zim offers services to hub ports in Asia and Europe;
Revised ELAA Proposal
16 June 2006
Annex 9: Comparison with the Air Transport Industry
DG Comp has on a number of occasions stated that the liner shipping industry is comparable to air transport. While it is true that there are similarities between the two industries, there are also crucial differences. As the ELAA has previously stated, the liner shipping industry has a unique blend of characteristics that require a sector-specific legal instrument to enable the industry to operate efficiently and provide the stability of supply that it seeks and European trade requires, including:
• Scheduled services;
• Economies of scale and density;
• Capacity indivisibilities;
• High fixed but avoidable costs;
• Low short-run marginal costs;
• Relatively mobile capital;
• Relatively low sunk costs for a capital-intensive industry;
• Low entry barriers (and low barriers to expansion);
• Divisible and variable demand;
• Periodic supply;
• Customers benefiting from higher frequency of service;
• Customers benefiting from availability of space;
• Relatively inelastic market demand; and
• Low switching costs and highly elastic carrier demand.
When comparing the liner shipping industry with air transport, one has to bear in mind that air transport must be divided into two categories: passenger traffic and cargo traffic. Passenger traffic is by far the most important of the two, and the main driver for investment. We will deal with both sectors in turn.
Another important fact to bear in mind is that air transport liberalization is not a success story example. Cutthroat competition has had a devastating impact on the industry – in particular in the US where most consolidation has taken place. The majority of the US global network carriers are currently operating under bankruptcy protection, and it was only thanks to large governmental funding that the airlines survived recent backlashes to the industry such as the 11 September 2001 terror events.
Likewise, in Europe, the state of many of the network carriers is still far from stable, with the recent governmental restructuring aid to Alitalia as one example.

2
The liner shipping industry has managed to provide reliable services at all times without such governmental financial support. However, it is unlikely that it would have succeeded without industry cooperation.
Passenger traffic
The market is highly concentrated: The relevant market for passenger traffic is a city pair. In most of these markets (at least where indirect flights are not seen as a viable alternative) there are one or two players active. The EC Commission has still on numerous occasions allowed mergers or cooperation agreements (including price and capacity) between duopoly carriers, as long as the carriers have provided remedies allowing for potential entry, mostly consisting of commitments to give up slots to new entrants.
As the ELAA has pointed out, the concentration in the liner shipping industry is generally low.
There are significant barriers to entry: Despite efforts from the Commission to liberalize the air transport market, there are still regulatory barriers to start operations from the EEA to third countries. Bilateral agreements between countries usually restrict traffic between the countries to carriers owned by interests in one of the two countries, and usually do not allow cabotage of a foreign carrier.
Moreover, an increasing number of important airports are facing serious congestion problems, in particular during certain peak hours. Entry becomes difficult as carriers have “grandfather rights” to their slots.
As the ELAA has pointed out, there are no such regulatory barriers to entry in liner shipping.
Pricing and other strategic decisions are transparent: There is excellent data available for passenger traffic. Carriers have access to MIDT data which provide the exact number of passengers per carrier sold by the Computerized Reservation Systems, and airports, airport authorities or statistical bureaus often publish exact data of passenger traffic on an airport to airport basis and by aircraft, including low-cost carriers. Although there is an increased number of direct sales through the Internet, in particular for low-cost carriers, the data available gives a good idea of general load factors per route, and current and near future capacity per route is publicly available information.
Also the pricing policies of competitor air carriers are somewhat transparent. The MIDT data provides bookings per booking class. Different “web-scraping” services provide subscribing carriers with real-time fare levels of competitors, although the yield management systems may not be transparent.
For all these reasons, air carriers as well as external consultants have excellent information to produce reports on volume developments per city pair.
As the ELAA has pointed out, there is a lack of reliable data in the liner shipping industry, and in many trades, the only source of useful information is the conference secretariat.
Air carriers engage in significant information exchanges: Airlines wishing to provide a network service, as opposed to the point-to-point services offered primarily by low-cost carriers, need to cooperate through one of the three major global alliances. The level of cooperation may vary to a significant extent between alliances and within alliances. Many carriers enter into bilateral strategic alliance agreements within the global alliance. These alliances differ significantly from alliances in the liner shipping industry, as they are not merely operational but also commercial, and in the case of immunized alliances such as SkyTeam and Star result in the elimination or reduction of competition between the participating carriers.

3
As the ELAA has pointed out, liner shipping alliances are operational in scope, and alliance members remain fierce competitors.
Air passenger carriers also enjoy a block exemption for tariff consultation within IATA, which is currently under review. The information exchange within IATA differs significantly from the Revised ELAA Proposal as it allows discussion and agreement on fares for interlining, without any input or influence of customers.
Air carriers do not have the same needs as liner carriers – difference in elasticity of demand: The demand for liner shipping is relatively inelastic, in particular for short-term. Over time, manufacturers will locate their production plants where it is most profitable. In that way, low transport prices have driven increased demand through globalization. The situation for air passenger transport is different. Airlines can, in times of over-supply, create new demand by offering low fares to leisure passengers, something which is obvious through the success of Southwest in the US and Ryanair in Europe.
Air carriers do not have the same needs as liner carriers – difference in logistics: Whereas the liner shipping companies need to be sure that all the components of a complex supply chain work, air passenger traffic only needs to worry about the airport to airport service. In order to provide an attractive network, airlines need to and do engage in joint scheduling for connecting flights, but that is really all that is needed.
Air carriers do not have the same needs as liner carriers – different investments risks: In times of unexpected increases in demand, air carriers have, to a much larger extent than liner carriers, the option to charter airplanes from speculative purchasers like GECAS. In liner shipping, such short-term chartering has proved not to be available in times of high demand, and not at all for large vessels. Chartering long-term is an issue of financing – a totally different story which in no way can be used to quickly increase supply. Liner carriers are tied into very strict binding contracts with charterers, often before building is undertaken. For example, the German KG financing scheme requires an agreement with carriers before the order to build a vessel is given (i.e. more than 90% of all vessels are only built on commitment). A vessel takes 3 years to build. Big ships are not kept in stock. Only the smaller vessels (i.e. below 3,000 TEU) are sometimes built speculatively. These are never used in big markets such as China, however. In conclusion, chartering does not allow to expand service more rapidly than ownership. A suitable vessel cannot be chosen like an airplane.
Cargo traffic
Air cargo traffic is by nature more similar to liner shipping than passenger traffic, but there are still enormous differences. One only needs to look at the size of the logistics in a seaport compared to an airport, or the size of a container compared to a FedEx cartonboard box, or an 8,000 TEU vessel compared to an airplane, to realize that the logistics of container traffic is far more complex than air cargo traffic.
Air cargo traffic is relatively small compared to passenger traffic, and the airplanes used are to a large extent the same, in fact many passenger carriers combine their services with cargo operations on the same flights.
This interchangeability between air passenger and air cargo traffic makes the issue of demand forecasting far less sensitive for air cargo carriers. Combined air cargo and passenger carriers can easily swap
4
between the two, and specialist cargo carriers can easily buy, lease or sell aircrafts to adjust to unexpected demand developments.
Therefore, what was stated above regarding elasticity of demand and investment risks for air passenger traffic applies also to air cargo.
Liner carrier vessels are specially built for container traffic, with an approximate three-year lead-time between the decision to build and the vessel coming into operation. As the ELAA has previously pointed out, a situation of insufficient supply would have horrific consequences for world trade.
Conclusion
Analogies between air transport and liner shipping are imperfect, to say the least. The liner shipping industry is unique also in comparison with other transport industries. The Revised ELAA Proposal is necessary for liner carriers because:
• The logistics chain cannot be managed without accurate timely data and industry wide discussions;
• Customers demand it;
• Capacity deployment cannot be managed without accurate timely data and industry wide discussions; and
• Capacity investment is difficult and misinterpretation of data has the potential of having devastating consequences for world trade. Accurate data and the discussion of it provides the best possible platform for carriers to make their investments.
The situation in the air transport industry is entirely different.
• Air transport does not have the complex logistics of liner shipping;
• The importance of investment is more relevant to the main driver of that industry, which is passenger traffic. Passenger traffic demand forecasting is much easier than liner shipping due to better data available (concentrated markets with extensive cooperation agreements, publicly available passenger data and fares);
• Passenger traffic demand is much more elastic than liner shipping demand; and
• Air carriers have the possibility to short-term lease aircraft.

The Tramp Shipping Market
Produced by Clarkson Research Studies April 2004
This report is presented as an economic description of the Tramp shipping market. Clarkson Research has no experience of the terms or expressions used under competition law.
This report has been prepared by Clarkson Research and com-missioned by the European Community Shipowners' Associa-tions (ECSA) (supported by the International Chamber of Ship-ping). Data in this publication is prepared by Clarkson Research Stud-ies for the use of Clarkson subscribers and may not be repro-duced without the written permission of Clarkson Research Studies. The information contained in this report is believed to be correct but the accuracy thereof is not guaranteed and the Company and its employees cannot accept liability for loss suf-fered in consequence of reliance on the information contained herein. This report does not obviate the need to make further appropriate enquiries and inspections.

Clarkson Research Studies 1 April 2004
Executive Summary
1. This report is intended to provide a briefing on the organization and competitive economic structure of the tramp shipping industry.
The nature of the world shipping business 2. The international shipping industry transported 6.2 billion tonnes of cargo in 2003
(Table A1.4), with a fleet of 26,280 deep sea cargo ships (see Table 3 below). With the exception of the cruise and ferry business, shipping companies mainly serve industrial customers not consumers (paragraph 2.1, p9).
3. Merchant Shipping is an international service. The ships, which are the primary
business unit, are owned by 4,795 companies with an average of 5 ships each (see table above); registered under 144 different flags; and subject to international and port state regulations. The business is conducted in international market places using the US dollar as currency with has no tariffs or other impediments to free trade.
MAIN CHARACTERISTICS OF THE TRAMP MARKET
1. Globally competitive markets 2. Close to perfect competition model 3. Different sub-market segments in response to customer needs 4. Competition between sub-market segments for cargo 5. Volatile and unpredictable demand 6. Many small entrepreneurial shipping companies 7. Global ship trading patterns including “cross trades” 8. Ease of entry and exit 9. Very cost effective 10. Responding to the development of markets and shippers’ needs
Merchant fleet by company sizeCompany Size World Fleet European Union Owners
#Companies # Ships m. Dwt Avg. Ships #Companies # Ships m. Dwt Avg. Ships (# owned vessels)
300+ 4 2,099 59.5 525200-299 3 794 40.3 265 1 261 12.7 261100-199 9 1,201 61.4 133
50-99 45 3,010 124.0 67 14 912 30.4 6510-49 469 8,898 321.8 19 193 3,772 136.5 20
5-9 584 3,856 107.2 7 245 1,612 52.2 72-4 1,404 3,731 73.3 3 460 1,246 32.6 30-1 2,277 2,194 23.3 1 538 503 8.0 1
Unknown 497 7.1 17 0.5Total 4,795 26,280 817.9 5 1,451 8,323 272.9 6
Includes deep sea vessels, including bulk, specialised and linerSource: Clarkson Research Studies

Clarkson Research Studies 2 April 2004
4. The deep sea trades are served by about 3000 ports and the cargo carried by the shipping industry consists of many millions of separate consignments, of different sizes and with different physical characteristics (Figure 2, p11). Providing an efficient transport service between ports for this wide range of cargo parcels calls for a complex logistics operation, which the shipping industry has developed to handle.
5. The ships themselves are expensive, with some gas ships costing over $100
million each (Table A1.2, p31) and they have an economic life of over 20 years. Earnings are highly volatile and this makes the investment process in shipping both risky and complex. One of the primary functions of shipowners is to manage this investment process.
6. The commodities carried by sea cover energy products; agricultural products; raw
materials for the steel industry; forest products; industrial materials including chemicals; textiles machinery and consumer goods (Figure 1, p10).
7. Trade growth is influenced by the world business cycle and is very volatile and
unpredictable. Keeping an adequate supply of ships at all times is essential for the free flow of world trade and one of the principal roles of the shipping industry is to invest in anticipation of future growth. Given the complexity of the cargo flows to be transported, this difficult task is tightly controlled by market forces.
The global sea transport system
8. The transport system the shipping industry has developed to carry this diverse
range of commodities involves several separate but overlapping segments of the shipping business, each handling a different group of trades. This specialization is based on parcel size (i.e. the size of the individual consignment of cargo) and the cargo’s physical characteristics (section 3.3, p11).
9. The industry can be divided into three broad segments, each of which handles a
specific set of cargoes.
a. Bulk shipping; handles large cargo parcels in "bulk carriers" and oil tankers designed for the efficient transport of the very large parcels (10 to 450,000 tonnes) of homogeneous cargoes such as iron ore, coal, grain, oil etc.
b. Specialized shipping transports large quantities of "specialized" trades (e.g. chemicals, gas, motor vehicles, forest products), generally using ships built for the purpose. Although these ships are purpose built, they are often designed to allow the carriage of other cargoes. Specialized cargoes are often subject to competition from both the liner and bulk shipping segments.
c. Liner shipping; specializes in the transport of small cargo parcels, which do not fill the hold of a ship, on regular services. Today most liner cargo is

Clarkson Research Studies 3 April 2004
carried in containerships, but some are still transported in multi-purpose vessels or ro-ros.
10. In this report we refer to the bulk and specialized shipping segments collectively
as “tramp” shipping.
The “tramp” shipping competitive process
11. Although freight rates are highly volatile, with extremes in both directions, on average transport costs fell by 80 per cent in real terms during the second half of the 20th century (see Figure 5, p16). This demonstrates the long term cost effectiveness of the tramp shipping business.
12. During the 1990s major cargo shippers such as the oil companies and large liner
companies progressively reduced their owned fleets (Figure 7, p18), preferring to rely on the tramp market and to charter ships when required. This strategy was partly motivated by liability concerns; but the low return on capital from shipowning (by the standards of international corporations) and the flexibility offered by the charter market were also important. It may be taken, therefore, as evidence of the highly competitive nature of the tramp market.
13. Tramp shipping revenues are determined competitively in the international market
place, generally through the well developed network of shipbrokers and agents to transact the business. However the precise nature of the process differs for the bulk, and specialized segments.
14. The bulk shipping markets are highly competitive, and satisfy many of the
characteristics of the perfect competition model. The commodity is homogeneous; entry costs are very low; many companies are competing for business (arguably each ship is a separate competitive unit); and information flows make the markets very transparent. Business is carried out in four different ways, the voyage charters (Section 9.2, p23); consecutive voyage charters (Section 9.3); contracts of affreightment (Section 9.4); and time charters (Section 10, p25). The freight rates achievable in these markets are highly volatile, depending on market circumstances (Table A1.5, p33). Typically bulk shipping freight rates are twice as volatile as the US S&P 500 stock index.
15. The specialist shipping markets generally have fewer customers and fewer
shipping companies (Table A1.2, p31). Since the aim is to provide an improved service to these clients, there is sometimes a degree of product differentiation. However there is intense competition between specialized shipping companies, and outside competitors (for example small tankers compete for chemical parcels or containerships competing for reefer or vehicle business).
16. The liner business serves a range of clients from substantial shippers who enjoy
service contracts to intermediaries which group cargoes to negotiate volume

Clarkson Research Studies 4 April 2004
discounts and with whom the liner companies compete for shipper support. As the cargo capacity of containerships has got bigger, there has been intense competition between the liner, bulk and specialized segments for specific commodities, especially reefer cargo.
Commercial organization of “tramp” shipping
17. General market structure: The commercial structure of the shipping business is
very fluid, allowing free entry and exit of companies. In April 2004 the deep-sea merchant fleet (including bulk, specialized and liner fleets) was owned by 4,795 companies (Table 3). Only 16 of these companies (0.25%) owned more than 100 ships and the average shipping company had 5 ships. The ownership structure of the individual tramp sectors is shows in appendix 2 (p35) and table A1.2 (p30). These ships are often spread over several market segments. Consequently the bulk shipowners are generally in the position of price takers, being too small to influence the overall market. An analysis of 7,000 Dry Cargo fixtures found that 97% of the owners had a market share of less than 0.5 per cent of the fixtures.
18. Ease of entry: Tramp shipping has relatively few barriers to entry. New investors
require equity, but commercial shipping banks will provide loans to acceptable credits against a first mortgage on the ship. There is a comprehensive network of support services to which new investors can subcontract most business functions (subject to sound management controls). Ship management companies will manage the ships for a fee; chartering brokers arrange employment, collecting the revenues and dealing with claims; sale and purchase brokers will buy and sell ships; maritime lawyers and accountants undertake legal and administrative functions; classification societies and technical consultants provide technical support.
19. These services make it easy for new investors to enter segments of the bulk
shipping markets during profitable periods (example - two of the largest tanker companies operating today were only set up in 1997). In addition shipowners in one segment will move into new markets if they see an investment opportunity (example - recently several oil tanker companies have ordered LNG tankers). However some specialist sectors require specialist expertise which is difficult to acquire quickly.
20. Information availability: Information systems in bulk shipping business are very
open, giving buyers and sellers of ships, operators and charterers a timely flow of commercial data. Information about revenues and asset prices are published daily and widely circulated in the industry to both shipowner's and charterers by the shipbroking business and information publishers. These information services ensure a high degree of transparency. In addition the costs of operating different types of ships are well known (several companies publish reports documenting them) making it easy for potential investors to estimate prevailing profit levels.

Clarkson Research Studies 5 April 2004
21. Shipping pools operate in every sector of the tramp shipping business. A "pool" is a collection of similar vessels, under different ownerships, operating under a single administration. The pool managers market the vessels as a single, cohesive fleet unit, collect their earnings and distribute them under a pre-arranged "weighting" system. Pools are generally developed for two reasons. Firstly to allow participants to provide the service levels required by their major customers. Secondly to improve transport efficiency by special investment and increased ship utilization e.g. by arranging backhaul cargoes more effectively than a small group of ships could do.

Contents Sheet
Introduction to Tramp Shipping
1. Introduction 8
1.1 Methodology ..........................................................................................................................8 2 The product provided by the shipping industry 9
2.1 The transport service ..............................................................................................................9 2.2 The commodities traded by sea..............................................................................................9
3 Organization of the demand for sea transport 10 3.1 The liner and tramp system..................................................................................................10 3.2 Development of specialized shipping services 1950-2000 ..................................................11 3.3 The influence of cargo parcel size on ship demand .............................................................11 3.4 Parcel size characteristics of commodities shipped by sea .................................................12
3.4.1 Bulk shipping ...................................................................................................... 12 3.4.2 Specialised Shipping............................................................................................ 13 3.4.3 Liner Shipping .................................................................................................... 14
4 Differentiation of sea transport demand 15 4.1 Price and service aspects of sea transport demand...............................................................15 4.2 The cost of freight by region................................................................................................16 4.3 Long term trends in the cost of bulk transport .....................................................................16
5 The Supply of Sea Transport 17 5.1 The world merchant fleet .....................................................................................................17 5.2 National registration of the world merchant fleet ................................................................17 5.3 Competition between types of ship in the cargo fleet .........................................................17 5.4 The cargo handling economics & competition ....................................................................18
6 Sea Transport risk & investment strategy 18 6.1 The risk management system ...............................................................................................18
7 The companies involved in the shipping business 19 7.1 Shipping Companies and support services...........................................................................19
8 Definition of the Shipping Markets 21 8.1 The four markets where cargo and ships are traded.............................................................21 8.2 The role of market cycles in the competitive process ..........................................................22
9 “Voyage Charter” Contract 22 9.1 Negotiating & concluding a freight contract........................................................................22 9.2 The voyage charter...............................................................................................................23 9.3 The Consecutive Voyage Charter (CVC).............................................................................23 9.4 The Contract of Affreightment (COA).................................................................................24 9.5 Main contract terms (voyage charter party) .........................................................................24
10 “Timecharter” Contracts 25 10.1 Procedures for time chartering a ship.................................................................................25 10.2 The timecharter trip............................................................................................................25 10.3 The period timecharter .......................................................................................................26 10.4 Main contract terms (timecharter).....................................................................................26
11 The Bareboat Charter Contracts 26
Clarkson Research Studies 7 April 2004
12 Market Reporting & Information Flow 26 13 The Sale and Purchase Market 26
13.1 Procedure for buying and selling a ship .............................................................................26 13.2 How ship prices are determined .........................................................................................27
14 Comments on Cooperation in Bulk & Specialized Sectors 27 14.1 The principles of cooperation in shipping..........................................................................27 14.2 Types of alliances:..............................................................................................................27 14.3 Joint venture agreements:...................................................................................................27 14.4 Pool arrangements:.............................................................................................................28
Appendices A1. Summary Tables 29 A1.1 Total Fleet Ownership Profile……………………………………………………………...30 A1.2 Fleet Summary...…………………………………………………………………………....31 A1.3 Total World Fleet…………………………………………………………...…………..…..32 A1.4 World Seaborne Trade…………………………………………………………….………..32 A1.5 Shipping Market Volatility…………………………………..…………………..…………33 A1.6 Glossary of terms…………………………………………………………………………...34 A1.7 World Fleet by Owner Country…………………………………………………………….34 A2. Overview of the Tramp Shipping Market Segments 35 A2.1 Bulk Carrier Market Profile…………….….……….……………………………………...36 A2.2 Forest Products Carrier Market Profile.….………….……………………………………..38 A2.3 Crude Oil Tanker Market Profile………………………………………………………......40 A2.4 Oil Products Tanker Market Profile…………………………………………………….….42 A2.5 Chemical Tanker Market Profile………………………………………………………..….44 A2.6 LPG Market Profile………………………………………………………………………...46 A2.7 LNG Market Profile…………………………………………………………………….….48 A2.8 Reefer Market Profile………………………………………………………………………50 A2.9 Ro Ro Market Profile………………..……………………………………………………..52 A2.10 PCC Market Profile……………………………………………………………………….54

Clarkson Research Studies 8 April 2004
1. Introduction
1.1 Methodology1 Since the main purpose of this analysis is to provide a clear basis for discussing competitive
conditions in the tramp shipping market, we have structured the analysis to focus on the traditional perfect competition supply/demand model which many economists2 believe operates in some segments of the tramp market, but not fully in others. The shipping market segments discussed in this paper are summarized in Table 13 below. This divides them into three broad groups, Bulk Transport; Specialised transport; and Liner. Although the study is specifically not concerned with the liner business, we have included this segment because there is competition between the segments for some cargoes.
In this paper the aim is to describe the characteristics of the tramp shipping market.
The key issues we focus on are: -
1. Type of product: the aim here is to briefly describe the product offered by each of the 15 segments of the market and how they mutually overlap.
2. Differentiation: the degree of differentiation th exists in the transport product offered (in competitive terms differentiation offers the opportunity to reduce market size).
3. Number of firms: this measures the number of companies in the Segment. The plan in due course is to quantify this column. A point made in the text is that in many cases the competitive unit is, in effect, the ship not the company.
4. Entry Conditions: measures how easy it is for an outsider to become a viable force in the business.
1 It should be stressed that there is no clear cut distinction between bulk, specialized and liner services. For example companies “specializing” in carrying forestry products and refrigerated cargoes would do so in competition with "pure container line services", and at the same time be competing for other parcel shaped cargoes and also traditional "bulk cargoes" in the tramp market to reposition the vessel. 2 Shipping is often cited as an industry that displays the characteristics of perfect competition. 3 It should be stressed that there are differing degrees of specialization of the vessel types listed in Table 1. Ro Ro carriers could be categorized as specialized rather than liner.
Table 1: Shipping market segments by vessel type1. Bulk Transport 2. Specialised Transport 3. Liner Transport
Bulk carriers Forest Product Carriers ContainershipsCrude oil tankers Vegoil tankers Multipurpose shipsProduct tankers Chemical Carriers Ro Ro carriersCombos Gas Carriers Ro Ro freight carriers
LPG Carriers Ro Ro trailer carriersLNG CarriersReefersCar/vehicle carriersRo Ro carriers

Clarkson Research Studies 9 April 2004
2 The product provided by the shipping industry
2.1 The transport service In 2003 the shipping industry transported 6.2 billion tons of cargo with a deep sea fleet (ships
mainly over 2,000 dwt including bulk, specialised and liner) of 26,000 cargo ships. Another 40,000 service vessels are engaged in fishing, research, port services and the offshore industry. The annual freight revenue of the cargo transport business in 2000 was $380 billion and annual investment in new ships was $34 billion, with another $8 billion a year spent on second-hand ships4.
With the exception of the cruise and ferry businesses, shipping serves industrial customers not consumers. The clients include large corporations like oil companies, chemical companies, steel mills, car manufacturers, sugar refiners, traders and a host of other manufacturing companies which source raw materials and distribute their products in the international market. The product sold is sea transport.
2.2 The commodities traded by sea The shipping industry transports everything from a 4 million barrel parcel of oil to a cardboard
box of Christmas gifts. The main seaborne commodity trades are shown in Figure 1 arranged into six groups reflecting the area of economic activity to which they are most closely related. These groups can be summarized as follows:
1. Energy trades: Energy dominates bulk shipping. This group of commodities, which accounts for close to half of seaborne trade, comprises crude oil, oil products, liquefied gas and thermal coal for use in generating electricity.
2. Agricultural trades: A total of twelve commodities, accounting for 13 per cent of sea trade, are the products or raw materials of the agricultural industry. They include cereals such as wheat and barley, animal feedstuffs, sugar, molasses, refrigerated food, oil and fats and fertilizers.
3. Metal industry trades: This major commodity group, which accounts for 25 per cent of sea trade, including raw materials and products of the steel and non-ferrous metal industries, including iron ore, metallurgical grade coal, non-ferrous metal ores, steel products and scrap.
4. Forest products trades: Forest products are primarily industrial materials used for the manufacture of paper, paper board and in the construction industry. This section includes timber (logs and lumber) wood pulp, plywood, paper and various wood products, totalling about 145 mt. The trade is strongly influenced by the availability of forestry resources.
5. Other industrial materials: There are a wide range of industrial materials such as cement, salt, gypsum, mineral sands, alumina, chemicals and many others. The total trade in these commodities accounted for 9 per cent of sea trade. They cover a whole range of industries.
4 UNCTAD Review of Maritime Transport (2002) Table 41 page 66 and estimates

Clarkson Research Studies 10 April 2004
6. Other Manufactures: The final trade group comprises the remaining manufactures such as textiles, machinery, capital goods, vehicles, consumer goods, etc. The total tonnage involved in this sector accounts for only 3 per cent of sea trade, but many of these commodities have a high value so their share in value is probably closer to 50 per cent. They are the mainstay of the liner trades and their impact upon the shipping industry is much greater than the tonnage suggests.
Viewing the trade as a whole, over 70 per cent of the tonnage of seaborne trade is
associated with the energy and metal industries so the shipping industry is highly dependent upon developments in these two industries.
These trade statistics convey the scale of the merchant shipping business, but disguise its physical complexity. Cargo is shipped between over eighty countries. Some shipments are regular, others irregular; some are large, others are small; some shippers are in a hurry, others are not; some cargoes can be handled with suction or grabs, while others are fragile; some cargo is boxed, containerized or packed on pallets, while other cargo is loose. The shipping systems have evolved to deal efficiently with this complexity.
3 Organization of the demand for sea transport
3.1 The liner and tramp system Until the 1950s the sea transport business had two main segments, the network of regular liner
services, who carried small cargo parcels of cargo on defined routes, and tramp shipping which ships to carry irregular cargoes which did not fit in with the regular liner services. These two services were defined by Fayle (1932) as being distinguished by the organisation structure rather than the ships used, as follows:-
Energy
Agricultural
Metal Industry
Forest Product s
Industrial Mat
Manufactures
0 500 1,000 1,500 2,000 2,500
Million tons shipped per annum
Crude Oil (32.9%)
Products (10%) Steam Coal (5%)
Gas (2%)
Grain (6%)Fertilizers (1.9%) Other (5.3%)
Timber (2.4%)Woodpulp (.6%)
Other (1.2%)
Iron Ore (9.5%) Coking Coal (4.6%) Steel Products (3.5)
Other (3.1%)
Bulk minerals (3%)Chemicals (2.6%)
Other (3.1%)
Textiles, machinery, etc. (3.4%)
Copyright 1998 Martin Stopford
Figure 1 World seaborne trade by main commodity groups
Source: Clarkson Research Studies
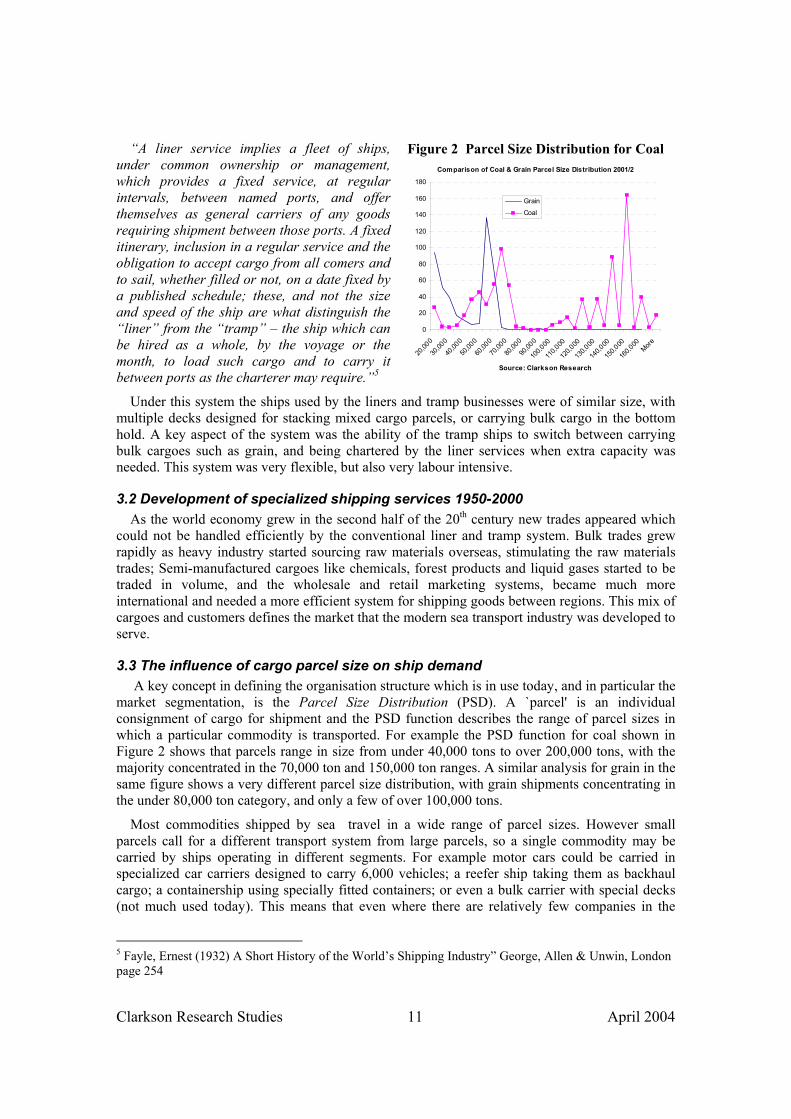
Clarkson Research Studies 11 April 2004
“A liner service implies a fleet of ships, under common ownership or management, which provides a fixed service, at regular intervals, between named ports, and offer themselves as general carriers of any goods requiring shipment between those ports. A fixed itinerary, inclusion in a regular service and the obligation to accept cargo from all comers and to sail, whether filled or not, on a date fixed by a published schedule; these, and not the size and speed of the ship are what distinguish the “liner” from the “tramp” – the ship which can be hired as a whole, by the voyage or the month, to load such cargo and to carry it between ports as the charterer may require.”5
Under this system the ships used by the liners and tramp businesses were of similar size, with multiple decks designed for stacking mixed cargo parcels, or carrying bulk cargo in the bottom hold. A key aspect of the system was the ability of the tramp ships to switch between carrying bulk cargoes such as grain, and being chartered by the liner services when extra capacity was needed. This system was very flexible, but also very labour intensive.
3.2 Development of specialized shipping services 1950-2000 As the world economy grew in the second half of the 20th century new trades appeared which
could not be handled efficiently by the conventional liner and tramp system. Bulk trades grew rapidly as heavy industry started sourcing raw materials overseas, stimulating the raw materials trades; Semi-manufactured cargoes like chemicals, forest products and liquid gases started to be traded in volume, and the wholesale and retail marketing systems, became much more international and needed a more efficient system for shipping goods between regions. This mix of cargoes and customers defines the market that the modern sea transport industry was developed to serve.
3.3 The influence of cargo parcel size on ship demand A key concept in defining the organisation structure which is in use today, and in particular the
market segmentation, is the Parcel Size Distribution (PSD). A `parcel' is an individual consignment of cargo for shipment and the PSD function describes the range of parcel sizes in which a particular commodity is transported. For example the PSD function for coal shown in Figure 2 shows that parcels range in size from under 40,000 tons to over 200,000 tons, with the majority concentrated in the 70,000 ton and 150,000 ton ranges. A similar analysis for grain in the same figure shows a very different parcel size distribution, with grain shipments concentrating in the under 80,000 ton category, and only a few of over 100,000 tons.
Most commodities shipped by sea travel in a wide range of parcel sizes. However small parcels call for a different transport system from large parcels, so a single commodity may be carried by ships operating in different segments. For example motor cars could be carried in specialized car carriers designed to carry 6,000 vehicles; a reefer ship taking them as backhaul cargo; a containership using specially fitted containers; or even a bulk carrier with special decks (not much used today). This means that even where there are relatively few companies in the
5 Fayle, Ernest (1932) A Short History of the World’s Shipping Industry” George, Allen & Unwin, London page 254
Comparison of Coal & Grain Parcel Size Distribution 2001/2
0
20
40
60
80
100
120
140
160
180
20,00
0
30,00
0
40,00
0
50,00
0
60,00
0
70,00
0
80,00
0
90,00
0
100,0
00
110,0
00
120,0
00
130,0
00
140,0
00
150,0
00
160,0
00More
Source: Clarkson Research
Grain
Coal
Figure 3 Parcel size distribution (PSD) for coal Figure 2 Parcel Size Distribution for Coal
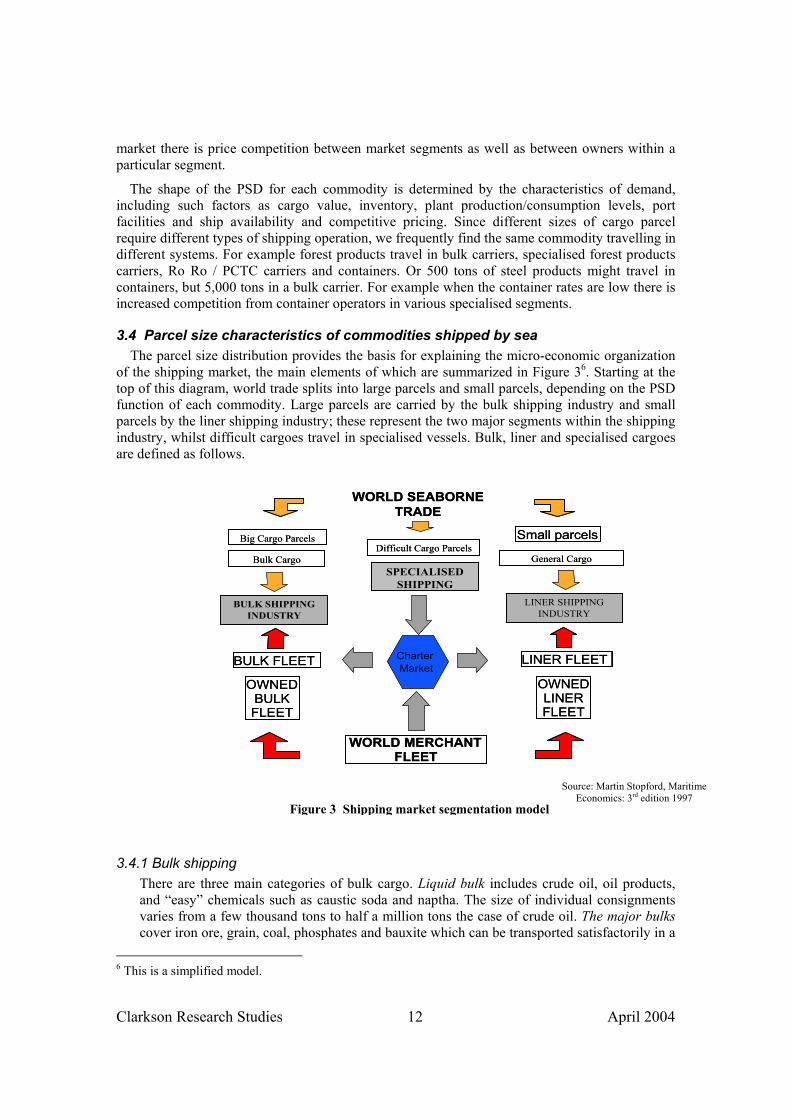
Clarkson Research Studies 12 April 2004
market there is price competition between market segments as well as between owners within a particular segment.
The shape of the PSD for each commodity is determined by the characteristics of demand, including such factors as cargo value, inventory, plant production/consumption levels, port facilities and ship availability and competitive pricing. Since different sizes of cargo parcel require different types of shipping operation, we frequently find the same commodity travelling in different systems. For example forest products travel in bulk carriers, specialised forest products carriers, Ro Ro / PCTC carriers and containers. Or 500 tons of steel products might travel in containers, but 5,000 tons in a bulk carrier. For example when the container rates are low there is increased competition from container operators in various specialised segments.
3.4 Parcel size characteristics of commodities shipped by sea The parcel size distribution provides the basis for explaining the micro-economic organization
of the shipping market, the main elements of which are summarized in Figure 36. Starting at the top of this diagram, world trade splits into large parcels and small parcels, depending on the PSD function of each commodity. Large parcels are carried by the bulk shipping industry and small parcels by the liner shipping industry; these represent the two major segments within the shipping industry, whilst difficult cargoes travel in specialised vessels. Bulk, liner and specialised cargoes are defined as follows.
3.4.1 Bulk shipping There are three main categories of bulk cargo. Liquid bulk includes crude oil, oil products, and “easy” chemicals such as caustic soda and naptha. The size of individual consignments varies from a few thousand tons to half a million tons the case of crude oil. The major bulks cover iron ore, grain, coal, phosphates and bauxite which can be transported satisfactorily in a
6 This is a simplified model.
WORLD SEABORNETRADE
Big Cargo Parcels
Bulk Cargo
BULK SHIPPINGINDUSTRY
BULK FLEET
Small parcels
General Cargo
LINER SHIPPING INDUSTRY
LINER FLEET
OWNED BULK FLEET
OWNED LINER FLEET
WORLD MERCHANTFLEET
SPECIALISED SHIPPING
Difficult Cargo Parcels
Charter Market
WORLD SEABORNETRADE
Big Cargo Parcels
Bulk Cargo
BULK SHIPPINGINDUSTRY
BULK FLEET
Small parcels
General Cargo
LINER SHIPPING INDUSTRY
LINER FLEET
OWNED BULK FLEET
OWNED LINER FLEET
WORLD MERCHANTFLEET
SPECIALISED SHIPPING
Difficult Cargo Parcels
Charter Market
Figure 3 Shipping market segmentation model
Source: Martin Stopford, Maritime Economics: 3rd edition 1997
Clarkson Research Studies 13 April 2004
conventional dry bulk carriers. Minor bulks7 covers the many other commodities that travel in shiploads. The most important are steel products, cement, gypsum, non-ferrous metal ores, sugar, salt, sulphur, forest products, wood chips and chemicals. In 2003 the bulk fleet of crude oil tankers, bulk carriers and products tankers consisted of 9,600 ships of 612 m dwt. It accounted for 76% of the total cargo fleet of 802 million dwt. Bulk shipping companies handle few transactions (roughly six to twelve voyages a year per ship), so there are minimal administrative overheads and in competitive terms the business unit is the ship rather than the company. Ownership of the fleet is split between industrial concerns who carry their own cargo (the “shippers”) and independent operators (the “shipowners”) who trade on the “freight market” or charter their ships for long periods to the shippers. The freight rates are very volatile (see graphs on page 33, 37, 41).
3.4.2 Specialised Shipping Specialised shipping (sometimes called “industrial shipping”) carries cargoes in the centre of Figure 3, which are shipped in volume, but where transport efficiency can be improved by investment in specially designed ships, terminals and cargo handling systems. The main cargoes are :
1. Refrigerated cargo (frozen meat, chilled produce, fish etc)
Refrigerated cargo is an obvious candidate for specialisation, since it can only be carried in holds with refrigeration. This cargo has traditionally been the subject of intense competition between the liner business and specialised "reefer" ships. Specialised reefer ships have fully insulated cargo holds and refrigeration equipment, trading with a full cargo of chilled or frozen commodities. When necessary they will, however, load other cargoes such as motor vehicles, General Cargo or palletized cargo. The other major source of refrigerated capacity is the containership fleet, which now has a greater cubic available than the specialised reefers. The result has been intense competition between these two sectors for the cargo, and a period of very low rates for reefer ships
2. Forest products (timber, pulp, paper.)
Forest products consist of logs, packaged timber (often in standard sizes), wood pulp bales, paper and wood chips. All of these cargoes can be carried in conventional bulk carriers, but as the trade developed in the 1960s shipowners started to build bulk carriers with special features designed for the efficient handling and stowage of forest products. The special features included "open" hatches which allowed packaged timber to be dropped directly into all parts of the hold (normal bulk carriers have only a smaller hatch opening) and sophisticated cargo handling gear up to speed up the loading and discharge process. These fleets are included in the specialized sector, though the ships can trade in the bulk market, and are especially useful for carrying non-homogeneous commodities such as empty containers, or steel products. However the high first cost of the ships make them more economically effective when used intensively as forest products carriers within a specialized training system.
3. Motor vehicles (new and used), trucks, earth moving equipment, farm implements
7 "Minor" bulks is a "mixed" bag requiring generally smaller consignments than major bulks... but considerably larger than per an individual container unit. Many "minor bulks" may also be carried by "specialised" forest product carriers.

Clarkson Research Studies 14 April 2004
Motor vehicles can be carried in a wide range of different ship types, including multi-deck liners, multi-purpose vessels with fold-down decks, bulk carriers fitted with collapsible decks (no longer used), deep sea ro-ro vessels, in containers on containerships and purpose built vehicle carriers. As the volume of trade increased specially designed pure car carriers (PCC's) were built but subsequent designs have been for more flexible RoRos and pure car and truck carriers (PCTC). These vessels have multiple decks designed for the carriage of cars, and a high cubic in order to maximize the number of vehicles which can be loaded. In order to add flexibility, the vessels are also have adjustable decks which can be adjusted to allow the transport of large vehicles such as earth-moving equipment and project cargoes. They are generally designed with a fast speed and efficient loading and discharge of the cargo. The fleet is currently 504 ships and details are shown in appendix 2. The vessels operate on regular and frequent transport routes to a multitude of loading/discharging ports/areas. In addition carriers are involved in through transport of vehicles.
4. Gases transported as liquids, including LNG, LPG, ammonia
In order to transport gases by sea they must be liquefied, by pressure or refrigeration and a fleet of specialized Tankers has been constructed for this purpose. There are two main categories of ship. Liquid petroleum gas (LPG) tankers carry propane, butane, ammonia and the number of other chemical gases either under pressure or pressure and refrigeration, or both. The coldest temperatures handled by these vessels is ethylene at -103 degrees centigrade. Liquefied natural gas (LNG) is carried in purpose-built LNG tankers at -163 degrees centigrade. These ships are heavily insulated. Although Gas Tankers are highly specialized, some can trade in oil product's and liquid chemical trades when freight rates make doing so viable. However not all Gas Tankers are designed with this capability. Currently there is a fleet of it 161 LNG tankers and 990 LPG carriers.
5. Chemicals.
Chemicals are shipped by sea in many small parcels, typically 3-30,000 tons in size. Many require special storage and handling systems. traditionally liquid chemicals were carried in drums or special tanks in cargo liners, but this was very inefficient. In the 1950s, as trade volume increased, the industry started to develop special tankers designed to carry up to 40 parcels of different chemicals within a single ship. These "parcel tankers" have separate tanks with independent pumping systems and special coatings such as stainless steel. As the system developed over at the following 30 years, to improve efficiency, liner type services were introduced on some long routes. However liquid chemical transportation is still spread across several different segments of the shipping industry, including smaller tankers (for example a 3,000 deadweight ship carrying a single parcel); tramp ships of 15-25,000 deadweight carrying mixed cargoes on a voyage by Voyage basis; containerships carrying chemicals in tank containers; and Parcel Tankers operating within pools, often on liner services. The specialized tanker fleet is difficult to define accurately, with around 2000 vessels carrying chemicals of some description, but only about half of these carrying the more sophisticated chemical cargoes.
3.4.3 Liner Shipping The liner business constitutes the provision of scheduled services at a fixed frequency over a pre-determined route, making sea transport available to cargo lots of all sizes. Liner
Clarkson Research Studies 15 April 2004
companies have extensive organisations, often in many countries, and the cost of ship operation is a relatively small part of total expenses. The governing freight document is the Bill of Lading or seaway bill, with the number of Bs/L issued per ship and even per container varying very substantially, depending on parcel size. Containerisation and the dissemination of the just in time approach have subordinated liner shipping within a door to door context of which the sea leg is only part, and not necessarily the most expensive part. Liner shipping caters for cargo of all kinds and, despite the high cost of ships and containers, participation in bulk cargoes is not inconsiderable and rising. Waste paper, is for example, perhaps the biggest single cargo carried in containerships, because of the need to return empty containers to loading areas generating better revenues. A healthy general cargo sector coexists within the liner sector, but, apart from specialist liner services (heavy lift, forest products, cars, refrigerated cargoes), non-cellular general cargo ships tend to operate over routes with small cargo constituencies or in countries with poor port infrastructures, increasingly in short sea trades. In addition cargo liners are involved in through transport of containers.
4 Differentiation of sea transport demand
4.1 Price and service aspects of sea transport demand There are four aspects to the service offered by the shipping services discussed in the previous
paragraphs which allow a degree of service differentiation:
1. Price: The freight cost is always important, but the greater the proportion of freight in the overall cost equation, the more emphasis shippers are likely to place on it. For many primary commodities shown on the left of Figure 1 price is the major consideration, but for semi manufactures and manufactures the service elements discussed in 2-4 below are also very significant
2. Speed: Time in transit incurs an inventory cost, so shippers of high-value commodities value speed. The cost of holding high-value commodities in stock may make it cheaper to ship small quantities frequently even if the freight cost is greater. On a three-month journey a cargo worth $100,000 incurs an inventory cost of $2,500 if interest rates are 10 per cent per annum. If the journey time can be halved it is worth paying up to $1,250 extra in freight. Speed may also be important for commercial reasons. Although liner ships are faster than trampers, since liner ships make more port calls, the time in transit is not necessarily longer.
3. Reliability: With the growing importance of `just in time' stock control systems, transport reliability has taken on a new significance. Some shippers may be prepared to pay more for a service which is guaranteed to operate to time and provide cargo capacity at all times.
4. Security: Loss or damage in transit is an insurable risk, but raises many difficulties for the shipper, who may well be prepared to pay more for secure transportation of his product without risk of damage.

Clarkson Research Studies 16 April 2004
4.2 The cost of freight by region The value of freight in 2000 was $380
billion, representing about five per cent of the total value of world trade. The table opposite shows the growth of freight costs and total trade since 1980, split by region. Its is important to remember these statistics cover both bulk and liner cargoes, and include inland distribution, which may be a considerable proportion of the total cost. During the period 1980 to 1999 the value of trade grew at 12 per cent per annum, whilst the freight costs increased by only seven per cent, showing the productivity improvement by the shipping industry during this period. In effect the unit cost was falling steadily over this period.
4.3 Long term trends in the cost of bulk transport
Long term trends in the cost of bulk transport provide an indication of the economic performance of the business. In 1950 it cost about $8 to transport coal from East Coast North America to Japan. In 2002 the trend, which is linear, had increased to $13/ton. Along the way there were seven market cycles, peaking in 1952, 1956, 1970, 1974, 1980, 1989 and 1995, but the average transport cost was $10.9 per ton. The cheapest year for shipping coal was 1972 when it cost $4.5/ton, while the most expensive was 1980 when it cost $24/ton. (The oil trade shows the same long-term trend, with transport costs fluctuating between fifty cents and one dollar per barrel. The highest cost was during the 1956 Suez crisis when the cost went up to $2.1 per barrel. In four years, 1949, 1961, 1977 and 1994 it fell to $0.5 per barrel).
Compared with other sectors of the economy, the transport industry's achievement is exceptional. Between 1960 and 1990 the trend price of freight only increased from $9/ton to $13/ton as shown in Figure 4 (in Figure 5 we show the development in real price terms). Over the same period average dollar prices increased sixfold. A basic Ford motor car had increased in price from $1,385 to $13,000; the UK rail fare from London to Glasgow from $23.4 to $106; the price of a ton of domestic coal from $12 in the UK to $200; and the price of a barrel of crude oil increased from $1.5 to $30. Another feature over this period has been the increase in the average cargo size- for example the average coal cargo in 1960 was 12,000t, now it is closer to 80,000t.
Figure 5: Transport cost of coal 1950-2002
y = 0.1024x + 7.4967R2 = 0.1737
02468
101214161820
1947 1952 1957 1962 1967 1972 1977 1982 1987 1992 1997 2002
Coal
$/ton
Atla
ntic
to P
acific
Coal freight/ton
Table 3: Freight Costs 1980-99 ($bn)1980 1990 1999 %
Developed economies 78 117 181 7%Africa 10 9 13 1%Americas 11 10 28 9%Asia 22 35 61 10%Europe 1 2 2 2%Oceania 0 0 1 5%Total Developing 45 56 104 7%World total 123 173 285 7%
Value of Imports $bn1980 1990 1999
Developed economies 1,426 2,662 4,010 10%Africa 78 82 105 2%Americas 123 118 358 11%Asia 211 428 780 15%Europe 16 21 23 2%Oceania 2 4 5 6%Total Developing 431 653 1,270 11%World total 1,857 3,134 5,821 12%
Figure 5b: Transport cost of coal 1950-2002 (real prices)
0
5
10
15
20
25
30
1947 1952 1957 1962 1967 1972 1977 1982 1987 1992 1997 2002
Coal
$/ton
Atla
ntic
to P
acific
19
48 P
rices
Table 2 Freight Costs 1980-99 ($bn)
Figure 5 Transport Cost of Coal 1950-2002 (Real Prices)
Sources: CRS, UNCTAD Review of Maritime Transport,
Martin Stopford (Maritime
Economics: 3rd edition 1997)
Figure 4 Transport Cost of Coal 1950-2002

Clarkson Research Studies 17 April 2004
5 The Supply of Sea Transport
5.1 The world merchant fleet In March 2004, Clarkson Research had records of 26,280 deep sea merchant ships (bulk,
specialised & liner), covering all ships down to around 2,000 gross tonnes. However, there is a far larger world fleet of self propelled sea-going merchant ships over 100 gross tons: approximately 80,000 vessels with a capacity of 490 mgt. Half of this 80,000 total though are non-cargo-carrying vessels including 24,000 fishing boats, 3,000 offshore support vessels, 8,000 tugs, 800 research vessels, 1,100 dredgers and 2,650 other non-cargo vessels. The balance is made up of small ships trading generally on short sea, non international routes.
5.2 National registration of the world merchant fleet One of the major commercial issues in the shipping business is the ownership of vessels. In order to trade any merchant ship must be registered under a maritime flag, and in making this registration the shipowner chooses the court jurisdiction under which the ship will operate. Because trading on the high seas is less subject to national affiliations than most other businesses, there is a long tradition of registering ships in countries that are not necessarily the owners commercial base, so the fleets registered in a particular country will not necessarily give a true indication of the fleet controlled by nationals of that country. In January 2002 the 35 most important maritime countries controlled 95% of the world fleet8. Out of 759 million Dwt, 279 million Dwt was registered under the national flag of the owner, and 479 million Dwt was registered under a foreign flag. The world's biggest shipowning nation is Greece, which controls 146 million Dwt of ships, with 46 million Dwt registered under the national flag. For Japan the ratio is even greater, with 103 m dwt controlled, but only 15 million Dwt registered under the Japanese flag.
5.3 Competition between types of ship in the cargo fleet Although some ship types are well defined, it is difficult to divide the fleet into clear categories
which provide a sound starting point for analysing market segmentation. Merchant ships are not mass-produced like cars or trucks and few ships in the fleet are precisely the same. Many are designed to meet a specific owner's needs, so classifying ships into types relies on selecting distinctive physical characteristics which serve to identify the `type' of ship when it is built.
In practice there is often considerable scope for competition between different ship types. For example containerships can carry reefer cargo (or reefer ships can carry containers) or in some instances chemical tankers and gas tankers can carry oil products in bulk. The statistical breakdown of the ship segments under discussion is shown in Figure (6 ) and in more detail in Annex 2.
8 The tramp shipping market is a global business with the international fleet registered in over 140 countries. Table on page 24 shows the top 35 ship owning countries.
Table 6: World Cargo Fleet
0 1000 2000 3000 4000 5000 6000
Combination CarrierLNG Carriers
PCTCLPG Carriers
RoRoReefers
Chemical TankersTankers
ContainersGeneral Cargo
Bulk Carriers
no of ships
Figure 6 World Cargo Fleet
Source: Clarkson Research Studies, 1st March 2004
Clarkson Research Studies 18 April 2004
5.4 The cargo handling economics & competition One of the major areas where shipowners have sought to establish a competitive advantage is
by developing improved cargo handling. In some trades this has resulted in a major change in the design of the ships, for example vehicle carriers and forest products carriers. Because these specialised ships are generally designed to meet the needs of a specific group of clients (for example car manufacturers9 etc) there is more focus on marketing and service levels than is the case with homogeneous bulk vessels.
6 Sea Transport risk & investment strategy
6.1 The risk management system
Because shipping is a risky business for both shipowners and cargo shippers (shipping markets are unpredictable and highly volatile), they have developed a system which allows shippers with a future commitment to sea transport to spread their risk by developing a portfolio approach to sourcing transport, using four different approaches- ownership, period timechartering, spot chartering and COA.
1. Ownership: companies shipping substantial quantities of bulk materials can run their own shipping fleets to handle a proportion of their transport requirements. For example, in 2003 the major oil companies collectively owned approximately 20 m.dwt of oil tankers, representing 7 per cent of the tanker fleet besides having a further 20m dwt (7%) on long term time charter or bareboat charter. Steel companies in Japan and Europe also run fleets of large bulk carriers for the transport of iron ore and coal. This type of bulk shipping operation suits shippers running a stable and predictable through transport operation.
2. Period Timecharter (TC): he may charter tonnage on a long-term basis from a shipowner. Some companies place charters for ten or fifteen years to provide a base load of shipping capacity to cover long-term material-supply contracts – particularly in the iron ore trade. For example, the Japanese shipping company Mitsui OSK ships iron ore for Sumitomo, Nippon Kokan and Nippon Steel on the basis of long-term cargo guarantees and operates a fleet of ore carriers and combined carriers to provide this service. In the early 1980s the company was carrying about 20 per cent of Japanese iron ore imports. In such cases, the contract is generally placed before the vessel is actually built. Shorter-term time charters for twelve months or three to five years would be obtained on the charter market.
9 Car transportation began in conventional vessels, then very specialised pure car carriers (PCC) and now to RoRo/PCTC capable of carrying various types of rolling cargo as well as static and project cargo such as generators, windmills, yachts, trains, airplanes, forest products.
0
50
100
150
200
250
1994 1995 1996 1997 1998 1999 2000
No
Shi
ps
VLCC Suezmax Aframax
Panamax Handy
Fig 7 Oil Major Owned Fleets 1994-2000
Figure 7 Oil Major Owned Fleets 1994-2000
Source: Clarkson Research Studies

Clarkson Research Studies 19 April 2004
3. Voyage and trip charter (Spot Charter): shippers with a single cargo or irregular requirements (for example traders) can contract for freight on a cargo by cargo basis. This is often the case in agricultural trades such as grain and sugar where seasonal factors and the volatility of the market make it difficult to plan shipping requirements in advance, or the cargo could be a consignment of prefabricated buildings for the Middle East or some heavy plant. In such cases, bulk or multi-deck tonnage is chartered for a single voyage via some market such as the Baltic Exchange or broker network, where the shipper can hire a ship for a single voyage at a negotiated freight rate per ton of cargo carried. A variation on the voyage charter is the trip charter when a vessel is fixed on a time charter basis for the period of a specific voyage and for the carriage of a specific cargo. The shipowner earns “hire” per day for the period determined by the voyage.
4. Contract of Affreightment10: the shipper may, normally through an open tendering procedure, enter into a long-term arrangement with a shipowner who specializes in a particular area of bulk shipping, supported by suitable tonnage. For example, Scandinavian shipowners are involved in the carriage of forest products from West Coast North America to Europe and run fleets of specialist ships designed to optimize the bulk transportation of forest products. Similarly, the transportation of motor cars is serviced by companies, which run fleets of pure vehicle carriers and Ro Ros servicing the Japanese car export trade. COAs are also used in other trades such as coal, fertilizer, grain, ore and oil.
An example of the way these sourcing techniques is used is shown in Figure 7 which shows the vessels used by oil companies in 2003 and the source from which they were obtained.
7 The companies involved in the shipping business
7.1 Shipping Companies and support services There are five categories11 of company involved in the transport chain, two directly and three
indirectly. The relevant companies are
1. Cargo owners 2. Traders 3. Shipowners (shipping companies/operators), 4. Ship managers 5. Ship brokers
Each has a different perspective on the business.
An important group of the past twenty years, cargo owners have cargo to be moved by sea. They may be primary producers such as oil companies or iron ore mines. Or they may be manufacturers or wholesalers importing raw materials or equipment. A third important group in last 20 years has been traders who purchase commodities on a speculative basis with a view to reselling them, often in a different location, so they become involved in the transport process. Some cargo owners have a very short term approach to the business, and just want to purchase
10 COAs, in line with contracts in other industries, are becoming shorter. COAs have increasingly developed into "service contracts" typically with duration of 1-2 years. Given the discussions in UNCITRAL and implications of the US Ocean Shipping Reform Act, be careful to avoid any confusion between chartering arrangements and liner trade Ocean Shipping Liner Agreements (OLSAs). 11 Some companies will combine two or more of the listed functions.

Clarkson Research Studies 20 April 2004
transport when they need it. Others take a more long term perspective, and may become deeply involved in the transport process. For example oil companies often run their own fleet of tankers, or offer long term time charters.
Shipping companies12 are equally diverse. In 2003 around 5,000 companies owned the 26,000 ships (bulk, specialized & liner) carrying the world’s deep-sea trade, an average of five ships per company (see table 3). There are some very big companies, at least when measured by the number of ships owned. One third of the fleet was owned by 61 companies with over 50 ships Another third was owned by 600 companies operating 20 to 50 ships, whilst the remaining third is owned by 4,400 companies with an average of 4 ships each. These companies are often highly focussed, with tight overheads, for example running a fleet of 100 ships with only 30 or 40 employees and sub-contract many main functions to third parties. The ownership characteristics of the individual tramp sectors are shown in appendix 2.
With so many shipping companies, the market share of individual shipowners is very small. This conclusion is illustrated by an analysis carried out of 7000 Dry Bulk fixtures (covering various types of dry bulk commodities) between January 2001 and April 2003. The survey analysed the ownership of each vessel "fixed" and calculated the share of each owner. A total of 750 shipowners were found to be trading during the survey period. Out of this total 712 accounted for less than 0.5 per cent of the total 7000 fixtures; 28 counted for between 0.5 per cent and 1.0 per cent of the total; and five accounted for between one and 1.5 per cent. Of the remainder one shipowner had 2.5 per cent and 13 per cent, which was the highest.
Ship Managers undertake the management (both technical and commercial) of ships on behalf of shipowners, often for a fixed fee. There are a significant number13 of ship management companies who will undertake the management of the ship on behalf of the client. In addition to tankers and bulk carriers, ship management companies will manage specialist ships such as LPG tankers. This makes it very easy for new companies to enter the business the core management tasks can all be outsourced.
12 The 4,795 owner companies listed in the table are based on “major group” analysis, that shows the highest level of ownership that we are aware of. 13 The Fairplay Shipping Directory lists over 700 Ship Managers although many of these do not manage internationally trading vessels.
Table 3 - Merchant fleet by company sizeCompany Size World Fleet European Union Owners
# Companies # Ships m. Dwt Avg. Ships # Companies # Ships m. Dwt Avg. Ships (# owned vessels)
300+ 4 2,099 59.54 525200-299 3 794 40.29 265 1 261 12.71 261100-199 9 1,201 61.41 133
50-99 45 3,010 123.98 67 14 912 30.42 6510-49 469 8,898 321.79 19 193 3,772 136.52 20
5-9 584 3,856 107.20 7 245 1,612 52.20 72-4 1,404 3,731 73.33 3 460 1,246 32.56 30-1 2,277 2,194 23.28 1 538 503 8.00 1
Unknown 497 7.10 17 0.51Total 4,795 26,280 817.92 5 1,451 8,323 272.91 6
Source: Clarkson Research Studies
Clarkson Research Studies 21 April 2004
Shipbrokers: There is a worldwide network of shipbroking companies14 which will undertake all the tasks involved with ordering new ships; buying and selling existing ships; and negotiating charters for the vessel. They also undertake the post fixture administration of contracts. This makes it relatively easy for a new shipowner to enter the market.
8 Definition of the Shipping Markets
8.1 The four markets where cargo and ships are traded In shipping there are four markets trading in different commodities. The freight market trades
in sea transport of commodities; the charter market deals in ships for hire; the sale and purchase 14 The Fairplay Shipping Directory lists over 1100 Ship brokers. Shipbroking companies are very competitive and revenue is usually based on a commission fee.
This diagram shows the cashflow in the shipping market. It involves threemarkets, the Freight Market, the Sale & Purchase Market and the NewbuildingMarket. Note that cash invested in newbuildings flows OUT of the industry.
Cash In
Cash Out
Cash
Key To Main Flows
Circulating
Low
High
S.H.Price
Freight Earnings
The Fo ur Mar ket s Th at Co n t ro l Sh ip p ing
Shipyard
World Trade
DemandLow
HighSupply
Low
High
Charterer in need of ship
1. The Freight Market
Charter Revenue
Low
High
Newbuilding Order
Charter Rate$000/day
New Price
Freight
2. The Charter Market
Charterer with cargo
3. The Sale & Purchase Market
Shipowners bidding for Cargo
Shipowners
Shipowners
(Buyers)
(Sellers)Pay Shipyard
Shipowner with ship for hire
Shipowners’
Rate $/ton
Pay seller
ShippingCash
Flow
4. The Newbuilding Markett
Source: Martin Stopford Maritime Economics 2nd edn 1997
This diagram shows the cashflow in the shipping market. It involves threemarkets, the Freight Market, the Sale & Purchase Market and the NewbuildingMarket. Note that cash invested in newbuildings flows OUT of the industry.
Cash In
Cash Out
Cash
Key To Main Flows
Circulating
Low
High
S.H.Price
This diagram shows the cashflow in the shipping market. It involves threemarkets, the Freight Market, the Sale & Purchase Market and the NewbuildingMarket. Note that cash invested in newbuildings flows OUT of the industry.
Cash In
Cash Out
Cash
Key To Main Flows
Circulating
Low
High
S.H.Price
Freight Earnings
The Fo ur Mar ket s Th at Co n t ro l Sh ip p ing
Freight Earnings
The Fo ur Mar ket s Th at Co n t ro l Sh ip p ing
Shipyard
World Trade
DemandLow
HighSupply
Low
High
Charterer in need of ship
1. The Freight Market
Charter Revenue
Low
High
Newbuilding Order
Charter Rate$000/day
New Price
Freight
2. The Charter Market
Charterer with cargo
3. The Sale & Purchase Market
Shipowners bidding for Cargo
Shipowners
Shipowners
(Buyers)
(Sellers)Pay Shipyard
Shipowner with ship for hire
Shipowners’
Rate $/ton
Pay seller
ShippingCash
Flow
4. The Newbuilding Markett
Source: Martin Stopford Maritime Economics 2nd edn 1997
Figure 8 The markets where ships and freight are traded

Clarkson Research Studies 22 April 2004
market trades second-hand ships; and the newbuilding market trades new ships. Beyond this there is no formal structure.
Because the same companies are trading in all four shipping markets, their activities are closely correlated. When rates rise or fall in the freight market the effect is transmitted into the sale and purchase market and from there into the newbuilding15 market. The markets are also linked by cash. The relationship is shown graphically in Figure 8. Cash flows back and forth between the industry's bank account (represented by the circle) and the four shipping markets (represented by the squares). The cashflow into the shipping companies' bank account is shown by the light shaded bars, while the black bars show outflows. The hatched bars indicate cash which changes hands from one shipowner to another, but does not change the cash balance of the industry as a whole.
8.2 The role of market cycles in the competitive process The cash flowing between the four markets drive the shipping investment process. At the
beginning of the cycle freight rates rise and cash starts to pour in, allowing shipowners to pay higher prices for second-hand ships. As prices are bid up investors turn to the newbuilding market which now looks better value. But as the ships arrive on the market two years later the whole process goes into reverse. Falling freight rates squeeze the cash inflow just as investors start paying for their newbuildings. Financially weak owners who cannot meet their day-to-day obligations are forced to sell ships on the second-hand market. These sales are often preceded by a, usually prolonged, period of declining rates. As ships are scrapped the supply falls, freight rates are bid up and the whole process starts again.
The cycles create a continuous movement of companies in and out of the market. Market cycles squeeze out the inefficient companies, and allow new and efficient companies to enter the market and gain market share. This is how the shipping industry directs investment and promotes efficiency.
Changes in supply and demand can impact the price paid for freight very quickly.
9 “Voyage Charter” Contract In bulk shipping, a voyage charter allows
the shipper to buy transport from the shipowner at a negotiated price per ton of cargo. The market contract suits shippers who want to leave the management of the transport to the shipowner, while the time charter is for experienced ship operators who prefer to manage the transport themselves.
9.1 Negotiating & concluding a freight contract
When a ship is chartered or a freight rate is agreed, the ship is said to be `fixed'. Fixtures are arranged in much the same way as any major international hiring or subcontracting operation. Shipowners have vessels for hire, charterers have cargo to transport, and brokers 15 There is strong competition between shipbuilding nations and yards within each nation.
Bareboat Timecharter Voyage CharterMaster appointed &
directed by:-Master appointed by owner, directed by
Master appointed and directed by:-
Charterer Charterer OwnerRevenue depends on:- Revenue depends on:- Revenue depends on:-
Hire rate & duration Hire rate & duration Quantity of cargo & rateCosts paid by owner:- Costs paid by owner :- Costs paid by owner:-Capital Capital CapitalBrokerage Brokerage Brokerage
Wages WagesProvisions ProvisionsMaintenance MaintenanceRepairs RepairsStores & supplies Stores & suppliesLube oil Lube oilWater WaterInsurance InsuranceOverheads Overheads
Port chargesStevadoring chargesCleaning holdsCargo claimsLight dues
Canal duesBunker fuel
Contract of Afreightment (COA): cost profile same as voyage charter
Type of Charter ArrangementTable 4 Type of Charter Arrangement
Source: Clarkson Research Studies
Clarkson Research Studies 23 April 2004
puts the deal together. Let us briefly consider the part played by each of these:
The shipowner comes to the market with a ship available, free of cargo. For example, it may be a Panamax bulk carrier currently on a voyage from the US Gulf to deliver grain to Japan, so it will be `open' (available for hire) in Japan from the anticipated date at which the grain has been discharged, say 12 May.
The shipper has a volume of cargo to transport from one location to another. The quantity, timing and physical characteristics of the cargo will determine the type of shipping contract required. For example, the shipper may have a cargo of 50,000 tons of coal to ship from Newcastle, New South Wales, to Rotterdam. Such a cargo might be very attractive to a bulk carrier operator discharging coal in Japan and looking for a cargo to reposition into the North Atlantic, because he has only a short ballast leg from Japan to Australia and then a full cargo back to Europe.
Most often the principal (i.e. the shipowner or charterer) will appoint a shipbroker to act for him. The broker's task is to discover what cargoes or ships are available; what the owners/ charterers want to be paid; and what is reasonable given the state of the market. With this information they negotiate the deal for their client, often in tense competition with other brokers. Brokers provide other services including post fixture processing, dealing with disputes, and providing accounting services in respect of freight, other payments and receipts under the charter, etc. Some owners or shippers carry out these tasks themselves. However, this requires a staff and management structure which only very large companies can justify. Since broking is all about information, brokers tend to gather in shipping centres. London remains the biggest, with other major centres in New York, Tokyo, Hong Kong, Singapore, Piraeus, Oslo, Hamburg, Copenhagen, Bergen etc.
Three types of contractual arrangement are commonly used. Under a voyage charter, the shipowner contracts to carry a specific cargo in a specific ship for a negotiated price per ton. Variants on the theme are the consecutive voyage charter and the contract of affreightment, in which the shipowner contracts to carry regular tonnages of cargo for an agreed price per ton.
9.2 The voyage charter A voyage charter provides transport for a specific cargo from port A to port B for a fixed price
per ton, so in this case the shipowner pays all the costs relating to the ship. For example, a grain trader may have 25,000 tons of grain to transport from Port Cartier in Canada to Tilbury in the UK. So what does he do? He calls his broker and tells him that he needs transport for the cargo. The broker will `fix' (i.e. charter) a ship for the voyage at a negotiated freight rate per ton of cargo, e.g. $5.20. The terms will be set out in a charter-party and, if all goes well, the ship arrives on the due date, loads the cargo, transports it to Tilbury, discharges and the transaction is complete.
If the voyage is not completed within the terms of charter-party then there will be a claim. For example, if laytime (i.e. port time) at Tilbury is specified at seven days and the time counted in port is ten days, the owner submits a claim for three days demurrage to the charterer. Conversely, if the ship spends only five days in port, the charterer will submit a claim for two days despatch to the owner. The rates for demurrage and despatch are stated in dollars per day in the charter-party.
9.3 The Consecutive Voyage Charter (CVC) A Consecutive Voyage Charter is similar to a Voyage Charter, but the ship is contracted to
undertake a series of cargo carrying voyages on a defined route. This is used when the shipper has a well defined schedule of cargoes to transport. To introduce some flexibility and allow for
Clarkson Research Studies 24 April 2004
changing circumstances the charter party may incorporate options in terms of loading and or discharge ports, quantities and other contract terms.
9.4 The Contract of Affreightment (COA)16 The Contract of Affreightment (COA) is a little more complicated. It is a negotiated contract
under which the shipowner agrees to carry a series of cargo parcels for a fixed price per unit/volume, generally without specifying the precise ship in which the cargo will be carried. However, the shipowner will be under obligation to provide the necessary cargo carrying capacity to serve the agreed cargo volume and destinations
For example, the shipper has a contract to supply ten consignments of 50,000 tons of coal from Colombia to Rotterdam at approximately two-monthly intervals. So he negotiates a Contract of Affreightment with a shipping company which agrees to undertake the transport at an agreed price per ton. Because details of each voyage and the ship used are left to the shipowner, he can increase his efficiency by planning the operating pattern for his fleet in the most efficient manner.
For example by switching cargo between vessels and obtaining backhauls he may be able to reduce his overall cost per ton transported. Because shipowners are aware of the potential value of a guaranteed cargo stream, there is generally intense competition for these contracts, with the result that shippers are able to obtain some of the value added in reduced rates. Companies who specialize in COAs sometimes describe their business as `industrial shipping' because their aim is to provide a service. Since a long-term contract is involved, COAs involve a greater commitment to marketing the service to the shipper and providing an efficient service.
There is COA business in the dry bulk market carrying cargoes of iron ore and coal and the major customers are the steel mills of Europe and the Far East. This system is also used in many of the specialised trades. The problem in negotiating COAs is that the precise volume and timing of cargo shipments is not generally known so cargo volumes may be specified as a range (e.g. `minimum x and maximum y tons17') while timing may rely on generalizations such as `The shipments under the contract shall be evenly spread over the contract period.'
9.5 Main contract terms (voyage charter party) The freight charters listed above will all be concluded with a contract drawn up between the
shipper and the shipowner, often through the intermediation of a shipbroker. There are various standard contracts in common use. They typically include the following terms:-
• Details of the ship and the contracting parties. • A description of cargo to be carried, drawing attention to any special features. • The load and discharge ports. • The terms on which the cargo is to be carried. This important part of the voyage charter-
party defines the commitments of the shipper and shipowner under the contract. This covers:
16 There has been a considerable development/change in COAs over recent years. COAs have increasingly developed into "service contracts" typically with duration of 1-2 years. According to ECSA members, within specialised shipping, the majority of cargo is transported under COA or service contract which are negotiated through an open tender process whereby the customer send out a tender to all carrier within the relevant segment. There is intensive competition among the carriers and extensive negotiations with the shipper until one carrier has been awarded the contract. 17 If the charter involved the transport of cars, the units involved would be expressed in numbers of vehicles rather than tones.

Clarkson Research Studies 25 April 2004
• The terms of payment. • Damages for non-performance . • Administrative clauses, covering matters that may give rise to difficulties if not clarified
in advance. These include the appointment of agents and stevedores, bills of lading, provisions for dealing with strikes, wars, ice, etc.
10 “Timecharter” Contracts
10.1 Procedures for time chartering a ship A timecharter gives the charterer the use of the ship, while leaving ownership and management
of the vessel in the hands of the shipowner. In this case the shipowner pays the capital and operating costs of the vessel, but not the voyage related costs (see Table 5 ). The length of the charter may be the time taken to complete a single voyage (trip charter) or a period of months or years (period charter). When on charter, the shipowner continues to pay the finance costs and operating costs of the vessel (i.e. the crew, maintenance and repair) but the charterer directs the commercial operations of the vessel and pays all voyage expenses (i.e. bunkers, port charges and canal dues) and cargo handling costs. With a time charter, the shipowner has a clear basis for preparing the ship budget, since he knows the ship operating costs from experience and is in receipt of a fixed daily or monthly charter rate (e.g. $5,000 per day). Often the shipowner will use a long time charter from a major corporation such as a steel mill or an oil company, as security for a loan to purchase the ship needed for the trade. Shipowners themselves may timecharter vessels for a number of reasons, including if they are not able to finance ownership of more vessels, their own tonnage is committed or they want to spread risk by having a mix of owned / chartered vessels.
Although simple in principle, in practice time charters involve risks for both parties. Details of the contractual agreement are set out in the `charter-party'. The shipowner must state the vessel's speed, fuel consumption and cargo capacity. The terms of hire will be adjusted if the ship does not perform to these standards. The charter-party will also set out the conditions under which the vessel is regarded as `off hire', for example during emergency repairs, when the charterer does not pay the charter hire. Long time charters also deal with such matters as the adjustment to the hire charge in the event of the vessel being laid up, and will set out certain conditions under which the charterer is entitled to terminate the arrangement, for example if the owner fails to run the ship efficiently.
There are three reasons why subcontracting/timechartering may be attractive. First, the shipper may not wish to become a shipowner, but his business requires the use of a ship under his control. The shipper may not want to be a ship owner for political, technical or financial reasons (avoding tying up capital for example). Second, the time charter may work out cheaper than buying, especially if the owner has lower costs, due to lower overheads and larger fleet. This seems to have been one of the reasons that oil companies subcontracted so much of their transport in the 1960s. Third, the charterer may be a speculator taking a position in anticipation of a change in the market.
Timechartering to industrial clients is a prime source of revenue for the shipowner. The availability of time charters varies from cargo to cargo (or commodity to commodity) and with business circumstances.
10.2 The timecharter trip A time charter trip is the simplest form of time charter. A specific vessel is hired to undertake a
trip from a specific starting point (for example Cape Hatteras) to the Pacific and back. During the time the vessel is on charter the owner is paid an agreed daily rate, for example $20,000 a day.

Clarkson Research Studies 26 April 2004
During the period that it is on charter the vessel is directed by the shipper, who tells it where to load cargo, and where to discharge it. The advantage of the trip charter is that it allows the shipper to vary his itinerary and provides greater flexibility than a voyage charter under which the contract involves the transport of a specific Cargo Parcel.
10.3 The period timecharter Under a period charter the ship is a hired out by the "shipowner" to the "charterer" for a period of time specified in the contract ("charter party"). During this period the shipowner provides the crew and maintains the vessel, whilst the charterer directs its operations. Normally the charter party will specify a number of admissible days "off hire" each year for repairs and maintenance, and there will be an agreement in the contract for handling any additional time out of service. Typically these charters may be three months, six months, twelve months, two years or in a few cases as long as 10 or even 15 years. Time charters have many different uses. The ship may be chartered by a cargo owner, for example an oil company, to carry its own cargo. Or it might be chartered by a shipowner who needs the vessel to meet cargo commitments, for example under a contract of a affreightment. Finally, some shipowner's may period time charter a vessel in the hope of trading it on the voyage charter market at a higher rate.
10.4 Main contract terms (timecharter) Time charter-parties follow the same general principles as the voyage charter (see paragraph
9.4), but also deal specifically with the ship's performance (i.e. fuel consumption, speed, quantity, trading limits, prohibited cargoes and allocation of voyage costs and prices of bunkers on delivery and redelivery) and equipment, and may exclude the items dealing with the cargo.
11 The Bareboat Charter Contracts Finally, if a company wishes to have full operational/technical control of the ship, but does not
wish to own it, a bare boat charter is arranged. Under this arrangement the investor, not necessarily a professional shipowner, purchases the vessel and hands it over to the charterer for a specified period, usually seven to twenty years. The charterer manages the vessel and pays all operating (including crewing, maintenance, dry docking etc.) and voyage costs and the owner, who is often a financial institution, is not active in the operation of a vessel and does not require any specific maritime skills. At the end of the charter the ship is returned to the owner, although some bareboat charters include an option to purchase the vessel on termination of the charter.
12 Market Reporting & Information Flow The rates at which charters are fixed depend on market conditions and the free flow of
information reporting latest developments plays a vital part in the market. Shipping has one of the most extensive market reporting systems of any capital industry and the network of brokers and information providers ensure a high degree of transparency in all the contract negotiations discussed above.
13 The Sale and Purchase Market
13.1 Procedure for buying and selling a ship About 1,300 deep sea merchant ships are sold each year, representing an investment of $16.7
billion in 2003. The market is very open, with ship prices freely reported and subject to open competition.
The participants in the sale and purchase market are the same mix of shippers, shipping companies and speculators who trade in the freight market.

Clarkson Research Studies 27 April 2004
Most sale and purchase transactions are carried out through shipbrokers.
13.2 How ship prices are determined The sale and purchase market thrives on price volatility. Profits earned from well-
timed buying and selling activity are an important source of income for shipping investors. Prices are generally determined by supply and demand, which in turn depend on the cashflow pressures discussed in previous sections.
14 Comments on Cooperation in Bulk & Specialized Sectors
14.1 The principles of cooperation in shipping One of the methods used by shipping companies to improve their efficiency is to form an
alliance with other companies. These alliances may take the form of pools, joint ventures, or space charter agreement.
14.2 Types of alliances: Table 5 shows three different types of alliance, joint ventures, pools and space charter
agreements. Eight areas of potential cooperation are shown on the vertical axis - capital investment; marketing; chartering; cargo contracts; logistics and productivity; operating cost efficiency; administration and training.
The table illustrates in a very approximate sense the range of the activities which may be undertaken in each of the four types of alliance. A joint venture generally covers every business aspect. It is to all intents and purposes a separate company set up for a specific cooperative venture. In contrast “Pools” are usually concerned with marketing and the associated activities of delivering cargo and collecting revenue.
14.3 Joint venture agreements: A joint venture is a business arrangement in which two or more parties undertake
a specific economic activity together. They are often bilateral in their nature. Whereas a pool is set up to accept a number of different members, a joint venture is usually restricted to a small number of partners who agree to work together on a specific project, or towards a specific goal. Joint ventures vary considerably in the amount of co-operation undertaken by the two parties.
Table 6: Key Issues in Building Shipping AlliancesJoint Venture / Consortia Pool Space Charter Arrangements
Capital Investment Yes
Marketing & Customer awareness Yes Yes
Chartering Efficiency Yes Yes Yes
Arranging Cargo contracts (COA) Yes Yes
Logistics & vessel productivity Yes Yes Yes
Operating Cost Efficiency Yes Yes Yes
Administrative cost efficiency Yes Yes
Training Yes
Table 5 Key issues in building shipping alliances
Source: Clarkson Research Studies

Clarkson Research Studies 28 April 2004
14.4 Pool arrangements: One of the most common arrangements for working together in the shipping industry is the
"Pool". Shipping pools are currently used in almost all segments of the tramp/non-liner shipping market including products tanker business, the chemical tanker business, the LPG business, the bulk carrier business and the crude tanker business.
A shipping pool can be defined as “a collection of similar vessel types under various ownerships placed in the care of a central administration”18. Areas of potential co-operation are shown in table 5. Pools are generally developed for 2 reasons. Firstly to allow participants to provide the service levels required by their major customers. Secondly, to improve transport efficiency by special investment and increased ship utilisation e.g. by arranging backhaul cargoes more effectively than a small group of ships could do.
14.5 Space Charter Agreements
In the breakbulk era liner companies operated freight pools, particularly in thin trades, in order to spread operational costs. Containerisation saw the introduction of consortia (sharing administrative and operating costs and revenue) and alliances (sharing vessel operating costs) as carriers sought to drive down operating costs and increase vessel size to access scale. Vessel sharing agreements, today’s most common format, operate on the basis of slot swaps between participating carriers with inequalities of provision and usage settled by cash cross-payments at pre-determined prices. In addition, carriers sell slots to third parties, to competing lines without sufficient market support to start their own services, and to lines seeking to supplement their own service capacity as well as to container leasing companies seeking to reposition empty containers. Slot charters are generally on the basis of long term inter-line contractual arrangements, with slot prices set for a fixed duration, but the slot prices for spot arrangements are fixed ad hoc. Needless to say, carriers prefer to restrict slot sales to capacity that they cannot themselves make profitable use of. Instances in which space is subcontracted to cargo interests are extremely rare or non-existent.
Space charter arrangements also exist in some of the specialised sectors. Considering the customer structure and the service requirements they place on the carriers it is a need to optimise capacity utilisation, sailing frequencies and port coverage to the benefit of the customers. Carriers use both irregular ad hoc space charter arrangements mainly to cover short term fluctuations as well as more regular fixed positioning space charters. The information in this paper is believed to be correct but the accuracy thereof is not guaranteed and the Company and its employees cannot accept liability for loss suffered in consequence of reliance on the information provided. Provision of this data does not obviate the need to make further appropriate enquiries and inspections. The information is for the use of the recipient only and is not to be used in any document for the purposes of raising finance without the written permission of Clarkson Research Studies.
18 William V. Packard 1989 Shipping Pools, Lloyds of London Press Ltd, London p 5

Appendix 1—Summary Tables

Clarkson Research Studies 30 April 2004
A1.1 Total Fleet Ownership Profile Merchant fleet by company sizeCompany Size World Fleet European Union Owners
#Companies # Ships m. Dwt Avg. Ships #Companies # Ships m. Dwt Avg. Ships (# owned vessels)
300+ 4 2,099 59.5 525200-299 3 794 40.3 265 1 261 12.7 261100-199 9 1,201 61.4 133
50-99 45 3,010 124.0 67 14 912 30.4 6510-49 469 8,898 321.8 19 193 3,772 136.5 20
5-9 584 3,856 107.2 7 245 1,612 52.2 72-4 1,404 3,731 73.3 3 460 1,246 32.6 30-1 2,277 2,194 23.3 1 538 503 8.0 1
Unknown 497 7.1 17 0.5Total 4,795 26,280 817.9 5 1,451 8,323 272.9 6
Includes deep sea vessel, including bulk, specialised and liner
OrderbookCompany Size World Orderbook European Union Owners
# Companies # Ships m. Dwt Avg. Ships # Companies # Ships m. Dwt Avg. Ships (# owned vessels)
300+ 4 139 11.33 35200-299 3 154 13.51 51 1 53 3.80 53100-199 9 107 10.60 12
50-99 45 420 21.61 9 14 160 8.25 1110-49 469 1,196 70.17 3 193 693 39.12 4
5-9 584 364 20.59 1 245 176 9.06 12-4 1,404 183 8.04 0 460 101 5.45 00-1 2,277 279 9.10 0 538 137 5.33 0
Unknown 288 14.27 12 0.17Total 4,795 3,130 179.21 1 1,451 1,332 71.18 1
Source: Clarkson Research Studies
Fleet figures in this section relate to vessels operating in bulk, specialised and liner trades. Deep Sea fleet (generally over 2,000 dwt). “European Union” refers to EU-15.

Clarkson Research Studies 31 April 2004
Fle
et S
umm
ary
Flee
t Siz
eO
wne
rshi
pV
esse
l Acq
uisi
tion
#shi
psO
wne
d by
To
p 20
Com
pany
Si
ze (a
ve.)
S&P
Vol
ume
2003
sal
es a
s %
flee
tN
/B V
olum
eO
rder
book
as
% o
f fle
etA
sset
Val
ue, N
B
Pric
e $m
Bul
k C
arri
ers1
5,62
128
.6%
5H
igh
7.2%
Hig
h16
.7%
50.0
Fore
st P
rodu
cts
Car
rier
s82
547
.3%
3M
ediu
m5.
9%Lo
w5.
9%C
rude
Oil
Tan
kers
21,
314
48.9
%6
Hig
h8.
9%H
igh
24.1
%84
.0O
il Pr
oduc
ts T
anke
rs3
1,59
933
.2%
3H
igh
11.3
%H
igh
37.4
%35
.0V
egoi
l Tan
kers
Low
Low
Che
mic
al T
anke
rs2,
179
33.7
%3
Med
ium
2.9%
Med
ium
24.9
%L
PG C
arri
ers4
991
71.1
%3
Low
2.7%
Med
ium
12.0
%66
.0L
NG
Car
rier
s515
888
.2%
4V
ery
Low
0.0%
Hig
h41
.9%
165.
0R
eefe
rs1,
281
46.2
%3
Hig
h6.
3%Lo
w0.
0%R
oRo
1,03
542
.2%
2M
ediu
m3.
0%Lo
w4.
8%PC
TC
650
479
.7%
5Lo
w0.
0%H
igh
22.3
%50
.0
NB
Pric
e Si
zes:
1 170
k dw
t, 2 3
00k
dwt,
3 47k
dw
t, 4 7
8k c
bm, 5 1
38k
cbm
6 6,5
00 c
ars.
Sour
ce: C
lark
son
Res
earc
h St
udie
s
A1.
2 Fl
eet S
umm
ary
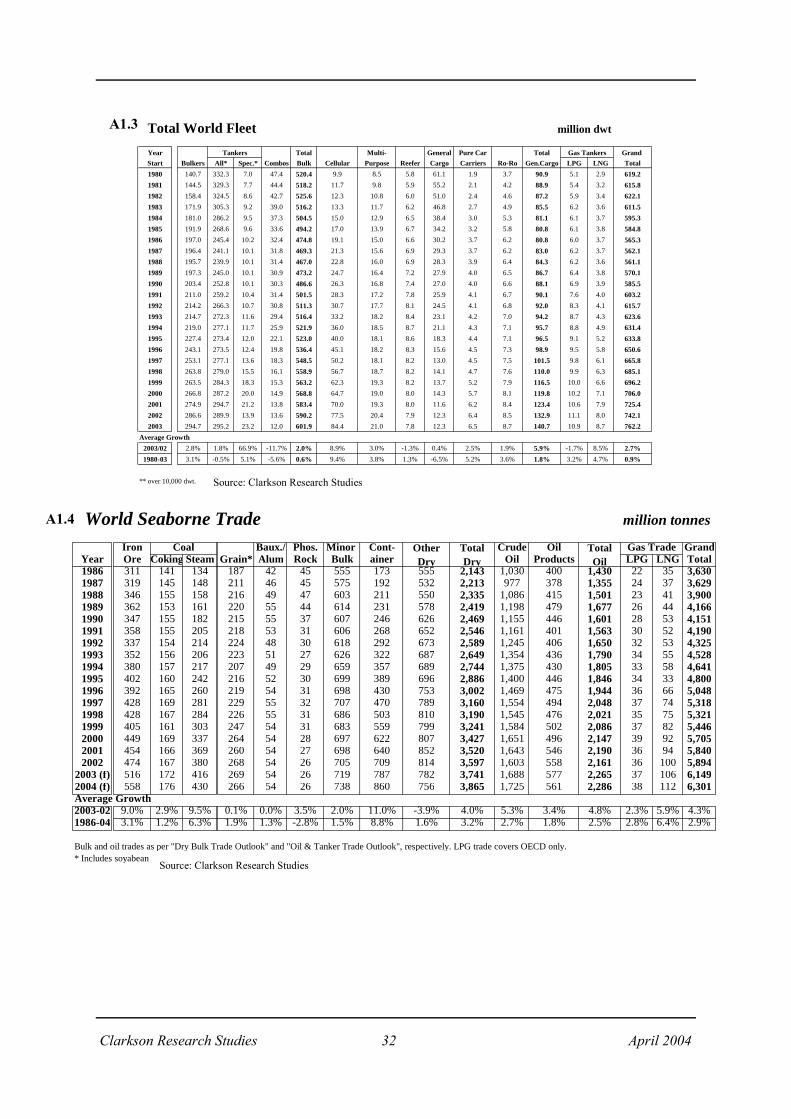
Clarkson Research Studies 32 April 2004
World Seaborne Trade million tonnes
Iron Baux./ Phos. Minor Cont- Crude Oil Gas Trade GrandYear Ore Coking SteamoGrain* Alum Rock Bulk ainer Oil Products LPG LNG Total1986 311 141 134 187 42 45 555 173 555 2,143 1,030 400 1,430 22 35 3,6301987 319 145 148 211 46 45 575 192 532 2,213 977 378 1,355 24 37 3,6291988 346 155 158 216 49 47 603 211 550 2,335 1,086 415 1,501 23 41 3,9001989 362 153 161 220 55 44 614 231 578 2,419 1,198 479 1,677 26 44 4,1661990 347 155 182 215 55 37 607 246 626 2,469 1,155 446 1,601 28 53 4,1511991 358 155 205 218 53 31 606 268 652 2,546 1,161 401 1,563 30 52 4,1901992 337 154 214 224 48 30 618 292 673 2,589 1,245 406 1,650 32 53 4,3251993 352 156 206 223 51 27 626 322 687 2,649 1,354 436 1,790 34 55 4,5281994 380 157 217 207 49 29 659 357 689 2,744 1,375 430 1,805 33 58 4,6411995 402 160 242 216 52 30 699 389 696 2,886 1,400 446 1,846 34 33 4,8001996 392 165 260 219 54 31 698 430 753 3,002 1,469 475 1,944 36 66 5,0481997 428 169 281 229 55 32 707 470 789 3,160 1,554 494 2,048 37 74 5,3181998 428 167 284 226 55 31 686 503 810 3,190 1,545 476 2,021 35 75 5,3211999 405 161 303 247 54 31 683 559 799 3,241 1,584 502 2,086 37 82 5,4462000 449 169 337 264 54 28 697 622 807 3,427 1,651 496 2,147 39 92 5,7052001 454 166 369 260 54 27 698 640 852 3,520 1,643 546 2,190 36 94 5,8402002 474 167 380 268 54 26 705 709 814 3,597 1,603 558 2,161 36 100 5,894
2003 (f) 516 172 416 269 54 26 719 787 782 3,741 1,688 577 2,265 37 106 6,1492004 (f) 558 176 430 266 54 26 738 860 756 3,865 1,725 561 2,286 38 112 6,301Average Growth2003-02 9.0% 2.9% 9.5% 0.1% 0.0% 3.5% 2.0% 11.0% -3.9% 4.0% 5.3% 3.4% 4.8% 2.3% 5.9% 4.3%1986-04 3.1% 1.2% 6.3% 1.9% 1.3% -2.8% 1.5% 8.8% 1.6% 3.2% 2.7% 1.8% 2.5% 2.8% 6.4% 2.9%
Bulk and oil trades as per "Dry Bulk Trade Outlook" and "Oil & Tanker Trade Outlook", respectively. LPG trade covers OECD only.* Includes soyabean
Coal Other Dry
Total Dry
Total Oil
A1.4
Total World Fleet million dwt
Year Total Multi- General Pure Car Total Grand
Start Bulkers All* Spec.* Combos Bulk Cellular Purpose Reefer Cargo Carriers Ro-Ro Gen.Cargo LPG LNG Total
1980 140.7 332.3 7.0 47.4 520.4 9.9 8.5 5.8 61.1 1.9 3.7 90.9 5.1 2.9 619.2
1981 144.5 329.3 7.7 44.4 518.2 11.7 9.8 5.9 55.2 2.1 4.2 88.9 5.4 3.2 615.8
1982 158.4 324.5 8.6 42.7 525.6 12.3 10.8 6.0 51.0 2.4 4.6 87.2 5.9 3.4 622.1
1983 171.9 305.3 9.2 39.0 516.2 13.3 11.7 6.2 46.8 2.7 4.9 85.5 6.2 3.6 611.5
1984 181.0 286.2 9.5 37.3 504.5 15.0 12.9 6.5 38.4 3.0 5.3 81.1 6.1 3.7 595.3
1985 191.9 268.6 9.6 33.6 494.2 17.0 13.9 6.7 34.2 3.2 5.8 80.8 6.1 3.8 584.8
1986 197.0 245.4 10.2 32.4 474.8 19.1 15.0 6.6 30.2 3.7 6.2 80.8 6.0 3.7 565.3
1987 196.4 241.1 10.1 31.8 469.3 21.3 15.6 6.9 29.3 3.7 6.2 83.0 6.2 3.7 562.1
1988 195.7 239.9 10.1 31.4 467.0 22.8 16.0 6.9 28.3 3.9 6.4 84.3 6.2 3.6 561.1
1989 197.3 245.0 10.1 30.9 473.2 24.7 16.4 7.2 27.9 4.0 6.5 86.7 6.4 3.8 570.1
1990 203.4 252.8 10.1 30.3 486.6 26.3 16.8 7.4 27.0 4.0 6.6 88.1 6.9 3.9 585.5
1991 211.0 259.2 10.4 31.4 501.5 28.3 17.2 7.8 25.9 4.1 6.7 90.1 7.6 4.0 603.2
1992 214.2 266.3 10.7 30.8 511.3 30.7 17.7 8.1 24.5 4.1 6.8 92.0 8.3 4.1 615.7
1993 214.7 272.3 11.6 29.4 516.4 33.2 18.2 8.4 23.1 4.2 7.0 94.2 8.7 4.3 623.6
1994 219.0 277.1 11.7 25.9 521.9 36.0 18.5 8.7 21.1 4.3 7.1 95.7 8.8 4.9 631.4
1995 227.4 273.4 12.0 22.1 523.0 40.0 18.1 8.6 18.3 4.4 7.1 96.5 9.1 5.2 633.8
1996 243.1 273.5 12.4 19.8 536.4 45.1 18.2 8.3 15.6 4.5 7.3 98.9 9.5 5.8 650.6
1997 253.1 277.1 13.6 18.3 548.5 50.2 18.1 8.2 13.0 4.5 7.5 101.5 9.8 6.1 665.8
1998 263.8 279.0 15.5 16.1 558.9 56.7 18.7 8.2 14.1 4.7 7.6 110.0 9.9 6.3 685.1
1999 263.5 284.3 18.3 15.3 563.2 62.3 19.3 8.2 13.7 5.2 7.9 116.5 10.0 6.6 696.2
2000 266.8 287.2 20.0 14.9 568.8 64.7 19.0 8.0 14.3 5.7 8.1 119.8 10.2 7.1 706.0
2001 274.9 294.7 21.2 13.8 583.4 70.0 19.3 8.0 11.6 6.2 8.4 123.4 10.6 7.9 725.4
2002 286.6 289.9 13.9 13.6 590.2 77.5 20.4 7.9 12.3 6.4 8.5 132.9 11.1 8.0 742.1
2003 294.7 295.2 23.2 12.0 601.9 84.4 21.0 7.8 12.3 6.5 8.7 140.7 10.9 8.7 762.2
Average Growth
2003/02 2.8% 1.8% 66.9% -11.7% 2.0% 8.9% 3.0% -1.3% 0.4% 2.5% 1.9% 5.9% -1.7% 8.5% 2.7%
1980-03 3.1% -0.5% 5.1% -5.6% 0.6% 9.4% 3.8% 1.3% -6.5% 5.2% 3.6% 1.8% 3.2% 4.7% 0.9%
** over 10,000 dwt.
Tankers Gas Tankers
A1.3
Source: Clarkson Research Studies
Source: Clarkson Research Studies

Clarkson Research Studies 33 April 2004
Example of Volatility in Shipping MarketsDaily Crude Tanker Rates 1Q04
75
125
175
225
275
325
05-Jan
12-Jan
19-Jan
26-Jan
02-Feb
09-Feb
16-Feb
23-Feb
01-Mar
08-Mar
15-Mar
22-Mar
29-Mar
WS
VLCCSuezmaxAframax
Based on WorldScale Rates for Med-Med Voyages
VLCC Price MovementsLast 7 Years
50
60
70
80
90
Apr '97 Apr '98 Apr '99 Apr '00 Apr '01 Apr '02 Apr '03 Apr '04
$m
NB
5-yr-old
Shipping Market Volatility - Last 7 Years
Spot Market Rate Volatility - Last 7 YearsCrude
TankersCPP
TankersBulk-
carriers VLGCs Chemical Tankers*
$/day $/day $/day $/day $/tMean Average 29,709 17,179 9,396 25,144 55.6St. Dev. 14,669 7,606 5,549 8,703 8.7St. Dev / Mean 0.49 0.44 0.59 0.35 0.16Max 75,589 44,091 34,790 49,145 95.0Min 11,025 7,080 5,116 7,561 40.0Range 64,564 37,011 29,674 41,584 55.0* All units $/day, apart from chemical tankers - based on Rott-F.East 3,000t $/t
5-yr old Secondhand Price Volatility - Last 7 YearsVLCC
TankerProduct Tanker
Panamax Bulker VLGC*
$m $m $m $mMean Average 61.0 23.0 18.1 55.4St. Dev. 6.8 2.4 4.8 3.3St. Dev / Mean 0.11 0.10 0.26 0.06Max 79.0 27.0 36.0 63.0Min 50.0 19.5 13.5 52.0Range 29.0 7.5 22.5 11.0* 3-year old
Newbuilding Price Volatility - Last 7 YearsVLCC
TankerProduct Tanker
Panamax Bulker VLGC
$m $m $m $mMean Average 73.3 28.7 23.2 60.1St. Dev. 5.9 2.4 3.0 3.5St. Dev / Mean 0.08 0.08 0.13 0.06Max 86.0 36.0 34.5 69.0Min 62.5 25.5 19.0 56.0Range 23.5 10.5 15.5 13.0Source: Clarkson Research Studies
A1.5
Source: Clarkson Research Studies Source: Clarkson Research Studies
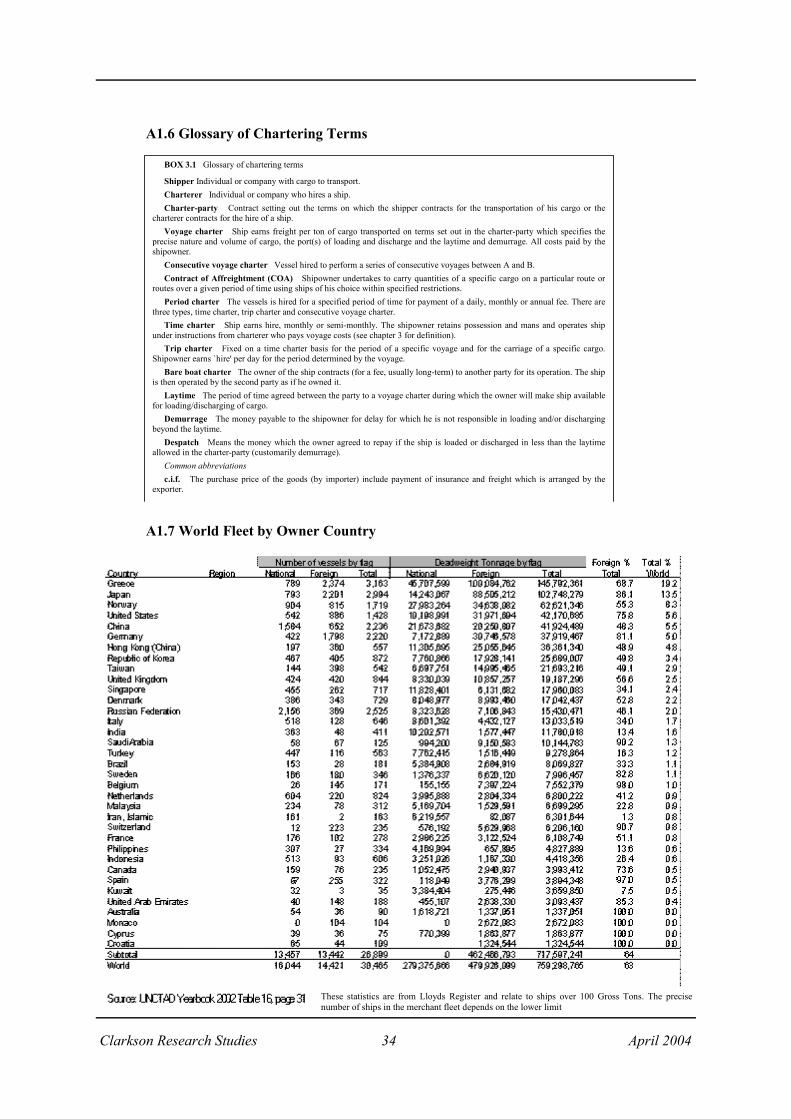
Clarkson Research Studies 34 April 2004
BOX 3.1 Glossary of chartering terms
Shipper Individual or company with cargo to transport. Charterer Individual or company who hires a ship. Charter-party Contract setting out the terms on which the shipper contracts for the transportation of his cargo or the
charterer contracts for the hire of a ship. Voyage charter Ship earns freight per ton of cargo transported on terms set out in the charter-party which specifies the
precise nature and volume of cargo, the port(s) of loading and discharge and the laytime and demurrage. All costs paid by theshipowner.
Consecutive voyage charter Vessel hired to perform a series of consecutive voyages between A and B. Contract of Affreightment (COA) Shipowner undertakes to carry quantities of a specific cargo on a particular route or
routes over a given period of time using ships of his choice within specified restrictions. Period charter The vessels is hired for a specified period of time for payment of a daily, monthly or annual fee. There are
three types, time charter, trip charter and consecutive voyage charter. Time charter Ship earns hire, monthly or semi-monthly. The shipowner retains possession and mans and operates ship
under instructions from charterer who pays voyage costs (see chapter 3 for definition). Trip charter Fixed on a time charter basis for the period of a specific voyage and for the carriage of a specific cargo.
Shipowner earns `hire' per day for the period determined by the voyage. Bare boat charter The owner of the ship contracts (for a fee, usually long-term) to another party for its operation. The ship
is then operated by the second party as if he owned it. Laytime The period of time agreed between the party to a voyage charter during which the owner will make ship available
for loading/discharging of cargo. Demurrage The money payable to the shipowner for delay for which he is not responsible in loading and/or discharging
beyond the laytime. Despatch Means the money which the owner agreed to repay if the ship is loaded or discharged in less than the laytime
allowed in the charter-party (customarily demurrage). Common abbreviations c.i.f. The purchase price of the goods (by importer) include payment of insurance and freight which is arranged by the
exporter.
A1.6 Glossary of Chartering Terms
A1.7 World Fleet by Owner Country
These statistics are from Lloyds Register and relate to ships over 100 Gross Tons. The precise number of ships in the merchant fleet depends on the lower limit

Appendix 2
Overview of the Tramp Shipping Market Segments
Notes to data 1. The following data covers the world deep sea fleet, as per Clarksons Shipping Intelli-
gence Weekly. 2. It is a difficult exercise to accurately report ownership information for the c.40,000
vessels on the Clarkson Fleet Database. In the following data we have used Clarksons Major Group indicator that groups ships under the highest level of ownership that we are aware of. Owner type is based on analysts estimates.
3. Some industry data included in this discussion is based on estimates or subjective judgments in circumstances where data for actual market transactions either does not exist or is not publicly available; the published information of other maritime data collection experts may differ from this data; while we have taken reasonable care in the compilation of the industry statistical data, graphs and tables and believe them to be correct, data compilation is subject to limited audit and validation procedures;Clarkson Research, its agents, officers and employees cannot accept liability for any loss suffered in consequence of reliance on such information or in any other manner; and the provision of such data, graphs and tables does not obviate the need to make appropriate further inquiries.
4. Where reference is made to “European Union”, this incorporates the existing EU-15 countries. It does not include Norway.

Clarkson Research Studies 36 April 2004
Bulk carrier Sector Overview
The major bulk cargoes include raw materials (e.g. iron ore & coal), cereal in general, minor ores and phosphates. At an owner level the sector is not highly concentrated, with the top 20 owners re-sponsible for 29% of the fleet (though this does not mean that they have 29% of any particular bulk trade). However, the level of concentration might be seen to be greater looking at the operator level, noting that many ship operators are chartering vessels from across the spectrum of ownership.
Demand for bulkcarriers is spread among utilities companies, commodity producers and traders. The number of charterers responsible for more than 10mt of seaborne cargo per annum is likely to be more than 25, but maybe not by many. The picture is different across cargoes; in the iron ore market the 3 major players (CVRD, BHP Billiton, Rio Tinto) are responsible for 75% of the cargo, whilst the coal and grain markets are much more fragmented. Consolidation does take place (a good exam-ple being the merger of major mineral interests BHP and Billiton), but the sector as a whole could not be said to be characterized by high levels of concentration. Our fixture data shows that around 400 charterers were active in the dry bulk market in 2003, with the top 20 responsible for around 48% of tonnage.
There are a number of ‘pooling’ type arrangements. Although these are more numerous, but possibly more ‘niche’ in the Handymax and Handysize sectors, there are also prevalent in the Panamax and Capesize sectors whereby a major shipper can call on a ‘pool’ of ships taken from a group of shi-powners.
A2.1 Bulk carrier Market Profile World European Union
ships m.dwt # owners ships m.dwt # ownersFleet, Mar-04 5,621 304.3 1122 1,700 96.8 443Orderbook, Mar-04 674 50.8 141 163 11.5 51O'book as % of fleet 12.0% 16.7% 9.6% 11.9%Top 20 Owners' Fleet, m.dwt, Mar-04 1,308 87.0 346 31.2% of fleet 23.3% 28.6% 20.4% 32.3%Ownership TypeIndustrial & Utilities 56 6.7 12 4 0.2 27 Oil MajorsOther Oil CompaniesState Owned Commercial 738 28.9 32 1 0.1 1State Owned Non-CommercialIndependent Public 603 43.5 37 45 3.4 7Independent Private 4,172 222.8 1,051 1,633 92.5 431Independent Manager 52 2.4 16 17 0.6 4NB Contracts, m.dwt, 2003 384 29.4% of fleet 6.8% 9.7%S/H Sales, m.dwt, 2003 374 21.8% of fleet 6.7% 7.2%Entry Conditions. Relatively easy. Vary between the major commodities. Pooling arrangements and high asset costs in the large vessel sectors exist. Type of Cargo, Charters. COAs, period charters and spot chartering all widely used.
Cargo Volumes (Dry Bulks) 2002 2003 2004World Imports, m.tonnes 2,073 2,172 2,249
growth 2% 5% 4%EU Major Bulk Imports, m.tonnes 293 308 309
growth 2% 5% 0%Source: Clarkson Research Studies

Clarkson Research Studies 37 April 2004
Bulk carrier Fleet Ownership Profile
Bulker Average Spot Earnings
0
5
10
15
20
25
30
35
Jan-
90Ja
n-91
Jan-
92Ja
n-93
Jan-
94Ja
n-95
Jan-
96Ja
n-97
Jan-
98Ja
n-99
Jan-
00Ja
n-01
Jan-
02Ja
n-03
Jan-
04
Source: Clarkson Research Studies
$,000/dTHE BULK CARRIER MARKET
Ship Types Cargoes
BIGGER CARGO PARCELS USE BIGGER BULK CARRIERS TO
ACHIEVE ECONOM IES OF
SCALE
CAPESIZE BULK CARRIER >80,000 DWT
621 SHIPS OF 99.2M . DWT
PANAM AXBULK CARRIER 60-80,000 DWT 1,076 SHIPS OF 76.0M . DWT
HANDYM AXBULK CARRIER 40-60,000 DWT 1,204 SHIPS OF
56.4M . DWT
HANDYSIZEBULK CARRIER 10-40,000 DWT 2,734 SHIPS OF
73.3M . DWT
COM BINEDCARRIERS
116 SHIPS OF 11.7M . DWT
IRON ORECOAL CEREALS
IRON ORECOALGRAINBAUXITEPHOSPHATE
CEREALSCOALSTEELSCEMENTPOTASHRICESUGARGYPSUMFOREST PRODSSCRAPSULPHURNFM ORESVEHICLESSALT
FleetCompany Size World Fleet European Union Owners
# Companies # Ships m.Dwt Avg. Ships # Companies # Ships m.Dwt Avg. Ships (# owned vessels)
300+200-299 1 297 15.91 297100-199 4 508 26.60 127
50-99 7 374 22.82 53 1 52 1.86 5210-49 92 1,534 95.48 17 27 420 32.04 16
5-9 193 1,251 70.63 6 94 592 32.74 62-4 416 1,127 52.79 3 168 471 23.27 30-1 424 408 15.80 1 158 152 6.38 1
Unknown 122 4.28 13 0.51Total 1,137 5,621 304.31 5 448 1,700 96.79 4
Source: Clarkson Research StudiesOrderbook
Company Size World Orderbook European Union Owners# Companies # Ships m.Dwt Avg.Ships # Companies # Ships m.Dwt Avg. Ships
(# owned vessels)300+
200-299 1 25 2.06 25100-199 4 45 4.75 11
50-99 7 20 1.83 3 1 4 0.17 410-49 92 167 12.55 2 27 30 2.88 1
5-9 193 107 8.50 1 94 62 4.63 12-4 416 95 7.19 0 168 20 1.61 00-1 424 55 2.71 0 158 47 2.21 0
Unknown 160 11.18Total 1,137 674 50.78 1 448 163 11.50 0
Source: Clarkson Research Studies
Source: Clarkson Research Studies
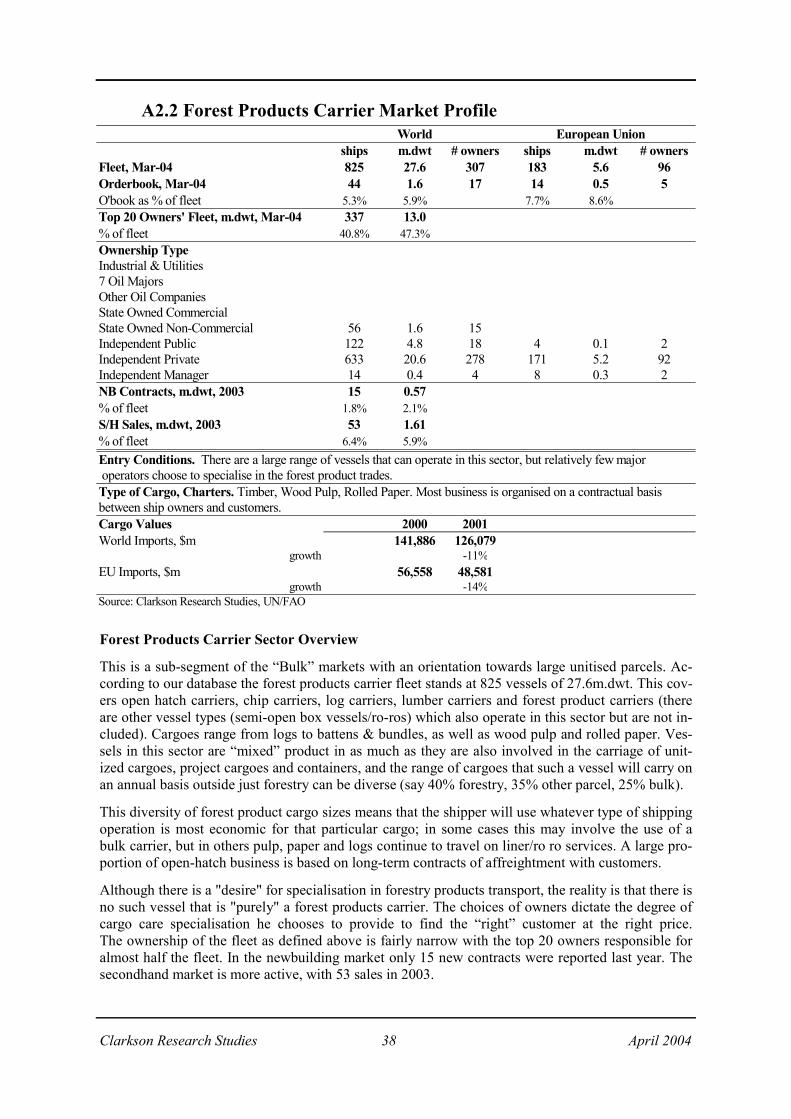
Clarkson Research Studies 38 April 2004
Forest Products Carrier Sector Overview
This is a sub-segment of the “Bulk” markets with an orientation towards large unitised parcels. Ac-cording to our database the forest products carrier fleet stands at 825 vessels of 27.6m.dwt. This cov-ers open hatch carriers, chip carriers, log carriers, lumber carriers and forest product carriers (there are other vessel types (semi-open box vessels/ro-ros) which also operate in this sector but are not in-cluded). Cargoes range from logs to battens & bundles, as well as wood pulp and rolled paper. Ves-sels in this sector are “mixed” product in as much as they are also involved in the carriage of unit-ized cargoes, project cargoes and containers, and the range of cargoes that such a vessel will carry on an annual basis outside just forestry can be diverse (say 40% forestry, 35% other parcel, 25% bulk).
This diversity of forest product cargo sizes means that the shipper will use whatever type of shipping operation is most economic for that particular cargo; in some cases this may involve the use of a bulk carrier, but in others pulp, paper and logs continue to travel on liner/ro ro services. A large pro-portion of open-hatch business is based on long-term contracts of affreightment with customers.
Although there is a "desire" for specialisation in forestry products transport, the reality is that there is no such vessel that is "purely" a forest products carrier. The choices of owners dictate the degree of cargo care specialisation he chooses to provide to find the “right” customer at the right price. The ownership of the fleet as defined above is fairly narrow with the top 20 owners responsible for almost half the fleet. In the newbuilding market only 15 new contracts were reported last year. The secondhand market is more active, with 53 sales in 2003.
A2.2 Forest Products Carrier Market Profile World European Union
ships m.dwt # owners ships m.dwt # ownersFleet, Mar-04 825 27.6 307 183 5.6 96Orderbook, Mar-04 44 1.6 17 14 0.5 5O'book as % of fleet 5.3% 5.9% 7.7% 8.6%Top 20 Owners' Fleet, m.dwt, Mar-04 337 13.0 93 3.2% of fleet 40.8% 47.3% 50.8% 57.9%Ownership TypeIndustrial & Utilities7 Oil MajorsOther Oil CompaniesState Owned CommercialState Owned Non-Commercial 56 1.6 15Independent Public 122 4.8 18 4 0.1 2Independent Private 633 20.6 278 171 5.2 92Independent Manager 14 0.4 4 8 0.3 2NB Contracts, m.dwt, 2003 15 0.57% of fleet 1.8% 2.1%S/H Sales, m.dwt, 2003 53 1.61% of fleet 6.4% 5.9%Entry Conditions. There are a large range of vessels that can operate in this sector, but relatively few major operators choose to specialise in the forest product trades. Type of Cargo, Charters. Timber, Wood Pulp, Rolled Paper. Most business is organised on a contractual basisbetween ship owners and customers.Cargo Values 2000 2001World Imports, $m 141,886 126,079
growth -11%EU Imports, $m 56,558 48,581
growth -14%Source: Clarkson Research Studies, UN/FAO
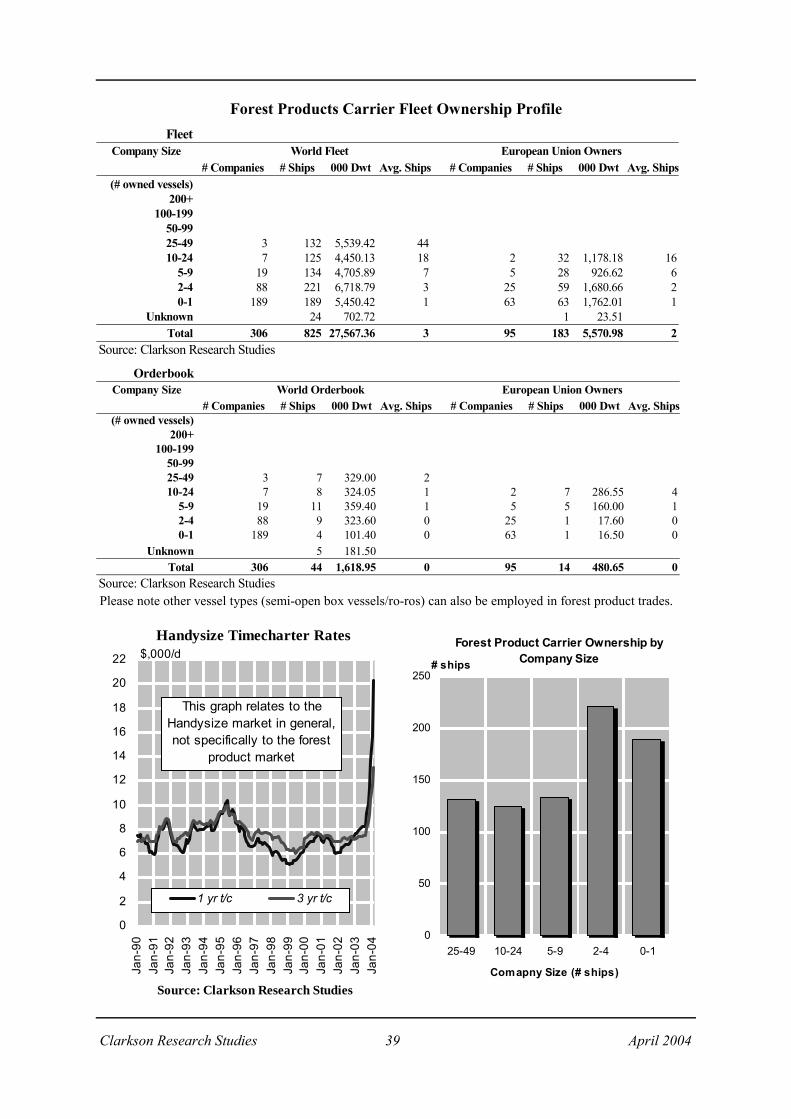
Clarkson Research Studies 39 April 2004
Forest Products Carrier Fleet Ownership Profile Fleet
Company Size World Fleet European Union Owners# Companies # Ships 000 Dwt Avg. Ships # Companies # Ships 000 Dwt Avg. Ships
(# owned vessels)200+
100-19950-9925-49 3 132 5,539.42 4410-24 7 125 4,450.13 18 2 32 1,178.18 16
5-9 19 134 4,705.89 7 5 28 926.62 62-4 88 221 6,718.79 3 25 59 1,680.66 20-1 189 189 5,450.42 1 63 63 1,762.01 1
Unknown 24 702.72 1 23.51Total 306 825 27,567.36 3 95 183 5,570.98 2
Source: Clarkson Research Studies
OrderbookCompany Size World Orderbook European Union Owners
# Companies # Ships 000 Dwt Avg. Ships # Companies # Ships 000 Dwt Avg. Ships (# owned vessels)
200+100-199
50-9925-49 3 7 329.00 210-24 7 8 324.05 1 2 7 286.55 4
5-9 19 11 359.40 1 5 5 160.00 12-4 88 9 323.60 0 25 1 17.60 00-1 189 4 101.40 0 63 1 16.50 0
Unknown 5 181.50Total 306 44 1,618.95 0 95 14 480.65 0
Source: Clarkson Research Studies
Forest Product Carrier Ownership by Company Size
0
50
100
150
200
250
25-49 10-24 5-9 2-4 0-1
Comapny Size (# ships)
# ships
Handysize Timecharter Rates
0
2
4
6
8
10
12
14
16
18
20
22
Jan-
90Ja
n-91
Jan-
92Ja
n-93
Jan-
94Ja
n-95
Jan-
96Ja
n-97
Jan-
98Ja
n-99
Jan-
00Ja
n-01
Jan-
02Ja
n-03
Jan-
04
Source: Clarkson Research Studies
$,000/d
1 yr t/c 3 yr t/c
This graph relates to the Handysize market in general, not specifically to the forest
product market
Please note other vessel types (semi-open box vessels/ro-ros) can also be employed in forest product trades.

Clarkson Research Studies 40 April 2004
Crude Oil Tanker Sector Overview
The crude oil tanker fleet incorporates 1,314 vessels ranging from 60,000-450,000 dwt. It covers four major sectors: Panamax (uncoated, 60-80,000 dwt), Aframax (uncoated, 80-120,000 dwt), Su-ezmax (120-200,000 dwt) and VL/ULCC (200,000 dwt+). The size of vessels used on a particular route is usually determined by cargo size and port facilities, but since these vessels carry only one type of cargo (crude oil), there can be significant competition between the size ranges, with, for ex-ample, VLCCs switched into Suezmax trades as long as port facilities can handle bigger vessels.
Demand for crude oil tankers is centred on the major oil companies. The oil industry has witnessed a significant degree of consolidation in the past decade, and this has been reflected in the chartering patterns. Our fixture database recorded 220 charterers in the crude oil market in 2003, with the top 20 accounting for 55% of tonnage. In the past the oil majors have also played a significant role in the ownership of the fleet, although this has diminished and they now only account for just 38 vessels. The majority of the fleet is currently owned by independent owners. The top 20 owners account for almost half of the fleet by dwt, though ownership in the larger sectors is more concentrated. Owning and operating the largest tankers requires considerable capital investment.
The sale & purchase market is relatively active, with 9% of the fleet by dwt changing hands in 2003. Over the past few years this market has been characterised by several large en-bloc deals, with the major players adding to their fleets.
A2.3 Crude Oil Tanker Market Profile World European Union
ships m.dwt # owners ships m.dwt # ownersFleet, Mar-04 1,314 222.4 219 429 68.2 88Orderbook, Mar-04 324 53.5 93 142 20.4 44O'book as % of fleet 24.7% 24.1% 33.1% 29.9%Top 20 Owners' Fleet, m.dwt, Mar-04 569 108.8 228 43.9% of fleet 43.3% 48.9% 53.1% 64.4%Ownership TypeIndustrial & Utilities 5 1.4 17 Oil Majors 38 7.0 4 16 3.6 3Other Oil Companies 117 22.7 20 11 1.3 3State Owned Commercial 90 9.6 11State Owned Non-CommercialIndependent Public 289 54.9 24 28 5.5 4Independent Private 773 126.6 167 374 57.7 79Independent Manager 2 0.2 2NB Contracts, m.dwt, 2003 214 34.3% of fleet 16.3% 15.4%S/H Sales, m.dwt, 2003 144 19.8% of fleet 11.0% 8.9%Entry Conditions. Relatively easy. Asset costs depend on size of vessel (current VLCC price = $84m).
Type of Cargo, Charters. Homogeneous cargo encourages competition between vessels of different sizes.Long-term contracts, period charters and spot chartering all widely used. Main charterers are oil majors/traders.Cargo Volumes 2000 2001 2002 2003World Imports, m.bpd 33.1 33.0 32.2 33.9
growth 23% 0% -2% 5%EU Imports, m.bpd 9.7 9.3 8.7 9.1
growth -32% -4% -6% 5%Source: Clarkson Research Studies

Clarkson Research Studies 41 April 2004
THE CRUDE TANKER MARKETShip Types Load areas
VLCC TANKER FLEET>200,000 DWT 425 SHIPS OF 123.7 M . DWT
SUEZM AXTANKER FLEET
120-200,000 DWT 288 SHIPS OF 42.6 M . DWT
COM BINEDCARRIERS
117 SHIPS OF 11.7M . DWT
ARABIAN GULFWEST AFRICARED SEA NORTH SEAMED.
MED.WEST AFRICABLACK SEANORTH SEA
NORTH SEAMED.CARIBBEANARABIAN GULFS.E. ASIABLACK SEACHINA
AFRAM AXTANKER FLEET
80-120,000 DWT 584 SHIPS OF 57.3 M . DWT
Crude Oil Tanker Fleet Ownership Profile
Tanker Average Spot Earnings
0
10
20
30
40
50
60
70
80
Jan-
90Ja
n-91
Jan-
92Ja
n-93
Jan-
94Ja
n-95
Jan-
96Ja
n-97
Jan-
98Ja
n-99
Jan-
00Ja
n-01
Jan-
02Ja
n-03
Jan-
04
Source: Clarkson Research Studies
$,000/d
Crude Tankers
OrderbookCompany Size World Orderbook European Union Owners
# Companies # Ships m. Dwt Avg. Ships # Companies # Ships m. Dwt Avg. Ships (# owned vessels)
300+200-299100-199
50-99 2 16 1.86 810-49 35 139 25.11 4 13 62 9.18 5
5-9 39 61 10.51 2 18 31 4.61 22-4 69 56 8.56 1 31 32 4.66 10-1 84 45 6.36 1 32 17 1.90 1
Unknown 7 1.14Total 229 324 53.54 1 94 142 20.36 2
Source: Clarkson Research Studies
FleetCompany Size World Fleet European Union Owners
# Companies # Ships m. Dwt Avg. Ships # Companies # Ships m. Dwt Avg. Ships (# owned vessels)
300+200-299100-199
50-99 2 118 21.94 5910-49 35 667 112.60 19 13 195 29.05 15
5-9 39 258 48.10 7 18 117 21.25 72-4 69 196 31.06 3 31 91 14.87 30-1 84 73 8.47 1 32 26 2.99 1
Unknown 2 0.18Total 229 1,314 222.35 6 94 429 68.17 5
Source: Clarkson Research Studies
Source: Clarkson Research Studies

Clarkson Research Studies 42 April 2004
Oil Products Tanker Sector Overview
For the purposes of this review the oil products tanker fleet is defined as all non-specialised tankers below 60,000 dwt, as well as coated tankers above this size. These ships carry a spectrum of cargoes, ranging from relatively unsophisticated dirty products such as fuel oil through to clean products such as naphtha. Vessels that trade at one end of this spectrum are unlikely to be able to switch easily to the other end, and “last cargo” regulations ensure that dedicated fleets become established for some cargo types. At the most sophisticated end of the fleet there is an overlap with the chemical sector, with a significant volume of “swing tonnage” that can operate in either CPP or easychems depending on market conditions.
The ownership structure is relatively diverse. According to our database 509 companies own a total of 1,575 product tankers, with 269 vessels owned by 1-ship companies. There are 26 companies who own 10 or more vessels. This sector has received a massive amount of investment in the past few years and the orderbook for delivery over the next couple of years stands at 37% of the fleet. In the wake of the Erika and Prestige there has been a growing focus on modern, quality ships.
Demand is typically short-haul, matching refinery production with intra-regional demand. However, some longer-haul routes serve major refining regions such as the Middle East and the Caribbean. The biggest charterers are the major oil companies and oil traders. In 2003 our fixture database re-corded 264 charterers of oil products tonnage, with the top 20 responsible for 59% of trade.
A2.4 Oil Products Tanker Market Profile World European Union
ships m.dwt # owners ships m.dwt # ownersFleet, Mar-04 1,599 50.9 473 444 18.3 135Orderbook, Mar-04 372 19.0 93 182 9.6 40O'book as % of fleet 23.3% 37.4% 41.0% 52.5%Top 20 Owners' Fleet, m.dwt, Mar-04 419 16.9 165 10.2% of fleet 26.2% 33.2% 37.2% 55.7%Ownership TypeIndustrial & Utilities7 Oil Majors 22 1.1 5 14 0.8 2Other Oil Companies 91 2.9 20 7 0.2 3State Owned Commercial 322 7.7 28State Owned Non-Commercial 3 0.1 1Independent Public 163 7.5 29 53 2.4 8Independent Private 990 31.4 397 368 14.9 121Independent Manager 8 0.3 3 2 0.1 2NB Contracts, m.dwt, 2003 244 13.0% of fleet 15.3% 25.5%S/H Sales, m.dwt, 2003 108 5.7% of fleet 6.8% 11.3%Entry Conditions. Capital costs are relatively low compared with larger crude oil sectors. Several major pooling arrangements are in operation.Type of Cargo, Charters. A wide range of cargoes (fuel oil, gas oil, gasolene, jet, naphtha, mtbe). Long-term contracts, period charters and spot chartering all widely used. Main charterers are oil majors/traders.Cargo Volumes 2000 2001 2002 2003World Imports, m.bpd 10.0 11.0 11.2 11.6
growth -63% 10% 2% 4%EU Imports, m.bpd 3.7 4.2 4.0 3.5
growth -74% 14% -5% -13%Source: Clarkson Research Studies
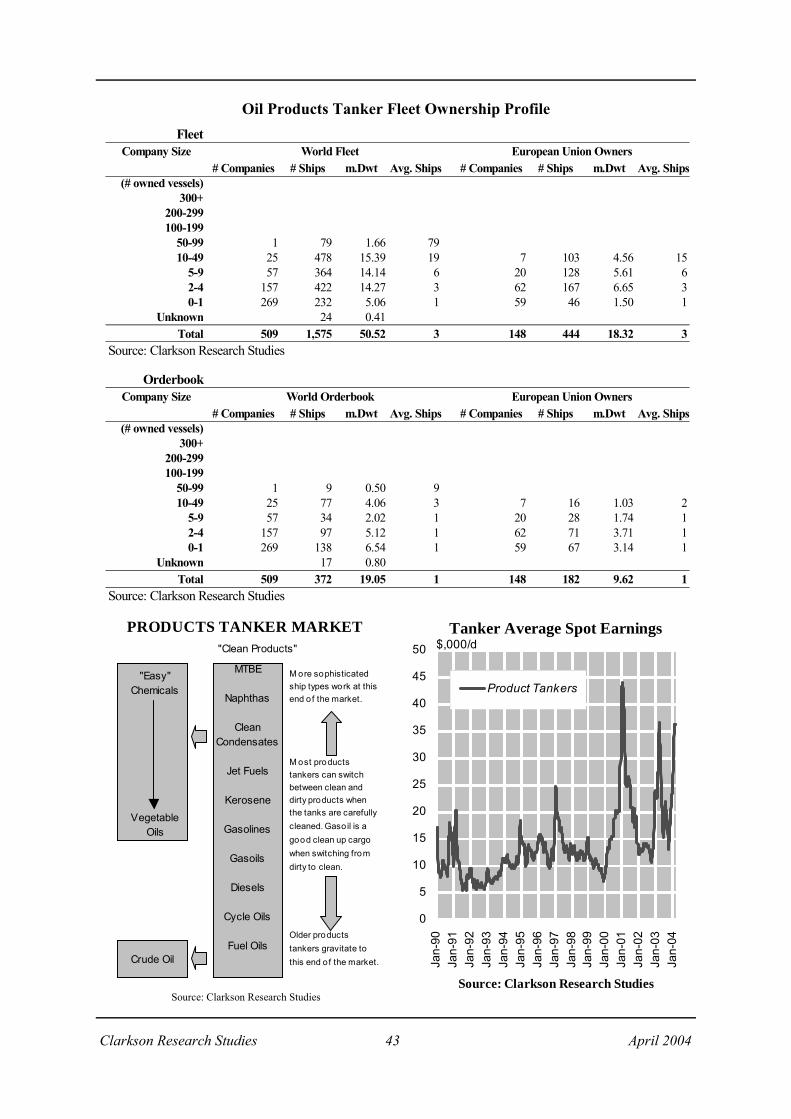
Clarkson Research Studies 43 April 2004
PRODUCTS TANKER MARKET
MTBE
Naphthas
CleanCondensates
Jet Fuels
Kerosene
Gasolines
Gasoils
Diesels
Cycle Oils
Fuel Oils
"Clean Products"
M ore sophisticated ship types work at this end o f the market.
M ost products tankers can switch between clean and dirty products when the tanks are carefully cleaned. Gasoil is a good clean up cargo when switching from dirty to clean.
Older products tankers gravitate to this end of the market.
"Easy" Chemicals
Vegetable Oils
Crude Oil
Oil Products Tanker Fleet Ownership Profile
Tanker Average Spot Earnings
0
5
10
15
20
25
30
35
40
45
50
Jan-
90Ja
n-91
Jan-
92Ja
n-93
Jan-
94Ja
n-95
Jan-
96Ja
n-97
Jan-
98Ja
n-99
Jan-
00Ja
n-01
Jan-
02Ja
n-03
Jan-
04
Source: Clarkson Research Studies
$,000/d
Product Tankers
FleetCompany Size World Fleet European Union Owners
# Companies # Ships m.Dwt Avg. Ships # Companies # Ships m.Dwt Avg. Ships (# owned vessels)
300+200-299100-199
50-99 1 79 1.66 7910-49 25 478 15.39 19 7 103 4.56 15
5-9 57 364 14.14 6 20 128 5.61 62-4 157 422 14.27 3 62 167 6.65 30-1 269 232 5.06 1 59 46 1.50 1
Unknown 24 0.41Total 509 1,575 50.52 3 148 444 18.32 3
Source: Clarkson Research Studies
OrderbookCompany Size World Orderbook European Union Owners
# Companies # Ships m.Dwt Avg. Ships # Companies # Ships m.Dwt Avg. Ships (# owned vessels)
300+200-299100-199
50-99 1 9 0.50 910-49 25 77 4.06 3 7 16 1.03 2
5-9 57 34 2.02 1 20 28 1.74 12-4 157 97 5.12 1 62 71 3.71 10-1 269 138 6.54 1 59 67 3.14 1
Unknown 17 0.80Total 509 372 19.05 1 148 182 9.62 1
Source: Clarkson Research Studies
Source: Clarkson Research Studies

Clarkson Research Studies 44 April 2004
Chemical Tanker Sector Overview
The chemical tanker fleet includes: 1. Modern parcel tankers with either full or partial stainless steel tanks that cover the sophisticated end of the chemicals market, for which IMO Grade I/II is required, and 2. Newer parcel tankers with the flexibility to carry many cargoes, from easy chemicals through caustic soda to methanol, requiring IMO Grade III (last cargo requirements are also enforced).
Owners operate liner-type parcel services based on Contracts of Affreightment with a small number of major industrial charterers. The sophisticated end of the chemical tanker market can be character-ised as an “industrial shipping” sector. The operation of chemical parcel services, with many differ-ent cargoes loaded into a single vessel with as many as 30-40 tanks with separate pumping arrange-ments, is highly complex and requires a high degree of skill / experience to ensure high utilisation levels are achieved. The strong degree of control exerted by the major owners through long-term contracts has produced less volatility in earnings and vessel prices than in standard, commoditised bulk shipping.
The main fleet figures in our table above refer to all chemical tankers with IMO grade tanks. Also shown are the orderbook and top 20 owner %age figures for just the IMO 1 and 2 grade fleet. These indicate a greater degree of consolidation within the specialised chemical fleet, with the top 20 own-ers responsible for over 42%. It also shows an orderbook that in relative terms is smaller, equivalent to 14% of the fleet to be delivered between now and 2007.
A2.5 Chemical Tanker Market Profile World European Union
ships m.dwt # owners ships m.dwt # ownersFleet, Mar-04 2,179 32.9 703 644 11.1 180Orderbook, Mar-04 329 8.2 118 148 4.0 56O'book as % of fleet 15.1% 24.9% 23.0% 35.9%O'book as % of fleet (exc. IMO 3 Only) 9.8% 14.2%Top 20 Owners' Fleet, m.dwt, Mar-04 383 11.1 183 5.5% of fleet 17.6% 33.7% 28.4% 49.5%% of fleet (excluding IMO 3 Only vessels) 22.0% 42.6%Ownership TypeIndustrial & Utilities 12 0.4 27 Oil Majors 5 0.2 2Other Oil Companies 43 0.8 14 17 0.2 2State Owned Commercial 73 1.1 20State Owned Non-CommercialIndependent Public 250 7.2 24 47 1.4 8Independent Private 1,786 23.1 670 574 9.4 178Independent Manager 10 0.2 5 6 0.1 3NB Contracts, m.dwt, 2003 125 2.2% of fleet 5.7% 6.8%S/H Sales, m.dwt, 2003 56 0.96% of fleet 2.6% 2.9%Entry Conditions. The small number of owners and charterers present higher barriers to entry. The ownership structure is highly concentrated with pooling arrangements in place.Type of Cargo, Charters. Owners operate liner-type parcel services based on COAs with a small number of major industrial charterers. There is a larger proportion of spot trade in the smaller sectors.Cargo Volumes 2000 2001 2002 (e) 2003 (e)World Imports, m.tonnes 108.5 110.7 116.2 118.4
growth 3% 2% 5% 2%Source: Clarkson Research Studies, Drewry.
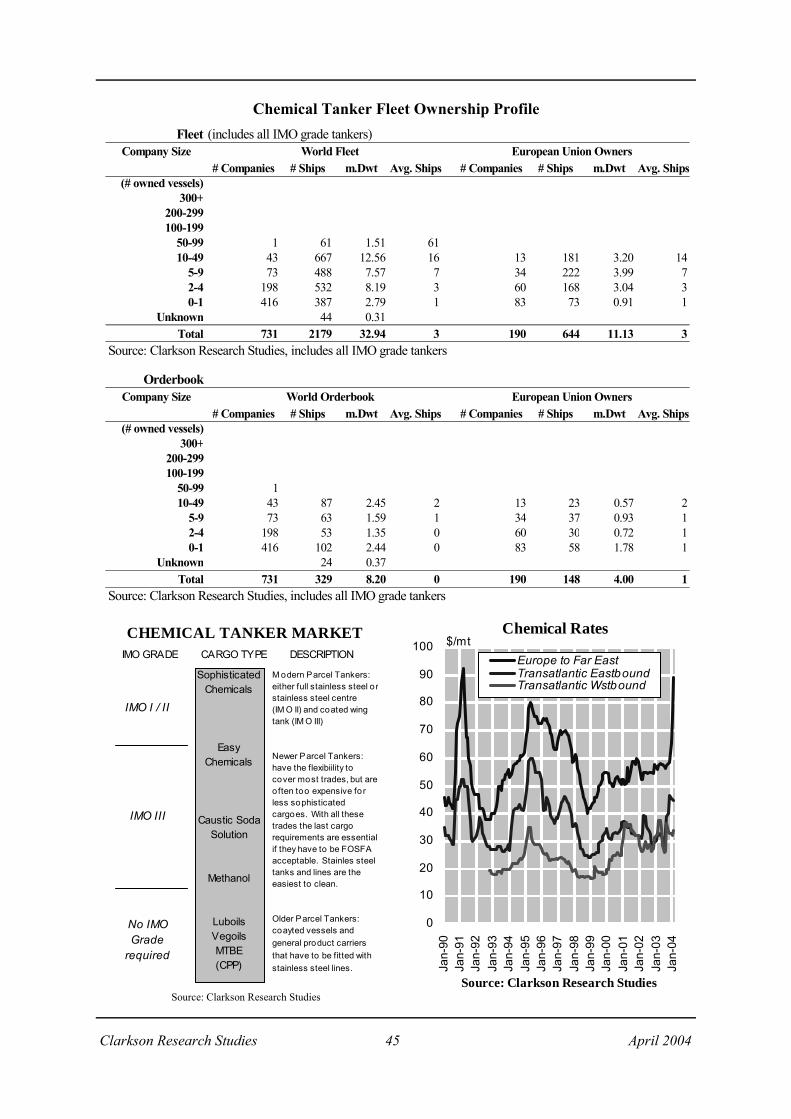
Clarkson Research Studies 45 April 2004
CHEMICAL TANKER MARKET
Sophisticated Chemicals
EasyChemicals
Caustic SodaSolution
Methanol
LuboilsVegoilsMTBE(CPP)
IMO GRADE CARGO TYPE DESCRIPTION
M odern Parcel Tankers: either full stainless steel o rstainless steel centre (IM O II) and coated wing tank (IM O III)
Newer Parcel Tankers: have the flexibiility to cover most trades, but are o ften too expensive fo r less sophisticated cargoes. With all these trades the last cargo requirements are essential if they have to be FOSFA acceptable. Stainles steel tanks and lines are the easiest to clean.
Older Parcel Tankers: coayted vessels and general product carriers that have to be fitted with stainless steel lines.
IMO I / II
IMO III
No IMO Grade
required
Chemical Tanker Fleet Ownership Profile
Chemical Rates
0
10
20
30
40
50
60
70
80
90
100
Jan-
90Ja
n-91
Jan-
92Ja
n-93
Jan-
94Ja
n-95
Jan-
96Ja
n-97
Jan-
98Ja
n-99
Jan-
00Ja
n-01
Jan-
02Ja
n-03
Jan-
04
Source: Clarkson Research Studies
$/mtEurope to Far EastTransatlantic EastboundTransatlantic Wstbound
Fleet (includes all IMO grade tankers)Company Size World Fleet European Union Owners
# Companies # Ships m.Dwt Avg. Ships # Companies # Ships m.Dwt Avg. Ships (# owned vessels)
300+200-299100-199
50-99 1 61 1.51 6110-49 43 667 12.56 16 13 181 3.20 14
5-9 73 488 7.57 7 34 222 3.99 72-4 198 532 8.19 3 60 168 3.04 30-1 416 387 2.79 1 83 73 0.91 1
Unknown 44 0.31Total 731 2179 32.94 3 190 644 11.13 3
Source: Clarkson Research Studies, includes all IMO grade tankers
OrderbookCompany Size World Orderbook European Union Owners
# Companies # Ships m.Dwt Avg. Ships # Companies # Ships m.Dwt Avg. Ships (# owned vessels)
300+200-299100-199
50-99 110-49 43 87 2.45 2 13 23 0.57 2
5-9 73 63 1.59 1 34 37 0.93 12-4 198 53 1.35 0 60 30 0.72 10-1 416 102 2.44 0 83 58 1.78 1
Unknown 24 0.37Total 731 329 8.20 0 190 148 4.00 1
Source: Clarkson Research Studies, includes all IMO grade tankers
Source: Clarkson Research Studies
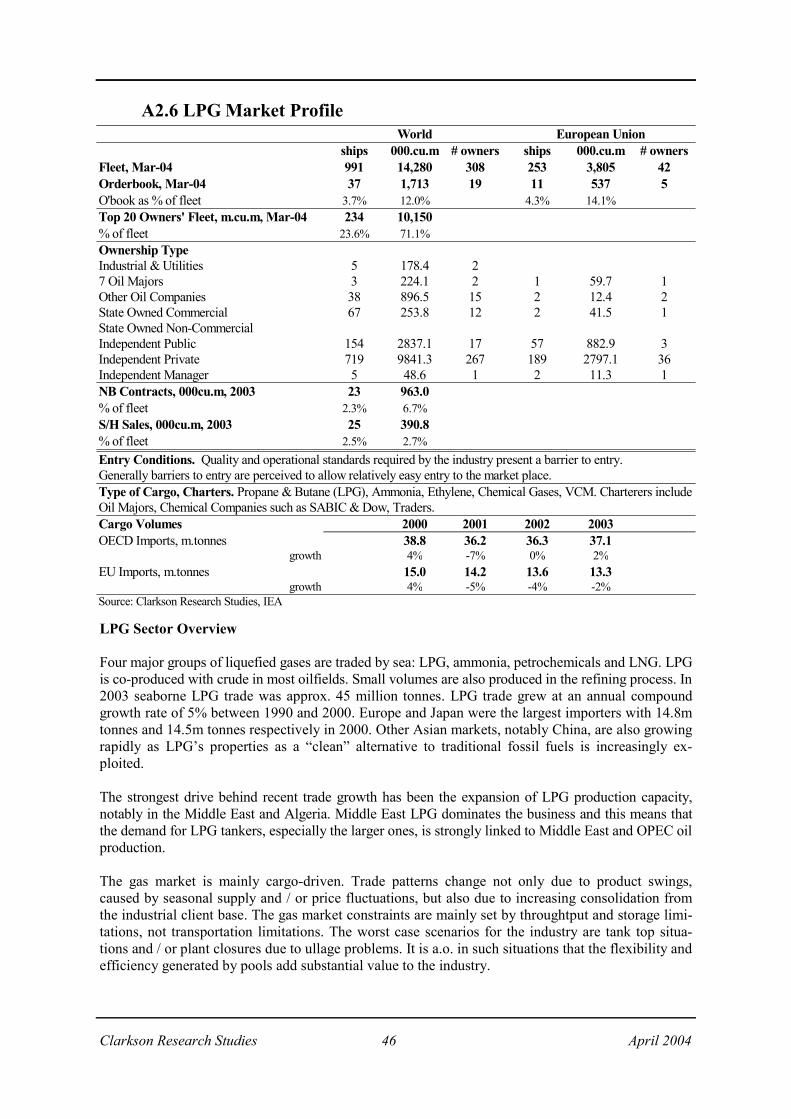
Clarkson Research Studies 46 April 2004
LPG Sector Overview Four major groups of liquefied gases are traded by sea: LPG, ammonia, petrochemicals and LNG. LPG is co-produced with crude in most oilfields. Small volumes are also produced in the refining process. In 2003 seaborne LPG trade was approx. 45 million tonnes. LPG trade grew at an annual compound growth rate of 5% between 1990 and 2000. Europe and Japan were the largest importers with 14.8m tonnes and 14.5m tonnes respectively in 2000. Other Asian markets, notably China, are also growing rapidly as LPG’s properties as a “clean” alternative to traditional fossil fuels is increasingly ex-ploited. The strongest drive behind recent trade growth has been the expansion of LPG production capacity, notably in the Middle East and Algeria. Middle East LPG dominates the business and this means that the demand for LPG tankers, especially the larger ones, is strongly linked to Middle East and OPEC oil production. The gas market is mainly cargo-driven. Trade patterns change not only due to product swings, caused by seasonal supply and / or price fluctuations, but also due to increasing consolidation from the industrial client base. The gas market constraints are mainly set by throughtput and storage limi-tations, not transportation limitations. The worst case scenarios for the industry are tank top situa-tions and / or plant closures due to ullage problems. It is a.o. in such situations that the flexibility and efficiency generated by pools add substantial value to the industry.
A2.6 LPG Market Profile World European Union
ships 000.cu.m # owners ships 000.cu.m # ownersFleet, Mar-04 991 14,280 308 253 3,805 42Orderbook, Mar-04 37 1,713 19 11 537 5O'book as % of fleet 3.7% 12.0% 4.3% 14.1%Top 20 Owners' Fleet, m.cu.m, Mar-04 234 10,150 208 3,619% of fleet 23.6% 71.1% 82.2% 95.1%Ownership TypeIndustrial & Utilities 5 178.4 27 Oil Majors 3 224.1 2 1 59.7 1Other Oil Companies 38 896.5 15 2 12.4 2State Owned Commercial 67 253.8 12 2 41.5 1State Owned Non-CommercialIndependent Public 154 2837.1 17 57 882.9 3Independent Private 719 9841.3 267 189 2797.1 36Independent Manager 5 48.6 1 2 11.3 1NB Contracts, 000cu.m, 2003 23 963.0% of fleet 2.3% 6.7%S/H Sales, 000cu.m, 2003 25 390.8% of fleet 2.5% 2.7%Entry Conditions. Quality and operational standards required by the industry present a barrier to entry. Generally barriers to entry are perceived to allow relatively easy entry to the market place.Type of Cargo, Charters. Propane & Butane (LPG), Ammonia, Ethylene, Chemical Gases, VCM. Charterers include Oil Majors, Chemical Companies such as SABIC & Dow, Traders.Cargo Volumes 2000 2001 2002 2003OECD Imports, m.tonnes 38.8 36.2 36.3 37.1
growth 4% -7% 0% 2%EU Imports, m.tonnes 15.0 14.2 13.6 13.3
growth 4% -5% -4% -2%Source: Clarkson Research Studies, IEA

Clarkson Research Studies 47 April 2004
LPG Fleet Ownership Profile Fleet
Company Size World Fleet European Union Owners# Companies # Ships 000 cum Avg. Ships # Companies # Ships 000 cum Avg. Ships
(# owned vessels)200+
100-19950-9925-49 5 169 4,265 34 2 53 1,264 2710-24 14 192 2,751 14 7 99 1,183 14
5-9 33 222 4,213 7 8 58 794 72-4 90 234 2,220 3 11 29 401 30-1 167 165 816 1 15 14 162 1
Unknown 9 14Total 309 991 14,279.8 3 43 253 3,805 6
Source: Clarkson Research Studies
OrderbookCompany Size World Orderbook European Union Owners
# Companies # Ships 000 cum Avg. Ships # Companies # Ships 000 Dwt Avg. Ships (# owned vessels)
200+100-199
50-9925-49 5 2 76.0 0 210-24 14 11 346.2 1 7 6 123.0 1
5-9 33 8 531.6 0 82-4 90 5 126.0 0 11 1 82.0 00-1 167 10 625.7 0 15 4 332.0 0
Unknown 1 7.2Total 309 37 1,712.7 0 43 11 537.0 0
Source: Clarkson Research Studies
(Continued from page 46) Since 1990 the fleet has grown from 682 vessels to the current number of 991, of which 499 are pressurised, 294 are semi refrigerated and 192 are fully refrigerated. Gas traffics are complex and market swings create continuous uncertainty for owners. In order to cope with the latter, pools have naturally developed in order to create a more efficient capacity utilization platform, which at the same time generates added value to the shippers. It basically allows owners to provide quality / flexibility / reliability / stability and economies of scale to the industry despite uncertain market con-ditions and increasingly higher operational standards set by their client base. Although pools tend to be composed of tonnage with similar capacity profiles, it needs to be stressed that there is still a high degree of competition not only within but also between the respective segments. Term deals are becoming increasingly rare for the very reason that the flexibility and the availability on the shipping market allows customers to benefit from tailor-made logistics. This development makes shipping investments more risk-bearing.
Different sizes of LPG tankers are used in different trades. The largest vessels, which typically are around 80,000 cubic meters, are used in the deep-sea trade, for example from the Arabian Gulf to Japan. There are just over a 100 of the large vessels, some of which can also be used to transport clean petroleum product (CPP) cargoes. Medium sized vessels are used in the shorter haul trades, whilst the very smallest trades are used to distribute LPG and other petrochemical gases within the regions, especially Asia and Northwest Europe.
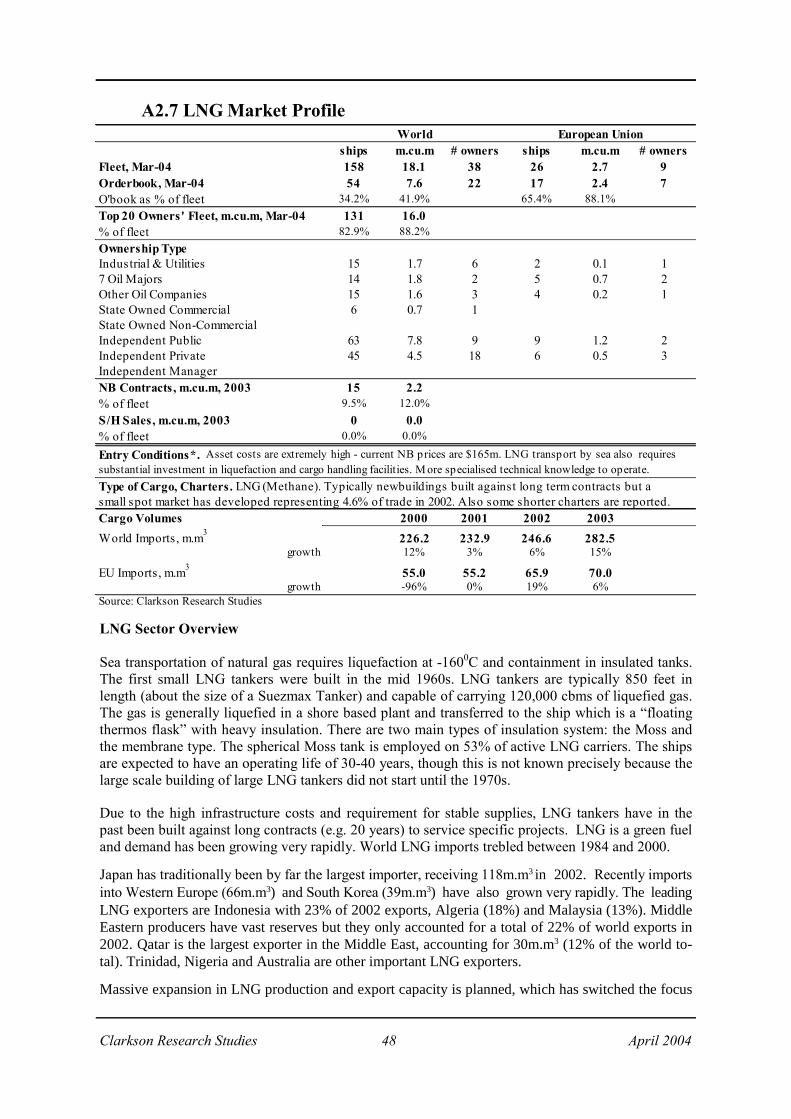
Clarkson Research Studies 48 April 2004
LNG Sector Overview Sea transportation of natural gas requires liquefaction at -1600C and containment in insulated tanks. The first small LNG tankers were built in the mid 1960s. LNG tankers are typically 850 feet in length (about the size of a Suezmax Tanker) and capable of carrying 120,000 cbms of liquefied gas. The gas is generally liquefied in a shore based plant and transferred to the ship which is a “floating thermos flask” with heavy insulation. There are two main types of insulation system: the Moss and the membrane type. The spherical Moss tank is employed on 53% of active LNG carriers. The ships are expected to have an operating life of 30-40 years, though this is not known precisely because the large scale building of large LNG tankers did not start until the 1970s.
Due to the high infrastructure costs and requirement for stable supplies, LNG tankers have in the past been built against long contracts (e.g. 20 years) to service specific projects. LNG is a green fuel and demand has been growing very rapidly. World LNG imports trebled between 1984 and 2000.
Japan has traditionally been by far the largest importer, receiving 118m.m3 in 2002. Recently imports into Western Europe (66m.m3) and South Korea (39m.m3) have also grown very rapidly. The leading LNG exporters are Indonesia with 23% of 2002 exports, Algeria (18%) and Malaysia (13%). Middle Eastern producers have vast reserves but they only accounted for a total of 22% of world exports in 2002. Qatar is the largest exporter in the Middle East, accounting for 30m.m3 (12% of the world to-tal). Trinidad, Nigeria and Australia are other important LNG exporters.
Massive expansion in LNG production and export capacity is planned, which has switched the focus
A2.7 LNG Market Profile World European Union
ships m.cu.m # owners ships m.cu.m # ownersFleet, Mar-04 158 18.1 38 26 2.7 9Orderbook, Mar-04 54 7.6 22 17 2.4 7O'book as % of fleet 34.2% 41.9% 65.4% 88.1%Top 20 Owners' Fleet, m.cu.m, Mar-04 131 16.0 26 2.7% of fleet 82.9% 88.2% 100.0% 100.0%Ownership TypeIndustrial & Utilities 15 1.7 6 2 0.1 17 Oil Majors 14 1.8 2 5 0.7 2Other Oil Companies 15 1.6 3 4 0.2 1State Owned Commercial 6 0.7 1State Owned Non-CommercialIndependent Public 63 7.8 9 9 1.2 2Independent Private 45 4.5 18 6 0.5 3Independent ManagerNB Contracts, m.cu.m, 2003 15 2.2% of fleet 9.5% 12.0%S/H Sales, m.cu.m, 2003 0 0.0% of fleet 0.0% 0.0%
Entry Conditions*. Asset costs are extremely high - current NB prices are $165m. LNG transport by sea also requires substantial investment in liquefaction and cargo handling facilities. M ore specialised technical knowledge to operate.Type of Cargo, Charters. LNG (Methane). Typically newbuildings built against long term contracts but a small spot market has developed representing 4.6% of trade in 2002. Also some shorter charters are reported.Cargo Volumes 2000 2001 2002 2003World Imports, m.m3 226.2 232.9 246.6 282.5
growth 12% 3% 6% 15%
EU Imports, m.m3 55.0 55.2 65.9 70.0growth -96% 0% 19% 6%
Source: Clarkson Research Studies

Clarkson Research Studies 49 April 2004
LNG Fleet Ownership Profile Fleet
Company Size World Fleet European Union Owners# Companies # Ships m cum Avg. Ships # Companies # Ships m cum Avg. Ships
(# owned vessels)200+
100-19950-9925-4910-24 4 55 6.4 14
5-9 7 49 6.3 7 1 7 0.9 72-4 15 42 4.1 3 7 18 0.1 30-1 17 12 1.3 1 4 1 1.6 0
UnknownTotal 43 158 18.1 4 12 26 2.7 2
Source: Clarkson Research Studies
OrderbookCompany Size World Orderbook European Union Owners
# Companies # Ships m cum Avg. Ships # Companies # Ships m cum Avg. Ships (# owned vessels)
200+100-199
50-9925-4910-24 4 11 1.5 3
5-9 7 10 1.4 1 1 5 0.7 52-4 15 20 2.8 1 7 5 1.0 10-1 17 13 1.9 1 4 7 0.6 2
UnknownTotal 43 54 7.6 1 12 17 2.4 1
Source: Clarkson Research Studies
(Continued from page 48) onto the LNG carrier newbuilding market. The LNG fleet currently consists of 158 vessels , with an-other 54 vessels on order. Unlike LPG, which has many small vessels, the majority of vessels are over 130,000 cubic meters in size. 2002 and 2003 saw heavy ordering of LNG carriers with a total of 34 firm contracts. Another 11 have been placed in the first 3 months of 2004. Almost all of the ves-sels on order are in the 135,000 cbm to 145,000 cbm size range. This compares to the average vessel size of 96,500 cbm in the 1970s. Although there is no technical reason why vessels up to 200,000 cbm cannot be built, they are inhibited by port and storage limitations.
Currently a 138,000 cubic meter LNG newbuilding costs around $165 million. For comparison, in 1990 a 125,000 cubic meter vessel cost $225-250 million. The fall reflects the greater competitive-ness of the ship building industry and improvements in engineering. Because LNG ships have gener-ally been built for specific projects, the second hand market is very limited and the only entry vehi-cle is a company purchase or newbuilding. Recently as ships have come off long leases, we have seen the first indication of a second hand market, but prices are very difficult to establish. For this reason we are not able to quote specific second hand prices.
* Entry Barriers. It has earlier been a common assumption that entry barriers have been moderate or high due to the fact that the transportation has been considered as an integrated part of value chain – organised by the exporter or the importer. These have been significantly reduced over recent years through "outsourcing" of the maritime transport-element, with the entry of new players/investors thanks to the lower shipbuilding prices and the speculations of a growing market for the coming years. Therefore we will not only have project-related vessels, but also LNG carriers operating on a spot market and the emergence of independent LNG-shipowners.
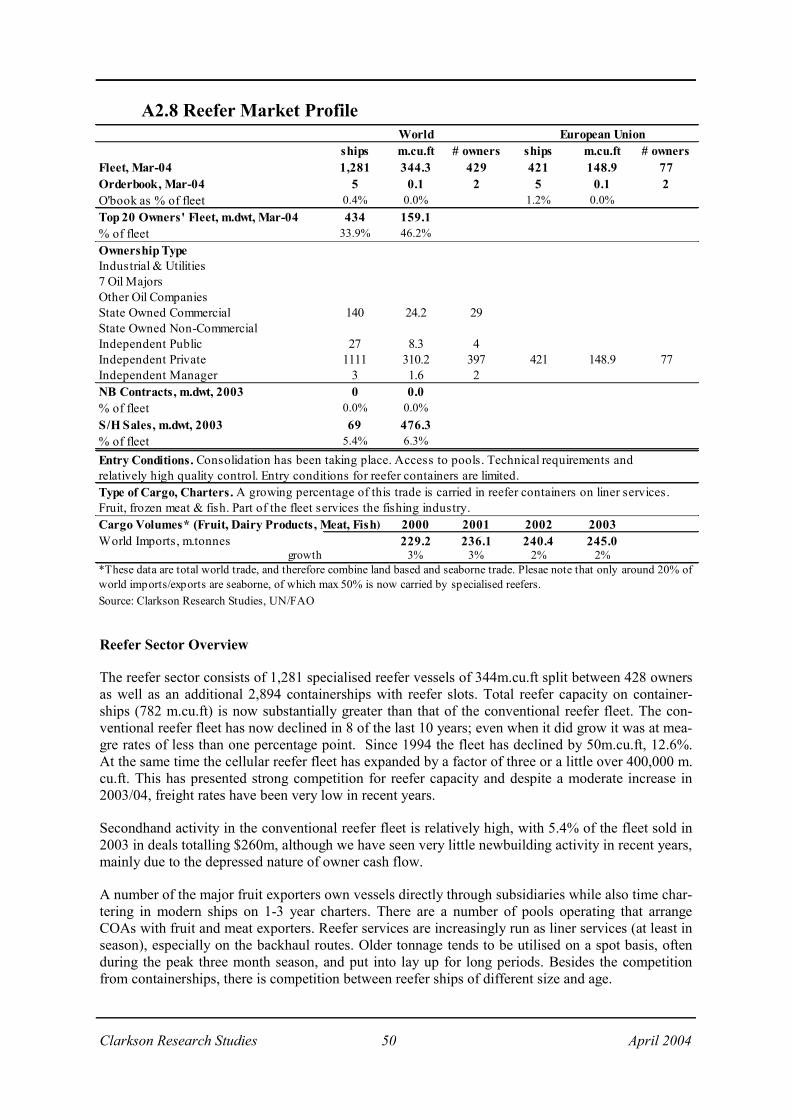
Clarkson Research Studies 50 April 2004
Reefer Sector Overview
The reefer sector consists of 1,281 specialised reefer vessels of 344m.cu.ft split between 428 owners as well as an additional 2,894 containerships with reefer slots. Total reefer capacity on container-ships (782 m.cu.ft) is now substantially greater than that of the conventional reefer fleet. The con-ventional reefer fleet has now declined in 8 of the last 10 years; even when it did grow it was at mea-gre rates of less than one percentage point. Since 1994 the fleet has declined by 50m.cu.ft, 12.6%. At the same time the cellular reefer fleet has expanded by a factor of three or a little over 400,000 m.cu.ft. This has presented strong competition for reefer capacity and despite a moderate increase in 2003/04, freight rates have been very low in recent years.
Secondhand activity in the conventional reefer fleet is relatively high, with 5.4% of the fleet sold in 2003 in deals totalling $260m, although we have seen very little newbuilding activity in recent years, mainly due to the depressed nature of owner cash flow.
A number of the major fruit exporters own vessels directly through subsidiaries while also time char-tering in modern ships on 1-3 year charters. There are a number of pools operating that arrange COAs with fruit and meat exporters. Reefer services are increasingly run as liner services (at least in season), especially on the backhaul routes. Older tonnage tends to be utilised on a spot basis, often during the peak three month season, and put into lay up for long periods. Besides the competition from containerships, there is competition between reefer ships of different size and age.
A2.8 Reefer Market Profile World European Union
ships m.cu.ft # owners ships m.cu.ft # ownersFleet, Mar-04 1,281 344.3 429 421 148.9 77Orderbook, Mar-04 5 0.1 2 5 0.1 2O'book as % of fleet 0.4% 0.0% 1.2% 0.0%Top 20 Owners' Fleet, m.dwt, Mar-04 434 159.1 314 120.3% of fleet 33.9% 46.2% 74.6% 80.8%Ownership TypeIndustrial & Utilities7 Oil MajorsOther Oil CompaniesState Owned Commercial 140 24.2 29State Owned Non-CommercialIndependent Public 27 8.3 4Independent Private 1111 310.2 397 421 148.9 77Independent Manager 3 1.6 2NB Contracts, m.dwt, 2003 0 0.0% of fleet 0.0% 0.0%S/H Sales, m.dwt, 2003 69 476.3% of fleet 5.4% 6.3%
Entry Conditions. Consolidation has been taking place. Access to pools. Technical requirements and relatively high quality control. Entry conditions for reefer containers are limited.Type of Cargo, Charters. A growing percentage of this trade is carried in reefer containers on liner services.Fruit, frozen meat & fish. Part of the fleet services the fishing industry. Cargo Volumes* (Fruit, Dairy Products, Meat, Fish) 2000 2001 2002 2003World Imports, m.tonnes 229.2 236.1 240.4 245.0
growth 3% 3% 2% 2%*These data are total world trade, and therefore combine land based and seaborne trade. Plesae note that only around 20% of world imports/exports are seaborne, of which max 50% is now carried by specialised reefers.Source: Clarkson Research Studies, UN/FAO

Clarkson Research Studies 51 April 2004
Reefer Fleet Ownership Profile
Reefer Spot Rates
0
20
40
60
80
100
120
Jan-
01
May
-01
Sep-
01
Jan-
02
May
-02
Sep-
02
Jan-
03
May
-03
Sep-
03
Jan-
04
Source: ReeferTrends
c/cuft
200-350,000 cuft
350-550,000 cuft
OrderbookCompany Size World Orderbook European Union Owners
# Companies # Ships m cuft Avg. Ships # Companies # Ships m cuft Avg. Ships (# owned vessels)
200+100-199
50-99 2 4 2 2 4 225-49 310-24 21 11
5-9 28 1 0 8 1 02-4 106 230-1 268 33
UnknownTotal 428 5 0.0 0 77 5 0.0 0
Source: Clarkson Research Studies
Historical Reefer Capacity
0
100
200
300
400
500
600
700
800
1980
1982
1984
1986
1988
1990
1992
1994
1996
1998
2000
2002
2004
Source: Clarkson Research Studies
m cuft
Reefership Containership
Fleet data at start of year
Containership reefer capacity now more than twice as large as that on
conventional reeferships
FleetCompany Size World Fleet European Union Owners
# Companies # Ships m cuft Avg. Ships # Companies # Ships m cuft Avg. Ships (# owned vessels)
200+100-199
50-99 2 128 40.4 64 2 126 40.0 6325-49 3 92 25.1 3110-24 21 286 100.1 14 11 142 57.0 13
5-9 28 187 60.6 7 8 57 24.3 72-4 106 268 69.5 3 23 63 20.3 30-1 268 268 41.0 1 33 33 7.3 1
Unknown 52 7.7Total 428 1,281 344.3 3 77 421 148.9 5
Source: Clarkson Research Studies

Clarkson Research Studies 52 April 2004
Ro-Ro Sector Overview
Diverse and somewhat elderly in some sectors, the RoRo fleet offers unconventional flexibility which allows it to carry whatever type of cargo is offered, and to serve ports where access might oth-erwise prove a problem. However, there is still a surplus of ships in service built in the mid/late 1970s (422 RoRos built before 1980 are still in operation).
Ownership is very fragmented, with 439 owners and an average company size of only two vessels. Newbuilding activity has been low in recent years, due to fairly depressed cash flow conditions for owners and a lack of fleet renewal. Liquidity in the sale and purchase market is low.
Analysis of the RoRo fleet is complex due to the diversity of the fleet and as a result it is a difficult sector to define. There are 1,035 ships in the RoRo sector, averaging 8,501 dwt, and 19 years of age. One sector is the deep sea Ro Ro sector, serviced by specialist players on long haul routes operating liner like services. We generally class these as Ro Ro container of which there are around 100, with a dwt above 20,000 dwt, lane metre capacity of around 2,500 and container capacity over 1,000 teu. A second sector consists of smaller vessels operating on ferry / liner type services on short haul routes such as Baltic, Mediterranean, US Gulf and Japan. It is difficult to make a clear distinction between Ro Ro passenger ships (not included in statistics above) and the Ro Ros operating in these trades. A third sector is more spot or short term charter orientated. In this sector, military demand demand can have a certain impact for some owners.
A2.9 Ro Ro Market Profile World European Union
ships m.dwt # owners ships m.dwt # ownersFleet, Mar-04 1,035 9.0 431 480 4.0 166Orderbook, Mar-04 45 0.4 23 30 0.3 15O'book as % of fleet 4.3% 4.8% 6.3% 8.0%Top 20 Owners' Fleet, m.dwt, Mar-04 190 3.8 188 2.2% of fleet 18.4% 42.2% 39.2% 56.7%Ownership TypeIndustrial & Utilities 1 0.0 17 Oil MajorsOther Oil CompaniesState Owned Commercial 73 0.4 21 3 0.0 3State Owned Non-Commercial 15 0.5 1Independent Public 83 1.3 14 55 0.6 7Independent Private 860 6.7 397 422 3.3 158Independent Manager 3 0.0 3NB Contracts, m.dwt, 2003 20 200.0% of fleet 1.9% 2.2%S/H Sales, m.dwt, 2003 28 272.3% of fleet 2.7% 3.0%
Entry Conditions.
Type of Cargo, Charters. Type of cargo very varied including HGVs, containers, wheeled traffic, OOG, awkwardloads. Deep sea and short sea trades are very different in nature.Source: Clarkson Research Studies

Clarkson Research Studies 53 April 2004
Ro Ro Fleet Ownership Profile
Historical Ro-Ro Fleet (excl. PCCs)
0
2
4
6
8
10
1982
1984
1986
1988
1990
1992
1994
1996
1998
2000
2002
2004
m dwt
0.0
0.2
0.4
0.6
0.8
1.0
Source: Clarkson Research Studies
m dwt
10,000 dwt +2,500-9,999 dwt
Start year fleet (left hand axis)
Deliveries (right hand axis)
OrderbookCompany Size World Orderbook European Union Owners
# Companies # Ships 000 Dwt Avg. Ships # Companies # Ships 000 Dwt Avg. Ships (# owned vessels)
200+100-199
50-9925-4910-24 13 8 77.6 1 9 8 77.6 1
5-9 38 4 42.6 0 20 2 20.0 02-4 143 13 115.2 0 58 8 75.0 00-1 245 19 187.8 0 83 12 142.8 0
Unknown 1 10.5Total 439 45 433.7 0 170 30 315.4 0
Source: Clarkson Research Studies
FleetCompany Size World Fleet European Union Owners
# Companies # Ships 000 Dwt Avg. Ships # Companies # Ships 000 Dwt Avg. Ships (# owned vessels)
200+100-199
50-9925-4910-24 13 172 2,780.8 13 9 115 1,379.7 13
5-9 38 247 2,342.4 7 20 130 1,161.6 72-4 143 364 2,550.6 3 58 156 994.1 30-1 245 236 1,250.0 1 83 79 416.1 1
Unknown 16 57.2Total 439 1,035 8,981.0 2 170 480 3,951.4 3
Source: Clarkson Research Studies
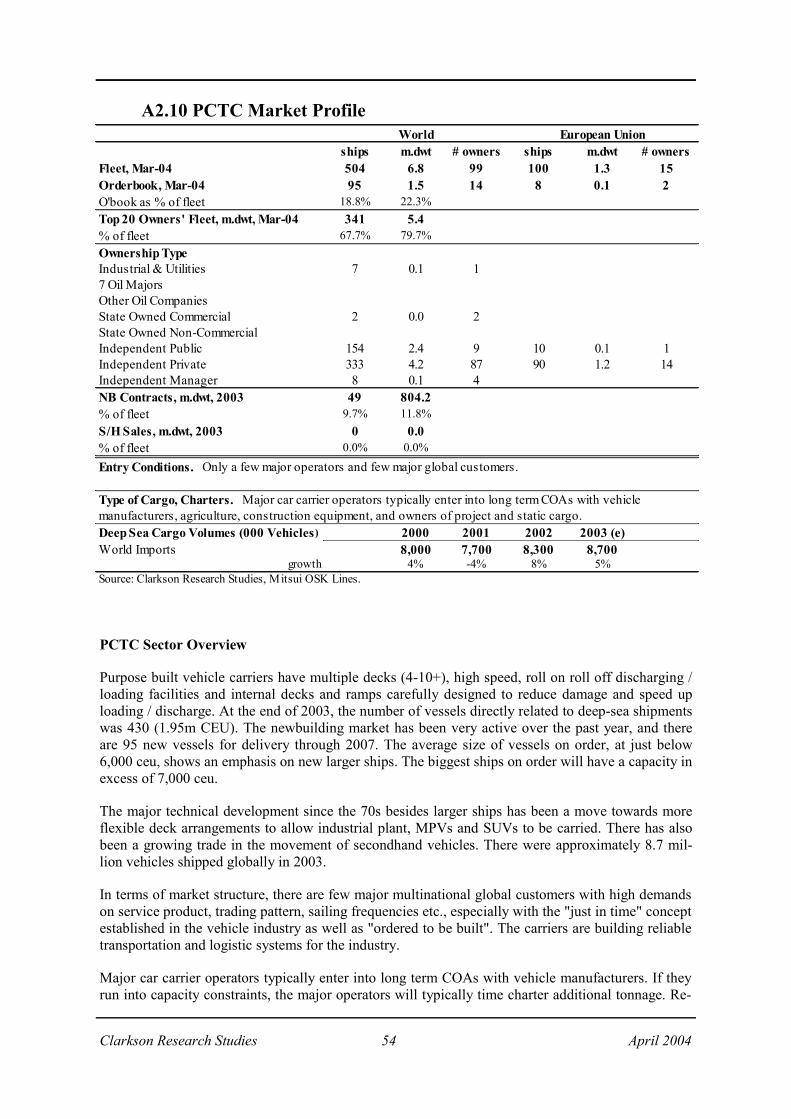
Clarkson Research Studies 54 April 2004
PCTC Sector Overview
Purpose built vehicle carriers have multiple decks (4-10+), high speed, roll on roll off discharging / loading facilities and internal decks and ramps carefully designed to reduce damage and speed up loading / discharge. At the end of 2003, the number of vessels directly related to deep-sea shipments was 430 (1.95m CEU). The newbuilding market has been very active over the past year, and there are 95 new vessels for delivery through 2007. The average size of vessels on order, at just below 6,000 ceu, shows an emphasis on new larger ships. The biggest ships on order will have a capacity in excess of 7,000 ceu.
The major technical development since the 70s besides larger ships has been a move towards more flexible deck arrangements to allow industrial plant, MPVs and SUVs to be carried. There has also been a growing trade in the movement of secondhand vehicles. There were approximately 8.7 mil-lion vehicles shipped globally in 2003.
In terms of market structure, there are few major multinational global customers with high demands on service product, trading pattern, sailing frequencies etc., especially with the "just in time" concept established in the vehicle industry as well as "ordered to be built". The carriers are building reliable transportation and logistic systems for the industry.
Major car carrier operators typically enter into long term COAs with vehicle manufacturers. If they run into capacity constraints, the major operators will typically time charter additional tonnage. Re-
A2.10 PCTC Market Profile World European Union
ships m.dwt # owners ships m.dwt # ownersFleet, Mar-04 504 6.8 99 100 1.3 15Orderbook, Mar-04 95 1.5 14 8 0.1 2O'book as % of fleet 18.8% 22.3%Top 20 Owners' Fleet, m.dwt, Mar-04 341 5.4 100 1.3% of fleet 67.7% 79.7% 100.0% 100.0%Ownership TypeIndustrial & Utilities 7 0.1 17 Oil MajorsOther Oil CompaniesState Owned Commercial 2 0.0 2State Owned Non-CommercialIndependent Public 154 2.4 9 10 0.1 1Independent Private 333 4.2 87 90 1.2 14Independent Manager 8 0.1 4NB Contracts, m.dwt, 2003 49 804.2% of fleet 9.7% 11.8%S/H Sales, m.dwt, 2003 0 0.0% of fleet 0.0% 0.0%
Entry Conditions. Only a few major operators and few major global customers.
Type of Cargo, Charters. Major car carrier operators typically enter into long term COAs with vehiclemanufacturers, agriculture, construction equipment, and owners of project and static cargo.Deep Sea Cargo Volumes (000 Vehicles) 2000 2001 2002 2003 (e)World Imports 8,000 7,700 8,300 8,700
growth 4% -4% 8% 5%Source: Clarkson Research Studies, Mitsui OSK Lines.

Clarkson Research Studies 55 April 2004
PCTC Fleet Ownership Profile
(Continued from page 54) cently market conditions have been very tight, and this has contributed to an absence of vessels be-coming available on the secondhand market. Unlike other segments, these vessels have never been a trading commodity as they are often used by the owner during their full economical and technical life time.
Vehicles can also moved on board conventional RoRos, Reefers (often as backhaul cargoes) and in-novators are constantly looking to develop racking systems in containers to make container transport a more cost effective option.
OrderbookCompany Size World Orderbook European Union Owners
# Companies # Ships 000 Dwt Avg. Ships # Companies # Ships 000 Dwt Avg. Ships (# owned vessels)
200+100-199
50-9925-49 6 46 785.7 8 110-24 5 18 294.1 4 2 8 104.1 4
5-9 12 22 320.0 2 32-4 33 0 70-1 46 9 122.0 0 2
UnknownTotal 102 95 1,521.8 1 15 8 104.1 1
Source: Clarkson Research Studies
FleetCompany Size World Fleet European Union Owners
# Companies # Ships 000 Dwt Avg. Ships # Companies # Ships 000 Dwt Avg. Ships (# owned vessels)
200+100-199
50-9925-49 6 215 3,479.5 36 1 31 649.5 3110-24 5 79 1,083.1 16 2 28 454.1 14
5-9 12 74 958.5 6 3 16 89.3 52-4 33 93 925.1 3 7 23 130.7 30-1 46 43 386.9 1 2 2 17.1 1
UnknownTotal 102 504 6,833.0 5 15 100 1,340.8 7
Source: Clarkson Research Studies

Survey on terminal handling charges and currency and bunker
adjustment factors
A project done for the European Liner Affairs Association
Center for Maritime Economics and Logistics (MEL) Erasmus University Rotterdam
Survey on terminal handling charges and currency and bunker adjustment factors
Index 1.0 Introduction 02 2.0 Overview of responses given 03 3.0 Conclusions 05 Appendix Questionnaire 06
Confidential 1

Survey on terminal handling charges and currency and bunker adjustment factors
1.0 Introduction This report reflects the outcome of a series of interviews held on behalf of the European Liner Affairs Association during the month of October 2005. The objective of these interviews was to review the mechanism of terminal handling charges with a number of pre-selected terminal operators and shippers / consignees on one hand and to review the system of adjustment factors for currency and bunker costs with a number of cargo owners on the other hand. The interviews were done by means of a fixed questionnaire that was made available beforehand to the people interviewed. The role MEL played was twofold. Firstly it acted as a neutral institute that arranged and carried out the interviews. Secondly MEL has reported the findings back also in a neutral way. This evaluation report consists of three parts. The first part is an aggregate overview of the responses given by company. This overview is followed by a set of conclusions that can be drawn form these responses. The last part of the report is the transcripts of the telephone interviews. Rotterdam, 7 November 2005 Center for Maritime Economics and Logistics (MEL) Erasmus University Rotterdam
Confidential 2

Survey on terminal handling charges and currency and bunker adjustment factors
2.0 Overview of responses given. Terminal operators Question
Ope
rato
r A
Ope
rato
r B
Ope
rato
r C
Ope
rato
r D
Ope
rato
r E
Ope
rato
r F
Do you think that you face a competitive disadvantage as a result of the level of terminal handling costs charged by carriers?
Instead of negotiations with carriers and alliances on terminal handling charges would you like to agree these charges directly with cargo owners?
Do you think that this will not lead to extra costs of for the cargo owners? Will you use the level of terminal handling costs charged to route cargo to your terminal or port?
Do you understand the multi-trade THC structure of carriers? Do you see the differences between terminal contracts and THC charged out to the market as extra income for the line?
Would you charge one flat THC rate to the cargo owner irrespective of the destination of his cargo?
Would you like to discuss free time and storage related issues with the cargo owner instead of the carrier?
reflects a positive reply on the question asked.
Confidential 3
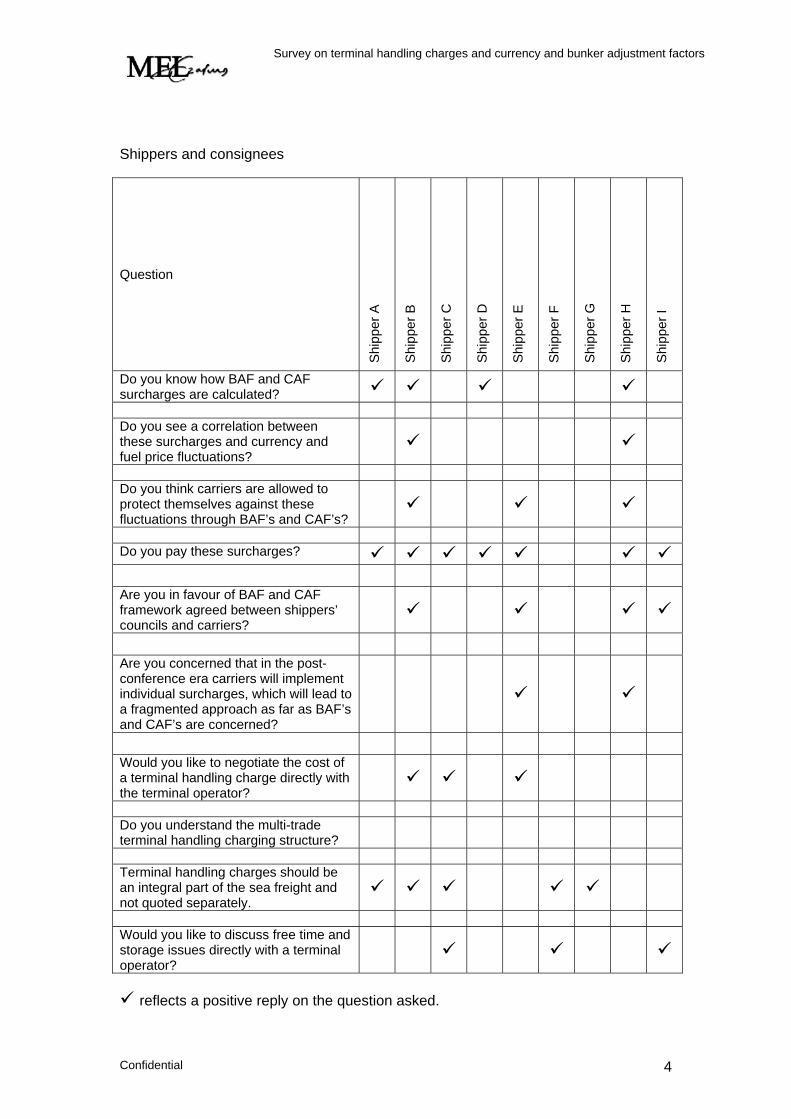
Survey on terminal handling charges and currency and bunker adjustment factors
Shippers and consignees
Question
Shi
pper
A
Shi
pper
B
Shi
pper
C
Shi
pper
D
Shi
pper
E
Shi
pper
F
Shi
pper
G
Shi
pper
H
Shi
pper
I
Do you know how BAF and CAF surcharges are calculated?
Do you see a correlation between these surcharges and currency and fuel price fluctuations?
Do you think carriers are allowed to protect themselves against these fluctuations through BAF’s and CAF’s?
Do you pay these surcharges? Are you in favour of BAF and CAF framework agreed between shippers’ councils and carriers?
Are you concerned that in the post-conference era carriers will implement individual surcharges, which will lead to a fragmented approach as far as BAF’s and CAF’s are concerned?
Would you like to negotiate the cost of a terminal handling charge directly with the terminal operator?
Do you understand the multi-trade terminal handling charging structure?
Terminal handling charges should be an integral part of the sea freight and not quoted separately.
Would you like to discuss free time and storage issues directly with a terminal operator?
reflects a positive reply on the question asked.
Confidential 4
Survey on terminal handling charges and currency and bunker adjustment factors
3.0 Conclusions Terminal operators Terminal operators have limited knowledge of the terminal handling charges carriers invoice to their customers, despite the fact that this is “freely” available information. They are concerned that “overcharging” by carriers affects their competitive position and they more or less collectively see terminal handling charges as an additional source of income for carriers. Three out of the six terminal operators have an interest to open a dialogue with cargo owners on terminal handling charges and yard related costs. One operator thought such a scenario could improve the income of the terminal considerably. An increase in number of necessary contacts with customers was not perceived as a big problem when cargo owners instead of carriers are invoiced. More and more terminal operators see their hinterland as an area where more contacts with cargo owners should be established. Shippers and consignees
Terminal handling charges Shippers and consignees are not interested in negotiating handling charges with terminal operators directly. Yard and storage related costs score slightly better. The composition of a THC, as charged by the carrier, was often considered as not transparent and, from a multi-trade perspective, cargo interests do not understand the difference in THC’s for the various trade lanes. There is a renewed interest to include the THC in the ocean freight. Freight forwarders support this, from a commission perspective, while more and more exporters prefer to start working on a “gate-in / gate-out” basis.
Currency and bunker adjustment factors. During the interviews it transpired that there is hardly any knowledge about how CAF and BAF surcharges are calculated. The general perception, especially from non-forwarder accounts, is that there is hardly any correlation with the underlying costs and that the surcharges are meant as an additional money maker for the lines. Forwarders, as intermediates, face fewer problems with these surcharges. A common complaint from their side was that these surcharges should be subject to a commission as well. The lack of transparency was often cited by cargo owners as one of the major obstacles. Like in other industries, cargo owners believe that carriers should hedge against currency and bunker risks and should not transfer these risks to the cargo owners. There is not much support for a mutually agreed calculation mechanism for bunkers and currencies between carriers and shippers’ councils. The post-conference era regarding surcharges was frequently mentioned. Several parties interviewed had serious concerns on what they mentioned as ‘a fragmented approach’ towards adjustment factors and the risk that carriers will launch individual surcharges. It is this fear that led the parties interviewed realize that the current surcharge system, although far from perfect, offers a least a degree of stability.
Confidential 5

Survey on terminal handling charges and currency and bunker adjustment factors
Appendix 1 Questionnaire Terminal handling charges Shippers and consignees.
1. A terminal handling charge covers the cost for receipt/delivery and loading/unloading of a container on board a seagoing vessel and does not differentiate between the pre- and on carrying mode of transportation like truck, barge, rail and feeder.
What is the percentage of terminal handling charges in your
overall freight bill and how constant has this percentage been over time?
Are there big differences in terminal handling charges in the various ports you are using? If so, how could this be explained?
What could be done to see a continuation of the stability of terminal handling charges in the future?
2. Ocean rate quotations made by carriers are always subject to terminal
handling charges at both origin and destination.
Could you give me some reasons why terminal handling charges should not be included in rate quotations but kept separate? How do you look at the advantage of having a terminal handling charged in local currency?
3. Shippers and consignees cannot “negotiate” the level of terminal handling
charges with carriers. There is no incentive in terms of volume, mode of transportation and the moment of delivery / pick-up. Terminal operators find these three items important to optimize their operations and would like to influence them and perhaps give incentives to these parties that can assist them in this optimisation process.
Would you be interested to start negotiating terminal handling
charges directly with terminal operators? Do you believe you have enough volume to justify this extra
effort and would you be able to achieve better rates through this? Have you ever discussed this possibility with terminal operators
and if so what was their reaction?
4. As mentioned earlier, carriers collect terminal handling charges to offset the stevedoring costs they make in a particular port. If the current practice could be changed into a new charging mechanism, which one would have your preference? Carriers quoting on a free in and out basis and stevedoring
companies charging shipper/consignees directly for delivering and receiving containers.
Shippers and consignees entering in direct contracts with terminal operators. These contracts will then also cover items like free time and demurrage / detention.
Terminal handling charges to become an integral part of the sea freight.
Confidential 6

Survey on terminal handling charges and currency and bunker adjustment factors
5. Terminal handling charges are differentiated by trade lane even when the different vessels call at the same terminal and operate under the same terminal contract. An example of this is the difference between Terminal handling charges applicable for cargo destined for the USA and for Asia.
Do you ship with different carriers and do they belong to different
alliances as well? Are the terminal handling charges differentiated among carriers you used in the past? If so, could you explain the reasons why?
6. Carriers active on a particular trade lane charge the same amount for terminal
handling charges in a particular port even when they vary in size (throughput) and have different terminal contracts. How do you perceive the fact that carriers charge the same terminal
handling charges on a particular trade lane? Is there a differentiation between the different alliances / carriers?
Should free time and demurrage / detention related cost be an issue
to be discussed between terminal operators and carriers or between shippers/consignees and terminal operators? What would have your preference?
Confidential 7

Survey on terminal handling charges and currency and bunker adjustment factors
Terminal handling charges Terminal operators.
1. A terminal handling charge is levied by an ocean carrier to its customers to cover the cost for the receipt/delivery and loading/unloading of a container on board a seagoing vessel and does not differentiate between the pre- and on carrying mode of transportation like truck, barge, rail and feeder.
Does the level of terminal handling costs charged by ocean
carriers to their customers affect the competitive position of your terminal(s)?
Do you have insight into these terminal handling charges and if
so would you charge more or less if shippers were able to negotiate directly with you?
Do you enter in terminal contracts on a per alliance basis or do
your differentiate between alliance members and/or alliances themselves?
How do you use the level of terminal handling charges as a
mechanism to reach your corporate objectives?
2. Given the fact that your contract partners are either individual carriers and or
alliances:
Would you be interested to engage in terminal handling negotiations with shippers/consignees small and large alike?
How would you rate the importance of “volume” provided by
carriers (and the economies of scale thereof), versus the need for flexibility of operations that could result from direct negotiations with shippers?
By how much, if at all, would such direct negotiations with
shipper increase your operating costs? And if they do, would you be able to pass on these costs in view of competition?
3. Carriers differentiate terminal handling charges by trade lane even when their vessels call at the same terminal and operate under the same terminal contract. An example of this is the difference between Terminal handling charges applicable for cargo destined for the USA and for Asia.
Do you follow the same degree of differentiation in your
contracts with carriers / alliances? If so, what are the reasons for this?
Do you believe that this differentiation may be reason for
shippers / consignees to route their cargo over cheaper ports i.e. ports where carriers charge a lower THC?
Confidential 8

Survey on terminal handling charges and currency and bunker adjustment factors
How would you stimulate both carriers and their customers to use modes of transport that fit better in your operations? How can you influence and achieve this?
What would happen if some part of the cost for terminal handling
is charged to carriers and the other part to shippers and consignees directly? How would you manage this from an administration and contract point of view?
Confidential 9

Survey on terminal handling charges and currency and bunker adjustment factors
Bunker and currency adjustment factors
1. Carriers have the ability to charge additional costs to customers to compensate for fluctuations in bunkers costs and currency variations.
Do you know how these surcharges are calculated by carriers
and how close they correlate with actual bunker fuel increases and currency fluctuations?
2. It is often argued by shipper councils that currency and bunker charging
mechanisms are not transparent and that the liner industry “abuses” it to increase revenue using rising bunker costs and currency adjustments as a justification.
How in your view could carriers be protected from bunker and
currency fluctuations, so that their costs do increase unpredictably and they are therefore able to offer you a competitive and predictable service?
3. Adjustment factors for bunkers and currencies are set by conferences with in
many instances outsiders following. Member lines may have completely different policies on hedging against these risks.
If CAF’s and BAF’s were to be differentiated by carrier, how
would you cope with the resulting rate instability in terms of commitments to your own clients (consumers)? Would not such an instability have an impact final consumer prices, trade, and, at the end of the day, on your own bottom line?
Have you ever, as a shipper or consignee, researched on the importance of rate stability among your own customers? Would you be interested in such a survey among consumer organisations?
4. More and more shippers/consignees are looking for fixed “all in” rates for a
specific contract period stating that they do not have the ability to charge their customers for these fluctuations in view of agreed contract terms.
What do you recommend the position of the liner industry
should be in this? 5. When a commonly agreed formula between shippers’ councils and carriers
to calculate BAF and CAF would be established and published on a monthly basis:
Would this be a workable approach in your views? If so, please explain.
What would be your preferred timing period for establishing above, immediately or should a phase out period apply?
Confidential 10