revised si appendix - proceedings of the national … appendix detouring of ... [email protected],...
TRANSCRIPT
1
SI Appendix
Detouring of Cisplatin to Access Mitochondrial Genome for Overcoming
Resistance
Sean Marrache,a,1 Rakesh K. Pathak,a,1 and Shanta Dhar*a,b
aNanoTherapeutics Research Laboratory, Department of Chemistry, University of
Georgia, Athens, GA 30602
bDepartment of Physiology and Pharmacology, University of Georgia, Athens, GA 30602
*To whom correspondence should be addressed. E-mail: [email protected] 1S.M. and R.K.P. contributed equally to this work.
Corresponding Author: Professor Shanta Dhar Department of Chemistry, Room 679 University of Georgia Athens, GA 30602 [email protected], phone: 706-542-1012, fax: 706-542-9454
2
Materials and Instrumentations: All chemicals were received and used without further
purification unless otherwise noted. Cisplatin was purchased from Strem Chemicals,
Inc. Dimethylaminopyridine (DMAP), K2PtCl4, KCl, N-hydroxysuccinimide (NHS),
triethylamine, 5-bromopentanoic acid, 6-bromohexanoic acid, sodium azide, N,N'-
dicyclohexylcarbodiimide (DCC), hydrogen peroxide solution (30 wt.% in H2O), (3-(4,5-
dimethylthiazol-2-yl)-2,5-diphenyltetrazolium bromide (MTT) were purchased from
Sigma-Aldrich. Dibenzocyclooctynes (DBCO)-amine (Product No. A103) was procured
from Click chemistry Tools Bioconjugate Technology Company. Carboxy terminated
poly(lactic-co-glycolic acid) (PLGA) [dL/g, 0.15 to 0.25 (low molecular weight, LMW)
and 0.55 to 0.75 (high molecular weight, HMW)] was procured from Lactel and OH-
PEG-OH of molecular weight 3350 was purchased from Sigma Aldrich.
Triphenyphosphine (TPP) was purchased from Sigma Aldrich. Bicinchoninic acid (BCA)
protein assay kit (Pierce 23227) was purchased from Thermo Scientific. The
mitochondrial isolation kit (catalog number PI-89874) for mammalian cells was
purchased from Thermo Scientific. Tris(hydroxymethyl)aminomethane was purchased
from Fischer Scientific. Sodium chloride, magnesium chloride, sucrose, potassium
chloride, and ethylyenediaminetetraacetic acid (EDTA) were purchased from J.T. Baker.
Oligomycin, rotenone, antimycin-A, and trifluorocarbonylcyanide phenylhydrazone
(FCCP) were purchased from Sigma Aldrich. The protease inhibitor cocktail was
purchased from Sigma Aldrich. Slide-A-Lyzer mini Dialysis Units (catalog number
69572) were purchased from Thermo Scientific. The mitochondrial DNA isolation Kit
(ab65321) and nuclear DNA isolation kit (ab65358) were purchased from Abcam.
5,5′,6,6′-Tetrachloro-1,1′,3,3′-tetraethyl-imidacarbocyanine iodide or JC-1 dye and the
Alexa Fluor® 488 Annexin V/Dead Cell Apoptosis Kit were purchased from Invitrogen.
The citrate synthase assay kit (ab119692) was purchased from Abcam.
Distilled water was purified by passage through a Millipore Milli-Q Biocel water
purification system (18.2 MΩ) containing a 0.22 µm filter. 1H, 13C spectra were recorded
on a 400 MHz; 31P NMR and 195Pt NMR spectra recorded on a 500 MHz Varian NMR
spectrometer, respectively. Electrospray ionization mass spectrometry (ESI-MS) and
high-resolution mass spectrometry (HRMS)-ESI were recorded on Perkin Elmer SCIEX
API 1 plus and Thermo scientific ORBITRAP ELITE instruments, respectively.
3
Electrochemical measurements were made at 25 °C on an analytical system model CHI
920c potentiostat from CH Instruments, Inc. (Austin, TX). Cells were counted using
Countess® Automated cell counter procured from Invitrogen life technology. Dynamic
light scattering (DLS) measurements were carried out using a Malvern Zetasizer Nano
ZS system. Optical measurements were carried out on a NanoDrop 2000
spectrophotometer. Transmission electron microscopy (TEM) images were acquired
using a Philips/FEI Technai 20 microscope. Inductively coupled plasma mass
spectrometry (ICP-MS) studies were performed on a VG PlasmaQuad 3 ICP mass
spectrometer. Plate reader analyses were performed on a Bio-Tek Synergy HT
microplate reader. Gel permeation chromatographic (GPC) analyses were performed on
Shimadzu LC20-AD prominence liquid chromatographer equipped with a refractive
index detector and Waters columns; molecular weights were calculated using a
conventional calibration curve constructed from narrow polystyrene standards using
tetrahydrofuran (THF) as an eluent at a temperature of 40 °C. Bioenergetic assays were
carried out using a Seahorse XF24 analyzer (Seahorse Biosciences, North Billerica,
MA, USA). Fluorescence imaging of cellular components was carried out on a Xenogen
IVIS® Lumina system. Flow cytometry measurements were performed on a BD LSR II
flow cytometer. Clinical chemistry analysis of the plasma samples was conducted at the
University of Georgia Veterinary Teaching Hospital using a Hitachi P-Modular system.
Cell Lines and Cell Culture: Human prostate cancer cell line PC3 and neuroblastoma
SH-SY5Y cells were procured from the American type culture collection (ATCC).
Cisplatin resistant human ovarian carcinoma cell line A2780/CP70 was kindly provided
by Prof. Thomas Hamilton (Fox Chase Cancer Center, Jenkintown, PA). Human bone
marrow derived MSCs were purchased from Lonza. H9C2 cardiomyocytes was given as
a generous gift from Prof. Mark Anderson, University of Iowa. The cardiomyocytes were
grown in 90% Dulbecco’s Modified Eagle’s Medium (DMEM) supplemented with 4 mM
L-glutamine, 1.5 g/L sodium bicarbonate, 1 mM sodium pyruvate, 4.5 g/L glucose, 1%
penicillin/streptomycin, and 10% fetal bovine serum. PC3 and A2780/CP70 cells were
grown at 37 °C in 5% CO2 in Roswell Park Memorial Institute (RPMI) 1640 medium
supplemented with 10% FBS, 1% penicillin/streptomycin, sodium pyruvate (100 mM),
4
HEPES buffer solution (1 M), and L-glutamine (200 mM). SH-SY5Y cells were cultured
in DMEM supplemented with 10% FBS and 1% penicillin/streptomycin. Human MSCs
were grown in mesenchymal stem cell basal medium supplemented with 2% FBS, 1%
penicillin/streptomycin, recombinant human fibroblast growth factor-basic (5 ng/mL),
recombinant human fibroblast growth factor-acidic (5 ng/mL), and recombinant human
epithelial growth factor (5 ng/mL). Cells were passed every 3 to 4 days and restarted
from frozen stocks upon reaching pass number 20 for PC3, SH-SY5Y, A2780/CP70,
H9C2 cells and 10 for MSC.
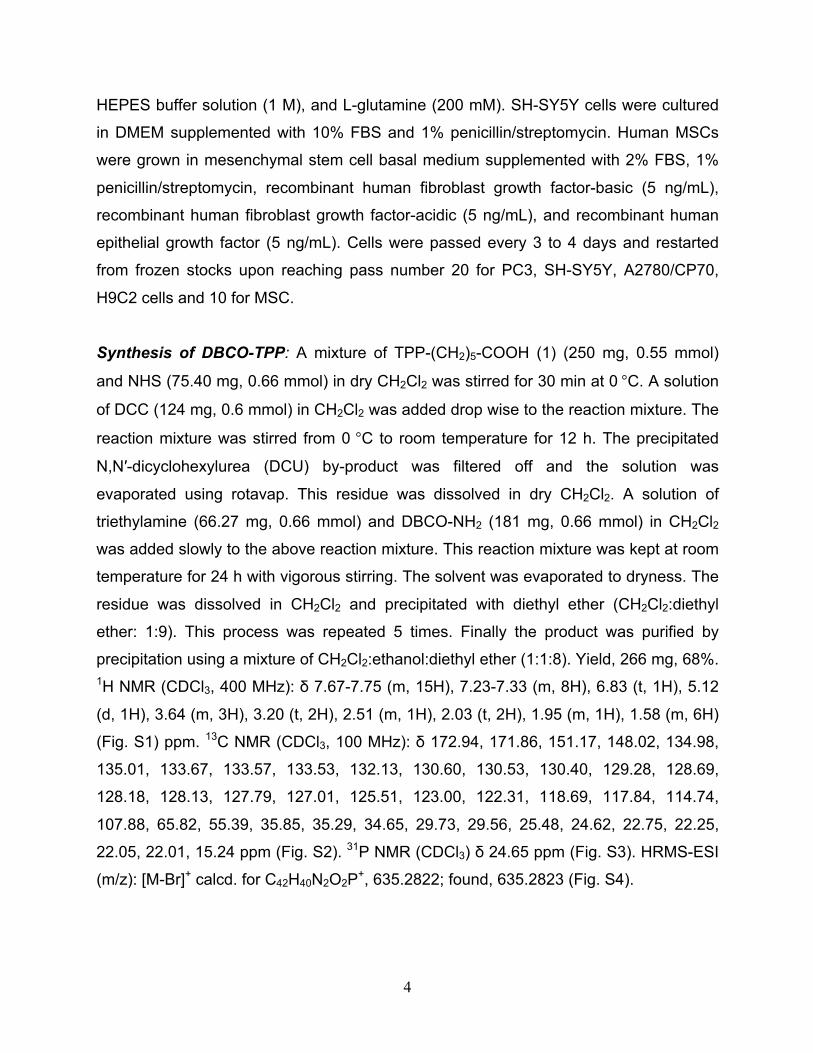
Synthesis of DBCO-TPP: A mixture of TPP-(CH2)5-COOH (1) (250 mg, 0.55 mmol)
and NHS (75.40 mg, 0.66 mmol) in dry CH2Cl2 was stirred for 30 min at 0 °C. A solution
of DCC (124 mg, 0.6 mmol) in CH2Cl2 was added drop wise to the reaction mixture. The
reaction mixture was stirred from 0 °C to room temperature for 12 h. The precipitated
N,N′-dicyclohexylurea (DCU) by-product was filtered off and the solution was
evaporated using rotavap. This residue was dissolved in dry CH2Cl2. A solution of
triethylamine (66.27 mg, 0.66 mmol) and DBCO-NH2 (181 mg, 0.66 mmol) in CH2Cl2
was added slowly to the above reaction mixture. This reaction mixture was kept at room
temperature for 24 h with vigorous stirring. The solvent was evaporated to dryness. The
residue was dissolved in CH2Cl2 and precipitated with diethyl ether (CH2Cl2:diethyl
ether: 1:9). This process was repeated 5 times. Finally the product was purified by
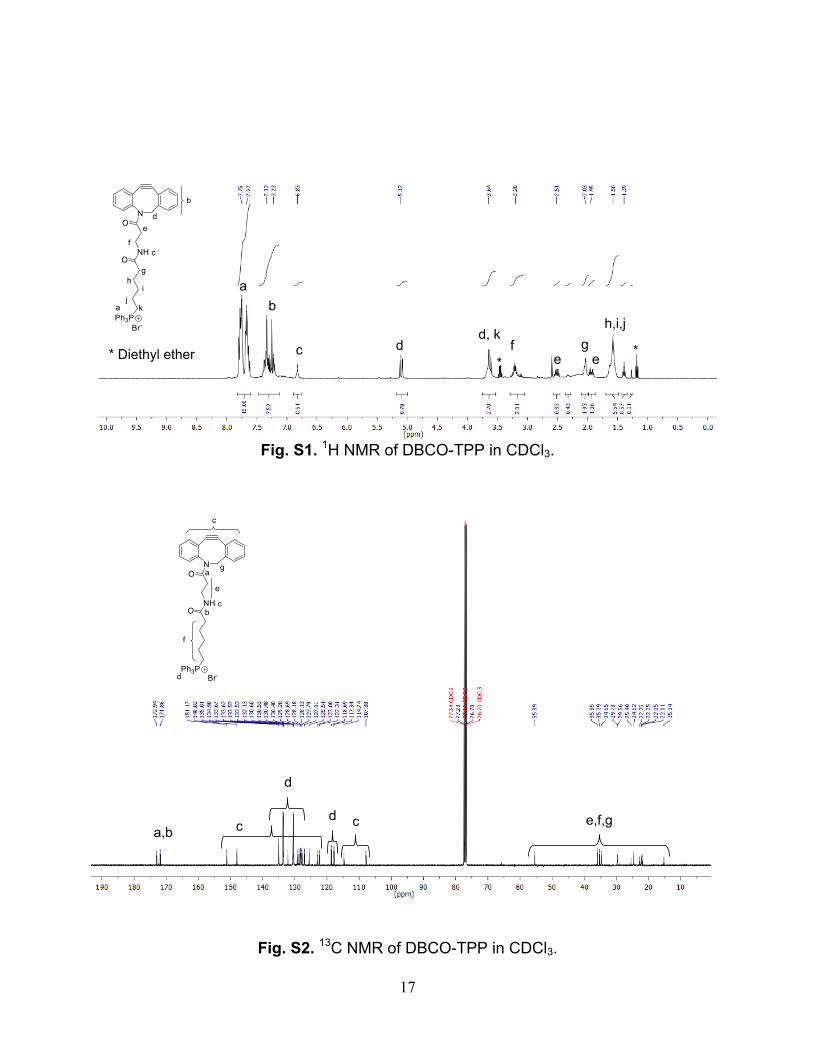
precipitation using a mixture of CH2Cl2:ethanol:diethyl ether (1:1:8). Yield, 266 mg, 68%. 1H NMR (CDCl3, 400 MHz): δ 7.67-7.75 (m, 15H), 7.23-7.33 (m, 8H), 6.83 (t, 1H), 5.12
(d, 1H), 3.64 (m, 3H), 3.20 (t, 2H), 2.51 (m, 1H), 2.03 (t, 2H), 1.95 (m, 1H), 1.58 (m, 6H)
(Fig. S1) ppm. 13C NMR (CDCl3, 100 MHz): δ 172.94, 171.86, 151.17, 148.02, 134.98,
135.01, 133.67, 133.57, 133.53, 132.13, 130.60, 130.53, 130.40, 129.28, 128.69,
128.18, 128.13, 127.79, 127.01, 125.51, 123.00, 122.31, 118.69, 117.84, 114.74,
107.88, 65.82, 55.39, 35.85, 35.29, 34.65, 29.73, 29.56, 25.48, 24.62, 22.75, 22.25,
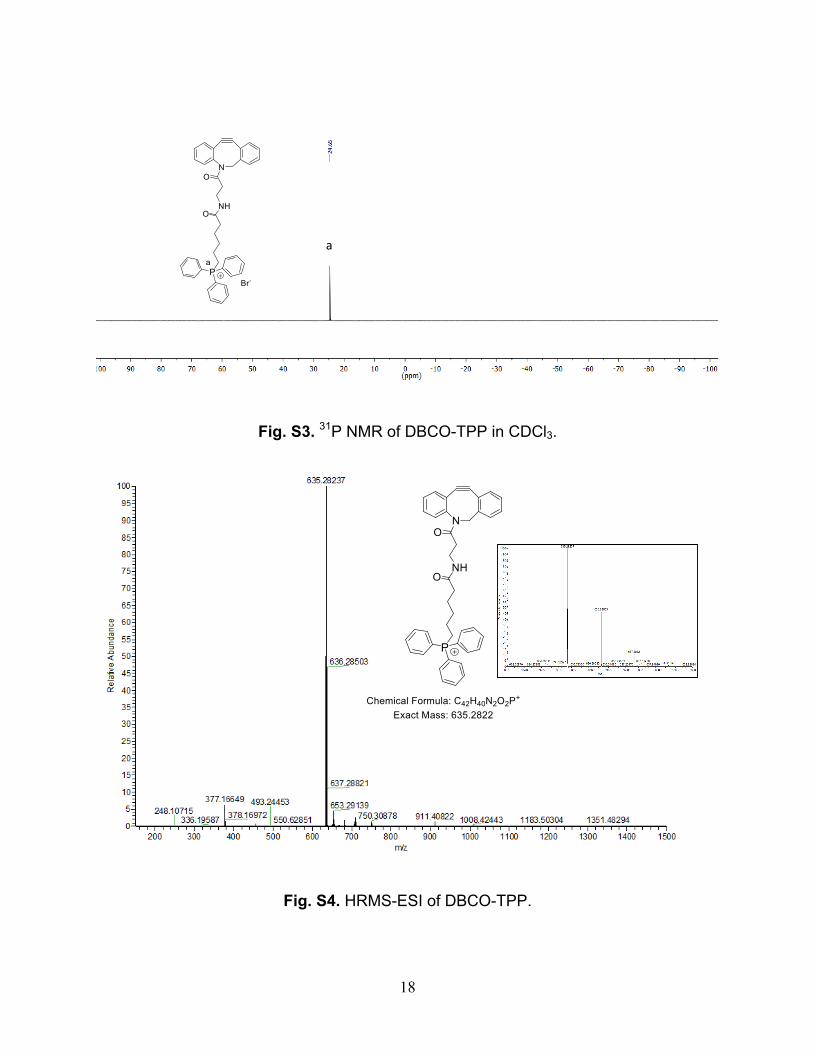
22.05, 22.01, 15.24 ppm (Fig. S2). 31P NMR (CDCl3) δ 24.65 ppm (Fig. S3). HRMS-ESI
(m/z): [M-Br]+ calcd. for C42H40N2O2P+, 635.2822; found, 635.2823 (Fig. S4).
5
Synthesis of Platin-M: A solution of Platin-Az (2) (60 mg, 0.098 mmol) and DBCO-TPP
(140 mg, 0.196 mmol) in 10 mL of dry dimethylformamide (DMF) was stirred at room
temperature for 12 h. This reaction mixture was concentrated and the product was
precipitated using diethyl ether. The crude product was suspended in CH2Cl2 and
CH3CN and precipitated with diethyl ether. Finally the product was isolated through
precipitation with CH2Cl2:CH3CN:diethyl ether (1:1:8) to get a light yellow solid. Yield,
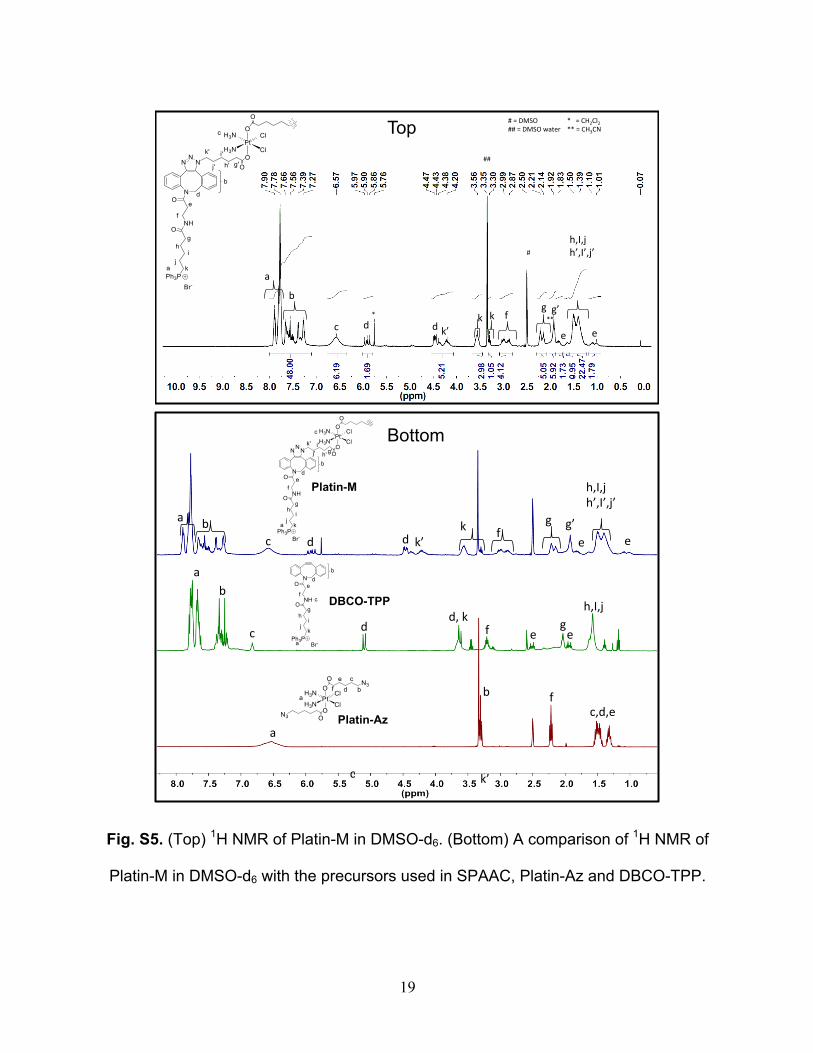
140 mg, 71%. 1H NMR (DMSO-d6, 400 MHz): δ 7.78-7.90 (m, 30H), 7.27-7.66 (m, 18H),
6.57 (broad, 6H), 5.86-5.97 (m, 2H), 4.43-4.47 (m, 2H), 4.20-4.38 (m, 4H), 3.30-3.56 (m,
4H), 2.87-2.99 (m, 4H), 2.14-2.21 (m, 4H), 1.92 (m, 4H), 1.83 (m, 2H), 1.39-1.50 (m,
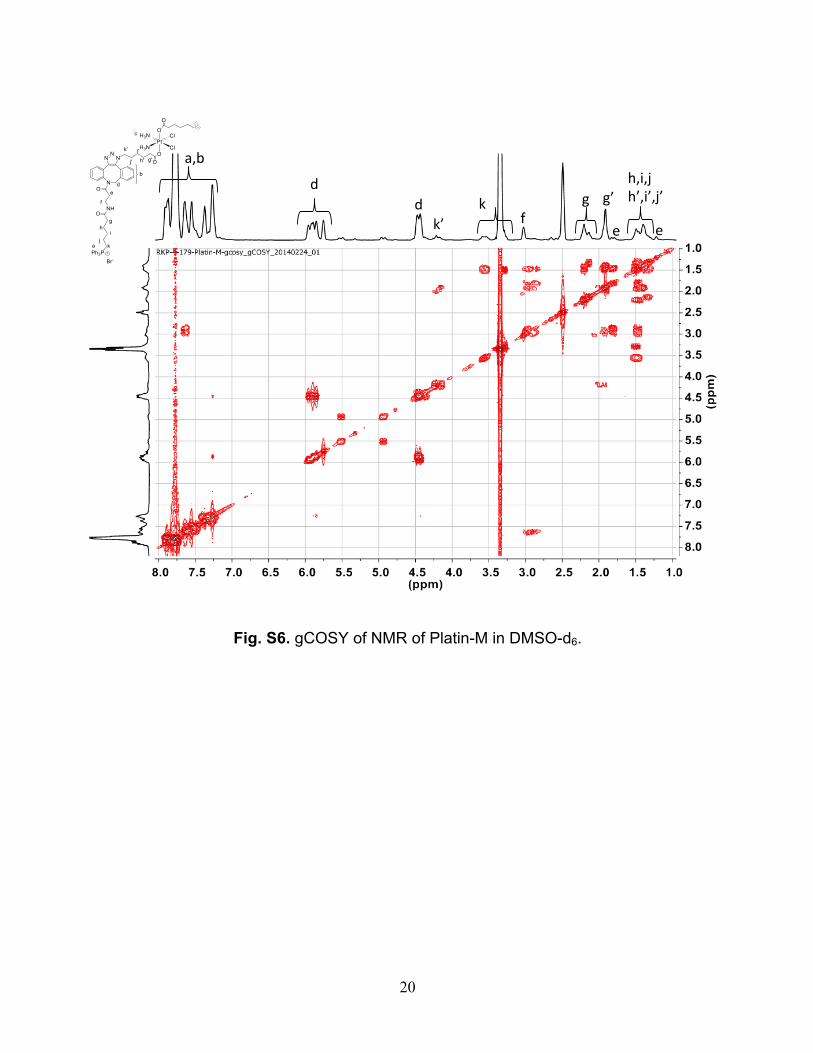
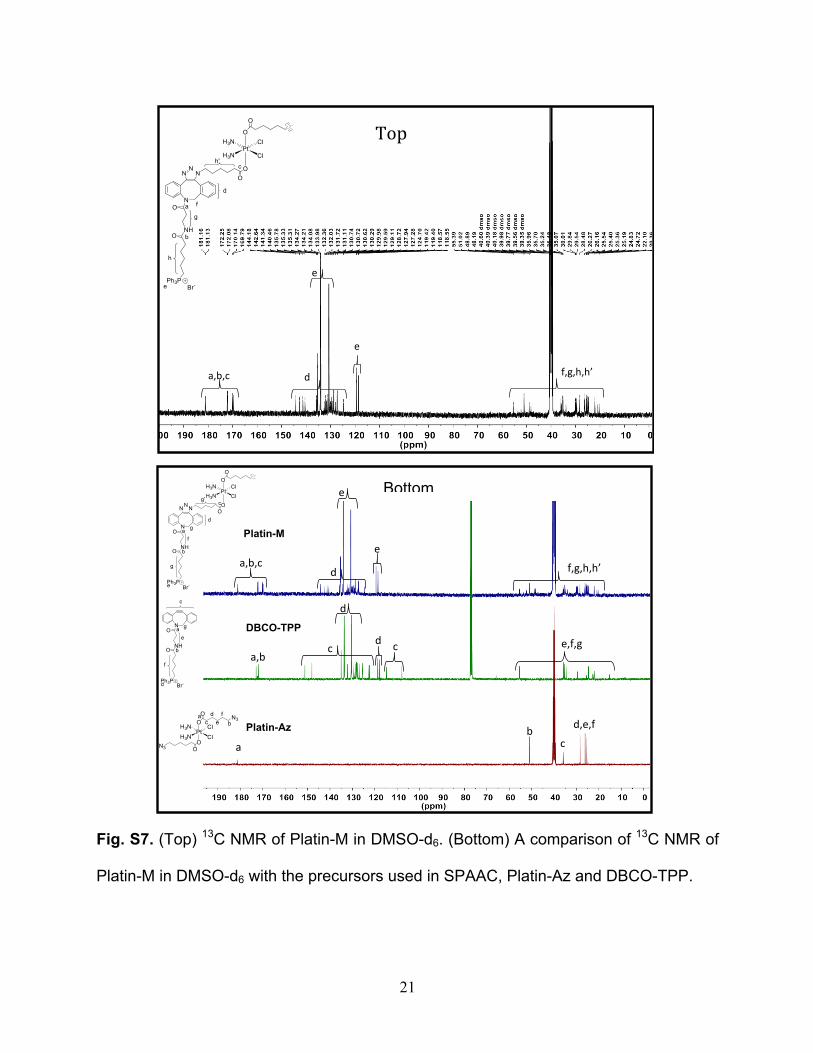
24H), 1.01-1.10 (m, 2H) ppm (Fig. S5), gCOSY (Fig. S6). 13C NMR (CDCl3, 100 MHz): δ
δ 181.16, 181.13, 172.25, 172.08, 170.14, 169.79, 144.18, 142.64, 141.34, 140.46,
135.78, 135.33, 135.31, 134.27, 134.21, 134.08, 133.98, 132.36, 132.03, 131.72,
131.11, 130.74, 130.72, 130.62, 130.29, 129.98, 129.59, 129.11, 128.72, 127.94,
127.28, 124.70, 119.42, 119.40, 118.57, 118.55, 55.39, 52.26, 51.02, 48.89, 48.19,
40.60, 40.39, 40.18, 39.98, 39.77, 39.56, 39.35, 35.96, 35.70, 35.24, 35.18, 35.07,
33.91, 30.01, 29.84, 29.54, 28.48, 26.27, 26.16, 25.54, 25.40, 25.36, 25.19, 24.83,
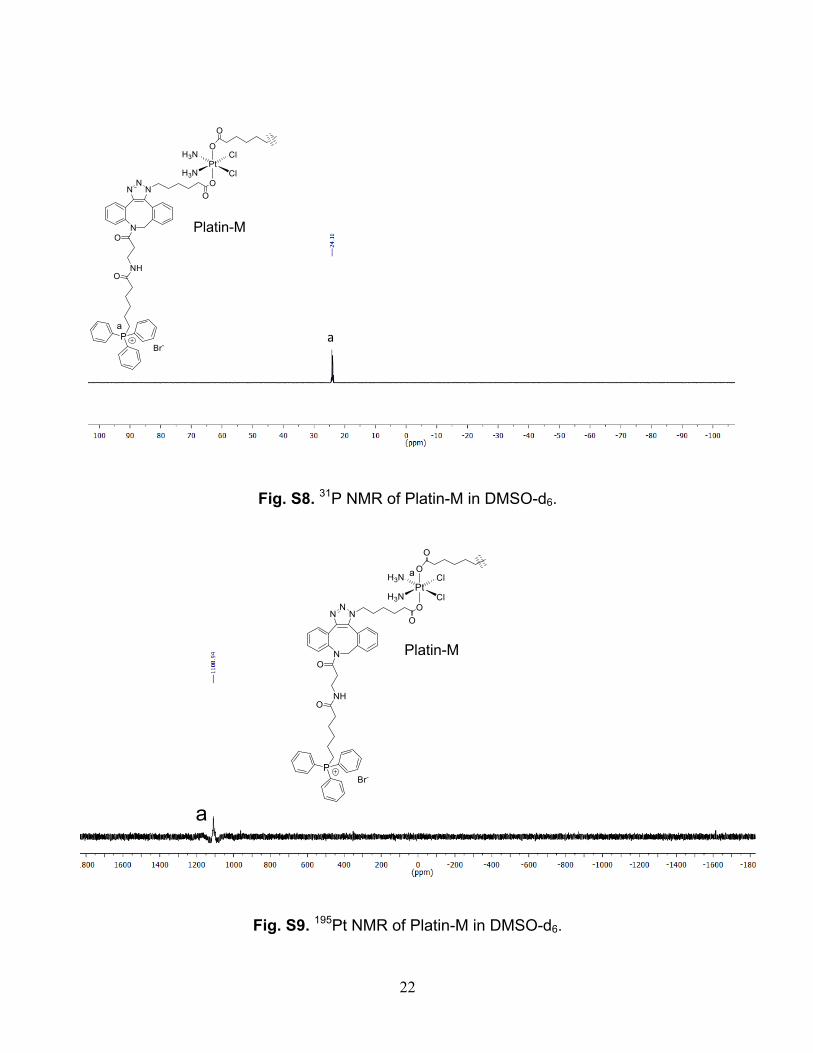
24.72, 22.10, 20.86, 20.36 ppm (Fig. S7). 31P NMR (CDCl3) δ 24.10 ppm (Fig. S8). 195Pt
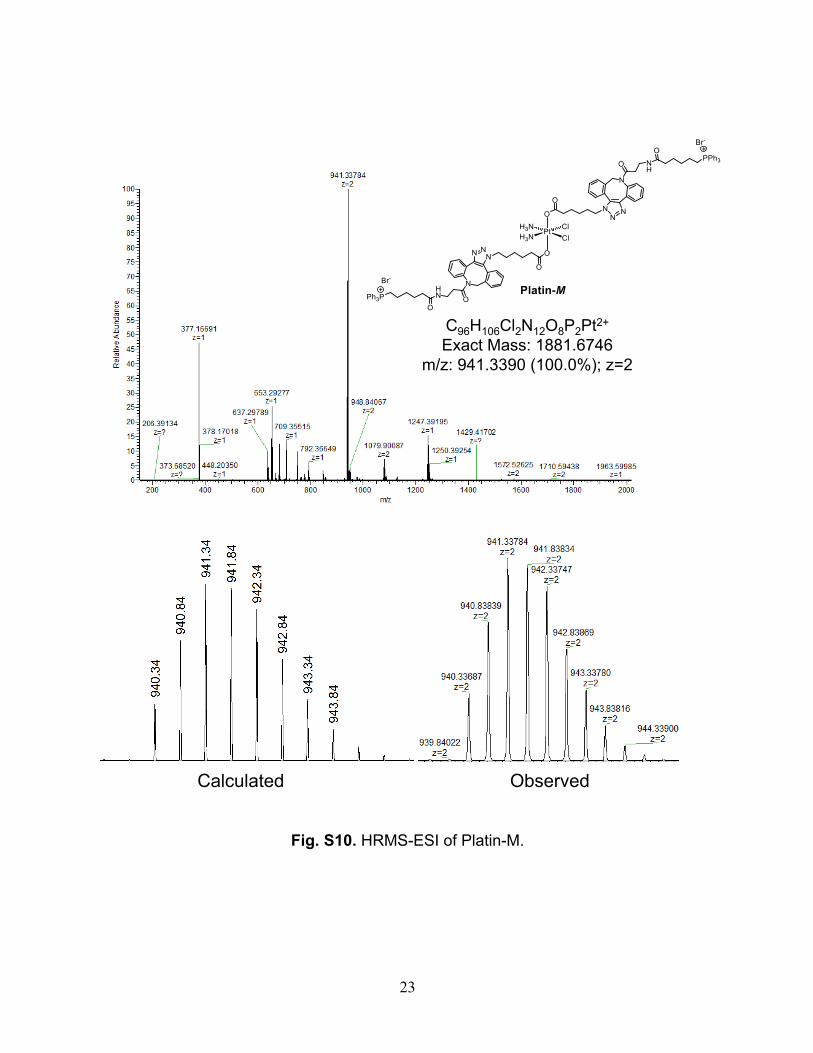
(DMSO-d6, 107.6 MHz) δ 1108.94 ppm (Fig. S9). HRMS m/z Calcd. for
C96H106Cl2N12O8P2Pt2+: (M)2+ 941.3390. Found 941.3378 (Fig. S10). Elemental analysis
calcd (%) for C96H106Br2Cl2N12O8P2Pt.CH3CN.CH2Cl2.H2O: C 54.35, H 5.21, N 8.32;
found: C 54.10, H 5.44, N 8.55.
Electrochemistry of Platin-M: Electrochemical measurements were made at 25 °C on
an analytical system model CHI 920c potentiostat from CH Instruments, Inc. (Austin,
TX). A conventional three-electrode set-up comprising a glassy carbon working
electrode, platinum wire auxiliary electrode, and Ag/AgCl (3M KCl) reference electrode
was used for electrochemical measurements. The electrochemical data were
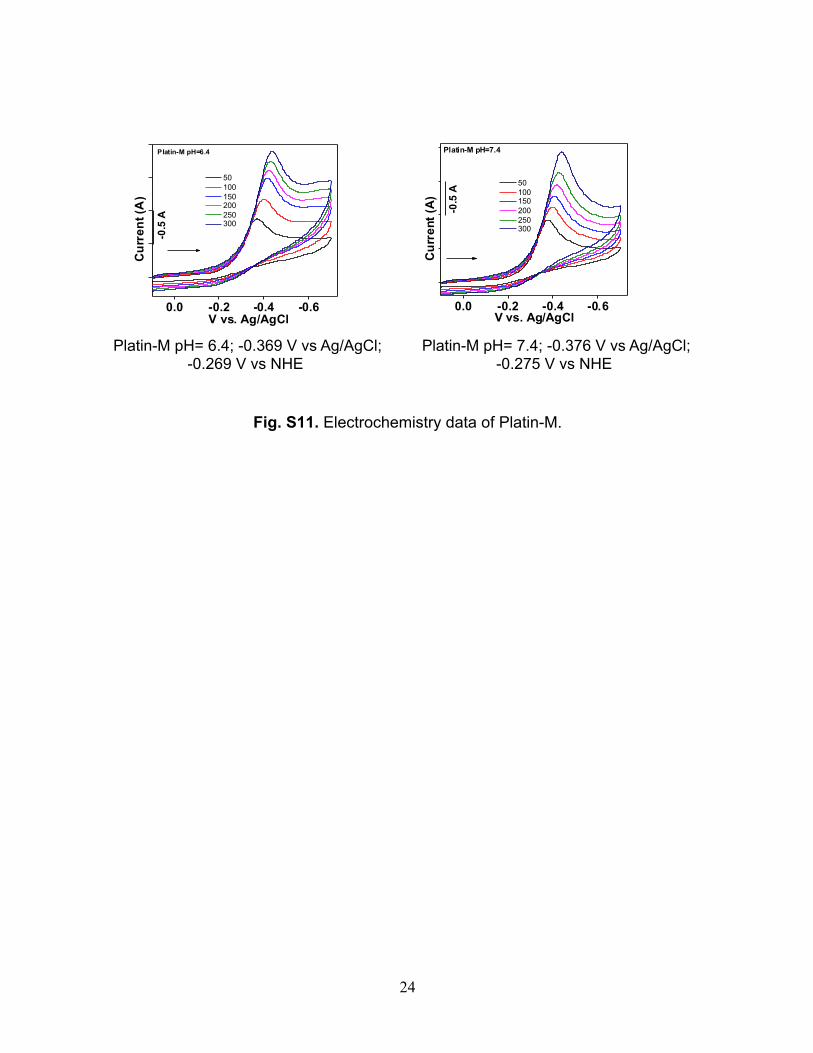
uncorrected for junction potentials. KCl was used as a supporting electrolyte. Platin-M
(1 mM) solutions were prepared in 20% DMF-phosphate buffered saline (PBS) of pH
6.4 and 7.4 with 0.1 M KCl and voltammograms were recorded at different scan rates
6
(Fig. S11). Redox potentials of Platin-M at pH 7.4 was found to be -0.376 V vs. Ag/AgCl;
-0.275 vs. NHE and at pH 6.4 was found to be -0.369 V vs. Ag/AgCl; -0.269 vs. NHE.
Platin-M Ability to Form Micelles: Platin-M was dissolved in DMF to a final
concentration of 1.5 mg/mL. This solution was added drop wise slowly into vigorously
stirring nanopure water (10 mL) and stirred at room temperature for 3 h. This solution
was then filtered and washed 3 times via centrifugation using Amicon centrifugal filters
with a MW cutoff of 100 kDa in order to ensure removal of organic solvent. Finally, the
micelles were resuspended in nanopure water (1 mL) and filtered through a 0.2 µm
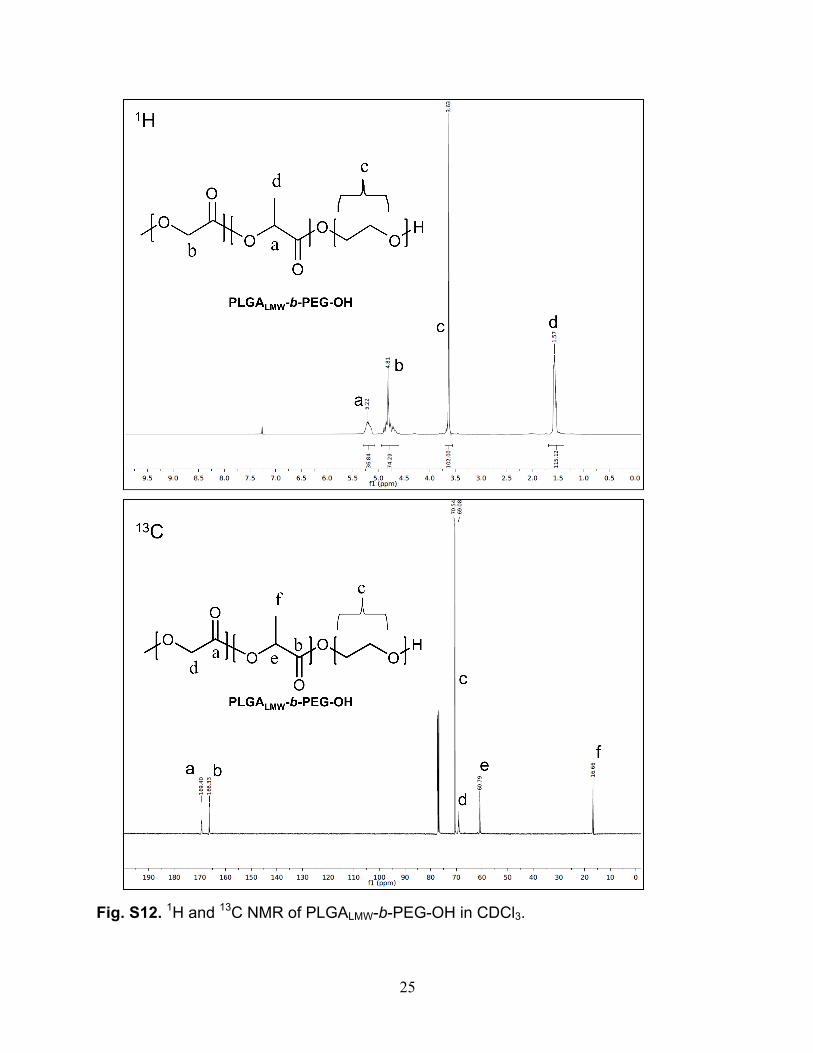
filter. The resulting suspension was characterized by DLS. Synthesis of PLGALMW-b-PEG-OH and PLGALMW-b-PEG-TPP: These two polymers
were synthesized following methods previously reported by us (3). Spectral Data for
PLGALMW-b-PEG-OH (Fig. S12): 1H NMR (CDCl3, 400 MHz): δ 5.22 [m, 37 H
(OCHCH3C(O)], 4.81 [m, 74 H (OCH2C(O)], 3.63 [s, 102 H (OCH2)], 1.57 [m, 115 H
(CH3CH)] ppm. 13C NMR (CDCl3, 100 MHz): δ 169.40, 166.33, 70.54, 69.08, 60.79,
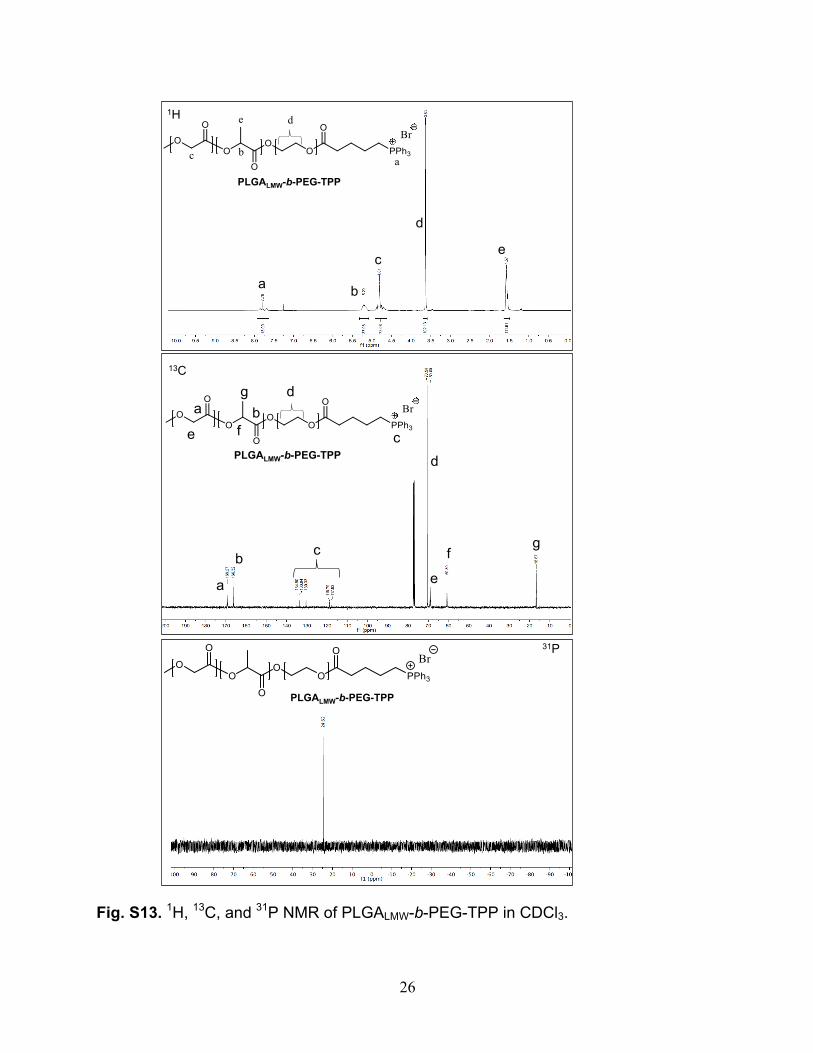
16.66 ppm. Spectral Data for PLGALMW-b-PEG-TPP (Fig. S13): 1H NMR (CDCl3, 400
MHz): δ 7.8-7.3 [m 15 H (PPh3), 5.20 [m, 37 H (OCHCH3C(O)], 4.81 [m, 73 H
(OCH2C(O)], 3.63 [s, 102 H (OCH2)], 1.57 [m, 112 H (CH3CH)] ppm. 13C NMR (CDCl3,
100 MHz): δ 169.27, 166.32, 134.90, 133.84, 130.33, 118.79, 117.93, 70.54, 69.00,
60.80, 16.67 ppm. 31P NMR (CDCl3, 100 MHz): δ 24.62 ppm. GPC: Mn=14,420 g/mol,
Mw=17,030 g/mol, Mz=20,320 g/mol, PDI = 1.18 (Fig. S16).
Synthesis of PLGAHMW-b-PEG-OH: OH-PEG-OH (3.75 g, 1.1 mmol), PLGA-COOH
(inherent viscosity of 0.55-0.75, 5.0 g, 0.38 mmol), and DMAP (0.045 g, 0.38 mmol)
were dissolved in dry CH2Cl2 (50 mL). The reaction mixture was cooled to 0 °C while
stirring. DCC (0.2 g, 1.1 mmol) was dissolved in CH2Cl2 (3 mL) and added drop wise to
the polymer solution. The mixture was then warmed to room temperature and stirred
overnight. Afterwards, DCU was filtered out and the resulting mixture was precipitated in
a 50:50 mixture of cold diethyl ether:methanol (200 mL), repeatedly. The resulting solid
was centrifuged at 5000 rpm for 10 min. The resulting solid was lyophilized to produce
7
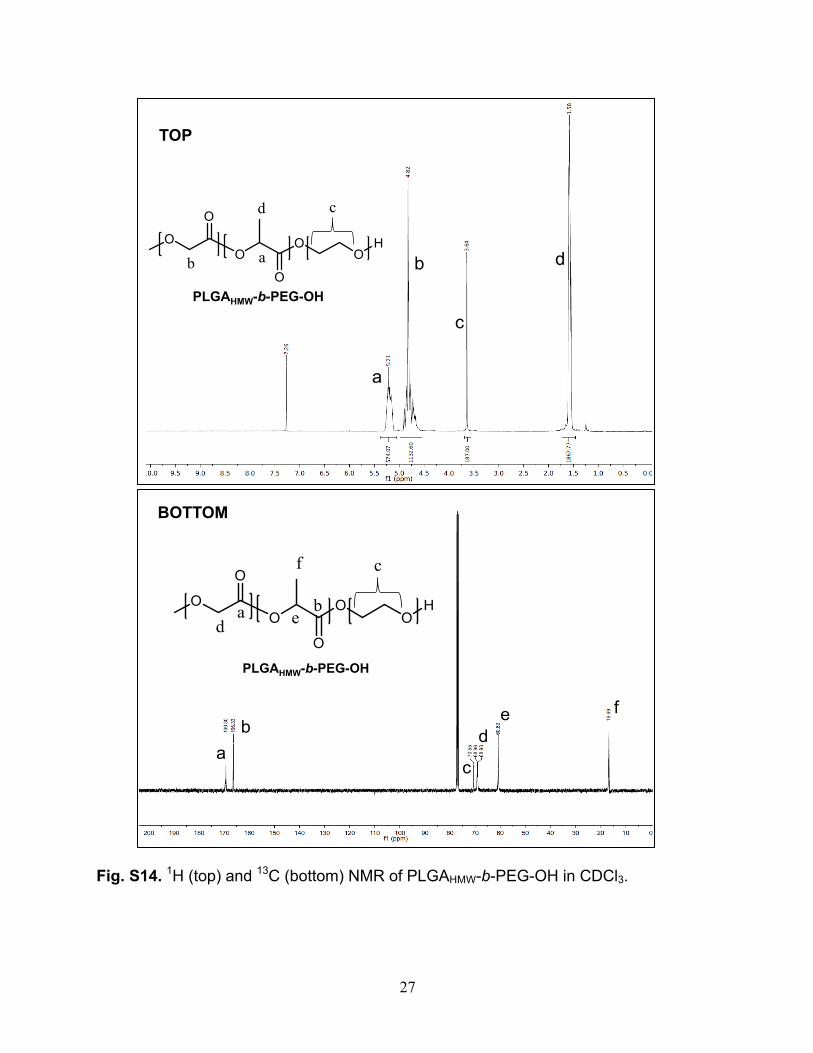
the polymer with a 41% yield. Final product was analyzed by NMR and GPC. 1H NMR
(CDCl3, 400 MHz): δ 5.21 [m, 574 H (OCHCH3C(O)], 4.82 [m, 1132 H (OCH2C(O)], 3.64
[s, 187 H (OCH2)], 1.58 [m, 1868 H (CH3CH)] ppm (Fig. S14). 13C NMR (CDCl3, 100
MHz): δ 169.30, 166.33, 70.55, 68.96, 68.93, 60.80, 16.69 ppm (Fig. S14). GPC:
Mn=47,280 g/mol, Mw=68,210 g/mol, Mz=92,900 g/mol, PDI = 1.36 (Fig. S16).
Synthesis of PLGAHMW-b-PEG-TPP: PLGAHMW-b-PEG-OH (1 g, 0.02 mmol), TPP-
(CH2)4-COOH (0.045 g, 0.12 mmol), and DMAP (0.010 g, 0.08 mmol) were dissolved in
CH2Cl2 for 30 min at 0 °C. A solution of DCC (12 mg, 0.06 mmol) was added drop wise.
The solution was slowly returned to room temperature and stirred for 12 h. The resulting
DCU was removed via gravity filtration. CH2Cl2 was removed in vacuo and the resulting
polymer was dissolved in a 50:50 mixture of CH2Cl2/CH3OH and precipitated with cold
diethyl ether. The resulting solid was isolated by centrifugation (5000 rpm, 10 min, 4 °C)
This process was repeated 4 times in order to remove the residual TPP-(CH2)4-COOH.
Finally, the resulting polymer was lyophilized to produce the targeted polymer with a
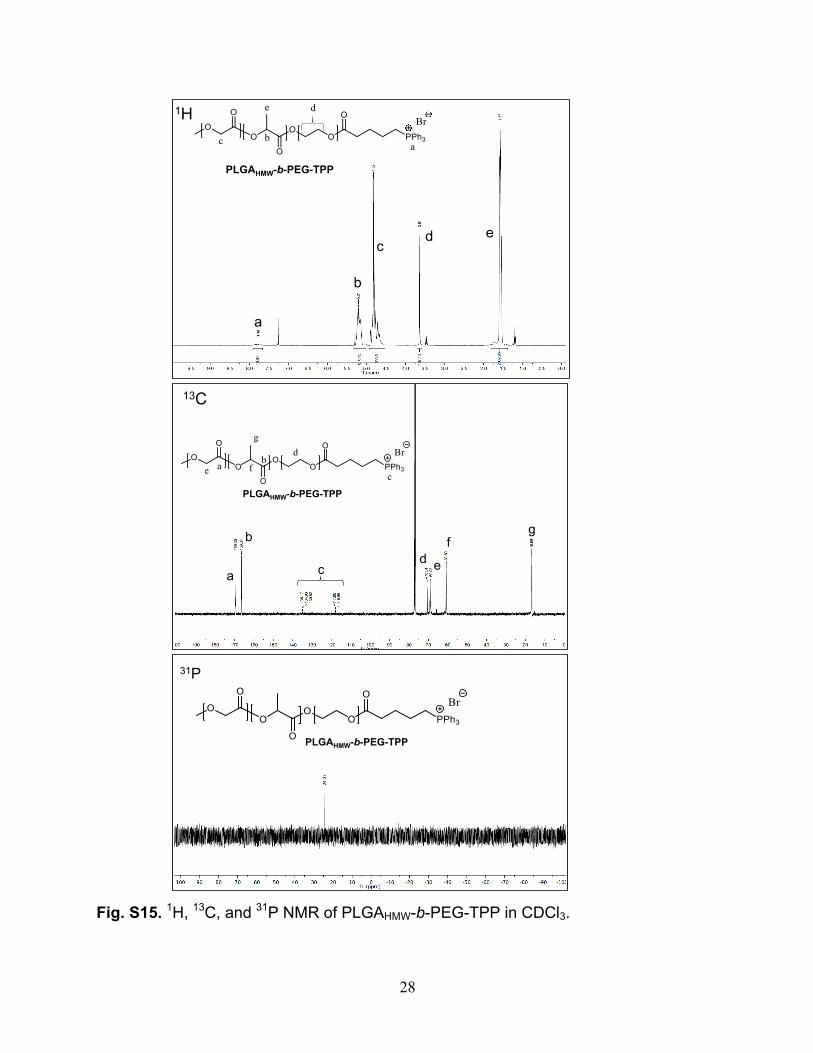
59% yield. 1H NMR (CDCl3, 400 MHz): δ 7.6-7.7 [m, 15 H, (PPh3)], 5.21 [m, 615 H
(OCHCH3C(O)], 4.82 [m, 1203 H (OCH2C(O)], 3.64 [s, 187 H (OCH2)], 1.57 [m, 2002 H
(CH3CH)] ppm (Fig. S15). 13C NMR (CDCl3, 100 MHz): δ 169.30, 166.34, 135.17,
134.93, 130.52, 117.85, 116.59, 70.54, 69.05, 60.80, 16.69 ppm (Fig. S15). 31P NMR
(CDCl3, 100 MHz): δ 24.37 ppm (Fig. S15). GPC: Mn=54,510 g/mol, Mw= 73,510 g/mol,
Mz=94,380 g/mol, PDI = 1.35 (Fig. S16).
Preparation of Platin-M Encapsulated PLGA-b-PEG Polymeric Nanoparticles (NPs): Platin-M encapsulated targeted NPs (T-Platin-M-NP) and non-targeted (NT-
Platin-M-NP) NPs were prepared by a nanoprecipitation method. Briefly, PLGA-b-PEG-
TPP (3) or PLGA-PEG-OH were dissolved in DMF (50 mg/mL). Varying amounts of
Platin-M (10 mg/mL in DMF) were added to the PLGA-b-PEG-TPP or PLGA-b-PEG-OH
solution to a final polymer solution of 5 mg/mL. This was added drop-wise slowly into
vigorously stirring nanopure water (10 mL) and stirred at room temperature for 2 h. This
solution was then filtered and washed through centrifugal filters with a MW cutoff of 100
kDa 3 times at 3000 rpm and 4 °C in order to ensure the removal of all organic solvent.
8
Finally, the NPs were resuspended in nanopure water (1 mL) and filtered through a 0.2
µm filter. The NPs were characterized by DLS (Fig. S19, Tables S2 and S3) for size and
zeta potential and Platin-M content was analyzed by ICP-MS (Tables S2 and S3). Preparation of PLGA-PEG-QD Encapsulated PLGA-b-PEG-TPP-NPs: PLGALMW-b-
PEG-TPP-NPs and PLGAHMW-b-PEG-TPP-NPs containing PLGA-PEG-QD (3) were
synthesized using nanoprecipitation method. A mixture of PLGALMW-b-PEG-TPP or
PLGAHMW-b-PEG-TPP (5 mg/mL in DMF) and PLGA-PEG-QD (10 µL, 8 µM in DMF)
was added drop wise to vigorously stirring water. The resultant T-QD-NPs were stirred
for 2 h. Organic solvent was removed by 3 washes using centrifugal filters with a 100
kDa cut-off at 3000 rpm and 4 °C. NPs were resuspended in nanopure water. Release Kinetics of Platin-M from NPs: In order to understand the rate at which
Platin-M was released from the NP core, release kinetics of T-Platin-M-NPs and NT-
Platin-M-NPs were studied. The NPs (T or NT) were synthesized according to the
method above. The resulting NPs were subjected to dialysis using Slide-A-Lyzer mini
dialysis devices with a 100 kDa MW cutoff of in 1X PBS at physiological conditions (pH
7.4 and 6.0, 37 °C). PBS was changed every 12 h. At different time points, the dialysis
bag was removed and the amount of Platin-M remaining in the polymeric core was
analyzed by ICP-MS. Cellular Fractionation of Cells Treated with Platin-M-NPs, Platin-M, and Cisplatin: PC3 cells were plated at a concentration of 1.0x10⁶ in 15 mL of media and allowed to
grow overnight. Platin-M, T-Platin-M-NPs, NT-Platin-M-NPs, and cisplatin (1 µM with
respect to Pt) were added to cells and incubated for 12 h. After internalization, the
mitochondria and the cytosol were isolated using a mitochondria isolation kit for
mammalian cells. Cells were isolated by trypsinization and washed 3x with 1X PBS.
Reagent A supplemented with protease inhibitors (10 mg/mL) was added followed by
incubation on ice for 2 min. Reagent B was added and incubated on ice for 5 min with
gentle vortexing every min. Following this, reagent C was added and the cells were
centrifuged (700xg at 4 °C for 10 min). The resulting pellet yielded the nuclei and
9
cellular debris. The supernatant, containing the cytosolic and mitochondrial fractions,
was removed and further centrifuged (12,000xg at 4 °C for 15 min). The resulting
supernatant contained the cytosolic fraction and the pellet contained the impure
mitochondrial fraction. This was further purified by washing with reagent C and
centrifuging at 12,000 xg at 4 °C for 5 min. The isolated nucleus and cellular debris
were further fractionated in order to obtain a pure nuclear fraction. The pellet was
resuspended in 600 µL of a modified Tris-HCl buffer (10 mM Tris-HCl, pH 7.0, 10 mM
NaCl, 3 mM MgCl2, 30 mM sucrose). This was incubated on ice for 10 min and
centrifuged (3000 rpm, 4 °C). The resulting pellet was resuspended in 1 mL of pre-
chilled CaCl2 buffer (10 mM Tris-HCl of pH 7.0, 10 mM NaCl, 3 mM MgCl2, 30 mM
sucrose, 10 mM CaCl2). This was repeatedly centrifuged and washed with the CaCl2
buffer and the supernatant was discarded each time. The pellet was further purified by
resuspending in a buffer containing 20 mM Tris-HCl of pH 7.9, 20% glycerol, 0.1 M KCl,
and 0.2 mM EDTA and centrifuging at 14,000 rpm for 30 min at 4 °C. The resulting
pellet yielded the purified nuclear fraction and was resuspended in H2O. The amount of
protein in each fraction was analyzed by a BCA assay and the Pt content of each
fraction was quantified by ICP-MS. Mitochondrial Sub-fractionation: PC3 cells were plated at a concentration of 1.0x10⁶
in 30 mL media and allowed to grow overnight. QD blended PLGAHMW-b-PEG-TPP or
PLGALMW-b-PEG-TPP NPs (0.5 mg/mL with respect to NP) were then internalized in
PC3 cells for 6 h. After internalization, the mitochondria and the cytosol were isolated
using a mitochondria isolation kit for mammalian cells. These fractions were further sub-
fractionated. The freshly isolated PC3 mitochondria in PBS (1x) were incubated with
protease inhibitor (0.125 mg/mL) and 0.6 % digitonin for 10 min on ice. Immediately
after incubation, the mitochondria were centrifuged at 10,000xg for 10 min at 4 °C. The
supernatant (SN-I) contained the outer mitochondrial membrane (OMM) fraction and the
intermembrane space (IMS). The pellet was resuspended in 150 mmol/L KCl, protease
inhibitor (0.125 mg/mL) and incubated on ice for 10 min. This was centrifuged at
10,000xg for 10 min at 4 °C. The supernatant, which contained the mitochondrial matrix,
was collected. To this, 50 µL of 1x cell lysis buffer (30 mM Tris-HCl, 0.1 mM EDTA, 20
10
% w/v sucrose) was added. This was subsequently sonicated and centrifuged at
10,000xg for 15 min at 4 °C. The supernatant (SN-II) containing the purified inner
mitochondrial membrane (IMM) fraction and matrix was collected. SN-I and SN-II were
centrifuged at 105,000xg for 60 min. The pellet from SN-I contained the OMM fraction
and the supernatant contained the IMS. The pellet from SN-II was resuspended in PBS
containing Lubrol WX (0.5 mg/mL), 37 % sucrose and incubated for 15 min on ice. This
was once again centrifuged at 105,000 g for 60 min at 4 °C. The pellet containing the
IMM fraction and the supernatant containing the matrix were collected. The collected
fractions were analyzed for Cd concentration by ICP-MS. A BCA assay was performed
on all the fractions in order to calculate the Cd (ng)/protein (pg). The collected fractions
were imaged on a Xenogen IVIS® Lumina system with 570 excitation wavelength and a
Cy5.5 emission channel with an exposure time of 0.5 s. Cell MitoStress Analysis: Different parameters of respiration: basal respiration,
coupling efficiency, and spare respiratory capacity were investigated by using Seahorse
XF-24 cell MitoStress Test Kit. Prior to the assay, XF sensor cartridges were hydrated.
To each well of an XF utility plate, 1 mL of Seahorse Bioscience calibrant was added
and the XF sensor cartridges were placed on top of the utility plate, and kept at 37 °C
incubator without CO2 for a minimum of 12 h. PC3, A2780-CP70, SH-SY5Y, and H9C2
cells were cultured in XF24-well cell culture microplates (Seahorse Bioscience) at a
density of 2.5×10⁴ cells/well (except for H9C2, cell density of this cell line: 5×10⁴
cells/well) (0.32 cm2) in 200 µL growth medium and then incubated for 24 h at 37 °C in
5% CO2 atmosphere. The cells were treated with Platin-M (10 µM), cisplatin (10 µM),
DBCO-TPP (10 µM), empty-T-NPs, empty-NT-NPs, T-Platin-M-NPs, NT-Platin-M-NPs
(10 µM with respect to Pt; ~0.5 mg/mL for empty NPs) for 12 h at 37 °C in 5% CO2
atmosphere. After 12 h, all but 50 µL of the culture medium was removed from each
well and the cells were rinsed two times with 500 µL of XF stress test glycolysis
optimization medium pre-warmed to 37 °C and finally 450 µL of glucose depleted
optimization medium was added to each well and the plate was placed at 37 °C without
CO2 for 1 h prior to assay. Different parameters of respiration were calculated by
subtracting the average respiration rates before and after the addition of the electron
11
transport inhibitors oligomycin (1.0 µM), trifluorocarbonylcyanide phenylhydrazone or
FCCP (1.0 µM), an ionophore that is a mobile ion carrier, and a mixture of antimycin-A
(1.0 µM) which is a complex III inhibitor and rotenone (1.0 µM), a mitochondrial inhibitor
that prevents the transfer of electrons from the Fe-S center in Complex I to ubiquinone.
The parameters calculated included: basal respiration (baseline respiration minus
antimycin-A post injection respiration), ATP turnover (baseline respiration minus
oligomycin post injection respiration), maximal respiratory capacity (FCCP stimulated
respiration minus antimycin-A post injection respiration) and reserve respiratory
capacity (FCCP stimulated respiration minus baseline respiration). Test articles on each
well had four replicates.
In Vivo Biodistribution (bioD) and Pharmacokinetics (PK): BioD and PK properties
were determined using male Sprague Dawley rats weighing around ~300 g. Three rats
per group, had T-QD-NPs injected via tail vein with ~1 mL of T-NPs (23 mg/kg with
respect to NPs, 81 µg/kg with respect to Cd) or saline. In a separate experiment, two
rats per group had Platin-M (~0.5 mL, 95.8±0.7 µg Pt), NT-Platin-M-NPs (~0.5 mL,
98.0±7.2 µg Pt; Size: 59.53±0.34 nm, Zeta Potential: -22.3±1.2 mV), and T-Platin-M-
NPs (~0.14 mL, 25.7±2.1 µg Pt; Size: 57.23±0.52 nm, Zeta Potential: 34.2±0.5 mV)
injected via tail vein or saline. At varying time intervals, blood samples were collected in
heparinized tubes and centrifuged in order to collect blood plasma. The percentage of
QD or Pt was calculated by taking into consideration that blood constitutes 7% of body
weight and plasma constitutes 55% of blood volume (4). The amount of Cd from the QD
or Pt from Platin-M was calculated in the blood plasma by ICP-MS. After 24 h, the
animals were sacrificed and the vital organs were collected. The collective urine and
feces were also collected over a 24 h period for T-QD-NPs. For Platin-M, NT-Platin-M-
NPs, and T-Platin-M-NPs, urine samples (~100 µL) were collected at 24 h directly from
the bladder and collective feces were collected over 24 h. The overall bioD was
calculated by analyzing the amount of Cd or Pt in each organ as well as the feces and
urine by ICP-MS. Before analysis, the organs and feces were dissolved with
PerkinElmer solvable (Product number: 6NE9100) for 24 h with gentle heating and
shaking. The calculations for AUC, Cmax, Tmax, and CL (t=0) were performed in the
12
GraphPad Prism (Version 5.01). PK parameters were determined by fitting the data
using a two-compartmental or one compartmental model equation (Tables S1 and S5).
Quantification of mtDNA-Pt and nDNA-Pt Adducts: The mitochondria and nuclei
were isolated according to the protocols mentioned before. These fractions were further
fractionated in order to isolate mitochondrial and nuclear DNA, respectively. For
mitochondrial DNA (mtDNA), the freshly isolated mitochondria were re-suspended in 35
µL of mitochondrial lysis buffer. To this, 5 µL of the enzyme mix was added. This was
incubated at 50 °C in water bath until the solution turned clear (~1 h). To this, 100 µL of
absolute ethanol was added and the resulting solution was incubated for 10 min at -20
°C. The solution was then centrifuged at 14000 rpm for 5 min at room temperature. The
resulting pellet was then purified by washing with 70% ethanol in nanopure H2O. The
resulting purified mtDNA was resuspended in tris-EDTA (TE) buffer. The resulting
solution was quantified for the amount and purity of DNA by UV-Vis spectroscopy
(260/280 nm) and the amount of Pt by ICP-MS. For nuclear DNA (nDNA), the freshly
isolated nuclei were re-suspended in 40 µL of cell lysis buffer. To this, 5 µL of the
enzyme mix was added. This was incubated in a 50 °C water bath until the solution
turned clear (~1 h). To this, 100 µL of absolute ethanol was added and the resulting
solution was incubated for 10 min at -20 °C. The solution was then centrifuged at 14000
rpm for 5 min at room temperature. The resulting pellet was then purified by washing
with 70% ethanol in nanopure H2O. Reprecipitation with 70% ethanol in nanopure H2O
was performed until the ratio of the absorbances at 260 and 280 nm was ≥1.75 and
≤2.1. The resulting purified nDNA was resuspended in TE buffer. The resulting solution
was quantified for the amount of DNA by UV-Vis spectroscopy (260/280 nm) and the
amount of Pt by ICP-MS.
Citrate Synthase Assay: SH-SY5Y cells were seeded at a density of 1x10⁶ cells/mL on
each well of a six well plate and allowed to grow overnight. Cells were treated with 1.0
µM cisplatin, 1.0 µM Platin-M, 1.0 µM NT-Platin-M-NPs, and 1.0 µM T-Platin-M-NPs for
12 h at 37 °C. The cells were trypsinized and washed 3x with PBS. The isolated cell
pellet was then solubilized using 500 µL of the extraction buffer and incubated on ice for
13
20 min. The cells were then centrifuged at 16,000xg at 4 °C for 20 min. The samples
(100 µL) were then added to the pre-coated microplate strips, sealed, and incubated for
3 h at room temperature. The wells were aspirated and washed 3x with wash buffer.
Activity buffer (100 µL) was then added to each well and the plate was transferred to the
microplate reader. The plate was read every minute for 20 sec intervals for 10 min at a
wavelength of 412 nm.
Cytotoxicity of Platin-M and Platin-M-NPs: The cytotoxicity of Platin-M, T-Platin-M-
NPs, NT-Platin-M-NPs, and cisplatin was tested in PC3, A2780/CP70, SH-SY-5Y, and
MSC by MTT assay (Fig. S20, Table S4). PC3 cells (2000 cells/well), A2780/CP70 cells
(2000 cells/well), SH-SY-5Y (2000 cells/well), and MSC (2000 cells/well) were plated on
a 96 well plate and allowed to grow overnight. The media was changed and increasing
concentrations of each formulation was added. For T-Platin-M-NPs, NT-Platin-M-NPs,
the media was changed after 12 h and further incubated for an additional 60 h. The free
drugs were incubated for 72 h without further media changes. After the given incubation
time, MTT was added (5 mg/mL, 20 µL/well) and incubated for 5 h in order for MTT to
be reduced to purple formazan. The media was removed and the cells were lysed with
100 µL of DMSO. In order to homogenize the formazan solution, the plates were
subjected to 10 min of gentle shaking and the absorbance was read at 550 nm with a
background reading at 800 nm with a plate reader. Cytotoxicity was expressed as mean
percentage increase relative to the unexposed control ± SD. Control values were set at
0% cytotoxicity or 100% cell viability. Cytotoxicity data (where appropriate) was fitted to
a sigmoidal curve and a three parameters logistic model used to calculate the IC50,
which is the concentration of chemotherapeutics causing 50% inhibition in comparison
to untreated controls. The mean IC50 is the concentration of agent that reduces cell
growth by 50% under the experimental conditions and is the average from at least three
independent measurements that were reproducible and statistically significant. The IC50
values were reported at ±99% confidence intervals. These analyses were performed
with GraphPad Prism (San Diego, U.S.A).
14
Cellular Apoptosis Detection by Flow Cytometry: SH-SY5Y cells were seeded at a
density of 1x10⁶ cells/mL on each well of a six well plate and allowed to grow overnight.
Cells were treated with 1.0 µM cisplatin, 1.0 µM Platin-M, 1.0 µM NT-Platin-M-NPs, and
1.0 µM T-Platin-M-NPs for 12 h at 37 °C. As positive controls, etoposide (100 µM,
incubation time: 12 h) for apoptosis and H2O2 (1 mM, incubation time: 45 min) for
necrosis were used. The cells were trypsinized, repeatedly washed with cold PBS, and
centrifuged at 1800 rpm for 3 min, and the supernatants were discarded (Note: During
trypsinization, media was centrifuged and to isolate the floating cells). Cell density was
determined and cells were resuspended in 1X Annexin-binding buffer to ~1×10⁶
cells/mL preparing a sufficient volume to have 100 µL per assay. To 100 µL of cell
suspension, 5 µL Alexa Fluor® 488 Annexin V and 1 µL (100 µg/mL) PI working solution
were added, and incubated for 15 min at room temperature. After the incubation period,
400 µL 1X Annexin-binding buffer was added to each sample, samples were gently
mixed keeping the samples on ice and the samples were analyzed on the flow
cytometer immediately. Flow Cytometric Analyses of Mitochondrial Function and Mitochondrial Mass by JC-1 Assay: To evaluate the integrity of mitochondrial functions, we used the cationic
dye JC-1 assay. SH-SY5Y cells were cultured on a six well plate at a density of 1x10⁶
cells/mL and allowed to grow overnight at 37 °C. Cells were treated with 1.0 µM
cisplatin, 1.0 µM Platin-M, 1.0 µM NT-Platin-M-NPs, and 1.0 µM T-Platin-M-NPs for 12
h at 37 °C. A solution of JC-1 reagent (10 µg/mL in RPMI) was added and incubated for
10 min at 37 °C. The cells were washed 3 times with PBS and trypsinized. The cells
were isolated and washed 3x by centrifugation with PBS (1,800 rpm for 3 min at 4 °C).
The resulting cell pellet was resuspended in 100 µL PBS and analyzed by flow
cytometry using 488 nm and 633 nm excitations with 530 nm and 660 nm bandpass
filters.
15
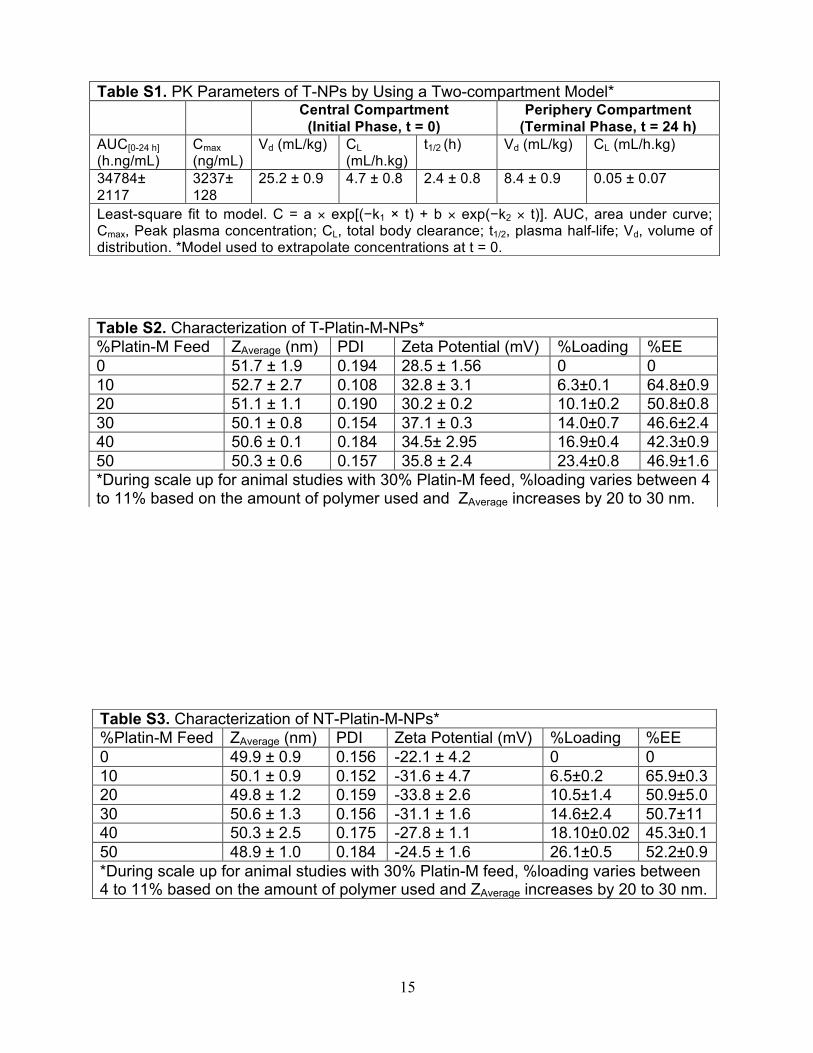
Table S1. PK Parameters of T-NPs by Using a Two-compartment Model* Central Compartment
(Initial Phase, t = 0) Periphery Compartment
(Terminal Phase, t = 24 h) AUC[0-24 h] (h.ng/mL)
Cmax (ng/mL)
Vd (mL/kg) CL (mL/h.kg)
t1/2 (h) Vd (mL/kg) CL (mL/h.kg)
34784± 2117
3237± 128
25.2 ± 0.9 4.7 ± 0.8 2.4 ± 0.8
8.4 ± 0.9 0.05 ± 0.07
Least-square fit to model. C = a × exp[(−k1 × t) + b × exp(−k2 × t)]. AUC, area under curve; Cmax, Peak plasma concentration; CL, total body clearance; t1/2, plasma half-life; Vd, volume of distribution. *Model used to extrapolate concentrations at t = 0.
Table S2. Characterization of T-Platin-M-NPs* %Platin-M Feed ZAverage (nm) PDI Zeta Potential (mV) %Loading %EE 0 51.7 ± 1.9 0.194 28.5 ± 1.56 0 0 10 52.7 ± 2.7 0.108 32.8 ± 3.1 6.3±0.1 64.8±0.9 20 51.1 ± 1.1 0.190 30.2 ± 0.2 10.1±0.2 50.8±0.8 30 50.1 ± 0.8 0.154 37.1 ± 0.3 14.0±0.7 46.6±2.4 40 50.6 ± 0.1 0.184 34.5± 2.95 16.9±0.4 42.3±0.9 50 50.3 ± 0.6 0.157 35.8 ± 2.4 23.4±0.8 46.9±1.6 *During scale up for animal studies with 30% Platin-M feed, %loading varies between 4 to 11% based on the amount of polymer used and ZAverage increases by 20 to 30 nm.
Table S3. Characterization of NT-Platin-M-NPs* %Platin-M Feed ZAverage (nm) PDI Zeta Potential (mV) %Loading %EE 0 49.9 ± 0.9 0.156 -22.1 ± 4.2 0 0 10 50.1 ± 0.9 0.152 -31.6 ± 4.7 6.5±0.2 65.9±0.3 20 49.8 ± 1.2 0.159 -33.8 ± 2.6 10.5±1.4 50.9±5.0 30 50.6 ± 1.3 0.156 -31.1 ± 1.6 14.6±2.4 50.7±11 40 50.3 ± 2.5 0.175 -27.8 ± 1.1 18.10±0.02 45.3±0.1 50 48.9 ± 1.0 0.184 -24.5 ± 1.6 26.1±0.5 52.2±0.9 *During scale up for animal studies with 30% Platin-M feed, %loading varies between 4 to 11% based on the amount of polymer used and ZAverage increases by 20 to 30 nm.
16
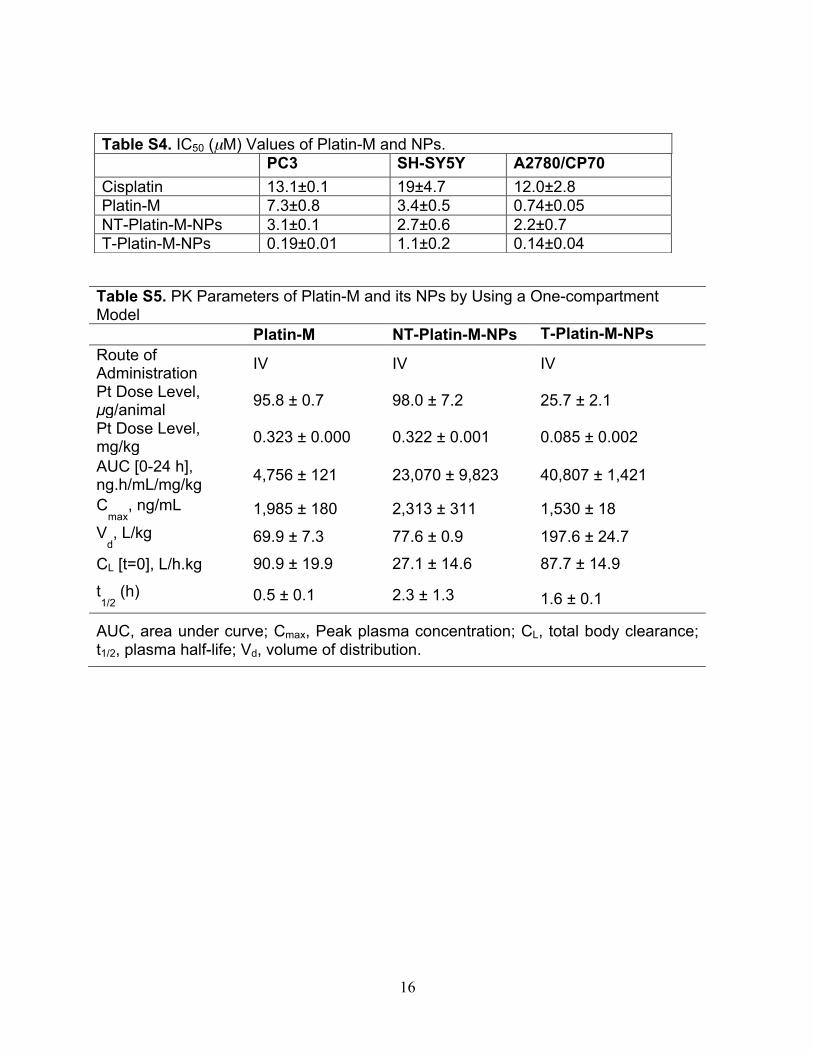
Table S4. IC50 (µM) Values of Platin-M and NPs. PC3 SH-SY5Y A2780/CP70 Cisplatin 13.1±0.1 19±4.7 12.0±2.8 Platin-M 7.3±0.8 3.4±0.5 0.74±0.05 NT-Platin-M-NPs 3.1±0.1 2.7±0.6 2.2±0.7 T-Platin-M-NPs 0.19±0.01 1.1±0.2 0.14±0.04
Table S5. PK Parameters of Platin-M and its NPs by Using a One-compartment Model Platin-M NT-Platin-M-NPs T-Platin-M-NPs Route of Administration IV IV IV
Pt Dose Level, µg/animal 95.8 ± 0.7 98.0 ± 7.2 25.7 ± 2.1
Pt Dose Level, mg/kg 0.323 ± 0.000 0.322 ± 0.001 0.085 ± 0.002
AUC [0-24 h], ng.h/mL/mg/kg 4,756 ± 121 23,070 ± 9,823 40,807 ± 1,421
Cmax
, ng/mL 1,985 ± 180 2,313 ± 311 1,530 ± 18 V
d, L/kg 69.9 ± 7.3 77.6 ± 0.9 197.6 ± 24.7
CL [t=0], L/h.kg 90.9 ± 19.9 27.1 ± 14.6 87.7 ± 14.9
t1/2
(h) 0.5 ± 0.1 2.3 ± 1.3 1.6 ± 0.1
AUC, area under curve; Cmax, Peak plasma concentration; CL, total body clearance; t1/2, plasma half-life; Vd, volume of distribution.
17
Fig. S1. 1H NMR of DBCO-TPP in CDCl3.
Fig. S2. 13C NMR of DBCO-TPP in CDCl3.
a b
c d d, k
f e
g e
h,i,j
* * Diethyl ether *
a,b c c
d
d e,f,g
18
Fig. S3. 31P NMR of DBCO-TPP in CDCl3.
Fig. S4. HRMS-ESI of DBCO-TPP.
!"
19
Fig. S5. (Top) 1H NMR of Platin-M in DMSO-d6. (Bottom) A comparison of 1H NMR of
Platin-M in DMSO-d6 with the precursors used in SPAAC, Platin-Az and DBCO-TPP.
Bottom
!"
#"
$" %" %"&" '"
()*)+"(,)*,)+,"
-"--"
-"""."/01/21"--"."/03/4"
&,"
5"."6789"55"."6789":!;<=""
55"
5"
>" >,"
<" <"&"
Top
!"
#"
$"
$%&%'"
()"
*"
!"#"
$" &"&%"("
*" '"+"'"
,%-%."
!" #"$" &" &"
(" *"
,%-%.",)%-)%.)"
()"
+" +)"'"'"
Platin-Az
DBCO-TPP
Platin-M
20
Fig. S6. gCOSY of NMR of Platin-M in DMSO-d6.
!"#$
%$&$
'$
(")"*$(+")+"*+$
&+$
,$ ,+$
-$ -$
%$
21
Fig. S7. (Top) 13C NMR of Platin-M in DMSO-d6. (Bottom) A comparison of 13C NMR of
Platin-M in DMSO-d6 with the precursors used in SPAAC, Platin-Az and DBCO-TPP.
!
!"#"$% &% '"(")")*%
+%
+%
!"#"
$"
%&'&("
!&#"$" $"
%"
%" '&(&)"
!&#&$"%" (&)&*&*+"
'"
'"
Platin-Az
DBCO-TPP
Platin-M
"#$!
%#&&#'!Bottom
22
Fig. S8. 31P NMR of Platin-M in DMSO-d6.
Fig. S9. 195Pt NMR of Platin-M in DMSO-d6.
!"
Platin-M
Platin-M
a
23
Fig. S10. HRMS-ESI of Platin-M.
Calculated Observed
C96H106Cl2N12O8P2Pt2+
Exact Mass: 1881.6746 m/z: 941.3390 (100.0%); z=2
24
Fig. S11. Electrochemistry data of Platin-M.
Platin-M pH= 6.4; -0.369 V vs Ag/AgCl; -0.269 V vs NHE
0.0 -0.2 -0.4 -0.6
Platin-M pH=6.4
50 100 150 200 250 300
Cur
rent
(A)
V vs. Ag/AgCl
-0.5
A
Platin-M pH= 7.4; -0.376 V vs Ag/AgCl; -0.275 V vs NHE
0.0 -0.2 -0.4 -0.6
Platin-M pH=7.4
50 100 150 200 250 300
V vs. Ag/AgCl
Cur
rent
(A)
-0.5
A
25
Fig. S12. 1H and 13C NMR of PLGALMW-b-PEG-OH in CDCl3.
26
Fig. S13. 1H, 13C, and 31P NMR of PLGALMW-b-PEG-TPP in CDCl3.
a
b c
d
e
f g
PLGALMW-b-PEG-TPP c e
a f
g b
d
PLGALMW-b-PEG-TPP
a b
c
d
e
PLGALMW-b-PEG-TPP
1H
13C
31P
27
Fig. S14. 1H (top) and 13C (bottom) NMR of PLGAHMW-b-PEG-OH in CDCl3.
a b
c
d e f
PLGAHMW-b-PEG-OH
a
b
c
d
PLGAHMW-b-PEG-OH
BOTTOM
TOP
28
Fig. S15. 1H, 13C, and 31P NMR of PLGAHMW-b-PEG-TPP in CDCl3.
PLGAHMW-b-PEG-TPP
a
b
c d e
f g
PLGAHMW-b-PEG-TPP
a
b
c d e
PLGAHMW-b-PEG-TPP
1H
13C
31P
29
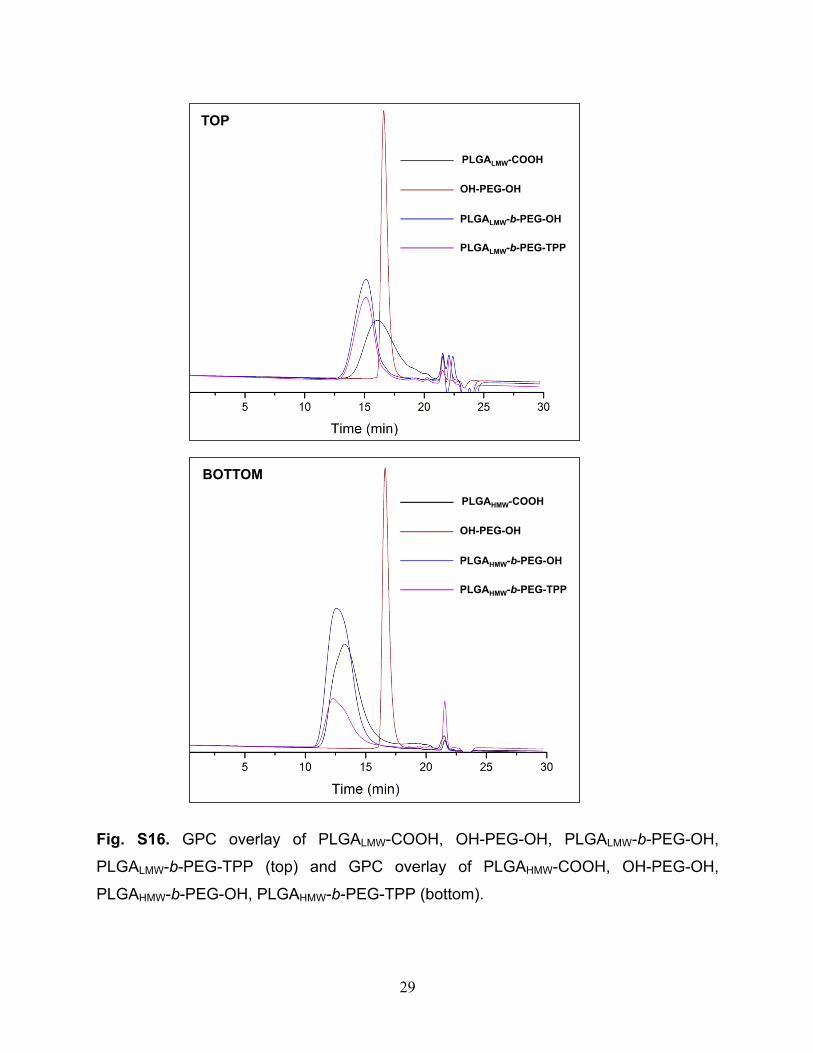
Fig. S16. GPC overlay of PLGALMW-COOH, OH-PEG-OH, PLGALMW-b-PEG-OH,
PLGALMW-b-PEG-TPP (top) and GPC overlay of PLGAHMW-COOH, OH-PEG-OH,
PLGAHMW-b-PEG-OH, PLGAHMW-b-PEG-TPP (bottom).
PLGALMW-b-PEG-TPP
PLGALMW-b-PEG-OH
OH-PEG-OH
PLGALMW-COOH
PLGAHMW-b-PEG-TPP
PLGAHMW-b-PEG-OH
OH-PEG-OH
PLGAHMW-COOH
TOP
BOTTOM
30
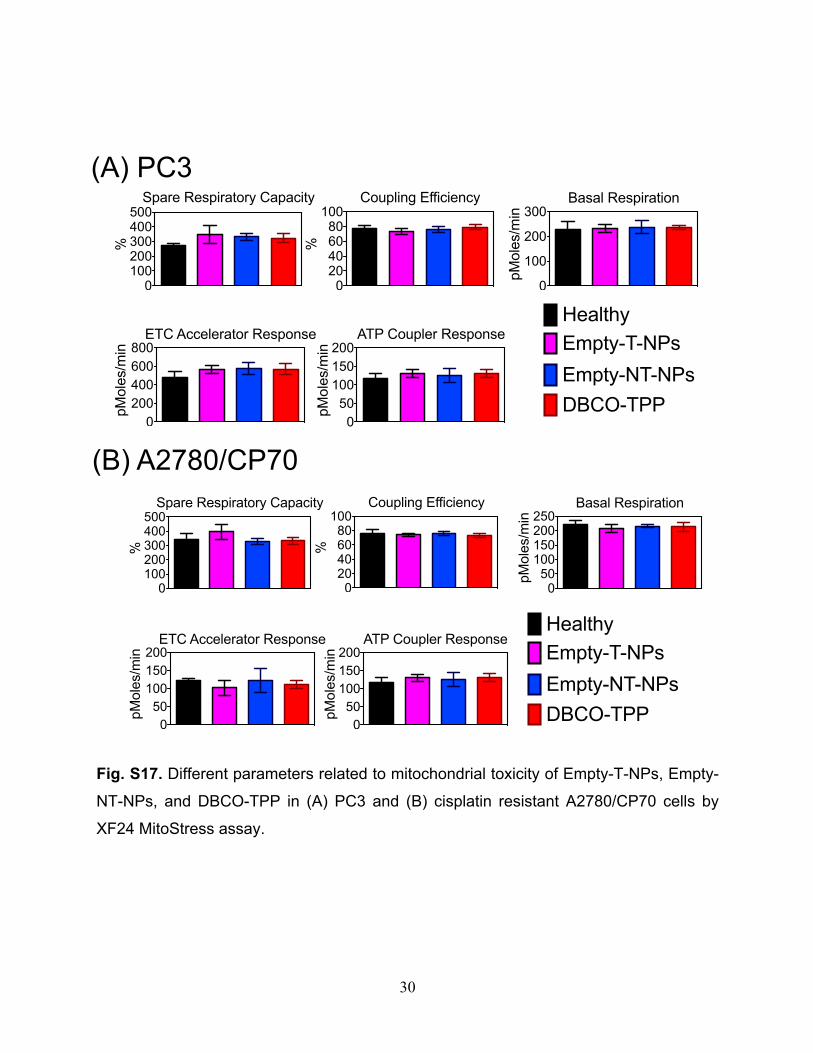
Fig. S17. Different parameters related to mitochondrial toxicity of Empty-T-NPs, Empty-
NT-NPs, and DBCO-TPP in (A) PC3 and (B) cisplatin resistant A2780/CP70 cells by
XF24 MitoStress assay.
0100200300400500
%
Spare Respiratory Capacity
020406080
100
%
Coupling Efficiency
0
100
200
300
pMol
es/m
in
Basal Respiration
0200400600800
pMol
es/m
in
ETC Accelerator Response
050
100150200
pMol
es/m
inATP Coupler Response
(A) PC3
HealthyEmpty-T-NPsEmpty-NT-NPsDBCO-TPP
(B) A2780/CP70
0100200300400500
%
Spare Respiratory Capacity
020406080
100
%
Coupling Efficiency
050
100150200250
pMol
es/m
inBasal Respiration
050
100150200
pMol
es/m
in
ETC Accelerator Response
050
100150200
pMol
es/m
in
ATP Coupler ResponseHealthyEmpty-T-NPsEmpty-NT-NPsDBCO-TPP
31
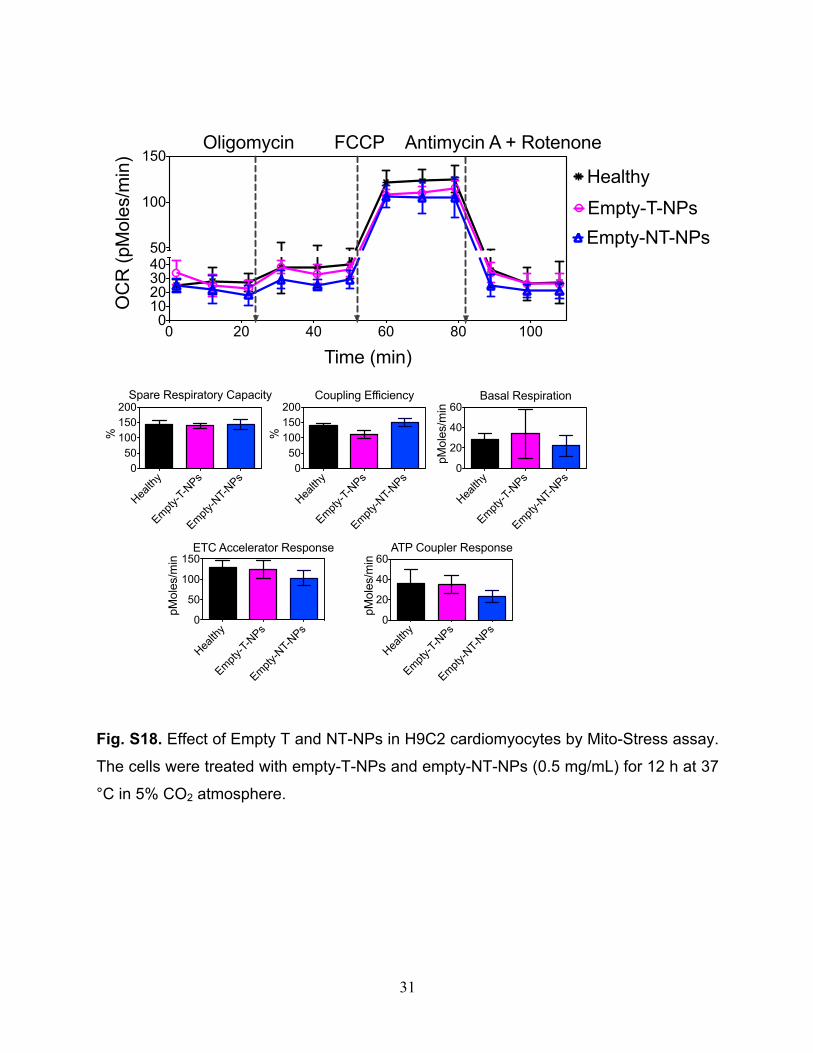
Fig. S18. Effect of Empty T and NT-NPs in H9C2 cardiomyocytes by Mito-Stress assay.
The cells were treated with empty-T-NPs and empty-NT-NPs (0.5 mg/mL) for 12 h at 37
°C in 5% CO2 atmosphere.
Health
y
Empty-T-
NPs
Empty-N
T-NPs
050
100150200
%
Spare Respiratory Capacity
%
Health
y
Empty-T-
NPs
Empty-N
T-NPs
050
100150200
Coupling Efficiency
Health
y
Empty-T-
NPs
Empty-N
T-NPs
0
20
40
60
pMol
es/m
in
Basal Respiration
Health
y
Empty-T-
NPs
Empty-N
T-NPs
0
50
100
150
pMol
es/m
in
ETC Accelerator Response
pMol
es/m
in
Health
y
Empty-T-
NPs
Empty-N
T-NPs
0
20
40
60ATP Coupler Response
0 20 40 60 80 1000
1020304050
100
150
Time (min)
OC
R (p
Mol
es/m
in)
Healthy
Empty-T-NPsEmpty-NT-NPs
FCCPOligomycin Antimycin A + Rotenone
32
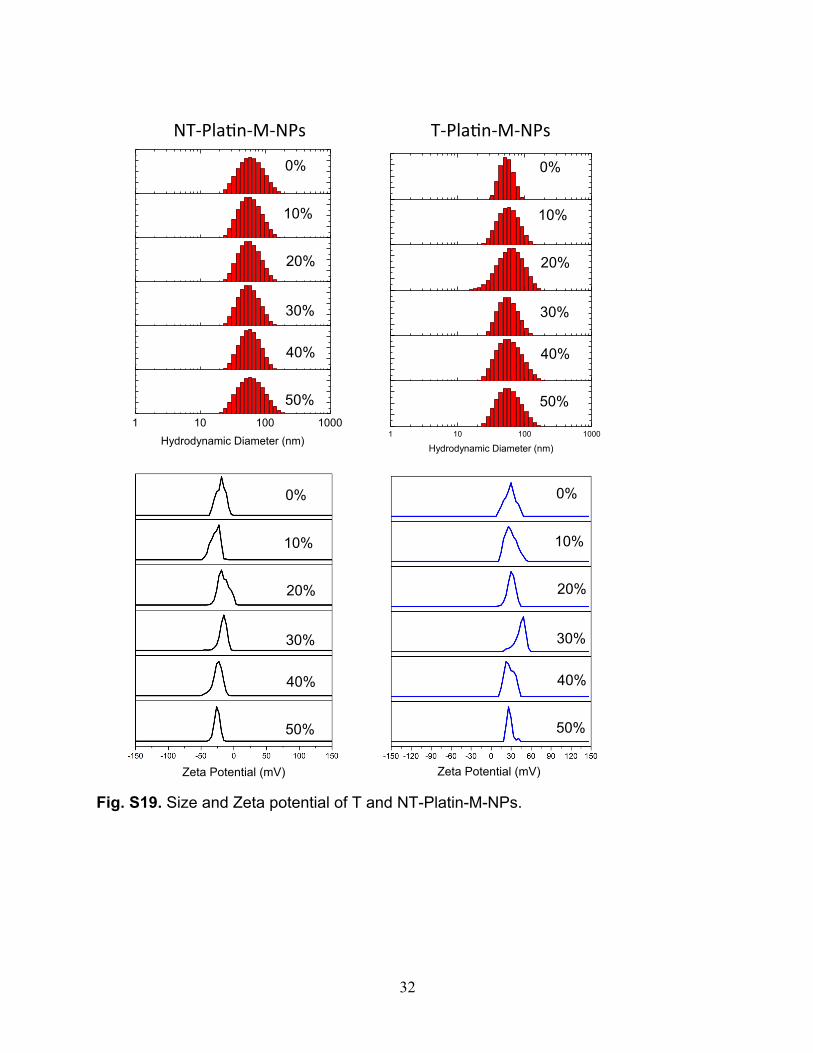
Fig. S19. Size and Zeta potential of T and NT-Platin-M-NPs.
1 10 100 1000
Hydrodynamic Diameter (nm)
!"#$%&'(#)#!$*+
1 10 100 1000
Hydrodynamic Diameter (nm)
"#$%&'(#)#!$*+
0%
10%
20%
30%
40%
50%
0%
10%
20%
30%
40%
50%
0%
10%
20%
30%
40%
50%
0%
10%
20%
30%
40%
50%
Zeta Potential (mV) Zeta Potential (mV)
33
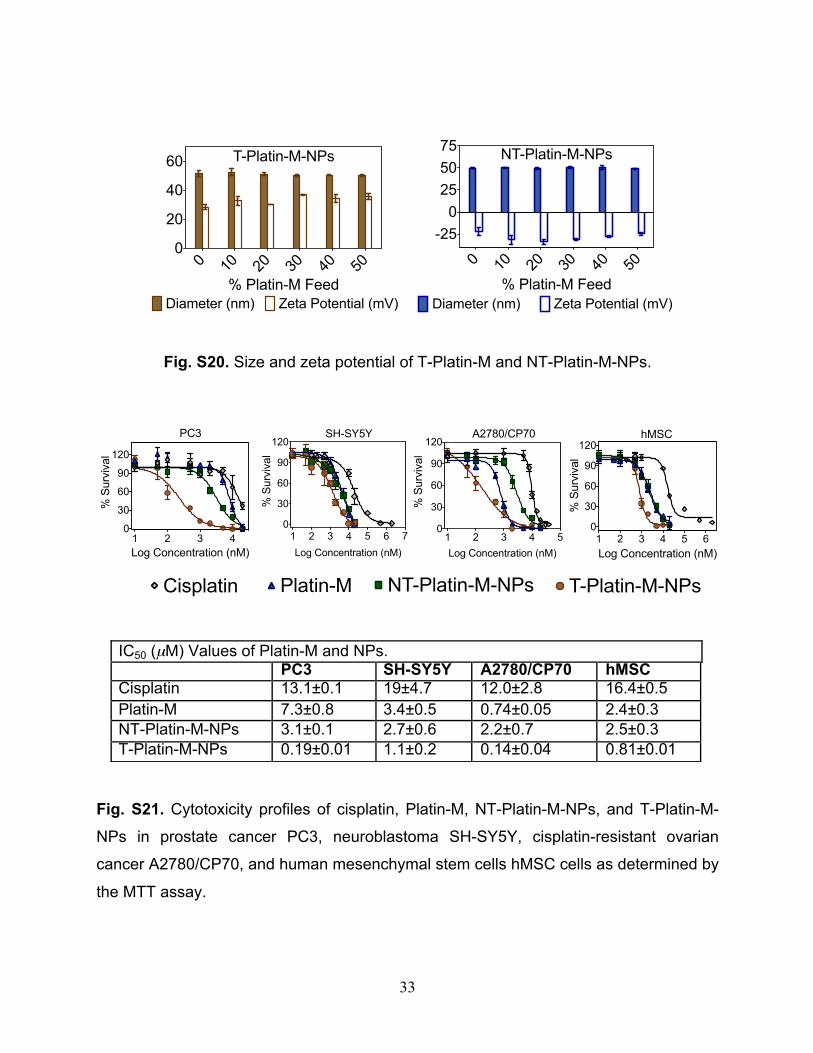
Fig. S20. Size and zeta potential of T-Platin-M and NT-Platin-M-NPs.
Fig. S21. Cytotoxicity profiles of cisplatin, Platin-M, NT-Platin-M-NPs, and T-Platin-M-
NPs in prostate cancer PC3, neuroblastoma SH-SY5Y, cisplatin-resistant ovarian
cancer A2780/CP70, and human mesenchymal stem cells hMSC cells as determined by
the MTT assay.
1 2 3 4 50
30
60
90
120
Log Concentration (nM)
% S
urvi
val
T-Platin-M-NPs
NT-Platin-M-NPs
Platin-MCisplatin
A2780/CP70
1 2 3 4 5 6 70
30
60
90
120
Log Concentration (nM)
% S
urvi
val
SH-SY5Y
1 2 3 40
30
60
90
120
Log Concentration (nM)
% S
urvi
val
PC3
1 2 3 4 50
30
60
90
120
Log Concentration (nM)
% S
urvi
val
T-Platin-M-NPs
NT-Platin-M-NPs
Platin-MCisplatin
A2780/CP70
1 2 3 4 50
30
60
90
120
Log Concentration (nM)
% S
urvi
val
T-Platin-M-NPs
NT-Platin-M-NPs
Platin-MCisplatin
A2780/CP70
1 2 3 4 50
30
60
90
120
Log Concentration (nM)
% S
urvi
val
T-Platin-M-NPs
NT-Platin-M-NPs
Platin-MCisplatin
A2780/CP70
1 2 3 4 50
30
60
90
120
Log Concentration (nM)
% S
urvi
val
T-Platin-M-NPs
NT-Platin-M-NPs
Platin-MCisplatin
A2780/CP70
1 2 3 4 5 60
30
60
90
120
Log Concentration (nM)
% S
urvi
val
hMSC
IC50 (µM) Values of Platin-M and NPs. PC3 SH-SY5Y A2780/CP70 hMSC Cisplatin 13.1±0.1 19±4.7 12.0±2.8 16.4±0.5 Platin-M 7.3±0.8 3.4±0.5 0.74±0.05 2.4±0.3 NT-Platin-M-NPs 3.1±0.1 2.7±0.6 2.2±0.7 2.5±0.3 T-Platin-M-NPs 0.19±0.01 1.1±0.2 0.14±0.04 0.81±0.01
0 10 20 30 40 500
20
40
60
% Platin-M FeedDiameter (nm) Zeta Potential (mV)
T-Platin-M-NPs
0 10 20 30 40 50
-250
255075
% Platin-M FeedDiameter (nm) Zeta Potential (mV)
NT-Platin-M-NPs
34
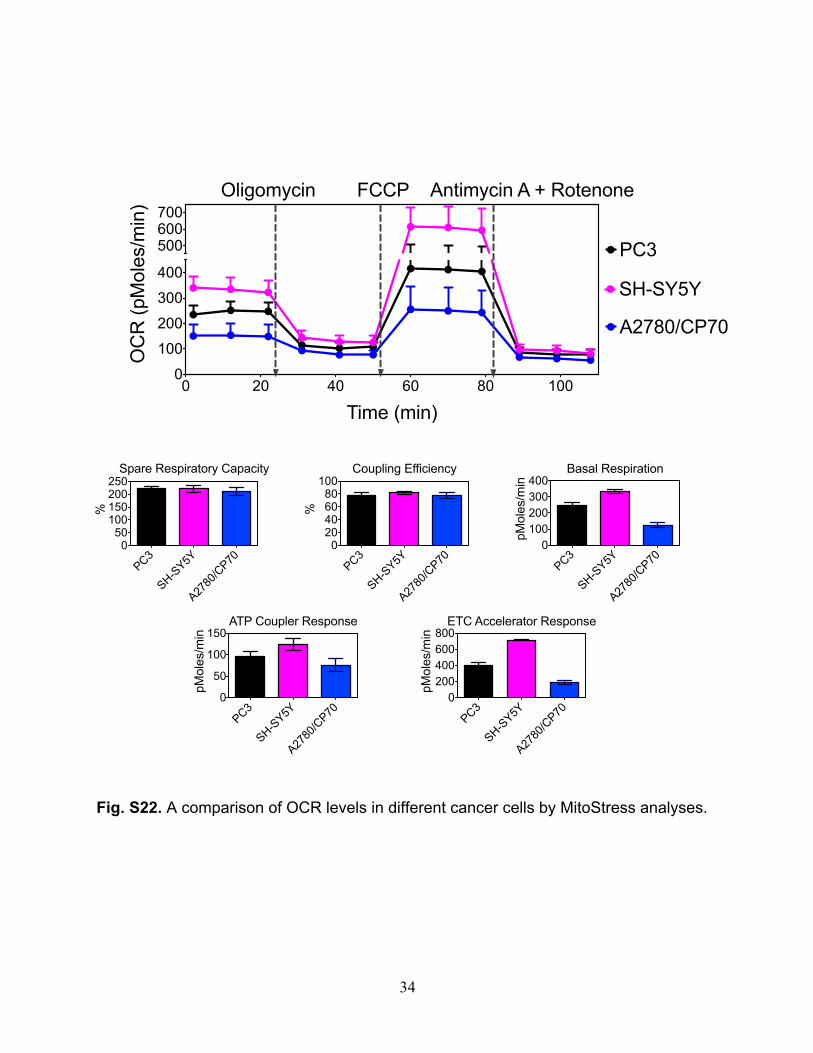
Fig. S22. A comparison of OCR levels in different cancer cells by MitoStress analyses.
PC3
SH-SY5Y
A2780
/CP70
050
100150200250
%
Spare Respiratory Capacity
%
PC3
SH-SY5Y
A2780
/CP70
020406080
100Coupling Efficiency
pMol
es/m
in
PC3
SH-SY5Y
A2780
/CP70
0100200300400
Basal Respiration
pMol
es/m
in
PC3
SH-SY5Y
A2780
/CP70
0200400600800
ETC Accelerator Response
pMol
es/m
in
PC3
SH-SY5Y
A2780
/CP70
0
50
100
150ATP Coupler Response
0 20 40 60 80 1000
100
200
300
400
500600700
Time (min)
OC
R (p
Mol
es/m
in)
PC3
A2780/CP70
SH-SY5Y
FCCPOligomycin Antimycin A + Rotenone
35
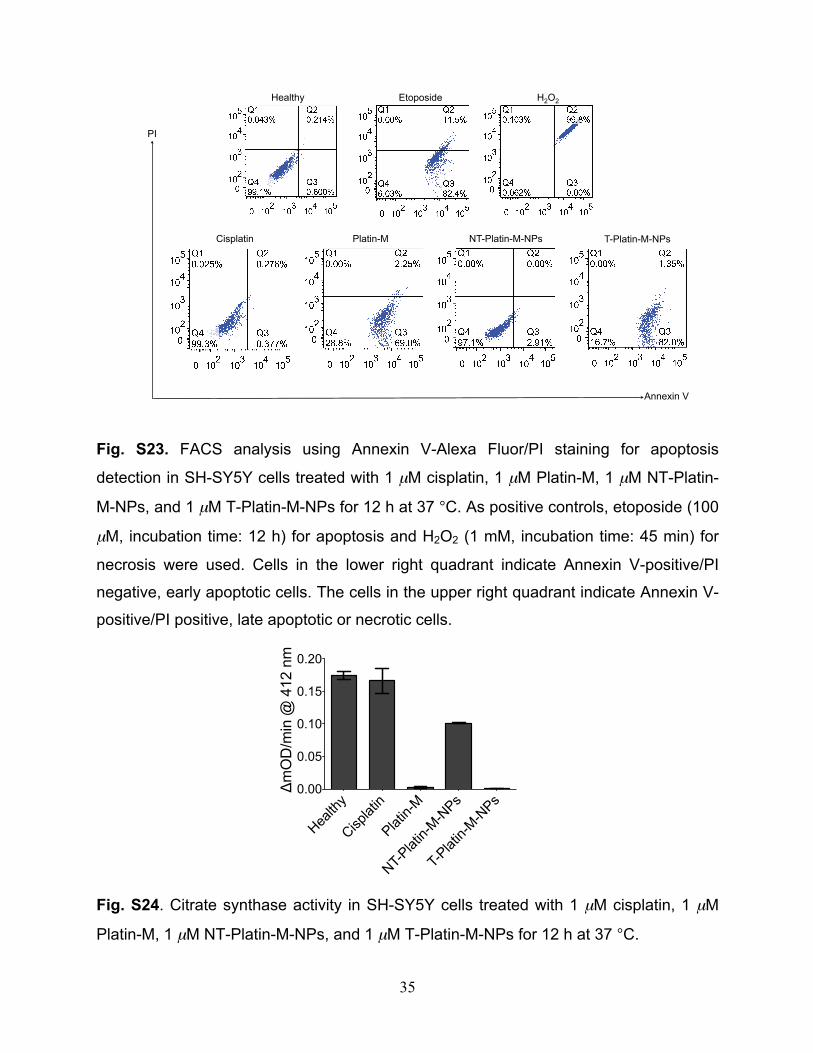
Fig. S23. FACS analysis using Annexin V-Alexa Fluor/PI staining for apoptosis
detection in SH-SY5Y cells treated with 1 µM cisplatin, 1 µM Platin-M, 1 µM NT-Platin-
M-NPs, and 1 µM T-Platin-M-NPs for 12 h at 37 °C. As positive controls, etoposide (100
µM, incubation time: 12 h) for apoptosis and H2O2 (1 mM, incubation time: 45 min) for
necrosis were used. Cells in the lower right quadrant indicate Annexin V-positive/PI
negative, early apoptotic cells. The cells in the upper right quadrant indicate Annexin V-
positive/PI positive, late apoptotic or necrotic cells.
Fig. S24. Citrate synthase activity in SH-SY5Y cells treated with 1 µM cisplatin, 1 µM
Platin-M, 1 µM NT-Platin-M-NPs, and 1 µM T-Platin-M-NPs for 12 h at 37 °C.
Healthy
Cisplatin Platin-M NT-Platin-M-NPs T-Platin-M-NPs
Etoposide H2O2
Annexin V
PI
!mO
D/m
in @
412
nm
Health
y
Cisplat
in
Platin-
M
NT-Plat
in-M-N
Ps
T-Plat
in-M-N
Ps0.00
0.05
0.10
0.15
0.20
36
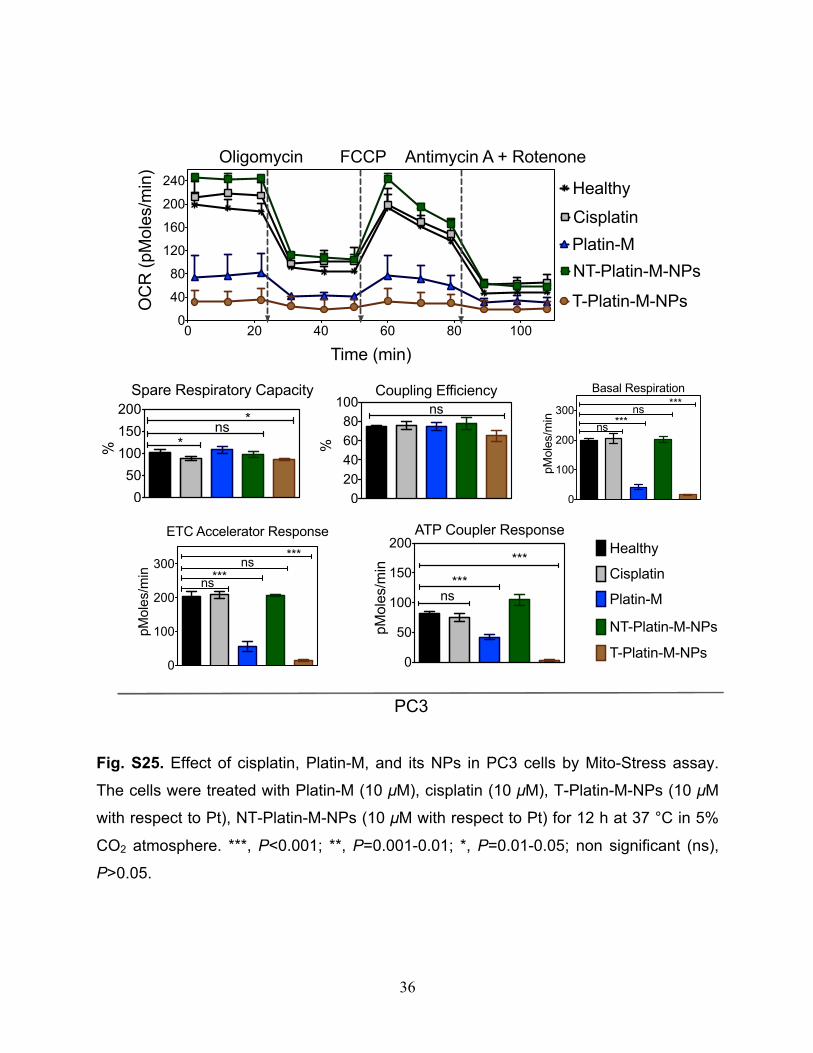
Fig. S25. Effect of cisplatin, Platin-M, and its NPs in PC3 cells by Mito-Stress assay.
The cells were treated with Platin-M (10 µM), cisplatin (10 µM), T-Platin-M-NPs (10 µM
with respect to Pt), NT-Platin-M-NPs (10 µM with respect to Pt) for 12 h at 37 °C in 5%
CO2 atmosphere. ***, P<0.001; **, P=0.001-0.01; *, P=0.01-0.05; non significant (ns),
P>0.05.
0 20 40 60 80 1000
40
80
120
160
200
240
Time (min)
OC
R (p
Mol
es/m
in)
Healthy
CisplatinPlatin-MNT-Platin-M-NPs
FCCPOligomycin Antimycin A + Rotenone
T-Platin-M-NPs
0
50
100
150
200
%
Spare Respiratory Capacity
*
*ns
020406080
100
%
Coupling Efficiencyns
0
100
200
300
pMol
es/m
in
Basal Respiration
ns ***ns ***
0
100
200
300
pMol
es/m
in
ETC Accelerator Response
***
***ns
ns
0
50
100
150
200
pMol
es/m
in
ATP Coupler Response
***ns
***
T-Platin-M-NPs
NT-Platin-M-NPs
Platin-M
Cisplatin
Healthy
PC3
37
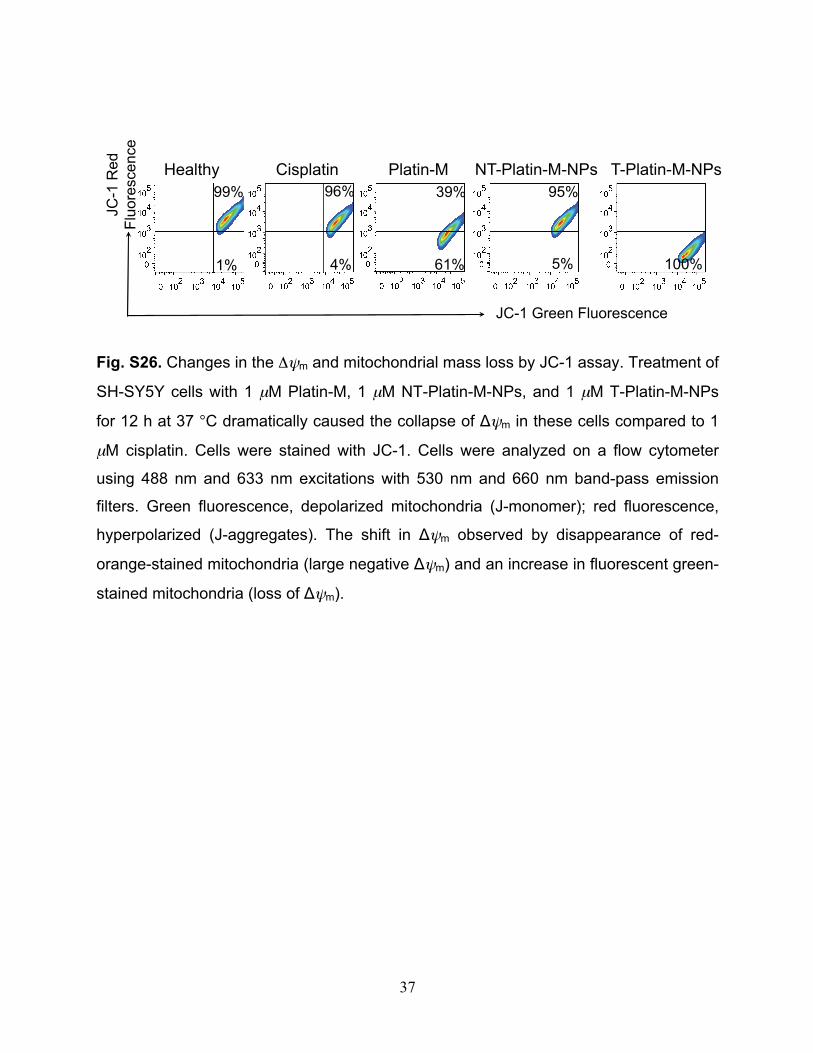
Fig. S26. Changes in the Δψm and mitochondrial mass loss by JC-1 assay. Treatment of
SH-SY5Y cells with 1 µM Platin-M, 1 µM NT-Platin-M-NPs, and 1 µM T-Platin-M-NPs
for 12 h at 37 °C dramatically caused the collapse of Δψm in these cells compared to 1
µM cisplatin. Cells were stained with JC-1. Cells were analyzed on a flow cytometer
using 488 nm and 633 nm excitations with 530 nm and 660 nm band-pass emission
filters. Green fluorescence, depolarized mitochondria (J-monomer); red fluorescence,
hyperpolarized (J-aggregates). The shift in Δψm observed by disappearance of red-
orange-stained mitochondria (large negative Δψm) and an increase in fluorescent green-
stained mitochondria (loss of Δψm).
JC-1 Green Fluorescence
JC-1
Red
Fl
uore
scen
ce
Healthy Cisplatin Platin-M NT-Platin-M-NPs T-Platin-M-NPs 99%
1%
96%
4%
39%
61%
95%
5% 100%
38
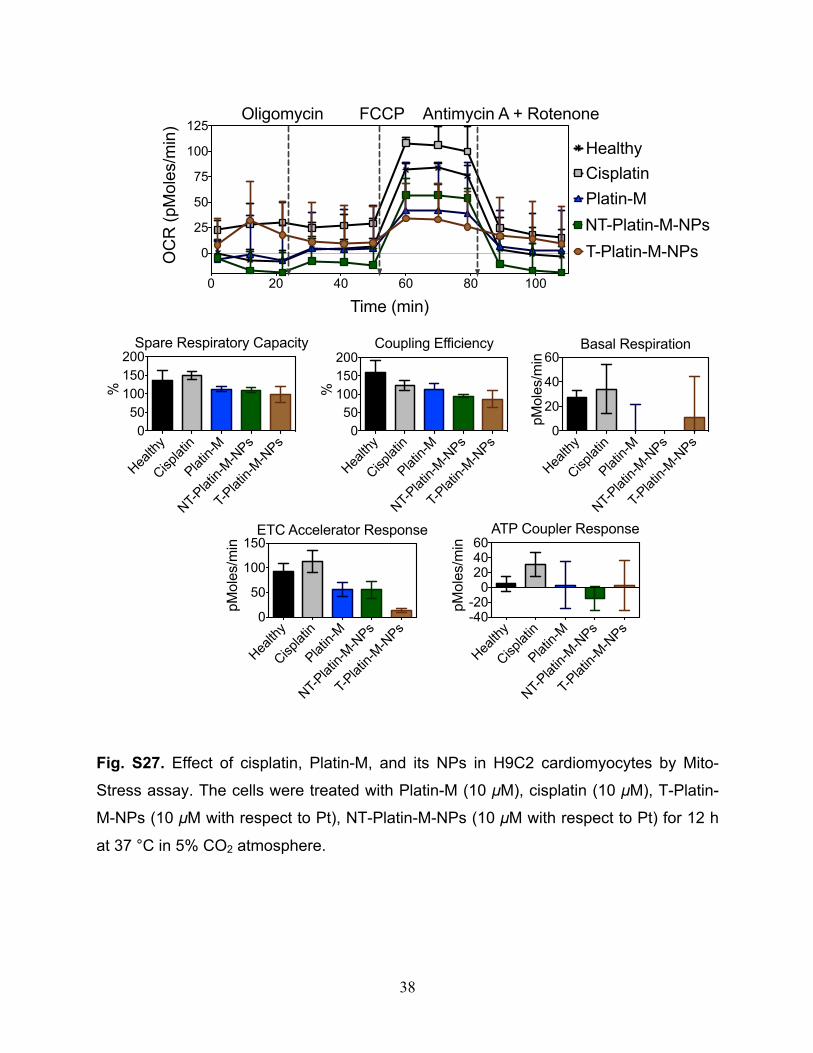
Fig. S27. Effect of cisplatin, Platin-M, and its NPs in H9C2 cardiomyocytes by Mito-
Stress assay. The cells were treated with Platin-M (10 µM), cisplatin (10 µM), T-Platin-
M-NPs (10 µM with respect to Pt), NT-Platin-M-NPs (10 µM with respect to Pt) for 12 h
at 37 °C in 5% CO2 atmosphere.
Health
y
Cisplat
in
Platin-
M
NT-Plat
in-M-N
Ps
T-Plat
in-M-N
Ps0
50100150200
%
Spare Respiratory Capacity
Health
y
Cisplat
in
Platin-
M
NT-Plat
in-M-N
Ps
T-Plat
in-M-N
Ps0
50100150200
%Coupling Efficiency
Health
y
Cisplat
in
Platin-
M
NT-Plat
in-M-N
Ps
T-Plat
in-M-N
Ps0
20
40
60
pMol
es/m
in
Basal Respiration
pMol
es/m
in
Health
y
Cisplat
in
Platin-
M
NT-Plat
in-M-N
Ps
T-Plat
in-M-N
Ps0
50
100
150ETC Accelerator Response
pMol
es/m
in
Health
y
Cisplat
in
Platin-
M
NT-Plat
in-M-N
Ps
T-Plat
in-M-N
Ps-40-20
0204060
ATP Coupler Response
0 20 40 60 80 100
0
25
50
75
100
125
Time (min)
OC
R (p
Mol
es/m
in)
Healthy
Platin-MNT-Platin-M-NPs
FCCPOligomycin Antimycin A + Rotenone
T-Platin-M-NPs
Cisplatin
39
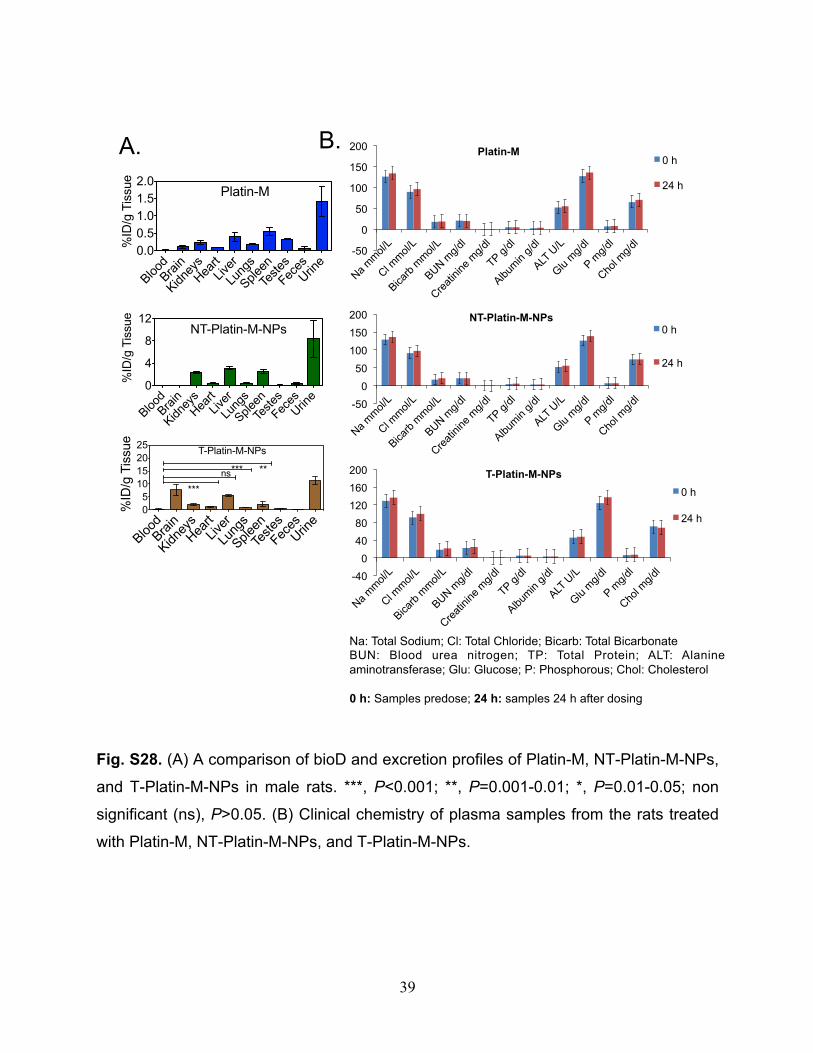
Fig. S28. (A) A comparison of bioD and excretion profiles of Platin-M, NT-Platin-M-NPs,
and T-Platin-M-NPs in male rats. ***, P<0.001; **, P=0.001-0.01; *, P=0.01-0.05; non
significant (ns), P>0.05. (B) Clinical chemistry of plasma samples from the rats treated
with Platin-M, NT-Platin-M-NPs, and T-Platin-M-NPs.
BloodBrai
n
Kidney
sHea
rtLiv
er
Lung
s
SpleenTe
stesFec
esUrin
e0.00.51.01.52.0
%ID
/g T
issu
e
Platin-M
BloodBrai
n
Kidney
sHea
rtLiv
er
Lung
s
SpleenTe
stesFec
esUrin
e0
4
8
12
%ID
/g T
issu
e
NT-Platin-M-NPs
BloodBrai
n
Kidney
sHea
rtLiv
er
Lung
s
SpleenTe
stesFec
esUrin
e05
10152025
%ID
/g T
issu
e
ns
***
*** **
T-Platin-M-NPs
Na: Total Sodium; Cl: Total Chloride; Bicarb: Total Bicarbonate BUN: Blood urea nitrogen; TP: Total Protein; ALT: Alanine aminotransferase; Glu: Glucose; P: Phosphorous; Chol: Cholesterol 0 h: Samples predose; 24 h: samples 24 h after dosing
A. B.
-50
0
50
100
150
200
Na mmol/
L
Cl mmol/
L
Bicarb
mmol/
L
BUN mg/d
l
Creati
nine m
g/dl
TP g/dl
Albumin
g/dl
ALT U
/L
Glu mg/d
l
P mg/d
l
Chol m
g/dl
NT-Platin-M-NPs 0 h
24 h
-40
0
40
80
120
160
200
Na mmol/
L
Cl mmol/
L
Bicarb
mmol/
L
BUN mg/d
l
Creati
nine m
g/dl
TP g/dl
Albumin
g/dl
ALT U
/L
Glu mg/d
l
P mg/d
l
Chol m
g/dl
T-Platin-M-NPs 0 h
24 h
-50
0
50
100
150
200
Na mmol/
L
Cl mmol/
L
Bicarb
mmol/
L
BUN mg/d
l
Creati
nine m
g/dl
TP g/dl
Albumin
g/dl
ALT U
/L
Glu mg/d
l
P mg/d
l
Chol m
g/dl
Platin-M 0 h
24 h
40
References:
1. Pathak RK, Marrache S, Harn DA, Dhar S (2014) Mito-DCA: A Mitochondria
Targeted Molecular Scaffold for Efficacious Delivery of Metabolic Modulator
Dichloroacetate. ACS Chem Biol 9: 1178-1187.
2. Pathak RK, McNitt CD, Popik VV, Dhar S (2014) Copper-free Click-chemistry
Platform to Functionalize Cisplatin Prodrugs. Chem Eur J 20: 6861-6865.
3. Marrache S, Dhar S (2012) Engineering of Blended Nanoparticle Platform for
Delivery of Mitochondria-acting Therapeutics. Proc Natl Acad Sci USA
109:16288-16293.
4. Lee HB, Blaufox MD (1985) Blood Volume in the Rat. J Nucl Med 26:72-76.