revision slides types of data leah wild key terms categorical variables quantity variables nominal...
TRANSCRIPT
Revision SlidesTypes of Data
Leah Wild
Key Terms Categorical variables Quantity variables Nominal variables Ordinal Variables Binary data. Discrete and continuous data. Interval and ratio variables Qualitative and Quantitative traits/
characteristics of data.
Categorical Data
The objects being studied are grouped into categories based on some qualitative trait.
The resulting data are merely labels or categories.
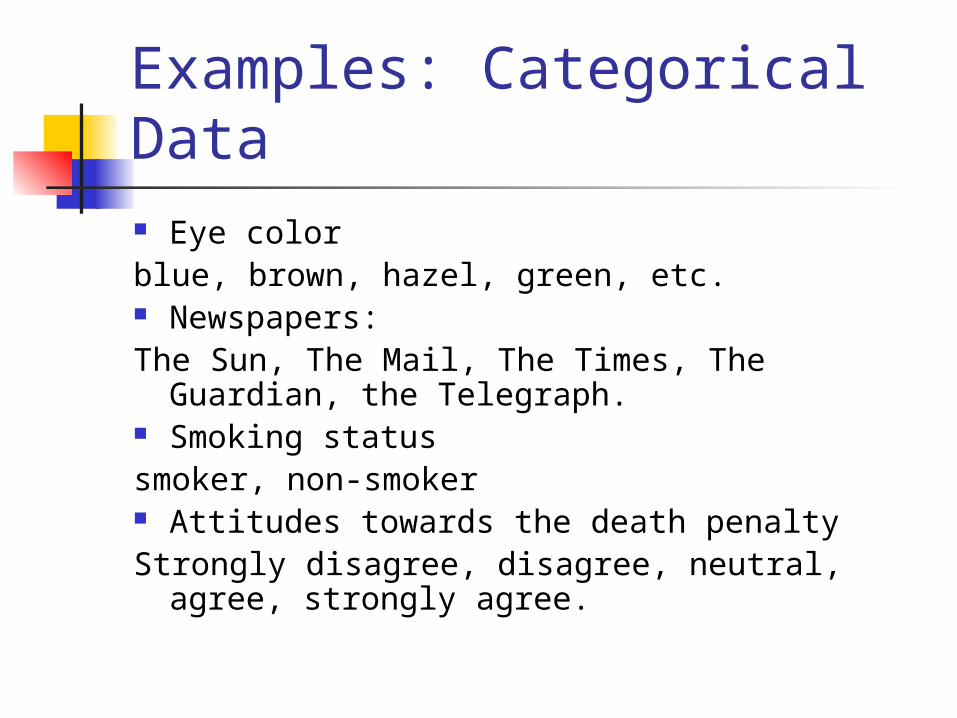
Examples: Categorical Data Eye colorblue, brown, hazel, green, etc. Newspapers: The Sun, The Mail, The Times, The Guardian, the
Telegraph. Smoking status smoker, non-smoker Attitudes towards the death penaltyStrongly disagree, disagree, neutral, agree,
strongly agree.
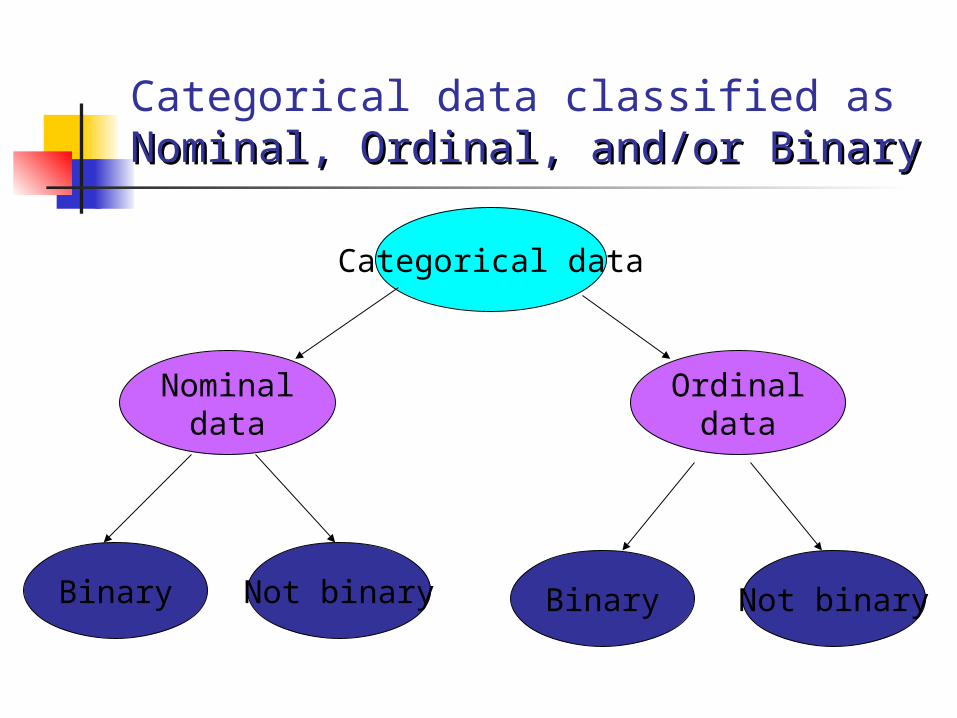
Categorical data classified asNominal, Ordinal, and/or BinaryNominal, Ordinal, and/or Binary
Categorical data
Not binaryBinary
Ordinaldata
Nominaldata
Binary Not binary
Nominal Data
A type of categorical data in which objects fall into unordered categories.
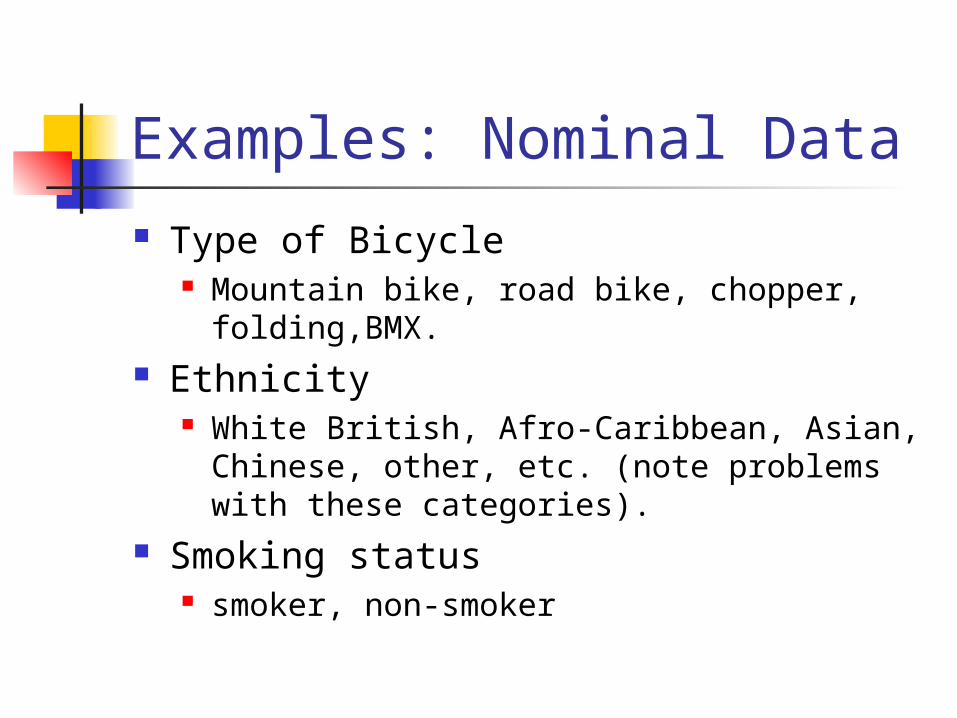
Examples: Nominal Data Type of Bicycle
Mountain bike, road bike, chopper, folding,BMX.
Ethnicity White British, Afro-Caribbean, Asian,
Chinese, other, etc. (note problems with these categories).
Smoking status smoker, non-smoker
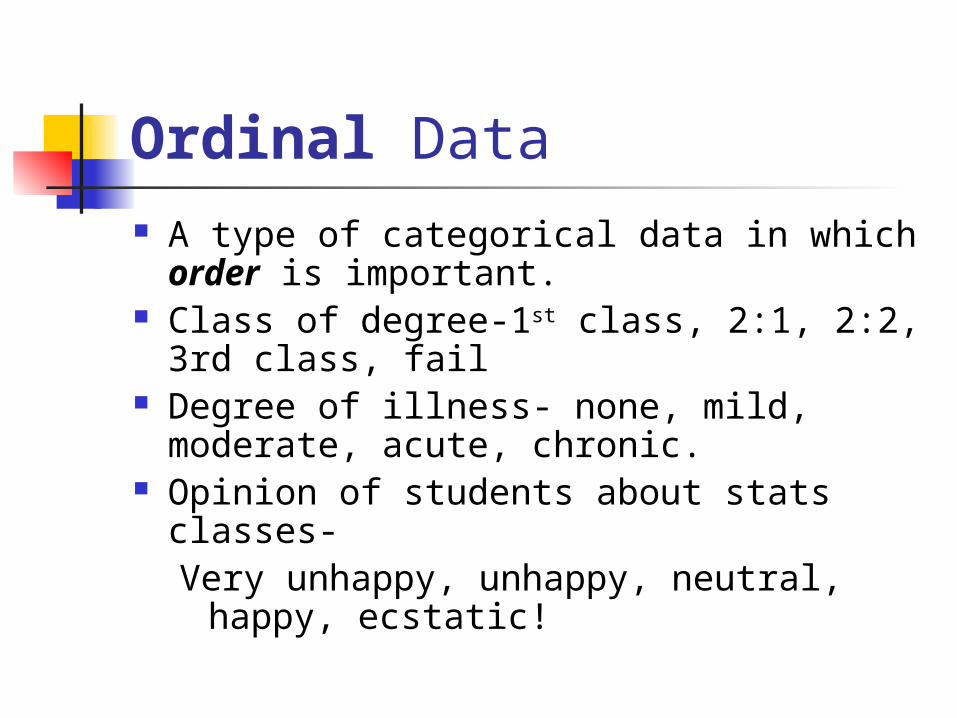
Ordinal Data A type of categorical data in which
order is important. Class of degree-1st class, 2:1, 2:2, 3rd
class, fail Degree of illness- none, mild, moderate,
acute, chronic. Opinion of students about stats classes-
Very unhappy, unhappy, neutral, happy, ecstatic!
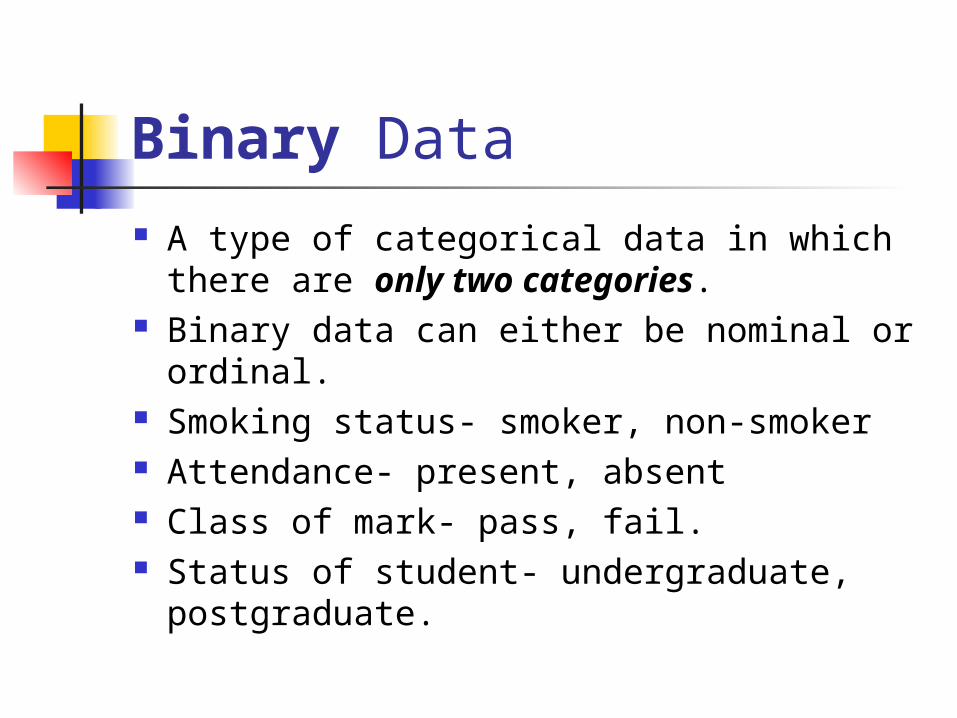
Binary Data A type of categorical data in which there
are only two categories. Binary data can either be nominal or
ordinal. Smoking status- smoker, non-smoker Attendance- present, absent Class of mark- pass, fail. Status of student- undergraduate,
postgraduate.
Quantity Data
The objects being studied are ‘measured’ based on some quantitative trait.
The resulting data are set of numbers.
Examples: quantity Data
Pulse rate Height Age Exam marks Size of bicycle frame Time to complete a statistics test Number of cigarettes smoked
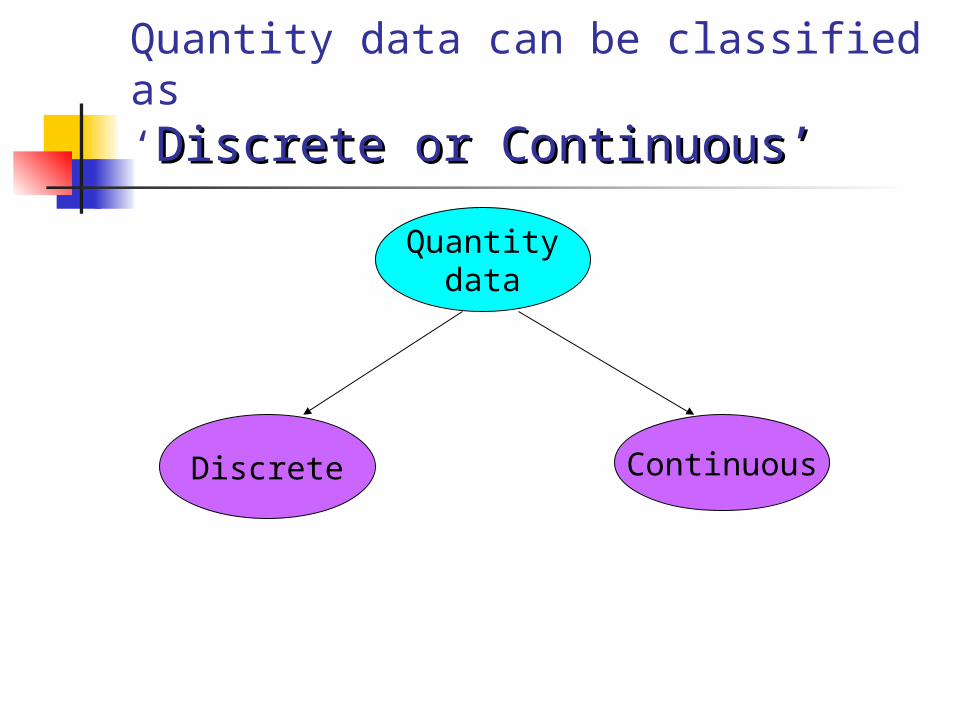
Quantity data can be classified as‘Discrete or Continuous’Discrete or Continuous’
Quantitydata
ContinuousDiscrete
Discrete DataOnly certain values are possible (there are gaps between the possible values).
Implies counting.
Continuous DataTheoretically, with a fine enough
measuring device. Implies counting.
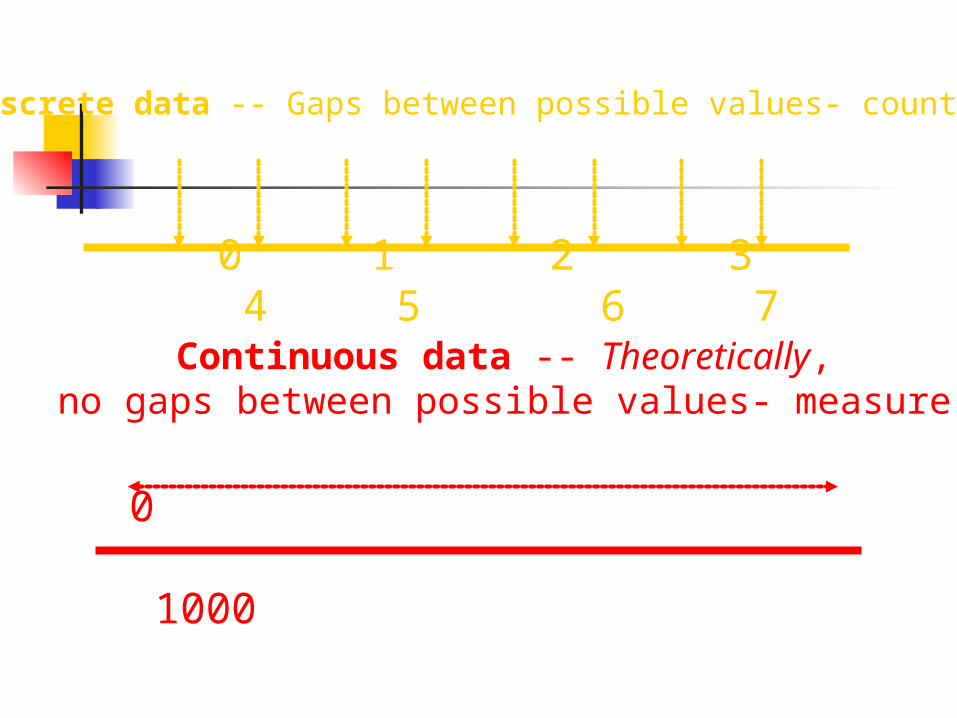
Discrete data -- Gaps between possible values- count
0 1 2 3 4 5 6 7
Continuous data -- Theoretically,no gaps between possible values- measure
0 1000
Examples: Discrete Data Number of children in a family Number of students passing a stats
exam Number of crimes reported to the
police Number of bicycles sold in a day.Generally, discrete data are counts.
We would not expect to find 2.2 children in a family or 88.5 students passing an exam or 127.2 crimes being reported to
the police or half a bicycle being sold in one day.
Examples:Continuous data
Size of bicycle frame Height Time to run 500 metres Age
‘Generally, continuous data come from measurements.
(any value within an interval is possible with a fine enough measuring device’- (Rowntree 2000)).
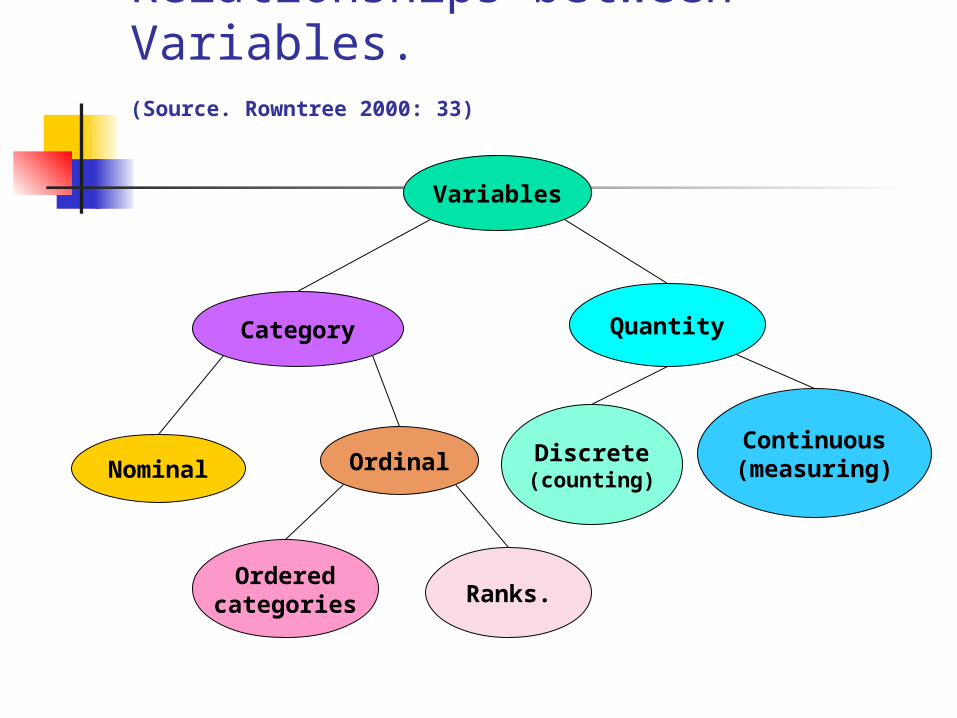
Variables
Category Quantity
Nominal Ordinal Discrete(counting)
Continuous(measuring)
Orderedcategories Ranks.
Relationships between Variables. (Source. Rowntree 2000: 33)
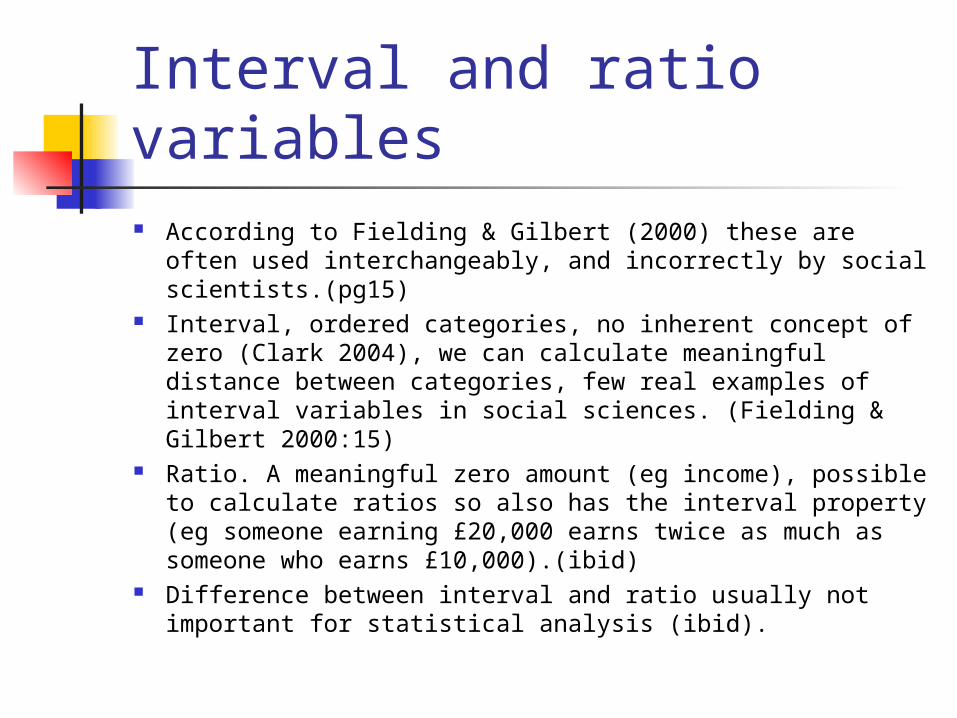
Interval and ratio variables According to Fielding & Gilbert (2000) these are often
used interchangeably, and incorrectly by social scientists.(pg15)
Interval, ordered categories, no inherent concept of zero (Clark 2004), we can calculate meaningful distance between categories, few real examples of interval variables in social sciences. (Fielding & Gilbert 2000:15)
Ratio. A meaningful zero amount (eg income), possible to calculate ratios so also has the interval property (eg someone earning £20,000 earns twice as much as someone who earns £10,000).(ibid)
Difference between interval and ratio usually not important for statistical analysis (ibid).
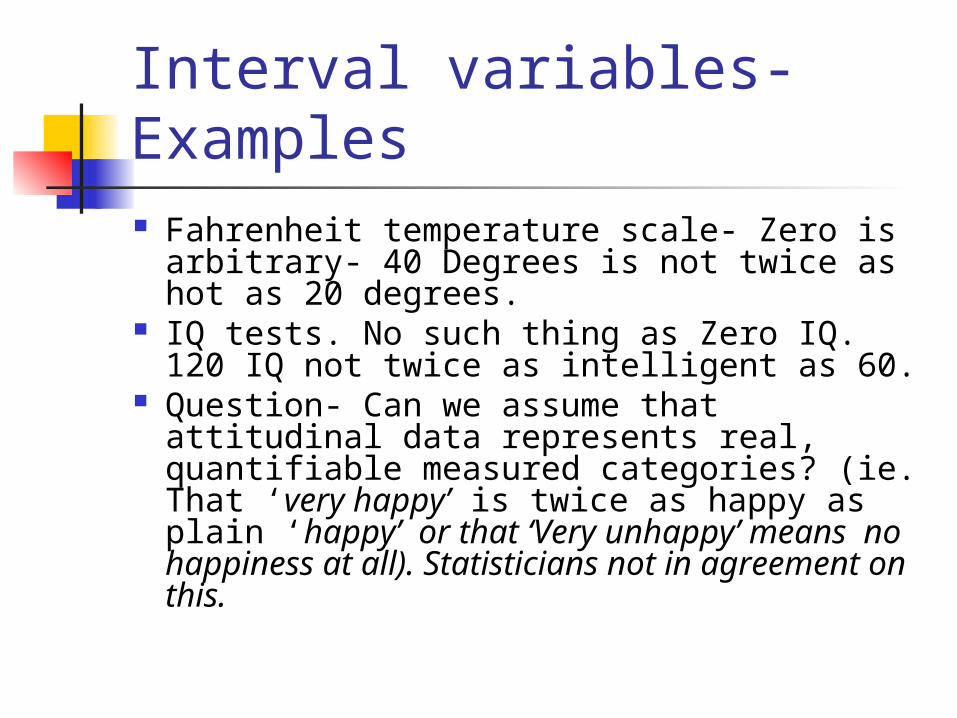
Interval variables- Examples Fahrenheit temperature scale- Zero is
arbitrary- 40 Degrees is not twice as hot as 20 degrees.
IQ tests. No such thing as Zero IQ. 120 IQ not twice as intelligent as 60.
Question- Can we assume that attitudinal data represents real, quantifiable measured categories? (ie. That ‘very happy’ is twice as happy as plain ‘happy’ or that ‘Very unhappy’ means no happiness at all). Statisticians not in agreement on this.
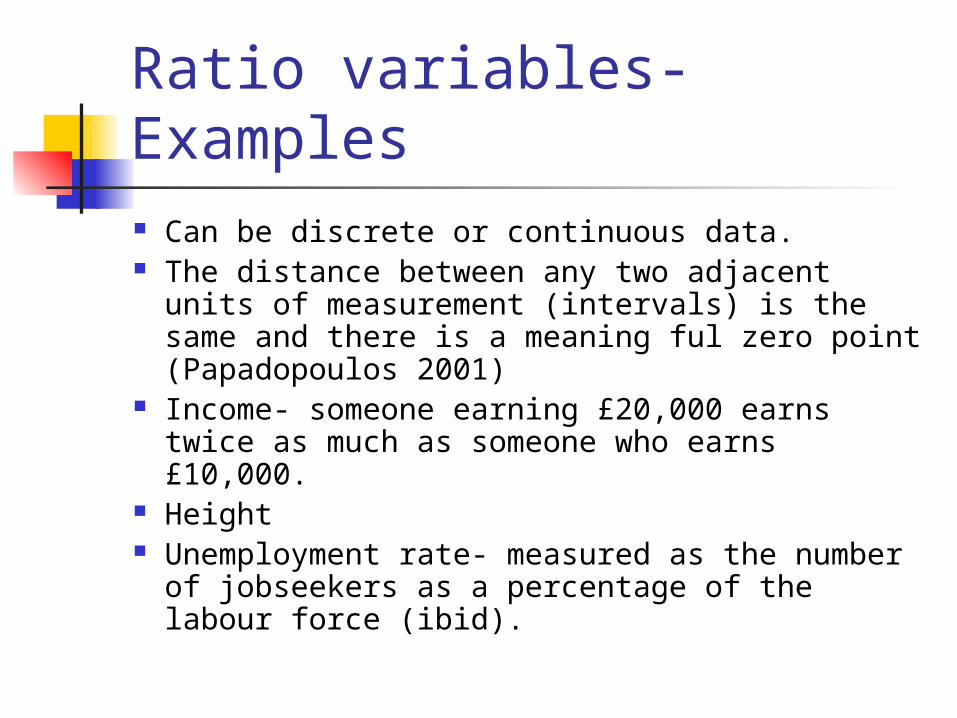
Ratio variables-Examples Can be discrete or continuous data. The distance between any two adjacent units
of measurement (intervals) is the same and there is a meaning ful zero point (Papadopoulos 2001)
Income- someone earning £20,000 earns twice as much as someone who earns £10,000.
Height Unemployment rate- measured as the number
of jobseekers as a percentage of the labour force (ibid).
Why is this Important?
The type of data collected in a study
determine the type of statistical analysis
used. See lecture 7.