revisiting and updating the effect of phosphate...
TRANSCRIPT

1
Revisiting and updating the effect of
phosphate fertilizers to cadmium
accumulation in European agricultural soils
2013
Erik Smolders & Laetitia Six
KU Leuven,
Division Soil and Water Management
Kasteelpark Arenberg 20
3001 Heverlee
Belgium

Revisiting and updating the effect of P fertilizers Fertilizers Europe
2
Executive summary
Cadmium (Cd) occurs naturally as an impurity in rock phosphate at concentrations 1-200 mg Cd (kg
P2O5)-1 and is present in the commercial phosphate (P) fertilizers. The application of P fertilizers is the
main source of annual addition of Cd in the agricultural soils of Europe. In 2002, a proposal was made to
limit Cd concentrations in EU fertilizers based on a mass balance approach. A Cd concentration in
fertilizers was calculated that would not lead to net accumulation in soils of EU-15, on average, on the
long-term provided constant mass balance parameters. The objectives of current study were to update
that mass balance with actual parameters and with data that are applicable to EU-27+Norway and to
calculate scenarios of long-term change in soil Cd depending on the Cd concentration in the P fertilizers.
The update is warranted because emissions of Cd have decreased since the assessment of 2002, because
the use of P-fertilizers has decreased and because now better tools exist to estimate Cd leaching from
soil.
The atmospheric deposition of Cd to soils of EU-27+1 was updated with recent data of 20 countries
(2009-2011). The average and worst case values (0.35-0.7 g Cd ha-1 y-1) are strikingly smaller than the
worst case value used in 2002 (3 g Cd ha-1 y-1) and are now below EU-27+1 estimated average input
values through P fertiliser use ( ∼0.8 g Cd ha-1 y-1). The decrease in atmospheric deposition between the
assessment of 2002 (with data 1990-2002) is partly related to reduced point or fugitive atmospheric
emissions of Cd and partly to better and EMEP approved sampling and detection methods. The use of
fertiliser in 2012 in EU-27+1 has decreased by 40 % since about 15 years ago. The estimation of leaching
has now been improved by using recent compilations of soil solution Cd concentrations in 151 soils that
cover the range of concentrations in EU27+1 soils. The net application of Cd via manure, compost, sludge
and lime were updated but no significant time trends in these small sources of Cd were observed.
Future long-term changes (100 years) in soil Cd concentrations were calculated for four fertiliser Cd
concentrations (20, 40, 60 and 80 mg Cd (kg P2O5)-1) and for 2160 different scenarios covering the range
of conditions encountered in EU, i.e. P fertilizer use, soil properties (pH, organic carbon content), climatic
conditions affecting leaching, type of crop and atmospheric deposition (zero to worst case) (See right-
hand graph below for summary). At the highest Cd concentration, 80 mg Cd (kg P2O5)-1, soil Cd is
predicted to remain rather constant with an estimated decrease of only 1 % for the European average
(ranging between -53 and 31 %). At 60 mg Cd (kg P2O5)-1, soil Cd is predicted to change by -7 % in 100
years, i.e. a net decrease (-57 to +22 % for the 10-90th percentiles of these scenarios). At 40 mg Cd (kg
P2O5)-1, these values are -14 % (-62 to +14 %) and at 20 mg Cd (kg P2O5)
-1 they are -20 % (-66 to -12 %). In
other words, for low to medium fertilizer Cd (0 to 40 mg Cd (kg P2O5)-1) concentrations, soil Cd tends to
accumulate relatively slowly in scenarios with limited leaching and high soil pH, but decreases in the
majority of the scenarios after 100 years of P fertilizer application. For fertilizers with Cd concentrations
of 60 to 80 mg Cd (kg P2O5)-1, a slight decrease is expected in Europe for the average scenario and
accumulation is expected to be maximally 45 % (drainage of 0.1 m yr-1, pH 7.5 and 4 % OC).
For comparison, the prediction used for the 2002 Fertiliser Cd limit proposal (CSTEE) at 60 mg Cd (kg
P2O5)-1 was an increase ranging between +40 and +125 % in 100 years (see left-hand graph below). The
decreasing trend in atmospheric deposition largely explains the difference between this and the previous

Revisiting and updating the effect of P fertilizers Fertilizers Europe
3
assessment. The most recent trend of crop Cd concentration (1970-2002; Sweden) confirms a significant
decreasing trend that contrasts the historic one in the same region (1918-1980; Sweden) (Kirchmann et
al. 2009).
Figure 0 Predicted change in soil Cd in European agricultural soil after 100 years application of inorganic P fertilizers
with Cd concentrations of 20-60 mg Cd (kg P2O5)-1
and in our update mass balance, also 80 mg Cd (kg P2O5)-1
. Means
of the different simulations are indicated with a filled marker (●), the expected European means (with pH 5.8, 2.5 %
OC, 0.35 g Cd ha-1
yr-1
through atmospheric deposition and P fertilizer application of 22 kg P2O5 ha-1
yr-1
, cfr. cereal
system) are indicated with an empty marker (○) and the error bars represent the 10th
and 90th
percentile of the 2160
scenarios. On the left side, mass balance calculations were done according to the CSTEE report (2002), while on the
right side, updated parameters were used. Negative values denote reductions of soil Cd.
Sensitivity analysis shows that soil pH is the factor affecting the net balance most sensitively.
Leaching is the main net output of Cd and is likely to exceed the net input of Cd in EU soils at the current
average fertilizer Cd concentration of 36 mg Cd (kg P2O5)-1 in agricultural soils that have, on average, a
soil pH of 5.8.
Cd content of P fertilizer (mg Cd (kg P2O5)-1)
20 40 60
% C
han
ge in
so
il C
d
-60
-40
-20
0
20
40
60
a) CSTEE parameters
Cd content of P fertilizer (mg Cd (kg P2O5)
-1)
20 40 60 80%
Ch
ange
in s
oil
Cd
-60
-40
-20
0
20
40
60
b) Updated parameters

Revisiting and updating the effect of P fertilizers Fertilizers Europe
4
Table of contents
Executive summary ............................................................................................................................ 2
Table of contents ............................................................................................................................... 4
Introduction: The environmental significance of cadmium in soil ......................................................... 6
Objective of this study .......................................................................................................................... 6
Mass balance: model description ........................................................................................................ 9
Estimation of parameters for mass balance ....................................................................................... 10
Soil Cd concentrations ........................................................................................................................ 11
Geochemical occurrence of cadmium in soils ................................................................................. 11
Conclusion ..................................................................................................................................... 11
INPUT: Atmospheric emission and deposition of Cd ............................................................................ 14
Emission of Cd ................................................................................................................................ 14
Deposition ..................................................................................................................................... 16
Cadmium concentration in mosses: a link with atmospheric deposition ......................................... 19
Conclusion ..................................................................................................................................... 19
INPUT: Phosphate fertilizers ............................................................................................................... 20
Cd content of fertilizers .................................................................................................................. 20
Application rates ............................................................................................................................ 21
Case study: Sweden ....................................................................................................................... 24
Conclusions .................................................................................................................................... 25
INPUT: manure, sludge and lime ........................................................................................................ 26
Manure and compost ..................................................................................................................... 26
Lime ............................................................................................................................................... 27
Sludge ............................................................................................................................................ 28
Conclusion ..................................................................................................................................... 31
OUTPUT: Crop offtake ........................................................................................................................ 31
Transfer function TF ....................................................................................................................... 31
Foliar uptake of Cd ......................................................................................................................... 34
Conclusion ..................................................................................................................................... 34
OUTPUT: Leaching ............................................................................................................................. 35

Revisiting and updating the effect of P fertilizers Fertilizers Europe
5
KD models ....................................................................................................................................... 36
Conclusions .................................................................................................................................... 39
Mass balance computations ............................................................................................................. 40
Future trends ..................................................................................................................................... 40
1. Full factorial analysis .............................................................................................................. 40
2. Analysis based on 14 typical EU scenarios ............................................................................... 46
3. Sensitivity analysis .................................................................................................................. 48
Observed and predicted trends ........................................................................................................... 50
References ....................................................................................................................................... 52
Appendix ......................................................................................................................................... 56

Revisiting and updating the effect of P fertilizers Fertilizers Europe
6
Introduction: The environmental significance of cadmium in soil
Cadmium (Cd) is a trace metal that naturally occurs in soils, but without any known functions for the
plant. Due to its resemblance with Zn2+, Cd is readily absorbed by plant roots and translocated to above-
ground parts. The consumption of vegetables by humans may be an important exposure pathway.
Cadmium occurs in soils as a divalent cation, Cd2+, at concentrations typically ranging between 0.1 and
1.0 mg Cd kg-1. Although the Cd concentration in soils represents only a small fraction of the total soil
exchangeable cations (10-4‒10-6), Cd can affect the ecosystem due to its pronounced toxicity even at
trace levels. Interest in Cd in soils and plants was stimulated when industrial pollution of agricultural
lands in Japan with Cd-rich waste waters led to health problems, known as the ‘itai-itai’ disease. Human
risks occur at soil Cd concentrations well below those required to cause visual effects on plants or soil
biota (Smolders and Mertens 2013). The primary route for Cd exposure to humans is through ingestion
of Cd contaminated crops. Additionally, the risk of Cd in soil is persistent because (i) its residence time
exceeds decades and (ii) its bioavailability does not decrease in the long-term. The biological half-life of
Cd in humans is 10‒20 years. This means that a rare consumption of a high Cd containing food item has
less effect than the lifetime exposure of moderately contaminated food. Poisoning is estimated at a daily
dietary Cd intake of 300 µg day-1. This occurs at a dietary exposure that is only 10-20 fold higher than the
background concentration. Moderate impacts at population level are obviously found at lower soil Cd
concentrations. The World Health Organisation has defined the tolerable daily dietary intake is 58 µg Cd
day-1 for an adult of 70 kg bodyweight (WHO, 2010). This is only about 7 to 3 times higher than the
average daily intake when food is grown in uncontaminated soils. In Europe the tolerable weekly Cd
intake is 2.5 µg Cd (kg bodyweight)-1 (EFSA, 2011). This equals to a daily dietary intake of 25 µg Cd day-1
for an adult of 70 kg bodyweight, which is close to the upper level of Cd found in soils (Table 1). This
underlines the importance to avoid excessive accumulation of Cd in soils through additional inputs.
Table 1 The human exposure to soil Cd in non-contaminated and contaminated soils.
Soil Cd Grain Cd Dietary intake for adult Cumulative lifetime intake
(mg Cd kg-1) mg (kg DW)-1 (µg Cd day-1) (g Cd)
Background 0.1-1 0.01-0.2 8-20 0.1-0.4
Contaminated 1-10 0.2-2.0 160-600 2-10
Cadmium occurs naturally as an impurity in rock phosphate at concentrations 1-200 mg Cd (kg
P2O5)-1 and is present in the commercial phosphate (P) fertilizers. The application of P fertilizers is the
main source of annual addition of Cd in the agricultural soils of Europe.
Objective of this study
Several actions have been taken worldwide to reduce emissions of Cd to soils. Enforcement of
emission controls (by effective technologies and waste treatment processes) on industries emitting Cd
has resulted in a decrease in atmospheric deposition. The diffuse addition of Cd by fertilizers and sewage

Revisiting and updating the effect of P fertilizers Fertilizers Europe
7
sludge has also been tackled. In Europe a draft proposal has been made to set limits of Cd in phosphate
fertilizers. The draft proposal was based on a risk assessment by the CSTEE (2002). Herein a mass balance
approach (explained in detail below) was used. The goal was to set limits on Cd in fertilizers as such that
annual application would not lead to long-term (projection of 100 years) accumulation of Cd in European
agricultural soils. In other words, values are calculated for which net annual input of Cd in soils equals
the net output of Cd through leaching and/or removal by crop. The outcome of this mass balance
approach is shown in Figure 1. It is demonstrated that when P fertilizers containing maximally 20 mg Cd
(kg P2O5)-1 are applied to the fields no net increase in soil Cd is expected in the majority of the scenarios.
Figure 1 Predicted change (%) in soil Cd in European agricultural soil after 100 years at three concentrations of
Cd in P fertilizers. Means and 10th
and 90th
percentile of the different scenarios that assume various
values of fertilizer application rates, soil properties (pH and organic carbon), climatic conditions, and
other diffuse Cd sources (atmospheric deposition, sludge). Based on analysis of CSTEE (2002)
The data used for this CSTEE report are at least 10 to sometimes 20 years old. Data (see details
below) show that, at that time, (i) the input via P fertilizers was roughly two third higher and (ii) the
atmospheric deposition of Cd was higher. Moreover, the models used to calculate leaching need
revision, since more data and calibrated models have become available since. Taken together, an update
of this mass balance approach is necessary. The objective of this study is to review and update all input
and output parameters needed for a mass balance approach (Figure 3). Similar to the CSTEE opinion of
2002, the long-term change in soil Cd is calculated for different scenarios that represent contrasting
agricultural systems in the European Union plus Norway (EU27+1). These calculations were performed
for four Cd levels in P fertilizers: 20, 40 and 60 mg Cd (kg P2O5)-1, i.e. the proposed limits for Cd levels in P
fertilizers, and 80 mg Cd (kg P2O5)-1. The % of change in soil Cd will be estimated over 100 years.
Slow increases in soil Cd concentrations in time (from 1840 to 1980) are clearly evident from
archived soil samples. Figure 2 shows historical trends in soil Cd concentrations as measured in the
Rothamsted (UK) experiments, while the bottom graph shows that current and future trends still need to
be investigated closely with the reduced current fertilizer consumption and atmospheric deposition.

Revisiting and updating the effect of P fertilizers Fertilizers Europe
8
Figure 2 Historic and current trends in soil Cd levels (mg Cd kg
-1):
Up: Untreated Broadbalk plot from 1846 to 1980. The open circles represent measured Cd
concentrations and the full circles are estimated soil Cd concentrations (Jones et al. 1987). This
corresponds to an annual increase of 5.4 g Cd ha-1
yr-1
between 1846 and 1980. However, for this same
plot, Rothbaum et al. (1986) reported an annual increase of 2.9 g Cd ha-1
between 1881 and 1983.
Bottom: Current trends in soil Cd are still under investigation. It is however known that the atmospheric
deposition and P fertilizer application rates decreased in the past decennia.
time (years)
2020 2040 2060 2080 2100 2120 2140
Soil
Cd
(m
g C
d k
g-1)
0.18
0.20
0.22
0.24
0.26
0.28
0.30
0.32
0.34
?
?
?

Revisiting and updating the effect of P fertilizers Fertilizers Europe
9
Mass balance: model description
The mass balance model calculates trends in soil Cd concentrations from the annual input-output
and the existing Cd concentration in soil. This mass balance is made for the entire of EU-27+1 and also
for some important production regions, but not for each field or parcel. This was done because the
average situation, rather than the site specific situation, controls risk. The food products consumed by
the European population rarely come from one location. This in combination with the fact that chronic
(lifetime) exposure matters far more than single high intake events, justifies the generic mass balance
approach, instead of site specific approach, for setting limits on Cd. Cadmium has a long biological half-
life (15 to 20 years) and toxic effects manifest themselves mainly in older people (> 50 years) (Smolders
and Mertens 2013). As such, the effect of a lifetime consumption of moderately contaminated food is
thus larger than the rare consumption of food containing large concentrations of Cd. This justifies the
use of the mean or regional assessment of the mass balance of Cd for risk assessment rather than the
exceptional, site specific conditions.
Cadmium mass balances in agricultural soils have been described before (Jensen and Bro-
Rasmussen 1992; Moolenaar and Lexmond 1998; Tjell and Christensen 1992). In 2002, a mass balance
was presented to the European Commission in a CSTEE report (2002), which was based on technical
documents submitted by the different member states. The basis of calculation was the stand-still
principle, i.e. setting a limit on Cd in fertilizer that would not lead to long-term accumulation of Cd in
European agricultural soils. In other words, net annul input of Cd to soil should not exceed the net
annual output via leaching or removal by crops. In such a mass balance all source of Cd, i.e. not only
fertilizer Cd but also Cd input through atmospheric deposition and sludge application are included in the
analysis. Projections were made over the next 100 years (2000‒2100), assuming constant input and
output rate over time.
A balance equation for the plough layer reads:
Δ Cdsoil = INPUT – OUTPUT (1)
with Δ CdSoil, the change in Cd content in the plough layer (g Cd ha-1 yr-1). This Cd balance is presented
graphically in Figure 3.
The Cd input in the agricultural soil mainly originates from atmospheric deposition, from fertilization
with phosphate fertilizers and from application of manure, sludge and lime. However, the input of Cd
through manure recycles some of the previously removed Cd by crop offtake. The main Cd output fluxes
are leaching losses and removal of Cd with the harvested crop. No data is available on losses of Cd
through erosion and it is furthermore assumed that these losses are marginal.
The Cd concentration of the topsoil at year i (Cdsoil, i, mg Cd kg-1) is calculated from the net Cd
balance (i.e. input – output, g Cd ha-1 year-1) in year (i-1) and the soil Cd concentration in year i-1 as:
������,� =������,�� + ���� − ������
����� (2)
with Wsoil the soil weight in the plough layer (tonnes ha-1). In all calculations a bulk density of 1200 kg m-³
is assumed and a soil depth of 0.25 m. This corresponds to 3000 tonnes of soil per hectare.

Revisiting and updating the effect of P fertilizers Fertilizers Europe
10
Figure 3 The Cd input-output balance in agricultural soils and risk for contamination through the food chain.
As explained before, the model constructed in 2002 needs revisiting. How the parameters are
updated and revisited for this project is described in detail in the following sections.

Revisiting and updating the effect of P fertilizers Fertilizers Europe
11
Estimation of parameters for mass balance
Soil Cd concentrations
Geochemical occurrence of cadmium in soils
The soil Cd concentration at time t=0 in the mass balance has a major impact on the predicted
future Cd concentrations. As such, the correct estimation of the background concentration is essential.
Data of soil Cd performed 20 years ago are still valid since the expected change in 20 years will not be
more than 10 % (e.g. from 0.3 to 0.33 mg Cd kg-1).
There are only a few specific Cd minerals (e.g. greenockite (CdS) and otavite (CdCO3)) in the
environment. Cadmium occurs more in zinc (Zn) minerals at typical 1:200 weight ratios. Cadmium
concentrations are generally higher in sedimentary rocks (0.01‒2.6 mg Cd (kg rock)-1) than in igneous
rocks (0.07-0.25 mg Cd (kg rock)-1).
Table 2 Typical concentrations of Cd in rocks (Traina 1999).
Rock type Cd concentration (mg Cd (kg rock)-1
Igneous 0.07‒0.25
Metamorphic 0.11‒1.00
Sedimentary 0.01‒2.60
Soil Cd concentrations typically range between 0.1 and 1 mg Cd kg-1 (Table 3). A large scale sampling
program by FOREGS in 2006 showed that 90 % of the sampling points (total of 840) are below 0.48 mg
Cd kg-1. The soil Cd content was on average 0.284 mg Cd kg-1. Data obtained across Europe through
numerous studies (Table 3) confirm that a background concentration of 0.3 mg Cd kg-1
is realistic. In
general, lower concentrations are found in the Scandinavian countries, while higher concentrations are
found in the United Kingdom, Ireland, Central Europe (Belgium, France, Germany) and some parts of
Slovakia and Poland (Table 3 and Figure 4).
Conclusion
A background soil Cd concentration of 0.28 mg Cd kg-1, i.e. the average for the European Member
states according to the FOREGS study can be used as an EU average value.

Revisiting and updating the effect of P fertilizers Fertilizers Europe
12
Table 3 Measured total Cd concentrations in agricultural soils as reported in the EU risk assessment report in
2007 and updated values. Data are means with median values between brackets or the range between
minimum‒maximum soil Cd concentrations. Letters indicate the references used and are listed below the
table.
Country EU (2007)‡ others Country EU (2007)‡ others
Austria 0.24 a Malta
Belgium 0.25 0.33 a Netherlands <0.1‒1.6
0.3 0.3‒0.87
0.32 0.5 (0.4)
0.27 Poland 0.41 b
Bulgaria 0.4 c Portugal
Cyprus
0.34 e Romania
Czech Republic 0.27 a Slovakia 0.15‒1.01
Denmark 0.25 (0.22) 0.22 Slovenia
Estonia 0.5 d Spain 0.37‒0.51 (Catalonia) g
Finland 0.2 0.21 a 0.26 (Salamanca) h
France 0.39 (0.30) 0.41 (0.25) a Sweden 0.26 (0.22) 0.23 a
0.41 (0.25) 0.21‒0.29 b
Germany
0.31 0.4 (sand) UK 0.33‒0.43 0.23 a
1.0 (loam) 0.27‒0.42
1.5 (clay) 0.34‒0.47
Greece 0.34‒0.42 (North) a Norway 0.11 j
0.4 (Central) EU-27+1 0.3
0.38‒0.46 (South) FOREGS 0.28
Hungary This study 0.28
Ireland 0.54 (South-East) a
‡ References cited in the CSTEE report (2002)
a Risk assessment reports from Member states
performed in 2000 for the European Commission.
b Kabata-Pendias and Dudka (1991)
c Atanassov et al. (2008)
d Alumaa et al. (2001)
e Akun et al. (2011)
f Abollino et al. (2002)
g Schuhmacher (1994)
h Crisanto Herrero and Lorenzo Martin (1993)
i Ursinyova et al. (1997)
j Esser (1996)

Revisiting and updating the effect of P fertilizers Fertilizers Europe
13
Figure 4 Measured Cd concentrations across Europe (FOREGS 2006).

Revisiting and updating the effect of P fertilizers Fertilizers Europe
14
INPUT: Atmospheric emission and deposition of Cd
Emission of Cd
Cadmium is emitted to the atmosphere from anthropogenic and natural sources. The most
important anthropogenic sources are oil and coal combustion, incineration of municipal waste, traffic
and non-ferrous metal production (e.g. Cd/CdO producers, Zn smelters) (Table 4).
Table 4 Emission inventory for 2010 (EMEP/CEIP 2012a). The most important anthropogenic source of Cd is the
oil and coal combustion.
Sector Emission (tonnes year-1
)
Industrial combustion 29
Small combustion 39
Industrial processes 14
Waste incineration 1.1
Others (traffic, waste water) 3.7
Total 87
A trend analysis shows that the highest Cd emissions occurred from 1950s until mid-1960s, this is
the time that the production of non-ferrous metals (particular copper and zinc) in various smelters was
growing rapidly. Between 1955 and 2005, emissions decreased about 5 times due to the more efficient
flue gas desulfurization in smelters and power plants (Pacyna et al. 2009). The evolution of atmospheric
emission of Cd in Europe from 1955 to 2005 is shown in Figure 5.
Figure 5 Change in atmospheric emissions of Cd (tonnes year-1
) in Europe in the period from 1980 till 2005
(Pacyna et al. 2007).
Similarly, trend reports on Cd emission can be found for each member state separately or for the
European Union in the EMEP/CEIP public database WebDab (http://webdab1.umweltbundesamt.at).

Revisiting and updating the effect of P fertilizers Fertilizers Europe
15
Cadmium emissions in the European Union reduced 2.5 times from 1990 to 2010 and 1.5 times from
2000 to 2010 (Figure 6).
Figure 6 Evolution in Cd emissions (tonnes year-1
) from 1990 to 2010 for the European Union (EMEP/CEIP
2012a).
It remains a challenge to quantify the uncertainty of the reported emissions, since countries often
do not provide information on the uncertainties of the estimates, or, the data set reported by national
emission experts to EMEP is often incomplete and inaccurate (EMEP/CEIP 2012b).
Cadmium emission is estimated by models based on emission factors of the main emission sources
(combustion of coal/oil, iron and steel production, non-ferrous metal manufacturing, etc.) provided by
EMEP/EEA in the Air pollutant emission inventory guidebook 2009. Pacyna et al. (2007) states that the
“official” emission data reported by national emission experts (i.e. EMEP emission data) is an
underestimate by factor 3‒4 compared to their data, obtained from the ESPREME project site
(http://espreme.ier.uni-stuttgart.de) (Figure 7 and Table 5). However, both studies argue that emission
of Cd has strongly reduced. The inconsistency in Cd emission estimates underlines the importance of
atmospheric deposition measurements.
Table 5 Atmospheric emissions of Cd (tonnes) obtained from EMEP and from the ESPREME project website for the
EU-27 member + Norway. Atmospheric deposition estimates (g Cd ha-1
) were calculated from emission
estimates.
ESPREME project
Reference year EMEP Basecase BAU†
MFTR†
2000 Emission (tonnes Cd yr-1
) 143 402
Predicted deposition (g Cd ha-1
yr-1
)* 0.3 0.9
2010 Emission (tonnes Cd yr-1
) 101 290 218
Predicted deposition (g Cd ha-1
yr-1
)* 0.2 0.6 0.5 † model assumptions for BAU and MFTR are described in detail on the ESPREME project website.
* assuming all emitted Cd is deposited evenly on European surface (EU-27+1 is 4.54 106 km²)
Year
1990 1992 1994 1996 1998 2000 2002 2004 2006 2008 2010
Cd
em
issi
on
(to
nn
es
year
-1)
0
50
100
150
200
250
300

Revisiting and updating the effect of P fertilizers Fertilizers Europe
16
Figure 7 Comparison of emission estimates obtained from EMEP and from Pacyna et al. (2007), referred to as
‘This work’ in the graph, in 2005.
Deposition
Atmospheric deposition is an important source of Cd in European agricultural soils. As a result of
reduced emissions, measured atmospheric Cd deposition decreased significantly over the last decades
(Figure 8). For example, the Cd concentration in precipitation reduced with a factor 5 from 1980 to 2005
for a sampling station in Norway (NO 0001R) and approximately a factor 2 in Germany (DE 0001R) and
the Netherlands (NL 0009R) from 1995 to 2005.
Figure 8 Change of Cd concentration in precipitation from 1979 to 2004 at selected monitoring stations in
Europe (Pacyna et al. 2009).
Total atmospheric depositions include wet and dry depositions. It can be argued that dry deposition
is not a net input since it contains mainly resuspended Cd, i.e. Cd that was previously removed from

Revisiting and updating the effect of P fertilizers Fertilizers Europe
17
other locations. Including this resuspended Cd might lead to an overestimation of atmospheric
deposition.
Since 1999, monitoring of air concentrations and atmospheric deposition of heavy metals is
included in the EMEP monitoring program. Major improvements in the data quality, the development
and application of analytical methods to measure the heavy metal concentrations and improvement of
the sampling protocol at many stations, have resulted in more accurate deposition data. In the first years
of monitoring, Cd was measured using Graphite Furnace Atomic Absorption Spectrometry (GF-AAS). The
detection limit for GF-AAS ranges between 0.5 and 0.1 µg Cd L-1. This detection limit is larger than Cd in
the wet deposition samples as estimated from emission data (Table 5). For example, the predicted EU
deposition rate is about 0.2 g ha-1 yr-1 according to EMEP emission data (Table 5). Assuming 700 mm yr-1
rainfall, this results in approximately 0.03 µg L-1 (see also Figure 8). At present, the majority of the
laboratories are using the more sensitive method: Induced Coupled Plasma Mass Spectrometry (ICP-MS)
with a detection limit ranging between 0.05 and 0.01 µg Cd L-1, which enables to measure atmospheric
deposition accurately. Many stations are now using wet only collectors, which are open only during
precipitation events, instead of the bulk collector, which are open at all times. Bulk collectors tend to
give too high metal concentrations due to dry deposition of resuspended Cd from the soil. However, in
some areas (e.g. Nordic countries with a lot of snow), the difference between wet only and bulk
collectors is negligible.
Table 6 shows the measured atmospheric Cd deposition in the EU-27 countries in 2010. For
comparison previously reported Cd deposition data are presented. These were collected for reference
year 2002 and all EU-16 countries for the EU risk assessment report (2007). The deposition values in
2002 range between 0.15 and 4 g ha-1 year-1, depending on country and sampling method. In 2010,
measured depositions range between 0.1 and 0.6 g Cd ha-1 year-1. We noticed that when lower Cd
concentration can be measured, the deposition values are also lower (e.g. United Kingdom). When the
detection limit of Cd was high, larger deposition values are found (e.g. Ireland). The deposition values
generally decrease from North to South Europe. The EU-27 average is either calculated based on total
atmospheric emission data in Table 5, or based on measured atmospheric deposition data values. The
atmospheric deposition value range between 0.1 and 0.8 and in exceptional cases go up to 1 or 1.3
(Slovakia and Ireland, respectively).

Revisiting and updating the effect of P fertilizers Fertilizers Europe
18
Table 6 Measured atmospheric Cd deposition in European countries (g Cd ha-1
year-1
). Data of 2002 (EU-
15+1) were copied from EU risk assessment report (EU 2007) and data for 2010 were based on Cd
measurements of the EMEP monitoring sites during 2010.
Country 1990-2000 2010 Comments
Bulk Wet only
Austria 2.1 (0.4‒2.6) Only Cd air concentrations available
Belgium 1.1‒3.6 0.2 1 monitoring site at Belgian coast
Bulgaria
No deposition data available
Cyprus Only air concentrations available
Czech Republic 0.4 0.4 Wet only: a lot of missing values (< DL)
Denmark 0.4‒1.5 0.2‒0.8 Average of 3 stations
Estonia 0.5‒1.2 Highest measurement probably biased by one
suspicious measurement.
Finland 0.1‒0.4 0.2‒0.5 Measurements below detection limit were set at
0.005 µg Cd L-1
France 2.0 0.3 0.1‒0.2 Majority of wet only samples below detection limit
Germany 1.4‒4 0.2‒0.3
Greece No monitoring of heavy metals
Hungary 0.4 Only 1 monitoring station
Ireland 1.3 Only 1 monitoring station; detection limit is high
(0.05‒0.1 µg Cd L-1
)
Italy 18 Unrealistically high Cd concentrations in
precipitation
Latvia 0.4‒0.6 Measurements below detection limit were set at
0.01 µg Cd L-1
Lithuania 0.4 Only 1 monitoring station
Luxembourg No deposition data available
Malta No deposition data available
Netherlands 0.9‒1.2 0.1‒0.2 Measurements below detection limit were set at
0.017 µg Cd L-1
Poland 0.3‒0.4
Portugal Unreliable Cd measurements
Romania Only air concentrations available
Slovakia 0.5‒1
Slovenia 0.3 Only 1 monitoring station
Spain 0.3 Only 1 monitoring station
Sweden 0.2‒1.5 0.1‒0.6
United Kingdom 1.8‒2.0 0.1 Low Cd concentrations measured
Norway 0.2‒1.2 0.2‒0.7
EU-27+1 0.35 (0.21) Average and standard deviation (n= 44 ) over wet
and bulk samplers
0.2‒0.6 Deposition estimated from emissions (Table 5)
EU-15+1 0.4 Deposition estimated from emissions (EU 2007)
0.4 or 3 Range used in Cd risk assessment (EU 2007)
0 or 3 3 is worst case scenario (CSTEE 2002),

Revisiting and updating the effect of P fertilizers Fertilizers Europe
19
Cadmium concentration in mosses: a link with atmospheric deposition
The last two decennia, mosses have been applied successfully as biomonitors of Cd and lead
(Pb) deposition across Europe (Berg et al. 1995; Harmens et al. 2007; Zechmeister et al. 2003). As
such, the Cd concentration in mosses can provide a complementary (rather than an alternative)
measure of the spatial patterns and temporal trends in atmospheric deposition (Aboal et al. 2010).
Often linear regression between Cd concentration in mosses and measured Cd deposition, is used to
transform moss data to absolute deposition rates. However, many findings show that in general the
concentration of a heavy metal in moss cannot be closely related to atmospheric deposition, which
impedes its use to estimate bulk deposition (Aboal et al. 2010; Gombert et al. 2004). Harmens et al.
(2012) showed that for some European countries the correlation between Cd concentrations in the
moss samples and the atmospheric deposition (as modelled from emission data) correlate well
(Spearman rank correlation coefficient up to 0.8), but other countries correlations were found to be
low and even negative (Figure 9). In conclusion, there are multiple reasons why bulk deposition
should not be estimated from concentrations of Cd in moss (Aboal et al. 2010).
Figure 9 Spearman rank correlation coefficient between modelled Cd deposition and concentrations in
mosses for Cd as measured in a survey in 2000 (Harmens et al. 2012)
Conclusion
The most important conclusions that can be drawn from this analysis are:
1. Emission of Cd to the atmosphere in 2010 is 1.5 to 2 times less than in 2000. The
estimated emission from EU-27+1 is 101 tonnes yr-1 according to EMEP and between
218 and 290 according to the ESPREME project. This translates to an atmospheric
deposition that rages between 0.2‒0.6 g Cd ha-1 yr-1, with 0.4 g Cd ha-1 yr-1 on average,
assuming that all emitted Cd falls on European surface.
2. Measured depositions of Cd have also decreasing between 2000 and 2012, this is due to
the reduced emission on the one hand and the improved measurements of deposition
on the other hand. The average EU-27+1 Cd deposition ranges between 0.1 and 0.8 and

Revisiting and updating the effect of P fertilizers Fertilizers Europe
20
is on average 0.35 g Cd ha-1 year-1 (Ireland and Portugal not considered).This value
remarkably agrees with the independent value estimated from emission data.
3. We propose to use 0.35 g Cd ha-1
yr-1
as the best estimate of the mean Cd depositions
and to use a standard deviation of 0.21 (Table 6) and 0.70 g ha-1 yr-1 as a realistic worst
case.
INPUT: Phosphate fertilizers
Cd content of fertilizers
Phosphate fertilizers, among all mineral fertilizers, are generally the major source of trace
metals (McLaughlin et al. 1996). For P-fertilizers, the phosphate rock (PR) is the source of P but also
of the trace metals and only a limited fraction of Cd is lost to the by-products during manufacturing.
As a result, the Cd:P ratio in the rock phosphate determines the fertilizer Cd concentration. The Cd
concentration in rock phosphate varies largely with the origin, i.e. igneous RP contain lower
concentrations of Cd (0.07‒0.25 mg Cd kg-1 rock) compared to sedimentary rocks (0.01‒2.60 mg Cd
kg-1) (Traina 1999). Lowest metal concentrations are generally found in PR from Scandinavian
countries, while largest concentrations are found in PR from Nauru, Togo and Morocco (McLaughlin
and Hamon 2001). In general Cd concentrations vary between 2‒1500 mg Cd (kg P2O5)-1 (McLaughlin
et al. 1996). In 2000, the average Cd:P2O5 ratio in P fertilizers used in 10 EU member states ranged
from 1 to 58 mg Cd (kg P2O5)-1, with an average concentration of 36 mg Cd (kg P2O5)
-1 (ERM 2001). In
another survey, Nziguheba and Smolders (2008) investigated 196 P fertilizer samples used across
Europe (EU-15). Results show that in 2008 the Cd concentration in the P fertilizers used in Europe
ranged between the limit of quantification and 120 mg Cd (kg P2O5)-1, with an average value of 36 mg
Cd (kg P2O5)-1, which corresponds closely to previously reported values (Figure 10).
Figure 10 Frequency distribution of Cd concentrations in European fertilizers expressed per unit P (mg Cd (kg
P)-1
). The Cd standard of 60 mg Cd (kg P2O5)-1
is indicated with arrows.
The contribution of P fertilizers to soil Cd has led to proposals to limit Cd in P fertilizers. The
limits or standards proposed in 2002 by the European Commission, but still not adopted in 2012, are
a stepwise decrease from 60 to 40 and finally to 20 mg Cd (kg P2O5)-1. Figure 10 indicates that for 30
% of the samples the Cd content was larger than 60 mg Cd (kg P2O5)-1.
There are two options to obtain low Cd concentrations in P fertilizers: (i) use of low-Cd PR, or (ii)
decadmiation of PR or phosphoric acid. The use of low-Cd PR is considered to be the low-cost option
Revisiting and updating the effect of P fertilizers Fertilizers Europe
21
and is used by several member states such as Sweden, Finland, Denmark and the Netherlands.
However, in the long-term perspective, the access to these low-Cd PR may become limited.
Application rates
The application rate of mineral fertilizer (kg P2O5 ha-1 yr-2) is a critical parameter in determining
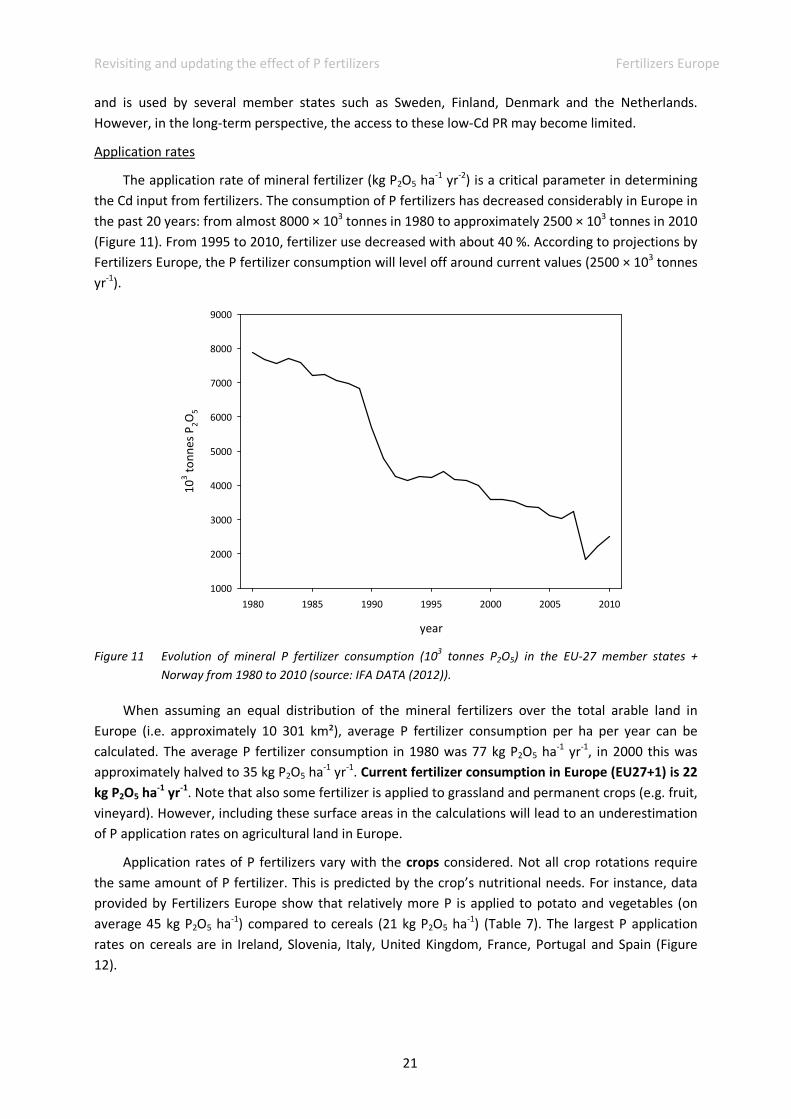
the Cd input from fertilizers. The consumption of P fertilizers has decreased considerably in Europe in
the past 20 years: from almost 8000 × 103 tonnes in 1980 to approximately 2500 × 103 tonnes in 2010
(Figure 11). From 1995 to 2010, fertilizer use decreased with about 40 %. According to projections by
Fertilizers Europe, the P fertilizer consumption will level off around current values (2500 × 103 tonnes
yr-1).
Figure 11 Evolution of mineral P fertilizer consumption (103 tonnes P2O5) in the EU-27 member states +
Norway from 1980 to 2010 (source: IFA DATA (2012)).
When assuming an equal distribution of the mineral fertilizers over the total arable land in
Europe (i.e. approximately 10 301 km²), average P fertilizer consumption per ha per year can be
calculated. The average P fertilizer consumption in 1980 was 77 kg P2O5 ha-1 yr-1, in 2000 this was
approximately halved to 35 kg P2O5 ha-1 yr-1. Current fertilizer consumption in Europe (EU27+1) is 22
kg P2O5 ha-1
yr-1. Note that also some fertilizer is applied to grassland and permanent crops (e.g. fruit,
vineyard). However, including these surface areas in the calculations will lead to an underestimation
of P application rates on agricultural land in Europe.
Application rates of P fertilizers vary with the crops considered. Not all crop rotations require
the same amount of P fertilizer. This is predicted by the crop’s nutritional needs. For instance, data
provided by Fertilizers Europe show that relatively more P is applied to potato and vegetables (on
average 45 kg P2O5 ha-1) compared to cereals (21 kg P2O5 ha-1) (Table 7). The largest P application
rates on cereals are in Ireland, Slovenia, Italy, United Kingdom, France, Portugal and Spain (Figure
12).
year
1980 1985 1990 1995 2000 2005 2010
10
3 t
on
ne
s P
2O
5
1000
2000
3000
4000
5000
6000
7000
8000
9000

Revisiting and updating the effect of P fertilizers Fertilizers Europe
22
Table 7 Annual P fertilizer inputs (kg P2O5 ha-1
) for the EU-27+1 countries for the most important cropping
systems (Fertilizer Europe statistics) in 2010-2011.
total total
Country Cereals Potato Vegetables arable land agricultural land
Austria 14 52 46 16 9
Belgium 20 21 32 21 20
Bulgaria 14 66 30 11 10
Cyprus 20 28 35 16 18
Czech Republic 14 30 20 15 11
Denmark 9 19 36 9 9
Estonia 9 60 50 9 8
Finland 13 82 63 14 15
France 28 55 50 28 18
Germany 19 60 55 22 17
Greece 18 100 80 19 9
Hungary 4 4 7 3 3
Ireland 49 120 85 48 11
Italy 34 50 65 25 17
Latvia 14 33 22 10 6
Lithuania 17 29 14 17 13
Netherlands 5 50 38 21 13
Poland 21 20 37 26 25
Portugal 28 50 45 26 10
Romania 10 20 10 8 6
Slovakia 11 45 14 10 8
Slovenia 41 55 50 41 22
Spain 28 45 75 27 17
Sweden 11 77 36 9 8
United Kingdom 30 130 35 31 12
Norway 25 74 70 22 20
EU 27 +1 average
(standard deviation)
21 (11) 45 (31) 50 22* 14
* P10 = 9 kg P2O5 ha-1
; P90 = 30 kg P2O5 ha-1
, taking into account difference in surface per country

23
Figure 12 Phosphate application rates (kg P2O5 ha-1
) on a) total arable land, b) land for cereal production and c) potato fields, for each EU27+1 member state
(based on Fertilizers Europe data).
P use on total arable land
Country
AT
BE
DE
DK
ES FI
FR
GB
GR IE IT NL
PT
SE
BG
CY
CZ
EE
HU
LT
LV
PL
RO SI
SK
NO
Ph
osp
hat
e a
pp
licat
ion
rat
es
(kg
P2O
5 h
a-1)
0
10
20
30
40
50
60
P use on land used for cereal production
Country
AT
BE
DE
DK
ES FI
FR
GB
GR IE IT NL
PT
SE
BG
CY
CZ
EE
HU
LT
LV
PL
RO SI
SK
NO
Ph
osp
hat
e a
pp
licat
ion
rat
es
(kg
P2O
5 h
a-1)
0
10
20
30
40
50
60
P use on land used for potato production
Country
AT
BE
DE
DK
ES FI
FR
GB
GR IE IT NL
PT
SE
BG
CY
CZ
EE
HU
LT
LV
PL
RO SI
SK
NO
Ph
osp
hat
e a
pp
licat
ion
rat
es
(kg
P2O
5 h
a-1)
0
20
40
60
80
100
120
140

Revisiting and updating the effect of P fertilizers Fertilizers Europe
24
Additionally, the P application rate depends on the soil fertility. Recommended P loads for high-P
soils are relatively low compared to recommendations for low-P soils (example given in Table 8). When
soils contain considerable amounts of P, the P addition rates can be set lower.
Table 8 Fertilizer advice given in Germany according to soil class types (P content measured by the calcium
acetate extraction method) and crop type. (KTBL 2005)
Crop rotation Soil class (mg P2O5 (100 g soil)-1
A (≤ 5) B (6-9) C (10-20) D (21-34) E (≥ 35)
Potato 150-180 110-140 70-100 40-60 0
Maize 160-190 120-150 80-110 50-70 0
Catch crop 50-60 30-40 10-20 0 0
From the average annual P fertilizer application rate in EU-27+1, the expected annual Cd input
through P fertilizers can be calculated for different Cd:P2O5 ratios or fertilizer qualities (Table 9).
Table 9 Total annual Cd input (tonnes Cd yr-1
) into soils of arable land from P fertilisers in EU-27+1, based on the
average amount of P fertilizer applied on arable land (Fertilizer Industry statistics) and the total area of
arable land (1.61 × 10⁸ ha). Calculations are done for the current EU average Cd content, 36 mg Cd (kg
P2O5)-1
(Nziguheba and Smolders 2008).
year Average P fertilizer applied Total annual input into EU-27+1 Annual input
(kg P2O5 ha-1
) (tonnes Cd yr-1
) (g Cd ha-1
yr-1
)
2002 36
210 1.3
2010 22
130 0.8
With current P fertilizer application rates, 70 to 210 tonnes of Cd are applied to European arable
land, depending on the Cd content of the P fertilizer used (20 or 60 mg Cd (kg P2O5)-1). This translates to
an annual input between 0.5 and 1.3 g Cd ha-1, i.e. somewhat larger than current atmospheric
deposition. Measures to decrease Cd inputs through improvements in fertilizer ‘quality’ are therefore
equally important as reduction in Cd emissions.
Case study: Sweden
Since a full and detailed study according to important production areas in Europe was not possible
due to the large amount of missing data, we give a detailed example of a case study performed in
Sweden by Sternbeck et al. (2011) for the European commission. Five important production areas were
identified (Table 10). We discuss below the fertilizer and atmospheric inputs of Cd to agricultural soils.
Table 10 Major production areas used for the Swedish risk assessment report (Sternbeck et al. 2011).
Production area Abbreviation Crop rotation
Götalands södra slättbygder Gss Sugar beet, spring barley, winter rape, winter wheat
Götalands mellanbygder Gmb Sugar beet, spring barley, winter rape, winter wheat
Götalands norra slättbygder Gns Winter rape, winter wheat, oats, winter wheat, spring barley, oats
Svealands slättbygder Ss Spring barley, winter rape, winter wheat, oats
Götalands skogsbygder Gsk Winter wheat, winter rape, spring barley, oats

Revisiting and updating the effect of P fertilizers Fertilizers Europe
25
Input of Cd through P fertilizers
Swedish recommendations for P application are partly based on the principle that losses through
harvest and leaching should be compensated for by fertilization. The load of P fertilizer thus depends on
the P content of the soil on one hand and on the P needs of the crops on the other hand. The P content
is measured by extraction with ammonium lactate, and soils are classified in different P-AL classes. For P-
rich soils the recommended doses are much lower than for the low-P soils. In general, more P is added to
potatoes than to cereals. Based on this, time averaged P application rates were calculated for each
production area, according to the soil fertility classes (P-AL) and crops (Table 11).
Table 11 Calculated average mineral P fertilizer application rates (kg P2O5 ha-1
yr-1
) for crops included in the
general crop rotations and for potato depending on soil fertility classes (P-AL).
Production area Crop rotation Potato
P-AL II P-AL III P-AL IV A P-AL IV B P-AL II P-AL III P-AL IV A P-AL IV B
Götalands södra slättbygder 46 25 9 41 23 9
Götalands mellanbygder 46 25 9 41 23 9
Götalands norra slättbygder 50 39 15 53 41 23
Svealands slättbygder 50 39 16 53 41 23
Götalands skogsbygder 50 41 17 53 41 23
Input of Cd through atmospheric deposition
The atmospheric deposition values in the different production areas were estimated from Cd
concentrations measured in moss samples, but calibrated to data on wet deposition. The annual
atmospheric deposition on agricultural soils ranges between 0.3 to 0.4 g Cd ha-1 yr-1 (Table 12). This is in
correspondence with the EU-27+1 average from Table 6.
Table 12 Atmospheric deposition data used in the Swedish risk assessment report (Sternbeck et al. 2011).
Production area Atmospheric deposition
(g Cd ha-1
yr-1
)
Götalands södra slättbygder 0.39
Götalands mellanbygder 0.31
Götalands norra slättbygder 0.33
Svealands slättbygder 0.34
Götalands skogsbygder 0.36
Conclusions
The most important conclusions that can be drawn from this analysis are:
1. P fertilizer application rates in EU have decreased over the past decennia, i.e. about 40 %
change in the past 15 years. The EU-27+1 average application rates for cereals and potato
are 21 and 45 kg P2O5 ha-1 respectively. Average P fertilizer application on arable land is 22
kg P2O5 ha-1
in the EU-27+1 countries.
2. The current utilized P fertilizers contain on average 36 mg Cd (kg P2O5)-1. This results in an
annual Cd input of 0.8 g Cd ha-1 yr-1 when applied at the average rate of 22 kg P2O5 ha-1.

Revisiting and updating the effect of P fertilizers Fertilizers Europe
26
INPUT: manure, sludge and lime
Manure and compost
The heavy metal content of animal manures (Table 13) is largely a reflection of metal concentrations
in the feeds consumed. The use of manure leads to addition of Cd to the soil. However, with animal
manure, some of the Cd that was previously taken up by crops (see crop offtake) is recycled to the soil.
As such, Cd input from manure is only a net input at a continental scale if there is a net import of animal
feed crops in the continent. However, on local scale with large application rates of manure, the Cd input
can be significant. For countries with relatively large animal husbandry (e.g. The Netherlands and
Denmark), the net Cd input is estimated to be 0.05 g Cd ha-1 yr-1 (Hellstrand and Landner 1998;
Moolenaar and Lexmond 1998). Since the average situation controls risk rather than the site specific
approach (see mass balance section), this mass balance is made for EU27+1 and not at field or parcel
scale.
Table 13 Typical cadmium concentrations in different types of manure produced in European countries.
Country Manure types Minimum Median Maximum
mg Cd (kg dry matter)-1
United Kingdom (Nicholson et al. 1999) Dairy cattle manure < 0.1 0.38 0.53
Dairy cattle slurry < 0.1 0.33 1.74
Beef cattle manure < 0.1 0.13 0.24
Beef cattle slurry 0.11 0.26 0.53
Pig manure 0.19 0.37 0.53
Pig slurry < 0.1 0.30 0.84
Sweden (Eriksson 2001) Pig slurry 0.27 0.28 0.32
Pig manure 0.19 0.25 0.36
Dairy cattle slurry 0.09 0.12 0.18
Austria (Sager 2007) Cattle manure 0.27
Pig manure 0.46
Pig dung 0.33
Poultry dung 0.46
Average (standard deviation) 0.2 (0.1)
We estimated the Cd input in European as follows: in total 30 × 109 kg feeds were imported into
Europe in 2010. Assuming these feeds are mostly cereal-based, with cereals having a concentration of
0.02 ‒ 0.05 mg Cd (kg grain)-1, this results in a Cd input of 1 to 2 tonnes Cd in Europe. When this is evenly
spread on arable land, the net Cd input is 0.006 ‒ 0.014 g Cd ha-1
yr-1. Including Cd export via agricultural
products (meat, milk, etc.) would even further decrease the Cd net input.
Since typical Cd concentrations in manure (Table 13) is at least a tenfold lower than the Cd
concentration in P fertilizers (Table 13) and part of the applied Cd is just recycled Cd, it is unlikely that
manure application is an important net source of Cd in Europe. In further calculations we will assume a
net Cd input of 0.01 g Cd ha-1
yr-1
.

Revisiting and updating the effect of P fertilizers Fertilizers Europe
27
Lime
Lime is added to arable soil to correct the soil pH and compensate for acidifying processes. With
lime applications a soil pH of 6 to 6.5 is targeted to ensure adequate nutrient availability and crop
growth. Like P fertilizers, lime may contain elevated Cd levels. In many risk assessments performed by
the member states in 2000 for the European Commission, the contribution of Cd through lime
application is not even mentioned. To date, there is no regulation on the maximum Cd content of
commercial limes. The EC Regulation (2002/2003) states that: “Heavy metals should not be added
deliberately, and any trace metals which are incidental to the production process should not exceed the
limit fixed by the Committee. The copper content shall not be higher than 10 mg Cu kg-1. No limits are
specified for other heavy metals.”
We estimated the Cd input from liming from a Swedish risk assessment report. Lime application
rates of 100‒150 kg CaO ha-1 yr-1 are common in Scandinavian countries. However, given the average soil
pH (4.5 ‒ 5.0) in Scandinavia, these application rates are rather low. The average Cd content in lime
currently available on Swedish markets is circa 0.4 mg Cd (kg CaO)-1. This results in annual applications of
0.04 ‒0.06 g Cd ha-1 yr-1 (Sternbeck et al. 2011). The same calculations can be done for the UK (Nicholson
et al. 2003): currently, the total quantity of lime applied in the UK is around 2.87 × 10⁹ kg lime, spread
over 6 × 10⁶ ha arable land. This results in an annual application rate of 0.48 tonnes lime ha-1. The
average Cd content of lime suitable for agricultural purposes is 0.3 mg Cd (kg lime)-1 (i.e. similar to
example of Sweden). This results in an annual Cd input of 0.14 g Cd ha-1 yr-1. The larger lime application
rates in England result in higher Cd inputs. In France, on total 2.16 × 10⁹ kg was applied to agricultural
land (18.4 × 10⁶ ha) in 2007 (Société chimique de Société chimique de France 2007). This corresponds to
an annual application of 120 kg CaO ha-1 yr-1. If the Cd content is 0.35 (average of Sweden and UK), this is
an input of 0.04 g Cd ha-1 yr-1.
Lime application rates are dependent on the soil pH. Scandinavian countries, the UK and Ireland,
and most parts of Western Europe have a soil pH ranging from 4.5 to 5.0 according to EUSOILS
measurements (Figure 13). In the Mediterranean countries soil pH is generally higher, 6.5 to 7.5. Note
however, that these measurements also include measurements in non-agricultural soils. When only
agricultural soils are considered the soil pH is on average 5.8 (NGU 2012). The optimal lime application
rate, according to the UK lime calculator (www.aglime.org.uk) would be at least 700 kg lime ha-1.
Obviously this rate will decrease after a while, since the soil pH will improve through this application.
Unfortunately, European averages on Cd concentrations in commercial lime and application rates of lime
are not available. We therefore set the European average to be 250 kg CaO ha-1
yr-1
with lime which
contains 0.35 mg Cd (kg CaO)-1. This results in an annual Cd input of 0.09 g Cd ha
-1 yr
-1.

Revisiting and updating the effect of P fertilizers Fertilizers Europe
28
Figure 13 Soil pH measured in CaCl2 extract in European soils (EUSOILS 2010).
Sludge
The application of sewage sludge to agricultural soils provides a number of agronomic benefits in
terms of recycling nutrients, such as phosphorus and nitrogen, and to increase the organic content of a
soil. The use of sewage sludge as source of P and N is expected to increase in the future. Unfortunately,
the application of sludge is an important source of heavy metals (Table 14) and pathogens. Where sludge

Revisiting and updating the effect of P fertilizers Fertilizers Europe
29
is used in agriculture, it is therefore necessary to monitor and control the concentrations of Cd in the soil
and their rate of application to the soil, to ensure that animal or human health is not put at risk through
the food chain.
Table 14 Sludge application rates in EU-27+1. Total quantity of sludge spread on agricultural land (EUROSTAT
2012) and the sludge application rate. The Cd concentrations measured in the sludge (EC 2010) were
used to estimate the annual Cd application rates (g Cd ha-1
yr-1
) on arable land, assuming sludge is spread
over the entire agricultural land.
Country Total load Sludge application Cd content Cd application
106 kg kg ha
-1 mg Cd kg
-1 g Cd ha
-1 yr
-1
Austria 40 29.2
Belgium 20 22.6 1.0-1.5 0.02‒0.03
Bulgaria 11 3.5 1.6 0.01
Cyprus 6.9
Czech Republic 103 40.9 1.5 0.06
Denmark 43 17.8 1.0 0.02
Estonia 2 3.1 2.8 0.01
Finland 0.6
France 512 27.8 1.3 0.04
Germany 588 49.6 1.0 0.05
Hungary 1.4
Italy 1.3
Latvia 3.6
Lithuania 24 11.3 1.3 0.01
Luxembourg 5 81.9
Netherlands
Poland 112 10.4
Portugal 0.4-4
Slovakia 2.5
Slovenia 0.7
Spain 927 82.1 2.1 0.17
Sweden 56 21.4 0.9 0.02
United Kingdom 1221 203.4 1.3 0.26
Nicholson et al. (2003) 440 73.3 3.4 0.25
Norway 61 73.8 0.4 0.03
EU limit by 2015 according to draft 5
EU-27+1 average (without Spain and UK) 1.8 0.05 (0.03)
The European Union therefore set that the amount of sludge spread is limited by the amount of
nutrients required by the plants and the total amount of dry solids. By 2015, the EU sets the limit of Cd in
sludge applied on agricultural land at 5 mg Cd kg-1. For the majority of the member states this limit is
already respected.

Revisiting and updating the effect of P fertilizers Fertilizers Europe
30
In Table 14 the calculated Cd application rates were estimated based on average Cd contents and
the total load of sludge used for agricultural purposes. For this we assumed that all sludge is spread on
the total agricultural land. Obviously, this results in an underestimation of local application rates, which
can lead to locally high applications of Cd. The sludge application rates in current agricultural practise are
approximately 2 tonnes sludge (dry matter) ha-1 yr-1 (INERIS 2008). With an average Cd concentration of
1.8 mg Cd kg-1, this results in local Cd inputs of 3.7 g Cd ha-1 yr-1. Another example is given in the recent
risk assessment report of Sweden (Sternbeck et al. 2011). The current average Cd:P2O5 ratio is 70 mg Cd
(kg P2O5)-1. If the P load is 22 kg P2O5 ha-1 (i.e. European average) this results in a Cd input of 1.5 g Cd ha-1.
However, when considering the sludge application at country scale (Table 14), the average Cd application
through sludge are well below 0.2 g Cd ha-1 yr-1, and for the majority of the countries even below 0.05 g
Cd ha-1
yr-1. This value is used as a realistic average for EU. The aim of this risk assessment is to look at
the Cd soil mass balance for the European Union (+ Sweden). For this reason, country scale rather than
field scale Cd inputs through sludge are important.
In general, the Cd content of the sewage sludge has decreased appreciably over the past decennia
(Figure 14). Most likely this is related to reduction in use of Cd products and lower Cd concentrations in
galvanised structures such as roof sheets.
Figure 14 Variation of heavy metal contents (mg kg-1
) in treated sewage sludge from the Seine Aval treatment
plant in Paris, France (i.e. the largest waste water treatment plant in France). The shaded period
represents the metro line construction in Paris. Note that the concentrations of the heavy metals are
plotted on a log scale.

Revisiting and updating the effect of P fertilizers Fertilizers Europe
31
Conclusion
In Table 15 the total Cd input from manure, lime and sludge is given. We assume that this annual
application rate of 0.15 g Cd ha-1 yr-1 is kept constant in time.
Table 15 Annual Cd inputs (g Cd ha-1
yr-1
) into agricultural through application of manure, lime and sludge.
Source Cd application
(g Cd ha-1
yr-1
)
Manure 0.01
Lime 0.09
Sludge 0.05
Total 0.15
OUTPUT: Crop offtake
Crop offtake is the removal of Cd via the harvested crop. The Cd output depends on the yield of the
crop and its Cd concentration. Although Cd is a non-essential element with no known functions for the
plants, Cd can enter the plant using the uptake systems of nutrients which resemble the contaminant in
terms of charge and ion radius (i.e. Zn2+). When Cd is added to the soil, increasing crop Cd concentrations
are thus likely to occur. Plant roots absorb Cd present freely in the pore water, as such the uptake rate
increases with increasing Cd concentration in the pore water. Cadmium is then translocated from the
roots to the above-ground parts, typically more in plant leaves than in fruit or storage organs. Although
this increased Cd concentration in crops forms a risk for human health through food intake (Figure 3),
the removal of the harvested crops is an output factor in the mass balance. The amount of Cd taken up
by plants depends on the soil properties and/or plant species. The soil properties influencing uptake are
Cd speciation, total Cd concentration, soil pH, soil organic matter (SOM) content, the concentration of
other elements such as Cu, Ni, Se, Mn and P, the soil sorption capacity and the redox potential (Alloway
1995). Plant species and varieties differ in their ability to adsorb, accumulate and tolerate Cd. Leafy
vegetables, such as spinach, lettuce and cabbage tend to take up relatively more Cd.
Transfer function TF
The increased Cd concentrations in plants as a result of increased soil Cd concentrations can be
assessed by using the slope of plant Cd vs. soil Cd curves or so-called dose-response curves. These curves
are constructed using paired observations of soil and plant concentrations. It is observed that, at low
concentrations, increasing soil Cd will lead to an almost proportional increase in plant Cd ([Cd]crop)
assuming constant pH, SOM content, etc. (McLaughlin et al. 2011). The slope of that increase equals to
the so-called transfer factor (TF) as depicted in Figure 15:
TF = [Cd]crop / [Cd]soil (3)
This linear increase was observed when Cd is added to the soil as Cd2+ salt up to about 20 mg kg-1, above
which curvilinear trends are found (Brown et al. 1998; Haghiri 1973).

Revisiting and updating the effect of P fertilizers Fertilizers Europe
32
Figure 15 Linear increase of Cd concentration in the crop with the increasing soil Cd concentration. The slope of
the proportional line between crop and soil Cd is the transfer factor (TF). Note that the TF is largely
influenced by soil properties which can obscure effects of soil Cd on crop Cd.
The TF’s are no unique crop characteristics since phytoavailability of Cd depends strongly of soil
properties that influence Cd availability (pH, salinity, Zn concentration). The variability in Cd availability
across soil types often overrules the variability in crop Cd due to differences between crop Cd and soil Cd
(Smolders 2001). Unfortunately paired soil and plant data of field crops are not widely available. Transfer
functions derived from soil and plant data are shown in Table 16. In this study we focus on cereals and
potato, both being the major source of carbohydrate intake by the European population.
Table 16 The Cd transfer factors (TF) for wheat and potato grown in selected agricultural soils. The TF’s are
calculated as the ratio of [Cd]crop and [Cd]soil. For more information on references we refer to the Cd risk
assessment report (2007).
Crop [Cd]crop [Cd]soil TF Country
µg Cd (kg fresh weigth)-1
µg Cd kg-1
Wheat grain 38 (dry weight basis) 700 0.055 UK
58 435 0.11 France
60 400 0.15 The Netherlands
40-69 270-420 0.14-0.20 Sweden
56 440 0.13 Germany
57 0.14 Average
Potato 10 270 0.04 Sweden
30 400 0.08 The Netherlands
30 440 0.07 Germany
23 0.06 Average
Soil Cd (mg kg-1)
Cro
p C
d (
mg
kg-1
)
slope = TF = [Cd]crop
/ [Cd]soil

Revisiting and updating the effect of P fertilizers Fertilizers Europe
33
Knowledge of the transfer factor allows estimation of the Cd concentration in the plant [Cd]crop
based on the Cd concentration in the soil [Cd]soil:
[Cd]crop = TF × [Cd]soil (4)
By multiplying the [Cd]crop with the total yield per ha, the crop offtake (g Cd ha-1 yr-1) can easily be
calculated. The average production of wheat and potato in Europe is 5 and 26 tonnes ha-1 (fresh weight
based), respectively. At a background soil concentration of 0.3 mg Cd kg-1, the crop offtake is on average
0.21 g Cd ha-1
yr-1
for wheat and up to 0.5 g Cd ha-1
yr-1
for potatoes.
As mentioned before, soil properties have an important influence on Cd availability to plants.
Surveys of crop and soil Cd concentrations show that crop Cd concentrations increase with increasing
total Cd, with decreasing soil pH, and in some cases, with decreasing % OM at constant total Cd.
Additionally chloride salinity and zinc deficiency stimulates Cd uptake. These relationships are not always
straightforward and can be complex. For example, plant uptake increases proportionally with increasing
Cd concentration in soil solution (and thus total soil Cd). This would suggest that soil Cd bioavailability
increases as the sorption power of a soil decreases (or KD, see further). This decrease in Cd sorption
capacity could be related to a decrease in soil pH. In contrast, some studies have shown that Cd uptake
from solution increases when H+ activity is lowered (i.e. pH increased). For example, in a solution culture
Smolders and Helmke (unpublished) found that the concentration of Cd in soybean shoots increased by a
factor 1.9 between pH 5 and 7 at constant Cd2+ concentration. This ion interaction effect can mitigate the
soil chemical effect (Hough et al. 2005), and it is difficult to estimate the net effect of pH on metal
bioavailability. Field data on Cd uptake by numerous plants show that the net effect of increasing soil pH
on reducing Cd bioavailability is, on average only a factor of 1.2 per unit pH increase for maize and
potato (McLaughlin et al. 2011; Smolders et al. 2007). Another interionic effect can be observed at
elevated Zn or Ca concentrations. The uptake of Cd decreases as the concentration of Zn or Ca, an ion
competing with the same uptake sites, increases.
In Table 17, the effect of soil properties, especially pH, on the transfer factors for wheat grain and
potato tuber is shown. We selected only European data for this assessment. The effect of pH on TF is
relatively small, and when the long-term change in soil Cd is considered this pH effect is even negligible
(Table 18).
Table 17 The Cd transfer factors (TF) on fresh weight basis for selected agricultural crops calculated from
predicted crop Cd concentrations and mean or median Cd concentration in corresponding soils. The TF’s
are related to soil properties and were calculated for pH 5.8 (EU average) and pH 6.8. Relationships were
copied from the EU risk assessment report (EU 2007).
Crop TF relationship n Predicted TF reference
pH 5.8 pH 6.8
Wheat grain TF = (92 -10.3 pH + 0.10 [Cd]soil – 0.26 [Zn]soil) / 290 192 0.17 0.14 Eriksson et al. (1996)
Potato TF = 0.2 ×10(-0.36 -0.07 pH +0.29 log [soil Cd])
/[Cd]soil 239 0.09 0.07 Smolders et al. (2007)

Revisiting and updating the effect of P fertilizers Fertilizers Europe
34
Table 18 Effect of pH on the transfer function (TF) and the long-term change in soil Cd (%) with a constant TF (i.e.
0.06, see Table 16) versus a pH dependent TF, as calculated with equation of Smolders et al. (2007)
presented in Table 17. The long-term change was calculated using the mass balance approach (see
section on mass balance computations).
pH TF Cd content of P fertilizer
20 40 60
Constant
TF
pH dependent
TF
Constant
TF
pH dependent
TF
Constant
TF
pH dependent
TF
4.5 0.10 -68 -69 -63 -64 -57 -58
5.5 0.09 -25 -27 -17 -18 -8 -10
6.5 0.08 -2 -3 8 7 18 16
7.5 0.06 7 17 17 17 27 27
From above analysis, we can conclude that the pH effect on the Cd bioavailability and thus Cd
uptake does not have a significant effect on the long-term change in soil Cd. We therefore selected not
to correct TF’s for pH, but rather work with a constant TF value for each crop type (i.e.Table 16, bold
values).
Foliar uptake of Cd
For the completeness of this assessment, foliar uptake of Cd, is discussed briefly here. In air, non-
gaseous metals are associated with small (< 10 µm) particulates, called aerosols, which can be deposited
on plants on which the metals eventually absorb. The mechanisms are however still unclear. Washing or
even peeling vegetables or fruits before consumption does not fully remove the airborne metals. As a
result, airborne metals can be significant source of metals in the food chain. A recent compilation study
by McLaughlin et al. (2011) shows that variable results are obtained. Depending on the air Cd
concentration, the soil Cd concentration and the crop type, the percentage of airborne crop Cd ranges
from 0 to 58 % for barley grain. However, such high airborne percentages are found for soil Cd
concentrations of 0.08 mg Cd kg-1, which is 3 times lower than the European average (0.28 mg Cd kg-1).
The most important result of the large atmospheric deposition contribution is that Cd concentrations can
become unrelated to soil Cd concentrations. However, due to the significant decrease in air Cd
concentrations due to environmental efforts, the contribution of atmospheric deposition on foliar
uptake will also decrease.
Conclusion
We chose to work with three different cropping systems representative for European agriculture:
cereal monocropping, potato monocropping and cereal-potato rotations, with 2 consecutive years with
cereals and one with potato. Crop offtake is estimated based on the transfer factor and expected yields.
This implies that crop offtake is always linked to the soil Cd concentration, and will thus change in time.
An overview of TF and yields is presented in Table 19.

Revisiting and updating the effect of P fertilizers Fertilizers Europe
35
Table 19 The transfer function (TF) and average European crop yields (EUROSTAT 2012) with the standard
deviation given in brackets. The cereal-potato rotations are based on 2 consecutive years cereal
production, followed by one year with potato. As example crop offtake was calculated for a soil Cd
concentration of 0.3 mg Cd kg-1
, which is the European background concentration for Cd.
Cropping system TF Yield Crop offtake
(tonnes ha-1
) (g Cd ha-1
yr-1
)
Cereals 0.14 5.1 (1.9) 0.21
Potato 0.06 25.9 (9.6) 0.47
Cereal-potato 0.11* 12* 0.40
* The TF and yield were calculated as 2/3 for cereals and 1/3 for potato.
OUTPUT: Leaching
Leaching represents an outflow of Cd from the topsoil (g Cd ha-1 yr-1) and is a function of water
percolation through the topsoil and the dissolved Cd concentrations [Cd]solution in the pore water.
Percolation through the topsoil (m³ ha-1 yr-1) can be calculated from the precipitation excess F (m yr-1):
�������� �� = � × 10000�²ℎ��"�� (5)
Leaching (g Cd ha-1 yr-1) equals the percolation times the dissolved Cd concentration:
#���ℎ �$ = [��]���'(��)�������� �� (6)
with the Cd concentration in mg Cd L-1. Typical values for F in temperate regions ranges between 0.1 and
0.3 m yr-1, with 0.2 m yr-1 selected as European average (Degryse and Smolders 2006).
An appropriate evaluation of leaching requires an assessment of the proportion of the metal that is
mobile for leaching. The dissolved Cd pool reflects the Cd fraction that could be leached from the soil
(Sauvé et al. 2000). The Cd concentration in the pore water is the best basis for the calculation. However,
when total soil Cd changes, pore water concentrations will also change. Since Cd pore water
concentrations change almost proportionally with total soil Cd (keeping all other parameters constant), it
is best to predict the Cd pore water concentration from the total Cd concentration in a soil and the Cd
distribution coefficient (KD). The KD value (L kg-1) is a measure for the relative partitioning of an element
between the solid phase and solution phase or pore water (water held in pore space between soil
particles):
*+ =[��]����
[��]���'(��)
(7)
with [Cd]soil the Cd concentration in the solid phase of the soil (mg kg-1) and [Cd]solution the Cd
concentration in solution (mg L-1). Metal partitioning in soils can be due to sorption/desorption
reactions. Depending on the methods used to characterize the solid and liquid phase, different KD values
may be obtained that express partitioning between different pools with different availability (Degryse et
al. 2009).

Revisiting and updating the effect of P fertilizers Fertilizers Europe
36
Ideally, in situ measurements of pore water concentrations should be used for estimation of leaching.
The lack of these data for European soils, necessitates the estimation of solution Cd concentrations from
KD values and total soil Cd measurements:
[��]���'(��),,-./ =[��]����*+,,-./
(8)
The KD values can vary over several orders of magnitude for a given metal as a function of soil
properties: on 830 data points KD values range between 0.44 and 192000 L kg-1 (Sauvé et al. 2000). As
will be shown, this variability on KD is the most sensitive fraction for determination of the net mass
balance of Cd. Different empirical regression models for predicting KD values (KD, pred) are in use. In these
models, log KD values measured on a set of soils are related to a range of soil properties as follows:
Log KD = a + b pH + c log ([Cd]soil) + d log (OC) + e log (% clay) + f (CEC) + … (9)
From a practical point of view, it is preferable to only use routinely measured soil properties, e.g. pH and
percentage organic carbon (% OC) in KD models. Cadmium solubility data in contrasting soils
demonstrate that soil pH is the primary statistical factor associated with Cd concentrations in solution,
often more important than the total Cd concentration in a soil, followed by soil organic matter (SOM)
(Figure 16). A change in pH by two units affects the KD of Cd by more than 20-fold. Soil pH explains 30 to
60 % of the variability in log KD values (Sauvé et al. 2000). Soil pH regressions can be improved by adding
a component for SOM or for total soil Cd. Albeit significant, the most beneficial and site-specific KD
adjustment is pH, followed by SOM for Cd.
Many models relating soil characteristics with KD-values have been made in the past. We will review
the proposed models below and select the most reliable model for KD estimation.
Figure 16 Measured KD values (L kg-1
) related to soil pH (Smolders and Mertens 2013). The lines represent the
curve fitting for various empirical adsorption studies.
KD models
The magnitude of Cd leaching is very difficult to estimate precisely. The uncertainty of KD values
results in an equal uncertainty in the predicted annual losses of Cd through leaching (see below). It is

Revisiting and updating the effect of P fertilizers Fertilizers Europe
37
possible to under- or overestimate leaching, depending on the selection of the model for KD values.
Especially overestimation of leaching should be avoided given the risk for human exposure of Cd in the
soil.
The KD can be determined by measurement of the distribution of soil-borne metals between the
solid and the liquid phase. The total metal concentration is usually measured after hot acid digestion of
the soil sample. For the determination of the Cd concentration in the solution phase, however, many
different analytical methods have been proposed. Ideally, in situ soil solution or pore water
measurements should be used. With in situ measurements the ionic strength and soil pH is not altered
and the dissolved organic matter (DOM), known to influence Cd availability (see before) is not diluted. As
such, the true in situ Cd concentration can be predicted. The isolation of pore water is usually obtained
by centrifugation or by using Rhizon samplers. Since the isolation of soil solution is laborious method and
it is difficult to obtain large volumes, soil extracts are often preferred. The underlying assumption is that
the Cd concentration in the extract is a good estimate of the Cd concentration in the soil solution.
Different types of extractants (CaCl2, KNO3, Ca(NO3)2) and extraction protocols (i.e. extracting time,
concentration of the extractant and soil: liquid (S:L) ratios) are being used. For many soils the ionic
strength of a 0.01 M CaCl2 approximates to that of a soil solution. For Cd, the difference between
concentrations in the dilute salt extract and the soil solution are mostly within a factor 5. However, some
have observed larger differences. The calcium (Ca2+) added with the CaCl2 extractant can compete with
Cd for sorption on the surface sites. This results in a higher concentration of Cd in the extract compared
to the in situ soil solution. We prefer to work with pore water based KD estimations to allow a good and
accurate determination of Cd in solution.
Since 2000, more data are available on in situ KD measured. The KD models used in previous reports
(i.e. CSTEE 2002), can therefore be updated with new KD models based on pore water measurements. In
the CSTEE report, two models were used: one was based on pore water and the other one was based on
extraction. In Table 20 regression equations relating pore water-based KD values to soil pH and OC are
reported. Based on the data set available in four different studies, we have constructed our own KD
model.
Table 20 Selected regression models for KD derived from pore water- based KD measurements. The number of
observations used to derive the empirical model (n) and the R² value for the linear relationship log (KD
measured) and log (KD predicted by the model).
model Log KD = a + b pH + c log (% OC) Based on data from
a b c n R²
1 -1.14 0.56 0.88 56 0.67 Degryse et al. (2003)
2 -0.55 0.43 0.70 47 0.75 de Groot et al. (1998)
3 -2.35 0.78 0.43 31 0.81 McGrath (personal communication)
4 -0.74 0.44 0.90 17 0.79 Nolan et al. (2005)
5 -0.94 0.51 0.79 151 0.71 All data compiled

Revisiting and updating the effect of P fertilizers Fertilizers Europe
38
We have evaluated proposed KD models against the total data set (n = 151). We therefore analysed
the logarithmic relationship between the predicted pore water concentrations (= [Cd]soil / KD) and the
measured pore water concentrations ([Cd]solution). The strongest relationship was found in model 5 (R² =
0.81), model 2 (R² = 0.80) and model 4 (R² = 0.80).
Table 21 KD values (L kg-1
) were calculated according to the models in Table 20 at a soil pH of 5.5, 6.5 or 7.5 and
an organic C content of 2 or 4 % (conversion: OM = 1.7 OC).
model OC = 2 % OC = 4 %
pH=4.5 pH=5.5 pH=6.5 pH=7.5 pH=4.5 pH=5.5 pH=6.5 pH=7.5
1 42 152 546 1963 78 280 1005 3615
2 40 108 291 786 65 175 472 1276
3 20 121 736 4458 27 164 991 6008
4 33 91 253 698 61 170 470 1299
5 40 129 417 1351 69 223 722 2341
Based on the models in Table 20, the leaching of Cd in temperate regions (precipitation excess F =
0.2 m) with pH 6.5, 2 % OC and a background concentration of 0.3 mg Cd kg-1 ranges between 0.8 (model
3) and 2.4 (model 3) g ha-1 yr-1 (Table 22). The best fitted model for pore water estimations (model 5)
results in 1.44 g Cd ha-1 yr-1 leaching. Eriksson et al. (2012) estimated the leaching in Swedish soils to be
0.3‒0.5 g Cd ha-1 yr-1 using measured soil solution concentrations of 0.15‒0.25 µg Cd L-1 with 0.2 m
precipitation excess.
Table 22 The annual Cd leaching from the plough layer (g Cd ha-1
yr-1
). The Cd leaching is calculated for a soil with
0.3 mg Cd kg-1
(total Cd, background concentration) and an annual net water flux (F, or precipitation
excess) of 0.2 m yr-1
. The different models used are described in Table 20.
model OC = 2 % OC = 4 %
pH=4.5 pH=5.5 pH=6.5 pH=7.5 pH=4.5 pH=5.5 pH=6.5 pH=7.5
1 14.21 3.95 1.10 0.31 7.72 2.15 0.60 0.17
2 15.05 5.57 2.06 0.76 9.28 3.43 1.27 0.47
3 29.96 4.94 0.82 0.13 22.23 3.67 0.61 0.10
4 18.15 6.57 2.38 0.86 9.76 3.53 1.28 0.46
5 15.13 4.67 1.44 0.44 8.73 2.69 0.83 0.26
Since our model (model 5) includes the best data validation and the largest R² between measured
and estimated pore waters, we will use this model for leaching estimations.
The equations presented in Table 20 confirm that the effect of % OC on KD is relatively weak:
increasing soil organic C from 2.0 to 2.5 % at pH 6.5 increases KD from 417 to 498 for the equation based
on all data. At pH 7.5, the predicted KD values vary a factor 5 to 6, depending on the model used. At pH

Revisiting and updating the effect of P fertilizers Fertilizers Europe
39
7.5, the KD values are so large that this difference in KD value does not influence the long-term change in
soil Cd drastically. Differences in KD values between the models are much smaller in the lower pH range
(4.5 and 5.5). It is however important to notice that when KD values are low, small variations in KD will
have larger effects on the Cd mass balance than at higher pH with larger KD values (Figure 17). A
sensitivity analysis was performed to predict the net effect on the Cd mass balance. From the standard
error on the model parameters (Equation 9), we could estimate the standard deviation on the KD values
from our model for different pH and OC combinations. This results in following variation in percentage
change in soil Cd if other parameters are kept constant (Figure 17).
Figure 17 Sensitivity analysis of uncertainty on KD values (using parameter uncertainty). Percentage change in soil
Cd over 100 years compared to the background Cd concentration (0.3 mg Cd kg-1
). For each
combination of pH and organic carbon (OC) 1000 simulations were run to cover a full range of KD values
around the mean KD value. We assumed an atmospheric deposition of 0.35 g Cd ha-1
yr-1
, a P fertilizer
rate of 21 kg P2O5 ha-1
with 40 mg Cd (kg P2O5)-1
, a crop offtake in a cereal monocropping system of
0.21 g Cd ha-1
yr-1
and a precipitation excess of 0.2 m. The dot represents the mean KD value, which in
turn equals the median value. The error bars represent the 10th
and 90th
percentile of the predictions
based on parameter uncertainty.
Conclusions
KD values and thus estimation of soil solution concentration of Cd vary depending on the models
used to estimate KD values from soil properties (pH and SOM). We conclude that our model (model 5) is
the best model to use in further calculations. At pH 5.8 and OC 2.5% (the European average) the leaching
is on average of 2.56 g Cd ha-1
year-1. Although the error on the modelled KD values can have a large
effect on % change in soil Cd, especially at lower pH ranges, we will not consider this for further analysis.
pH 4
.5-O
C 2
%pH
4.5
-OC
3%
pH 4
.5 -
OC
4%
pH 5
.5-O
C 2
%pH
5.5
-OC
3%
pH 5
.5-O
C 4
%pH
6.5
-OC
2%
pH 6
.5-O
C 3
%pH
6.5
-OC
4%
pH 7
.5-O
C 2
%pH
7.5
-OC
3%
pH 7
.5-O
C 4
%
% c
ha
ng
e in
so
il C
d
-120
-100
-80
-60
-40
-20
0
20

Revisiting and updating the effect of P fertilizers Fertilizers Europe
40
Mass balance computations
The mass balance is ran according to different scenarios. Three approaches are compared to
account for the variable scenarios:
1. A full factorial combination of parameter values yielding 2160 scenarios (Table 23).
2. Selection of 14 typical scenarios by expert judgement, representing the mean and regionally
different scenarios in Europe.
3. A sensitivity analysis of all parameter values assuming no parameter covariance, to identify
the most important parameter for changes in soil Cd.
An overview of model parameters used for the different approaches are presented in Table 24. The
most important differences with model parameters used for previous risk assessment reports (CSTEE
2002) are the atmospheric deposition, the P fertilizer application rates and the KD models used for
estimation of leaching (Table 25).
Future trends
1. Full factorial analysis
A full factorial analysis was performed, in which different model parameters (Table 24) are
combined with each other. Obviously, some of the combinations are not equally important as others. For
example, most southern European soils have a high pH and the Mediterranean climate is associated with
small leaching (low value of F) and smaller crop yields that require smaller fertilizer doses; hence, the
combination of high pH, high F and high fertilizer input values is not as common as the scenarios with
average parameter values. For all scenarios, we started from an initial soil Cd concentration of 0.28 mg
Cd kg-1 (i.e. European average). The long-term change in soil Cd was calculated for a total of 2160
scenarios, which is the number of all possible parameter combinations of Table 23 and Table 24. The %
change in soil Cd for the individual scenarios are given in the appendix.
Table 23 Model parameters used for the 2160 scenarios to predict the long-term change of soil Cd. The values in
bold are the European averages (EU 27+1).
Model parameters for mass balance
Atmospheric deposition 0, 0.35, 0.7 g Cd ha-1
yr-1
Cropping systems (influencing P fertilizer application and crop
offtake)
Cereals, cereal-potato, potato (see Table 24)
% OC in soil 2, 2.5, 3, 4 % OC
Soil pH 4.5, 5.5, 5.8, 6.5, 7.5
Cd content of P fertilizer 20, 40, 60, 80 mg Cd (kg P2O5)-1
Precipitation excess (F) 0.1, 0.2, 0.3 m yr-1

41
Table 24 Mass balance parameters used for the different scenarios.
Model parameter EU average
(standard deviation)
Possible scenarios Unit Comments
STARTING POINT
Background Cd at time=0 0.28 (0.71) 0.25, 0.3, 0.35, 0.6 mg Cd (kg soil)-1
0.3 mg Cd kg-1
is the European average, and 0.6 mg Cd
kg-1
is the concentration in contaminated soils
INPUT
Cd concentration in
fertilizer
20, 40, 60, 80 mg Cd (kg P2O5)-1
Proposed thresholds by European Commission, plus an
additional higher concentration
Fertilizer application rate Cereals: 21 (11)
potato: 45 (31)
cereal-potato: 29
EU average: 22
Cereals: 21
potato: 45
cereal-potato: 29
kg P2O5 ha-1
yr-1
We assumed 3 types of cropping systems: cereals only,
potato only, and cereal-potato rotations with 2 years
cereals and 1 year potato.
Sludge, lime and manure 0.15 0.15 g Cd ha-1
yr-1
Total input is assumed constant
Atmospheric deposition 0.35 (0.21) 0, 0.35, 0.7 g Cd ha-1
yr-1
0.7 g Cd ha-1
yr-1
is a realistic worst case.
OUTPUT
Annual precipitation
excess
0.1, 0.2, 0.3 m For temperate and Mediterranean regions respectively
Cd in solution [Cd]solution
from KD models
[Cd]solution = [Cd]soil / KD µg Cd L-1
The KD model used: log KD = -0.94 + 0.51 pH + 0.79 log
(% OC)
Soil pH 5.8 (1.1) 4.5,5.5, 5.8, 6.5, 7.5
% organic C (OC) 2.5 (4.0) 2, 2.5, 3, 4 % Conversion factor: SOM = 1.7 OC.
Transfer factor for crop
offtake
Cereals: 0.14
potato: 0.06
cereal-potato: 0.11
TF = [Cd]crop / [Cd]soil
Crop yields Cereals: 5 (2)
potato: 26 (10)
cereal-potato: 12
Cereals: 5
potato: 26
cereal-potato: 12
tonnes EU yield averages (EUROSTAT 2012)
Other parameters
Soil depth 0.25 m Plough layer
Soil weight 3000 tonnes ha-1

Revisiting and updating the effect of P fertilizers Fertilizers Europe
42
Our long-term predictions of soil Cd were compared with previously reported predictions in the
CSTEE report (2002) in Figure 18.
Figure 18 Predicted change in soil Cd in European agricultural soil after 100 years application of inorganic P
fertilizers with Cd concentrations of 20, 40 or 60 mg Cd (kg P2O5)-1
and in our update mass balance, also
80 mg Cd (kg P2O5)-1
. Means of the different simulations are indicated with a filled marker (●), the
expected European means (with pH 5.8, 2.5 % OC, 0.35 g Cd ha-1
yr-1
through atmospheric deposition
and P fertilizer application of 22 kg P2O5 ha-1
yr-1
, cfr. cereal system) are indicated with an empty
marker (○) and the error bars represent the 10th
and 90th
percentile of the 2160 scenarios. On the left
side, mass balance calculations were done according to the CSTEE report (2002), while on the right side,
updated parameters were used (Table 24). Negative values denote reductions of soil Cd.
It is important to emphasize that in this report a different set of mass balance parameters and KD
models were used. These model parameters and KD models used for each prediction are compared to
our updated parameters in Table 25.
Cd content of P fertilizer (mg Cd (kg P2O5)-1)
20 40 60
% C
han
ge in
so
il C
d
-60
-40
-20
0
20
40
60
a) CSTEE parameters
Cd content of P fertilizer (mg Cd (kg P2O5)
-1)
20 40 60 80
% C
han
ge in
so
il C
d
-60
-40
-20
0
20
40
60
b) Updated parameters

Revisiting and updating the effect of P fertilizers Fertilizers Europe
43
Table 25 Parameters in the soil mass balance calculations. Comparison between parameters selected for the CSTEE
risk assessment (CSTEE 2002) and the updated parameters used for the full factorial analysis in this
report.
Model parameter CSTEE report Current report
STARTING POINT
Cd background (t=0) (mg Cd kg-1
) 0.3 0.28 (EU average)
INPUT
Atmospheric deposition (g Cd ha-1
yr-1
) 0, 3 (worst case) 0, 0.35 (EU-measured average),
0.7
P fertilizer rate (kg P2O5 ha-1
yr-1
) 23, 69 21 (cereals), 29 (cereal-potato
rotation), 45 (potatoes), 22 (EU
average)
Cd content of the fertilizer (mg Cd (kg
P2O5)-1
20, 40, 60 20, 40, 60, 80
Sludge, manure, lime, etc. (g Cd ha-1
yr-1
) Not considered 0.15
OUTPUT
KD model used to estimate [Cd]solution
KD in µg L-1
1) Römkens and Salomons (1998)1
2) McBride et al. (1997)2
Updated KD model3
pH 5.5, 6.5, 7.5 4.5, 5.5, 5.8 (EU average), 6.5,
7.5
OM or OC (OM = 1.72 OC) 1, 4 % OM 2, 2.5 (EU average), 3, 4 % OC
Precipitation excess (F) or drainage (D)
(m yr-1
)
0.1, 0.4 0.1, 0.2, 0.3
Crop offtake (g Cd ha-1
yr-1
) at t=0, value
changes proportionally with [Cd]soil
0.3 (wheat-corn rotation) 0.20 (cereal), 0.38 (cereal-
potato), 0.44 (potato)
Others parameters
Soil depth (m) 0.25 0.25
Soil weight (tonnes ha-1
) 3000 3000 1 Log KD = -1.16 + 0.56 pH
2 Log [Cd]solution = 3.62 -0.5 pH -0.45 log (10 OM) + 0.96 log [Cd]soil with [Cd]solution
3 Log KD = -0.94 + 0.51 pH +0.79 log (OC)
In Table 26, we made an inventory of the most important Cd inputs and outputs (g Cd ha-1 yr-1) as
calculated with the CSTEE report and our mass balance. It is clear that the 10 fold decrease in
atmospheric deposition has a large influence on the input-output balance. Also leaching was largely
influenced by the mass model used.

Revisiting and updating the effect of P fertilizers Fertilizers Europe
44
Table 26 Inventory of Cd inputs and outputs (g Cd ha-1
yr-1
) to agricultural soil as used in the CSTEE (2002) report
and current assessment. Analysis was performed for application of P fertilizer containing 40 mg Cd (kg
P2O5)-1
to a soil with pH 6.5, 2 % OC (or 3.44 % OM), 0.3 mg Cd kg-1
and a precipitation excess of 0.2 m.
Model parameter CSTEE, 2002 Comments Current Comments
INPUT
Atmospheric deposition 3.00 Worst case 0.35 EU average
Via P fertilizers 1.84 P rate is average of 23 and 69 kg P ha-1
0.88 EU average
Via sludge, manure and lime 0.00 Not considered 0.15
OUTPUT
Leaching 1) 1.98 Römkens and Salomons KD model 1.44 Updated KD
2) 0.30 McBride KD model model
Crop offtake 0.30 0.21 Cereals
BALANCE
1) 2.56 Römkens and Salomons -0.27 Updated KD
2) 4.24 McBride model
The estimated long-term change in soil Cd is clearly different depending on the parameters used for
the mass balance (Figure 18). According to the CSTEE projections, soil Cd concentrations can increase up
to 60 % when P fertilizer with 60 mg Cd (kg P2O4)-1 is applied annual at constant rate. In contrast, we
estimate that soil Cd will maximally increase 23 % after 100 years of application of the same P fertilizer
quality, which is three times less. In general, when considering the mean values only, our projections
show that even when P fertilizers containing 60 mg Cd (kg P2O4)-1 are applied annually, soil Cd will still
decrease slightly (-7%), while according to the CSTEE report increases can already be expected with the
high quality P fertilizers containing 20 mg Cd (kg P2O4)-1. Additionally, when P fertilizers containing 80 mg
Cd (kg P2o5)-1 are applied to fields at the rate of 22 kg P2O5 ha-1, no change in soil Cd is expected in the
long-term. On average inputs and outputs compensate each other.
Before drawing more conclusions, a preliminary sensitivity analysis is performed to identify which
input or output parameter causes this big difference between the two reports. For this we focus on the
effect of atmospheric deposition (3 vs. 0.35 g Cd ha-1 yr-1), leaching (KD model and precipitation excess:
0.1 or 0.4 m yr-1) at crop offtake of 1 g ha-1 yr-1 (mg Cd kg-1)-1 and P fertilizer rate (23 or 69 kg P2O5 yr-1).
We did the analysis for a soil with pH 5.8, 2.5 % OC (4.3 % OM) and a background soil Cd concentration of
0.3 mg Cd kg-1, i.e. European average. One parameter set is updated compared to the CSTEE report,
while the others are kept constant. Results are presented in Table 27.

Revisiting and updating the effect of P fertilizers Fertilizers Europe
45
Table 27 Sensitivity analysis to evaluate the effect of changing model parameters for mass balance calculations.
This was modelled for a soil with a soil pH of 5.8, 2.5 % OC (or 4.3 % OM) and a background soil Cd
concentration of 0.3 mg Cd kg-1
. Crop offtake is 1.00 g Cd ha-1
(mg Cd kg-1
)-1
.
P fertilizers Atmospheric KD model F= 0.1 m yr-1
F = 0.4 m yr-1
Cd content Application rate deposition change in soil Cd
(mg Cd (kg P2O5)-1
) (kg P2O5 ha-1
yr-1
) (g Cd ha-1
yr-1
) (%)
20
23
3.0
Römkens and Salomons 7 -44
McBride et al. 31 20
Updated 18 -20
0.35
Römkens and Salomons -19 -62
McBride et al. 2 -7
Updated -9 -42
69
3.0
Römkens and Salomons 16 -38
McBride et al. 41 29
Updated 27 -12
0.35
Römkens and Salomons -10 -56
McBride et al. 12 2
updated 0 -34
40
23
3.0
Römkens and Salomons 11 -41
McBride et al. 36 25
updated 23 -16
0.35
Römkens and Salomons -15 -59
McBride et al. 7 -3
updated -5 -38
69
3.0
Römkens and Salomons 29 -29
McBride et al. 55 43
updated 42 -1
0.35
Römkens and Salomons 3 -47
McBride et al. 27 16
updated 14 -23
60
23
3.0
Römkens and Salomons 16 -38
McBride et al. 41 29
updated 27 -12
0.35
Römkens and Salomons -10 -56
McBride et al. 12 2
updated 0 -34
69
3.0
Römkens and Salomons 42 -20
McBride et al. 70 58
updated 56 10
0.35
Römkens and Salomons 17 -38
McBride et al. 42 30
updated 29 -11

Revisiting and updating the effect of P fertilizers Fertilizers Europe
46
Clearly the projected change in soil Cd depends on the KD model used, with the largest KD values
(and thus lowest leaching) estimated with the McBride model and the lowest with the Römkens and
Salomons model. Our updated model had intermediate KD values. Note however, that with the Römkens
and Salomons model only pH is accounted for. The range of the predicted % change in soil Cd can be up
to 25 %. Additionally, changing the drainage rate from 0.1 to 0.4 m yr-1 also has a very large effect on
leaching and thus the long-term change in soil Cd. Changing the atmospheric deposition from 3 g Cd ha-1
yr-1 (worst case) to 0.35 g Cd ha-1 yr-1 (the measured EU-27+1 average) has large effects on the long-term
change of soil Cd: the predicted % change is 25 to 30 % lower when 0.35 is used instead of 3.0 g Cd ha-1
yr-1 for all three KD models. Increasing the P fertilizer application rate obviously results in an increase in
soil Cd, and increases more when P fertilizers rich in Cd are being used.
From above sensitivity analysis it is difficult to conclude which model parameter is most likely
influencing the outcome of the mass balance. The large difference predictions of the long-term change in
soil Cd is most likely due to a combination of factors, i.e. the up to 10-fold decrease in atmospheric
deposition, the difference in KD models and drainage assumed and thus leaching and/or the current
decrease in P fertilizer application rate compared to 2002. A more extended sensitivity analysis is
described further in the text.
2. Analysis based on 14 typical EU scenarios
Secondly, the Cd balance in the plough layer was calculated for a number of input-output scenarios
representative for the situation on European agricultural soils to identify the effects of varying Cd
concentrations in P fertilizers. This approach was also used in the risk assessment report made for the
European Union in 2007, i.e. different input scenarios were combined with low or high output scenarios.
The different scenarios were selected by expert judgment. The difference in input scenarios is mainly
based on difference in atmospheric deposition (low, average or high) and the P fertilizer application. This
last one was linked to the cropping system, with large P applications when potatoes are grown and low P
application rates for cereals. The difference in output scenarios is based on the difference in crop offtake
(according to cropping system) and in leaching losses. Leaching was calculated using the KD model 5 from
Table 20. Soil pH is the most sensitive parameter for calculating leaching losses, followed by OC. Low
input scenarios (1‒4) represent agricultural conditions of northern Europe, medium input scenarios (5‒8)
may be representative for central European agriculture, while the high input scenarios (9‒12) represent
high input farming systems. Scenario 13 may represent land use in some Mediterranean agricultural
areas where very low output prevails due to a limited excess precipitation (0.05 m yr-1 rather than 0.2 m
yr-1) and a large KD value in calcareous soils. The last scenario (14) is based on European average values.
The soil Cd concentration at t=0 also varied between the different scenarios, from 0.25 to 0.6 mg Cd kg-1.
This Cd content refers to the natural Cd (geological origin) and some Cd that was added in the past from
fertilizers and atmospheric deposition.

47
Table 28 Possible input and output scenarios with updated parameters (Table 24).
Scenario Cd input Cd output Cd soil
Atmospheric Cropping P fertilizer others Crop offtake Leaching t= 0
deposition system TF yield pH OC F
(g Cd ha-1
) (kg P2O5 ha-1
) (g Cd ha-1
) (tonnes ha-1
) (%) (m) (mg Cd kg-1
)
1 Low input –
low output
0 Cereals 21 0.15 0.14 5 7.5 4 0.2 0.25
2 Low input –
average output
0 Cereals 21 0.15 0.14 5 6.5 3 0.2 0.25
3 Low input –
high output
0 Cereals 21 0.15 0.14 5 5.5 2 0.2 0.25
4 Low input –
Very high output
0 Cereals 21 0.15 0.14 5 4.5 2 0.2 0.25
5 Average input –
low output
0.35 Cereal-potato 29 0.15 0.11 12 7.5 4 0.2 0.30
6 Average input –
average output
0.35 Cereal-potato 29 0.15 0.11 12 6.5 3 0.2 0.30
7 Average input –
high output
0.35 Cereal-potato 29 0.15 0.11 12 5.5 2 0.2 0.30
8 Average input –
very high output
0.35 Cereal-potato 29 0.15 0.11 12 5.5 2 0.2 0.30
9 High input –
low output
0.70 Potato 45 0.15 0.06 26 7.5 4 0.2 0.35
10 High input –
average output
0.70 Potato 45 0.15 0.06 26 6.5 3 0.2 0.35
11 High input –
high output
0.70 Potato 45 0.15 0.06 26 5.5 2 0.2 0.35
12 High input –
very high output
0.70 Potato 45 0.15 0.06 26 5.5 2 0.2 0.35
13 High input –
Very low output
0.70 Potato 45 0.15 0.06 26 7.5 4 0.2 0.6
14 EU average 0.35 Mostly cereals 22 0.15 0.14 5 5.8 2.5 0.05 0.28

Revisiting and updating the effect of P fertilizers Fertilizers Europe
48
The long-term change in soil Cd for these scenarios were calculated with the mass balance approach
and are presented in Table 29. The soil Cd is predicted to increase when the output is low to medium
after 100 years of exposure to current inputs. This increase in soil Cd is concomitant with the increase in
Cd concentration of the P fertilizer used. At the EU scale the soil Cd is predicted to decrease from 0.28 to
0.23, 0.24, 0.25 and 0.27 mg Cd kg-1 when fertilizers containing respectively 20, 40, 60 and 80 mg Cd (kg
P2O5)-1 are being used. This is a long-term reduction in soil Cd with about 5 to 18 % after 100 years. This is
in contrast with previously reported changes in soil Cd, i.e. a 6 % increase after 60 years was predicted in
the risk assessment report in 2007. The average percentage changes reasonably agree with the average
of the 2160 combinations described above.
Table 29 The predicted long-term change in soil Cd (%) after 100 years of exposure to Cd influxes in agricultural
soils. Eleven scenarios are selected that may be representative for European agriculture. Predictions are
made using the mass balance approach. Negative values denote reductions of soil Cd.
scenario Cd concentration in P fertilizer (mg Cd (kg P2O5)-1
)
20 40 60 80
1 Low input –low output +2.32 +7.78 +13.24 +18.70
2 Low input –medium output -5.95 -0.72 +4.51 -9.74
3 Low input –high output -36.06 -31.73 -27.40 -23.07
4 Low input –very high output -78.42 -75.73 -73.03 -70.33
5 Medium input –low output +4.44 +10.66 +16.87 +23.09
6 Medium input –medium output -3.83 +2.13 +8.09 +14.04
7 Medium input –high output -34.00 -29.07 -24.13 -19.20
8 Medium input –very high output -76.74 -73.66 -70.58 -67.51
9 High input –low output +8.30 +16.54 +24.78 +33.02
10 High input –medium output -0.10 +7.79 +15.69 +23.59
11 High input –high output -30.83 -24.28 -17.74 -11.19
12 High input –very high output -75.41 -71.83 -67.35 -62.39
13 High input –Very low output +3.73 +8.57 +13.43 +18.29
14 EU average -18.52 -14.05 -9.58 -5.11
3. Sensitivity analysis
In this section, the sensitivity of parameters important for the outcome of the mass balance is
analysed using a Risk Solver add-in available from www.solver.com. For all, model parameters, EU-27+1
averages, corresponding standard deviations and distribution can be found (Table 30).

Revisiting and updating the effect of P fertilizers Fertilizers Europe
49
Table 30 European averages for model parameters with their standard deviation and distribution. For the
lognormal distribution, the standard deviation was recalculated from log-transformed values assuming a
normal distribution of the log-transformed data and given in brackets.
Model
parameters
Mean Unit Standard
deviation
Distribution Reference
Atmospheric
deposition
0.35 g Cd ha-1
yr-1
0.21 Normal
EMEP/ CEIP (2012a)
P fertilizer rate 21.6 kg P2O5 ha-1
13.9 Normal Fertilizers Europe
(2011)
OC in soil 2.48 % 3.18
(1.93)
Lognormal NGU report (2012)
Soil pH 5.8 1.1 Normal NGU report (2012)
Soil Cd at t=0 0.28 0.71
(0.24)
Lognormal FOREGS (2006)
Cd content of P
fertilizer
36 P10 = 3, P90 = 73 Triangular (P10 = min.
and P90 =max.)
Nziguheba and
Smolders (2008)
In total 10 000 simulations, in which each parameter varies within its distribution, are run. The true
average change in soil Cd after 10 000 simulations is -18 % with a standard deviation of about 60 %
(Table 31).
Table 31 Predicted change in soil Cd in a probabilistic evaluation (10 000 simulations). The mean, standard
deviation, 10th
, 50th
and 90th
percentiles are given.
Statistic % Statistic %
Mean -18 10th
percentile -88
Standard deviation 60 90th
percentile 39
Median -18
The sensitivity report for the calculations is presented in Figure 19. Clearly, soil pH is the most
important parameter in predicting long-term change in soil Cd, followed by the initial soil Cd
concentration and OC content of a soil. The Cd concentration of the P fertilizer itself comes only on the
4th position.

Revisiting and updating the effect of P fertilizers Fertilizers Europe
50
Figure 19 Sensitivity report obtained with Risk solver analysis tool. The size of the bar represent the importance of
each parameter for the prediction of long-term change in soil Cd.
Observed and predicted trends
The primary route for Cd exposure to humans is through ingestion of foods. There are few data
available on time trends in Cd concentrations in crops and food. A trend analysis was done by Andersson
and Bingefors (1985). They measured Cd concentrations in stored grain samples in a long-term trial in
Sweden (60 years: 1918‒1980) (● in Figure 20). An increase was observed up to 1980. Other data from
10 long-term fertilizer trials in Sweden indicate a decreasing trend from the 1970s up to 2002
(Kirchmann et al. 2009) (○ in Figure 20). These trends are parallel to decreasing trends in Cd inputs
through atmospheric deposition (Figure 8), as well as to the decrease in input via P fertilizers (lower use
and lower Cd concentration).
Moment correlation
-0.6 -0.4 -0.2 0.0 0.2 0.4 0.6
Mo
de
l par
ame
ters
pH
initial soil Cd
OC
Cd concentration in P fertilizer
P fertilizer rate
Atmospheric deposition 0.083
0.189
0.227
0.242
-0.385
0.545

Revisiting and updating the effect of P fertilizers Fertilizers Europe
51
Figure 20 Grain Cd concentrations in long-term experiment conducted in Sweden during period 1918-1980 (●) as
published by Andersson and Bingefors (1985), and during 1970s to 2002 (○) (Kirchmann et al. 2009).
Due to the lack of data it was impossible to model the trend of Figure 20 with our mass balance
calculations. We can, however, confirm that a decreasing trend in soil Cd and thus crop Cd can be
expected. From the initial Cd grain concentrations (approximately 0.68 mg Cd kg-1 fresh grain weight)
and the transfer function data for wheat (TF = 0.14, Table 16), the initial soil Cd can be estimated to be
0.48 mg Cd kg-1 in 1970. The average initial soil pH for the 12 sites in Sweden (Carlgren and Mattsson
2001) is 6.7 and OC is 2.1 %. With atmospheric deposition (i.e. 0.35 g Cd ha-1 yr-1 is a realistic value for
Sweden (Table 6)) as only input of Cd to the soils, the relative change of soil Cd and also crop Cd is
predicted to be approximately 5 % over 40 years. The larger measured decline (33 % change) in grain Cd
contents could not be confirmed. We hypothesize that this is related to the unknown change in soil pH
over time. It is possible soil pH has decreased due to acidifying rain and crop production itself. A small
change in soil pH can have large effects on the long-term change.

Revisiting and updating the effect of P fertilizers Fertilizers Europe
52
References
Aboal JR, Fernández JA, Boquete T, Carballeira A (2010) Is it possible to estimate atmospheric deposition
of heavy metals by analysis of terrestrial mosses? Sci Total Environ 408: 6291-6297
Abollino O, Aceto M, Malandrino M, Mentasti E, Sarzanini C, Petrella F (2002) Heavy metals in
agricultural soils from Piedmont, Italy. Distribution, speciation and chemometric data treatment.
Chemosphere 49: 545-557
Akun ME, Yamacı RF, Charalambous C, Lechtvich S, Djamgoz M (2011) The distribution of carcinogenic
heavy metals in Cyprus soil. In: Gökçekus H, Türker U, La Moreaux JW (eds) Survival and Sustainability. Environmental Earth Sciences. Springer Berlin Heidelberg, pp 353-359
Alloway BJ (1995) Cadmium. In: Alloway B (ed) Heavy metals in soils. London: Chapman and Hall, pp 122-
151
Alumaa P, Steinnes E, Kirso U, Petersell V Heavy metal sorption by different Estonian soil types at low
equilibrium solution concentrations. In: Proceedings of the Estonian Academy of Sciences,
Chemistry, 2001. Estonian Academy Publishers, pp 104-115
Andersson A, Bingefors S (1985) Trends and Annual Variations in Cd Concentrations in Grain of Winter
Wheat. Acta Agriculturae Scandinavica 35: 339-344
Atanassov I, Simeonov L, Sargsyan V (2008) New bulgarian soil pollution standards. Soil Chemical
Pollution, Risk Assessment, Remediation and Security: 129-138
Berg T, Royset O, Steinnes E (1995) Moss (Hylocomium Splendens) used as biomonitor of atmospheric
trace-element deposition - Estimation of uptake efficiencies. Atmos Environ 29: 353-360
Brown SL, Chaney RL, Angle JS, Ryan JA (1998) The phytoavailability of cadmium to lettuce in long-term
biosolids-amended soils. J Environ Qual 27: 1071-1078
Carlgren K, Mattsson L (2001) Swedish soil fertility experiments. Acta Agriculturae Scandinavica, Section
B - Soil & Plant Science 51: 49-76
Crisanto Herrero T, Lorenzo Martin LF (1993) Evaluation of cadmium levels in fertilized soils. Bull Environ
Contam Toxicol 50: 61-68
CSTEE (2002) Member state assessments of the risk to health and environment from cadmium in
fertilizers. protection ECD-ghac.
de Groot AC, Peijnenburg WJGM, van den Hoop MAGT, Ritsema R, van Veen RPM (1998) Heavy metals in
Dutch field soils: an experimental and theoretical study on equilibrium partitioning. vol National
institute for public health and the environment,
Degryse F, Broos K, Smolders E, Merckx R (2003) Soil solution concentration of Cd and Zn can be
predicted with a CaCl2 soil extract. Eur J Soil Sci 54: 149-158
Degryse F, Smolders E (2006) Mobility of Cd and Zn in polluted and unpolluted Spodosols. Eur J Soil Sci
57: 122-133
Degryse F, Smolders E, Parker DR (2009) Partitioning of metals (Cd, Co, Cu, Ni, Pb, Zn) in soils: concepts,
methodologies, prediction and applications - a review. Eur J Soil Sci 60: 590-612
EC (2010) Environmental, economic and social impacts of the use of sewage sludge on land. Environment D. DG ENV.G.4/ETU/2008/0076r.

Revisiting and updating the effect of P fertilizers Fertilizers Europe
53
EFSA Panel on Contaminations in the food chain (2011) Scientific opinion on tolerable weekly intake for
cadmium. EFSA J 9:1975
EMEP/CEIP public database WebDab (2012a)
http://webdab1.umweltbundesamt.at/official_country_trend.html.
EMEP/CEIP (2012b) Long-term changes of heavy metal transboundary pollution of the environment
(1990-2012).
Eriksson J (2001) Concentrations of 61 trace elements in sewage sludge, farmyard manure, mineral
fertiliser, precipitation and in oil and crops. Agency SEP. 5159.
Eriksson J, Öborn I, Jansson G, Andersson A (1996) Factors influencing Cd-content in crops. Results from Swedish field investigations. Swedish Journal of agricultural research 26: 125-133
ERM (2001) Analysis and conclusions from member states' assessment of the risk to health and the
environment from cadmium in fertilisers. . Enterprise EC-D. Contract No. ETD/00/503201. Final
report. June 2001.
Esser KB (1996) Reference concentrations for heavy metals in mineral soils, oat, and orchard grass
(Dáctylis glomeráta) from three agricultural regions in Norway. Water Air Soil Pollut 89: 375-397
EU (2007) European Union risk assessment report. Cadmium metal. Part I environment.
Statistics by the European Commission (2012).
EUSOILS (2010) Map pH in Europe. http://eusoils.jrc.ec.europa.eu/library/data/ph/Resources/ph2.pdf.
Accessed 19/12/2012
Fertilizers Europe (2011) Forecast of food, farming and fertilizer use 2012-2022. Brussels
Geochemical atlas of Europe, Part 2 - Interpretation of geochemical maps, additional tables, figures,
maps and related publications (2006) Geological Survey of Finland, Espoo.
Gombert S, Traubenberg CR, Losno R, Leblond S, Colin JL, Cossa D (2004) Biomonitoring of element
deposition using mosses in the 2000 French survey: Identifying sources and spatial trends. J
Atmos Chem 49: 479-502
Haghiri F (1973) Cadmium uptake by plants. J Environ Qual 2: 93-95
Harmens H, Ilyin I, Mills G, Aboal JR, Alber R, Blum O, Coskun M, De Temmerman L, Fernandez JA,
Figueira R, Frontasyeva M, Godzik B, Goltsova N, Jeran Z, Korzekwa S, Kubin E, Kvietkus K,
Leblond S, Liiv S, Magnusson SH, Mankovska B, Nikodemus O, Pesch R, Poikolainen J, Radnovic D, Ruhling A, Santamaria JM, Schroeder W, Spiric Z, Stafilov T, Steinnes E, Suchara I, Tabors G,
Thoeni L, Turcsanyi G, Yurukova L, Zechmeister HG (2012) Country-specific correlations across
Europe between modelled atmospheric cadmium and lead deposition and concentrations in
mosses. Environ Pollut 166: 1-9
Harmens H, Norris DA, Koerber GR, Buse A, Steinnes E, Ruhling A (2007) Temporal trends in the
concentration of arsenic, chromium, copper, iron, nickel, vanadium and zinc in mosses across
Europe. Atmos Environ 41: 6673-6687. doi:DOI 10.1016/j.atmosenv.2007.03.062
Hellstrand S, Landner L (1998) Cadmium in fertilizers, soil, crops and foods - the Swedish situation.
Cadmium exposure in the Swedish environment KEMI report:

Revisiting and updating the effect of P fertilizers Fertilizers Europe
54
Hough RL, Tye AM, Crout NMJ, McGrath SP, Zhang H, Young SD (2005) Evaluating a 'Free Ion Activity
Model' applied to metal uptake by Lolium perenne L. grown in contaminated soils. Plant Soil 270:
1-12
International Fertilizer industry Association - Statistics (2012).
INERIS (2008) Publich health risk assessment of sludge landspreading. N° DRC-07-81117-09289-C.
Jensen A, Bro-Rasmussen F (1992) Environmental cadmium in Europe. Rev Environ Contam Toxicol 125:
101-181
Jones KC, Symon CJ, Johnston AE (1987) Retrospective analysis of an archived soil collection: II Cadmium.
Sci Total Environ 67: 75-89
Kabata-Pendias A, Dudka S (1991) Baseline data for cadmium and lead in soils and some cereals of
Poland. Water Air Soil Poll 57: 723-731
Kirchmann H, Mattsson L, Eriksson J (2009) Trace element concentration in wheat grain: results from the
Swedish long-term soil fertility experiments and national monitoring program. Environ Geochem
Hlth 31: 561-571
KTBL (2005) Faustzahlen für die Landwirtschaft Landwirtschaft KfTuBid.
McBride M, Sauve S, Hendershot W (1997) Solubility control of Cu, Zn, Cd and Pb in contaminated soils.
Eur J Soil Sci 48: 337-346
McLaughlin MJ, Hamon R Perspectives on inputs of cadmium to the food chain. In: Syers JK, Gochfeld M
(eds), Workshop held at the Belgian Academy of Sciences, Brussels., 2001. SCOPE, pp 60-65
McLaughlin MJ, Smolders E, Degryse F, Rietra R (2011) Uptake of metals into vegetables. In: Swartjes F
(ed) Dealing with contaminated sites. From theory towards practical application. Springer,
Dordrecht,
McLaughlin MJ, Tiller KG, Naidu R, Stevens DP (1996) Review: The behaviour and environmental impact
of contaminants in fertilizers. Aust J Soil Res 34: 1-54
Moolenaar SW, Lexmond TM (1998) Heavy-metal balances of agro-ecosystems in the Netherlands. Neth
J Agr Sci 46: 171-192
NGU (2012) The EuroGeoSurveys geochemical mapping of agricultural and grazing land soils project
(GEMAS). Evaluation of quality control results of total C and S, total organic carbon (TOC), cation
exchange capacity (CEC), XRF, pH, and particle size distribution (PSD) analysis.
Nicholson FA, Chambers BJ, Williams JR, Unwin RJ (1999) Heavy metal contents of livestock feeds and
animal manures in England and Wales. Bioresource Technol 70: 23-31
Nicholson FA, Smith SR, Alloway BJ, Carlton-Smith C, Chambers BJ (2003) An inventory of heavy metals
inputs to agricultural soils in England and Wales. Sci Total Environ 311: 205-219
Nolan AL, Zhang H, Mclaughlin MJ (2005) Prediction of Zinc, Cadmium, Lead, and Copper Availability to
Wheat in Contaminated Soils Using Chemical Speciation, Diffusive Gradients in Thin Films,
Extraction, and Isotopic Dilution Techniques. J Environ Qual 34: 496-507
Nziguheba G, Smolders E (2008) Inputs of trace elements in agricultural soils via phosphate fertilizers in
European countries. Sci Total Environ 390: 53-57

Revisiting and updating the effect of P fertilizers Fertilizers Europe
55
Pacyna EG, Pacyna JM, Fudala J, Strzelecka-Jastrzab E, Hlawiczka S, Panasiuk D, Nitter S, Pregger T,
Pfeiffer H, Friedrich R (2007) Current and future emissions of selected heavy metals to the
atmosphere from anthropogenic sources in Europe. Atmos Environ 41: 8557-8566
Pacyna JM, Pacyna EG, Aas W (2009) Changes of emissions and atmospheric deposition of mercury, lead,
and cadmium. Atmos Environ 43: 117-127
Römkens PFAM, Salomons W (1998) Cd, Cu and Zn solubility in arable and forest soils: Consequences of
land use changes for metal mobility and risk assessment. Soil Sci 163: 859-871
Rothbaum HP, Goguel RL, Johnston AE, Mattingly GEG (1986) Cadmium accumulation in soils from long-
continues applications of superphosphate. J Soil Sci 37: 99-107
Sager M (2007) Trace and nutrient elements in manure, dung and compost samples in Austria. Soil Biol
Biochem 39: 1383-1390
Sauvé S, Hendershot W, Allen HE (2000) Solid-solution partitioning of metals in contaminated soils:
dependence on pH, total metal burden and organic matter. Environ Sci Technol 34: 1125-1131
Schuhmacher M, Domingo JL, Llobet JM, Corbella J (1994) Cadmium, chromium, copper, and zinc in rice
and rice field soil from southern Catalonia, Spain. Bull Environ Contam Toxicol 53: 54-60
Smolders E (2001) Cadmium uptake by plants. Int J Occup Med Environ Health 14: 177-183
Smolders E, Jansson G, Van Laer L, Ruttens A, Vangronsveld J, Römkens P, De Temmerman L,
Waegeneers N, Bries J (2007) Teeltadvies voor de landbouw in kader van het Interreg project
BeNeKempen.
Smolders E, Mertens J (2013) Cadmium. In: Alloway BJ (ed) Heavy metals in soils: trace metals and
metalloids in soils. Environmental pollution, vol 22. Springer Netherlands,
Société chimique de France (2007) Carbonate de calcium.
http://www.societechimiquedefrance.fr/extras/donnees/mine/caco/texcaco.htm#Utilisation_cal
caire. Accessed 19/12/2012
Sternbeck J, Eriksson J, Österas AH (2011) The role of mineral fertilisers for cadmium in Swedish
agricultural soil and crops. Commission E. Ares (2011) 532940.
Tjell JC, Christensen TH (1992) Sustainable management of cadmium in Danish agriculture. Trace Metals
Other 2: 273-286
Traina SJ (1999) The environmental chemistry of cadmium. In: McLaughlin MJ, Singh BR (eds) Cadmium in soils and plants. Kluwer Academic, Dordrecht, pp 11-37
Ursínyová M, Hladíková V, Uhnák J, Kovačičová J (1997) Toxic elements in environmental samples from
selected regions in Slovakia. Bull Environ Contam Toxicol 58: 985-992
WHO, World Health Organisation of United Nations (2010) Summary and conclusions of the 73th meeting
joint FAO/WHO expert committee on food additives.
Zechmeister HG, Hohenwallner D, Riss A, Hanus-Illnar A (2003) Variations in heavy metal concentrations
in the moss species Abietinella abietina (Hedw.) Fleisch according to sampling time, within site
variability and increase in biomass. Sci Total Environ 301: 55-65

Revisiting and updating the effect of P fertilizers Fertilizers Europe
56
Appendix
Table A. 1 The long-term change in soil Cd after 100 years of input of P fertilizer and a soil cd concentration of 0.28 mg Cd
kg-1
at t=0. Leaching was estimated for a precipitation excess (F) of 0.1 m yr-1
and soil Cd at t=0 is 0.28 mg Cd kg-1
.
Atmospheric deposition (g Cd ha-1
yr-1
) is abbreviated as AD. CS stands for cropping system, which is either cereals
(C), cereal-potato rotation (CP) or potatoes only (P).
Cd content in P fertilizer (mg Cd (kg P2O5)-1
20 40 60 80
AD CS OC pH pH pH pH
4.5 5.5 5.8 6.5 7.5 4.5 5.5 5.8 6.5 7.5 4.5 5.5 5.8 6.5 7.5 4.5 5.5 5.8 6.5 7.5
0.00
C
2 -53 -19 -12 -3 2 -50 -14 -8 1 7 -47 -10 -3 6 12 -43 -6 1 11 17
2.5 -47 -15 -10 -2 2 -43 -11 -5 3 7 -40 -6 -1 7 12 -36 -2 4 12 17
3 -42 -13 -8 -1 3 -38 -8 -4 3 7 -35 -4 1 8 12 -31 1 6 13 17
4 -35 -10 -6 0 3 -31 -5 -1 5 8 -27 -1 4 9 13 -23 4 8 14 18
CP
2 -53 -19 -13 -4 2 -49 -13 -6 3 8 -44 -7 0 9 15 -39 -1 6 16 22
2.5 -47 -15 -10 -2 2 -42 -9 -4 4 9 -37 -3 2 11 15 -32 3 9 17 22
3 -42 -13 -8 -2 2 -37 -7 -2 5 9 -32 -1 4 12 16 -27 5 11 18 22
4 -34 -10 -6 0 3 -29 -4 1 6 9 -24 3 7 13 16 -18 9 13 19 23
P
2 -51 -16 -10 -1 5 -44 -7 0 9 15 -37 2 9 19 25 -30 12 19 29 36
2.5 -44 -13 -7 1 5 -37 -3 3 11 15 -29 6 12 21 26 -22 16 22 31 36
3 -39 -10 -5 1 5 -31 -1 4 12 16 -24 9 14 22 26 -16 18 24 32 36
4 -32 -7 -3 3 6 -24 3 7 13 16 -15 12 17 23 26 -7 22 27 33 37
0.35
C
2 -51 -15 -9 1 6 -47 -11 -4 5 11 -44 -6 0 10 16 -41 -2 5 15 21
2.5 -44 -12 -6 2 6 -40 -7 -2 7 11 -37 -3 3 11 16 -33 2 8 16 21
3 -39 -9 -4 3 7 -35 -5 0 7 12 -31 0 5 12 16 -28 4 10 17 21
4 -31 -6 -2 4 7 -27 -1 3 9 12 -23 3 8 13 17 -20 8 12 18 22
CP
2 -50 -15 -9 0 6 -46 -9 -3 7 12 -41 -3 3 13 19 -37 3 10 20 26
2.5 -44 -12 -6 2 6 -39 -6 0 8 13 -34 0 6 15 19 -29 6 12 21 26
3 -39 -9 -4 2 6 -34 -3 2 9 13 -29 3 8 16 20 -23 9 15 22 26
4 -31 -6 -2 4 7 -26 0 4 10 13 -21 7 11 17 20 -15 13 17 23 27
P
2 -48 -12 -6 3 9 -41 -3 4 13 19 -34 6 13 23 29 -27 15 23 33 40
2.5 -41 -9 -3 5 9 -34 0 6 15 19 -26 10 16 25 30 -19 19 26 35 40
3 -36 -7 -2 5 9 -28 3 8 16 20 -21 13 18 26 30 -13 22 28 36 40
4 -29 -3 1 7 10 -20 7 11 17 20 -12 16 21 27 30 -4 26 31 37 41
0.70
C
2 -48 -11 -5 5 10 -45 -7 0 9 15 -41 -3 4 14 20 -38 2 9 19 25
2.5 -41 -8 -2 6 10 -38 -4 2 11 15 -34 1 7 15 20 -30 5 11 20 25
3 -36 -5 0 7 11 -32 -1 4 11 16 -28 4 9 16 21 -25 8 13 21 25
4 -28 -2 2 8 11 -24 3 7 13 16 -20 7 11 18 21 -16 12 16 22 26
CP
2 -48 -12 -5 4 10 -43 -6 1 11 16 -38 0 7 17 23 -34 6 13 24 30
2.5 -41 -8 -3 5 10 -36 -2 4 12 17 -31 4 10 19 23 -26 10 16 25 30
3 -36 -6 -1 6 10 -31 1 6 13 17 -25 7 12 19 24 -20 13 18 26 30
4 -28 -2 2 8 11 -23 4 8 14 17 -17 10 15 21 24 -12 17 21 27 31
P
2 -45 -9 -2 7 13 -38 0 7 17 23 -31 10 17 27 33 -24 19 26 37 44
2.5 -39 -5 0 8 13 -31 4 10 19 23 -23 13 20 29 34 -16 23 29 39 44
3 -33 -3 2 9 13 -25 7 12 19 24 -17 16 22 30 34 -10 26 32 40 44
4 -25 1 5 11 14 -17 10 15 21 24 -9 20 25 31 35 -1 30 35 41 45

Revisiting and updating the effect of P fertilizers Fertilizers Europe
57
Table A. 2 The long-term change in soil Cd after 100 years of input of P fertilizer and a soil cd concentration of 0.28 mg Cd
kg-1
at t=0. Leaching was estimated for a precipitation excess (F) of 0.2 m yr-1
and soil Cd at t=0 is 0.28 mg Cd kg-1
.
Atmospheric deposition (g Cd ha-1
yr-1
) is abbreviated as AD. CS stands for cropping system, which is either cereals
(C), cereal-potato rotation (CP) or potatoes only (P).
Cd content in P fertilizer (mg Cd (kg P2O5)-1
20 40 60 80
AD CS OC pH pH pH pH
4.5 5.5 5.8 6.5 7.5 4.5 5.5 5.8 6.5 7.5 4.5 5.5 5.8 6.5 7.5 4.5 5.5 5.8 6.5 7.5
0.00
C
2 -79 -37 -27 -11 -1 -76 -33 -27 -11 -1 -74 -29 -18 -1 9 -72 -25 -14 3 14
2.5 -73 -31 -22 -8 0 -70 -31 -22 -8 0 -67 -23 -14 1 10 -65 -19 -9 6 15
3 -62 -27 -19 -7 1 -65 -27 -19 -7 1 -62 -19 -10 3 11 -59 -15 -6 7 15
4 -59 -22 -15 -5 2 -56 -23 -15 -5 2 -52 -13 -6 5 11 -49 -9 -1 10 16
CP
2 -78 -37 -27 -11 -1 -75 -37 -27 -11 -1 -72 -26 -15 2 12 -68 -21 -10 8 19
2.5 -72 -31 -22 -8 0 -69 -31 -22 -8 0 -65 -20 -11 4 13 -61 -15 -5 11 20
3 -67 -27 -19 -7 1 -63 -27 -19 -7 1 -59 -16 -7 6 14 -55 -10 -1 12 20
4 -58 -22 -15 -5 1 -54 -22 -15 -5 1 -50 -10 -3 8 15 -45 -4 3 15 21
P
2 -77 -34 -24 -8 2 -72 -34 -24 -8 2 -66 -18 -6 12 23 -61 -9 2 21 33
2.5 -70 -29 -20 -6 3 -65 -29 -20 -6 3 -59 -12 -1 14 24 -53 -3 8 24 34
3 -65 -25 -16 -4 4 -59 -25 -16 -4 4 -53 -7 2 16 24 -47 2 11 26 34
4 -56 -19 -12 -2 4 -50 -19 -12 -2 4 -43 -1 7 18 25 -36 8 16 28 35
0.35
C
2 -77 -33 -23 -7 4 -74 -33 -23 -7 4 -72 -26 -15 15 13 -70 -22 -11 7 18
2.5 -71 -28 -19 -4 4 -68 -28 -19 -4 4 -65 -20 -10 18 14 -63 -16 -6 9 19
3 -65 -24 -16 -3 5 -62 -24 -16 -3 5 -59 -16 -7 20 15 -56 -12 -2 11 19
4 -56 -18 -11 -1 6 -53 -18 -11 -1 6 -50 -10 -2 22 15 -47 -5 2 14 20
CP
2 -76 -33 -23 -7 3 -73 -33 -23 -7 3 -70 -23 -12 6 16 -66 -17 -6 12 23
2.5 -70 -28 -19 -4 4 -66 -28 -19 -4 4 -63 -20 -10 8 18 -59 -11 -1 14 24
3 -65 -24 -16 -3 5 -61 -24 -16 -3 5 -57 -13 -4 10 18 -53 -7 2 16 24
4 -56 -18 -11 -1 5 -52 -18 -11 -1 5 -47 -7 1 12 19 -43 -1 7 19 25
P
2 -75 -31 -20 -4 6 -70 -31 -20 -4 6 -64 -14 -3 27 27 -59 -6 6 25 37
2.5 -68 -25 -16 -2 7 -63 -25 -16 -2 7 -57 -8 2 27 27 -51 0 11 28 38
3 -63 -21 -13 0 8 -57 -21 -13 0 8 -51 -4 6 28 28 -44 5 15 30 38
4 -54 -16 -8 2 8 -47 -16 -8 2 8 -40 3 10 29 29 -34 12 20 32 39
0.70
C
2 -75 -30 -20 -3 8 -72 -30 -20 -3 8 -70 -23 -11 17 17 -68 -19 -7 11 22
2.5 -68 -25 -15 -1 8 -66 -25 -15 -1 8 -63 -17 -7 18 18 -60 -13 -2 13 23
3 -63 -21 -12 1 9 -60 -21 -12 1 9 -57 -12 -3 19 19 -54 -8 1 15 23
4 -54 -15 -7 3 10 -50 -15 -7 3 10 -47 -6 2 19 19 -44 -2 6 17 24
CP
2 -74 -30 -20 -3 7 -71 -30 -20 -3 7 -68 -20 -8 20 20 -64 -14 -3 16 27
2.5 -68 -25 -15 -1 8 -64 -25 -15 -1 8 -61 -14 -4 21 21 -57 -8 2 18 28
3 -62 -21 -12 1 9 -58 -21 -12 1 9 -54 -9 0 22 22 -50 -4 6 20 28
4 -53 -15 -8 3 9 -49 -15 -8 3 9 -45 -3 5 23 23 -40 3 11 22 29
P
2 -73 -28 -17 0 10 -68 -28 -17 0 10 -62 -11 1 31 31 -57 -3 9 29 41
2.5 -66 -22 -13 2 11 -60 -22 -13 2 11 -55 -5 6 31 31 -49 3 15 31 42
3 -60 -18 -9 4 12 -54 -18 -9 4 12 -48 0 9 32 32 -42 8 18 33 42
4 -51 -12 -5 6 12 -44 -12 -5 6 12 -38 6 14 33 33 -31 15 24 36 43

Revisiting and updating the effect of P fertilizers Fertilizers Europe
58
Table A. 3 The long-term change in soil Cd after 100 years of input of P fertilizer and a soil cd concentration of 0.28 mg Cd
kg-1
at t=0. Leaching was estimated for a precipitation excess (F) of 0.3 m yr-1
and soil Cd at t=0 is 0.28 mg Cd kg-1
.
Atmospheric deposition (g Cd ha-1
yr-1
) is abbreviated as AD. CS stands for cropping system, which is either cereals
(C), cereal-potato rotation (CP) or potatoes only (P).
Cd content in P fertilizer (mg Cd (kg P2O5)-1
20 40 60 80
AD CS OC pH pH pH pH
4.5 5.5 5.8 6.5 7.5 4.5 5.5 5.8 6.5 7.5 4.5 5.5 5.8 6.5 7.5 4.5 5.5 5.8 6.5 7.5
0.00
C
2 -90 -51 -38 -17 -3 -88 -47 -35 -13 2 -86 -44 -31 -8 7 -84 -40 -27 -4 11
2.5 -86 -44 -33 -14 -2 -84 -41 -29 -10 3 -82 -37 -25 -5 8 -79 -33 -21 -1 13
3 -81 -39 -29 -12 -1 -79 -36 -25 -7 4 -77 -32 -21 -3 9 -75 -28 -17 2 14
4 -74 -32 -23 -9 0 -71 -28 -19 -4 5 -69 -24 -15 1 10 -66 -20 -10 5 15
CP
2 -89 -50 -38 -17 -3 -87 -46 -33 -11 3 -84 -41 -28 -5 10 -82 -36 -23 1 16
2.5 -85 -44 -33 -14 -2 -82 -39 -27 -8 5 -79 -34 -22 -2 11 -77 -29 -16 4 18
3 -81 -39 -29 -12 -1 -78 -34 -23 -6 5 -75 -29 -18 1 12 -72 -24 -12 7 19
4 -73 -32 -23 -9 0 -70 -27 -17 -3 6 -66 -21 -11 4 13 -63 -16 -6 10 20
P
2 -88 -48 -36 -14 0 -84 -41 -28 -5 10 -80 -33 -20 4 20 -77 -26 -11 13 30
2.5 -84 -42 -30 -11 1 -79 -34 -22 -2 11 -75 -26 -13 8 21 -70 -19 -5 17 31
3 -79 -37 -26 -9 2 -75 -29 -17 1 12 -70 -21 -9 10 22 -65 -13 0 20 32
4 -72 -30 -20 -6 3 -66 -21 -11 4 13 -61 -13 -2 14 23 -55 -4 7 23 34
0.35
C
2 -88 -48 -35 -14 1 -87 -44 -31 -9 6 -85 -41 -28 -5 11 -83 -37 -24 0 15
2.5 -84 -41 -30 -10 2 -82 -38 -26 -6 7 -80 -34 -17 -1 12 -78 -30 -18 3 17
3 -80 -36 -25 -8 3 -77 -32 -21 -3 8 -75 -29 -11 1 13 -73 -25 -13 6 18
4 -72 -29 -19 -5 4 -69 -25 -15 0 9 -66 -21 -22 4 14 -64 -17 -7 9 19
CP
2 -88 -47 -35 -14 1 -85 -43 -30 -8 7 -83 -38 -25 -2 14 -80 -33 -19 4 20
2.5 -83 -41 -30 -10 2 -81 -36 -24 -4 9 -78 -31 -19 2 15 -75 -26 -13 8 22
3 -79 -36 -25 -8 3 -76 -31 -20 -2 9 -73 -26 -14 4 16 -70 -21 -9 10 23
4 -71 -29 -20 -5 4 -68 -23 -14 1 10 -64 -18 -8 8 17 -61 -13 -2 14 24
P
2 -87 -45 -33 -11 4 -83 -38 -24 -2 14 -87 -31 -16 8 24 -75 -23 -8 17 34
2.5 -82 -39 -27 -8 5 -78 -31 -19 2 15 -82 -23 -10 11 25 -69 -16 -2 21 35
3 -77 -34 -23 -5 6 -73 -26 -14 4 16 -77 -18 -5 14 26 -63 10 3 24 36
4 -69 -26 -17 -2 7 -64 -18 -8 8 17 -69 -9 1 17 27 -53 -1 10 27 38
0.70
C
2 -87 -45 -32 -10 5 -85 -41 -28 -5 10 -87 -38 -24 -1 15 -81 -35 -21 3 19
2.5 -82 -38 -26 -7 6 -80 -35 -22 -2 11 -82 -31 -18 2 16 -76 -27 -14 7 21
3 -78 -33 -22 -4 7 -75 -29 -18 0 12 -78 -25 -14 5 17 -71 -22 -10 9 22
4 -70 -26 -16 -1 8 -67 -22 -12 4 13 -70 -18 -7 8 18 -62 -14 -3 13 23
CP
2 -86 -45 -32 -10 5 -84 -40 -27 -4 11 -86 -35 -21 2 18 -79 -30 -16 8 24
2.5 -82 -38 -26 -7 6 -79 -33 -21 -1 13 -82 -28 -15 5 19 -73 -23 -10 12 26
3 -77 -33 -22 -4 7 -74 -28 -16 2 13 -77 -23 -11 8 20 -68 -17 -5 14 27
4 -69 -26 -16 -1 8 -66 -20 -10 5 14 -69 -15 -4 11 21 -58 -9 1 18 28
P
2 -85 -42 -29 -7 8 -81 -35 -21 2 18 -85 -28 -13 11 28 -74 -20 -5 21 38
2.5 -81 -36 -24 -4 9 -76 -28 -15 6 19 -81 -20 -7 15 29 -67 -13 2 24 39
3 -76 -30 -19 -2 10 -71 -22 -11 8 20 -76 -14 -2 18 30 -61 -6 7 27 40
4 -67 -23 -13 2 11 -62 -15 -4 11 21 -67 -6 5 21 31 -51 2 14 31 42