revisiting out-of-pocket requirements: trends in spending
TRANSCRIPT

RESEARCH ARTICLE Open Access
Revisiting out-of-pocket requirements:trends in spending, financial access barriers,and policy in ten high-income countriesThomas Rice1, Wilm Quentin2, Anders Anell3, Andrew J. Barnes4, Pauline Rosenau5, Lynn Y. Unruh6
and Ewout van Ginneken7*
Abstract
Background: Countries rely on out-of-pocket (OOP) spending to different degrees and employ varying techniques.The article examines trends in OOP spending in ten high-income countries since 2000, and analyzes theirrelationship to self-assessed barriers to accessing health care services. The countries are Australia, Canada, France,Germany, the Netherlands, New Zealand, Norway, Sweden, Switzerland, the United Kingdom, and the United States.
Methods: Data from three sources are employed: OECD statistics, the Commonwealth Fund survey of individuals ineach of ten countries, and country-specific documents on health care policies. Based on trends in OOP spending,we divide the ten countries into three groups and analyze both trends and access barriers accordingly. As part ofthis effort, we propose a conceptual model for understanding the key components of OOP spending.
Results: There is a great deal of variation in aggregate OOP spending per capita spending but there has beenconvergence over time, with the lowest-spending countries continuing to show growth and the highest spendingcountries showing stability. Both the level of aggregate OOP spending and changes in spending affect perceivedaccess barriers, although there is not a perfect correspondence between the two.
Conclusions: There is a need for better understanding the root causes of OOP spending. This will require data collectionthat is broken down into OOP resulting from cost sharing and OOP resulting from direct payments (due tounderinsurance and lacking benefits). Moreover, data should be disaggregated by consumer groups (e.g. income-level orhealth status). Only then can we better link the data to specific policies and suggest effective solutions to policy makers.
Keywords: Access, Coinsurance, Copayments, Deductibles, Cost-sharing, Comparative health systems, Out-of-pocket costs
BackgroundAll countries rely on out-of-pocket (OOP) spending to helpfund their health care systems. OOP spending includesboth direct payments made for uncovered services (due tolack of insurance or lacking benefits) and cost sharingrequirements such as coinsurance and deductibles. It servestwo main purposes: as a source of revenue, and to helpreduce demand for services. However, controversy sur-rounds OOP payments and opponents typically voice twoconcerns. Charging people for their medical care meansthat those with the greatest need, and those with the lowest
income, will feel the brunt. Moreover, patients may forgonecessary care - in contrast to other forms of financingsuch as taxes and premiums, which cannot be avoided byforgoing health care.In recent years there is a perception that in many coun-
tries costs are being shifted to patients. Policy interest,therefore, is high, but there has been little cross-countryresearch on actual trends in OOP spending or on consumerperceptions of reductions in access that result from higherOOPs. The purpose of this article is to: (a) systematicallyassess trends in OOP spending in ten prominent high-income countries as well as trends in people’s perception ofany resulting impediments regarding accessing needed
* Correspondence: [email protected] Observatory on Health Systems and Policies, Berlin University ofTechnology, Straße des 17. Juni 135, 10623 Berlin, GermanyFull list of author information is available at the end of the article
© The Author(s). 2018 Open Access This article is distributed under the terms of the Creative Commons Attribution 4.0International License (http://creativecommons.org/licenses/by/4.0/), which permits unrestricted use, distribution, andreproduction in any medium, provided you give appropriate credit to the original author(s) and the source, provide a link tothe Creative Commons license, and indicate if changes were made. The Creative Commons Public Domain Dedication waiver(http://creativecommons.org/publicdomain/zero/1.0/) applies to the data made available in this article, unless otherwise stated.
Rice et al. BMC Health Services Research (2018) 18:371 https://doi.org/10.1186/s12913-018-3185-8
medical care; and (b) discuss some of the policies respon-sible for these trends. As part of this effort, we propose aconceptual model for understanding the key componentsof OOP spending.The four most relevant previous studies published
since 2010 are presented in Table 1 [1–4]. The one mostsimilar to the current study [4], by Zare and Anderson,examines four of the ten countries in the current study,although in the U.S. it examines only the Medicare pro-gram and has a somewhat shorter time period (2000–2010). Our study differs from previous ones in severalimportant ways that extends our understanding of OOPpayments trends across countries. Most previous re-search considers OOP spending only in terms of costsharing policies. This overlooks the important role ofdirect payments for uncovered services, which in somecountries may play a larger role in OOP spending, asdoes the complicated interplay with Voluntary HealthInsurance. Such insurance strongly affects levels of OOPspending. In addition, this study examines recentchanges in OOP policy in each country. Moreover, un-like previous research, we examine the financial barriersof OOP spending with regard to reducing access to care.
Overall, the study attempts to link three things: aggre-gate trends in spending, perceived barriers to access, andgovernmental health policies.
MethodsChoice of countries and time periodOur choice of countries was based on the data availablefor self-reported access barriers due to OOP spending.To assess these barriers, we use a long time-series ofhousehold survey data collected by the CommonwealthFund. This survey now includes data from 11 countries:Australia, Canada, France, Germany, the Netherlands,New Zealand, Norway, Sweden, Switzerland, the U.K.,and the U.S. For the quantitative analysis of trends inspending and perceived access barriers, we include all 11countries. When describing policy changes since 2000,however, we exclude New Zealand because of the diffi-culty of obtaining accurate historical policy data. TheEuropean Observatory for Health Systems and Policiesregularly publishes updated books on developments inhealth policy in its Health Systems in Transition series.While the other countries’ books have all been updatedsince 2011, New Zealand’s book dates back to 2001 [5].
Table 1 Recent Previous Research on Out-of-Pocket Spending
Study Countries Data/Variable Key Findings Relevance
Baird, 2016 [1] Australia, France, Israel,Japan, Poland, Russia,Slovenia, Switzerland,United States
Individual survey on OOPspending compared to incomefrom Luxembourg Income Study(2010 for most countries)
• In median country, 13% ofpeople spend more than 10%of income in OOP.
• Varies from 3% (France) to17% (Switzerland).
• Poor and elderly at greatestrisk of cata-strophic spending.
• Focuses on percentageof population with highOOP spending duringa single year.
• Emphasizes groupsthat are most financiallyvulnerable.
• Does not examinecountries’ health policies.
• Does not examineperceived barriers onaccess to care.
Palladino et al.,2016 [2]
Austria, Belgium, CzechRepublic, Denmark, France,Germany, Netherlands,Spain, Sweden, Switzerland
Survey of people age 50 andolder from Health, Ageing andRetirement in Europe, withdata on changes in OOPspending and experiencingcatastrophic OOP spending(30% or more of income),from 2006/7 to 2013(Great Recession)
• Very large range in changesin OOP spending (− 11% inNetherlands to + 101% in Austria).
• Increase in catastrophic spending:from 2.3 to 3.9% over study period.
• People age 50 and older spentmore in 8 of11 countries.
• Countries do provide financialprotection for poor.
• Focuses on changes inOOP spending duringlimited time period.
• Does not examinecountries’ health policies.
• Does not examineperceived barrierson access to care.
Tambor et al.,2011 [3]
27 countries in theEuropean Union
Review of internationaldata bases, laws andregulations, and reportson changes in patientcost sharing requirementssince 1990
• Cost-sharing requirements vary agreat deal between countries, andhave increased significantly in many.
• Tax-based systems more likely touse co-payments, insurance-basedsystems more likely to use deductiblesand coinsurance.
• Almost all countries have policiesto protect the poorest and/or sickest.
• Focuses on healthpolicies in countries,but little detail provided.
• Includes extremelydiverse set of countries.
• Does not examineperceived barrierson access to care.
Zare & Anderson,2013 [4]
France, Germany, Japan,United Kingdom, UnitedStates (Medicare only)
Various data sets from OECD, WHO,European Observatory, and country-specific reports, time period 2000–2010;separately examine cost sharing forpharmaceuticals, inpatient, andambulatory care
• Inflation-adjusted OOP spending, andspending divided by income, increasedin all countries.
• Percent of total national health carepaid OOP declined in most countriesdue to protection mechanisms forpoor and/or sick.
• Focuses on healthpolicies in 5 countries.
• Does not examineperceived barrierson access to care.
Rice et al. BMC Health Services Research (2018) 18:371 Page 2 of 18

The study time frame varies for different parts of ourstudy. When examining aggregate data from the OECDand Commonwealth Fund, we consider the date rangefrom 2000 to the most recent time period. When exam-ining details about how OOP costs have changed in theindividual countries, data back to 2000 was not alwaysavailable. Therefore, we focused on an approximately10-year period, beginning in 2005 for most countries.
Conceptualizing out-of-pocket costsDefinition of termsThis study conceptualizes OOP spending as the sum ofcost sharing requirements for covered or insured ser-vices, direct payments for uncovered/uninsured services,and informal payments. It does not include premiumpayments. Because informal payments are negligible inour set of countries, we do not consider them further.There are three issues, however, that complicate imple-menting this definition.The first concerns the use of aggregate annual OOP
spending vs. spending for an individual service. Later inthe article, we show that in many of the ten countriesexamined here, inflation-adjusted, aggregate OOP spend-ing has not risen very much over the past decade. This issometimes assumed to mean that OOP expenses are nota growing problem. This is not correct, however. If costsharing requirements increase, people may respond byusing fewer services, which obscures the true impact ofgrowing cost sharing requirements because lower usagewill result in lower aggregate OOP payments. The moreappropriate way to examine whether people are facingan increase in the financial barriers that result fromOOP payments is to examine how coverage and benefitpolicies as well as cost sharing requirements are chan-ging over time, not how much aggregate OOP paymentsare changing. This is discussed in more detail below andpresented graphically in Fig. 1.A second issue relates to disentangling the role of vol-
untary health insurance (VHI). These products serve avariety of purposes, depending upon country. The mostbasic and common forms include supplementary VHI,which pays for services that are not covered by the na-tional health plan (e.g., dental care), and complementaryVHI, which pays for cost-sharing requirements forservices covered in the national plan (if allowed undernational legislation, as it is often seen as underminingthe utilization-reduction effect). In some countries, VHImay also serve as a primary (“substitutive”) insurancecoverage scheme. Finally, VHI sometimes can help pa-tients get access to care without waiting as long asothers who are obtaining public care but who lack VHI.If services are paid for by VHI, they do not constituteOOP spending. But lower OOP spending does notnecessarily mean lower financial barriers, as it may be
more costly in premiums to purchase VHI than tosimply pay the OOP.Finally, we do not examine OOP spending for long-
term care (LTC), for two reasons. First, the countriesexamined have very different LTC schemes with widelydiverging rules regarding patient responsibility for LTCcosts, such that it was not possible to summarize theserequirements without a large number of caveats. Second,LTC costs, to a large extent, fall only on one segment ofthe population – the elderly.
Analytic frameworkWith these issues in mind, we propose an analyticalframework that is based on the three-dimensional cubethat was first proposed by Busse et al. 2007 [6, 7] andwhich was subsequently adopted by the WHO in theirWorld Health Report 2010 [8]. The 2007 frameworkcaptures the three dimensions of population coverage(breadth), scope of services (depth) and level of coverage(cost-sharing). Our revision has added the level of OOPand VHI to these dimensions (see Fig. 1). This allows usto systematically analyze the specific sources and com-ponents of OOP payments as well as the role of VHI.The three dimensions, along with related policies, to-
gether determine the level of OOP. The first dimensionis about who is covered (breadth). OOP payments mayarise as a result of direct payments due to lack of insur-ance. The second dimension concerns which servicesare covered (scope). In this case OOP payments occur asdirect payments resulting from lacking benefits/under-insurance. The third dimension relates to what propor-tion of benefit cost is covered (depth). Here, OOPpayments may occur if cost-sharing schemes apply thatrequire insured/covered individuals to pay a share of thebenefit cost. As an important subcategory of OOP pay-ments, cost sharing may take several forms. The mostwell-known are direct methods (copayment, coinsur-ance, and deductibles) and indirect methods (e.g. extrabilling, reference pricing).In the presentation of the study results regarding
“Country-Specific OOP Policies,” below, we employthese concepts of breadth, scope, and depth in present-ing current policy and trends. Ideally, to fully understandthese policies and trends, one would conduct separateanalysis of how three determinants of OOP spendinghave changed over time in each of the ten countries, butthat is beyond the scope of this article and likely wouldfill a lengthy monograph.
Objective trends and perceived access barriersOne of the purposes of this study is to determine if thereis a relationship between objective, aggregate OOPspending and perceptions of barriers to access. Whilethere is certainly face validity to the hypothesis - if
Rice et al. BMC Health Services Research (2018) 18:371 Page 3 of 18

people have to spend more per service, economic the-ory would tell us they will use less - there are reasonsfor suspecting that this sort of causal relationshipmay be mitigated.In the typical international definition, which we em-
ploy here, premiums are not counted towards OOPspending. [9] But premiums, of course, can reduce theuse of needed services. In countries without universalcoverage, like the U.S., premiums form a major barriertowards obtaining coverage [10]. Moreover, through anincome effect, high premiums reduce disposable income,making less income available for purchasing health careservices. A similar scenario relates to taxes. Payrolldeductions for health care coverage, which are commonin many social insurance countries, also reduce dispos-able income. Finally, these same issues apply to VHI:depending on how visible VHI premium payments are tothe individual, they may also be viewed as a barrier toaccessing care.Moving away from definitional concerns, perceived
access burden is likely to be affected by distributionalissues that are difficult to observe in aggregate data.Countries that have a relatively low maximum on indi-vidual OOP expenditures are likely to see these costsspread out more equally among the population, meaningthat fewer people will perceive cost-related access prob-lems. In contrast, if there are high or even non-existentmaximum spending thresholds, then some (sicker)people will be subject to higher spending and are morelikely to experience access burdens. More broadly, acountry’s social safety net is an overarching determinantof perceived access burdens.
Data sources and analysisOECD data on OOP spending, from the years 2000 tothe most recent available, are used to show aggregatetrends in such spending by country. In addition, longitu-dinal, country-specific consumer survey data from theCommonwealth Fund are used as the source of per-ceived financial access problems. Sample sizes rangedfrom 1000 to over 7000, depending on country.However, much of the study data come from individual
country sources (e.g. legislation, national reports). Specif-ically, we sought information on current levels andchanges in both cost sharing requirements and direct pay-ments for uncovered services. One primary source werethe book series, Health Systems in Transition, publishedby the European Observatory on Health Systems andPolicies. [11] Country-specific sources are also used whendiscussing the policy modifications that were responsiblefor changes in OOP spending.Linear regressions were used to test whether trends in
OOP spending differed across countries categorized tohave historically low OOP costs with higher recentgrowth, historically moderate OOP costs with lower re-cent growth, or historically high OOP costs with low tono growth in recent years. In the analyses, the probabil-ity of making a type I error was set to 0.05.
ResultsAggregate trends in OOP spending by countryComparing OOP spending data over time and betweencountries is very difficult due to frequent breaks in thedata, as well as differing definitions and variations inreporting between countries. We aim to compensate in
Fig. 1 Three dimensions determine the level of out-of-pocket spending. Adapted from Busse and Schlette, 2007 [7]
Rice et al. BMC Health Services Research (2018) 18:371 Page 4 of 18
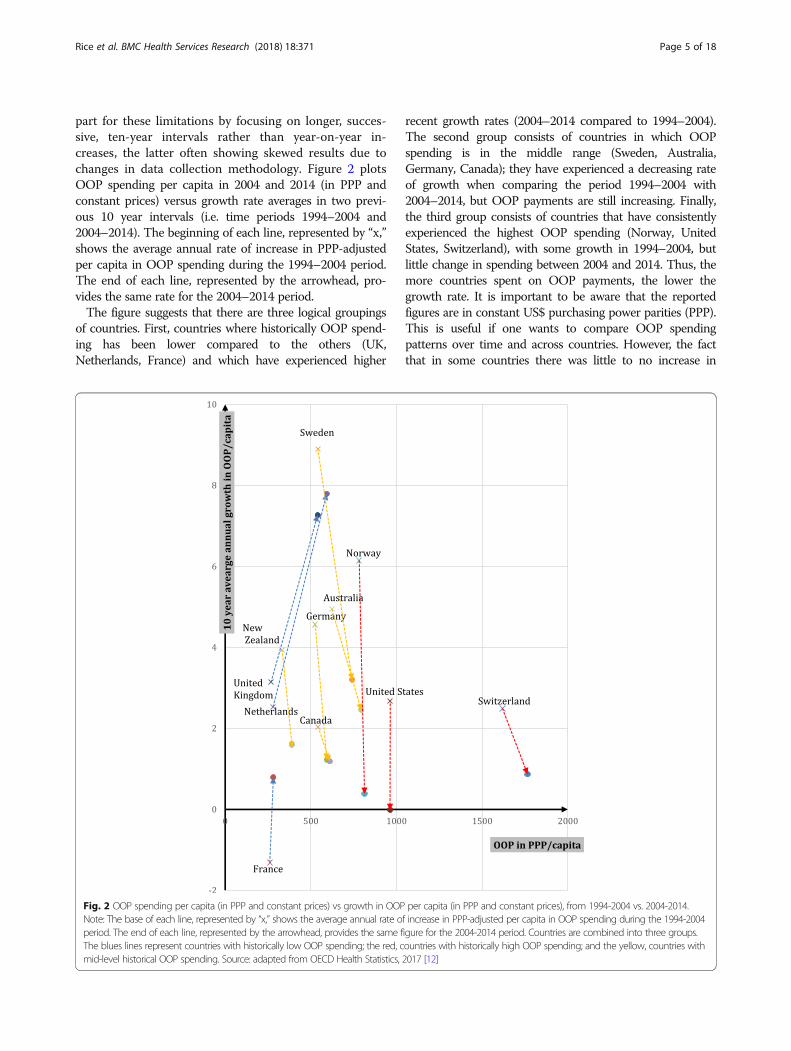
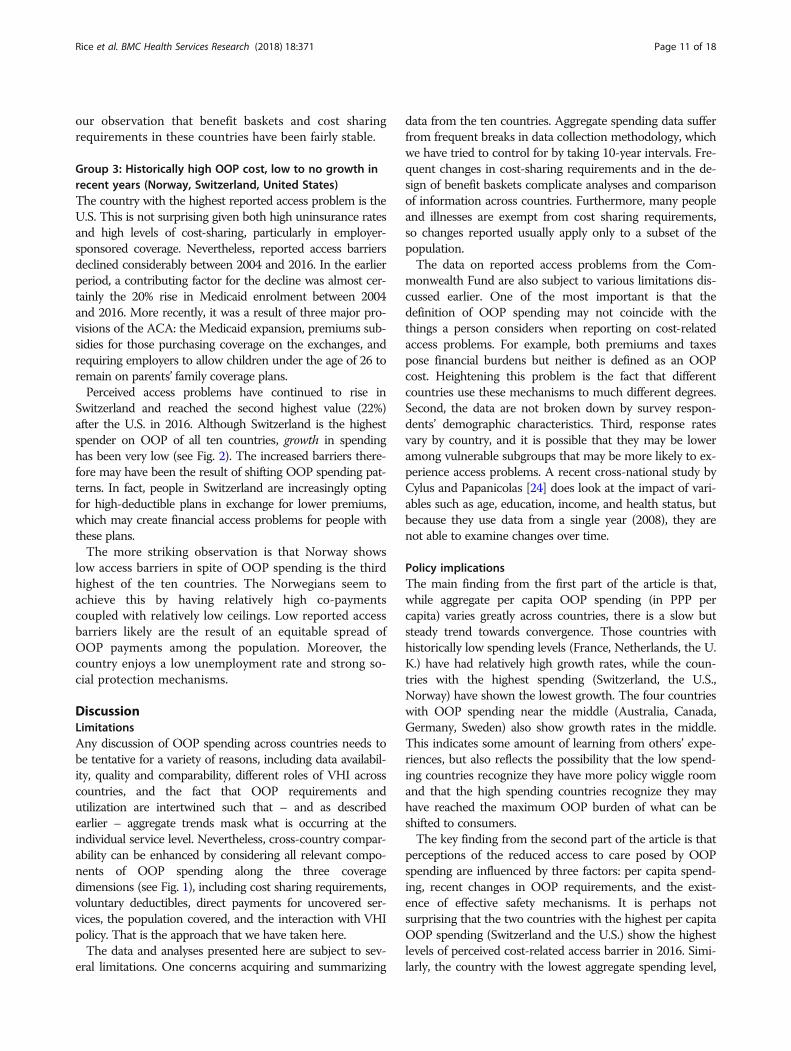
part for these limitations by focusing on longer, succes-sive, ten-year intervals rather than year-on-year in-creases, the latter often showing skewed results due tochanges in data collection methodology. Figure 2 plotsOOP spending per capita in 2004 and 2014 (in PPP andconstant prices) versus growth rate averages in two previ-ous 10 year intervals (i.e. time periods 1994–2004 and2004–2014). The beginning of each line, represented by “x,”shows the average annual rate of increase in PPP-adjustedper capita in OOP spending during the 1994–2004 period.The end of each line, represented by the arrowhead, pro-vides the same rate for the 2004–2014 period.The figure suggests that there are three logical groupings
of countries. First, countries where historically OOP spend-ing has been lower compared to the others (UK,Netherlands, France) and which have experienced higher
recent growth rates (2004–2014 compared to 1994–2004).The second group consists of countries in which OOPspending is in the middle range (Sweden, Australia,Germany, Canada); they have experienced a decreasing rateof growth when comparing the period 1994–2004 with2004–2014, but OOP payments are still increasing. Finally,the third group consists of countries that have consistentlyexperienced the highest OOP spending (Norway, UnitedStates, Switzerland), with some growth in 1994–2004, butlittle change in spending between 2004 and 2014. Thus, themore countries spent on OOP payments, the lower thegrowth rate. It is important to be aware that the reportedfigures are in constant US$ purchasing power parities (PPP).This is useful if one wants to compare OOP spendingpatterns over time and across countries. However, the factthat in some countries there was little to no increase in
Fig. 2 OOP spending per capita (in PPP and constant prices) vs growth in OOP per capita (in PPP and constant prices), from 1994-2004 vs. 2004-2014.Note: The base of each line, represented by “x,” shows the average annual rate of increase in PPP-adjusted per capita in OOP spending during the 1994-2004period. The end of each line, represented by the arrowhead, provides the same figure for the 2004-2014 period. Countries are combined into three groups.The blues lines represent countries with historically low OOP spending; the red, countries with historically high OOP spending; and the yellow, countries withmid-level historical OOP spending. Source: adapted from OECD Health Statistics, 2017 [12]
Rice et al. BMC Health Services Research (2018) 18:371 Page 5 of 18

constant US$PPP does not mean that there was no increasein spending when expressed in the local currency or that noextra cost-sharing requirements were implemented. Forexample, although Norwegian OOP spending growth in theperiod 2004–2014 seems minimal in Fig. 2, OOPs per capitaincreased from approximately 5740 to about 8215 whenexpressed in Norwegian Krone (NOK) [12].To confirm that the three groups did indeed experi-
ence divergent trends depicted in Fig. 2, a linear regres-sion model was used. The results of this test, shown inTable 2, indicate that the three groups of countriesindeed differed in their growth rate in OOP costs percapita in the decade prior to 2004 compared to the dec-ade that followed. Specifically, those with historically lowOOP costs but higher recent growth experienced anaverage increase of 3.63% (group 1), while those withhistorically moderate OOP costs with lower recentgrowth declined (group 2, − 3.00%, p < 0.001), as didthose with historically high OOP costs with low to norecent growth (group 3, − 3.56%, p < 0.001). There wereno significant differences in growth rates between theselatter two country groups.These trends illustrate our first key finding: a gradual
convergence in OOP spending between countries. The con-vergence, of course, is slow in coming, since from a lowbase even a large increase in the percentage growth consti-tutes a relatively small increase in dollar or euro spending,when compared to low growth from a high base.
Country-specific OOP policiesIn this section, we analyze changes in the barriers imposedby OOP payments by examining how policy modificationsaffect the breadth, scope, and depth of coverage over the lastdecade. For an overview of current policies in each countryexcept New Zealand, refer to the Table 1 in Appendix, andfor changes in such policies over the past decade, Table 2 inAppendix. Here we will focus on the changes between 2004and latest available year. We discuss the countries accordingto the three groups as identified in Fig. 2.
Group 1: Historically low OOP costs, higher recent growth(France, Netherlands, UK)OOP spending in France is the lowest among the tencountries and has remained fairly stable in spite of somerecent increases. For decades, France has had broad uni-versal coverage of the population through statutoryhealth insurance and near universal complementarycoverage. This means that OOP does not occur as aresult of lacking breadth or scope, but rather from cost-sharing requirements (depth). Nominal co-payments arecharged for almost all physician services, hospitalservices, auxiliary services, prescription drugs, visioncare, and dental care. Each type of health service has anannual cap of around €54, but these are additive. Gener-ous exemptions from cost sharing payments as well asfree complementary VHI (also through vouchers) existfor the poor, those with chronic illness, and womenmore than five months pregnant. Starting in 2010 allthose with an annual income below €11,611 (reduced to€9825 in 2016) received vouchers to purchase comple-mentary VHI. There is some extra billing for full-timepublic hospital doctors and a few other professionalmedical groups. In 2016 a major change in OOP chargeswas implemented: a daily hospital co-payment of about€18 for medical or surgical procedures that cost inexcess €120. Many patients, however, are exempt fromthese out-of-pocket charges. Overall, growth in OOPseems to relate to small increases in cost sharingrequirements in the form of co-payments.Like France, the Netherlands historically has had very
low per capita OOP spending. OOP spending in theNetherlands mostly is the result of direct payments dueto changes in the benefit basket and various cost sharingrequirements. Unfortunately, OOP spending data cannotbe separated into cost sharing vs. direct payments due tothe health care accounting practices in the Netherlands.Although there have been yearly changes in the benefit bas-ket by adding or removing services and pharmaceuticals, itis nevertheless likely that increases in cost sharing require-ments are responsible for changes in OOP spending, mostlyas a result of rising deductibles. Starting in 2008 a €150deductible was established (exempting GP care, maternitycare, and care for children under 18), and it has increasedmore than 2.5 fold, to €385, in 2016. Moreover, the delistingof certain services (e.g. dental care for adults) may have hadsome effect on increasing direct payments, although theimpact was mitigated by the high rates of participation involuntary health insurance. Direct payments are requiredfor some drugs, adult dental care, and some medical equip-ment, among other things. Indeed, in 2015, 84.1% of all in-sured purchased VHI, which typically covers dental care(73% of Dutch people) and physiotherapy [13].Historically, the U.K. has not systematically excluded
benefits (it rather provides services “to such extent as
Table 2 Differences in Growth in Out of Pocket Costs BetweenCountry Groupings
Predicted Mean PercentChange in OOP/Capita1994–2004 vs. 2004–2014
p-value
Group 1 - Historically lowOOP costs with higherrecent growth
3.63 referencegroup
Group 2 - Historically moderateOOP costs with lowerrecent growth
−3.00 < 0.001
Group 3 - Historically highOOP costs with low to norecent growth
−3.56 < 0.001
Rice et al. BMC Health Services Research (2018) 18:371 Page 6 of 18

[considered] necessary to meet all reasonable requirements”[14]. This means that the relatively high growth in OOP(2nd after the Netherlands) in 2004–2014 must be mostlyascribed to increased cost sharing requirements. Still, percapita OOP spending has been very low by internationalstandards, with only those in France spending less. In-patient and outpatient services are received free at point ofservice in most cases, but there are co-payments for pre-scription drugs that have been growing and amounted to£8.40 per prescription in 2016. These co-payments werecapped at £104 annually in 2009 and remain the sametoday. Furthermore, although the co-payment maximumwas lowered in 2006 (from £384 to £189), there have beenregular increases since then. Similarly, there are co-payments for dental services (the amount of which variesby service). Both drug and dental co-payments have risenby 2% per year since 2005. Children and students, thoseage 60 and above, people with specific medical conditionsand those on low-income schemes are exempted from co-payments for drugs and dental services, and are covered forvision services (which is normally not covered). Unsurpris-ingly, the market for VHI is rather small. Individuals buyVHI to avoid waiting lists, have some choice over the phys-ician they visit, and for more comfortable rooms [15].
Group 2: Historically moderate OOP costs, lower recentgrowth (Australia, Canada, Germany, Sweden)The Australian Medicare system provides universal popula-tion coverage. OOP occurs mostly due to a lack of scope ofbenefits, particularly dental benefits, and various cost shar-ing requirements. Indeed, although the system fully coverscare in public hospitals, it requires co-payments for mostother services as well as care in private hospitals. Per-service co-payments for GPs have grown considerably inrecent years, rising from $AUD 11.8 (€8.02) in 2005 [16] to$AUD 29.56 (€20.10) in 2014 [17], a 2.5-fold increase, withmost of the increase occurring since 2009. Other servicesthat have experienced significant aggregate increases inOOP expenditures over recent years are prescription drugs,specialist care, and dental care. The timing of these changesappears to relate to a change in national government datingfrom 2013. The new government has been attempting toreduce national health outlays. Australia is unusual in thatthe government provides strong incentives for people topurchase private supplementary VHI, and close to half ofthe population does so. VHI typically covers the higher usercharges of private hospitals, and helps reduce co-paymentsfor other services. Significantly, however, it does not coverco-payments for GP services. Interestingly, a recent surveyshows an emerging disillusionment with private insurers, asmembership is declining and 75% of young adults consid-ered downgrading or dropping their policy in the past12 months [18].
The Canadian health system, governed by the CanadaHealth Act of 1984, provides universal population coverage.The benefit package includes inpatient and most outpatientcare but excludes some important categories including out-patient prescription drugs, dental, or vision care. This re-sults in substantial OOP due to direct payments, mostly forpharmaceuticals. It is difficult to generalize much beyondthis because each of the 13 provinces and territorieschooses the extent to which it covers such services. Forexample, each has its own pharmacy benefits program andformulary and the prevalence of complementary VHIcoverage also varies. Complementary insurance coversmany of the potential OOP costs and some provinces re-quire employers to provide it for employees. Furthermore,beginning in 2010 most provinces adopted catastrophicincome-based pharmacy insurance that protects individualsfor catastrophic costs in purchasing medications. In almostall cases the OOP costs for the very poor are coveredthrough a variety of federal and provincial programs. Sincethe number of changes has been limited, OOP has grownmoderately in the period 2004–2014. Some provincial inno-vations stand out. Ontario is implementing publicly fundeduniversal comprehensive drug coverage, called “pharma-care,” for children and youth.The German system provides universal population cover-
age either through social health insurance (SHI) (almost90% of the population) or substitutive VHI. As OOPpolicies of substitutive VHI vary widely (and data is largelyunavailable), we focus on SHI. OOP spending in Germanyis related to both direct payments for services not coveredby SHI (e.g., over-the-counter drugs) and cost-sharing forSHI covered services, but the relative importance of cost-sharing versus direct payments is not known because of thehealth system’s accounting methods. OOP spending abovereference prices for dental care and medical aids can besubstantial; for example, reference prices for dental carecover only about 50% of the costs of standard care. Cost-sharing requirements increased in 2004 for such things asprescription drugs, inpatient care, and physician and dentalcare, while at the same time adult eyeglasses were excludedfrom coverage. Since these increased requirements becameeffective in 2004 they do not affect the average growth ratein the 2004–2014 period and therefore do not contradictthe observed drop in average growth in 2004–2014 com-pared to the 1994–2004 period. The most plausible explan-ation for the low growth in this period is the fact that in2013, co-payments for physician visits were discontinued.The most important protection mechanism against OOPsis the exemption of children under 18 years of age and amaximum cost-sharing limit of 2% of annual income (or1% for patients with severe chronic conditions). This hasremained largely unchanged over the study period.Sweden’s health system provides universal population
coverage for a broad basket of services. The majority of
Rice et al. BMC Health Services Research (2018) 18:371 Page 7 of 18
OOP is thus attributable to cost sharing requirements.These include co-payments for most health services adultsuse in Sweden, including hospitalization. Co-payments forhealth care visits and hospitalization vary across the 21counties although policies have converged over time. Co-payments are differentiated to steer patients towards useof primary care during office hours. Co-payments forvisits to specialist doctors without a referral are abouttwice as much as for a regular visit to a primary care doc-tor. In most counties children below age 20 are exemptfrom co-payments. There is a combined cap for each12 month period determined at the national level, maxi-mizing total co-payments for outpatient care. Deductibles,co-payments and caps for prescription drugs and dentalcare are determined fully at the national level. Dental carefor individuals under age 22 is free. For adults, there is adeductible of SEK 1000 (€103) for prescription drugsfollowed by a stepwise increase in subsidies ending in a12 months cap of SEK 2200 (€226). For dental care toadults, the deductible is SEK 3000 (€308), followed by in-crease in co-insurance to 85% above SEK 15,000 but with-out an overall cap. Additional minor changes in terms ofadditional subsidies for dental care to elderly were intro-duced in 2013. In 2009, prescription cost-sharing policywas changed such that patients now usually pay the fullprice for generic alternatives that are not the lowest costgeneric. In 2012 cost-sharing limits on prescriptions aswell as for outpatient services were increased (from SEK1800 to SEK 2200 (€ 185–226) and SEK 900 to SEK 1100(€ 92–113) respectively). These increased cost sharing re-quirements seem not to have had great impact on theaverage growth rate in 2004–2014, which was lower thanin the previous period. This can perhaps be explained bythe fact that the requirements were relatively minor andpartially offset by better dental benefits.
Group 3: Historically high OOP cost, low to no growth inrecent years (Norway, Switzerland, United States)Norwegians enjoy universal population coverage for a broadbasket of benefits. OOP payments relate to cost sharing formost health care services with the exception of inpatientcare. The majority of acute-care OOP payments are associ-ated with outpatient care, dental care, and prescription druguse. Cost sharing requirements have not changed much inthe past decade and OOP spending has remained at a stableyet high level. Requirements are set nationally for designatedservices and populations. For example, general practitionerand outpatient specialist co-payments were NOK 152/201(€16/21) (depending on level of education of GP) and NOK345 (€37) in 2017. Prescription drugs deemed essential andon an approved list called the “blue list” can cost as much asNOK 520 (€55) per prescription. Two different cost-sharingceilings are set by Parliament annually. The first ceiling wasNOK 2205 (€234) in 2017 and is a limit on cost-sharing
amounts paid to physicians, psychologists, hospital care, radi-ology and blue-list drugs. The second ceiling was NOK 1990(€211) in 2017 and limits OOP spending on physiotherapists,eligible dental care (identified conditions), some rehabilita-tion services, and treatment abroad (if referred by OsloUniversity hospital). Certain diseases (e.g. many communic-able disease) and patients (e.g. children, the disabled, preg-nant women) are subject to reduced or no cost-sharing whileservices like adult dental care face the highest cost-sharing.The Swiss system provides universal population coverage
for a broad basket of services. There have been somechanges to cost-sharing requirements in Switzerland sincethe early 2000’s. In 2004, the minimum deductible increasedfrom CHF230 (€210) to CHF300 (€275) and the maximumdeductible increased in 2005 from CHF1500 (€1373) toCHF2500 (€2288). In 2006, coinsurance increased to 20%for brand drugs if a cheaper generic is available. Direct pay-ments were affected by the exclusion of eye glasses fromcoverage in 2011, and the inclusion of complementary andalternative medicine into the benefits package in 2012. Infact, direct payments account for about 80% of all OOPs.Given the diversity of insurance plans in Switzerland the re-liance on OOPs is also affected by changes in choices madeby those purchasing coverage. The share of the populationopting for insurance plans with higher deductibles (in ex-change for lower premiums) has increased considerably overtime. For example, the proportion with a deductible of morethan CHF2000 (€1830), increased from less than 15% in2009 to almost 23% in 2014. Over the same period of time,the proportion of the population opting for insurance planswith limited choice of providers increased from about 35%to about 62% as a result of similar attempts to exert down-ward pressures on premiums through benefit design.The United States is the only country of the ten that has
substantial OOP costs due to direct payments resultingfrom uninsurance. However, these costs have almostcertainly gone down during the Obama administration be-cause many people obtained coverage under the AffordableCare Act (ACA), which expanded the scope of the Medic-aid program for the poor in many states and mandatedpeople not covered elsewhere to insure themselves throughinsurance exchanges. As a result uninsurance among theadult population age 18 and older dropped from 17.1% in2013 to 11.0% in 2016 [19]. (The rate is closer to 9% whenthe entire population is included since children’s uninsur-ance rates are lower.) Still, many Americans lack insurancecoverage and pay for all costs out of pocket.Unlike other high-income countries, Americans receive
insurance benefits through a number of sources: employers,Medicare (seniors and the disabled), Medicaid (low-incomepersons and some disabled), and through individual cover-age, some of which is purchased from private insurers in theACA’s insurance exchanges. OOP payments are best consid-ered within each of the main coverage types.
Rice et al. BMC Health Services Research (2018) 18:371 Page 8 of 18
� Medicaid covers a very wide scope of services andthis coverage is deep, with minimal cost sharingrequirements. As noted, the breadth of programcoverage has risen dramatically in recent years,particularly due to expansion under the ACA,doubling from 35 million people in 2000 to 70million in 2016. One of the main problems is thatphysician payment rates are so low in some statesthat it is difficult for program enrolees to findprimary care and specialist physicians to treat them.
� The breadth of Medicare coverage is nearlyuniversal in the age 65+ population; the programcovers many disabled people as well. Since 2006,with the implementation of prescription drugbenefits, nearly all types of services are covered.Depth of coverage is relatively low with coinsurancerates as high as 20% for physician services and noout-of-pocket ceiling. As a result, 86% of Medicarebeneficiaries have supplemental coverage [20] to payfor many coverage gaps. Sources include subsidizedcoverage from former employers, unsubsidized“Medigap” private insurance coverage (which ismainly complementary), and Medicaid for thosewith low incomes. Cost sharing requirementschange only modestly year to year.
� Just over half of insured Americans receive coveragethrough employers. The scope of services coveredtends to be broad. However, cost sharing requirementsin such plans have risen steeply in recent years. Themost dramatic changes have been for deductibles. Onaverage, annual deductibles for employees who are onlycovering themselves have gone up almost 2.5-fold,from $602 in 2005 to $1478 in 2016. There have alsobeen substantial increases in the maximum OOP costsbeneficiaries can incur each year. In 2005, 33% ofemployees had a maximum of $3000 or more. But in2016, this had risen to 66%. Depending on the insurerand type of service, employees are also subject tocoinsurance or co-payments, but these requirementshave been relatively stable over time except for brand-name drugs that are not on an insurer’s formulary.Most employees do not have coverage for dental careand vision services; for those that do, cost sharingrequirements changed little over the past 10 years.There is no major market for complementary coverage.The main supplementary coverage is for dental care.
� Beginning in 2014, individuals have also obtainedcoverage on the ACA’s insurance exchanges.Deductibles are quite high in the most commonlypurchased “Silver” plans, averaging almost $3600 in2017 [21].
U.S. cost-sharing has been rising mostly in theemployment-based markets. The reasons for rising
deductibles are straightforward: they provide a way of mod-erating premium increases – which have risen much moreslowly than deductibles. In view of these deductible in-creases, the most likely explanation for relatively stable ag-gregate OOPs shown in Fig. 2 is that OOP growth resultingmainly from deductible increases has been compensated (inthe aggregate) by lower utilization. A second reason is thatthe expansion of Medicaid under the ACA has offset somethe aggregate effects of the employer and individual marketdeductible increases since Medicaid has few cost-sharingrequirements. Finally, most people who originally obtainedcoverage on the ACA exchanges were previously uninsured[22], so the ACA resulted in a net reduction in thesepeople’s OOP spending.
Perceived access problems and the role of OOP spendingMany factors determine whether people will report thatthey experienced a cost-related access problem. Wefocus on its relationship to levels and changes in OOPspending but other factors - not examined in this study -can be important as well. Earlier we mentioned expensesthat are not included in the definition of OOP spending,such as insurance premiums and taxes, may affect re-sponses to questions about perceived reduction in accessto care. But beyond the definitional, individual character-istics such as current socioeconomic status, changes inthat status, income distribution, employment, andcountry-specific differences in attitudes about access tocare may also affect responses.The Commonwealth Fund survey asks respondents
about three aspects of perceived access, and compilescountry-specific statistics on the percentage of adultswho: (1) did not see a doctor when sick, (2) skippeda medical test or treatment recommended by a doc-tor, or (3) did not fill a prescription or skipped a dosebecause of cost in the past year. The data in Fig. 3show the percentage of adult respondents who experi-enced any of these three things. Countries aregrouped as they were in Fig. 2 (solid lines are thehighest spending countries), dotted lines the lowestspending, and dashed lines the middle spending coun-tries. In 2016, the U.S. had by far the highest rates ofreported access problems, and the U.K. the lowest,with Germany, Netherlands and Sweden also low. Weare particularly interested in country-specific trendsover the study period to see if they correlate withchanges in a country’s policies regarding what servicesare covered and, for covered services, cost sharingrequirements. Thus, perceived OOP barriers withincountries in each of the historical spending categoriesare described below to contextualize self-reportedaccess problems in terms of national OOP spendingtrends.
Rice et al. BMC Health Services Research (2018) 18:371 Page 9 of 18
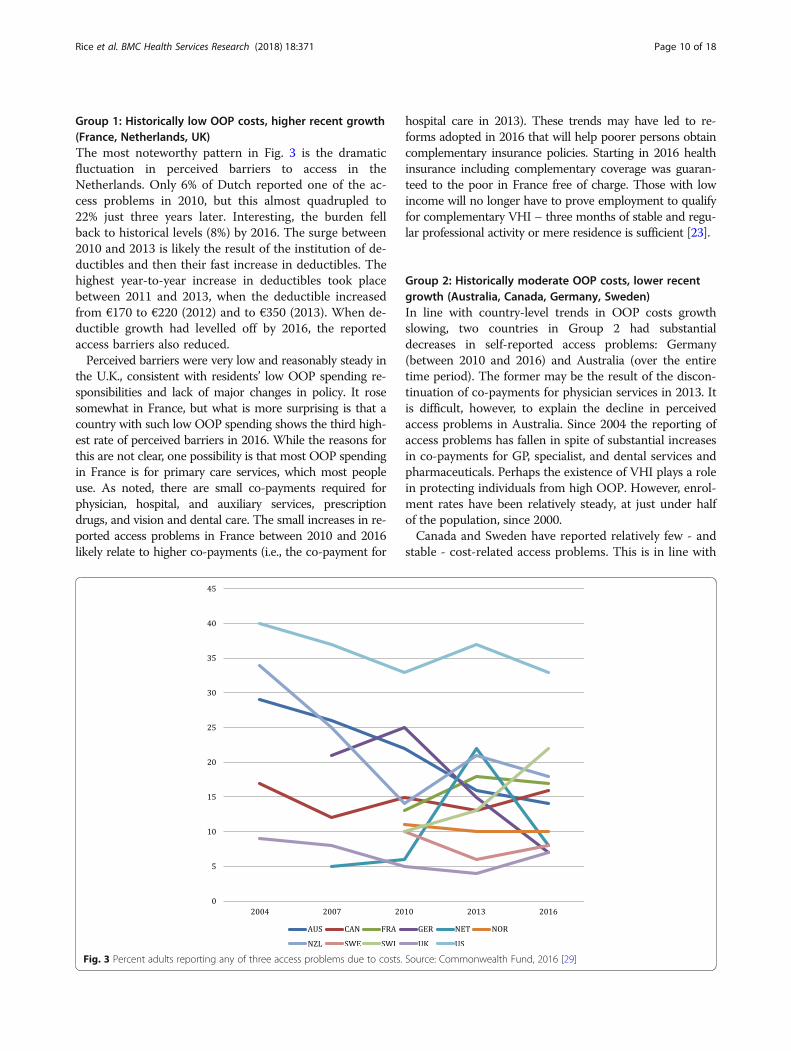
Group 1: Historically low OOP costs, higher recent growth(France, Netherlands, UK)The most noteworthy pattern in Fig. 3 is the dramaticfluctuation in perceived barriers to access in theNetherlands. Only 6% of Dutch reported one of the ac-cess problems in 2010, but this almost quadrupled to22% just three years later. Interesting, the burden fellback to historical levels (8%) by 2016. The surge between2010 and 2013 is likely the result of the institution of de-ductibles and then their fast increase in deductibles. Thehighest year-to-year increase in deductibles took placebetween 2011 and 2013, when the deductible increasedfrom €170 to €220 (2012) and to €350 (2013). When de-ductible growth had levelled off by 2016, the reportedaccess barriers also reduced.Perceived barriers were very low and reasonably steady in
the U.K., consistent with residents’ low OOP spending re-sponsibilities and lack of major changes in policy. It rosesomewhat in France, but what is more surprising is that acountry with such low OOP spending shows the third high-est rate of perceived barriers in 2016. While the reasons forthis are not clear, one possibility is that most OOP spendingin France is for primary care services, which most peopleuse. As noted, there are small co-payments required forphysician, hospital, and auxiliary services, prescriptiondrugs, and vision and dental care. The small increases in re-ported access problems in France between 2010 and 2016likely relate to higher co-payments (i.e., the co-payment for
hospital care in 2013). These trends may have led to re-forms adopted in 2016 that will help poorer persons obtaincomplementary insurance policies. Starting in 2016 healthinsurance including complementary coverage was guaran-teed to the poor in France free of charge. Those with lowincome will no longer have to prove employment to qualifyfor complementary VHI – three months of stable and regu-lar professional activity or mere residence is sufficient [23].
Group 2: Historically moderate OOP costs, lower recentgrowth (Australia, Canada, Germany, Sweden)In line with country-level trends in OOP costs growthslowing, two countries in Group 2 had substantialdecreases in self-reported access problems: Germany(between 2010 and 2016) and Australia (over the entiretime period). The former may be the result of the discon-tinuation of co-payments for physician services in 2013. Itis difficult, however, to explain the decline in perceivedaccess problems in Australia. Since 2004 the reporting ofaccess problems has fallen in spite of substantial increasesin co-payments for GP, specialist, and dental services andpharmaceuticals. Perhaps the existence of VHI plays a rolein protecting individuals from high OOP. However, enrol-ment rates have been relatively steady, at just under halfof the population, since 2000.Canada and Sweden have reported relatively few - and
stable - cost-related access problems. This is in line with
Fig. 3 Percent adults reporting any of three access problems due to costs. Source: Commonwealth Fund, 2016 [29]
Rice et al. BMC Health Services Research (2018) 18:371 Page 10 of 18
our observation that benefit baskets and cost sharingrequirements in these countries have been fairly stable.
Group 3: Historically high OOP cost, low to no growth inrecent years (Norway, Switzerland, United States)The country with the highest reported access problem is theU.S. This is not surprising given both high uninsurance ratesand high levels of cost-sharing, particularly in employer-sponsored coverage. Nevertheless, reported access barriersdeclined considerably between 2004 and 2016. In the earlierperiod, a contributing factor for the decline was almost cer-tainly the 20% rise in Medicaid enrolment between 2004and 2016. More recently, it was a result of three major pro-visions of the ACA: the Medicaid expansion, premiums sub-sidies for those purchasing coverage on the exchanges, andrequiring employers to allow children under the age of 26 toremain on parents’ family coverage plans.Perceived access problems have continued to rise in
Switzerland and reached the second highest value (22%)after the U.S. in 2016. Although Switzerland is the highestspender on OOP of all ten countries, growth in spendinghas been very low (see Fig. 2). The increased barriers there-fore may have been the result of shifting OOP spending pat-terns. In fact, people in Switzerland are increasingly optingfor high-deductible plans in exchange for lower premiums,which may create financial access problems for people withthese plans.The more striking observation is that Norway shows
low access barriers in spite of OOP spending is the thirdhighest of the ten countries. The Norwegians seem toachieve this by having relatively high co-paymentscoupled with relatively low ceilings. Low reported accessbarriers likely are the result of an equitable spread ofOOP payments among the population. Moreover, thecountry enjoys a low unemployment rate and strong so-cial protection mechanisms.
DiscussionLimitationsAny discussion of OOP spending across countries needs tobe tentative for a variety of reasons, including data availabil-ity, quality and comparability, different roles of VHI acrosscountries, and the fact that OOP requirements andutilization are intertwined such that – and as describedearlier – aggregate trends mask what is occurring at theindividual service level. Nevertheless, cross-country compar-ability can be enhanced by considering all relevant compo-nents of OOP spending along the three coveragedimensions (see Fig. 1), including cost sharing requirements,voluntary deductibles, direct payments for uncovered ser-vices, the population covered, and the interaction with VHIpolicy. That is the approach that we have taken here.The data and analyses presented here are subject to sev-
eral limitations. One concerns acquiring and summarizing
data from the ten countries. Aggregate spending data sufferfrom frequent breaks in data collection methodology, whichwe have tried to control for by taking 10-year intervals. Fre-quent changes in cost-sharing requirements and in the de-sign of benefit baskets complicate analyses and comparisonof information across countries. Furthermore, many peopleand illnesses are exempt from cost sharing requirements,so changes reported usually apply only to a subset of thepopulation.The data on reported access problems from the Com-
monwealth Fund are also subject to various limitations dis-cussed earlier. One of the most important is that thedefinition of OOP spending may not coincide with thethings a person considers when reporting on cost-relatedaccess problems. For example, both premiums and taxespose financial burdens but neither is defined as an OOPcost. Heightening this problem is the fact that differentcountries use these mechanisms to much different degrees.Second, the data are not broken down by survey respon-dents’ demographic characteristics. Third, response ratesvary by country, and it is possible that they may be loweramong vulnerable subgroups that may be more likely to ex-perience access problems. A recent cross-national study byCylus and Papanicolas [24] does look at the impact of vari-ables such as age, education, income, and health status, butbecause they use data from a single year (2008), they arenot able to examine changes over time.
Policy implicationsThe main finding from the first part of the article is that,while aggregate per capita OOP spending (in PPP percapita) varies greatly across countries, there is a slow butsteady trend towards convergence. Those countries withhistorically low spending levels (France, Netherlands, the U.K.) have had relatively high growth rates, while the coun-tries with the highest spending (Switzerland, the U.S.,Norway) have shown the lowest growth. The four countrieswith OOP spending near the middle (Australia, Canada,Germany, Sweden) also show growth rates in the middle.This indicates some amount of learning from others’ expe-riences, but also reflects the possibility that the low spend-ing countries recognize they have more policy wiggle roomand that the high spending countries recognize they mayhave reached the maximum OOP burden of what can beshifted to consumers.The key finding from the second part of the article is that
perceptions of the reduced access to care posed by OOPspending are influenced by three factors: per capita spend-ing, recent changes in OOP requirements, and the exist-ence of effective safety mechanisms. It is perhaps notsurprising that the two countries with the highest per capitaOOP spending (Switzerland and the U.S.) show the highestlevels of perceived cost-related access barrier in 2016. Simi-larly, the country with the lowest aggregate spending level,
Rice et al. BMC Health Services Research (2018) 18:371 Page 11 of 18

the U.K., has the lowest rate of perceived barriers to access.But these patterns do not always hold; France also has lowOOP spending, but the third highest rate of perceived cost-related access barriers in 2016. Conversely, Norway hashigh OOP spending, but low perceived cost related accessbarriers. This shows that there are more factors driving per-ceived barriers to accessing care.Indeed, a second factor driving perceived reductions in
access in some countries is recent changes to cost sharingrequirements. People often evaluate their welfare basednot so much on what they have, but rather, on changes tothe status quo [25]. The Netherlands, a country with his-torically low OOP spending, provides a case in point. De-ductibles were introduced in 2008, but they more thandoubled in the two-year period between 2011 and 2013.Even though the amounts were low compared to countrieslike Switzerland and the U.S., this fast rise coincided withmore than one-fifth of the population reporting cost-related access barriers in 2013 compared to just 6% threeyears earlier. As deductibles stabilized, the reported accessproblems returned to historic levels (8%) by 2016. Some-what analogously, France, a country with very low aggre-gate OOP spending, reports high and growing perceivedaccess barriers, which are likely due, in part, to increasesin co-payments. Thus, individuals perceive access barriersbased not only how much they have to pay OOP, but alsoaccording to what they are accustomed to paying.A third factor that appears to affect perceived barriers: the
existence of effective policies to counter high individualOOP burdens. We distinguish two kinds: safety-net mecha-nisms and policies aiming to more equally spread the OOPburden. It is noteworthy that even though Switzerland is,and has been for some time, an outlier with regard to aggre-gate OOP spending – with aggregate per capita amounts60% higher than the U.S. – its population reports far feweraccess barriers. This is due to several factors. First,Switzerland has achieved universal coverage of its popula-tion since 1996. Second, children and maternity services areexempted from most cost sharing requirements. Finally, an-nual maximums on coinsurance payments exist. In contrast,the U.S. has far weaker protection mechanisms, with a largeproportion of the population uninsured and very high de-ductibles in many health plans. Using Norway as an exampleto follow, policies could be aimed at more equitably spread-ing OOP among the population – such as coupling rela-tively high co-payments with relatively low out-of-pocketmaximums and generous exceptions and protections. TheU.S. movement towards very high deductibles (without pro-tection mechanisms) has a large impact – both economicand health – on vulnerable groups.The two most common complaints about relying on OOP
requirements are related to each other: they provide a bar-rier to receiving needed care, and they are regressive. Exceptfor the U.S., where there continues to be a sizable contingent
of uninsured persons, all the countries included in this studyhave formulated policies to help shield most of the econom-ically vulnerable. Those who are protected through lower orzero OOP requirements include low-income persons (allcountries), children, those with high expenditures, andpeople with particular diseases, and older adults. Some ofthese mechanisms appear to be more successful than others,judging from the large amount of variation in perceivedcost-related access problems shown in Fig. 3.High deductibles are particularly problematic for those
with lower incomes and those who are sicker. Not only arethey regressive by nature, but they can be a formidable bar-rier to care. If people do not expect to meet their deduct-ibles during the year, they will behave as though they areuninsured, and repeatedly studies have shown that such eco-nomic barriers result in receipt of fewer needed services andlack of compliance with prescription drug regimens [26].The two countries that rely most heavily on deductibles –the U.S. and Switzerland – showed the greatest access bar-riers in Fig. 3, and as noted the Netherlands also exhibitedsuch barriers when it substantially increased them.Of course, other cost containment mechanisms are
available to control costs. “Supply side cost-sharing” pol-icies such as global budgeting, supply and technologycontrols, managed care, and incentive reimbursement ofproviders are used in many countries [27, 28], and havethe potential to improve efficiency and equity. Neverthe-less, as OOP costs are an essential component of finan-cing sources in all countries, it is important to designpolicies that limit as far as possible, their negative conse-quences for patients.
ConclusionsSince OOP requirements are part of health systemfinancing in all countries, it behooves policy makers tofind ways to make them less of an access barrier and lessregressive. This requires a better understanding of theroot causes of OOP spending. However, in most coun-tries OOP data is not gathered in disaggregated fashion,i.e. broken down into cost sharing and direct payments.The latter relate to the coverage dimensions of uninsur-ance (“breadth”) and underinsurance (“scope”, i.e.lacking benefits) and in many cases these dimensionsmay be underestimated. Moreover, more granular dataneed to be available to allow for comparisons betweenconsumer groups (e.g. income-level or health status) tobetter understand the differential impacts of OOPpolicies and spending across populations. Statisticalagencies should therefore focus their efforts on disaggre-gating OOP data, so that future research can: (1) betteranalyze OOP spending, (2) connect these to actual pol-icies on the ground, and (3) suggest effective solutionsto policy makers.
Rice et al. BMC Health Services Research (2018) 18:371 Page 12 of 18

Appendix
Table 3 Key Out-of-Pocket Payment Requirements in the most Recent Year, by Country. This annex contains a table presenting a fulldescription of all out-of-pocket payment requirements in the ten high-income countries studied in this paper
Depth Scope Breadth
Deductibles Co-insurance andco-payments
Extra-billing andreference prices
Protection mechanisms
Australiaa none - specialist ambulatorycare: 15% co-insurance
- prescriptions: co-payment:AUD38.30
- hospital care: 25%co-insurance atprivate hospitals
- physicians maybill above feeschedule
- private hospitalsmay bill abovefee schedule
- prescriptions: reducedco-payment forlow-income andchildren: AUD6.20 +cap at AUD372;others: cap atAUD1,476 afterwhich low-incomeco-payment applies.
- ambulatory care:co-insurance cap AUD447;cap on OOP for extrabilling at AUD648 forlow income and childrenand AUD2,030 for others(80% of costs arecovered afterreaching the cap)
excludedservices: adultdental care,OTC drugsVHI exists forexcluded services andprivatehospital care
universalcoverage,+ VHI heldby about 50%
Canada - for prescriptions(depending on province)
- prescriptions (dependingon province): co-paymentor co-insurance
- not allowed - prescriptions: provincialregulations determineOOP caps and exemptions
- low income: variousprovincial programscover OOP costs
- tax credits for individualswhose medical expensesexceed 3% ofannual income
Excludedservices(depending onprovince):prescriptions,vision, dentalcare, homecare, rehabilitation,medical devices/aidsVHI exists formany of theexcluded services
universalcoverage,+ two thirdswith VHI
Englandb none - prescriptions:co-payment GBP8.40
- dental care: GBP19.70,53.90, or 233.70,depending on typeof service
- none -exemptions: children, lowincome, certain diseases, +for prescriptions and eyetests also aged 60+- annual cap on prescriptionsco-payment (prepaymentcertificate): GBP104
Excluded services:- private services- vision aids, eyetests
universalcoverage
France none - physician visits: 30%co-insurance + €1co-payment per visitand lab test/x-ray
- prescriptions: 15–100%co-insurance + €0.5co-payment/pack
- inpatient care: co-insurance:20% + co-payment €18/day
- dental care: co-insurance(30%) + co-payment €1
- additional co-paymentfor expensive care(>€120): €18(once per visit or stay)
- 20% of physiciansbill above feeschedule
- reference pricesexist for dentalcare, glasses,dentures,hearing aids(covering as littleas 10% of costs)
- children exemptedfrom co-payments
- patients with oneof 32 severe chronicdiseases exemptedfrom co-insurance
- low income (10% ofpopulation) receive freeVHI, free vision care,free dental care
- complementary VHIcovers co-insurance
- hospital co-paymentlimited to 31 days
- €50 caps on co-paymentseach for physician visits,prescriptions, and dental care
none universalcoverage,+ 95% withcomplementaryVHI
Germanyc None - prescriptions and medicalaids: 10% co-insurance(min €5, max €10)per prescription
- Hospital co-payment:€10 per day
- Home nursing,physiotherapy, etc.:10% co-insurance + €10per prescription
- Reference pricesexist for crownsand dentures(covering about50% of normaltreatment),prescriptions, andmedical aids.
Exemption: Childrenunder age 18;Maximum cost-sharing(does not apply to OOPabove reference prices):2% of annual income(1% for patients withchronic conditions)
excluded services:OTC drugs,certain servicesof uncertainbenefit orunfavourablecost-effectiveness.
universalcoverage;10% coveredby substitutiveVHI
Netherlands - €385 for all servicesexcept primary care
- 20-25% co-insurance fornon-contracted care(only for benefits in-kindinsurance policies)
- prescriptions:OOP abovereference price
deductible exemption:children < 18, maternalcare, integratedcare programs
excluded services:adult dental care,certain prescriptions(statins, ASS,
universalcoverage
Rice et al. BMC Health Services Research (2018) 18:371 Page 13 of 18

Table 3 Key Out-of-Pocket Payment Requirements in the most Recent Year, by Country. This annex contains a table presenting a fulldescription of all out-of-pocket payment requirements in the ten high-income countries studied in this paper (Continued)
Depth Scope Breadth
- medical devicesand aids: OOPabove referenceprices
benzos),physiotherapy
Norwayd None co-payments:- primary care:NOK 152/201- specialist care:NOK 345- physiotherapists:NOK 98–300- psychologist:NOK 345–1035- dental care for19–20 years:25% in co-paymentif services areprovided bypublic providers
- prescriptions: 39% offull price if onthe “blue list”(max NOK 520/prescription)
- radiology: NOK 245/exam- lab test: NOK 54
- extra billing ofservices/materialsused that areexcluded fromstatutorycoverage (this isnot included incap 1 or 2) suchas bandage,consumables
- children under age16 exempted fromco-payments, up to18 years for dental care
- Cap 1: max 2205 NOKduring a calendar yearcovering primary andspecialist care, radiologyand “blue list” prescriptions
- Cap 2: max 1990 NOKduring a calendar yearcovering physiotherapists,some dental care foradults (predefinedconditions), somerehab, andtreatment abroadwhen referred by Oslouniversity hospital
- tax deductions forpatients with medicalexpenses aboveNOK 5880
excluded services:adult dentalcare (with someexceptions fora few predefinedconditions),prescription drugsnot covered bythe “blue list”,services providedby non-contractedproviders, servicesprovided ordevices/materialsused that areexcluded fromstatutory coverage(e.g. bandages,consumables)
universalcoverage
Swedene - prescriptions: 1100 SEK(for adults> 18)
- dental care: 3000 SEK(for adults > 22)
co-payments(varying across the21 county councils):- primary care: 120–200 SEKper physician visit
- specialist care: 200–350 SEKper physician visit (reduced ifreferred from primary care)
- hospitalization: 100 SEK/dayfor adults> 19
- medical devices/aids:co-payment for differenttypes of devices/aids
co-insurance(determined at national level):- prescriptions: 50% between1100 and 2100 SEK, 25%between 2100 and 3900SEK, 10% between 3900 and5400 SEK (max 2200 inco-payments for each12 month period)
- dental care: 50% betweenreference prices of 3000 and15,000 SEK, 15% for referenceprices above 15,000 SEK (appliesfor each 12 month period)
- dental care: OOPabove referenceprices- medical devices/aids: OOP abovereference prices;extra billing formedical devices/aids not covered insome countycouncils (e.g.multifocal lenses incataract surgery,advanced hearingaids)
General exemptions:- children and youngadults < 22 for dentalcare, < 18 forprescription drugs,< 20 forhealth servicesTwo separateco-paymentcaps for each12 month period:- visits to primaryand outpatientspecialist carecombined: 1100 SEK
- prescription drugs:2200 SEK
excluded services:certain medicines,dental servicesand aids withuncertain benefitsand/or poorcost-effectiveness;services providedby non-contractedprivate providers;vision aids includingeye test
universalcoverage
Switzerland all services: min.CHF300 – maxCHF2500
- Co-insurance 10% of allcosts above deductible;
- Hospital co-payment:CHF 15 / day
- medical aids:patients pay OOPabove referenceprice
- Children (< 19 y): nodeductible (or voluntarybetween CHF 100and CHF 600);-Maximum forco-insurance:CHF700/year(Children: CHF350/year)
- exemptions forpreventive andmaternal care
excluded services:adult dentalcare, OTC drugs,psychotherapyperformed byindependentpsychologists,vision aids
Universalcoverage
US Employer plans- average: US$1318Medicare:- hospital care: US$1288- physician services:US$166- drugs: varies by plan
Employer plans:- average co-insurance:18–19% primary,specialist andhospital care
- average co-payment: US$24(primary), US$37 (specialist),US$308 (hospital)
- usually notallowed
Employer plans:- median cap onuser charges:US$3000–3999
Usually excluded:dental care andvision care
8.6%uninsured
Rice et al. BMC Health Services Research (2018) 18:371 Page 14 of 18

Table 3 Key Out-of-Pocket Payment Requirements in the most Recent Year, by Country. This annex contains a table presenting a fulldescription of all out-of-pocket payment requirements in the ten high-income countries studied in this paper (Continued)
Depth Scope Breadth
- prescriptions: co-insurance17–32%, co-payment:US$11–93
Medicare:- hospital care: no co-paymentfor first 60 days,US$322/day until day 90
- physician services: 20%co-insurance
- drugs: varies by planaAUD amounts refer to 2016 values; refs: https://www.humanservices.gov.au/customer/enablers/2016-medicare-safety-net-thresholds;http://www.pbs.gov.au/info/healthpro/explanatory-notes/front/fee; http://www.commonwealthfund.org/~/media/files/publications/fund-report/2016/jan/1857_mossialos_intl_profiles_2015_v7.pdfbValues refer to 2016cOOP requirements refer to SHI system; requirements for substitute VHI differdValues refer to 2015, ref.: http://www.commonwealthfund.org/~/media/files/publications/fund-report/2016/jan/1857_mossialos_intl_profiles_2015_v7.pdfeValues refer to 2011
Rice et al. BMC Health Services Research (2018) 18:371 Page 15 of 18

Table 4 Changes in Out-of-Pocket Payment Requirements Over 10-Year Period, by Country. This annex contains a table with a fulldescription of the changes in out-of-pocket requirements over a 10-year period in the ten high-income countries studied in this paper
Depth Scope Breadth
Deductibles Co-insurance andco-payments
Extra-billing andreference prices
Protectionmechanisms
Australia -no change 2005: pharmaceuticalco-payments increasedto AUD28.602015, 2016: increasein pharmaceuticalco-payments
- annualchanges relatedto decisions ofphysicians
- 2005: incentive paymentto GPs who do notextra bill
- annual increase inco-insurance caps
- 2016: introduction of capon OOP for extra billing
- minimalchanges
- no change
Canada - no change - provincial levelchanges forprescriptions
- no change - provincial level changesfor low-income andelderly caps/exemptions
- no federallevel changebut provinciallevel changes
- no change
England - no change prescriptions:- annual increaseof co-paymentsby GBP0.10–0.20
dental care:- 2006: reductionof co-payments(maximum reducedfrom GBP384 to 189)
- since then regular increase
- no change - regular increase ofprescriptions cap
- no change - no change
France - no change 2005: introduction of€1 co-payments forphysician visits, labtests, x-rays2006: introductionof €18 co-paymentfor expensive care (>€120)2008: introduction of€0.5 co-payment forprescriptions2013: increase of dailyco-payment for hospitalcare from €16 to €18
- changes relatedto choices ofphysicians
2005 and 2008:introduction of €50caps on co-paymentsfor each type of service
- minimalchanges
- no change;continuousgrowth ofcomplementary
VHI coverage
Germany - no change 2013: €10 per physicianvisit discontinued
2005: introductionof reference pricesystem for crownsand dentures
- no change - minimalchanges
since 2007:mandatoryinsurance
Netherlands 2008: €150deductibleintroduced2009–2016:annual increaseup to €385
since 2010: emergenceof co-insurance fornon-contracted providers
- no change 2014: severalcompensations forchronically ill wereabolished (e.g. partialcompensation for themandatory deductible),but municipalitiesmay provide suchcompensations now.
Many exclusionsand someinclusions, e.g.:2006: exclusionof adult dental care2007: inclusion ofpsychotherapy(severe cases),first IVF (of max. 3)2009: exclusionof benzos, statins2009 exclusionof walkers2011: exclusion ofdental care for18–22 y/o2011/12: reductionsin physical therapy2012: exclusion ofgastric acid blockers2013: exclusion ofsimple walking aids2013–14: inclusionof quit smoking and
- no change
Rice et al. BMC Health Services Research (2018) 18:371 Page 16 of 18

Table 4 Changes in Out-of-Pocket Payment Requirements Over 10-Year Period, by Country. This annex contains a table with a fulldescription of the changes in out-of-pocket requirements over a 10-year period in the ten high-income countries studied in this paper(Continued)
Depth Scope Breadth
Deductibles Co-insurance andco-payments
Extra-billing andreference prices
Protectionmechanisms
dietary advice
Norway - no change - small changes to co-payment amounts, slowlyincreasing
- no change - annual revision ofco-payment cap,slowly increasing
- minimal changes - no change
Sweden - no change - small increases to co-payment amounts for out-patient specialist care with-out referral in severalcounty councils
- no change 2008: reducedco-insurance fordental care abovehigh cost threshold2012: OOP caps increase:- prescriptions: fromSEK 1800 to 2200
- outpatient primary andspecialist care: from SEK900 to 1100
2016: introduction ofgeneral exemption fromco-payments forprescription drugsfor children under 18
2009: prescriptiondrug coveragerestricted to lowestcost generic2013: minorincrease in scope ofsubsidies in dentalcare to elderly
- no change
Switzerland - 2005: maxdeductible isincreasedfrom CHF1500to CHF2500
- Proportion ofinsured optingfor deductibleof CHF2500increasedfrom around5% in 2005 to19% in 2014
2011: hospital co-paymentis increased from CHF10 to:CHF 15 / day;2006: Co-insurance is in-creased to 20% for branddrugs if a cheaper genericis available;
-no change - no change 2011: vision aidsexcluded fromcoverage;2012: alternativeand complementarymedicineincluded inbenefits catalogue
- no change
US Employer plans:- averagedeductibleincrease fromUS$602 in2005 toUS$1318 in2015
Medicare:- annual smallincrease in
deductibles
Employer plans:- co-insurance, co-paymentsrelatively stableMedicare:- annual small increase inco-payments
- no change Employer plans:- annual 6% increase ofproportion of insuredwith cost-sharing cap of≥US$3000 (33% in2005, 59%)
- dental careand vision careexcluded inincreasingproportionof plans
- coverageamong the adultpopulationincreased from82.9% in 2013 to89% in 2016 [19]
Rice et al. BMC Health Services Research (2018) 18:371 Page 17 of 18

AbbreviationOOP: Out-of-Pocket
Availability of data and materialsAll data are from public sources. International comparative data are fromOECD Health Statistics (http://www.oecd.org/els/health-systems/health-data.htm) as well as the Commonwealth Fund International Health PolicySurveys (http://www.commonwealthfund.org/topics/current-issues/international-surveys). Country-specific data primarily comes from the HealthSystem in Transition (HiT) reviews (http://www.euro.who.int/en/about-us/partners/observatory/publications/health-system-reviews-hits/full-list-of-coun-try-hits), and was complemented with data from several academic papers,national policy documents and public websites as listed under the referenceswhere necessary.
Authors’ contributionsTR led the study, collected the data on the UK and USA and made the firstfull draft. EVG collected data on the Netherlands, was responsible forcorrespondence and writing the second full draft. WQ has collected dataand drafted the sections on Germany and Switzerland, AA and AJB havecollected the data and drafted the sections on Norway and Sweden, PR hascollected the data and drafted the sections on Canada and France and LYUcollected the data and drafted the section on Australia. All authors havebeen involved in the conception and design of the paper. All authors haveread and approved the manuscript.
Ethics approval and consent to participateNot applicable.
Competing interestsThe authors declare that they have no competing interests.
Publisher’s NoteSpringer Nature remains neutral with regard to jurisdictional claims inpublished maps and institutional affiliations.
Author details1University of California, Los Angeles, USA. 2Berlin University of Technology,Berlin, Germany. 3Lund University, Lund, Sweden. 4Virginia CommonwealthUniversity, Richmond, USA. 5University of Texas Health Science Center,Houston, USA. 6University of Central Florida, Orlando, USA. 7EuropeanObservatory on Health Systems and Policies, Berlin University of Technology,Straße des 17. Juni 135, 10623 Berlin, Germany.
Received: 22 November 2017 Accepted: 4 May 2018
References1. Baird K. High out-of-pocket medical spending among the poor and elderly
in nine developed countries. Health Serv Res. 2016;51(4):1467–88.2. Palladino R, Lee JT, Hone T, Filippidis FT, Millett C. The great recession and
increased cost sharing in European health systems. Health Aff. 2016;35(7):1204–13.
3. Tambor M, Pavlova M, Woch P, Groot W. Diversity and dynamics of patientcost-sharing for physicians’ and hospital services in the 27 European Unioncountries. Eur J Pub Health. 2011;21(5):585–90.
4. Zare H, Anderson G. Trends in cost sharing among selected high incomecountries – 2000-2010. Health Policy. 2013;112:35–44.
5. French S, Old S, Healy J. New Zealand. Health Syst Trans. 2001:1–128.6. Busse R, Schreyögg J, Gericke CA. Analyzing changes in health financing
arrangements in high-income countries: a comprehensive frameworkapproach. In: Health, nutrition and population (HNP) discussion paper.Washington DC: World Bank; 2007.
7. Busse R, Schlette S, editors. Health policy developments issue 7/8: focus onprevention, health and aging, and human resources. Gütersloh: VerlagBertelsmann Stiftung; 2007.
8. World Health Report. Health systems financing. In: The path to universalcoverage; 2010. p. 2010.
9. OECD. Glossary of Statistical Terms. Out-of-Pocket Expenditure byHouseholds on Health. https://stats.oecd.org/glossary/detail.asp?ID=1967
10. Kronick R, Gilmer T. Explaining the decline in health insurance coverage,1979-1995. Health Aff. 1999;18(2):30–47.
11. This series of full-length health system reviews can be downloadedfrom: http://www.euro.who.int/en/about-us/partners/observatory/publications/health-system-reviews-hits/full-list-of-country-hits
12. OECD Health statistics. 2017. http://www.oecd.org/els/health-systems/health-data.htm
13. NZA (Nederlandse Zorgautoriteit), 2016. Marktscan van deZorgverzekeringsmarkt 2015. [Market scan of the health insurance market2015. (May 2016 update): https://puc.overheid.nl/nza/doc/PUC_3341_22/1/
14. Mason A. Does the United Kingdom’s NHS have a health benefit basket?Eur J Health Econ. 2005;6(supple. 1):18–23.
15. Foubister T, Richardson E. United Kingdom. In: Sagan A, Thomson S, editors.Voluntary health Insurance in Europe: country experience. Copenhagen:WHO/European observatory on health Systems and Policies; 2016. Availablefrom http://www.euro.who.int/__data/assets/pdf_file/0011/310799/Voluntary-health-insurance-Europe-country-experience.pdf.
16. Wong CY, Greene J, Dolja-Gore X, van Gool K. The rise and fall in out-of-pocket costs in Australia: an analysis of the strengthening Medicare reforms.Health Econ. 2016. https://doi.org/10.1002/hec.3376.
17. Commonwealth of Australia. Out-of-pocket costs in Australian healthcare.2014. Available at: http://www.aph.gov.au/Parliamentary_Business/Committees/Senate/Community_Affairs/Australian_healthcare/Report
18. Australian Prudential Regulation Authority. New Polling Shows PrivateHealth Insurance Puts Profits Before Patients 2016. https://www.mtaa.org.au/sites/default/files/uploaded-content/website-content/160918%20-%20New%20Polling%20shows%20Private%20Health%20Insurance%20puts%20profits%20before%20patients.pdf.
19. Gallop. U.S. Uninsurance Rater at 11.0%, Lowest in Eight-Year Trend. 2016http://www.gallup.com/poll/190484/uninsured-rate-lowest-eight-year-trend.aspx.
20. Kaiser Family Foundation. A Primer on Medicare: Key Facts about theMedicare Program and the People it Covers. 2015. http://kff.org/report-section/a-primer-on-medicare-what-types-of-supplemental-insurance-do-beneficiaries-have/
21. Health Pocket. Aging Consumers without Subsidies Hit Hardest by 2017Obamacare Premium & Deductible Spikes. 2017. https://www.healthpocket.com/healthcare-research/infostat/2017-obamacare-premiums-deductibles#.WPU2-kXythE
22. Kaiser Family Foundation. Survey of Non-Group Health Insurance Enrollees.2014. https://www.kff.org/health-reform/report/survey-of-non-group-health-insurance-enrollees/
23. Amelie.fr. 2016. http://www.ameli.fr/assures/soins-et-remboursements/cmu-et-complementaires-sante/la-cmu-de-base-n-existe-plus/pourquoi-la-cmu-de-base-est-elle-supprimee.php
24. Cylus J, Papanicolas I. An analysis of perceived access to health Care in Europe:how universal is universal coverage? Health Policy. 2015;119:1133–44.
25. Kahneman D, Tversky A. Prospect theory: an analysis of decision under risk.Econometrica. 1979;47(2):263–92.
26. Rice T, Unruh LY. The economics of health reconsidered. Chicago: HealthAdministration Press; 2016.
27. Ellis RP, McGuire TG. Supply-side and demand-side cost sharing in healthcare. J Econ Perspect. 1993;7(4):135–51.
28. Stabile M, Thomson S, Allin S, Boyle S, Busse R, Chevreul K, Marchildon G,Mossialos E. Health care cost containment strategies used in four otherhigh-income countries hold lessons for the United States. Health Aff. 2013;32(4):643–52.
29. Commonwealth Fund. International health policy surveys. 2016. http://www.commonwealthfund.org/topics/current-issues/international-surveys
Rice et al. BMC Health Services Research (2018) 18:371 Page 18 of 18