revisiting unemployment levels and trends in south africa
TRANSCRIPT

Yu, D. (2013). Revisiting unemployment levels and trends in South Africa since the transition.
Development Southern Africa, 30 (6): 701-723
http://dx.doi.org/10.1080/0376835X.2013.830242
University of the Western Cape Research Repository [email protected]
Revisiting unemployment levels and trends in South Africa since
the transition
Derek Yu1
Abstract
Many recent studies compared the 1995 October Household Survey (OHS) with the latest
available Labour Force Survey (LFS) to derive the unemployment ‘trends’ in South
Africa since the transition, but this approach only gives a snapshot of unemployment
at two points in time. Although the better approach is to examine all available labour
surveys to derive the real unemployment trends during the period, this does not mean
these trends are fully reliable and comparable, as the sampling method, weighting
technique, questionnaire design and labour market status derivation methodology to
define the unemployed are different across the surveys. In particular, the unemployment
estimates in OHS 1995 – 99 and during the changeover between OHS and LFS in both
narrow and broad terms increased rapidly. This paper aimed to address these issues, if
possible, in order to improve the comparability and reliability of unemployment
aggregates across the surveys.
1. Introduction
Statistics South Africa (Stats SA) has been collecting detailed labour market data
since 1993 with the October Household Survey (OHS), the Labour Force Surveys
(LFS) that replaced the OHS since 2000 and took place twice a year, and the Quarterly
Labour Force Survey (QLFS) introduced since 2008, replacing the LFS. From these
surveys, levels and trends in labour force, labour force participation rates, the
employed, the unemployed and unemployment rates under the narrow (strict) and
broad (expanded) definitions are derived. With regard to unemployment, the
majority of recent South African studies only compare OHS 1995 with the latest
available LFS at the time of writing to derive the unemployment ‘trends’. However, this
approach could only provide a snapshot of unemployment at two points in time, but
does not address the possible fluctuations across the surveys and their causes in great
detail. In addition, it is also not entirely correct to compare OHS 1995 with an LFS,
as the labour market status derivation methodology of the former survey is not known,
due to the absence of metadata document when the data were released by Stats SA.
1 Lecturer, Department of Economics, University of the Western Cape, Private Bag X17, Bellville 7535, South Africa;
and part-time researcher, Department of Economics, Stellenbosch University, Private Bag X1, Matieland 7602, South
Africa. Correspondence: [email protected]
2
Even if all available OHSs, LFSs and QLFSs are examined, it still does not suggest
that the unemployment aggregates derived over the years are fully reliable and
comparable. Since the weighting technique is not the same across the surveys,
using the cross- sectional OHS/LFS/QLFS data to conduct time-series analyses
might not result in consistent and comparable unemployment estimates and
trends. In addition, as the labour market status derivation methodology has been
revised throughout the years, the unemployed were distinguished very differently
across some surveys. Of particular concern is the abrupt increase of the
unemployed in both narrow and broad terms during the changeover between the
OHS and LFS, as well as the rapid decrease of the broad unemployed during the
changeover between the LFS and QLFS, due to the adoption of a stricter
approach to distinguish the discouraged workseekers in the latter survey. Hence,
this paper first aims to examine the South African unemployment since the advent
of democracy in detail, before investigating whether these levels and trends are real,
and whether reliability and comparability of the estimates could be improved by
dealing with the above-mentioned issues.
The rest of the paper is structured as follows. Section 2 provides a literature review
of recent studies on unemployment levels and trends and the possible causes of the
fluctuations of these aggregates across some surveys. Section 3 discusses the data
and methodology, focusing on how the unemployed are distinguished in each survey.
This is followed by Section 4, which first analyses the unemployment estimates by
looking at all available OHSs, LFSs and QLFSs between 1994 and 2011, before
examining whether the reliability and comparability of these estimates would
improve by adopting a consistent weighting technique, namely the cross-entropy
(CE) approach. Section 4 also investigates whether the levels and trends of the
unemployment aggregates would change significantly by applying a consistent labour
market status derivation methodology across the surveys, if possible. In particular,
this section investigates whether the abrupt increase of both narrow and broad
unemployment between OHS 1999 and LFS 2000 no longer takes place after
applying a consistent methodology to classify the unemployed in all OHSs and LFSs.
Section 5 concludes the study.
OHS 1994 – QLFS 2011 data are used for the analyses; that is, OHS 1993 is not
examined because the sample did not include people from the former Transkei–
Bophuthatswana– Venda– Ciskei states. For the remainder of the paper, the OHSs
will be referred to as OHS 1994, OHS 1995, and so forth, while the LFSs will be
referred to as LFS 2000a (for the first round of LFS in 2000), LFS 2000b (second
round in 2000), LFS 2001a, and so forth. Finally, the QLFSs will be referred to as
QLFS 2008Q1 (for the first round of QLFS in 2008), QLFS 2008Q2 (second round
in 2008), and so forth.
2. Literature review of recent studies on unemployment in South
Africa
The majority of recent studies derive the unemployment trends since the transition
by comparing OHS 1995 with the latest available LFS at the time of writing (Casale
& Posel, 2002; Bhorat, 2004, 2006, 2009; Bhorat & Oosthuizen, 2005; Burger &
https://repository.uwc.ac.za/

3
Woolard, 2005; Dias & Posel, 2006; Oosthuizen, 2006; Van der Westhuizen et
al., 2006; Kingdon & Knight, 2007; Pauw et al., 2008). These studies first
examine the unemployment aggregates between the two surveys, before presenting
the demographic, educational attainment and household characteristics of the
unemployed. The data suggest that employment increases between the two
surveys, but so do the unemployed and unemployment rates. This implies that the
employment increase is not rapid enough to absorb the net labour force entrants.
In addition, the unemployment likelihood is greater for female blacks (despite
evidence of increasing black share of the employed and feminisation of
employment; Casale & Posel, 2002; Oosthuizen, 2006), those aged below 35 years
at the time of the survey, residing in rural areas in the Eastern Cape, Limpopo and
North West provinces, without Matric, people coming from households with fewer
than two employed members and relying heavily on income from social grants.
The unemployment rate increases across all educational attainment categories,
implying the graduate unemployment problem.
As the sampling technique and labour market status derivation methodology in
OHS 1995 are not known due to the absence of the metadata document, 2 the
results of the above studies should be treated with caution because they are not
fully comparable. Also, by comparing only two surveys, the possible fluctuations of
unemployment during the years between the two surveys could not be captured.
Hence, a few studies (Arora & Ricci, 2005; Banerjee et al., 2006; Yu, 2008;
Hlekiso & Mahlo, 2009; Burger et al., 2012) consider the above-mentioned issues
by examining many OHSs and LFSs to derive the detailed unemployment trends
for the period under study. By adopting this approach, the data suggest that the
number of unemployed and the unemployment rate under both the narrow and
broad definitions show an upward trend in the OHSs and LFS 2000a– 2003a. In
particular, the increase is very rapid between OHS 1999 and LFS 2000a. These
aggregates peak at LFS 2003a, before a downward trend is observed. The
demographic and educational attainment characteristics of the unemployed
throughout the years are also analysed, and the results are similar to those
derived by comparing OHS 1995 with an LFS, as discussed above.
The third group of literature focuses on the causes of unemployment. Firstly, due to
the extension of minimum wage agreed during collective bargaining to all workers
in the sector, it is argued that this wage is only affordable to the larger firms but not
necessarily the smaller firms. The latter firms, which are more labour intensive
and potentially the main source of job creation, would either close down or retrench
workers (Nattrass, 2000; Arora & Ricci, 2005; Bhorat, 2009; Mahadea &
Simson, 2011). Moreover, some new labour force entrants (the outsiders) struggle to
find formal employment, despite the fact that they are willing to accept wage levels
below the minimum wage. In others words, when trade unions and employers
negotiate over wage level, the views of the outsiders are not represented (Paton,
2 The metadata are also not available in OHS 1994. The author contacted Stats SA numerous times to request the
metadata document and the labour market status derivation methodology in these two OHSs, but did not receive the
information.
https://repository.uwc.ac.za/

4
2011; Von Fintel & Burger, 2009). Furthermore, the labour force with relatively
lower levels of educational attainment who failed to find work in the formal
sector also struggle to survive in the informal sector, due to the barriers of entry to
the sector and the lack of government support to promote microenterprises and
informal enterprises (Kingdon & Knight, 2004, 2007; Rogerson, 2004; Burger &
Woolard, 2005; Devey et al., 2006).
Looking at other causes of unemployment, employment rigidities caused by the
new labour legislations imposed since the transition arguably cause some
employers to switch to capital-intensive methods to replace labour (Mahadea,
2003; Arora & Ricci, 2005; Bhorat, 2009; Mahadea & Simson, 2011). It is also
argued that some of these legislations have failed to largely reduce extent of
employment discrimination on the previously disadvantaged groups, such as
blacks and youths (Mlatsheni & Rospabe , 2002; Burger & Jafta, 2006). There is
also a structural change in the South African economy since the transition,
resulting in an increasing demand for highly-skilled labour but retrenchment of
and low employment prospects for unskilled and lowly educated people
(Bannered et al., 2006; Lam et al., 2008; Bhorat, 2009). Finally, graduates
w h o s e q u a l i f i c a t i o n s w e r e o b t a i n e d a t i n s t i t u t i o n s not recognised by
employers, especially for blacks with post-Matric certificates and diplomas, also
struggle to find employment (Mlatsheni & Rospabe , 2002; Dias & Posel, 2007; Pauw
et al., 2008).
Most of the studies discussed above do not clearly explain whether these factors
might have led to abrupt fluctuations of unemployment aggregates during a
particular period, especially in the OHSs. A handful of studies (Oosthuizen, 2006;
Hodge, 2009) only argue that the abolishment of unfair labour legislations
imposed during the apartheid period leads to a rapid increase of labour force since
the transition, especially those from the previously disadvantaged groups (blacks
and females). However, unemployment continues to rise as job creation does not
match the growing labour supply. Some of these labour force entrants are
unemployable due to their low level of education and lack of work experience
(Burger & Woolard, 2005). The only study explicitly explaining the rapid increase of
unemployment in the OHSs is that by Burger et al. (2012). They argue that as the
South African Department of Education no longer allows schools to accept students
two years older than the correct grade-age in the late 1990s, these students end up
entering the labour market for work. Since the employment prospects of these
people are low, most of them end up as unemployed, thereby explaining the rapid
increase of unemployed until 2000. In other words, the rapid increase of
unemployed between 1995 and 2000 could be real.
The last group of literature revises the labour market status derivation methodology or
re- weights the datasets to derive more comparable labour market estimates
across the surveys. Casale & Posel (2002) investigate the increasing feminisation of
labour force by comparing OHS 1995 and OHS 1999, but take into consideration
that the question on the availability of the respondent to accept work within one
week is only asked in OHS 1999. Hence, in order to improve the comparability of
https://repository.uwc.ac.za/

5
labour market aggregates between the two surveys, they do not take this question
into consideration when distinguishing the unemployed in OHS 1999. In other
words, the individual’s work- seeking activity solely distinguishes the narrow
unemployed from the broad unemployed; those claiming they want to work and
have actively looked for work in the past four weeks are classified as narrow
unemployed, whilst those wanting to work but have not done anything to seek
work in the past four weeks are classified as discouraged workseekers and hence
part of the unemployed under the broad definition. Furthermore, in both surveys,
those who did not work in the past seven days due to problems with transport
and unrest are re-coded as employed (instead of unemployed) by the authors.
Using this revised methodology, the data suggest that the 1995 unemployment rates
are lower but the 1999 rates are higher than the original Stats SA estimates,
under both the narrow and broad definitions for both genders. Most importantly,
the female unemployment rate becomes significantly lower using the revised
methodology in 1995.3
Looking at other studies, Bhorat criticises that it is impossible to use OHS 1995 to
‘make a credible distinction between the formal and informal sector’ (1999:145), but
he claims that the survey has managed to design a set of questions to help
capturing a credible estimate of then number of unemployed. In particular, he
analyses the categories of answers to the question on reasons for not working in
the past seven days, and respondents whose answers are any of the following five
categories are the only ones to be considered as narrow unemployed: ‘lack of skills or
qualifications available for jobs’, ‘cannot find suitable work’, ‘has found a job, but only
starting at a definite date in the future’, ‘seasonal worker’ and ‘contract worker’.4
Altman (2008) re-estimates employment in OHS 1995 – 99 with the aid of data
from external sources, after taking into account the under-estimation of
employment in three broad industry categories (agriculture, mining, and
community, social and personal services) due to the poor questionnaire design to
capture the informal, low- income and self-employment, as mentioned by Yu
(2007:17 and 47). Casale et al. (2004) also take this issue into consideration, and
estimates that between OHS 1995 and LFS 2003 at most 1.4 million new jobs are
created, instead of two million as suggested by the data. Yu (2012) re-estimates
the informal sector employment using the recent proposed methodologies (e.g.,
Devey et al., 2006; Heintz & Posel, 2008) and finds that both the 1995 – 2007 and
2008 Stats SA methodologies underestimate informal sector employment.
However, Yu assumes that the total employment remains unchanged (for instance,
if informal sector employment should have been 0.2 million higher in a particular
survey, formal sector employment is assumed to decrease by 0.2 million). In other
words, the re-estimation of informal sector employment does not lead to changes
3 The female narrow unemployment rate is 22.6% using the Stats SA labour market status variable as it is, but
decreases to 22.1% using the revised methodology. Similarly, the female broad unemployment rate decreases from
39.2% to 37.6% in 1995 after using the revised methodology. The male unemployment rate only declines from 13.6%
to 13.5% under the narrow terms and from 23.5% to 23.0% under the broad terms, with the adoption of the revised
methodology.
https://repository.uwc.ac.za/

6
in employment. Furthermore, all studies discussed above assume that
unemployment remains unchanged, even after the re-estimation of employment.
Finally, Branson (2009) takes the inconsistent weighting techniques across the
surveys into consideration by adopting the entropy approach (to be discussed in
detail in Section 3) to re-weight the OHS 1995 – 99 and the March LFSs in 2000 – 04
data. She finds that even after using the new weights derived by this approach,
the female labour force and employment trends do not show any significant
changes. In particular, the higher employment levels in OHS 1995 (compared with
OHS 1996 –97) and LFS 2000a (a rapid 1.5 million increase from the OHS 1999 level)
are ‘unlikely to be a function of incorrect weights caused by post-stratification errors’,
but these abrupt changes are ‘either real or the result of measurement error’
(Branson 2009:53). Branson does not use the new weights to re-examine
unemployment.
3. Data and methodology
This section first looks at how the unemployed are defined in each OHS, LFS and
QLFS, before discussing the entropy approach to re-weight the person weights of
the surveys under examination. Whether it is possible to apply a consistent labour
market status derivation methodology across all the surveys to improve the
comparability of the unemployment estimates would also be dealt with.
3.1 Distinction of unemployed in the OHSs/LFSs/QLFS5
As mentioned in Section 2, the methodology used to distinguish the unemployed is
not available in OHS 1994 – 95. The methodology differs a lot between OHS 1996 and
LFS 2000a, before a consistent approach is used in LFS 2000b– 076. In the latter
surveys, the question on the reason for not working in the last seven days is
considered to distinguish the unemployed (see footnote 3): those who claim they are
not working at the time of the survey but have found a job and will start working
soon are immediately defined as unemployed under the narrow definition.
For those who are not defined as employed but claim that they are looking for work at
the time of the survey, and the reason for not working in the last seven days is ‘lack of
skills’, ‘seasonal worker’, ‘cannot find suitable work’, ‘contract worker’, or ‘recently
retrenched’, are also distinguished as unemployed under the narrow definition,
providing the following three requirements are met (the same approach is adopted
by the International Labour Organization; Haussmans, 2007): (1) they would accept
a job if being offered one; (2) assuming the job offer is accepted, they could start
working within two weeks; and (3) they took some action to look for work in the
last four weeks (e.g. registering at employment agency, placing or answering
advertisements). Those only meeting the first two criteria are immediately
4 Note that the respondents’ answers to the question on reasons for not working in the past seven days are only
considered to distinguish the unemployed since the introduction of the LFS. This will be discussed in Section 3. 5 The discussion in Section 3.1 relies substantially on the information in the OHS 1996–99, LFS 2000–07 and QLFS
2008–11 metadata document released by Stats SA. 6 For a detailed explanation on the algorithm adopted in each survey to distinguish the labour market status of the
working-age population in the OHSs and LFSs, refer to Yu (2007).
https://repository.uwc.ac.za/
7
classified as unemployed under the broad definition, and the difference between
broad unemployed and narrow unemployed stands for discouraged workseekers.
The LFS 2000a methodology, in general, is similar to the LFS 2000b– 07 methodology,
except on two issues. First, for criterion (2) above, it is changed from ‘within two weeks’ to
‘within one week’. Secondly, the respondents’ answers to the question on why they are
absent from work in the last seven days, despite having a job, are considered. For
instance, if the respondents’ answers are ‘problems with transport’, ‘off-season activity’,
‘unrest (violence)’ or ‘reduction in economic activity’, and they claim they would accept a
job if being offered one, they could be classified as unemployed. To sum up, LFS
2000a consider both questions on the reason for not working in the last seven days
(for those without a job) and the reason for being absent from work in the last seven
days (for those with a job but are absent from work at the time of the survey) when
identifying the unemployed.
In OHS 1996 – 99, criterion (2) discussed above is not used to distinguish the
unemployed under the broad definition. Furthermore, although criterion (2) is still
used to distinguish the unemployed under the narrow definition in these surveys, the
respondents must claim they could start working within one week (as in LFS 2000a)
instead of two weeks (as in LFS 2000b– 07b) before they could be defined as
unemployed. Also, as in LFS 2000a, the respondents’ answers to the question on
why there are absent from work in the last seven days are considered to distinguish
the unemployed. To conclude, the above analyses clearly show the incomparability
of the labour market status derivation methodology between the OHSs and LFSs.
In 2005, consultants from the International Monetary Fund were asked to evaluate
the LFS, leading to the revision of the labour market status derivation methodology
with the launch of the QLFS. 7 Those who are not classified as employed are
distinguished as narrow unemployed in the QLFS if the following three
requirements are met: they have already arranged to accept a job or start a
business later; assuming they have arranged to accept a job or start a business,
they could start working or start the business within one week; and they have
taken some action to look for work or start a business in the last four weeks.
Discouraged workseekers in the QLFS are identified more strictly in these surveys
(compared with what happened in OHSs and LFSs), as the respondents’ answers to
the question ‘What was the main reason why you did not try to find work or start a
business in the last four weeks?’ is involved. For the remaining respondents who are
not classified as either employed or narrow unemployed, if their reasons for not
trying to find work or start a business in the last four weeks are ‘no jobs available in
the area’, ‘unable to find work requiring his/her skills’ or ‘lost hope of finding any kind of
work’, and they claim that they could start working (if being offered a suitable job) or
start a business within one week, they would be classified as discouraged
7 For detailed explanation on the algorithm adopted in each survey to distinguish the labour market status of the
working-age population in the QLFSs, refer to Yu (2009).
https://repository.uwc.ac.za/

8
workseekers,8 while the remaining people are defined as inactive. Hence, it is
expected that the number of discouraged workseekers and subsequently the broad
unemployed, which is equal to the sum of narrow unemployed and discouraged
workseekers, would decrease drastically between LFS 2007b and QLFS 2008Q1.
3.2 Cross-entropy re-weighting approach
In OHSs, LFSs and QLFSs, the person weights are post-stratified to the external
population totals (i.e. the mid-year population estimates at the time of the
survey derived using the Census 1991, 1996 and 2001 information), with the pre-
census and post-census year’s population being calculated using exponential
interpolation and extrapolation. Nonetheless, some concerns are raised regarding
the reliability of the post-stratification design weights (Branson, 2009), as the
mid-year population estimates could be unreliable, inconsistent over time and of
poor quality, thereby resulting in temporal inconsistencies even at the aggregate
level. Furthermore, since the survey data are cross-sectional, the purpose of the
post-stratification adjustment is to produce the best estimates of the population,
given the information available at the time of the survey. However, temporal
consistency is not considered. This creates problems when these cross-sectional
data are used for time-series analyses. Also, as the post-stratification adjustment of
the Stats SA data is conducted at the person level (i.e. the person weight), this
could result in inconsistency between person-level and household-level data, and
the resultant analyses done at person and household levels would not necessarily
agree.
Hence, it is suggested that the entropy post-stratification approach is adopted to re-
weight the person weights of all the data under study, with the person weights being
adjusted to conform to the race, gender and age distribution of the population
estimates as calculated by the Actuarial Society of South Africa (ASSA) 2003 model.
The ASSA 2003 model aims to project the South African mid-year population
from 1985, on the basis of various demographic, epidemiological and behavioural
assumptions. The model could also be used to project trends in fertility and
mortality as well as the HIV/AIDS prevalence rate. Branson (2009:17) argues that
the population data derived from the ASSA model is more time consistent. There
are two ASSA 2003 models: the full model projects the population of the four race
groups by gender and age category (18 categories in total: zero to four years, five to
nine years, and so forth, with the last category being 85 years or above) as well as
the provincial population, while the lite model does not divide the population by
race. The full model is used in this paper.
The ESSA model could be explained as follows (Branson, 2009:30 – 7; Datafirst,
2010:2 – 3):9 let x be a random variable with possible outcomes xk , k = 1, 2, .. . , K
and probabilities p = ( p1, p2, .. . , pk )’. The entropy measure is:
8 The author contacted Stats SA to enquire why these three options are considered to distinguish the discouraged
workseekers, but did not receive an answer. 9 For the detailed mathematical explanation of the re-weighting approach, refer to Appendix A.
https://repository.uwc.ac.za/

9
H(p) ¼ 0 presents the degenerate solution, one possible outcome with certainty.
It reaches a maximum when the probability distribution is uniform; that is, the
maximum entropy approach. This approach can be generalised to include prior
information about the probability distribution with the aim to improve the accuracy
of the estimates, and is known as the CE approach. It can be explained as
follows: consider a survey sample of K individuals prior to adjustment probabilities
qk; that is, the initial Stats SA person weights converted into proportions to the sum
of one. Each individual has a vector of xk characteristics (e.g. race, gender, age
group). The CE estimate of p minimises the difference from q, given the
constraints to the problem. Alternatively, this implies the person weights are
adjusted to meet aggregate demographic trends (as derived by the ASSA model)
which appear realistic over time, while simultaneously diverging as little as possible
from the original Stats SA person weights.
Once the CE person weights are derived, the household CE weight variable is created
and is equal to the mean entropy person weight within the household. In Section
4, the unemployment levels and trends obtained using the CE weights are
compared with those derived using the original Stats SA person weights to find
out whether the unemployment aggregates would differ significantly.
3.3 Application of a consistent methodology to distinguish the
unemployed
As discussed in Section 3.1, the labour market status derivation methodology has
been revised throughout the years. Hence, two questions arise: What would have
happened to the unemployment aggregates in the OHSs and LFS 2000a, had the
LFS 2000b– 07b methodology been applied? What would have happened to the
unemployment aggregates in the OHSs and LFSs, had the QLFS methodology been
applied?
With regard to the first question, the LFS 2000b– 07b methodology could be applied
in OHS 1995 – 99 as well as LFS 2000a, but the only drawback is that the OHS
1995 estimates might not be fully reliable, because the question on how soon the
respondent could start working if being offered a job is not asked in this survey.
However, upon checking the respondents’ answer of this question in the other
OHSs, it is found that about 95% of the respondents who claimed they would
accept a job offer (if being offered one) would be available to start working
within two weeks. Hence, the omission of the question on how soon the
respondent could start working should not significantly affect the reliability of the
unemployment estimates of OHS 1995, when the LFS 2000b– 07b methodology is
applied.
https://repository.uwc.ac.za/

10
As far as the second question is concerned, the QLFS methodology as it is could not
be applied on the OHSs, due to the drastic changes in the categorisation of the answers
of the questions used to classify the unemployed. In addition, the question ‘what was
the main reason why you did not try to look for work or start a business in the last four
weeks?’, the critical question used in the QLFS methodology to distinguish the
discouraged workseekers, is not asked in the OHSs.
Despite the fact that the QLFS methodology could be applied in all LFSs (as the
question on the reason for not trying to look for work or start a business in the last
four weeks are asked in the LFSs, despite the fact the question is not used in the
original algorithm to distinguish the unemployed, as discussed in Section 3.1), it
needs to be revised, because the methodology concerns whether the LF is ready to
accept a job offer or to start a business within one week, but the LFS methodology
is only concerned about the acceptance of a job offer within one week. In fact, the
questions on whether the respondents are ready to start a business were not
asked in the LFSs. Hence, the QLFS methodology is revised slightly as it does not
take the respondents’ answers on the readiness to start a business into
consideration when deriving their labour market status, before being applied on
the LFSs. This is referred to as the ‘revised QLFS methodology’.10 As a summary,
Table 1 highlights the different key indicators used to define the unemployed in each
methodology.
4. Empirical analyses
This section first examines the unemployment levels and trends between 1994 and
2011 using the original Stats SA weights. Next, the unemployment numbers are
derived again using the CE weights in order to find out whether the fluctuations, if
any, across some surveys are attributed to the inconsistent Stats SA person
weights. Finally, the LFS 2000a– 07b methodology is applied in OHS 1994 – 99
and LFS 2000a while the revised QLFS methodology is applied in all 2000 – 07
LFSs and 2008 – 11 QLFSs to check whether unemployment aggregates differ a lot.
4.1 Unemployment using the Stats SA person weights and cross-
entropy weights
Figure 1 shows that the number of narrow unemployed increases from 2.45 million
in OHS 1994 to 4.24 million in QLFS 2011Q4, while the number of broad
unemployed rises from 4.63 million to 6.56 million between the two surveys.
However, throughout the years under study, the number of unemployed under
both definitions fluctuates a lot. For example, after an unusual decrease between
OHS 1994 and OHS 1995, the increase of the number of unemployed is relatively
more rapid between OHS 1995 and LFS 2000a. In particular, the unemployed
increases abruptly by 1.18 million and 0.67 million in narrow and broad terms
respectively, during the changeover between the OHS and LFS. After a decrease
taking place in LFS 2000b, the surveys estimate that an upward trend takes place
again, and unemployment peaks at LFS 2003a.
10 Tables A.1 and A.2 in Appendix show the Stata do-files on how the LFS 2000b–07b methodology and the revised
QLFS methodology are applied in OHS 1994–LFS 2000a and all LFSs/QLFSs respectively.
https://repository.uwc.ac.za/

11
Between LFS 2003b and QLFS 2011Q4, the number of narrowed unemployed
hovers around the 4.0 to 4.5 million range (the data estimate a slight upward trend
in QLFS 2008Q4 – 10Q3, however, as a result of the impact of global recession). With
regard to the board unemployed, it shows a downward trend in general between LFS
2003b and LFS2007b, before an abrupt decline of two million takes place in QLFS
2008Q1.
https://repository.uwc.ac.za/

12
https://repository.uwc.ac.za/

13
This is attributed to the much stricter approach to distinguish the discouraged
workseekers in the QLFSs, as indicated by the fact that the number of
discouraged workseekers decreases drastically from 3.44 million to 1.18 million
during the changeover between the LFS and QLFS. Furthermore, the data suggest
a relatively more rapid upward trend in broad unemployment between QLFS
2008Q4 and 2010Q3 compared with the narrow unemployed, and this is due to
the continuous increase of the number of discouraged workseekers during the
same period.
With regard to the impact of the CE weights on unemployment aggregates across
the surveys, Figure 1 indicates that, under both definitions, the number of
unemployed is lower in OHS 1994 – 95 as well as QLFS 2009Q2 – 11Q4 after using
the CE weights. However, the abrupt trends as discussed previously still take place.
This implies that these fluctuations observed between the surveys (i.e. the upward
trend in OHS 1995 – 99, the very rapid increase between OHS 1999 and LFS 2000a,
and the extremely big decline of broad unemployed between LFS 2007b and QLFS
2008Q1) are unlikely to be caused by post-stratification weighting errors, but are
either real or attributed to the changes in the labour market status derivation
methodology throughout the surveys. In other words, the results of the empirical
analyses suggest that the inconsistent weighting technique in each survey is not the
primary reason causing the fluctuations of the unemployment estimates across
some surveys.
4.2 Unemployment re-examined applying a consistent methodology
to distinguish unemployed
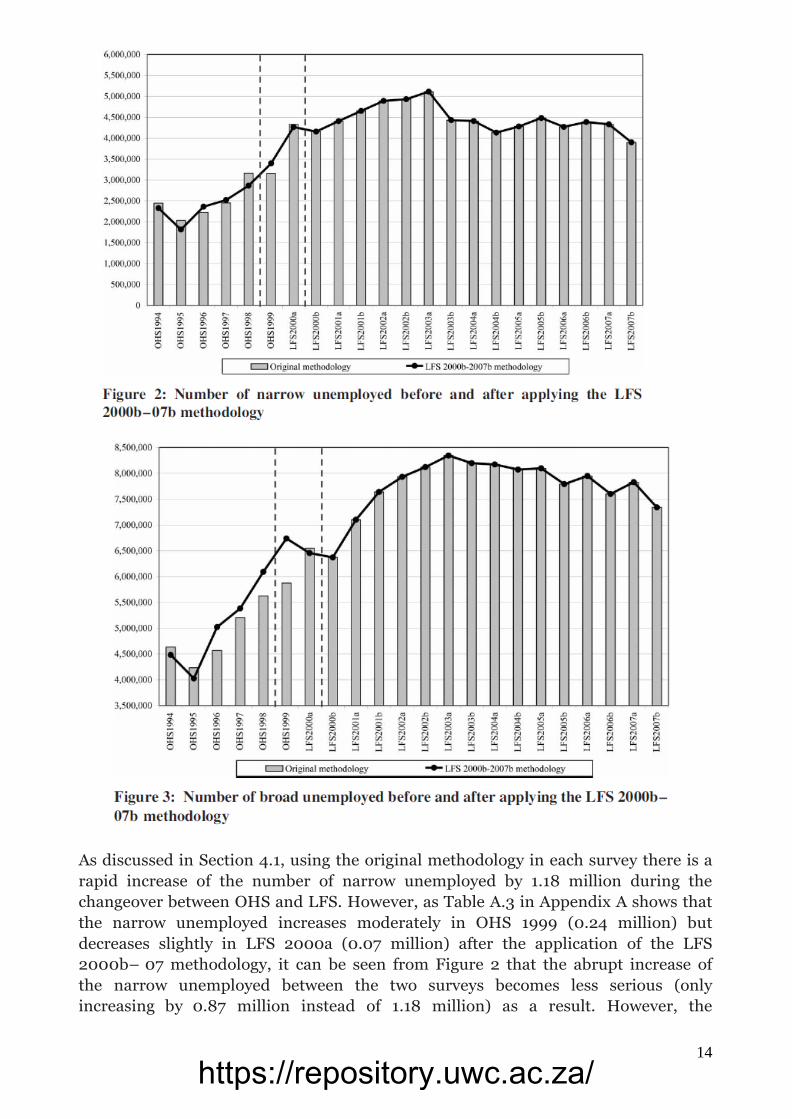
Figures 2 and 3 and Table A.3 in Appendix A present what would have happened to
the number of unemployed OHS 1994 – LFS 2000a, had the LFS 2000b– 07b
methodology been applied in these surveys. The results indicate that these aggregates
decrease in OHS 1994, OHS 1995 and LFS 2000a, but increase in OHS 1996, OHS
1997 and OHS 1999 under both definitions after the application of this
methodology. The increase is the greatest in OHS 1999 under the broad definition,
as the number of unemployed goes up by 0.86 million. The results in OHS 1998
are mixed, as the number of narrow unemployed decreases by 0.29 million but the
number of broad unemployed increases by 0.47 million after the application of the
LFS 2000b– 07b methodology.
https://repository.uwc.ac.za/
14
As discussed in Section 4.1, using the original methodology in each survey there is a
rapid increase of the number of narrow unemployed by 1.18 million during the
changeover between OHS and LFS. However, as Table A.3 in Appendix A shows that
the narrow unemployed increases moderately in OHS 1999 (0.24 million) but
decreases slightly in LFS 2000a (0.07 million) after the application of the LFS
2000b– 07 methodology, it can be seen from Figure 2 that the abrupt increase of
the narrow unemployed between the two surveys becomes less serious (only
increasing by 0.87 million instead of 1.18 million) as a result. However, the
https://repository.uwc.ac.za/

15
unusual decrease of unemployed between the 1994 and 1995 OHSs as well as the
upward trend in OHS 1995 – 99 still takes place even after the application of a
consistent labour market status derivation methodology. This suggests that the
relatively rapid upward trend in OHS 1995 – 99 could be real, confirming the
argument by Burger et al. (2012).
With regard to the broad unemployment estimates, due to the rapid increase of
broad unemployed in OHS 1999 (0.86 million) but slight decrease in LFS 2000a
(0.09 million) after adopting the LFS 2000b– 07 methodology, Figure 3 shows
that the previously mentioned abrupt increase of broad unemployed between the
two surveys, using the original methodology in each survey, no longer happens.
Instead, broad unemployed declines by 0.28 million between the two surveys after
adopting the LFS 2000b– 07 methodology. Nonetheless, even after the consistent
application of the latter methodology in the OHSs, the decrease of broad
unemployed between OHS 1994 and OHS 1995 and the upward trend in OHS 1995 –
99 still take place. The results once again suggest that the upward trend in OHS 1995 –
99 could be real.
To sum up, the changes in the labour market status derivation methodology in the
OHSs and LFS 2000a could partly explain the fluctuations and abrupt changes in
the unemployment aggregates in these surveys. Also, the labour market status
derivation methodology adopted in OHS 1999 might have led to serious
underestimation of the unemployed (especially under the broad definition) in this
survey, thereby causing the abrupt increase of unemployment estimates between
OHS 1999 and LFS 2000a. However, even after adopting the LFS 2000b– 07
methodology in the OHSs and LFS 2000a, the abrupt increase of narrow
unemployed between OHS 1999 and LFS 2000a still takes place. This implies this
sudden increase could either be real or due to the drastic changes in the
questionnaire design. Also, the upward trends of both narrow and broad
unemployed in OHS 1995 – 99 remain the same, even after applying a consistent
labour market status derivation methodology in these surveys. This implies that the
increase of unemployed in the late 1990s could be real, as argued by the studies
discussed in Section 2.
Turning the attention to the impact of the adoption of the revised QLFS methodology
on the LFS and QLFS unemployment estimates, Figure 4 shows that, before the
application of this methodology, the number of discouraged workseekers decreases
abruptly by 2.26 million (from 3.44 million to 1.18 million) during the changeover
between the LFS and QLFS. After the application of the methodology, the number of
discouraged workseekers in the LFSs clearly becomes lower, but the abrupt decline
between LFS 2007b and QLFS 2008Q1 still takes place, decreasing by 1.28 million
(from 2.43 million to 1.76 million) between the two surveys. Consequently, the
abrupt decrease of the number of broad unemployed and broad unemployment
rate between the two surveys still take place (albeit the decline being less
https://repository.uwc.ac.za/

16
serious),11 even after the application of a consistent methodology in all LFSs and
QLFSs.
Thus, the possible reasons for the still relatively higher number of discouraged
workseekers in the LFSs could be real, or due to the difference in the questionnaire
structure between LFSs and QLFSs. Looking at the latter factor in greater detail, it is
found that the number of categories of the question on why the person did not work
or start a business in the last four weeks are only 11 in LFSs but 16 in QLFSs. The
proportions of respondents declaring the options ‘No jobs available in the area’ and
‘lost hope of finding any kind of work’ are only about 48% and 5% respectively in the
QLFSs, but are approximately 52% and 11% in the LFSs. This might therefore have
explained the higher number of discouraged workseekers being distinguished in the
LFSs even after the revised QLFS methodology is applied.
Furthermore, with regard to how soon the respondent could start working if being
offered a job, the respondents were given the options ‘within a week’, ‘within two
weeks’, ‘within four weeks’ and ‘later than four weeks from now’ to choose from, but
this question is asked very differently as whether the respondents could start working
within a week if they are offered a job, and they could only have ‘yes’, ‘no’ and ‘don’t
know’ to choose from. Thus, the difference in the way this question is asked could also
play a role to explain why the number of broad unemployed is still higher in the LFSs
even after the use of the revised QLFS methodology. To conclude, the LFS and QLFS
aggregates of discouraged workseekers and broad unemployment are incomparable.
Finally, as discussed in Section 3.1 and shown in Table 1, it is only in the LFS 2000b–
07b that the respondents could be classified as unemployed if they declare they
could start working within two weeks, but this criterion is ‘within one week’ in
other surveys. Hence, Table A.4 in Appendix A shows the unemployment numbers
in these surveys, had the ‘within two weeks’ criterion been changed to ‘within one week’.
As expected, using the latter criterion, this leads to lower unemployment
estimates, but the decrease is not significant enough to remove the abrupt decline
of broad unemployment between LFS 2007b and QLFS 2008Q1. This is because
the last row of the table shows that, even after adopting the ‘within one week’
criterion in LFS 2007b, the number of broad unemployed only decreases from
7.34 million to 7.19 million. However, the latter estimate is still much higher than
the 5.37 million broad unemployment estimates in QLFS2008Q1. In other words, it
is rather the adoption of a much stricter approach to distinguish the discouraged
workseekers in the QLFS (as discussed in Section 3.1) as well as the change in
questionnaire structure as discussed above that mainly account for the
incomparability of broad unemployment aggregates between LFSs and QLFSs.
11 The number of broad unemployed drops by 1.97 million (from 7.34 million to 5.37 million) between LFS 2007b and
QLFS 2008Q1 if the original methodology is applied in each survey, but still decreases by 1.03 million (from 6.37
million to 5.34 million) even after the use of the revised QLFS methodology.
https://repository.uwc.ac.za/

17
5. Conclusion
Given the importance of the labour market to the economic growth of any country, it
is vital to infer unemployment levels and trends correctly from the labour data. In
South Africa, several researchers compare selected household surveys with each
other and derive conclusions about the ‘trends’ in unemployment for the whole period
between surveys, with the most commonly used approach being the comparison of
OHS 1995 with the latest available OHS or LFS at the time of the study. Such a
methodology may give misleading results and it is preferable to look at all the
available surveys before real trends could be determined. In fact, one must interpret
the OHS 1994 – 95 unemployment estimates with caution, as the labour market
status derivation methodology is not known. However, examining all of the
latest available OHSs, LFSs and QLFSs, despite giving a clearer picture on the
possible fluctuations and trends of unemployment, still does not suggest that the
results are fully reliable and comparable.
Hence, this paper first examines all available labour surveys and it is found that
unemployment increases rapidly in OHS 1995 – 99, and an extremely rapid
increase takes place between OHS 1999 and LFS 2000a under both narrow and
broad terms. Also, there is an abrupt decrease in the number of discouraged
workseekers and broad unemployed between LFS 2007b and QLFS 2008Q1.
These fluctuations are either real, due to the adoption of inconsistent weighting
techniques, or attributed to the changes in the methodology to classify the
unemployed. After using the minimum CE approach to re-weight all datasets under
study, the trends in the number and trends of unemployed do not show any
significant changes. This implies that the large discrepancies in these
unemployment estimates are not the result of using the inconsistent Stats SA
weights.
When the LFS 2000b– 07b labour market status derivation methodology is applied
in OHS 1994 – LFS 2000a, the abrupt changes in broad unemployment between
OHS 1999 and LFS 2000a no longer happens as a result. In other words, the OHS
and LFS broad unemployment aggregates become more comparable with the
adoption of the LFS methodology in both surveys. In contrast, when the revised
QLFS methodology is applied in all LFSs and QLFSs, despite the fact that the
number of discouraged workseekers becomes lower in the LFSs, it is still relatively
greater when compared with the QLFS estimates. Also, the abrupt decline in the
number of discouraged workseekers and broad unemployed still takes place (albeit
the extent of the abrupt decline being smaller) during the changeover between
LFS and QLFS. Hence, the incomparability problem between LFSs and QLFSs is
still not fully solved even with the application of the revised QLFS methodology in
these surveys, meaning that it is not possible to derive comparable long-term trends
in broad unemployment aggregates.
https://repository.uwc.ac.za/
18
References
Actuarial Society of South Africa, 2003. ASSA 2003 full model.
http://aids.actuarialsociety.org.za/default.asp?pageid=3282 Accessed 1
September 2011.
Altman, M, 2008. Revisiting South African employment trends in the 1990s. South
African Journal of Economics 76(2), 126 – 47.
Arora, A & Ricci, LA, 2005. Unemployment and the labour market. In Nowak, M &
Ricci, LA (Ed.), Post-apartheid South Africa: The First Ten Years. International
Monetary Fund, Washington, DC, 23 – 47.
Bannerjee, A, Galiani, S, Levinsohn, J & Woolard, I, 2006. Why has unemployment
risen in the new South Africa? CID Working Paper No. 134, Centre for
International Development, Harvard University, Harvard.
Bhorat, H. 1999. The October Household Survey, unemployment and the informal
sector: A note. South African Journal of Economics 67(2), 143 – 6.
Bhorat, H, 2004. Labour market challenges in the post-apartheid South Africa.
South African Journal of Economics 72(5), 940 – 77.
Bhorat, H, 2006. Labour supply and demand constraints on employment
creation: A microeconomic analysis. In Padayachee, V (Ed.), The
Development Decade? Economic and Social Change in South Africa: 1994 –
2004. Human Sciences Research Council, Pretoria, 275 – 301.
Bhorat, H, 2009. Unemployment in South Africa: Descriptors and determinants.
Proceedings of the IZA (Institute for the Study of Labor) / World Bank
Conference on Employment and Development, 4 – 5 May, Bonn.
Bhorat, H & Oosthuizen, M, 2005. The post-apartheid South African labour
market. DPRU Working Paper 05/93, Development Policy Research Unit,
Cape Town.
Branson, N, 2009. Re-weighting the OHS and LFS national household survey data
to create a consistent series over time: A cross entropy estimation approach.
SALDRU Working Paper Number 38, Southern Africa Labour and
Development Research Unit, Cape Town.
Burger, RP & Jafta, R, 2006. Returns to race: Labour market discrimination in post-
apartheid South Africa. Stellenbosch University Economic Working Paper:
WP04/06, Stellenbosch University, Stellenbosch.
Burger, RP & Woolard, I, 2005. The state of the labour market in South Africa after the
first decade of democracy. Journal of Vocational Education and Training 57(4),
453 – 76.
Burger, RP, Van der Berg, S & Von Fintel, D, 2012. The unintended consequences of
education policies on South African participation and unemployment.
Stellenbosch University Economic Working Papers: 11/2012, Stellenbosch
University, Stellenbosch.
Casale, D & Posel, D, 2002. The continued feminisation of the labour force in South
Africa: An analysis of recent data trends. South African Journal of Economics
70(1), 156 – 84.
Casale, D, Muller, C & Posel, D. 2004. ‘Two million net new jobs’: A reconsideration of the
rise in employment in South Africa, 1995 – 2003. South African Journal of
Economics 72(5), 978 – 1002.
https://repository.uwc.ac.za/

19
Datafirst, 2010. Calibrating StatsSA’s National Household Survey weights to a
consistent series over time.
http://www.datafirst.uct.ac.za/wiki/images/b/bb/Calibrating_StatsSA%27s_
Survey_Weights_lw.pdf Accessed 28 November 2012.
Devey, R, Skinner, C & Valodia, I, 2006. Second best? Trends and linkages in the
informal economy in South Africa. DPRU Working Paper 06/102,
Development Policy Research Unit, Cape Town.
Dias, R & Posel, D, 2006. Unemployment, education and skills constraints in
post-apartheid South Africa. DPRU Working Paper 07/120, Development
Policy Research Unit, Cape Town.
Dias, R & Posel, D, 2007. Unemployment, education and skills constraints in post-
apartheid South Africa. DPRU Working Paper 07/120, Development Policy
Research Unit, Cape Town.
Golan, A, Judge, G & Miller, D, 1996. Maximum Entropy Economics, Robust
Estimation with Limited Data. John Wiley and Sons Ltd, West Sussex,
Chichester.
Haussmans, R, 2007. Measurement of employment, unemployment and
underemployment – current international standards and issues in their
application. http://www.ilo.org/wcmsp5/ groups/public/—dgreports/—
stat/documents/publication/wcms_088394.pdf Accessed 26 November
2012.
Heintz, J & Posel, D, 2008. Revisiting informal employment and segmentation in the
South African labour market. South African Journal of Economics 76(1), 26 –
44.
Hlekiso, T & Mahlo, N, 2009. An overview of the demand and supply of skills in the
South African labour market. Proceedings of the ESSA (Economic Society of
South Africa) Conference, 7 – 9 September, Port Elizabeth.
Hodge, D, 2009. Growth, employment and unemployment in South Africa. South
African Journal of Economics 77(4), 488 – 504.
Kingdon, GG & Knight, J, 2004. Unemployment in South Africa: The nature of the
beast. World Development 32(3), 391 – 408.
Kingdon, GG & Knight, J, 2007. Unemployment in South Africa, 1995 – 2003: Causes,
problems and policies. Journal of African Economies 16(5), 813 – 48.
Lam, D, Leibbrandt, M & Mlatsheni, C, 2008. Education and youth unemployment in
South Africa. SALDRU Working Paper Number 22, Southern Africa Labour
and Development Research Unit, Cape Town.
Mahadea, D, 2003. Employment and growth in South Africa: Hope or despair?
South African Journal of Economics 71(1), 21 – 48.
Mahadea, D & Simson, R, 2011. Challenges of employment creation in South Africa.
Proceedings of the ESSA (Economic Society of South Africa) Conference, 5 – 7
September, Stellenbosch. Mlatsheni, C & Rospabe , S, 2002. Why is youth
unemployment so high and unequally spread in South Africa? DPRU Working
Paper 02/65, Development Policy Research Unit, Cape Town.
Nattrass, N, 2000. Inequality, unemployment and wage-setting institutions in South
Africa. Studies in Economics and Econometrics 24(3), 129 – 41.
Oosthuizen, M, 2006. The post-apartheid labour market: 1995 – 2004. DPRU
Working Paper 06/ 103, Development Policy Research Unit, Cape Town.
https://repository.uwc.ac.za/
20
Paton, C, 2011. Trade union strategies are not helping the poor and unemployed. In
Institute for Justice and Reconciliation (Ed.), Transformation Audit 2011:
From Inequality to Inclusive Growth. Institute for Justice and Reconciliation,
Cape Town, 40 – 5.
Pauw, K, Oosthuizen, M & Van der Westhuizen, C, 2008. Graduate unemployment in
the face of skills shortage: A labour market paradox. South African Journal of
Economics 76(1), 45 – 57. Rogerson, CM, 2004. The impact of the South African
government’s SMME programmes: A ten-year review (1994 – 2003).
Development Southern Africa 21(5), 765 – 84.
Van der Westhuizen, C, Goga, S & Oosthuizen, M, 2006. Women in the South
African labour market: 1995 – 2005. DPRU Working Paper 06/118,
Development Policy Research Unit, Cape Town.
Von Fintel, D & Burger, R, 2009. The South African labour market in the global
financial crisis: Recovering lost gains. In Institute for Justice and
Reconciliation (Ed.), Transformation Audit 2009: Recession and Recovery.
Institute for Justice and Reconciliation, Cape Town, 34 – 42.
Yu, D, 2007. The comparability of the Statistics South Africa October Household
Surveys and Labour Force Surveys. Stellenbosch University Economic
Working Paper: 17/2007, Stellenbosch University, Stellenbosch.
Yu, D, 2008. The South African labour market 1995 – 2006. Stellenbosch University
Economic Working Papers: 05/2008, Stellenbosch University, Stellenbosch.
Yu, D, 2009. The comparability of Labour Force Survey and Quarterly Labour
Force Survey. Stellenbosch University Economic Working Paper: 08/2009,
Stellenbosch University, Stellenbosch.
Yu, D, 2012. Defining and measuring informal employment in South Africa.
Development Southern Africa 29(1), 157 – 75.
https://repository.uwc.ac.za/

21
Appendix A. Mathematical explanation of the cross-entropy re-
weighting approach
In equation terms, the CE approach could be explained as follows (Golan et al.,
1996;Branson, 2009:34 – 6):
subject to the moment consistency constraints:
and adding-up normalisation constraint:
Each xt stands for a person-level indicator, indicating which demographic group
the individual is in (e.g. the individual’s gender, age category and race). T represents
the number of restrictions. For example, if race (four categories), gender (two
categories) and age groups (18 categories) are used, altogether there are 144 race–
gender– age constraints (4 × 2 × 18), nine provincial constraints, plus the category
‘missing’ (i.e. those with unspecified race, gender or age); that is, 154 (144 + 9 + 1)
constraints in total.
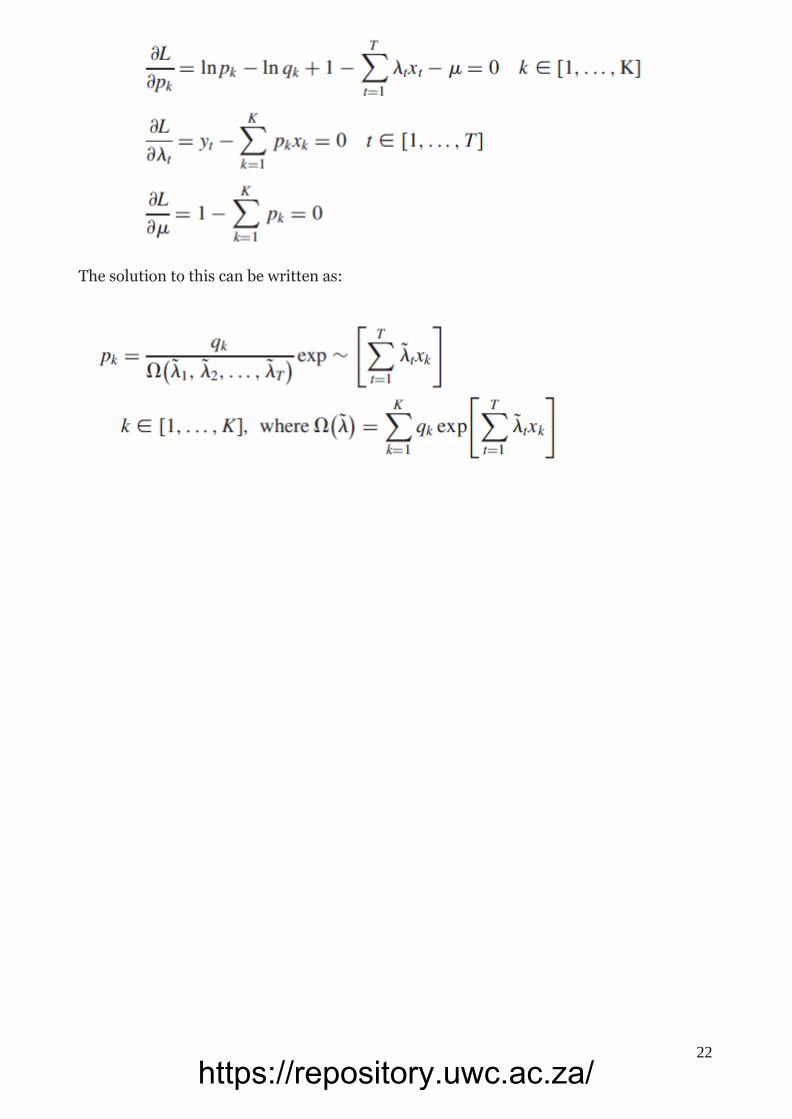
The new probability person weights are estimated as follows:
The first-order conditions are:
https://repository.uwc.ac.za/
22
The solution to this can be written as:
https://repository.uwc.ac.za/

23
https://repository.uwc.ac.za/

24
https://repository.uwc.ac.za/

25
https://repository.uwc.ac.za/

26
https://repository.uwc.ac.za/

27
https://repository.uwc.ac.za/