revolution in project selection: virginia dot smart scale€¦ · · 2016-07-20revolution in...
TRANSCRIPT
Revolution in project selection Virginia DOT Smart Scale
Ronique Day Policy Analyst
Office of the Virginia Secretary of Transportation
Chad Tucker Assistant Administrator
Division of Transportation and Mobility Planning
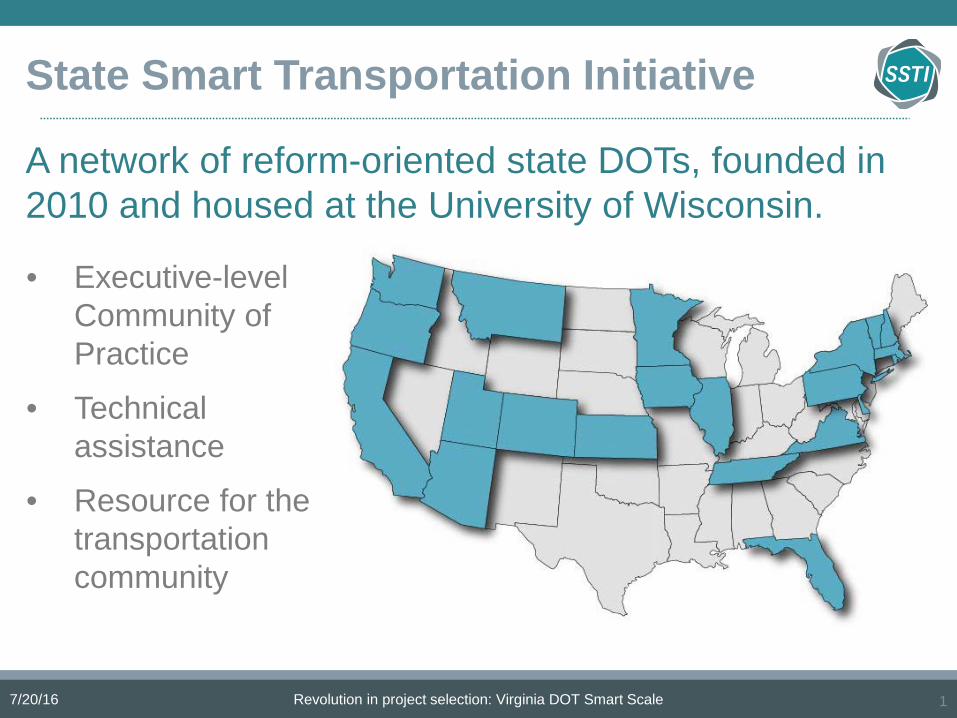
State Smart Transportation Initiative
A network of reform-oriented state DOTs founded in 2010 and housed at the University of Wisconsin
72016 Revolution in project selection Virginia DOT Smart Scale 1
bull Executive-level Community of Practice
bull Technical assistance
bull Resource for the transportation community
Virginiarsquos Smart Scale Prioritization Process ndash Implementing HB2
Ronique Day Office of Secretary of TransportationChad Tucker Virginia Department of TransportationJuly 20 2016
3
Overview
bull Building the foundation for House Bill 2 (SMART Scale)bull Integration into planning and programmingbull Grant applicationbull Screening and Validationbull Measures and Scoringbull Round 1 summary and lessons learned
Building the Foundation for House Bill 2
5
Virginiarsquos Statewide Prioritization Process
bull Legislation championed by Democratic Governor and the Republican Speaker of the House
ndash 2014 Virginia General Assemblyndash sect331 ndash 2355 of the Code of Virginia
bull Requires Commonwealth Transportation Board (CTB) use objective and quantifiable process for the allocation of construction funds
ndash Board allocates construction funds for the Commonwealthndash Programming of funds for capacity enhancing projectsndash Intent for the CTB to select the highest ranking projects however they maintain the
authority to propose adjustments to the rankings
bull Policy developed over a 16 month period and adopted by Commonwealth Transportation Board in June 2015
6
Broad-Based Evaluation Factors
Candidate projects are screened to determine if they qualify to be scored
All projects by law are evaluated using the following factorsbull Congestion mitigationbull Economic development
bull Accessibilitybull Safetybull Environmental Qualitybull Land Use (only in areas over 200000)
7
Three Key Goals
Established goals for successful implementationbull Promote performance in the selection of projects
bull Provide stability to the Six-Year Improvement Program
bull Establish project pipeline that links planning to programming
Board directionbull Simple and straightforward bull Does not require applicants to invest significant time and resources or require
the use of consultants bull VDOT and DRPT staff will be available to provide support and tools for
applicants in compiling data and information needed for application bull The application process will be electronic and map-based to facilitate
automated population of key data elements
8
Context for Reform
bull Legislature enacted significant transportation revenue package in 2013
bull Desire by lawmakers to demonstrate to public the benefits from new taxes
bull Decision-making process was opaque and sense that it was driven by politics
bull Lawmakers and stakeholders concerned that state was not advancing projects that addressed the more urgent needs
bull Governor McAuliffe campaigned on reforming transportation to lsquopick the right projects build the best onesrsquo
9
Keys to Political Support
bull Political will
bull Broad based evaluation ndash something for everyone
bull Recognizes that different parts of the state have different needs
bull Mode-neutral
bull Legislature controlled by opposite party of Administration
bull Did not impact fully-funded projects
10
Concerns of State and Local Officials
bull lsquoAll the funds will all go to Northern Virginiarsquo
bull lsquoRural areas will lose out in this processrsquo
bull lsquoMy region pays taxes and has transportation needsrsquo
bull lsquoPrioritization should be done at a regional level not a statewide levelrsquo
bull lsquoPolitics will still drive this process ndash I do not think this is going to change anythingrsquo
11
Public Engagement is Critical
bull 27 Commonwealth Transportation Board public hearings across the state
bull Stakeholder session in every construction district
bull Individual meetings with every Metropolitan Planning Organization (MPO)
bull Numerous presentations at stakeholder and association conferences
12
Guiding Principles for Measures
bull Analyze what matters to people and has a meaningful impact
bull Ensure fair and accurate benefits to cost analysis
bull Transparent and understandable
bull Must work for both urban and rural areas
bull Must work for all modes of transportation
bull Minimize overlap in measuresbull Measure characteristics
ndash ldquo5 Wsrdquo
13
Process Used to Develop Measures
bull Researched best practices from other state DOTs and MPOs
bull Secretary established an Executive Work Group to oversee implementation
bull Established sub-work group focused specifically on measures and the online
portal
bull Held peer exchange workshop
bull Held outreach meetings with key stakeholders
bull Surveyed stakeholders
bull Pilot project evaluation brought before the Board
14
Reformed Funding Formulas
bull In 2015 legislature adopted Administrationrsquos recommended revisions to funding formulasndash Amend and reenact sect 332-358 which established the highway allocation
formula for the $500 million CTB annual allocation bull Runs all state and federal construction revenues excluding specialized
programs through formulabull After capital rehabilitation and reconstruction
ndash 50 of funds distributed at statewide-level based on prioritization processndash 50 of funds set-aside for districts based on formula and then distributed
within the district using prioritization process
15
Benefits of Smart Scale
The team successfully developed and implemented what is likely the most
transformative transportation legislation in Virginia the last 30 years
bull Improved transparency
bull Enhanced accountability
bull Better certainty for project sponsors and business community
bull Project design focused on achieving most benefits for the least cost
bull Provides political cover to allow planning and programming to proceed
without intervention
Integrating into the planning and programming processes
16
Life Cycle of a Candidate Project
bull How itrsquos planned
How itrsquos scored How itrsquos funded
bull MPO CLRPs
bull Corridor Studies
bull STARS program
bull Local Comp Plans
bull District Grant
bull High-Priority
17
bull VTrans is the long-range statewide multimodal policy plan - Vision and Goals for transportation in the Commonwealth
bull VTrans2040 serves two functions and produces two independent but connected documentsbull VTrans2040 - 25 year vision document
bull VTrans2040 - Multimodal Transportation Plan (VMTP) includes Multimodal Needs Assessment
How it is plannedVTrans 2040
19
First round of projects ndash FY16-22 SYIP update$500M for High Priority Projects
bull Locally or Regionally submitted projects compete statewide
$500M for Construction District Grantsbull Formula driven distribution to 9 construction
districtsbull Locally submitted projects compete within each
district
How it is fundedHB 1887
19
20
How are projects filtered
VTrans2040 - Long Range Statewide Multimodal Policy Planbull Vision Documentbull Multimodal Transportation Plan and Needs Assessment
wwwvtransorg20
21
21
Note Map includes all locally designated growth areas that appear consistent with the intent of 152-22231 OIPI is asking that localities who want their growth areas to qualify for HB2 funding to add a code reference (152-22231) by October 1 2015 to ensure that projects submitted to promote these areas meet the HB2screening requirement Projects promoting UDA-like designated growth areas with the proper code reference submitted after October 1 will not be considered in the first round of HB2 project screening
21
VTrans - Needs Assessment
4 Need Categoriesbull Corridors of Statewide Significancebull Regional Networksbull Urban Dev Areasbull Safety
Virginia CoSS
22
Regional Networks
Defined as bull Jurisdictions that are included either in
whole or in part within MPO Planning Area Boundaries
bull Any additional element of the transportation system that is connected to the MPO area and deemed critical to the MPO
23
Urban Development AreasUDAs
Areas voluntarily designated by local governments as prime areas for future economic growth pursuant to 152-22231
bull Must reflect transportation-efficient land use principles includingbull Mixed-use land usebull Interconnected streetsbull Moderately compact growth
24
Safety
bull Safety needs based on the top 100 intersections and segments identified based on PSI Potential for Safety Improvement in each district
bull PSI score is the number of serious or fatal crashes minus the predicted rate for that typevolume roadway
httpswwwgooglecommapsdu0viewermid=1mQGiz1QQWRJ0T3HEVUiiDGS9dLQ
25
SMART Scale Grant Application
26
Who can submit
Project System
Regional Entity (MPOs PDCs)
Locality (Counties Cities Towns)
Public Transit Agencies
Corridor of Statewide Significance
YesYes with a resolution of support from relevant
regional entity
Yes with resolution of support from
relevant regional entity
Regional Network Yes Yes
Yes with resolution of support from
relevant entity
Urban Development Area
No Yes No
Localities are also eligible to submit projects addressing a safety need identified in VTrans 2040 under the District Grant Program
27
28
How do they submit an application
All your grant request applications managed
in one system
Enhanced project location mapping
SMART Scale Validation and Screening
32
33
Validation Process
bull VDOT and DRPT review of applicationbull Focus on the following
ndash Project eligibility Studies not allowed New Interchanges with no study or Interchange Justification Report (IJR) Projects lacking a planning preferred alternative
ndash Scope and Cost Estimatendash Project readinessndash HB2 Factors
Scoring items that applicant provides in the following categories ndash 1) Accessibility 2) Environment 3) Economic Development and 4) Land Use and Transportation Coordination (Area Types A and B only)
33
34
Screening Process
bull High Priority Projects ndash Project must meet a need identified for ndash Corridor of Statewide Significance ndash Regional Network
bull Construction District Grant Programs ndash Project must meet a need identified forndash Corridor Statewide Significancendash Regional Networkndash Urban Development Areandash Safety
VTrans Multimodal Work GroupVDOT
34
SMART Scale Measures and Scoring
35
36
SMART Scale Factors
37
Factor AreasGoals that guided measure
development
bull Safety ndash reduce the number and rate of fatalities and severe injuries
bull Congestion ndash reduce person hours of delay and increase person throughput
bull Accessibility ndash increase access to jobs and travel optionsbull Economic Development ndash support economic development
and improve goods movementbull Environmental Quality ndash improve air quality and avoid
impacts to the natural environmentbull Land Use ndash support transportation efficient land development
patterns
38
Measuring SAFETY
ndash 50 of score ndash Expected reduction in total fatalities and severe injuries (100 of score for transit projects)
ndash 50 of score ndash Expected reduction in the rate of fatalities and severe injuries per 100 million vehicle miles traveled
39
Safety - How
bull Highway Projectsbull Compile fatalsevere crash data for project limits (5 years)bull Based on project scope select Crash Modification Factorbull Use CMF to calculate reduction in crashes and rate
bull TransitTravel Demand ManagementNew Locationbull Identify corridor servedbull Use ridershipvolume reduction to calculate reduction in VMTbull Use VMT reduction to calculate crash reduction
39
40
Measuring CONGESTION MITIGATION
ndash 50 of score ndash Change in peak period (multimodal) person throughput in the project corridor
ndash 50 of score - Change in the amount of peak period person hours of delay in the project corridor
41
Congestion ndash HowPerson Throughput
bull Highway Projectsbull Volume to Capacity ratio calculated for peak hourbull Calculate volume above capacity now being served by improvement ndash
convert to person throughputbull Apply expansion factor to account for peak period ndash based on INRIX
Travel Time Index (TTI)bull TransitTravel Demand Management
bull Identify corridor servedbull Determine peak period ridershipvolume reduction (Throughput A)bull Using process above for highways calculate additional vehicle
demand that can now be served based on transit diversion in corridor served (Throughput B)
bull Add together to get total person throughput
41
42
bull Highway Projectsbull Volume to Capacity ratio
calculated for each hour of day to estimate speed
bull Sum delay reduction (up to posted speed limit) for peak period and convert to person hours
bull TransitTravel Demand Managementbull Identify corridor servedbull Determine peak period
ridershipvolume reduction bull Using process above for highways
calculate reduction in person hours
Congestion ndash HowPerson Hours of Delay
42
43
Congestion ndash HowAdjusting Volume to Capacity
VC
VC
No build
Build
Before Speed
After Speed
Transit PampR
Capacity Improvement
43
44
Measuring ACCESSIBILITY
ndash 60 of score ndash Change in cumulative job accessibility (within 45 minutes) (within 60 minutes for transit projects)
ndash 20 of score - Change in cumulative job accessibility for disadvantaged populations (within 45 minutes by automobile and 60 minutes by transit)
ndash 20 of score ndash Assessment of the project support for connections between modes and promotion of multiple transportation choices
44
45
Accessibility - HowAccess to Jobs
bull All Projectsbull Using analysis for congestion measures ndash use change in speedbull Also consider reduced travel distances from new facilities and
changes in land development patterns bull Use improvement in speed to code improvement into Accessibility
GIS tool ndash conduct before and after analysis to get change in cumulative job access
bull Accessibility Toolbull GIS based modelbull Analysis done at Census block group level ndash job access between
each block group within 45 minutes (60 minutes for transit)bull Decay factor applied based on travel time
45
46
bull Accessibility Tool
1 2 3 4 5
6 7 8 9 10
11 12 13 14 15
Tool analyzes existing accessibility to jobs
No-
Build
Accessibility - HowAccess to Jobs
46
47
Accessibility - HowAccess to Jobs
bull Accessibility Tool
1 2 3 4 5
6 7 8 9 10
11 12 13 14 15
Tool moves to next block assessing existing accessibility
No-
Build
47
48
Accessibility - HowAccess to Jobs
bull Accessibility Tool
1 2 3 4 5
6 7 8 9 10
11 12 13 14 15
Process is repeated for all blocks to establish existing accessibility to jobs
No-
Build
48
49
Accessibility - HowAccess to Jobs
bull Accessibility Tool
1 2 3 4 5
6 7 8 9 10
11 12 13 14 15
Tool then analyzes change in access to jobs based on proposed improvement
Build
49
50
Accessibility - HowAccess to Jobs
bull Accessibility Tool
1 2 3 4 5
6 7 8 9 10
11 12 13 14 15
Tool moves to next block calculating change in job access
Build
50
51
Accessibility - HowAccess to Jobs
bull Accessibility Tool
1 2 3 4 5
6 7 8 9 10
11 12 13 14 15
Process is repeated for all blocks ndash increase in access for each block is summed and used to score projects
Build
51
52
Disadvantaged Access to Jobs
bull Similar process in previous slides used for disadvantaged access to jobs
bull Main difference is the utilization of disadvantaged population data in the calculation
bull Disadvantaged populationbull Low income elderly minority and Limited English Proficiency
population percentage by Census Block Group
bull Compared block group and identified block groups in the 75th
percentile of the region ndash regions defined as PDCMPONVTA
52
53
Accessibility - HowAccess to Travel Options
bull Projects receive points based on features than enhance multimodal access (Max 5 points)bull Transitbull Park and Ridebull Bikebull Pedestrianbull HOVHOTbull Real time traveler info or wayfinding
bull Scaled by the number of anticipated Non-SOV usersbull Transit Users + Bike Users + Pedestrians +
HOVPark and Ride
53
54
Measuring ENVIRONMENTAL QUALITY
ndash 50 of score ndash Potential of project to reduce criteria air pollutant and greenhouse gas emissions
ndash 50 of Score ndash Potential impacts to natural and cultural resources
54
55
Environment ndash HowAir Quality and Energy
bull Air QualityEnergybull Points awarded based on
Providing bicycle or pedestrian facilities Improvements for transit Addressing freight bottlenecks New or expanded Park and Ride lot Provisions for hybridelectric vehicles or
energy efficient infrastructurebull Points scaled based on number of non-
SOV users and truck volume
55
56
Environment ndash HowNaturalCultural Resource Impact
Sum the total acreage of land (within frac14 mile of project) in four categories
bull Conservation Landbull SpeciesHabitatbull Cultural Resourcesbull Wetlands
(Data sources VOF VDCR VDOF VDGIF NPS VDHR USFWS)
Project Conservation SpeciesHabitat Cultural Resources
Wetlands Total Acres
A 100 25 25 150 300
Example
56
57
Environment ndash HowNaturalCultural Resource Impact
Scaling Impact and Assigning PointsThe type of environmental document required for each project
will be used to assess and scale the potential natural resource impacts
bull Environmental Impact Statement ndash 50 of acreage will be used for scoring
bull Environmental Assessment ndash 30 of acreage will be used for scoring
bull Categorical Exclusion ndash 10 of acreage will be used for scoring
bull Points based on the amount of potentially impacted area divided by the total buffer area (Lowest Impact = 100 points)
57
58
Environment ndash HowNaturalCultural Resource Impact
Project Conservation SpeciesHabitat
Cultural Resources Wetlands Total
AcresEnviro
DocScaled Acres
A 100 25 25 150 300 EA 100
B 100 25 25 150 300 EIS 150
C 20 0 0 5 25 CE 25
This value gets divided by the total acres within the frac14 mile project buffer
58
59
Measuring ECONOMIC DEVELOPMENT
ndash 60 of score ndash Assessment of progress made towards new economic development (new and expansion of existing)
ndash 20 of score - Rate projects based on the extent to which the project is deemed to enhance access to critical intermodal locations interregional freight movement andor freight intensive industries
ndash 20 of score ndash Projectrsquos impact to travel time reliability
59
60
Economic Development ndash HowDevelopment Supported
bull For each project development sites are identified that the project supports
bull Proposed transportation improvement is evaluated onbull Consistency with Local Comp PlanLocal Economic Development
Strategy ndash up to 1 pointbull Consistency with Regional Economic Development Strategy ndash up to
1 pointbull Each development site is evaluated on
bull Consistency with local comp planzoning ndash up to 1 pointbull Development status ndash up to 1 pointbull Site utilities ndash up to 1 point
bull Max 5 points per site ndash used to weight square footage
60
61
bull Adjusting Weighted Square Footagendash Two Adjustments
Distance from project in miles (except sites less than 1 mile) Type of access provided
bull Formula ndash (Points) x (Square Footage) (Distance) x (Access Adjustment)
Project provides a new direct (physically to the site) primary access to the site that does not exist today 100
Project improves existing access (or relocates existing access) to the site directly (Site must be physically adjacent to the project)
100
Project enhances economic development by improving congestion mobility access or operations in the vicinity of the site but the site is not physically adjacent to the project
50
Development NameTotal Points Square Footage Distance Site Access Access
AdjustmentAdjusted
Square Footage
Development A 5 250000 2Project enhances economic development by improving congestion mobility access or operations in the vicinity of the site but the site is not physically adjacent to the project
50 312500
Development B 5 250000 02Project improves existing access (or relocates existing access) to the site directly (Site must be physically adjacent to the project)
100 1250000
Economic Development ndash HowDevelopment Supported
61
62
Economic Development ndash HowIntermodal Access
bull Project can get up to 6 pointsbull Improve access to distribution centers or intermodalmanufacturing facilities
Within 1 mile ndash 2 points 1 to 3 miles ndash 1 point
bull Improve STAA Truck Route Improvement to STAA route - 2 points Improve access to STAA route ndash 1 point
bull Improve access or reduce congestion around portairports Within 1 mile - 2 points 1-3 miles ndash 1 point
bull Point are scaled by freight tonnage along corridor ndash IHS Transearch data was used to calculate daily tonnage on the project
Improve Access to distro intermodal and manufacturing
Improve STAA truck route
Improve access reduce congestion portsairports
Tonnage (1000s) per day
Measure Scaled by tonnage
Project A 200 200 000 16307 65228
Project B 100 200 000 20815 62445
Project C 200 100 000 477 1431
62
63
Measuring LAND USE
ndash 100 of score ndash Degree to which project will support transportation efficient land use patterns and local policies
bull Points awarded based onbull Promoting walkable bicycle friendly mixed use developmentbull Supporting in-fill developmentbull Having an adopted corridoraccess management plan that
exceeds VDOT standardsbull Points scaled by projected 2025 population and employment
density (from MPO approved travel demand model)
63
64
Land Use ndash HowLocalRegional Land Use Policies
bull LocalRegional Land Use Policiesndash Points awarded based on
Promoting walkable bicycle friendly mixed use development
Supporting in-fill development Having an adopted corridoraccess management plan that
exceeds VDOT standards
ndash Points scaled by projected population and employment density (from MPO approved travel demand model)
64
65
How Scoring Works
10090
8070 60
Everything is Relative
65
66
Everything is Relative
Project Measure ScoreA 250 50B 300 60C 75 15D 15 3E 500 100F 150 30
Highest Value Dictates Scores
Project Measure ScoreA 200 40B 300 60C 75 15D 15 3E 500 100F 150 30
Project Measure ScoreA 250 333B 300 40C 75 10D 15 2E 750 100F 150 20
Change here only affects one score
Change here affects all
scores
The best project for that measure dictates the score for all other projects
66
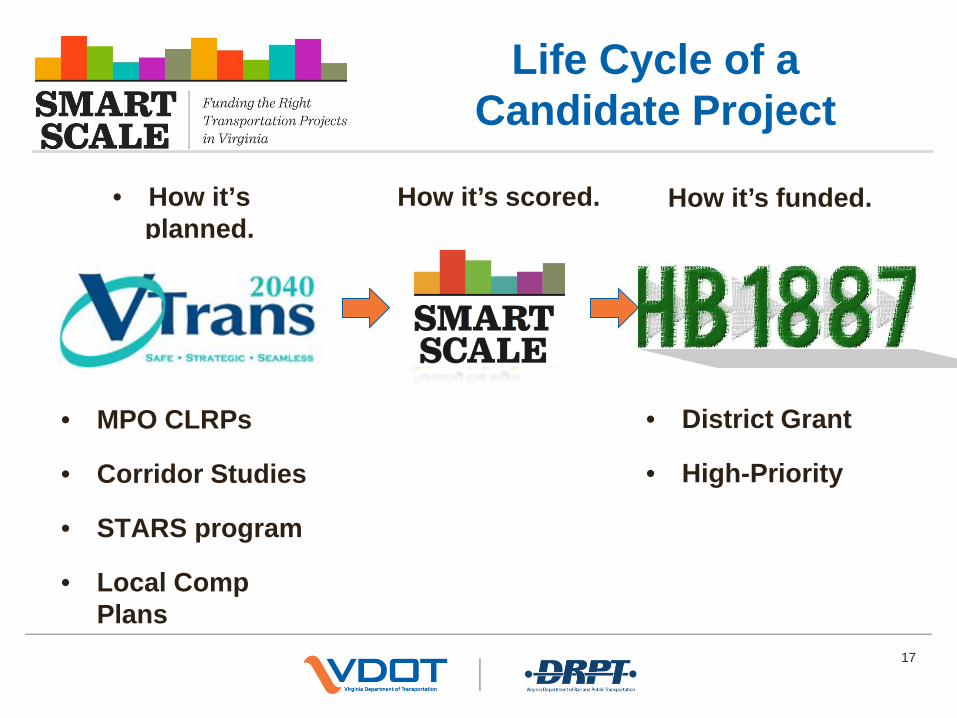
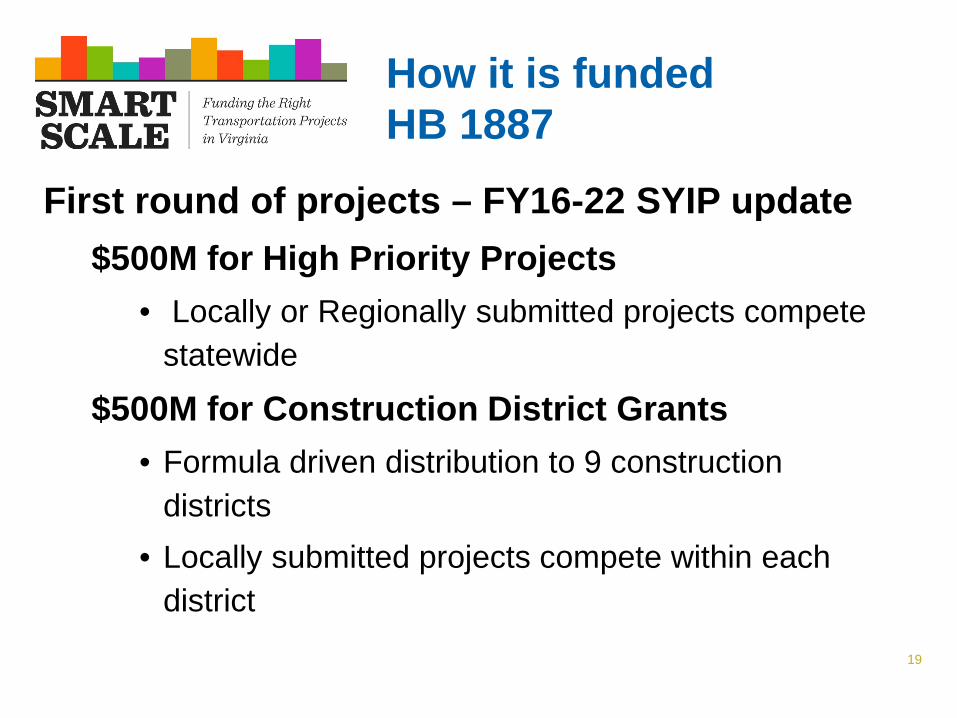
19
First round of projects ndash FY16-22 SYIP update$500M for High Priority Projects
bull Locally or Regionally submitted projects compete statewide
$500M for Construction District Grantsbull Formula driven distribution to 9 construction
districtsbull Locally submitted projects compete within each
district
How it is fundedHB 1887
19
20
How are projects filtered
VTrans2040 - Long Range Statewide Multimodal Policy Planbull Vision Documentbull Multimodal Transportation Plan and Needs Assessment
wwwvtransorg20
21
21
Note Map includes all locally designated growth areas that appear consistent with the intent of 152-22231 OIPI is asking that localities who want their growth areas to qualify for HB2 funding to add a code reference (152-22231) by October 1 2015 to ensure that projects submitted to promote these areas meet the HB2screening requirement Projects promoting UDA-like designated growth areas with the proper code reference submitted after October 1 will not be considered in the first round of HB2 project screening
21
VTrans - Needs Assessment
4 Need Categoriesbull Corridors of Statewide Significancebull Regional Networksbull Urban Dev Areasbull Safety
Virginia CoSS
22
Regional Networks
Defined as bull Jurisdictions that are included either in
whole or in part within MPO Planning Area Boundaries
bull Any additional element of the transportation system that is connected to the MPO area and deemed critical to the MPO
23
Urban Development AreasUDAs
Areas voluntarily designated by local governments as prime areas for future economic growth pursuant to 152-22231
bull Must reflect transportation-efficient land use principles includingbull Mixed-use land usebull Interconnected streetsbull Moderately compact growth
24
Safety
bull Safety needs based on the top 100 intersections and segments identified based on PSI Potential for Safety Improvement in each district
bull PSI score is the number of serious or fatal crashes minus the predicted rate for that typevolume roadway
httpswwwgooglecommapsdu0viewermid=1mQGiz1QQWRJ0T3HEVUiiDGS9dLQ
25
SMART Scale Grant Application
26
Who can submit
Project System
Regional Entity (MPOs PDCs)
Locality (Counties Cities Towns)
Public Transit Agencies
Corridor of Statewide Significance
YesYes with a resolution of support from relevant
regional entity
Yes with resolution of support from
relevant regional entity
Regional Network Yes Yes
Yes with resolution of support from
relevant entity
Urban Development Area
No Yes No
Localities are also eligible to submit projects addressing a safety need identified in VTrans 2040 under the District Grant Program
27
28
How do they submit an application
All your grant request applications managed
in one system
Enhanced project location mapping
SMART Scale Validation and Screening
32
33
Validation Process
bull VDOT and DRPT review of applicationbull Focus on the following
ndash Project eligibility Studies not allowed New Interchanges with no study or Interchange Justification Report (IJR) Projects lacking a planning preferred alternative
ndash Scope and Cost Estimatendash Project readinessndash HB2 Factors
Scoring items that applicant provides in the following categories ndash 1) Accessibility 2) Environment 3) Economic Development and 4) Land Use and Transportation Coordination (Area Types A and B only)
33
34
Screening Process
bull High Priority Projects ndash Project must meet a need identified for ndash Corridor of Statewide Significance ndash Regional Network
bull Construction District Grant Programs ndash Project must meet a need identified forndash Corridor Statewide Significancendash Regional Networkndash Urban Development Areandash Safety
VTrans Multimodal Work GroupVDOT
34
SMART Scale Measures and Scoring
35
36
SMART Scale Factors
37
Factor AreasGoals that guided measure
development
bull Safety ndash reduce the number and rate of fatalities and severe injuries
bull Congestion ndash reduce person hours of delay and increase person throughput
bull Accessibility ndash increase access to jobs and travel optionsbull Economic Development ndash support economic development
and improve goods movementbull Environmental Quality ndash improve air quality and avoid
impacts to the natural environmentbull Land Use ndash support transportation efficient land development
patterns
38
Measuring SAFETY
ndash 50 of score ndash Expected reduction in total fatalities and severe injuries (100 of score for transit projects)
ndash 50 of score ndash Expected reduction in the rate of fatalities and severe injuries per 100 million vehicle miles traveled
39
Safety - How
bull Highway Projectsbull Compile fatalsevere crash data for project limits (5 years)bull Based on project scope select Crash Modification Factorbull Use CMF to calculate reduction in crashes and rate
bull TransitTravel Demand ManagementNew Locationbull Identify corridor servedbull Use ridershipvolume reduction to calculate reduction in VMTbull Use VMT reduction to calculate crash reduction
39
40
Measuring CONGESTION MITIGATION
ndash 50 of score ndash Change in peak period (multimodal) person throughput in the project corridor
ndash 50 of score - Change in the amount of peak period person hours of delay in the project corridor
41
Congestion ndash HowPerson Throughput
bull Highway Projectsbull Volume to Capacity ratio calculated for peak hourbull Calculate volume above capacity now being served by improvement ndash
convert to person throughputbull Apply expansion factor to account for peak period ndash based on INRIX
Travel Time Index (TTI)bull TransitTravel Demand Management
bull Identify corridor servedbull Determine peak period ridershipvolume reduction (Throughput A)bull Using process above for highways calculate additional vehicle
demand that can now be served based on transit diversion in corridor served (Throughput B)
bull Add together to get total person throughput
41
42
bull Highway Projectsbull Volume to Capacity ratio
calculated for each hour of day to estimate speed
bull Sum delay reduction (up to posted speed limit) for peak period and convert to person hours
bull TransitTravel Demand Managementbull Identify corridor servedbull Determine peak period
ridershipvolume reduction bull Using process above for highways
calculate reduction in person hours
Congestion ndash HowPerson Hours of Delay
42
43
Congestion ndash HowAdjusting Volume to Capacity
VC
VC
No build
Build
Before Speed
After Speed
Transit PampR
Capacity Improvement
43
44
Measuring ACCESSIBILITY
ndash 60 of score ndash Change in cumulative job accessibility (within 45 minutes) (within 60 minutes for transit projects)
ndash 20 of score - Change in cumulative job accessibility for disadvantaged populations (within 45 minutes by automobile and 60 minutes by transit)
ndash 20 of score ndash Assessment of the project support for connections between modes and promotion of multiple transportation choices
44
45
Accessibility - HowAccess to Jobs
bull All Projectsbull Using analysis for congestion measures ndash use change in speedbull Also consider reduced travel distances from new facilities and
changes in land development patterns bull Use improvement in speed to code improvement into Accessibility
GIS tool ndash conduct before and after analysis to get change in cumulative job access
bull Accessibility Toolbull GIS based modelbull Analysis done at Census block group level ndash job access between
each block group within 45 minutes (60 minutes for transit)bull Decay factor applied based on travel time
45
46
bull Accessibility Tool
1 2 3 4 5
6 7 8 9 10
11 12 13 14 15
Tool analyzes existing accessibility to jobs
No-
Build
Accessibility - HowAccess to Jobs
46
47
Accessibility - HowAccess to Jobs
bull Accessibility Tool
1 2 3 4 5
6 7 8 9 10
11 12 13 14 15
Tool moves to next block assessing existing accessibility
No-
Build
47
48
Accessibility - HowAccess to Jobs
bull Accessibility Tool
1 2 3 4 5
6 7 8 9 10
11 12 13 14 15
Process is repeated for all blocks to establish existing accessibility to jobs
No-
Build
48
49
Accessibility - HowAccess to Jobs
bull Accessibility Tool
1 2 3 4 5
6 7 8 9 10
11 12 13 14 15
Tool then analyzes change in access to jobs based on proposed improvement
Build
49
50
Accessibility - HowAccess to Jobs
bull Accessibility Tool
1 2 3 4 5
6 7 8 9 10
11 12 13 14 15
Tool moves to next block calculating change in job access
Build
50
51
Accessibility - HowAccess to Jobs
bull Accessibility Tool
1 2 3 4 5
6 7 8 9 10
11 12 13 14 15
Process is repeated for all blocks ndash increase in access for each block is summed and used to score projects
Build
51
52
Disadvantaged Access to Jobs
bull Similar process in previous slides used for disadvantaged access to jobs
bull Main difference is the utilization of disadvantaged population data in the calculation
bull Disadvantaged populationbull Low income elderly minority and Limited English Proficiency
population percentage by Census Block Group
bull Compared block group and identified block groups in the 75th
percentile of the region ndash regions defined as PDCMPONVTA
52
53
Accessibility - HowAccess to Travel Options
bull Projects receive points based on features than enhance multimodal access (Max 5 points)bull Transitbull Park and Ridebull Bikebull Pedestrianbull HOVHOTbull Real time traveler info or wayfinding
bull Scaled by the number of anticipated Non-SOV usersbull Transit Users + Bike Users + Pedestrians +
HOVPark and Ride
53
54
Measuring ENVIRONMENTAL QUALITY
ndash 50 of score ndash Potential of project to reduce criteria air pollutant and greenhouse gas emissions
ndash 50 of Score ndash Potential impacts to natural and cultural resources
54
55
Environment ndash HowAir Quality and Energy
bull Air QualityEnergybull Points awarded based on
Providing bicycle or pedestrian facilities Improvements for transit Addressing freight bottlenecks New or expanded Park and Ride lot Provisions for hybridelectric vehicles or
energy efficient infrastructurebull Points scaled based on number of non-
SOV users and truck volume
55
56
Environment ndash HowNaturalCultural Resource Impact
Sum the total acreage of land (within frac14 mile of project) in four categories
bull Conservation Landbull SpeciesHabitatbull Cultural Resourcesbull Wetlands
(Data sources VOF VDCR VDOF VDGIF NPS VDHR USFWS)
Project Conservation SpeciesHabitat Cultural Resources
Wetlands Total Acres
A 100 25 25 150 300
Example
56
57
Environment ndash HowNaturalCultural Resource Impact
Scaling Impact and Assigning PointsThe type of environmental document required for each project
will be used to assess and scale the potential natural resource impacts
bull Environmental Impact Statement ndash 50 of acreage will be used for scoring
bull Environmental Assessment ndash 30 of acreage will be used for scoring
bull Categorical Exclusion ndash 10 of acreage will be used for scoring
bull Points based on the amount of potentially impacted area divided by the total buffer area (Lowest Impact = 100 points)
57
58
Environment ndash HowNaturalCultural Resource Impact
Project Conservation SpeciesHabitat
Cultural Resources Wetlands Total
AcresEnviro
DocScaled Acres
A 100 25 25 150 300 EA 100
B 100 25 25 150 300 EIS 150
C 20 0 0 5 25 CE 25
This value gets divided by the total acres within the frac14 mile project buffer
58
59
Measuring ECONOMIC DEVELOPMENT
ndash 60 of score ndash Assessment of progress made towards new economic development (new and expansion of existing)
ndash 20 of score - Rate projects based on the extent to which the project is deemed to enhance access to critical intermodal locations interregional freight movement andor freight intensive industries
ndash 20 of score ndash Projectrsquos impact to travel time reliability
59
60
Economic Development ndash HowDevelopment Supported
bull For each project development sites are identified that the project supports
bull Proposed transportation improvement is evaluated onbull Consistency with Local Comp PlanLocal Economic Development
Strategy ndash up to 1 pointbull Consistency with Regional Economic Development Strategy ndash up to
1 pointbull Each development site is evaluated on
bull Consistency with local comp planzoning ndash up to 1 pointbull Development status ndash up to 1 pointbull Site utilities ndash up to 1 point
bull Max 5 points per site ndash used to weight square footage
60
61
bull Adjusting Weighted Square Footagendash Two Adjustments
Distance from project in miles (except sites less than 1 mile) Type of access provided
bull Formula ndash (Points) x (Square Footage) (Distance) x (Access Adjustment)
Project provides a new direct (physically to the site) primary access to the site that does not exist today 100
Project improves existing access (or relocates existing access) to the site directly (Site must be physically adjacent to the project)
100
Project enhances economic development by improving congestion mobility access or operations in the vicinity of the site but the site is not physically adjacent to the project
50
Development NameTotal Points Square Footage Distance Site Access Access
AdjustmentAdjusted
Square Footage
Development A 5 250000 2Project enhances economic development by improving congestion mobility access or operations in the vicinity of the site but the site is not physically adjacent to the project
50 312500
Development B 5 250000 02Project improves existing access (or relocates existing access) to the site directly (Site must be physically adjacent to the project)
100 1250000
Economic Development ndash HowDevelopment Supported
61
62
Economic Development ndash HowIntermodal Access
bull Project can get up to 6 pointsbull Improve access to distribution centers or intermodalmanufacturing facilities
Within 1 mile ndash 2 points 1 to 3 miles ndash 1 point
bull Improve STAA Truck Route Improvement to STAA route - 2 points Improve access to STAA route ndash 1 point
bull Improve access or reduce congestion around portairports Within 1 mile - 2 points 1-3 miles ndash 1 point
bull Point are scaled by freight tonnage along corridor ndash IHS Transearch data was used to calculate daily tonnage on the project
Improve Access to distro intermodal and manufacturing
Improve STAA truck route
Improve access reduce congestion portsairports
Tonnage (1000s) per day
Measure Scaled by tonnage
Project A 200 200 000 16307 65228
Project B 100 200 000 20815 62445
Project C 200 100 000 477 1431
62
63
Measuring LAND USE
ndash 100 of score ndash Degree to which project will support transportation efficient land use patterns and local policies
bull Points awarded based onbull Promoting walkable bicycle friendly mixed use developmentbull Supporting in-fill developmentbull Having an adopted corridoraccess management plan that
exceeds VDOT standardsbull Points scaled by projected 2025 population and employment
density (from MPO approved travel demand model)
63
64
Land Use ndash HowLocalRegional Land Use Policies
bull LocalRegional Land Use Policiesndash Points awarded based on
Promoting walkable bicycle friendly mixed use development
Supporting in-fill development Having an adopted corridoraccess management plan that
exceeds VDOT standards
ndash Points scaled by projected population and employment density (from MPO approved travel demand model)
64
65
How Scoring Works
10090
8070 60
Everything is Relative
65
66
Everything is Relative
Project Measure ScoreA 250 50B 300 60C 75 15D 15 3E 500 100F 150 30
Highest Value Dictates Scores
Project Measure ScoreA 200 40B 300 60C 75 15D 15 3E 500 100F 150 30
Project Measure ScoreA 250 333B 300 40C 75 10D 15 2E 750 100F 150 20
Change here only affects one score
Change here affects all
scores
The best project for that measure dictates the score for all other projects
66
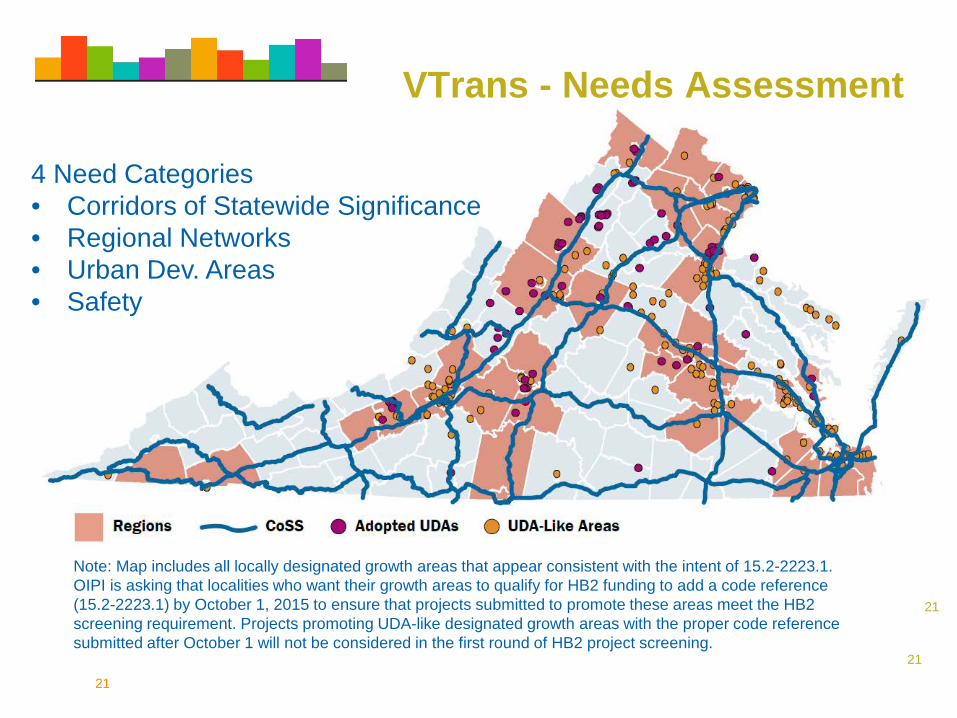
21
21
Note Map includes all locally designated growth areas that appear consistent with the intent of 152-22231 OIPI is asking that localities who want their growth areas to qualify for HB2 funding to add a code reference (152-22231) by October 1 2015 to ensure that projects submitted to promote these areas meet the HB2screening requirement Projects promoting UDA-like designated growth areas with the proper code reference submitted after October 1 will not be considered in the first round of HB2 project screening
21
VTrans - Needs Assessment
4 Need Categoriesbull Corridors of Statewide Significancebull Regional Networksbull Urban Dev Areasbull Safety
Virginia CoSS
22
Regional Networks
Defined as bull Jurisdictions that are included either in
whole or in part within MPO Planning Area Boundaries
bull Any additional element of the transportation system that is connected to the MPO area and deemed critical to the MPO
23
Urban Development AreasUDAs
Areas voluntarily designated by local governments as prime areas for future economic growth pursuant to 152-22231
bull Must reflect transportation-efficient land use principles includingbull Mixed-use land usebull Interconnected streetsbull Moderately compact growth
24
Safety
bull Safety needs based on the top 100 intersections and segments identified based on PSI Potential for Safety Improvement in each district
bull PSI score is the number of serious or fatal crashes minus the predicted rate for that typevolume roadway
httpswwwgooglecommapsdu0viewermid=1mQGiz1QQWRJ0T3HEVUiiDGS9dLQ
25
SMART Scale Grant Application
26
Who can submit
Project System
Regional Entity (MPOs PDCs)
Locality (Counties Cities Towns)
Public Transit Agencies
Corridor of Statewide Significance
YesYes with a resolution of support from relevant
regional entity
Yes with resolution of support from
relevant regional entity
Regional Network Yes Yes
Yes with resolution of support from
relevant entity
Urban Development Area
No Yes No
Localities are also eligible to submit projects addressing a safety need identified in VTrans 2040 under the District Grant Program
27
28
How do they submit an application
All your grant request applications managed
in one system
Enhanced project location mapping
SMART Scale Validation and Screening
32
33
Validation Process
bull VDOT and DRPT review of applicationbull Focus on the following
ndash Project eligibility Studies not allowed New Interchanges with no study or Interchange Justification Report (IJR) Projects lacking a planning preferred alternative
ndash Scope and Cost Estimatendash Project readinessndash HB2 Factors
Scoring items that applicant provides in the following categories ndash 1) Accessibility 2) Environment 3) Economic Development and 4) Land Use and Transportation Coordination (Area Types A and B only)
33
34
Screening Process
bull High Priority Projects ndash Project must meet a need identified for ndash Corridor of Statewide Significance ndash Regional Network
bull Construction District Grant Programs ndash Project must meet a need identified forndash Corridor Statewide Significancendash Regional Networkndash Urban Development Areandash Safety
VTrans Multimodal Work GroupVDOT
34
SMART Scale Measures and Scoring
35
36
SMART Scale Factors
37
Factor AreasGoals that guided measure
development
bull Safety ndash reduce the number and rate of fatalities and severe injuries
bull Congestion ndash reduce person hours of delay and increase person throughput
bull Accessibility ndash increase access to jobs and travel optionsbull Economic Development ndash support economic development
and improve goods movementbull Environmental Quality ndash improve air quality and avoid
impacts to the natural environmentbull Land Use ndash support transportation efficient land development
patterns
38
Measuring SAFETY
ndash 50 of score ndash Expected reduction in total fatalities and severe injuries (100 of score for transit projects)
ndash 50 of score ndash Expected reduction in the rate of fatalities and severe injuries per 100 million vehicle miles traveled
39
Safety - How
bull Highway Projectsbull Compile fatalsevere crash data for project limits (5 years)bull Based on project scope select Crash Modification Factorbull Use CMF to calculate reduction in crashes and rate
bull TransitTravel Demand ManagementNew Locationbull Identify corridor servedbull Use ridershipvolume reduction to calculate reduction in VMTbull Use VMT reduction to calculate crash reduction
39
40
Measuring CONGESTION MITIGATION
ndash 50 of score ndash Change in peak period (multimodal) person throughput in the project corridor
ndash 50 of score - Change in the amount of peak period person hours of delay in the project corridor
41
Congestion ndash HowPerson Throughput
bull Highway Projectsbull Volume to Capacity ratio calculated for peak hourbull Calculate volume above capacity now being served by improvement ndash
convert to person throughputbull Apply expansion factor to account for peak period ndash based on INRIX
Travel Time Index (TTI)bull TransitTravel Demand Management
bull Identify corridor servedbull Determine peak period ridershipvolume reduction (Throughput A)bull Using process above for highways calculate additional vehicle
demand that can now be served based on transit diversion in corridor served (Throughput B)
bull Add together to get total person throughput
41
42
bull Highway Projectsbull Volume to Capacity ratio
calculated for each hour of day to estimate speed
bull Sum delay reduction (up to posted speed limit) for peak period and convert to person hours
bull TransitTravel Demand Managementbull Identify corridor servedbull Determine peak period
ridershipvolume reduction bull Using process above for highways
calculate reduction in person hours
Congestion ndash HowPerson Hours of Delay
42
43
Congestion ndash HowAdjusting Volume to Capacity
VC
VC
No build
Build
Before Speed
After Speed
Transit PampR
Capacity Improvement
43
44
Measuring ACCESSIBILITY
ndash 60 of score ndash Change in cumulative job accessibility (within 45 minutes) (within 60 minutes for transit projects)
ndash 20 of score - Change in cumulative job accessibility for disadvantaged populations (within 45 minutes by automobile and 60 minutes by transit)
ndash 20 of score ndash Assessment of the project support for connections between modes and promotion of multiple transportation choices
44
45
Accessibility - HowAccess to Jobs
bull All Projectsbull Using analysis for congestion measures ndash use change in speedbull Also consider reduced travel distances from new facilities and
changes in land development patterns bull Use improvement in speed to code improvement into Accessibility
GIS tool ndash conduct before and after analysis to get change in cumulative job access
bull Accessibility Toolbull GIS based modelbull Analysis done at Census block group level ndash job access between
each block group within 45 minutes (60 minutes for transit)bull Decay factor applied based on travel time
45
46
bull Accessibility Tool
1 2 3 4 5
6 7 8 9 10
11 12 13 14 15
Tool analyzes existing accessibility to jobs
No-
Build
Accessibility - HowAccess to Jobs
46
47
Accessibility - HowAccess to Jobs
bull Accessibility Tool
1 2 3 4 5
6 7 8 9 10
11 12 13 14 15
Tool moves to next block assessing existing accessibility
No-
Build
47
48
Accessibility - HowAccess to Jobs
bull Accessibility Tool
1 2 3 4 5
6 7 8 9 10
11 12 13 14 15
Process is repeated for all blocks to establish existing accessibility to jobs
No-
Build
48
49
Accessibility - HowAccess to Jobs
bull Accessibility Tool
1 2 3 4 5
6 7 8 9 10
11 12 13 14 15
Tool then analyzes change in access to jobs based on proposed improvement
Build
49
50
Accessibility - HowAccess to Jobs
bull Accessibility Tool
1 2 3 4 5
6 7 8 9 10
11 12 13 14 15
Tool moves to next block calculating change in job access
Build
50
51
Accessibility - HowAccess to Jobs
bull Accessibility Tool
1 2 3 4 5
6 7 8 9 10
11 12 13 14 15
Process is repeated for all blocks ndash increase in access for each block is summed and used to score projects
Build
51
52
Disadvantaged Access to Jobs
bull Similar process in previous slides used for disadvantaged access to jobs
bull Main difference is the utilization of disadvantaged population data in the calculation
bull Disadvantaged populationbull Low income elderly minority and Limited English Proficiency
population percentage by Census Block Group
bull Compared block group and identified block groups in the 75th
percentile of the region ndash regions defined as PDCMPONVTA
52
53
Accessibility - HowAccess to Travel Options
bull Projects receive points based on features than enhance multimodal access (Max 5 points)bull Transitbull Park and Ridebull Bikebull Pedestrianbull HOVHOTbull Real time traveler info or wayfinding
bull Scaled by the number of anticipated Non-SOV usersbull Transit Users + Bike Users + Pedestrians +
HOVPark and Ride
53
54
Measuring ENVIRONMENTAL QUALITY
ndash 50 of score ndash Potential of project to reduce criteria air pollutant and greenhouse gas emissions
ndash 50 of Score ndash Potential impacts to natural and cultural resources
54
55
Environment ndash HowAir Quality and Energy
bull Air QualityEnergybull Points awarded based on
Providing bicycle or pedestrian facilities Improvements for transit Addressing freight bottlenecks New or expanded Park and Ride lot Provisions for hybridelectric vehicles or
energy efficient infrastructurebull Points scaled based on number of non-
SOV users and truck volume
55
56
Environment ndash HowNaturalCultural Resource Impact
Sum the total acreage of land (within frac14 mile of project) in four categories
bull Conservation Landbull SpeciesHabitatbull Cultural Resourcesbull Wetlands
(Data sources VOF VDCR VDOF VDGIF NPS VDHR USFWS)
Project Conservation SpeciesHabitat Cultural Resources
Wetlands Total Acres
A 100 25 25 150 300
Example
56
57
Environment ndash HowNaturalCultural Resource Impact
Scaling Impact and Assigning PointsThe type of environmental document required for each project
will be used to assess and scale the potential natural resource impacts
bull Environmental Impact Statement ndash 50 of acreage will be used for scoring
bull Environmental Assessment ndash 30 of acreage will be used for scoring
bull Categorical Exclusion ndash 10 of acreage will be used for scoring
bull Points based on the amount of potentially impacted area divided by the total buffer area (Lowest Impact = 100 points)
57
58
Environment ndash HowNaturalCultural Resource Impact
Project Conservation SpeciesHabitat
Cultural Resources Wetlands Total
AcresEnviro
DocScaled Acres
A 100 25 25 150 300 EA 100
B 100 25 25 150 300 EIS 150
C 20 0 0 5 25 CE 25
This value gets divided by the total acres within the frac14 mile project buffer
58
59
Measuring ECONOMIC DEVELOPMENT
ndash 60 of score ndash Assessment of progress made towards new economic development (new and expansion of existing)
ndash 20 of score - Rate projects based on the extent to which the project is deemed to enhance access to critical intermodal locations interregional freight movement andor freight intensive industries
ndash 20 of score ndash Projectrsquos impact to travel time reliability
59
60
Economic Development ndash HowDevelopment Supported
bull For each project development sites are identified that the project supports
bull Proposed transportation improvement is evaluated onbull Consistency with Local Comp PlanLocal Economic Development
Strategy ndash up to 1 pointbull Consistency with Regional Economic Development Strategy ndash up to
1 pointbull Each development site is evaluated on
bull Consistency with local comp planzoning ndash up to 1 pointbull Development status ndash up to 1 pointbull Site utilities ndash up to 1 point
bull Max 5 points per site ndash used to weight square footage
60
61
bull Adjusting Weighted Square Footagendash Two Adjustments
Distance from project in miles (except sites less than 1 mile) Type of access provided
bull Formula ndash (Points) x (Square Footage) (Distance) x (Access Adjustment)
Project provides a new direct (physically to the site) primary access to the site that does not exist today 100
Project improves existing access (or relocates existing access) to the site directly (Site must be physically adjacent to the project)
100
Project enhances economic development by improving congestion mobility access or operations in the vicinity of the site but the site is not physically adjacent to the project
50
Development NameTotal Points Square Footage Distance Site Access Access
AdjustmentAdjusted
Square Footage
Development A 5 250000 2Project enhances economic development by improving congestion mobility access or operations in the vicinity of the site but the site is not physically adjacent to the project
50 312500
Development B 5 250000 02Project improves existing access (or relocates existing access) to the site directly (Site must be physically adjacent to the project)
100 1250000
Economic Development ndash HowDevelopment Supported
61
62
Economic Development ndash HowIntermodal Access
bull Project can get up to 6 pointsbull Improve access to distribution centers or intermodalmanufacturing facilities
Within 1 mile ndash 2 points 1 to 3 miles ndash 1 point
bull Improve STAA Truck Route Improvement to STAA route - 2 points Improve access to STAA route ndash 1 point
bull Improve access or reduce congestion around portairports Within 1 mile - 2 points 1-3 miles ndash 1 point
bull Point are scaled by freight tonnage along corridor ndash IHS Transearch data was used to calculate daily tonnage on the project
Improve Access to distro intermodal and manufacturing
Improve STAA truck route
Improve access reduce congestion portsairports
Tonnage (1000s) per day
Measure Scaled by tonnage
Project A 200 200 000 16307 65228
Project B 100 200 000 20815 62445
Project C 200 100 000 477 1431
62
63
Measuring LAND USE
ndash 100 of score ndash Degree to which project will support transportation efficient land use patterns and local policies
bull Points awarded based onbull Promoting walkable bicycle friendly mixed use developmentbull Supporting in-fill developmentbull Having an adopted corridoraccess management plan that
exceeds VDOT standardsbull Points scaled by projected 2025 population and employment
density (from MPO approved travel demand model)
63
64
Land Use ndash HowLocalRegional Land Use Policies
bull LocalRegional Land Use Policiesndash Points awarded based on
Promoting walkable bicycle friendly mixed use development
Supporting in-fill development Having an adopted corridoraccess management plan that
exceeds VDOT standards
ndash Points scaled by projected population and employment density (from MPO approved travel demand model)
64
65
How Scoring Works
10090
8070 60
Everything is Relative
65
66
Everything is Relative
Project Measure ScoreA 250 50B 300 60C 75 15D 15 3E 500 100F 150 30
Highest Value Dictates Scores
Project Measure ScoreA 200 40B 300 60C 75 15D 15 3E 500 100F 150 30
Project Measure ScoreA 250 333B 300 40C 75 10D 15 2E 750 100F 150 20
Change here only affects one score
Change here affects all
scores
The best project for that measure dictates the score for all other projects
66
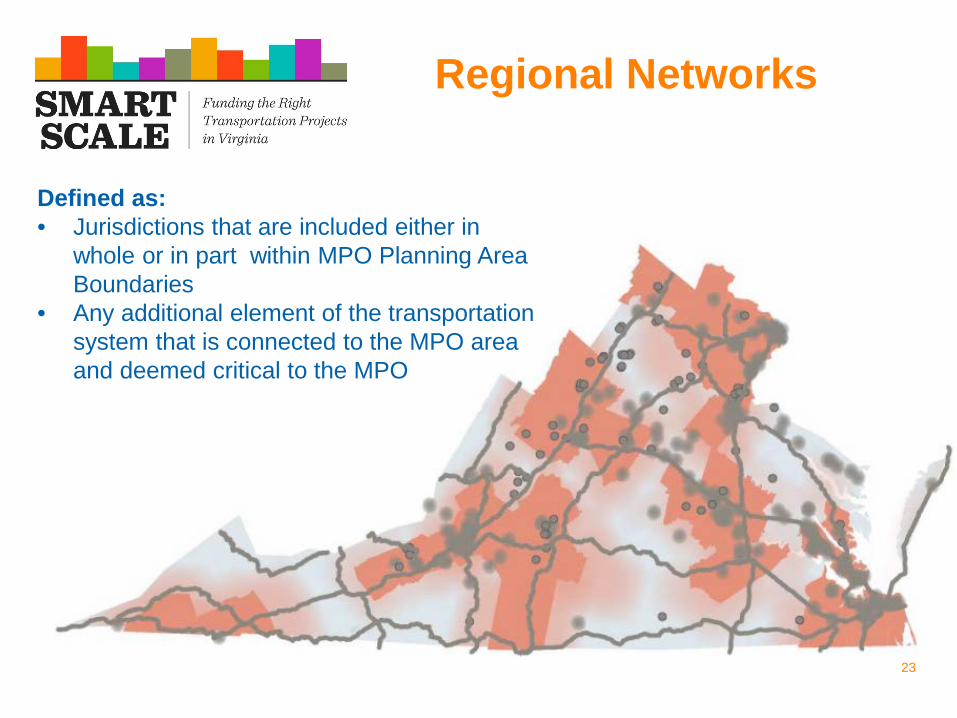
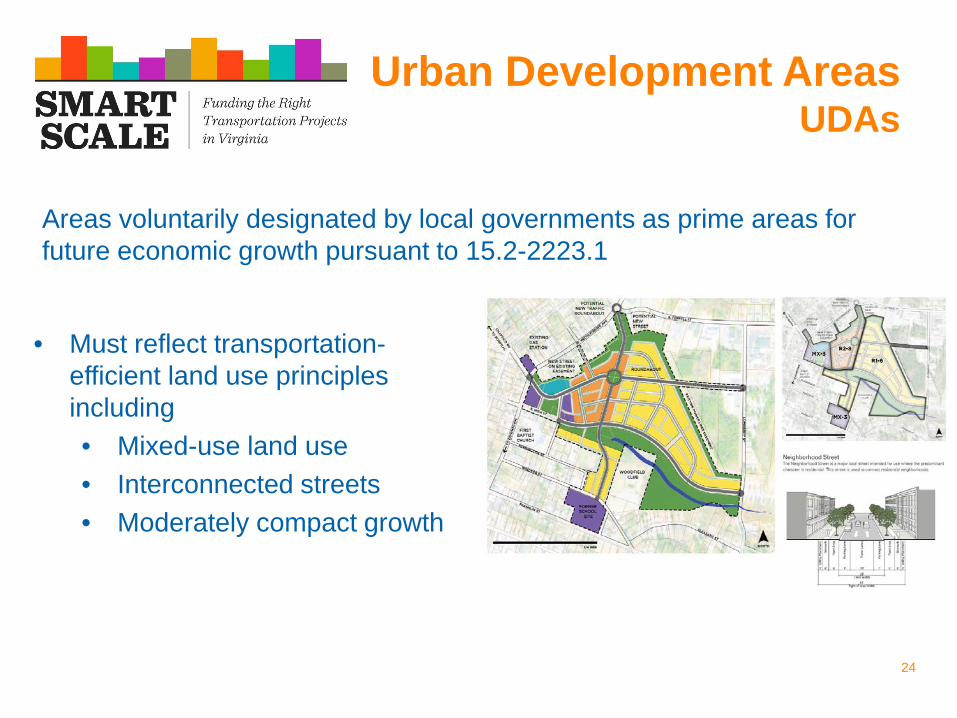
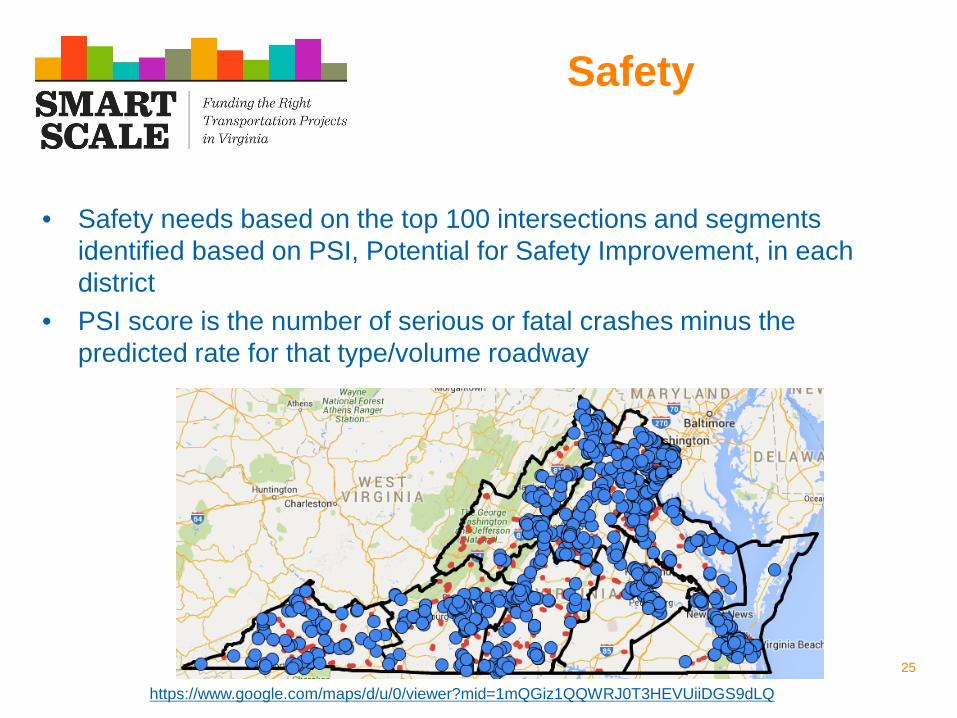
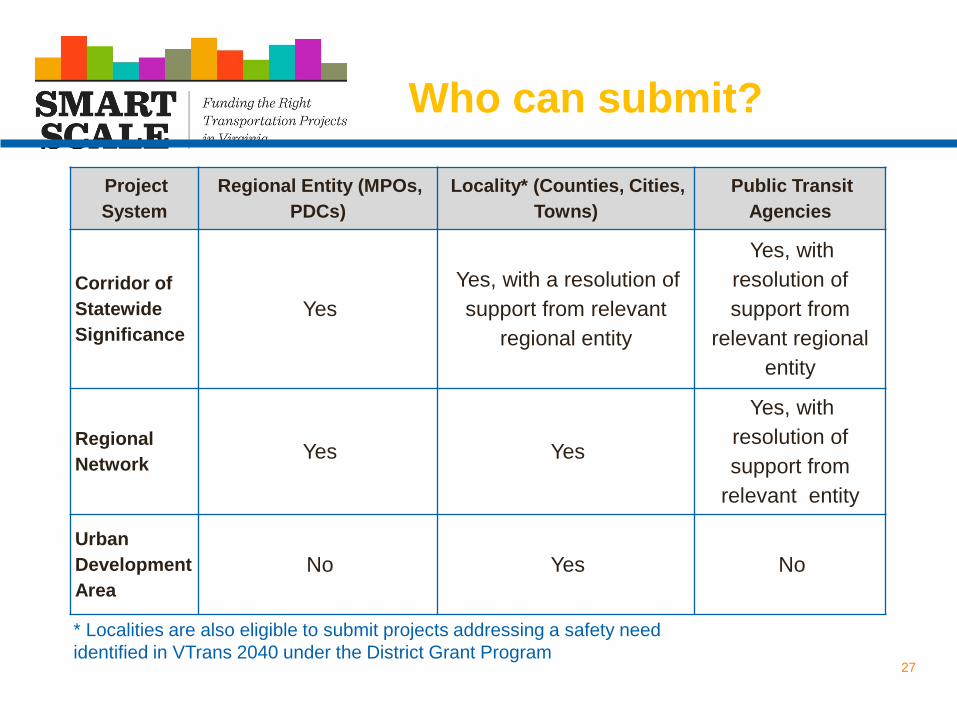
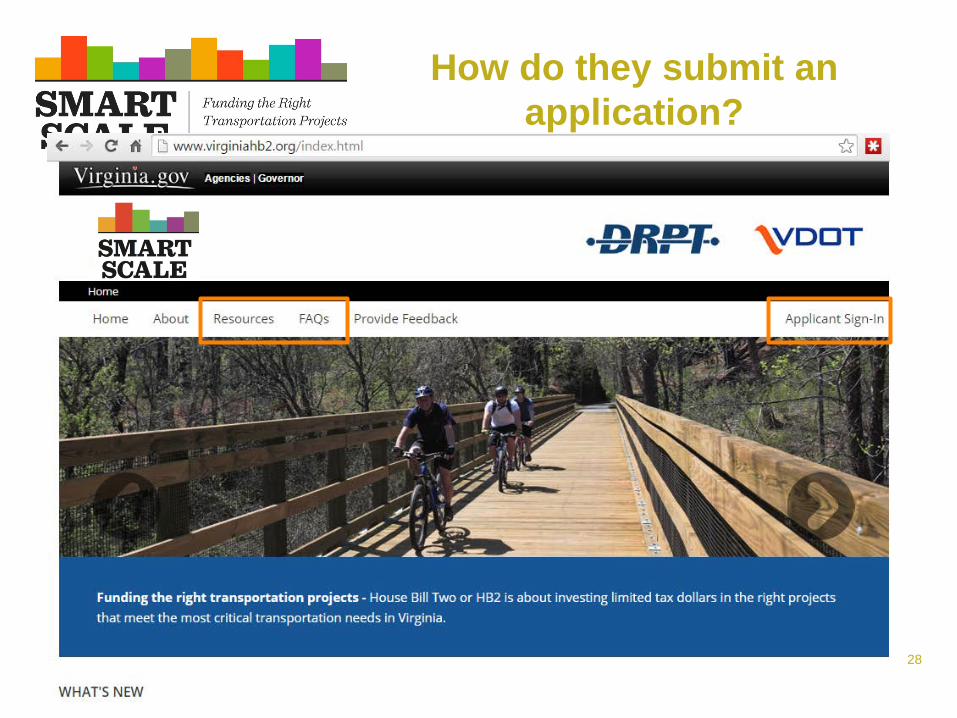
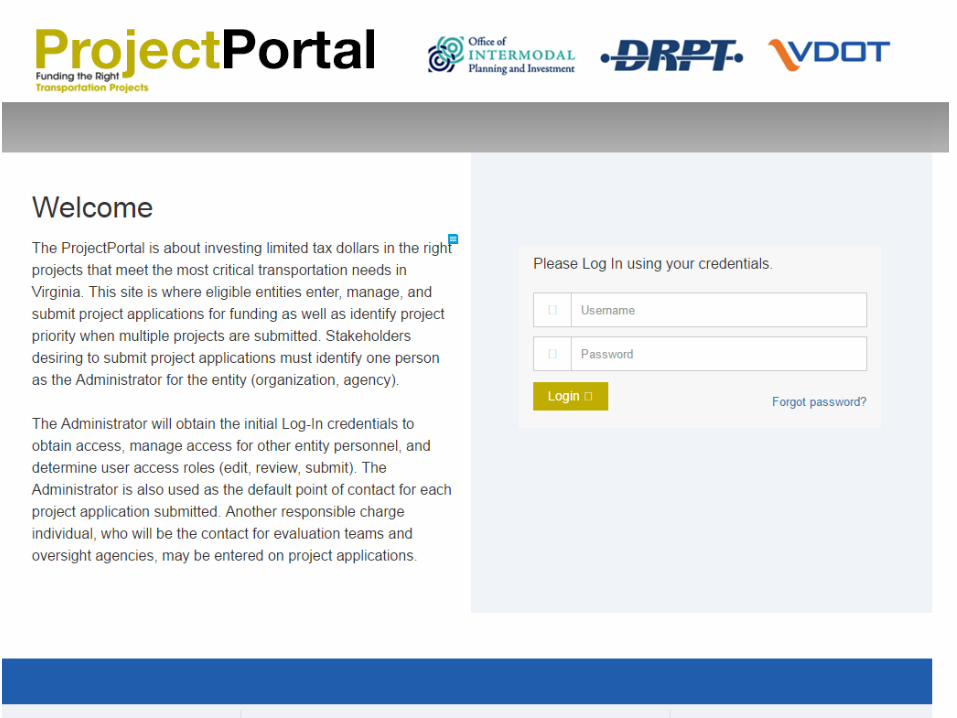
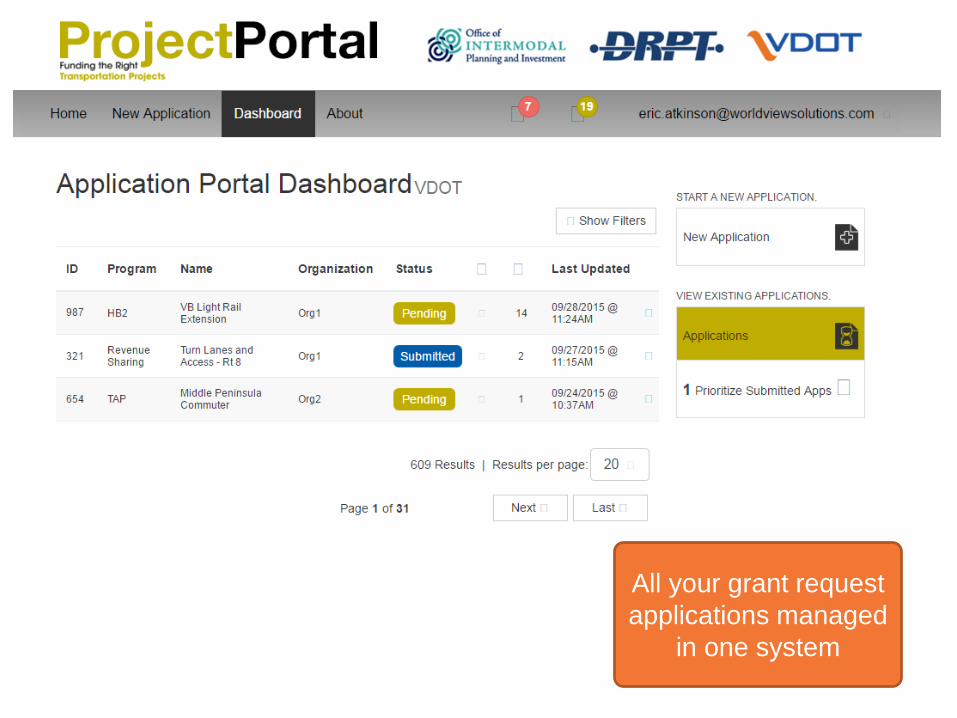
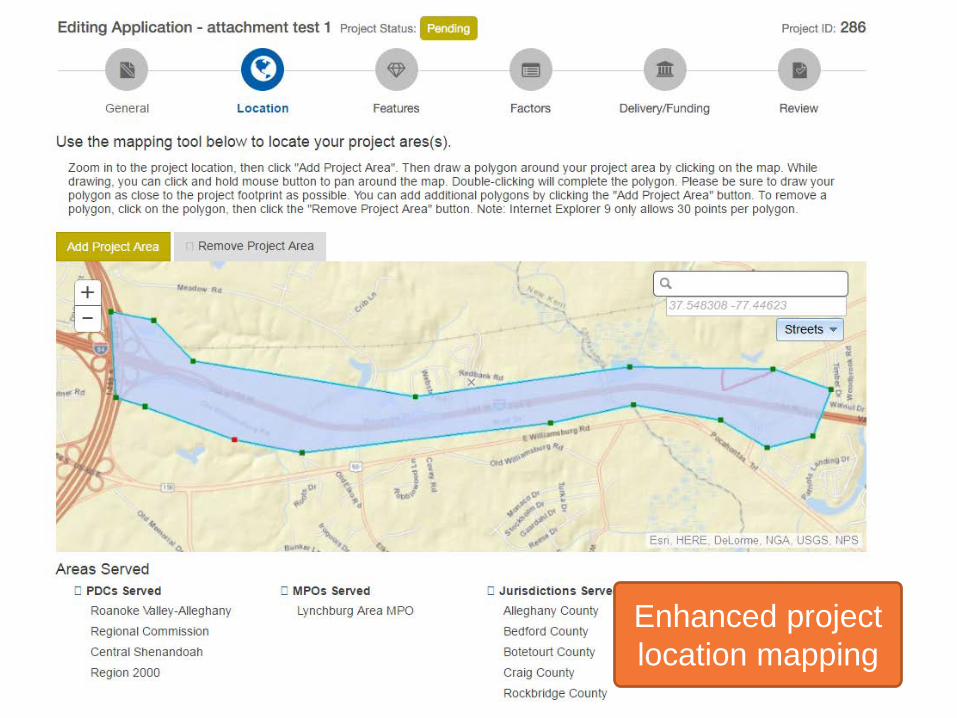
33
Validation Process
bull VDOT and DRPT review of applicationbull Focus on the following
ndash Project eligibility Studies not allowed New Interchanges with no study or Interchange Justification Report (IJR) Projects lacking a planning preferred alternative
ndash Scope and Cost Estimatendash Project readinessndash HB2 Factors
Scoring items that applicant provides in the following categories ndash 1) Accessibility 2) Environment 3) Economic Development and 4) Land Use and Transportation Coordination (Area Types A and B only)
33
34
Screening Process
bull High Priority Projects ndash Project must meet a need identified for ndash Corridor of Statewide Significance ndash Regional Network
bull Construction District Grant Programs ndash Project must meet a need identified forndash Corridor Statewide Significancendash Regional Networkndash Urban Development Areandash Safety
VTrans Multimodal Work GroupVDOT
34
SMART Scale Measures and Scoring
35
36
SMART Scale Factors
37
Factor AreasGoals that guided measure
development
bull Safety ndash reduce the number and rate of fatalities and severe injuries
bull Congestion ndash reduce person hours of delay and increase person throughput
bull Accessibility ndash increase access to jobs and travel optionsbull Economic Development ndash support economic development
and improve goods movementbull Environmental Quality ndash improve air quality and avoid
impacts to the natural environmentbull Land Use ndash support transportation efficient land development
patterns
38
Measuring SAFETY
ndash 50 of score ndash Expected reduction in total fatalities and severe injuries (100 of score for transit projects)
ndash 50 of score ndash Expected reduction in the rate of fatalities and severe injuries per 100 million vehicle miles traveled
39
Safety - How
bull Highway Projectsbull Compile fatalsevere crash data for project limits (5 years)bull Based on project scope select Crash Modification Factorbull Use CMF to calculate reduction in crashes and rate
bull TransitTravel Demand ManagementNew Locationbull Identify corridor servedbull Use ridershipvolume reduction to calculate reduction in VMTbull Use VMT reduction to calculate crash reduction
39
40
Measuring CONGESTION MITIGATION
ndash 50 of score ndash Change in peak period (multimodal) person throughput in the project corridor
ndash 50 of score - Change in the amount of peak period person hours of delay in the project corridor
41
Congestion ndash HowPerson Throughput
bull Highway Projectsbull Volume to Capacity ratio calculated for peak hourbull Calculate volume above capacity now being served by improvement ndash
convert to person throughputbull Apply expansion factor to account for peak period ndash based on INRIX
Travel Time Index (TTI)bull TransitTravel Demand Management
bull Identify corridor servedbull Determine peak period ridershipvolume reduction (Throughput A)bull Using process above for highways calculate additional vehicle
demand that can now be served based on transit diversion in corridor served (Throughput B)
bull Add together to get total person throughput
41
42
bull Highway Projectsbull Volume to Capacity ratio
calculated for each hour of day to estimate speed
bull Sum delay reduction (up to posted speed limit) for peak period and convert to person hours
bull TransitTravel Demand Managementbull Identify corridor servedbull Determine peak period
ridershipvolume reduction bull Using process above for highways
calculate reduction in person hours
Congestion ndash HowPerson Hours of Delay
42
43
Congestion ndash HowAdjusting Volume to Capacity
VC
VC
No build
Build
Before Speed
After Speed
Transit PampR
Capacity Improvement
43
44
Measuring ACCESSIBILITY
ndash 60 of score ndash Change in cumulative job accessibility (within 45 minutes) (within 60 minutes for transit projects)
ndash 20 of score - Change in cumulative job accessibility for disadvantaged populations (within 45 minutes by automobile and 60 minutes by transit)
ndash 20 of score ndash Assessment of the project support for connections between modes and promotion of multiple transportation choices
44
45
Accessibility - HowAccess to Jobs
bull All Projectsbull Using analysis for congestion measures ndash use change in speedbull Also consider reduced travel distances from new facilities and
changes in land development patterns bull Use improvement in speed to code improvement into Accessibility
GIS tool ndash conduct before and after analysis to get change in cumulative job access
bull Accessibility Toolbull GIS based modelbull Analysis done at Census block group level ndash job access between
each block group within 45 minutes (60 minutes for transit)bull Decay factor applied based on travel time
45
46
bull Accessibility Tool
1 2 3 4 5
6 7 8 9 10
11 12 13 14 15
Tool analyzes existing accessibility to jobs
No-
Build
Accessibility - HowAccess to Jobs
46
47
Accessibility - HowAccess to Jobs
bull Accessibility Tool
1 2 3 4 5
6 7 8 9 10
11 12 13 14 15
Tool moves to next block assessing existing accessibility
No-
Build
47
48
Accessibility - HowAccess to Jobs
bull Accessibility Tool
1 2 3 4 5
6 7 8 9 10
11 12 13 14 15
Process is repeated for all blocks to establish existing accessibility to jobs
No-
Build
48
49
Accessibility - HowAccess to Jobs
bull Accessibility Tool
1 2 3 4 5
6 7 8 9 10
11 12 13 14 15
Tool then analyzes change in access to jobs based on proposed improvement
Build
49
50
Accessibility - HowAccess to Jobs
bull Accessibility Tool
1 2 3 4 5
6 7 8 9 10
11 12 13 14 15
Tool moves to next block calculating change in job access
Build
50
51
Accessibility - HowAccess to Jobs
bull Accessibility Tool
1 2 3 4 5
6 7 8 9 10
11 12 13 14 15
Process is repeated for all blocks ndash increase in access for each block is summed and used to score projects
Build
51
52
Disadvantaged Access to Jobs
bull Similar process in previous slides used for disadvantaged access to jobs
bull Main difference is the utilization of disadvantaged population data in the calculation
bull Disadvantaged populationbull Low income elderly minority and Limited English Proficiency
population percentage by Census Block Group
bull Compared block group and identified block groups in the 75th
percentile of the region ndash regions defined as PDCMPONVTA
52
53
Accessibility - HowAccess to Travel Options
bull Projects receive points based on features than enhance multimodal access (Max 5 points)bull Transitbull Park and Ridebull Bikebull Pedestrianbull HOVHOTbull Real time traveler info or wayfinding
bull Scaled by the number of anticipated Non-SOV usersbull Transit Users + Bike Users + Pedestrians +
HOVPark and Ride
53
54
Measuring ENVIRONMENTAL QUALITY
ndash 50 of score ndash Potential of project to reduce criteria air pollutant and greenhouse gas emissions
ndash 50 of Score ndash Potential impacts to natural and cultural resources
54
55
Environment ndash HowAir Quality and Energy
bull Air QualityEnergybull Points awarded based on
Providing bicycle or pedestrian facilities Improvements for transit Addressing freight bottlenecks New or expanded Park and Ride lot Provisions for hybridelectric vehicles or
energy efficient infrastructurebull Points scaled based on number of non-
SOV users and truck volume
55
56
Environment ndash HowNaturalCultural Resource Impact
Sum the total acreage of land (within frac14 mile of project) in four categories
bull Conservation Landbull SpeciesHabitatbull Cultural Resourcesbull Wetlands
(Data sources VOF VDCR VDOF VDGIF NPS VDHR USFWS)
Project Conservation SpeciesHabitat Cultural Resources
Wetlands Total Acres
A 100 25 25 150 300
Example
56
57
Environment ndash HowNaturalCultural Resource Impact
Scaling Impact and Assigning PointsThe type of environmental document required for each project
will be used to assess and scale the potential natural resource impacts
bull Environmental Impact Statement ndash 50 of acreage will be used for scoring
bull Environmental Assessment ndash 30 of acreage will be used for scoring
bull Categorical Exclusion ndash 10 of acreage will be used for scoring
bull Points based on the amount of potentially impacted area divided by the total buffer area (Lowest Impact = 100 points)
57
58
Environment ndash HowNaturalCultural Resource Impact
Project Conservation SpeciesHabitat
Cultural Resources Wetlands Total
AcresEnviro
DocScaled Acres
A 100 25 25 150 300 EA 100
B 100 25 25 150 300 EIS 150
C 20 0 0 5 25 CE 25
This value gets divided by the total acres within the frac14 mile project buffer
58
59
Measuring ECONOMIC DEVELOPMENT
ndash 60 of score ndash Assessment of progress made towards new economic development (new and expansion of existing)
ndash 20 of score - Rate projects based on the extent to which the project is deemed to enhance access to critical intermodal locations interregional freight movement andor freight intensive industries
ndash 20 of score ndash Projectrsquos impact to travel time reliability
59
60
Economic Development ndash HowDevelopment Supported
bull For each project development sites are identified that the project supports
bull Proposed transportation improvement is evaluated onbull Consistency with Local Comp PlanLocal Economic Development
Strategy ndash up to 1 pointbull Consistency with Regional Economic Development Strategy ndash up to
1 pointbull Each development site is evaluated on
bull Consistency with local comp planzoning ndash up to 1 pointbull Development status ndash up to 1 pointbull Site utilities ndash up to 1 point
bull Max 5 points per site ndash used to weight square footage
60
61
bull Adjusting Weighted Square Footagendash Two Adjustments
Distance from project in miles (except sites less than 1 mile) Type of access provided
bull Formula ndash (Points) x (Square Footage) (Distance) x (Access Adjustment)
Project provides a new direct (physically to the site) primary access to the site that does not exist today 100
Project improves existing access (or relocates existing access) to the site directly (Site must be physically adjacent to the project)
100
Project enhances economic development by improving congestion mobility access or operations in the vicinity of the site but the site is not physically adjacent to the project
50
Development NameTotal Points Square Footage Distance Site Access Access
AdjustmentAdjusted
Square Footage
Development A 5 250000 2Project enhances economic development by improving congestion mobility access or operations in the vicinity of the site but the site is not physically adjacent to the project
50 312500
Development B 5 250000 02Project improves existing access (or relocates existing access) to the site directly (Site must be physically adjacent to the project)
100 1250000
Economic Development ndash HowDevelopment Supported
61
62
Economic Development ndash HowIntermodal Access
bull Project can get up to 6 pointsbull Improve access to distribution centers or intermodalmanufacturing facilities
Within 1 mile ndash 2 points 1 to 3 miles ndash 1 point
bull Improve STAA Truck Route Improvement to STAA route - 2 points Improve access to STAA route ndash 1 point
bull Improve access or reduce congestion around portairports Within 1 mile - 2 points 1-3 miles ndash 1 point
bull Point are scaled by freight tonnage along corridor ndash IHS Transearch data was used to calculate daily tonnage on the project
Improve Access to distro intermodal and manufacturing
Improve STAA truck route
Improve access reduce congestion portsairports
Tonnage (1000s) per day
Measure Scaled by tonnage
Project A 200 200 000 16307 65228
Project B 100 200 000 20815 62445
Project C 200 100 000 477 1431
62
63
Measuring LAND USE
ndash 100 of score ndash Degree to which project will support transportation efficient land use patterns and local policies
bull Points awarded based onbull Promoting walkable bicycle friendly mixed use developmentbull Supporting in-fill developmentbull Having an adopted corridoraccess management plan that
exceeds VDOT standardsbull Points scaled by projected 2025 population and employment
density (from MPO approved travel demand model)
63
64
Land Use ndash HowLocalRegional Land Use Policies
bull LocalRegional Land Use Policiesndash Points awarded based on
Promoting walkable bicycle friendly mixed use development
Supporting in-fill development Having an adopted corridoraccess management plan that
exceeds VDOT standards
ndash Points scaled by projected population and employment density (from MPO approved travel demand model)
64
65
How Scoring Works
10090
8070 60
Everything is Relative
65
66
Everything is Relative
Project Measure ScoreA 250 50B 300 60C 75 15D 15 3E 500 100F 150 30
Highest Value Dictates Scores
Project Measure ScoreA 200 40B 300 60C 75 15D 15 3E 500 100F 150 30
Project Measure ScoreA 250 333B 300 40C 75 10D 15 2E 750 100F 150 20
Change here only affects one score
Change here affects all
scores
The best project for that measure dictates the score for all other projects
66
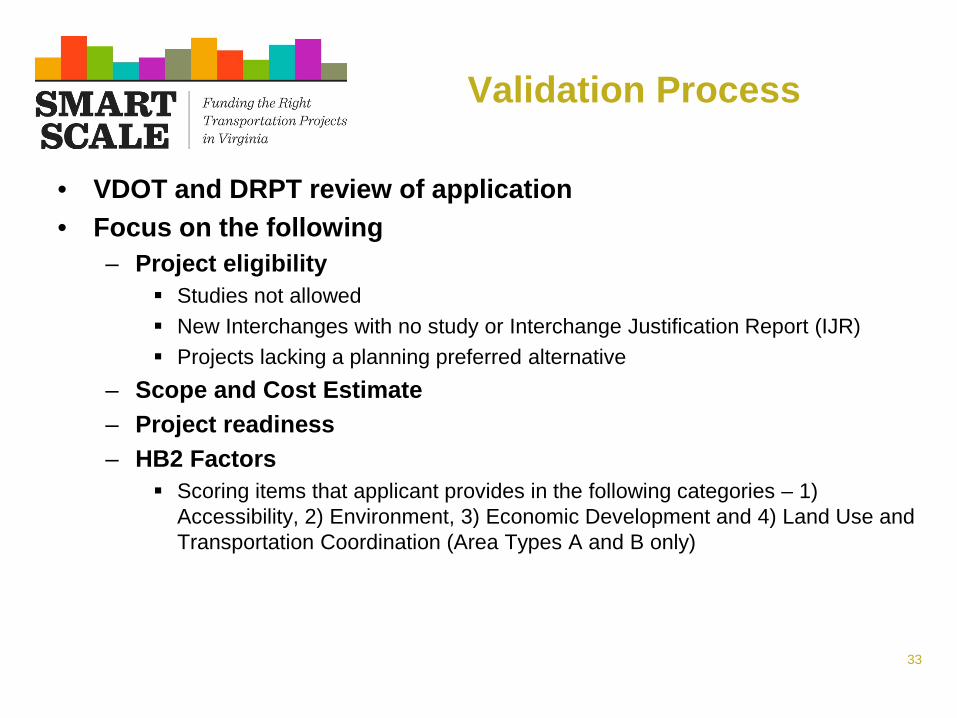
34
Screening Process
bull High Priority Projects ndash Project must meet a need identified for ndash Corridor of Statewide Significance ndash Regional Network
bull Construction District Grant Programs ndash Project must meet a need identified forndash Corridor Statewide Significancendash Regional Networkndash Urban Development Areandash Safety
VTrans Multimodal Work GroupVDOT
34
SMART Scale Measures and Scoring
35
36
SMART Scale Factors
37
Factor AreasGoals that guided measure
development
bull Safety ndash reduce the number and rate of fatalities and severe injuries
bull Congestion ndash reduce person hours of delay and increase person throughput
bull Accessibility ndash increase access to jobs and travel optionsbull Economic Development ndash support economic development
and improve goods movementbull Environmental Quality ndash improve air quality and avoid
impacts to the natural environmentbull Land Use ndash support transportation efficient land development
patterns
38
Measuring SAFETY
ndash 50 of score ndash Expected reduction in total fatalities and severe injuries (100 of score for transit projects)
ndash 50 of score ndash Expected reduction in the rate of fatalities and severe injuries per 100 million vehicle miles traveled
39
Safety - How
bull Highway Projectsbull Compile fatalsevere crash data for project limits (5 years)bull Based on project scope select Crash Modification Factorbull Use CMF to calculate reduction in crashes and rate
bull TransitTravel Demand ManagementNew Locationbull Identify corridor servedbull Use ridershipvolume reduction to calculate reduction in VMTbull Use VMT reduction to calculate crash reduction
39
40
Measuring CONGESTION MITIGATION
ndash 50 of score ndash Change in peak period (multimodal) person throughput in the project corridor
ndash 50 of score - Change in the amount of peak period person hours of delay in the project corridor
41
Congestion ndash HowPerson Throughput
bull Highway Projectsbull Volume to Capacity ratio calculated for peak hourbull Calculate volume above capacity now being served by improvement ndash
convert to person throughputbull Apply expansion factor to account for peak period ndash based on INRIX
Travel Time Index (TTI)bull TransitTravel Demand Management
bull Identify corridor servedbull Determine peak period ridershipvolume reduction (Throughput A)bull Using process above for highways calculate additional vehicle
demand that can now be served based on transit diversion in corridor served (Throughput B)
bull Add together to get total person throughput
41
42
bull Highway Projectsbull Volume to Capacity ratio
calculated for each hour of day to estimate speed
bull Sum delay reduction (up to posted speed limit) for peak period and convert to person hours
bull TransitTravel Demand Managementbull Identify corridor servedbull Determine peak period
ridershipvolume reduction bull Using process above for highways
calculate reduction in person hours
Congestion ndash HowPerson Hours of Delay
42
43
Congestion ndash HowAdjusting Volume to Capacity
VC
VC
No build
Build
Before Speed
After Speed
Transit PampR
Capacity Improvement
43
44
Measuring ACCESSIBILITY
ndash 60 of score ndash Change in cumulative job accessibility (within 45 minutes) (within 60 minutes for transit projects)
ndash 20 of score - Change in cumulative job accessibility for disadvantaged populations (within 45 minutes by automobile and 60 minutes by transit)
ndash 20 of score ndash Assessment of the project support for connections between modes and promotion of multiple transportation choices
44
45
Accessibility - HowAccess to Jobs
bull All Projectsbull Using analysis for congestion measures ndash use change in speedbull Also consider reduced travel distances from new facilities and
changes in land development patterns bull Use improvement in speed to code improvement into Accessibility
GIS tool ndash conduct before and after analysis to get change in cumulative job access
bull Accessibility Toolbull GIS based modelbull Analysis done at Census block group level ndash job access between
each block group within 45 minutes (60 minutes for transit)bull Decay factor applied based on travel time
45
46
bull Accessibility Tool
1 2 3 4 5
6 7 8 9 10
11 12 13 14 15
Tool analyzes existing accessibility to jobs
No-
Build
Accessibility - HowAccess to Jobs
46
47
Accessibility - HowAccess to Jobs
bull Accessibility Tool
1 2 3 4 5
6 7 8 9 10
11 12 13 14 15
Tool moves to next block assessing existing accessibility
No-
Build
47
48
Accessibility - HowAccess to Jobs
bull Accessibility Tool
1 2 3 4 5
6 7 8 9 10
11 12 13 14 15
Process is repeated for all blocks to establish existing accessibility to jobs
No-
Build
48
49
Accessibility - HowAccess to Jobs
bull Accessibility Tool
1 2 3 4 5
6 7 8 9 10
11 12 13 14 15
Tool then analyzes change in access to jobs based on proposed improvement
Build
49
50
Accessibility - HowAccess to Jobs
bull Accessibility Tool
1 2 3 4 5
6 7 8 9 10
11 12 13 14 15
Tool moves to next block calculating change in job access
Build
50
51
Accessibility - HowAccess to Jobs
bull Accessibility Tool
1 2 3 4 5
6 7 8 9 10
11 12 13 14 15
Process is repeated for all blocks ndash increase in access for each block is summed and used to score projects
Build
51
52
Disadvantaged Access to Jobs
bull Similar process in previous slides used for disadvantaged access to jobs
bull Main difference is the utilization of disadvantaged population data in the calculation
bull Disadvantaged populationbull Low income elderly minority and Limited English Proficiency
population percentage by Census Block Group
bull Compared block group and identified block groups in the 75th
percentile of the region ndash regions defined as PDCMPONVTA
52
53
Accessibility - HowAccess to Travel Options
bull Projects receive points based on features than enhance multimodal access (Max 5 points)bull Transitbull Park and Ridebull Bikebull Pedestrianbull HOVHOTbull Real time traveler info or wayfinding
bull Scaled by the number of anticipated Non-SOV usersbull Transit Users + Bike Users + Pedestrians +
HOVPark and Ride
53
54
Measuring ENVIRONMENTAL QUALITY
ndash 50 of score ndash Potential of project to reduce criteria air pollutant and greenhouse gas emissions
ndash 50 of Score ndash Potential impacts to natural and cultural resources
54
55
Environment ndash HowAir Quality and Energy
bull Air QualityEnergybull Points awarded based on
Providing bicycle or pedestrian facilities Improvements for transit Addressing freight bottlenecks New or expanded Park and Ride lot Provisions for hybridelectric vehicles or
energy efficient infrastructurebull Points scaled based on number of non-
SOV users and truck volume
55
56
Environment ndash HowNaturalCultural Resource Impact
Sum the total acreage of land (within frac14 mile of project) in four categories
bull Conservation Landbull SpeciesHabitatbull Cultural Resourcesbull Wetlands
(Data sources VOF VDCR VDOF VDGIF NPS VDHR USFWS)
Project Conservation SpeciesHabitat Cultural Resources
Wetlands Total Acres
A 100 25 25 150 300
Example
56
57
Environment ndash HowNaturalCultural Resource Impact
Scaling Impact and Assigning PointsThe type of environmental document required for each project
will be used to assess and scale the potential natural resource impacts
bull Environmental Impact Statement ndash 50 of acreage will be used for scoring
bull Environmental Assessment ndash 30 of acreage will be used for scoring
bull Categorical Exclusion ndash 10 of acreage will be used for scoring
bull Points based on the amount of potentially impacted area divided by the total buffer area (Lowest Impact = 100 points)
57
58
Environment ndash HowNaturalCultural Resource Impact
Project Conservation SpeciesHabitat
Cultural Resources Wetlands Total
AcresEnviro
DocScaled Acres
A 100 25 25 150 300 EA 100
B 100 25 25 150 300 EIS 150
C 20 0 0 5 25 CE 25
This value gets divided by the total acres within the frac14 mile project buffer
58
59
Measuring ECONOMIC DEVELOPMENT
ndash 60 of score ndash Assessment of progress made towards new economic development (new and expansion of existing)
ndash 20 of score - Rate projects based on the extent to which the project is deemed to enhance access to critical intermodal locations interregional freight movement andor freight intensive industries
ndash 20 of score ndash Projectrsquos impact to travel time reliability
59
60
Economic Development ndash HowDevelopment Supported
bull For each project development sites are identified that the project supports
bull Proposed transportation improvement is evaluated onbull Consistency with Local Comp PlanLocal Economic Development
Strategy ndash up to 1 pointbull Consistency with Regional Economic Development Strategy ndash up to
1 pointbull Each development site is evaluated on
bull Consistency with local comp planzoning ndash up to 1 pointbull Development status ndash up to 1 pointbull Site utilities ndash up to 1 point
bull Max 5 points per site ndash used to weight square footage
60
61
bull Adjusting Weighted Square Footagendash Two Adjustments
Distance from project in miles (except sites less than 1 mile) Type of access provided
bull Formula ndash (Points) x (Square Footage) (Distance) x (Access Adjustment)
Project provides a new direct (physically to the site) primary access to the site that does not exist today 100
Project improves existing access (or relocates existing access) to the site directly (Site must be physically adjacent to the project)
100
Project enhances economic development by improving congestion mobility access or operations in the vicinity of the site but the site is not physically adjacent to the project
50
Development NameTotal Points Square Footage Distance Site Access Access
AdjustmentAdjusted
Square Footage
Development A 5 250000 2Project enhances economic development by improving congestion mobility access or operations in the vicinity of the site but the site is not physically adjacent to the project
50 312500
Development B 5 250000 02Project improves existing access (or relocates existing access) to the site directly (Site must be physically adjacent to the project)
100 1250000
Economic Development ndash HowDevelopment Supported
61
62
Economic Development ndash HowIntermodal Access
bull Project can get up to 6 pointsbull Improve access to distribution centers or intermodalmanufacturing facilities
Within 1 mile ndash 2 points 1 to 3 miles ndash 1 point
bull Improve STAA Truck Route Improvement to STAA route - 2 points Improve access to STAA route ndash 1 point
bull Improve access or reduce congestion around portairports Within 1 mile - 2 points 1-3 miles ndash 1 point
bull Point are scaled by freight tonnage along corridor ndash IHS Transearch data was used to calculate daily tonnage on the project
Improve Access to distro intermodal and manufacturing
Improve STAA truck route
Improve access reduce congestion portsairports
Tonnage (1000s) per day
Measure Scaled by tonnage
Project A 200 200 000 16307 65228
Project B 100 200 000 20815 62445
Project C 200 100 000 477 1431
62
63
Measuring LAND USE
ndash 100 of score ndash Degree to which project will support transportation efficient land use patterns and local policies
bull Points awarded based onbull Promoting walkable bicycle friendly mixed use developmentbull Supporting in-fill developmentbull Having an adopted corridoraccess management plan that
exceeds VDOT standardsbull Points scaled by projected 2025 population and employment
density (from MPO approved travel demand model)
63
64
Land Use ndash HowLocalRegional Land Use Policies
bull LocalRegional Land Use Policiesndash Points awarded based on
Promoting walkable bicycle friendly mixed use development
Supporting in-fill development Having an adopted corridoraccess management plan that
exceeds VDOT standards
ndash Points scaled by projected population and employment density (from MPO approved travel demand model)
64
65
How Scoring Works
10090
8070 60
Everything is Relative
65
66
Everything is Relative
Project Measure ScoreA 250 50B 300 60C 75 15D 15 3E 500 100F 150 30
Highest Value Dictates Scores
Project Measure ScoreA 200 40B 300 60C 75 15D 15 3E 500 100F 150 30
Project Measure ScoreA 250 333B 300 40C 75 10D 15 2E 750 100F 150 20
Change here only affects one score
Change here affects all
scores
The best project for that measure dictates the score for all other projects
66
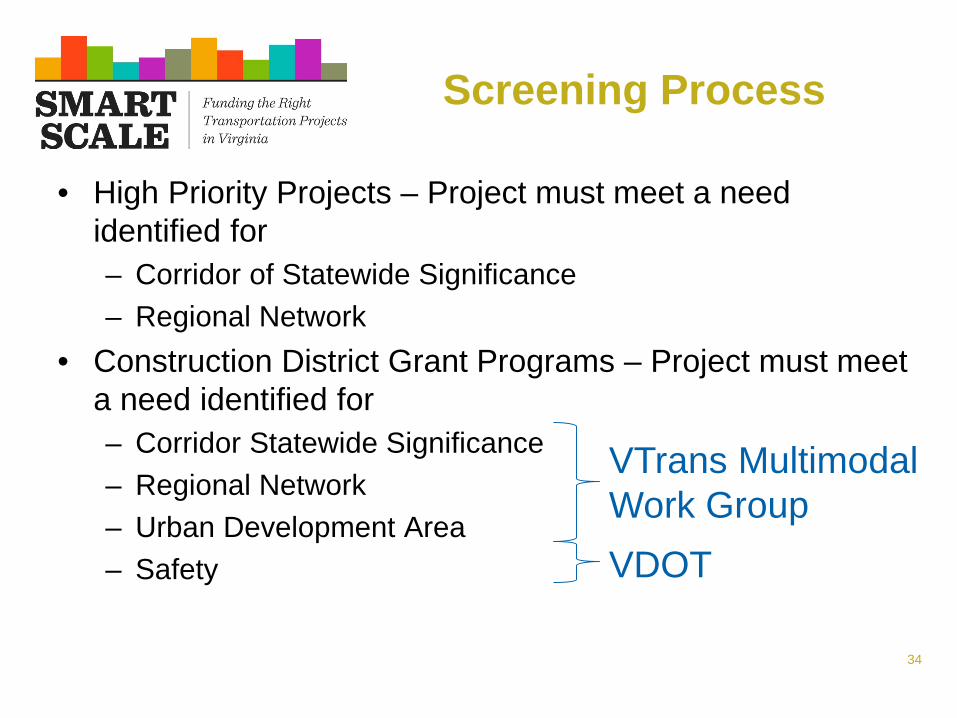
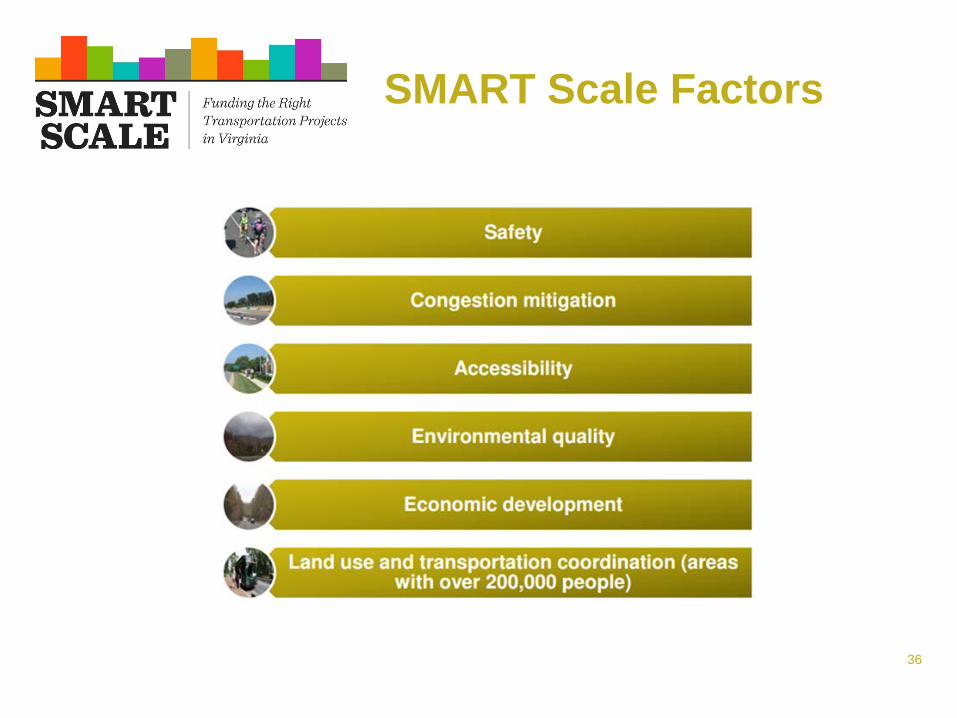
39
Safety - How
bull Highway Projectsbull Compile fatalsevere crash data for project limits (5 years)bull Based on project scope select Crash Modification Factorbull Use CMF to calculate reduction in crashes and rate
bull TransitTravel Demand ManagementNew Locationbull Identify corridor servedbull Use ridershipvolume reduction to calculate reduction in VMTbull Use VMT reduction to calculate crash reduction
39
40
Measuring CONGESTION MITIGATION
ndash 50 of score ndash Change in peak period (multimodal) person throughput in the project corridor
ndash 50 of score - Change in the amount of peak period person hours of delay in the project corridor
41
Congestion ndash HowPerson Throughput
bull Highway Projectsbull Volume to Capacity ratio calculated for peak hourbull Calculate volume above capacity now being served by improvement ndash
convert to person throughputbull Apply expansion factor to account for peak period ndash based on INRIX
Travel Time Index (TTI)bull TransitTravel Demand Management
bull Identify corridor servedbull Determine peak period ridershipvolume reduction (Throughput A)bull Using process above for highways calculate additional vehicle
demand that can now be served based on transit diversion in corridor served (Throughput B)
bull Add together to get total person throughput
41
42
bull Highway Projectsbull Volume to Capacity ratio
calculated for each hour of day to estimate speed
bull Sum delay reduction (up to posted speed limit) for peak period and convert to person hours
bull TransitTravel Demand Managementbull Identify corridor servedbull Determine peak period
ridershipvolume reduction bull Using process above for highways
calculate reduction in person hours
Congestion ndash HowPerson Hours of Delay
42
43
Congestion ndash HowAdjusting Volume to Capacity
VC
VC
No build
Build
Before Speed
After Speed
Transit PampR
Capacity Improvement
43
44
Measuring ACCESSIBILITY
ndash 60 of score ndash Change in cumulative job accessibility (within 45 minutes) (within 60 minutes for transit projects)
ndash 20 of score - Change in cumulative job accessibility for disadvantaged populations (within 45 minutes by automobile and 60 minutes by transit)
ndash 20 of score ndash Assessment of the project support for connections between modes and promotion of multiple transportation choices
44
45
Accessibility - HowAccess to Jobs
bull All Projectsbull Using analysis for congestion measures ndash use change in speedbull Also consider reduced travel distances from new facilities and
changes in land development patterns bull Use improvement in speed to code improvement into Accessibility
GIS tool ndash conduct before and after analysis to get change in cumulative job access
bull Accessibility Toolbull GIS based modelbull Analysis done at Census block group level ndash job access between
each block group within 45 minutes (60 minutes for transit)bull Decay factor applied based on travel time
45
46
bull Accessibility Tool
1 2 3 4 5
6 7 8 9 10
11 12 13 14 15
Tool analyzes existing accessibility to jobs
No-
Build
Accessibility - HowAccess to Jobs
46
47
Accessibility - HowAccess to Jobs
bull Accessibility Tool
1 2 3 4 5
6 7 8 9 10
11 12 13 14 15
Tool moves to next block assessing existing accessibility
No-
Build
47
48
Accessibility - HowAccess to Jobs
bull Accessibility Tool
1 2 3 4 5
6 7 8 9 10
11 12 13 14 15
Process is repeated for all blocks to establish existing accessibility to jobs
No-
Build
48
49
Accessibility - HowAccess to Jobs
bull Accessibility Tool
1 2 3 4 5
6 7 8 9 10
11 12 13 14 15
Tool then analyzes change in access to jobs based on proposed improvement
Build
49
50
Accessibility - HowAccess to Jobs
bull Accessibility Tool
1 2 3 4 5
6 7 8 9 10
11 12 13 14 15
Tool moves to next block calculating change in job access
Build
50
51
Accessibility - HowAccess to Jobs
bull Accessibility Tool
1 2 3 4 5
6 7 8 9 10
11 12 13 14 15
Process is repeated for all blocks ndash increase in access for each block is summed and used to score projects
Build
51
52
Disadvantaged Access to Jobs
bull Similar process in previous slides used for disadvantaged access to jobs
bull Main difference is the utilization of disadvantaged population data in the calculation
bull Disadvantaged populationbull Low income elderly minority and Limited English Proficiency
population percentage by Census Block Group
bull Compared block group and identified block groups in the 75th
percentile of the region ndash regions defined as PDCMPONVTA
52
53
Accessibility - HowAccess to Travel Options
bull Projects receive points based on features than enhance multimodal access (Max 5 points)bull Transitbull Park and Ridebull Bikebull Pedestrianbull HOVHOTbull Real time traveler info or wayfinding
bull Scaled by the number of anticipated Non-SOV usersbull Transit Users + Bike Users + Pedestrians +
HOVPark and Ride
53
54
Measuring ENVIRONMENTAL QUALITY
ndash 50 of score ndash Potential of project to reduce criteria air pollutant and greenhouse gas emissions
ndash 50 of Score ndash Potential impacts to natural and cultural resources
54
55
Environment ndash HowAir Quality and Energy
bull Air QualityEnergybull Points awarded based on
Providing bicycle or pedestrian facilities Improvements for transit Addressing freight bottlenecks New or expanded Park and Ride lot Provisions for hybridelectric vehicles or
energy efficient infrastructurebull Points scaled based on number of non-
SOV users and truck volume
55
56
Environment ndash HowNaturalCultural Resource Impact
Sum the total acreage of land (within frac14 mile of project) in four categories
bull Conservation Landbull SpeciesHabitatbull Cultural Resourcesbull Wetlands
(Data sources VOF VDCR VDOF VDGIF NPS VDHR USFWS)
Project Conservation SpeciesHabitat Cultural Resources
Wetlands Total Acres
A 100 25 25 150 300
Example
56
57
Environment ndash HowNaturalCultural Resource Impact
Scaling Impact and Assigning PointsThe type of environmental document required for each project
will be used to assess and scale the potential natural resource impacts
bull Environmental Impact Statement ndash 50 of acreage will be used for scoring
bull Environmental Assessment ndash 30 of acreage will be used for scoring
bull Categorical Exclusion ndash 10 of acreage will be used for scoring
bull Points based on the amount of potentially impacted area divided by the total buffer area (Lowest Impact = 100 points)
57
58
Environment ndash HowNaturalCultural Resource Impact
Project Conservation SpeciesHabitat
Cultural Resources Wetlands Total
AcresEnviro
DocScaled Acres
A 100 25 25 150 300 EA 100
B 100 25 25 150 300 EIS 150
C 20 0 0 5 25 CE 25
This value gets divided by the total acres within the frac14 mile project buffer
58
59
Measuring ECONOMIC DEVELOPMENT
ndash 60 of score ndash Assessment of progress made towards new economic development (new and expansion of existing)
ndash 20 of score - Rate projects based on the extent to which the project is deemed to enhance access to critical intermodal locations interregional freight movement andor freight intensive industries
ndash 20 of score ndash Projectrsquos impact to travel time reliability
59
60
Economic Development ndash HowDevelopment Supported
bull For each project development sites are identified that the project supports
bull Proposed transportation improvement is evaluated onbull Consistency with Local Comp PlanLocal Economic Development
Strategy ndash up to 1 pointbull Consistency with Regional Economic Development Strategy ndash up to
1 pointbull Each development site is evaluated on
bull Consistency with local comp planzoning ndash up to 1 pointbull Development status ndash up to 1 pointbull Site utilities ndash up to 1 point
bull Max 5 points per site ndash used to weight square footage
60
61
bull Adjusting Weighted Square Footagendash Two Adjustments
Distance from project in miles (except sites less than 1 mile) Type of access provided
bull Formula ndash (Points) x (Square Footage) (Distance) x (Access Adjustment)
Project provides a new direct (physically to the site) primary access to the site that does not exist today 100
Project improves existing access (or relocates existing access) to the site directly (Site must be physically adjacent to the project)
100
Project enhances economic development by improving congestion mobility access or operations in the vicinity of the site but the site is not physically adjacent to the project
50
Development NameTotal Points Square Footage Distance Site Access Access
AdjustmentAdjusted
Square Footage
Development A 5 250000 2Project enhances economic development by improving congestion mobility access or operations in the vicinity of the site but the site is not physically adjacent to the project
50 312500
Development B 5 250000 02Project improves existing access (or relocates existing access) to the site directly (Site must be physically adjacent to the project)
100 1250000
Economic Development ndash HowDevelopment Supported
61
62
Economic Development ndash HowIntermodal Access
bull Project can get up to 6 pointsbull Improve access to distribution centers or intermodalmanufacturing facilities
Within 1 mile ndash 2 points 1 to 3 miles ndash 1 point
bull Improve STAA Truck Route Improvement to STAA route - 2 points Improve access to STAA route ndash 1 point
bull Improve access or reduce congestion around portairports Within 1 mile - 2 points 1-3 miles ndash 1 point
bull Point are scaled by freight tonnage along corridor ndash IHS Transearch data was used to calculate daily tonnage on the project
Improve Access to distro intermodal and manufacturing
Improve STAA truck route
Improve access reduce congestion portsairports
Tonnage (1000s) per day
Measure Scaled by tonnage
Project A 200 200 000 16307 65228
Project B 100 200 000 20815 62445
Project C 200 100 000 477 1431
62
63
Measuring LAND USE
ndash 100 of score ndash Degree to which project will support transportation efficient land use patterns and local policies
bull Points awarded based onbull Promoting walkable bicycle friendly mixed use developmentbull Supporting in-fill developmentbull Having an adopted corridoraccess management plan that
exceeds VDOT standardsbull Points scaled by projected 2025 population and employment
density (from MPO approved travel demand model)
63
64
Land Use ndash HowLocalRegional Land Use Policies
bull LocalRegional Land Use Policiesndash Points awarded based on
Promoting walkable bicycle friendly mixed use development
Supporting in-fill development Having an adopted corridoraccess management plan that
exceeds VDOT standards
ndash Points scaled by projected population and employment density (from MPO approved travel demand model)
64
65
How Scoring Works
10090
8070 60
Everything is Relative
65
66
Everything is Relative
Project Measure ScoreA 250 50B 300 60C 75 15D 15 3E 500 100F 150 30
Highest Value Dictates Scores
Project Measure ScoreA 200 40B 300 60C 75 15D 15 3E 500 100F 150 30
Project Measure ScoreA 250 333B 300 40C 75 10D 15 2E 750 100F 150 20
Change here only affects one score
Change here affects all
scores
The best project for that measure dictates the score for all other projects
66
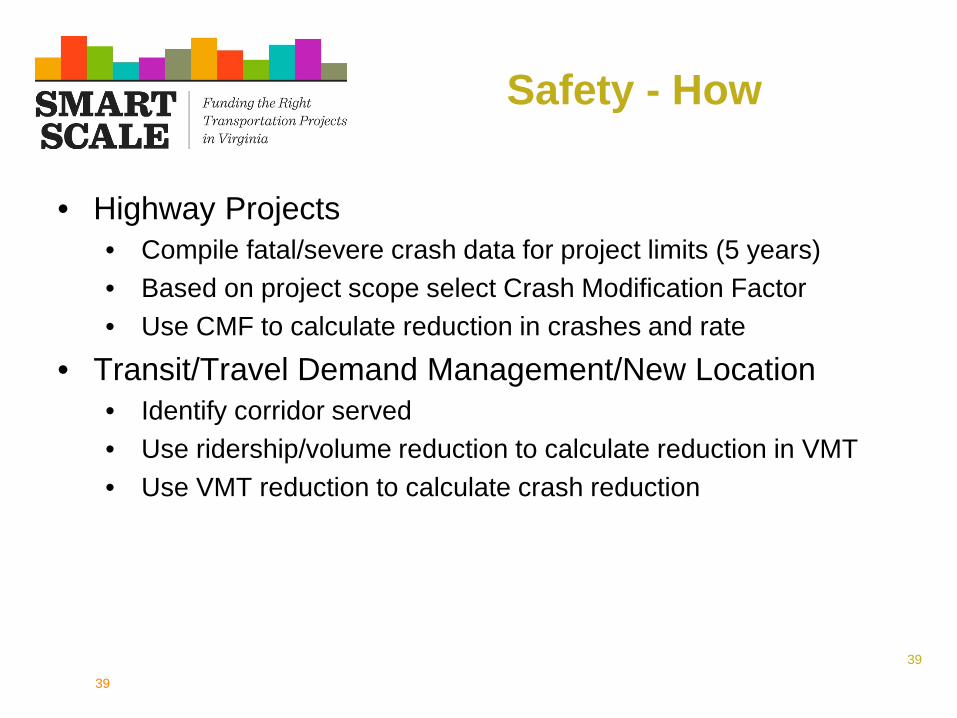
41
Congestion ndash HowPerson Throughput
bull Highway Projectsbull Volume to Capacity ratio calculated for peak hourbull Calculate volume above capacity now being served by improvement ndash
convert to person throughputbull Apply expansion factor to account for peak period ndash based on INRIX
Travel Time Index (TTI)bull TransitTravel Demand Management
bull Identify corridor servedbull Determine peak period ridershipvolume reduction (Throughput A)bull Using process above for highways calculate additional vehicle
demand that can now be served based on transit diversion in corridor served (Throughput B)
bull Add together to get total person throughput
41
42
bull Highway Projectsbull Volume to Capacity ratio
calculated for each hour of day to estimate speed
bull Sum delay reduction (up to posted speed limit) for peak period and convert to person hours
bull TransitTravel Demand Managementbull Identify corridor servedbull Determine peak period
ridershipvolume reduction bull Using process above for highways
calculate reduction in person hours
Congestion ndash HowPerson Hours of Delay
42
43
Congestion ndash HowAdjusting Volume to Capacity
VC
VC
No build
Build
Before Speed
After Speed
Transit PampR
Capacity Improvement
43
44
Measuring ACCESSIBILITY
ndash 60 of score ndash Change in cumulative job accessibility (within 45 minutes) (within 60 minutes for transit projects)
ndash 20 of score - Change in cumulative job accessibility for disadvantaged populations (within 45 minutes by automobile and 60 minutes by transit)
ndash 20 of score ndash Assessment of the project support for connections between modes and promotion of multiple transportation choices
44
45
Accessibility - HowAccess to Jobs
bull All Projectsbull Using analysis for congestion measures ndash use change in speedbull Also consider reduced travel distances from new facilities and
changes in land development patterns bull Use improvement in speed to code improvement into Accessibility
GIS tool ndash conduct before and after analysis to get change in cumulative job access
bull Accessibility Toolbull GIS based modelbull Analysis done at Census block group level ndash job access between
each block group within 45 minutes (60 minutes for transit)bull Decay factor applied based on travel time
45
46
bull Accessibility Tool
1 2 3 4 5
6 7 8 9 10
11 12 13 14 15
Tool analyzes existing accessibility to jobs
No-
Build
Accessibility - HowAccess to Jobs
46
47
Accessibility - HowAccess to Jobs
bull Accessibility Tool
1 2 3 4 5
6 7 8 9 10
11 12 13 14 15
Tool moves to next block assessing existing accessibility
No-
Build
47
48
Accessibility - HowAccess to Jobs
bull Accessibility Tool
1 2 3 4 5
6 7 8 9 10
11 12 13 14 15
Process is repeated for all blocks to establish existing accessibility to jobs
No-
Build
48
49
Accessibility - HowAccess to Jobs
bull Accessibility Tool
1 2 3 4 5
6 7 8 9 10
11 12 13 14 15
Tool then analyzes change in access to jobs based on proposed improvement
Build
49
50
Accessibility - HowAccess to Jobs
bull Accessibility Tool
1 2 3 4 5
6 7 8 9 10
11 12 13 14 15
Tool moves to next block calculating change in job access
Build
50
51
Accessibility - HowAccess to Jobs
bull Accessibility Tool
1 2 3 4 5
6 7 8 9 10
11 12 13 14 15
Process is repeated for all blocks ndash increase in access for each block is summed and used to score projects
Build
51
52
Disadvantaged Access to Jobs
bull Similar process in previous slides used for disadvantaged access to jobs
bull Main difference is the utilization of disadvantaged population data in the calculation
bull Disadvantaged populationbull Low income elderly minority and Limited English Proficiency
population percentage by Census Block Group
bull Compared block group and identified block groups in the 75th
percentile of the region ndash regions defined as PDCMPONVTA
52
53
Accessibility - HowAccess to Travel Options
bull Projects receive points based on features than enhance multimodal access (Max 5 points)bull Transitbull Park and Ridebull Bikebull Pedestrianbull HOVHOTbull Real time traveler info or wayfinding
bull Scaled by the number of anticipated Non-SOV usersbull Transit Users + Bike Users + Pedestrians +
HOVPark and Ride
53
54
Measuring ENVIRONMENTAL QUALITY
ndash 50 of score ndash Potential of project to reduce criteria air pollutant and greenhouse gas emissions
ndash 50 of Score ndash Potential impacts to natural and cultural resources
54
55
Environment ndash HowAir Quality and Energy
bull Air QualityEnergybull Points awarded based on
Providing bicycle or pedestrian facilities Improvements for transit Addressing freight bottlenecks New or expanded Park and Ride lot Provisions for hybridelectric vehicles or
energy efficient infrastructurebull Points scaled based on number of non-
SOV users and truck volume
55
56
Environment ndash HowNaturalCultural Resource Impact
Sum the total acreage of land (within frac14 mile of project) in four categories
bull Conservation Landbull SpeciesHabitatbull Cultural Resourcesbull Wetlands
(Data sources VOF VDCR VDOF VDGIF NPS VDHR USFWS)
Project Conservation SpeciesHabitat Cultural Resources
Wetlands Total Acres
A 100 25 25 150 300
Example
56
57
Environment ndash HowNaturalCultural Resource Impact
Scaling Impact and Assigning PointsThe type of environmental document required for each project
will be used to assess and scale the potential natural resource impacts
bull Environmental Impact Statement ndash 50 of acreage will be used for scoring
bull Environmental Assessment ndash 30 of acreage will be used for scoring
bull Categorical Exclusion ndash 10 of acreage will be used for scoring
bull Points based on the amount of potentially impacted area divided by the total buffer area (Lowest Impact = 100 points)
57
58
Environment ndash HowNaturalCultural Resource Impact
Project Conservation SpeciesHabitat
Cultural Resources Wetlands Total
AcresEnviro
DocScaled Acres
A 100 25 25 150 300 EA 100
B 100 25 25 150 300 EIS 150
C 20 0 0 5 25 CE 25
This value gets divided by the total acres within the frac14 mile project buffer
58
59
Measuring ECONOMIC DEVELOPMENT
ndash 60 of score ndash Assessment of progress made towards new economic development (new and expansion of existing)
ndash 20 of score - Rate projects based on the extent to which the project is deemed to enhance access to critical intermodal locations interregional freight movement andor freight intensive industries
ndash 20 of score ndash Projectrsquos impact to travel time reliability
59
60
Economic Development ndash HowDevelopment Supported
bull For each project development sites are identified that the project supports
bull Proposed transportation improvement is evaluated onbull Consistency with Local Comp PlanLocal Economic Development
Strategy ndash up to 1 pointbull Consistency with Regional Economic Development Strategy ndash up to
1 pointbull Each development site is evaluated on
bull Consistency with local comp planzoning ndash up to 1 pointbull Development status ndash up to 1 pointbull Site utilities ndash up to 1 point
bull Max 5 points per site ndash used to weight square footage
60
61
bull Adjusting Weighted Square Footagendash Two Adjustments
Distance from project in miles (except sites less than 1 mile) Type of access provided
bull Formula ndash (Points) x (Square Footage) (Distance) x (Access Adjustment)
Project provides a new direct (physically to the site) primary access to the site that does not exist today 100
Project improves existing access (or relocates existing access) to the site directly (Site must be physically adjacent to the project)
100
Project enhances economic development by improving congestion mobility access or operations in the vicinity of the site but the site is not physically adjacent to the project
50
Development NameTotal Points Square Footage Distance Site Access Access
AdjustmentAdjusted
Square Footage
Development A 5 250000 2Project enhances economic development by improving congestion mobility access or operations in the vicinity of the site but the site is not physically adjacent to the project
50 312500
Development B 5 250000 02Project improves existing access (or relocates existing access) to the site directly (Site must be physically adjacent to the project)
100 1250000
Economic Development ndash HowDevelopment Supported
61
62
Economic Development ndash HowIntermodal Access
bull Project can get up to 6 pointsbull Improve access to distribution centers or intermodalmanufacturing facilities
Within 1 mile ndash 2 points 1 to 3 miles ndash 1 point
bull Improve STAA Truck Route Improvement to STAA route - 2 points Improve access to STAA route ndash 1 point
bull Improve access or reduce congestion around portairports Within 1 mile - 2 points 1-3 miles ndash 1 point
bull Point are scaled by freight tonnage along corridor ndash IHS Transearch data was used to calculate daily tonnage on the project
Improve Access to distro intermodal and manufacturing
Improve STAA truck route
Improve access reduce congestion portsairports
Tonnage (1000s) per day
Measure Scaled by tonnage
Project A 200 200 000 16307 65228
Project B 100 200 000 20815 62445
Project C 200 100 000 477 1431
62
63
Measuring LAND USE
ndash 100 of score ndash Degree to which project will support transportation efficient land use patterns and local policies
bull Points awarded based onbull Promoting walkable bicycle friendly mixed use developmentbull Supporting in-fill developmentbull Having an adopted corridoraccess management plan that
exceeds VDOT standardsbull Points scaled by projected 2025 population and employment
density (from MPO approved travel demand model)
63
64
Land Use ndash HowLocalRegional Land Use Policies
bull LocalRegional Land Use Policiesndash Points awarded based on
Promoting walkable bicycle friendly mixed use development
Supporting in-fill development Having an adopted corridoraccess management plan that
exceeds VDOT standards
ndash Points scaled by projected population and employment density (from MPO approved travel demand model)
64
65
How Scoring Works
10090
8070 60
Everything is Relative
65
66
Everything is Relative
Project Measure ScoreA 250 50B 300 60C 75 15D 15 3E 500 100F 150 30
Highest Value Dictates Scores
Project Measure ScoreA 200 40B 300 60C 75 15D 15 3E 500 100F 150 30
Project Measure ScoreA 250 333B 300 40C 75 10D 15 2E 750 100F 150 20
Change here only affects one score
Change here affects all
scores
The best project for that measure dictates the score for all other projects
66
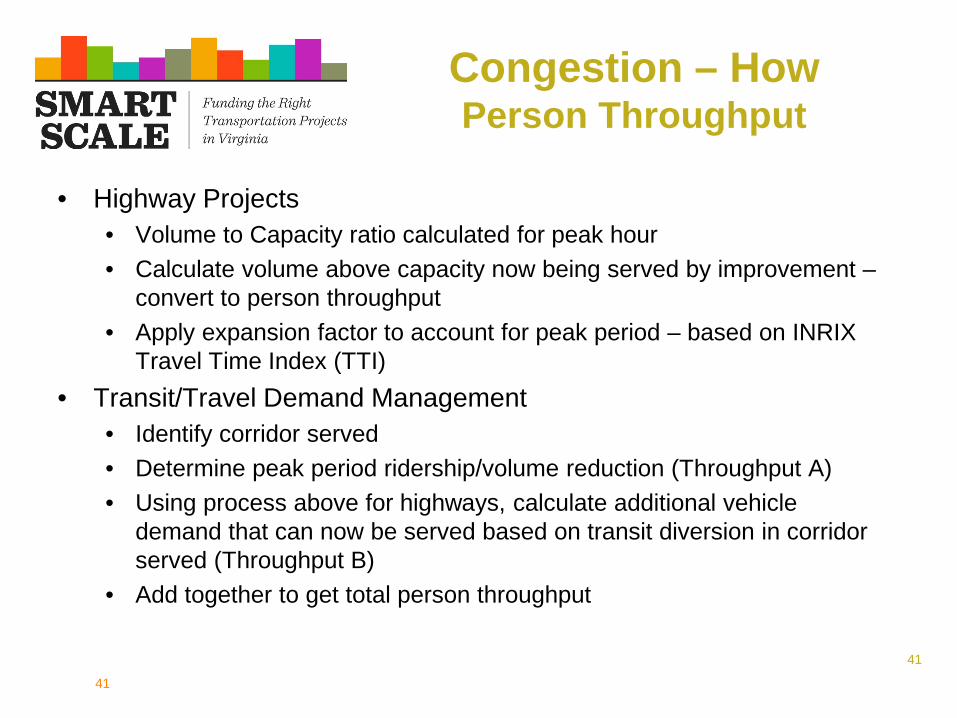
42
bull Highway Projectsbull Volume to Capacity ratio
calculated for each hour of day to estimate speed
bull Sum delay reduction (up to posted speed limit) for peak period and convert to person hours
bull TransitTravel Demand Managementbull Identify corridor servedbull Determine peak period
ridershipvolume reduction bull Using process above for highways
calculate reduction in person hours
Congestion ndash HowPerson Hours of Delay
42
43
Congestion ndash HowAdjusting Volume to Capacity
VC
VC
No build
Build
Before Speed
After Speed
Transit PampR
Capacity Improvement
43
44
Measuring ACCESSIBILITY
ndash 60 of score ndash Change in cumulative job accessibility (within 45 minutes) (within 60 minutes for transit projects)
ndash 20 of score - Change in cumulative job accessibility for disadvantaged populations (within 45 minutes by automobile and 60 minutes by transit)
ndash 20 of score ndash Assessment of the project support for connections between modes and promotion of multiple transportation choices
44
45
Accessibility - HowAccess to Jobs
bull All Projectsbull Using analysis for congestion measures ndash use change in speedbull Also consider reduced travel distances from new facilities and
changes in land development patterns bull Use improvement in speed to code improvement into Accessibility
GIS tool ndash conduct before and after analysis to get change in cumulative job access
bull Accessibility Toolbull GIS based modelbull Analysis done at Census block group level ndash job access between
each block group within 45 minutes (60 minutes for transit)bull Decay factor applied based on travel time
45
46
bull Accessibility Tool
1 2 3 4 5
6 7 8 9 10
11 12 13 14 15
Tool analyzes existing accessibility to jobs
No-
Build
Accessibility - HowAccess to Jobs
46
47
Accessibility - HowAccess to Jobs
bull Accessibility Tool
1 2 3 4 5
6 7 8 9 10
11 12 13 14 15
Tool moves to next block assessing existing accessibility
No-
Build
47
48
Accessibility - HowAccess to Jobs
bull Accessibility Tool
1 2 3 4 5
6 7 8 9 10
11 12 13 14 15
Process is repeated for all blocks to establish existing accessibility to jobs
No-
Build
48
49
Accessibility - HowAccess to Jobs
bull Accessibility Tool
1 2 3 4 5
6 7 8 9 10
11 12 13 14 15
Tool then analyzes change in access to jobs based on proposed improvement
Build
49
50
Accessibility - HowAccess to Jobs
bull Accessibility Tool
1 2 3 4 5
6 7 8 9 10
11 12 13 14 15
Tool moves to next block calculating change in job access
Build
50
51
Accessibility - HowAccess to Jobs
bull Accessibility Tool
1 2 3 4 5
6 7 8 9 10
11 12 13 14 15
Process is repeated for all blocks ndash increase in access for each block is summed and used to score projects
Build
51
52
Disadvantaged Access to Jobs
bull Similar process in previous slides used for disadvantaged access to jobs
bull Main difference is the utilization of disadvantaged population data in the calculation
bull Disadvantaged populationbull Low income elderly minority and Limited English Proficiency
population percentage by Census Block Group
bull Compared block group and identified block groups in the 75th
percentile of the region ndash regions defined as PDCMPONVTA
52
53
Accessibility - HowAccess to Travel Options
bull Projects receive points based on features than enhance multimodal access (Max 5 points)bull Transitbull Park and Ridebull Bikebull Pedestrianbull HOVHOTbull Real time traveler info or wayfinding
bull Scaled by the number of anticipated Non-SOV usersbull Transit Users + Bike Users + Pedestrians +
HOVPark and Ride
53
54
Measuring ENVIRONMENTAL QUALITY
ndash 50 of score ndash Potential of project to reduce criteria air pollutant and greenhouse gas emissions
ndash 50 of Score ndash Potential impacts to natural and cultural resources
54
55
Environment ndash HowAir Quality and Energy
bull Air QualityEnergybull Points awarded based on
Providing bicycle or pedestrian facilities Improvements for transit Addressing freight bottlenecks New or expanded Park and Ride lot Provisions for hybridelectric vehicles or
energy efficient infrastructurebull Points scaled based on number of non-
SOV users and truck volume
55
56
Environment ndash HowNaturalCultural Resource Impact
Sum the total acreage of land (within frac14 mile of project) in four categories
bull Conservation Landbull SpeciesHabitatbull Cultural Resourcesbull Wetlands
(Data sources VOF VDCR VDOF VDGIF NPS VDHR USFWS)
Project Conservation SpeciesHabitat Cultural Resources
Wetlands Total Acres
A 100 25 25 150 300
Example
56
57
Environment ndash HowNaturalCultural Resource Impact
Scaling Impact and Assigning PointsThe type of environmental document required for each project
will be used to assess and scale the potential natural resource impacts
bull Environmental Impact Statement ndash 50 of acreage will be used for scoring
bull Environmental Assessment ndash 30 of acreage will be used for scoring
bull Categorical Exclusion ndash 10 of acreage will be used for scoring
bull Points based on the amount of potentially impacted area divided by the total buffer area (Lowest Impact = 100 points)
57
58
Environment ndash HowNaturalCultural Resource Impact
Project Conservation SpeciesHabitat
Cultural Resources Wetlands Total
AcresEnviro
DocScaled Acres
A 100 25 25 150 300 EA 100
B 100 25 25 150 300 EIS 150
C 20 0 0 5 25 CE 25
This value gets divided by the total acres within the frac14 mile project buffer
58
59
Measuring ECONOMIC DEVELOPMENT
ndash 60 of score ndash Assessment of progress made towards new economic development (new and expansion of existing)
ndash 20 of score - Rate projects based on the extent to which the project is deemed to enhance access to critical intermodal locations interregional freight movement andor freight intensive industries
ndash 20 of score ndash Projectrsquos impact to travel time reliability
59
60
Economic Development ndash HowDevelopment Supported
bull For each project development sites are identified that the project supports
bull Proposed transportation improvement is evaluated onbull Consistency with Local Comp PlanLocal Economic Development
Strategy ndash up to 1 pointbull Consistency with Regional Economic Development Strategy ndash up to
1 pointbull Each development site is evaluated on
bull Consistency with local comp planzoning ndash up to 1 pointbull Development status ndash up to 1 pointbull Site utilities ndash up to 1 point
bull Max 5 points per site ndash used to weight square footage
60
61
bull Adjusting Weighted Square Footagendash Two Adjustments
Distance from project in miles (except sites less than 1 mile) Type of access provided
bull Formula ndash (Points) x (Square Footage) (Distance) x (Access Adjustment)
Project provides a new direct (physically to the site) primary access to the site that does not exist today 100
Project improves existing access (or relocates existing access) to the site directly (Site must be physically adjacent to the project)
100
Project enhances economic development by improving congestion mobility access or operations in the vicinity of the site but the site is not physically adjacent to the project
50
Development NameTotal Points Square Footage Distance Site Access Access
AdjustmentAdjusted
Square Footage
Development A 5 250000 2Project enhances economic development by improving congestion mobility access or operations in the vicinity of the site but the site is not physically adjacent to the project
50 312500
Development B 5 250000 02Project improves existing access (or relocates existing access) to the site directly (Site must be physically adjacent to the project)
100 1250000
Economic Development ndash HowDevelopment Supported
61
62
Economic Development ndash HowIntermodal Access
bull Project can get up to 6 pointsbull Improve access to distribution centers or intermodalmanufacturing facilities
Within 1 mile ndash 2 points 1 to 3 miles ndash 1 point
bull Improve STAA Truck Route Improvement to STAA route - 2 points Improve access to STAA route ndash 1 point
bull Improve access or reduce congestion around portairports Within 1 mile - 2 points 1-3 miles ndash 1 point
bull Point are scaled by freight tonnage along corridor ndash IHS Transearch data was used to calculate daily tonnage on the project
Improve Access to distro intermodal and manufacturing
Improve STAA truck route
Improve access reduce congestion portsairports
Tonnage (1000s) per day
Measure Scaled by tonnage
Project A 200 200 000 16307 65228
Project B 100 200 000 20815 62445
Project C 200 100 000 477 1431
62
63
Measuring LAND USE
ndash 100 of score ndash Degree to which project will support transportation efficient land use patterns and local policies
bull Points awarded based onbull Promoting walkable bicycle friendly mixed use developmentbull Supporting in-fill developmentbull Having an adopted corridoraccess management plan that
exceeds VDOT standardsbull Points scaled by projected 2025 population and employment
density (from MPO approved travel demand model)
63
64
Land Use ndash HowLocalRegional Land Use Policies
bull LocalRegional Land Use Policiesndash Points awarded based on
Promoting walkable bicycle friendly mixed use development
Supporting in-fill development Having an adopted corridoraccess management plan that
exceeds VDOT standards
ndash Points scaled by projected population and employment density (from MPO approved travel demand model)
64
65
How Scoring Works
10090
8070 60
Everything is Relative
65
66
Everything is Relative
Project Measure ScoreA 250 50B 300 60C 75 15D 15 3E 500 100F 150 30
Highest Value Dictates Scores
Project Measure ScoreA 200 40B 300 60C 75 15D 15 3E 500 100F 150 30
Project Measure ScoreA 250 333B 300 40C 75 10D 15 2E 750 100F 150 20
Change here only affects one score
Change here affects all
scores
The best project for that measure dictates the score for all other projects
66

43
Congestion ndash HowAdjusting Volume to Capacity
VC
VC
No build
Build
Before Speed
After Speed
Transit PampR
Capacity Improvement
43
44
Measuring ACCESSIBILITY
ndash 60 of score ndash Change in cumulative job accessibility (within 45 minutes) (within 60 minutes for transit projects)
ndash 20 of score - Change in cumulative job accessibility for disadvantaged populations (within 45 minutes by automobile and 60 minutes by transit)
ndash 20 of score ndash Assessment of the project support for connections between modes and promotion of multiple transportation choices
44
45
Accessibility - HowAccess to Jobs
bull All Projectsbull Using analysis for congestion measures ndash use change in speedbull Also consider reduced travel distances from new facilities and
changes in land development patterns bull Use improvement in speed to code improvement into Accessibility
GIS tool ndash conduct before and after analysis to get change in cumulative job access
bull Accessibility Toolbull GIS based modelbull Analysis done at Census block group level ndash job access between
each block group within 45 minutes (60 minutes for transit)bull Decay factor applied based on travel time
45
46
bull Accessibility Tool
1 2 3 4 5
6 7 8 9 10
11 12 13 14 15
Tool analyzes existing accessibility to jobs
No-
Build
Accessibility - HowAccess to Jobs
46
47
Accessibility - HowAccess to Jobs
bull Accessibility Tool
1 2 3 4 5
6 7 8 9 10
11 12 13 14 15
Tool moves to next block assessing existing accessibility
No-
Build
47
48
Accessibility - HowAccess to Jobs
bull Accessibility Tool
1 2 3 4 5
6 7 8 9 10
11 12 13 14 15
Process is repeated for all blocks to establish existing accessibility to jobs
No-
Build
48
49
Accessibility - HowAccess to Jobs
bull Accessibility Tool
1 2 3 4 5
6 7 8 9 10
11 12 13 14 15
Tool then analyzes change in access to jobs based on proposed improvement
Build
49
50
Accessibility - HowAccess to Jobs
bull Accessibility Tool
1 2 3 4 5
6 7 8 9 10
11 12 13 14 15
Tool moves to next block calculating change in job access
Build
50
51
Accessibility - HowAccess to Jobs
bull Accessibility Tool
1 2 3 4 5
6 7 8 9 10
11 12 13 14 15
Process is repeated for all blocks ndash increase in access for each block is summed and used to score projects
Build
51
52
Disadvantaged Access to Jobs
bull Similar process in previous slides used for disadvantaged access to jobs
bull Main difference is the utilization of disadvantaged population data in the calculation
bull Disadvantaged populationbull Low income elderly minority and Limited English Proficiency
population percentage by Census Block Group
bull Compared block group and identified block groups in the 75th
percentile of the region ndash regions defined as PDCMPONVTA
52
53
Accessibility - HowAccess to Travel Options
bull Projects receive points based on features than enhance multimodal access (Max 5 points)bull Transitbull Park and Ridebull Bikebull Pedestrianbull HOVHOTbull Real time traveler info or wayfinding
bull Scaled by the number of anticipated Non-SOV usersbull Transit Users + Bike Users + Pedestrians +
HOVPark and Ride
53
54
Measuring ENVIRONMENTAL QUALITY
ndash 50 of score ndash Potential of project to reduce criteria air pollutant and greenhouse gas emissions
ndash 50 of Score ndash Potential impacts to natural and cultural resources
54
55
Environment ndash HowAir Quality and Energy
bull Air QualityEnergybull Points awarded based on
Providing bicycle or pedestrian facilities Improvements for transit Addressing freight bottlenecks New or expanded Park and Ride lot Provisions for hybridelectric vehicles or
energy efficient infrastructurebull Points scaled based on number of non-
SOV users and truck volume
55
56
Environment ndash HowNaturalCultural Resource Impact
Sum the total acreage of land (within frac14 mile of project) in four categories
bull Conservation Landbull SpeciesHabitatbull Cultural Resourcesbull Wetlands
(Data sources VOF VDCR VDOF VDGIF NPS VDHR USFWS)
Project Conservation SpeciesHabitat Cultural Resources
Wetlands Total Acres
A 100 25 25 150 300
Example
56
57
Environment ndash HowNaturalCultural Resource Impact
Scaling Impact and Assigning PointsThe type of environmental document required for each project
will be used to assess and scale the potential natural resource impacts
bull Environmental Impact Statement ndash 50 of acreage will be used for scoring
bull Environmental Assessment ndash 30 of acreage will be used for scoring
bull Categorical Exclusion ndash 10 of acreage will be used for scoring
bull Points based on the amount of potentially impacted area divided by the total buffer area (Lowest Impact = 100 points)
57
58
Environment ndash HowNaturalCultural Resource Impact
Project Conservation SpeciesHabitat
Cultural Resources Wetlands Total
AcresEnviro
DocScaled Acres
A 100 25 25 150 300 EA 100
B 100 25 25 150 300 EIS 150
C 20 0 0 5 25 CE 25
This value gets divided by the total acres within the frac14 mile project buffer
58
59
Measuring ECONOMIC DEVELOPMENT
ndash 60 of score ndash Assessment of progress made towards new economic development (new and expansion of existing)
ndash 20 of score - Rate projects based on the extent to which the project is deemed to enhance access to critical intermodal locations interregional freight movement andor freight intensive industries
ndash 20 of score ndash Projectrsquos impact to travel time reliability
59
60
Economic Development ndash HowDevelopment Supported
bull For each project development sites are identified that the project supports
bull Proposed transportation improvement is evaluated onbull Consistency with Local Comp PlanLocal Economic Development
Strategy ndash up to 1 pointbull Consistency with Regional Economic Development Strategy ndash up to
1 pointbull Each development site is evaluated on
bull Consistency with local comp planzoning ndash up to 1 pointbull Development status ndash up to 1 pointbull Site utilities ndash up to 1 point
bull Max 5 points per site ndash used to weight square footage
60
61
bull Adjusting Weighted Square Footagendash Two Adjustments
Distance from project in miles (except sites less than 1 mile) Type of access provided
bull Formula ndash (Points) x (Square Footage) (Distance) x (Access Adjustment)
Project provides a new direct (physically to the site) primary access to the site that does not exist today 100
Project improves existing access (or relocates existing access) to the site directly (Site must be physically adjacent to the project)
100
Project enhances economic development by improving congestion mobility access or operations in the vicinity of the site but the site is not physically adjacent to the project
50
Development NameTotal Points Square Footage Distance Site Access Access
AdjustmentAdjusted
Square Footage
Development A 5 250000 2Project enhances economic development by improving congestion mobility access or operations in the vicinity of the site but the site is not physically adjacent to the project
50 312500
Development B 5 250000 02Project improves existing access (or relocates existing access) to the site directly (Site must be physically adjacent to the project)
100 1250000
Economic Development ndash HowDevelopment Supported
61
62
Economic Development ndash HowIntermodal Access
bull Project can get up to 6 pointsbull Improve access to distribution centers or intermodalmanufacturing facilities
Within 1 mile ndash 2 points 1 to 3 miles ndash 1 point
bull Improve STAA Truck Route Improvement to STAA route - 2 points Improve access to STAA route ndash 1 point
bull Improve access or reduce congestion around portairports Within 1 mile - 2 points 1-3 miles ndash 1 point
bull Point are scaled by freight tonnage along corridor ndash IHS Transearch data was used to calculate daily tonnage on the project
Improve Access to distro intermodal and manufacturing
Improve STAA truck route
Improve access reduce congestion portsairports
Tonnage (1000s) per day
Measure Scaled by tonnage
Project A 200 200 000 16307 65228
Project B 100 200 000 20815 62445
Project C 200 100 000 477 1431
62
63
Measuring LAND USE
ndash 100 of score ndash Degree to which project will support transportation efficient land use patterns and local policies
bull Points awarded based onbull Promoting walkable bicycle friendly mixed use developmentbull Supporting in-fill developmentbull Having an adopted corridoraccess management plan that
exceeds VDOT standardsbull Points scaled by projected 2025 population and employment
density (from MPO approved travel demand model)
63
64
Land Use ndash HowLocalRegional Land Use Policies
bull LocalRegional Land Use Policiesndash Points awarded based on
Promoting walkable bicycle friendly mixed use development
Supporting in-fill development Having an adopted corridoraccess management plan that
exceeds VDOT standards
ndash Points scaled by projected population and employment density (from MPO approved travel demand model)
64
65
How Scoring Works
10090
8070 60
Everything is Relative
65
66
Everything is Relative
Project Measure ScoreA 250 50B 300 60C 75 15D 15 3E 500 100F 150 30
Highest Value Dictates Scores
Project Measure ScoreA 200 40B 300 60C 75 15D 15 3E 500 100F 150 30
Project Measure ScoreA 250 333B 300 40C 75 10D 15 2E 750 100F 150 20
Change here only affects one score
Change here affects all
scores
The best project for that measure dictates the score for all other projects
66
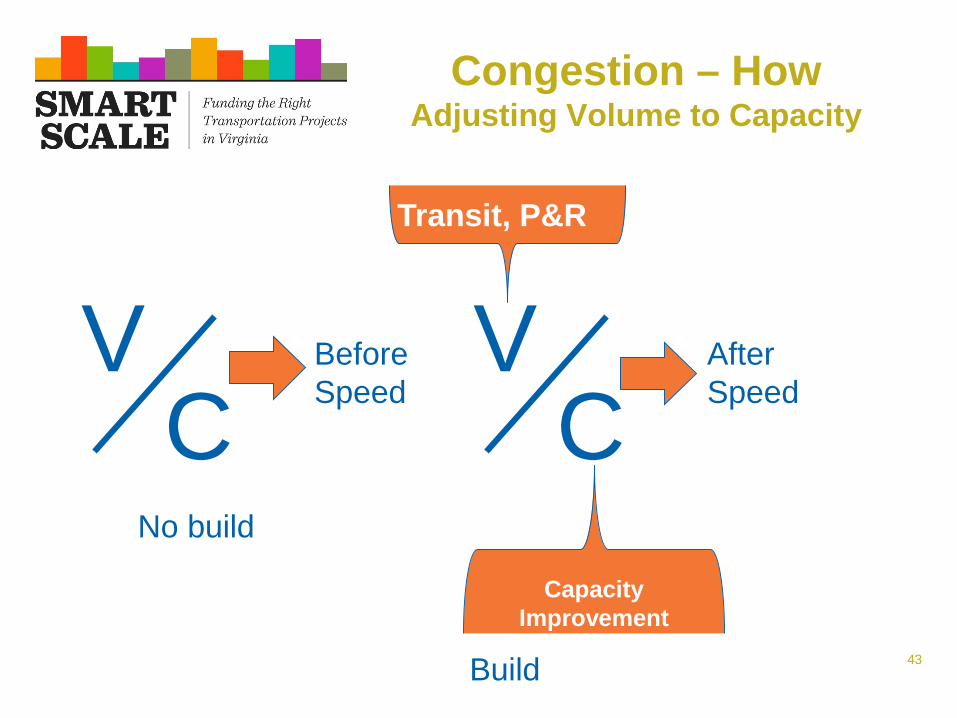
44
Measuring ACCESSIBILITY
ndash 60 of score ndash Change in cumulative job accessibility (within 45 minutes) (within 60 minutes for transit projects)
ndash 20 of score - Change in cumulative job accessibility for disadvantaged populations (within 45 minutes by automobile and 60 minutes by transit)
ndash 20 of score ndash Assessment of the project support for connections between modes and promotion of multiple transportation choices
44
45
Accessibility - HowAccess to Jobs
bull All Projectsbull Using analysis for congestion measures ndash use change in speedbull Also consider reduced travel distances from new facilities and
changes in land development patterns bull Use improvement in speed to code improvement into Accessibility
GIS tool ndash conduct before and after analysis to get change in cumulative job access
bull Accessibility Toolbull GIS based modelbull Analysis done at Census block group level ndash job access between
each block group within 45 minutes (60 minutes for transit)bull Decay factor applied based on travel time
45
46
bull Accessibility Tool
1 2 3 4 5
6 7 8 9 10
11 12 13 14 15
Tool analyzes existing accessibility to jobs
No-
Build
Accessibility - HowAccess to Jobs
46
47
Accessibility - HowAccess to Jobs
bull Accessibility Tool
1 2 3 4 5
6 7 8 9 10
11 12 13 14 15
Tool moves to next block assessing existing accessibility
No-
Build
47
48
Accessibility - HowAccess to Jobs
bull Accessibility Tool
1 2 3 4 5
6 7 8 9 10
11 12 13 14 15
Process is repeated for all blocks to establish existing accessibility to jobs
No-
Build
48
49
Accessibility - HowAccess to Jobs
bull Accessibility Tool
1 2 3 4 5
6 7 8 9 10
11 12 13 14 15
Tool then analyzes change in access to jobs based on proposed improvement
Build
49
50
Accessibility - HowAccess to Jobs
bull Accessibility Tool
1 2 3 4 5
6 7 8 9 10
11 12 13 14 15
Tool moves to next block calculating change in job access
Build
50
51
Accessibility - HowAccess to Jobs
bull Accessibility Tool
1 2 3 4 5
6 7 8 9 10
11 12 13 14 15
Process is repeated for all blocks ndash increase in access for each block is summed and used to score projects
Build
51
52
Disadvantaged Access to Jobs
bull Similar process in previous slides used for disadvantaged access to jobs
bull Main difference is the utilization of disadvantaged population data in the calculation
bull Disadvantaged populationbull Low income elderly minority and Limited English Proficiency
population percentage by Census Block Group
bull Compared block group and identified block groups in the 75th
percentile of the region ndash regions defined as PDCMPONVTA
52
53
Accessibility - HowAccess to Travel Options
bull Projects receive points based on features than enhance multimodal access (Max 5 points)bull Transitbull Park and Ridebull Bikebull Pedestrianbull HOVHOTbull Real time traveler info or wayfinding
bull Scaled by the number of anticipated Non-SOV usersbull Transit Users + Bike Users + Pedestrians +
HOVPark and Ride
53
54
Measuring ENVIRONMENTAL QUALITY
ndash 50 of score ndash Potential of project to reduce criteria air pollutant and greenhouse gas emissions
ndash 50 of Score ndash Potential impacts to natural and cultural resources
54
55
Environment ndash HowAir Quality and Energy
bull Air QualityEnergybull Points awarded based on
Providing bicycle or pedestrian facilities Improvements for transit Addressing freight bottlenecks New or expanded Park and Ride lot Provisions for hybridelectric vehicles or
energy efficient infrastructurebull Points scaled based on number of non-
SOV users and truck volume
55
56
Environment ndash HowNaturalCultural Resource Impact
Sum the total acreage of land (within frac14 mile of project) in four categories
bull Conservation Landbull SpeciesHabitatbull Cultural Resourcesbull Wetlands
(Data sources VOF VDCR VDOF VDGIF NPS VDHR USFWS)
Project Conservation SpeciesHabitat Cultural Resources
Wetlands Total Acres
A 100 25 25 150 300
Example
56
57
Environment ndash HowNaturalCultural Resource Impact
Scaling Impact and Assigning PointsThe type of environmental document required for each project
will be used to assess and scale the potential natural resource impacts
bull Environmental Impact Statement ndash 50 of acreage will be used for scoring
bull Environmental Assessment ndash 30 of acreage will be used for scoring
bull Categorical Exclusion ndash 10 of acreage will be used for scoring
bull Points based on the amount of potentially impacted area divided by the total buffer area (Lowest Impact = 100 points)
57
58
Environment ndash HowNaturalCultural Resource Impact
Project Conservation SpeciesHabitat
Cultural Resources Wetlands Total
AcresEnviro
DocScaled Acres
A 100 25 25 150 300 EA 100
B 100 25 25 150 300 EIS 150
C 20 0 0 5 25 CE 25
This value gets divided by the total acres within the frac14 mile project buffer
58
59
Measuring ECONOMIC DEVELOPMENT
ndash 60 of score ndash Assessment of progress made towards new economic development (new and expansion of existing)
ndash 20 of score - Rate projects based on the extent to which the project is deemed to enhance access to critical intermodal locations interregional freight movement andor freight intensive industries
ndash 20 of score ndash Projectrsquos impact to travel time reliability
59
60
Economic Development ndash HowDevelopment Supported
bull For each project development sites are identified that the project supports
bull Proposed transportation improvement is evaluated onbull Consistency with Local Comp PlanLocal Economic Development
Strategy ndash up to 1 pointbull Consistency with Regional Economic Development Strategy ndash up to
1 pointbull Each development site is evaluated on
bull Consistency with local comp planzoning ndash up to 1 pointbull Development status ndash up to 1 pointbull Site utilities ndash up to 1 point
bull Max 5 points per site ndash used to weight square footage
60
61
bull Adjusting Weighted Square Footagendash Two Adjustments
Distance from project in miles (except sites less than 1 mile) Type of access provided
bull Formula ndash (Points) x (Square Footage) (Distance) x (Access Adjustment)
Project provides a new direct (physically to the site) primary access to the site that does not exist today 100
Project improves existing access (or relocates existing access) to the site directly (Site must be physically adjacent to the project)
100
Project enhances economic development by improving congestion mobility access or operations in the vicinity of the site but the site is not physically adjacent to the project
50
Development NameTotal Points Square Footage Distance Site Access Access
AdjustmentAdjusted
Square Footage
Development A 5 250000 2Project enhances economic development by improving congestion mobility access or operations in the vicinity of the site but the site is not physically adjacent to the project
50 312500
Development B 5 250000 02Project improves existing access (or relocates existing access) to the site directly (Site must be physically adjacent to the project)
100 1250000
Economic Development ndash HowDevelopment Supported
61
62
Economic Development ndash HowIntermodal Access
bull Project can get up to 6 pointsbull Improve access to distribution centers or intermodalmanufacturing facilities
Within 1 mile ndash 2 points 1 to 3 miles ndash 1 point
bull Improve STAA Truck Route Improvement to STAA route - 2 points Improve access to STAA route ndash 1 point
bull Improve access or reduce congestion around portairports Within 1 mile - 2 points 1-3 miles ndash 1 point
bull Point are scaled by freight tonnage along corridor ndash IHS Transearch data was used to calculate daily tonnage on the project
Improve Access to distro intermodal and manufacturing
Improve STAA truck route
Improve access reduce congestion portsairports
Tonnage (1000s) per day
Measure Scaled by tonnage
Project A 200 200 000 16307 65228
Project B 100 200 000 20815 62445
Project C 200 100 000 477 1431
62
63
Measuring LAND USE
ndash 100 of score ndash Degree to which project will support transportation efficient land use patterns and local policies
bull Points awarded based onbull Promoting walkable bicycle friendly mixed use developmentbull Supporting in-fill developmentbull Having an adopted corridoraccess management plan that
exceeds VDOT standardsbull Points scaled by projected 2025 population and employment
density (from MPO approved travel demand model)
63
64
Land Use ndash HowLocalRegional Land Use Policies
bull LocalRegional Land Use Policiesndash Points awarded based on
Promoting walkable bicycle friendly mixed use development
Supporting in-fill development Having an adopted corridoraccess management plan that
exceeds VDOT standards
ndash Points scaled by projected population and employment density (from MPO approved travel demand model)
64
65
How Scoring Works
10090
8070 60
Everything is Relative
65
66
Everything is Relative
Project Measure ScoreA 250 50B 300 60C 75 15D 15 3E 500 100F 150 30
Highest Value Dictates Scores
Project Measure ScoreA 200 40B 300 60C 75 15D 15 3E 500 100F 150 30
Project Measure ScoreA 250 333B 300 40C 75 10D 15 2E 750 100F 150 20
Change here only affects one score
Change here affects all
scores
The best project for that measure dictates the score for all other projects
66
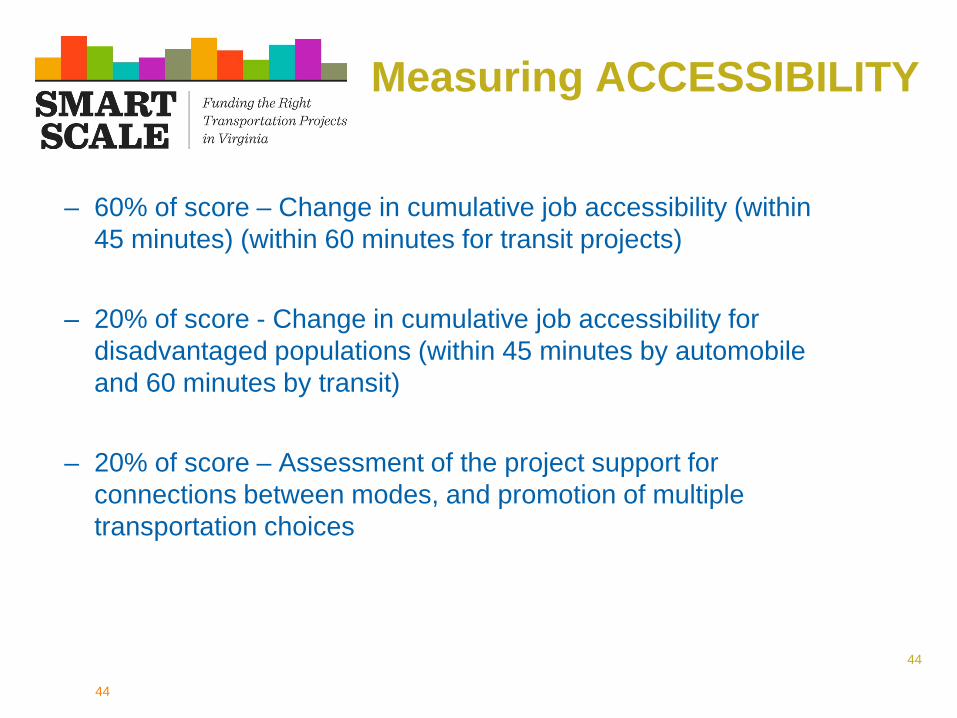
45
Accessibility - HowAccess to Jobs
bull All Projectsbull Using analysis for congestion measures ndash use change in speedbull Also consider reduced travel distances from new facilities and
changes in land development patterns bull Use improvement in speed to code improvement into Accessibility
GIS tool ndash conduct before and after analysis to get change in cumulative job access
bull Accessibility Toolbull GIS based modelbull Analysis done at Census block group level ndash job access between
each block group within 45 minutes (60 minutes for transit)bull Decay factor applied based on travel time
45
46
bull Accessibility Tool
1 2 3 4 5
6 7 8 9 10
11 12 13 14 15
Tool analyzes existing accessibility to jobs
No-
Build
Accessibility - HowAccess to Jobs
46
47
Accessibility - HowAccess to Jobs
bull Accessibility Tool
1 2 3 4 5
6 7 8 9 10
11 12 13 14 15
Tool moves to next block assessing existing accessibility
No-
Build
47
48
Accessibility - HowAccess to Jobs
bull Accessibility Tool
1 2 3 4 5
6 7 8 9 10
11 12 13 14 15
Process is repeated for all blocks to establish existing accessibility to jobs
No-
Build
48
49
Accessibility - HowAccess to Jobs
bull Accessibility Tool
1 2 3 4 5
6 7 8 9 10
11 12 13 14 15
Tool then analyzes change in access to jobs based on proposed improvement
Build
49
50
Accessibility - HowAccess to Jobs
bull Accessibility Tool
1 2 3 4 5
6 7 8 9 10
11 12 13 14 15
Tool moves to next block calculating change in job access
Build
50
51
Accessibility - HowAccess to Jobs
bull Accessibility Tool
1 2 3 4 5
6 7 8 9 10
11 12 13 14 15
Process is repeated for all blocks ndash increase in access for each block is summed and used to score projects
Build
51
52
Disadvantaged Access to Jobs
bull Similar process in previous slides used for disadvantaged access to jobs
bull Main difference is the utilization of disadvantaged population data in the calculation
bull Disadvantaged populationbull Low income elderly minority and Limited English Proficiency
population percentage by Census Block Group
bull Compared block group and identified block groups in the 75th
percentile of the region ndash regions defined as PDCMPONVTA
52
53
Accessibility - HowAccess to Travel Options
bull Projects receive points based on features than enhance multimodal access (Max 5 points)bull Transitbull Park and Ridebull Bikebull Pedestrianbull HOVHOTbull Real time traveler info or wayfinding
bull Scaled by the number of anticipated Non-SOV usersbull Transit Users + Bike Users + Pedestrians +
HOVPark and Ride
53
54
Measuring ENVIRONMENTAL QUALITY
ndash 50 of score ndash Potential of project to reduce criteria air pollutant and greenhouse gas emissions
ndash 50 of Score ndash Potential impacts to natural and cultural resources
54
55
Environment ndash HowAir Quality and Energy
bull Air QualityEnergybull Points awarded based on
Providing bicycle or pedestrian facilities Improvements for transit Addressing freight bottlenecks New or expanded Park and Ride lot Provisions for hybridelectric vehicles or
energy efficient infrastructurebull Points scaled based on number of non-
SOV users and truck volume
55
56
Environment ndash HowNaturalCultural Resource Impact
Sum the total acreage of land (within frac14 mile of project) in four categories
bull Conservation Landbull SpeciesHabitatbull Cultural Resourcesbull Wetlands
(Data sources VOF VDCR VDOF VDGIF NPS VDHR USFWS)
Project Conservation SpeciesHabitat Cultural Resources
Wetlands Total Acres
A 100 25 25 150 300
Example
56
57
Environment ndash HowNaturalCultural Resource Impact
Scaling Impact and Assigning PointsThe type of environmental document required for each project
will be used to assess and scale the potential natural resource impacts
bull Environmental Impact Statement ndash 50 of acreage will be used for scoring
bull Environmental Assessment ndash 30 of acreage will be used for scoring
bull Categorical Exclusion ndash 10 of acreage will be used for scoring
bull Points based on the amount of potentially impacted area divided by the total buffer area (Lowest Impact = 100 points)
57
58
Environment ndash HowNaturalCultural Resource Impact
Project Conservation SpeciesHabitat
Cultural Resources Wetlands Total
AcresEnviro
DocScaled Acres
A 100 25 25 150 300 EA 100
B 100 25 25 150 300 EIS 150
C 20 0 0 5 25 CE 25
This value gets divided by the total acres within the frac14 mile project buffer
58
59
Measuring ECONOMIC DEVELOPMENT
ndash 60 of score ndash Assessment of progress made towards new economic development (new and expansion of existing)
ndash 20 of score - Rate projects based on the extent to which the project is deemed to enhance access to critical intermodal locations interregional freight movement andor freight intensive industries
ndash 20 of score ndash Projectrsquos impact to travel time reliability
59
60
Economic Development ndash HowDevelopment Supported
bull For each project development sites are identified that the project supports
bull Proposed transportation improvement is evaluated onbull Consistency with Local Comp PlanLocal Economic Development
Strategy ndash up to 1 pointbull Consistency with Regional Economic Development Strategy ndash up to
1 pointbull Each development site is evaluated on
bull Consistency with local comp planzoning ndash up to 1 pointbull Development status ndash up to 1 pointbull Site utilities ndash up to 1 point
bull Max 5 points per site ndash used to weight square footage
60
61
bull Adjusting Weighted Square Footagendash Two Adjustments
Distance from project in miles (except sites less than 1 mile) Type of access provided
bull Formula ndash (Points) x (Square Footage) (Distance) x (Access Adjustment)
Project provides a new direct (physically to the site) primary access to the site that does not exist today 100
Project improves existing access (or relocates existing access) to the site directly (Site must be physically adjacent to the project)
100
Project enhances economic development by improving congestion mobility access or operations in the vicinity of the site but the site is not physically adjacent to the project
50
Development NameTotal Points Square Footage Distance Site Access Access
AdjustmentAdjusted
Square Footage
Development A 5 250000 2Project enhances economic development by improving congestion mobility access or operations in the vicinity of the site but the site is not physically adjacent to the project
50 312500
Development B 5 250000 02Project improves existing access (or relocates existing access) to the site directly (Site must be physically adjacent to the project)
100 1250000
Economic Development ndash HowDevelopment Supported
61
62
Economic Development ndash HowIntermodal Access
bull Project can get up to 6 pointsbull Improve access to distribution centers or intermodalmanufacturing facilities
Within 1 mile ndash 2 points 1 to 3 miles ndash 1 point
bull Improve STAA Truck Route Improvement to STAA route - 2 points Improve access to STAA route ndash 1 point
bull Improve access or reduce congestion around portairports Within 1 mile - 2 points 1-3 miles ndash 1 point
bull Point are scaled by freight tonnage along corridor ndash IHS Transearch data was used to calculate daily tonnage on the project
Improve Access to distro intermodal and manufacturing
Improve STAA truck route
Improve access reduce congestion portsairports
Tonnage (1000s) per day
Measure Scaled by tonnage
Project A 200 200 000 16307 65228
Project B 100 200 000 20815 62445
Project C 200 100 000 477 1431
62
63
Measuring LAND USE
ndash 100 of score ndash Degree to which project will support transportation efficient land use patterns and local policies
bull Points awarded based onbull Promoting walkable bicycle friendly mixed use developmentbull Supporting in-fill developmentbull Having an adopted corridoraccess management plan that
exceeds VDOT standardsbull Points scaled by projected 2025 population and employment
density (from MPO approved travel demand model)
63
64
Land Use ndash HowLocalRegional Land Use Policies
bull LocalRegional Land Use Policiesndash Points awarded based on
Promoting walkable bicycle friendly mixed use development
Supporting in-fill development Having an adopted corridoraccess management plan that
exceeds VDOT standards
ndash Points scaled by projected population and employment density (from MPO approved travel demand model)
64
65
How Scoring Works
10090
8070 60
Everything is Relative
65
66
Everything is Relative
Project Measure ScoreA 250 50B 300 60C 75 15D 15 3E 500 100F 150 30
Highest Value Dictates Scores
Project Measure ScoreA 200 40B 300 60C 75 15D 15 3E 500 100F 150 30
Project Measure ScoreA 250 333B 300 40C 75 10D 15 2E 750 100F 150 20
Change here only affects one score
Change here affects all
scores
The best project for that measure dictates the score for all other projects
66
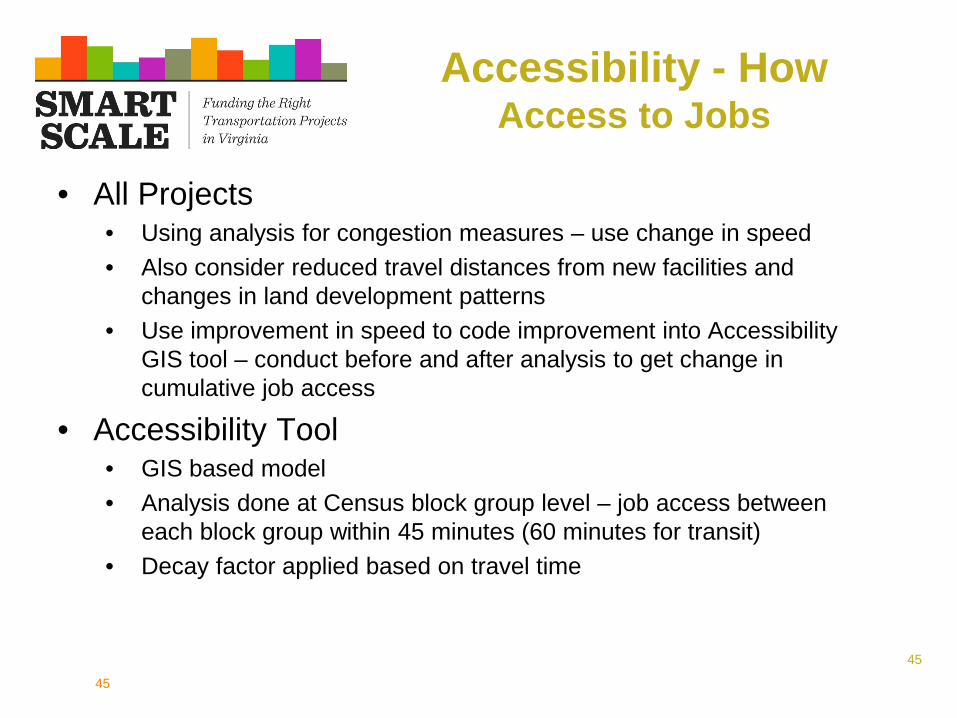
46
bull Accessibility Tool
1 2 3 4 5
6 7 8 9 10
11 12 13 14 15
Tool analyzes existing accessibility to jobs
No-
Build
Accessibility - HowAccess to Jobs
46
47
Accessibility - HowAccess to Jobs
bull Accessibility Tool
1 2 3 4 5
6 7 8 9 10
11 12 13 14 15
Tool moves to next block assessing existing accessibility
No-
Build
47
48
Accessibility - HowAccess to Jobs
bull Accessibility Tool
1 2 3 4 5
6 7 8 9 10
11 12 13 14 15
Process is repeated for all blocks to establish existing accessibility to jobs
No-
Build
48
49
Accessibility - HowAccess to Jobs
bull Accessibility Tool
1 2 3 4 5
6 7 8 9 10
11 12 13 14 15
Tool then analyzes change in access to jobs based on proposed improvement
Build
49
50
Accessibility - HowAccess to Jobs
bull Accessibility Tool
1 2 3 4 5
6 7 8 9 10
11 12 13 14 15
Tool moves to next block calculating change in job access
Build
50
51
Accessibility - HowAccess to Jobs
bull Accessibility Tool
1 2 3 4 5
6 7 8 9 10
11 12 13 14 15
Process is repeated for all blocks ndash increase in access for each block is summed and used to score projects
Build
51
52
Disadvantaged Access to Jobs
bull Similar process in previous slides used for disadvantaged access to jobs
bull Main difference is the utilization of disadvantaged population data in the calculation
bull Disadvantaged populationbull Low income elderly minority and Limited English Proficiency
population percentage by Census Block Group
bull Compared block group and identified block groups in the 75th
percentile of the region ndash regions defined as PDCMPONVTA
52
53
Accessibility - HowAccess to Travel Options
bull Projects receive points based on features than enhance multimodal access (Max 5 points)bull Transitbull Park and Ridebull Bikebull Pedestrianbull HOVHOTbull Real time traveler info or wayfinding
bull Scaled by the number of anticipated Non-SOV usersbull Transit Users + Bike Users + Pedestrians +
HOVPark and Ride
53
54
Measuring ENVIRONMENTAL QUALITY
ndash 50 of score ndash Potential of project to reduce criteria air pollutant and greenhouse gas emissions
ndash 50 of Score ndash Potential impacts to natural and cultural resources
54
55
Environment ndash HowAir Quality and Energy
bull Air QualityEnergybull Points awarded based on
Providing bicycle or pedestrian facilities Improvements for transit Addressing freight bottlenecks New or expanded Park and Ride lot Provisions for hybridelectric vehicles or
energy efficient infrastructurebull Points scaled based on number of non-
SOV users and truck volume
55
56
Environment ndash HowNaturalCultural Resource Impact
Sum the total acreage of land (within frac14 mile of project) in four categories
bull Conservation Landbull SpeciesHabitatbull Cultural Resourcesbull Wetlands
(Data sources VOF VDCR VDOF VDGIF NPS VDHR USFWS)
Project Conservation SpeciesHabitat Cultural Resources
Wetlands Total Acres
A 100 25 25 150 300
Example
56
57
Environment ndash HowNaturalCultural Resource Impact
Scaling Impact and Assigning PointsThe type of environmental document required for each project
will be used to assess and scale the potential natural resource impacts
bull Environmental Impact Statement ndash 50 of acreage will be used for scoring
bull Environmental Assessment ndash 30 of acreage will be used for scoring
bull Categorical Exclusion ndash 10 of acreage will be used for scoring
bull Points based on the amount of potentially impacted area divided by the total buffer area (Lowest Impact = 100 points)
57
58
Environment ndash HowNaturalCultural Resource Impact
Project Conservation SpeciesHabitat
Cultural Resources Wetlands Total
AcresEnviro
DocScaled Acres
A 100 25 25 150 300 EA 100
B 100 25 25 150 300 EIS 150
C 20 0 0 5 25 CE 25
This value gets divided by the total acres within the frac14 mile project buffer
58
59
Measuring ECONOMIC DEVELOPMENT
ndash 60 of score ndash Assessment of progress made towards new economic development (new and expansion of existing)
ndash 20 of score - Rate projects based on the extent to which the project is deemed to enhance access to critical intermodal locations interregional freight movement andor freight intensive industries
ndash 20 of score ndash Projectrsquos impact to travel time reliability
59
60
Economic Development ndash HowDevelopment Supported
bull For each project development sites are identified that the project supports
bull Proposed transportation improvement is evaluated onbull Consistency with Local Comp PlanLocal Economic Development
Strategy ndash up to 1 pointbull Consistency with Regional Economic Development Strategy ndash up to
1 pointbull Each development site is evaluated on
bull Consistency with local comp planzoning ndash up to 1 pointbull Development status ndash up to 1 pointbull Site utilities ndash up to 1 point
bull Max 5 points per site ndash used to weight square footage
60
61
bull Adjusting Weighted Square Footagendash Two Adjustments
Distance from project in miles (except sites less than 1 mile) Type of access provided
bull Formula ndash (Points) x (Square Footage) (Distance) x (Access Adjustment)
Project provides a new direct (physically to the site) primary access to the site that does not exist today 100
Project improves existing access (or relocates existing access) to the site directly (Site must be physically adjacent to the project)
100
Project enhances economic development by improving congestion mobility access or operations in the vicinity of the site but the site is not physically adjacent to the project
50
Development NameTotal Points Square Footage Distance Site Access Access
AdjustmentAdjusted
Square Footage
Development A 5 250000 2Project enhances economic development by improving congestion mobility access or operations in the vicinity of the site but the site is not physically adjacent to the project
50 312500
Development B 5 250000 02Project improves existing access (or relocates existing access) to the site directly (Site must be physically adjacent to the project)
100 1250000
Economic Development ndash HowDevelopment Supported
61
62
Economic Development ndash HowIntermodal Access
bull Project can get up to 6 pointsbull Improve access to distribution centers or intermodalmanufacturing facilities
Within 1 mile ndash 2 points 1 to 3 miles ndash 1 point
bull Improve STAA Truck Route Improvement to STAA route - 2 points Improve access to STAA route ndash 1 point
bull Improve access or reduce congestion around portairports Within 1 mile - 2 points 1-3 miles ndash 1 point
bull Point are scaled by freight tonnage along corridor ndash IHS Transearch data was used to calculate daily tonnage on the project
Improve Access to distro intermodal and manufacturing
Improve STAA truck route
Improve access reduce congestion portsairports
Tonnage (1000s) per day
Measure Scaled by tonnage
Project A 200 200 000 16307 65228
Project B 100 200 000 20815 62445
Project C 200 100 000 477 1431
62
63
Measuring LAND USE
ndash 100 of score ndash Degree to which project will support transportation efficient land use patterns and local policies
bull Points awarded based onbull Promoting walkable bicycle friendly mixed use developmentbull Supporting in-fill developmentbull Having an adopted corridoraccess management plan that
exceeds VDOT standardsbull Points scaled by projected 2025 population and employment
density (from MPO approved travel demand model)
63
64
Land Use ndash HowLocalRegional Land Use Policies
bull LocalRegional Land Use Policiesndash Points awarded based on
Promoting walkable bicycle friendly mixed use development
Supporting in-fill development Having an adopted corridoraccess management plan that
exceeds VDOT standards
ndash Points scaled by projected population and employment density (from MPO approved travel demand model)
64
65
How Scoring Works
10090
8070 60
Everything is Relative
65
66
Everything is Relative
Project Measure ScoreA 250 50B 300 60C 75 15D 15 3E 500 100F 150 30
Highest Value Dictates Scores
Project Measure ScoreA 200 40B 300 60C 75 15D 15 3E 500 100F 150 30
Project Measure ScoreA 250 333B 300 40C 75 10D 15 2E 750 100F 150 20
Change here only affects one score
Change here affects all
scores
The best project for that measure dictates the score for all other projects
66
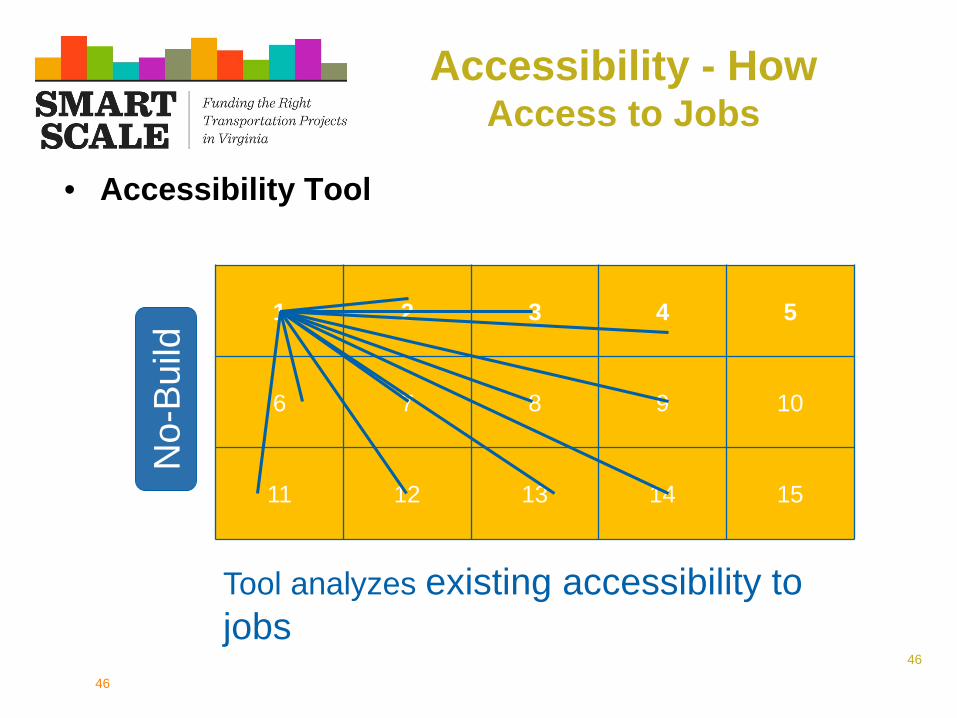
47
Accessibility - HowAccess to Jobs
bull Accessibility Tool
1 2 3 4 5
6 7 8 9 10
11 12 13 14 15
Tool moves to next block assessing existing accessibility
No-
Build
47
48
Accessibility - HowAccess to Jobs
bull Accessibility Tool
1 2 3 4 5
6 7 8 9 10
11 12 13 14 15
Process is repeated for all blocks to establish existing accessibility to jobs
No-
Build
48
49
Accessibility - HowAccess to Jobs
bull Accessibility Tool
1 2 3 4 5
6 7 8 9 10
11 12 13 14 15
Tool then analyzes change in access to jobs based on proposed improvement
Build
49
50
Accessibility - HowAccess to Jobs
bull Accessibility Tool
1 2 3 4 5
6 7 8 9 10
11 12 13 14 15
Tool moves to next block calculating change in job access
Build
50
51
Accessibility - HowAccess to Jobs
bull Accessibility Tool
1 2 3 4 5
6 7 8 9 10
11 12 13 14 15
Process is repeated for all blocks ndash increase in access for each block is summed and used to score projects
Build
51
52
Disadvantaged Access to Jobs
bull Similar process in previous slides used for disadvantaged access to jobs
bull Main difference is the utilization of disadvantaged population data in the calculation
bull Disadvantaged populationbull Low income elderly minority and Limited English Proficiency
population percentage by Census Block Group
bull Compared block group and identified block groups in the 75th
percentile of the region ndash regions defined as PDCMPONVTA
52
53
Accessibility - HowAccess to Travel Options
bull Projects receive points based on features than enhance multimodal access (Max 5 points)bull Transitbull Park and Ridebull Bikebull Pedestrianbull HOVHOTbull Real time traveler info or wayfinding
bull Scaled by the number of anticipated Non-SOV usersbull Transit Users + Bike Users + Pedestrians +
HOVPark and Ride
53
54
Measuring ENVIRONMENTAL QUALITY
ndash 50 of score ndash Potential of project to reduce criteria air pollutant and greenhouse gas emissions
ndash 50 of Score ndash Potential impacts to natural and cultural resources
54
55
Environment ndash HowAir Quality and Energy
bull Air QualityEnergybull Points awarded based on
Providing bicycle or pedestrian facilities Improvements for transit Addressing freight bottlenecks New or expanded Park and Ride lot Provisions for hybridelectric vehicles or
energy efficient infrastructurebull Points scaled based on number of non-
SOV users and truck volume
55
56
Environment ndash HowNaturalCultural Resource Impact
Sum the total acreage of land (within frac14 mile of project) in four categories
bull Conservation Landbull SpeciesHabitatbull Cultural Resourcesbull Wetlands
(Data sources VOF VDCR VDOF VDGIF NPS VDHR USFWS)
Project Conservation SpeciesHabitat Cultural Resources
Wetlands Total Acres
A 100 25 25 150 300
Example
56
57
Environment ndash HowNaturalCultural Resource Impact
Scaling Impact and Assigning PointsThe type of environmental document required for each project
will be used to assess and scale the potential natural resource impacts
bull Environmental Impact Statement ndash 50 of acreage will be used for scoring
bull Environmental Assessment ndash 30 of acreage will be used for scoring
bull Categorical Exclusion ndash 10 of acreage will be used for scoring
bull Points based on the amount of potentially impacted area divided by the total buffer area (Lowest Impact = 100 points)
57
58
Environment ndash HowNaturalCultural Resource Impact
Project Conservation SpeciesHabitat
Cultural Resources Wetlands Total
AcresEnviro
DocScaled Acres
A 100 25 25 150 300 EA 100
B 100 25 25 150 300 EIS 150
C 20 0 0 5 25 CE 25
This value gets divided by the total acres within the frac14 mile project buffer
58
59
Measuring ECONOMIC DEVELOPMENT
ndash 60 of score ndash Assessment of progress made towards new economic development (new and expansion of existing)
ndash 20 of score - Rate projects based on the extent to which the project is deemed to enhance access to critical intermodal locations interregional freight movement andor freight intensive industries
ndash 20 of score ndash Projectrsquos impact to travel time reliability
59
60
Economic Development ndash HowDevelopment Supported
bull For each project development sites are identified that the project supports
bull Proposed transportation improvement is evaluated onbull Consistency with Local Comp PlanLocal Economic Development
Strategy ndash up to 1 pointbull Consistency with Regional Economic Development Strategy ndash up to
1 pointbull Each development site is evaluated on
bull Consistency with local comp planzoning ndash up to 1 pointbull Development status ndash up to 1 pointbull Site utilities ndash up to 1 point
bull Max 5 points per site ndash used to weight square footage
60
61
bull Adjusting Weighted Square Footagendash Two Adjustments
Distance from project in miles (except sites less than 1 mile) Type of access provided
bull Formula ndash (Points) x (Square Footage) (Distance) x (Access Adjustment)
Project provides a new direct (physically to the site) primary access to the site that does not exist today 100
Project improves existing access (or relocates existing access) to the site directly (Site must be physically adjacent to the project)
100
Project enhances economic development by improving congestion mobility access or operations in the vicinity of the site but the site is not physically adjacent to the project
50
Development NameTotal Points Square Footage Distance Site Access Access
AdjustmentAdjusted
Square Footage
Development A 5 250000 2Project enhances economic development by improving congestion mobility access or operations in the vicinity of the site but the site is not physically adjacent to the project
50 312500
Development B 5 250000 02Project improves existing access (or relocates existing access) to the site directly (Site must be physically adjacent to the project)
100 1250000
Economic Development ndash HowDevelopment Supported
61
62
Economic Development ndash HowIntermodal Access
bull Project can get up to 6 pointsbull Improve access to distribution centers or intermodalmanufacturing facilities
Within 1 mile ndash 2 points 1 to 3 miles ndash 1 point
bull Improve STAA Truck Route Improvement to STAA route - 2 points Improve access to STAA route ndash 1 point
bull Improve access or reduce congestion around portairports Within 1 mile - 2 points 1-3 miles ndash 1 point
bull Point are scaled by freight tonnage along corridor ndash IHS Transearch data was used to calculate daily tonnage on the project
Improve Access to distro intermodal and manufacturing
Improve STAA truck route
Improve access reduce congestion portsairports
Tonnage (1000s) per day
Measure Scaled by tonnage
Project A 200 200 000 16307 65228
Project B 100 200 000 20815 62445
Project C 200 100 000 477 1431
62
63
Measuring LAND USE
ndash 100 of score ndash Degree to which project will support transportation efficient land use patterns and local policies
bull Points awarded based onbull Promoting walkable bicycle friendly mixed use developmentbull Supporting in-fill developmentbull Having an adopted corridoraccess management plan that
exceeds VDOT standardsbull Points scaled by projected 2025 population and employment
density (from MPO approved travel demand model)
63
64
Land Use ndash HowLocalRegional Land Use Policies
bull LocalRegional Land Use Policiesndash Points awarded based on
Promoting walkable bicycle friendly mixed use development
Supporting in-fill development Having an adopted corridoraccess management plan that
exceeds VDOT standards
ndash Points scaled by projected population and employment density (from MPO approved travel demand model)
64
65
How Scoring Works
10090
8070 60
Everything is Relative
65
66
Everything is Relative
Project Measure ScoreA 250 50B 300 60C 75 15D 15 3E 500 100F 150 30
Highest Value Dictates Scores
Project Measure ScoreA 200 40B 300 60C 75 15D 15 3E 500 100F 150 30
Project Measure ScoreA 250 333B 300 40C 75 10D 15 2E 750 100F 150 20
Change here only affects one score
Change here affects all
scores
The best project for that measure dictates the score for all other projects
66
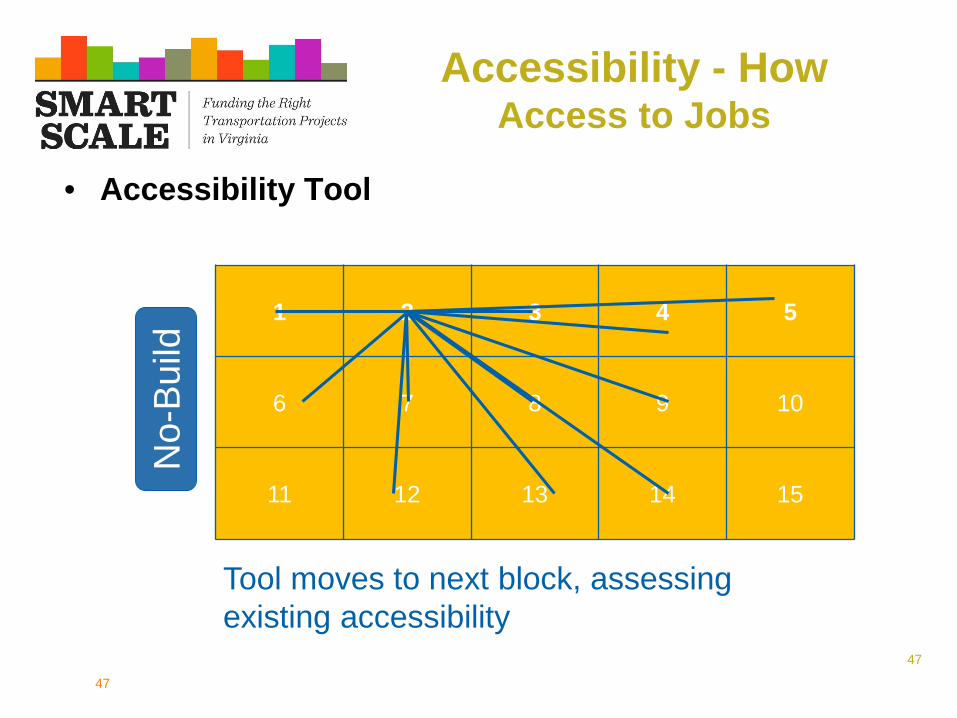
48
Accessibility - HowAccess to Jobs
bull Accessibility Tool
1 2 3 4 5
6 7 8 9 10
11 12 13 14 15
Process is repeated for all blocks to establish existing accessibility to jobs
No-
Build
48
49
Accessibility - HowAccess to Jobs
bull Accessibility Tool
1 2 3 4 5
6 7 8 9 10
11 12 13 14 15
Tool then analyzes change in access to jobs based on proposed improvement
Build
49
50
Accessibility - HowAccess to Jobs
bull Accessibility Tool
1 2 3 4 5
6 7 8 9 10
11 12 13 14 15
Tool moves to next block calculating change in job access
Build
50
51
Accessibility - HowAccess to Jobs
bull Accessibility Tool
1 2 3 4 5
6 7 8 9 10
11 12 13 14 15
Process is repeated for all blocks ndash increase in access for each block is summed and used to score projects
Build
51
52
Disadvantaged Access to Jobs
bull Similar process in previous slides used for disadvantaged access to jobs
bull Main difference is the utilization of disadvantaged population data in the calculation
bull Disadvantaged populationbull Low income elderly minority and Limited English Proficiency
population percentage by Census Block Group
bull Compared block group and identified block groups in the 75th
percentile of the region ndash regions defined as PDCMPONVTA
52
53
Accessibility - HowAccess to Travel Options
bull Projects receive points based on features than enhance multimodal access (Max 5 points)bull Transitbull Park and Ridebull Bikebull Pedestrianbull HOVHOTbull Real time traveler info or wayfinding
bull Scaled by the number of anticipated Non-SOV usersbull Transit Users + Bike Users + Pedestrians +
HOVPark and Ride
53
54
Measuring ENVIRONMENTAL QUALITY
ndash 50 of score ndash Potential of project to reduce criteria air pollutant and greenhouse gas emissions
ndash 50 of Score ndash Potential impacts to natural and cultural resources
54
55
Environment ndash HowAir Quality and Energy
bull Air QualityEnergybull Points awarded based on
Providing bicycle or pedestrian facilities Improvements for transit Addressing freight bottlenecks New or expanded Park and Ride lot Provisions for hybridelectric vehicles or
energy efficient infrastructurebull Points scaled based on number of non-
SOV users and truck volume
55
56
Environment ndash HowNaturalCultural Resource Impact
Sum the total acreage of land (within frac14 mile of project) in four categories
bull Conservation Landbull SpeciesHabitatbull Cultural Resourcesbull Wetlands
(Data sources VOF VDCR VDOF VDGIF NPS VDHR USFWS)
Project Conservation SpeciesHabitat Cultural Resources
Wetlands Total Acres
A 100 25 25 150 300
Example
56
57
Environment ndash HowNaturalCultural Resource Impact
Scaling Impact and Assigning PointsThe type of environmental document required for each project
will be used to assess and scale the potential natural resource impacts
bull Environmental Impact Statement ndash 50 of acreage will be used for scoring
bull Environmental Assessment ndash 30 of acreage will be used for scoring
bull Categorical Exclusion ndash 10 of acreage will be used for scoring
bull Points based on the amount of potentially impacted area divided by the total buffer area (Lowest Impact = 100 points)
57
58
Environment ndash HowNaturalCultural Resource Impact
Project Conservation SpeciesHabitat
Cultural Resources Wetlands Total
AcresEnviro
DocScaled Acres
A 100 25 25 150 300 EA 100
B 100 25 25 150 300 EIS 150
C 20 0 0 5 25 CE 25
This value gets divided by the total acres within the frac14 mile project buffer
58
59
Measuring ECONOMIC DEVELOPMENT
ndash 60 of score ndash Assessment of progress made towards new economic development (new and expansion of existing)
ndash 20 of score - Rate projects based on the extent to which the project is deemed to enhance access to critical intermodal locations interregional freight movement andor freight intensive industries
ndash 20 of score ndash Projectrsquos impact to travel time reliability
59
60
Economic Development ndash HowDevelopment Supported
bull For each project development sites are identified that the project supports
bull Proposed transportation improvement is evaluated onbull Consistency with Local Comp PlanLocal Economic Development
Strategy ndash up to 1 pointbull Consistency with Regional Economic Development Strategy ndash up to
1 pointbull Each development site is evaluated on
bull Consistency with local comp planzoning ndash up to 1 pointbull Development status ndash up to 1 pointbull Site utilities ndash up to 1 point
bull Max 5 points per site ndash used to weight square footage
60
61
bull Adjusting Weighted Square Footagendash Two Adjustments
Distance from project in miles (except sites less than 1 mile) Type of access provided
bull Formula ndash (Points) x (Square Footage) (Distance) x (Access Adjustment)
Project provides a new direct (physically to the site) primary access to the site that does not exist today 100
Project improves existing access (or relocates existing access) to the site directly (Site must be physically adjacent to the project)
100
Project enhances economic development by improving congestion mobility access or operations in the vicinity of the site but the site is not physically adjacent to the project
50
Development NameTotal Points Square Footage Distance Site Access Access
AdjustmentAdjusted
Square Footage
Development A 5 250000 2Project enhances economic development by improving congestion mobility access or operations in the vicinity of the site but the site is not physically adjacent to the project
50 312500
Development B 5 250000 02Project improves existing access (or relocates existing access) to the site directly (Site must be physically adjacent to the project)
100 1250000
Economic Development ndash HowDevelopment Supported
61
62
Economic Development ndash HowIntermodal Access
bull Project can get up to 6 pointsbull Improve access to distribution centers or intermodalmanufacturing facilities
Within 1 mile ndash 2 points 1 to 3 miles ndash 1 point
bull Improve STAA Truck Route Improvement to STAA route - 2 points Improve access to STAA route ndash 1 point
bull Improve access or reduce congestion around portairports Within 1 mile - 2 points 1-3 miles ndash 1 point
bull Point are scaled by freight tonnage along corridor ndash IHS Transearch data was used to calculate daily tonnage on the project
Improve Access to distro intermodal and manufacturing
Improve STAA truck route
Improve access reduce congestion portsairports
Tonnage (1000s) per day
Measure Scaled by tonnage
Project A 200 200 000 16307 65228
Project B 100 200 000 20815 62445
Project C 200 100 000 477 1431
62
63
Measuring LAND USE
ndash 100 of score ndash Degree to which project will support transportation efficient land use patterns and local policies
bull Points awarded based onbull Promoting walkable bicycle friendly mixed use developmentbull Supporting in-fill developmentbull Having an adopted corridoraccess management plan that
exceeds VDOT standardsbull Points scaled by projected 2025 population and employment
density (from MPO approved travel demand model)
63
64
Land Use ndash HowLocalRegional Land Use Policies
bull LocalRegional Land Use Policiesndash Points awarded based on
Promoting walkable bicycle friendly mixed use development
Supporting in-fill development Having an adopted corridoraccess management plan that
exceeds VDOT standards
ndash Points scaled by projected population and employment density (from MPO approved travel demand model)
64
65
How Scoring Works
10090
8070 60
Everything is Relative
65
66
Everything is Relative
Project Measure ScoreA 250 50B 300 60C 75 15D 15 3E 500 100F 150 30
Highest Value Dictates Scores
Project Measure ScoreA 200 40B 300 60C 75 15D 15 3E 500 100F 150 30
Project Measure ScoreA 250 333B 300 40C 75 10D 15 2E 750 100F 150 20
Change here only affects one score
Change here affects all
scores
The best project for that measure dictates the score for all other projects
66
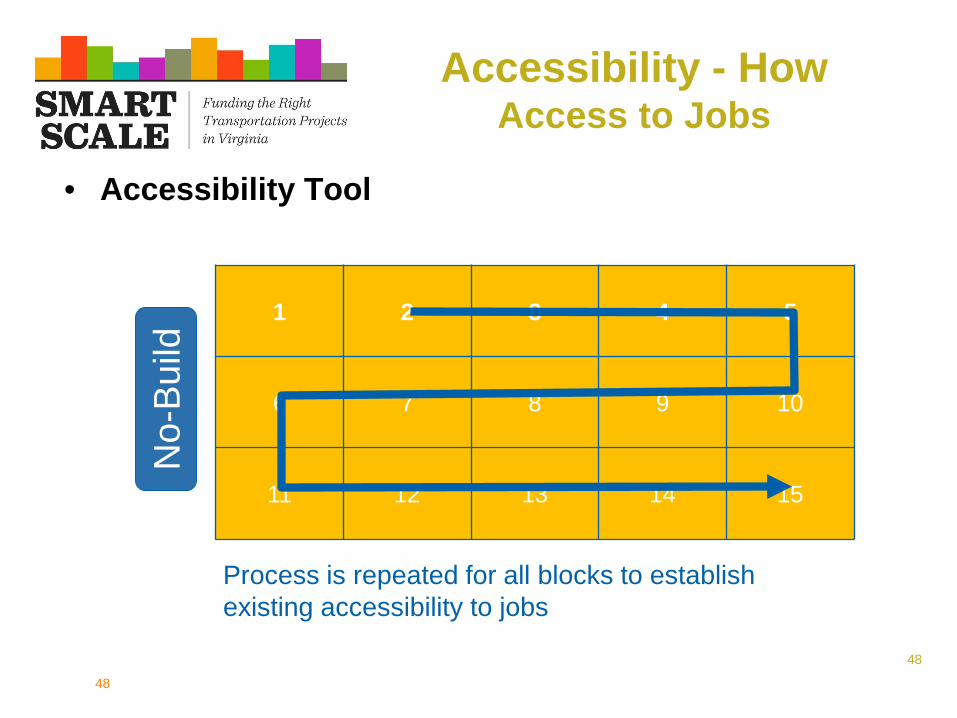
49
Accessibility - HowAccess to Jobs
bull Accessibility Tool
1 2 3 4 5
6 7 8 9 10
11 12 13 14 15
Tool then analyzes change in access to jobs based on proposed improvement
Build
49
50
Accessibility - HowAccess to Jobs
bull Accessibility Tool
1 2 3 4 5
6 7 8 9 10
11 12 13 14 15
Tool moves to next block calculating change in job access
Build
50
51
Accessibility - HowAccess to Jobs
bull Accessibility Tool
1 2 3 4 5
6 7 8 9 10
11 12 13 14 15
Process is repeated for all blocks ndash increase in access for each block is summed and used to score projects
Build
51
52
Disadvantaged Access to Jobs
bull Similar process in previous slides used for disadvantaged access to jobs
bull Main difference is the utilization of disadvantaged population data in the calculation
bull Disadvantaged populationbull Low income elderly minority and Limited English Proficiency
population percentage by Census Block Group
bull Compared block group and identified block groups in the 75th
percentile of the region ndash regions defined as PDCMPONVTA
52
53
Accessibility - HowAccess to Travel Options
bull Projects receive points based on features than enhance multimodal access (Max 5 points)bull Transitbull Park and Ridebull Bikebull Pedestrianbull HOVHOTbull Real time traveler info or wayfinding
bull Scaled by the number of anticipated Non-SOV usersbull Transit Users + Bike Users + Pedestrians +
HOVPark and Ride
53
54
Measuring ENVIRONMENTAL QUALITY
ndash 50 of score ndash Potential of project to reduce criteria air pollutant and greenhouse gas emissions
ndash 50 of Score ndash Potential impacts to natural and cultural resources
54
55
Environment ndash HowAir Quality and Energy
bull Air QualityEnergybull Points awarded based on
Providing bicycle or pedestrian facilities Improvements for transit Addressing freight bottlenecks New or expanded Park and Ride lot Provisions for hybridelectric vehicles or
energy efficient infrastructurebull Points scaled based on number of non-
SOV users and truck volume
55
56
Environment ndash HowNaturalCultural Resource Impact
Sum the total acreage of land (within frac14 mile of project) in four categories
bull Conservation Landbull SpeciesHabitatbull Cultural Resourcesbull Wetlands
(Data sources VOF VDCR VDOF VDGIF NPS VDHR USFWS)
Project Conservation SpeciesHabitat Cultural Resources
Wetlands Total Acres
A 100 25 25 150 300
Example
56
57
Environment ndash HowNaturalCultural Resource Impact
Scaling Impact and Assigning PointsThe type of environmental document required for each project
will be used to assess and scale the potential natural resource impacts
bull Environmental Impact Statement ndash 50 of acreage will be used for scoring
bull Environmental Assessment ndash 30 of acreage will be used for scoring
bull Categorical Exclusion ndash 10 of acreage will be used for scoring
bull Points based on the amount of potentially impacted area divided by the total buffer area (Lowest Impact = 100 points)
57
58
Environment ndash HowNaturalCultural Resource Impact
Project Conservation SpeciesHabitat
Cultural Resources Wetlands Total
AcresEnviro
DocScaled Acres
A 100 25 25 150 300 EA 100
B 100 25 25 150 300 EIS 150
C 20 0 0 5 25 CE 25
This value gets divided by the total acres within the frac14 mile project buffer
58
59
Measuring ECONOMIC DEVELOPMENT
ndash 60 of score ndash Assessment of progress made towards new economic development (new and expansion of existing)
ndash 20 of score - Rate projects based on the extent to which the project is deemed to enhance access to critical intermodal locations interregional freight movement andor freight intensive industries
ndash 20 of score ndash Projectrsquos impact to travel time reliability
59
60
Economic Development ndash HowDevelopment Supported
bull For each project development sites are identified that the project supports
bull Proposed transportation improvement is evaluated onbull Consistency with Local Comp PlanLocal Economic Development
Strategy ndash up to 1 pointbull Consistency with Regional Economic Development Strategy ndash up to
1 pointbull Each development site is evaluated on
bull Consistency with local comp planzoning ndash up to 1 pointbull Development status ndash up to 1 pointbull Site utilities ndash up to 1 point
bull Max 5 points per site ndash used to weight square footage
60
61
bull Adjusting Weighted Square Footagendash Two Adjustments
Distance from project in miles (except sites less than 1 mile) Type of access provided
bull Formula ndash (Points) x (Square Footage) (Distance) x (Access Adjustment)
Project provides a new direct (physically to the site) primary access to the site that does not exist today 100
Project improves existing access (or relocates existing access) to the site directly (Site must be physically adjacent to the project)
100
Project enhances economic development by improving congestion mobility access or operations in the vicinity of the site but the site is not physically adjacent to the project
50
Development NameTotal Points Square Footage Distance Site Access Access
AdjustmentAdjusted
Square Footage
Development A 5 250000 2Project enhances economic development by improving congestion mobility access or operations in the vicinity of the site but the site is not physically adjacent to the project
50 312500
Development B 5 250000 02Project improves existing access (or relocates existing access) to the site directly (Site must be physically adjacent to the project)
100 1250000
Economic Development ndash HowDevelopment Supported
61
62
Economic Development ndash HowIntermodal Access
bull Project can get up to 6 pointsbull Improve access to distribution centers or intermodalmanufacturing facilities
Within 1 mile ndash 2 points 1 to 3 miles ndash 1 point
bull Improve STAA Truck Route Improvement to STAA route - 2 points Improve access to STAA route ndash 1 point
bull Improve access or reduce congestion around portairports Within 1 mile - 2 points 1-3 miles ndash 1 point
bull Point are scaled by freight tonnage along corridor ndash IHS Transearch data was used to calculate daily tonnage on the project
Improve Access to distro intermodal and manufacturing
Improve STAA truck route
Improve access reduce congestion portsairports
Tonnage (1000s) per day
Measure Scaled by tonnage
Project A 200 200 000 16307 65228
Project B 100 200 000 20815 62445
Project C 200 100 000 477 1431
62
63
Measuring LAND USE
ndash 100 of score ndash Degree to which project will support transportation efficient land use patterns and local policies
bull Points awarded based onbull Promoting walkable bicycle friendly mixed use developmentbull Supporting in-fill developmentbull Having an adopted corridoraccess management plan that
exceeds VDOT standardsbull Points scaled by projected 2025 population and employment
density (from MPO approved travel demand model)
63
64
Land Use ndash HowLocalRegional Land Use Policies
bull LocalRegional Land Use Policiesndash Points awarded based on
Promoting walkable bicycle friendly mixed use development
Supporting in-fill development Having an adopted corridoraccess management plan that
exceeds VDOT standards
ndash Points scaled by projected population and employment density (from MPO approved travel demand model)
64
65
How Scoring Works
10090
8070 60
Everything is Relative
65
66
Everything is Relative
Project Measure ScoreA 250 50B 300 60C 75 15D 15 3E 500 100F 150 30
Highest Value Dictates Scores
Project Measure ScoreA 200 40B 300 60C 75 15D 15 3E 500 100F 150 30
Project Measure ScoreA 250 333B 300 40C 75 10D 15 2E 750 100F 150 20
Change here only affects one score
Change here affects all
scores
The best project for that measure dictates the score for all other projects
66
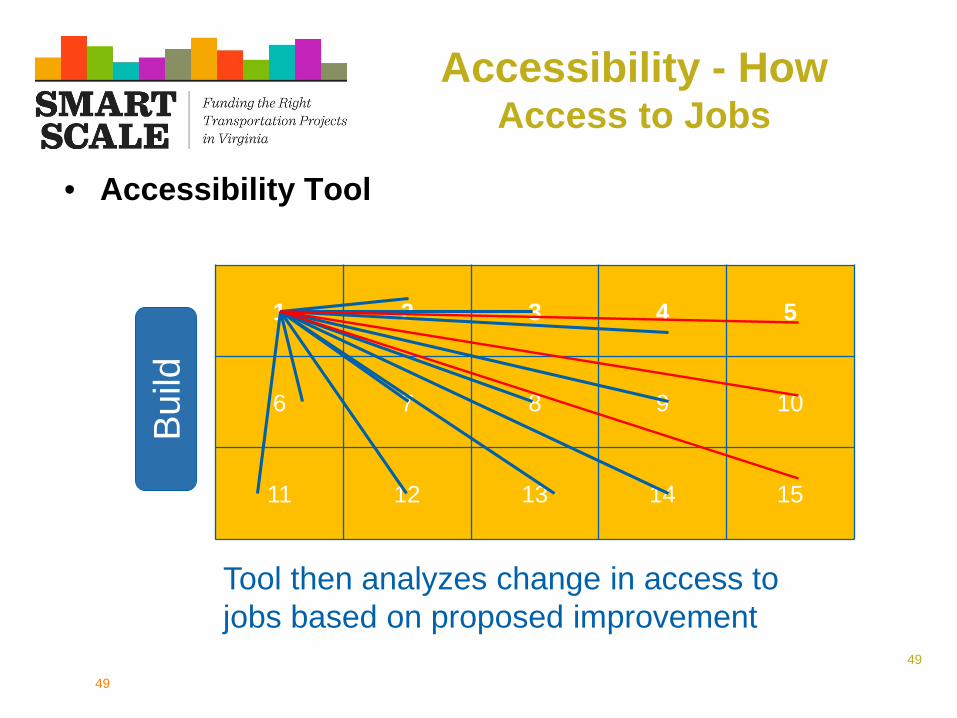
50
Accessibility - HowAccess to Jobs
bull Accessibility Tool
1 2 3 4 5
6 7 8 9 10
11 12 13 14 15
Tool moves to next block calculating change in job access
Build
50
51
Accessibility - HowAccess to Jobs
bull Accessibility Tool
1 2 3 4 5
6 7 8 9 10
11 12 13 14 15
Process is repeated for all blocks ndash increase in access for each block is summed and used to score projects
Build
51
52
Disadvantaged Access to Jobs
bull Similar process in previous slides used for disadvantaged access to jobs
bull Main difference is the utilization of disadvantaged population data in the calculation
bull Disadvantaged populationbull Low income elderly minority and Limited English Proficiency
population percentage by Census Block Group
bull Compared block group and identified block groups in the 75th
percentile of the region ndash regions defined as PDCMPONVTA
52
53
Accessibility - HowAccess to Travel Options
bull Projects receive points based on features than enhance multimodal access (Max 5 points)bull Transitbull Park and Ridebull Bikebull Pedestrianbull HOVHOTbull Real time traveler info or wayfinding
bull Scaled by the number of anticipated Non-SOV usersbull Transit Users + Bike Users + Pedestrians +
HOVPark and Ride
53
54
Measuring ENVIRONMENTAL QUALITY
ndash 50 of score ndash Potential of project to reduce criteria air pollutant and greenhouse gas emissions
ndash 50 of Score ndash Potential impacts to natural and cultural resources
54
55
Environment ndash HowAir Quality and Energy
bull Air QualityEnergybull Points awarded based on
Providing bicycle or pedestrian facilities Improvements for transit Addressing freight bottlenecks New or expanded Park and Ride lot Provisions for hybridelectric vehicles or
energy efficient infrastructurebull Points scaled based on number of non-
SOV users and truck volume
55
56
Environment ndash HowNaturalCultural Resource Impact
Sum the total acreage of land (within frac14 mile of project) in four categories
bull Conservation Landbull SpeciesHabitatbull Cultural Resourcesbull Wetlands
(Data sources VOF VDCR VDOF VDGIF NPS VDHR USFWS)
Project Conservation SpeciesHabitat Cultural Resources
Wetlands Total Acres
A 100 25 25 150 300
Example
56
57
Environment ndash HowNaturalCultural Resource Impact
Scaling Impact and Assigning PointsThe type of environmental document required for each project
will be used to assess and scale the potential natural resource impacts
bull Environmental Impact Statement ndash 50 of acreage will be used for scoring
bull Environmental Assessment ndash 30 of acreage will be used for scoring
bull Categorical Exclusion ndash 10 of acreage will be used for scoring
bull Points based on the amount of potentially impacted area divided by the total buffer area (Lowest Impact = 100 points)
57
58
Environment ndash HowNaturalCultural Resource Impact
Project Conservation SpeciesHabitat
Cultural Resources Wetlands Total
AcresEnviro
DocScaled Acres
A 100 25 25 150 300 EA 100
B 100 25 25 150 300 EIS 150
C 20 0 0 5 25 CE 25
This value gets divided by the total acres within the frac14 mile project buffer
58
59
Measuring ECONOMIC DEVELOPMENT
ndash 60 of score ndash Assessment of progress made towards new economic development (new and expansion of existing)
ndash 20 of score - Rate projects based on the extent to which the project is deemed to enhance access to critical intermodal locations interregional freight movement andor freight intensive industries
ndash 20 of score ndash Projectrsquos impact to travel time reliability
59
60
Economic Development ndash HowDevelopment Supported
bull For each project development sites are identified that the project supports
bull Proposed transportation improvement is evaluated onbull Consistency with Local Comp PlanLocal Economic Development
Strategy ndash up to 1 pointbull Consistency with Regional Economic Development Strategy ndash up to
1 pointbull Each development site is evaluated on
bull Consistency with local comp planzoning ndash up to 1 pointbull Development status ndash up to 1 pointbull Site utilities ndash up to 1 point
bull Max 5 points per site ndash used to weight square footage
60
61
bull Adjusting Weighted Square Footagendash Two Adjustments
Distance from project in miles (except sites less than 1 mile) Type of access provided
bull Formula ndash (Points) x (Square Footage) (Distance) x (Access Adjustment)
Project provides a new direct (physically to the site) primary access to the site that does not exist today 100
Project improves existing access (or relocates existing access) to the site directly (Site must be physically adjacent to the project)
100
Project enhances economic development by improving congestion mobility access or operations in the vicinity of the site but the site is not physically adjacent to the project
50
Development NameTotal Points Square Footage Distance Site Access Access
AdjustmentAdjusted
Square Footage
Development A 5 250000 2Project enhances economic development by improving congestion mobility access or operations in the vicinity of the site but the site is not physically adjacent to the project
50 312500
Development B 5 250000 02Project improves existing access (or relocates existing access) to the site directly (Site must be physically adjacent to the project)
100 1250000
Economic Development ndash HowDevelopment Supported
61
62
Economic Development ndash HowIntermodal Access
bull Project can get up to 6 pointsbull Improve access to distribution centers or intermodalmanufacturing facilities
Within 1 mile ndash 2 points 1 to 3 miles ndash 1 point
bull Improve STAA Truck Route Improvement to STAA route - 2 points Improve access to STAA route ndash 1 point
bull Improve access or reduce congestion around portairports Within 1 mile - 2 points 1-3 miles ndash 1 point
bull Point are scaled by freight tonnage along corridor ndash IHS Transearch data was used to calculate daily tonnage on the project
Improve Access to distro intermodal and manufacturing
Improve STAA truck route
Improve access reduce congestion portsairports
Tonnage (1000s) per day
Measure Scaled by tonnage
Project A 200 200 000 16307 65228
Project B 100 200 000 20815 62445
Project C 200 100 000 477 1431
62
63
Measuring LAND USE
ndash 100 of score ndash Degree to which project will support transportation efficient land use patterns and local policies
bull Points awarded based onbull Promoting walkable bicycle friendly mixed use developmentbull Supporting in-fill developmentbull Having an adopted corridoraccess management plan that
exceeds VDOT standardsbull Points scaled by projected 2025 population and employment
density (from MPO approved travel demand model)
63
64
Land Use ndash HowLocalRegional Land Use Policies
bull LocalRegional Land Use Policiesndash Points awarded based on
Promoting walkable bicycle friendly mixed use development
Supporting in-fill development Having an adopted corridoraccess management plan that
exceeds VDOT standards
ndash Points scaled by projected population and employment density (from MPO approved travel demand model)
64
65
How Scoring Works
10090
8070 60
Everything is Relative
65
66
Everything is Relative
Project Measure ScoreA 250 50B 300 60C 75 15D 15 3E 500 100F 150 30
Highest Value Dictates Scores
Project Measure ScoreA 200 40B 300 60C 75 15D 15 3E 500 100F 150 30
Project Measure ScoreA 250 333B 300 40C 75 10D 15 2E 750 100F 150 20
Change here only affects one score
Change here affects all
scores
The best project for that measure dictates the score for all other projects
66
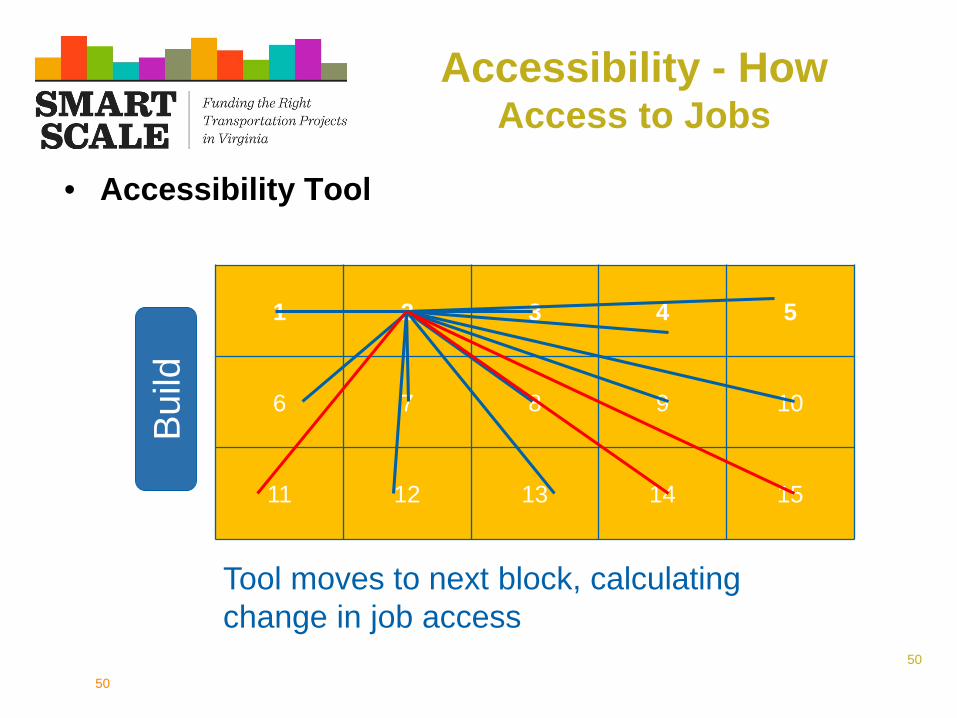
51
Accessibility - HowAccess to Jobs
bull Accessibility Tool
1 2 3 4 5
6 7 8 9 10
11 12 13 14 15
Process is repeated for all blocks ndash increase in access for each block is summed and used to score projects
Build
51
52
Disadvantaged Access to Jobs
bull Similar process in previous slides used for disadvantaged access to jobs
bull Main difference is the utilization of disadvantaged population data in the calculation
bull Disadvantaged populationbull Low income elderly minority and Limited English Proficiency
population percentage by Census Block Group
bull Compared block group and identified block groups in the 75th
percentile of the region ndash regions defined as PDCMPONVTA
52
53
Accessibility - HowAccess to Travel Options
bull Projects receive points based on features than enhance multimodal access (Max 5 points)bull Transitbull Park and Ridebull Bikebull Pedestrianbull HOVHOTbull Real time traveler info or wayfinding
bull Scaled by the number of anticipated Non-SOV usersbull Transit Users + Bike Users + Pedestrians +
HOVPark and Ride
53
54
Measuring ENVIRONMENTAL QUALITY
ndash 50 of score ndash Potential of project to reduce criteria air pollutant and greenhouse gas emissions
ndash 50 of Score ndash Potential impacts to natural and cultural resources
54
55
Environment ndash HowAir Quality and Energy
bull Air QualityEnergybull Points awarded based on
Providing bicycle or pedestrian facilities Improvements for transit Addressing freight bottlenecks New or expanded Park and Ride lot Provisions for hybridelectric vehicles or
energy efficient infrastructurebull Points scaled based on number of non-
SOV users and truck volume
55
56
Environment ndash HowNaturalCultural Resource Impact
Sum the total acreage of land (within frac14 mile of project) in four categories
bull Conservation Landbull SpeciesHabitatbull Cultural Resourcesbull Wetlands
(Data sources VOF VDCR VDOF VDGIF NPS VDHR USFWS)
Project Conservation SpeciesHabitat Cultural Resources
Wetlands Total Acres
A 100 25 25 150 300
Example
56
57
Environment ndash HowNaturalCultural Resource Impact
Scaling Impact and Assigning PointsThe type of environmental document required for each project
will be used to assess and scale the potential natural resource impacts
bull Environmental Impact Statement ndash 50 of acreage will be used for scoring
bull Environmental Assessment ndash 30 of acreage will be used for scoring
bull Categorical Exclusion ndash 10 of acreage will be used for scoring
bull Points based on the amount of potentially impacted area divided by the total buffer area (Lowest Impact = 100 points)
57
58
Environment ndash HowNaturalCultural Resource Impact
Project Conservation SpeciesHabitat
Cultural Resources Wetlands Total
AcresEnviro
DocScaled Acres
A 100 25 25 150 300 EA 100
B 100 25 25 150 300 EIS 150
C 20 0 0 5 25 CE 25
This value gets divided by the total acres within the frac14 mile project buffer
58
59
Measuring ECONOMIC DEVELOPMENT
ndash 60 of score ndash Assessment of progress made towards new economic development (new and expansion of existing)
ndash 20 of score - Rate projects based on the extent to which the project is deemed to enhance access to critical intermodal locations interregional freight movement andor freight intensive industries
ndash 20 of score ndash Projectrsquos impact to travel time reliability
59
60
Economic Development ndash HowDevelopment Supported
bull For each project development sites are identified that the project supports
bull Proposed transportation improvement is evaluated onbull Consistency with Local Comp PlanLocal Economic Development
Strategy ndash up to 1 pointbull Consistency with Regional Economic Development Strategy ndash up to
1 pointbull Each development site is evaluated on
bull Consistency with local comp planzoning ndash up to 1 pointbull Development status ndash up to 1 pointbull Site utilities ndash up to 1 point
bull Max 5 points per site ndash used to weight square footage
60
61
bull Adjusting Weighted Square Footagendash Two Adjustments
Distance from project in miles (except sites less than 1 mile) Type of access provided
bull Formula ndash (Points) x (Square Footage) (Distance) x (Access Adjustment)
Project provides a new direct (physically to the site) primary access to the site that does not exist today 100
Project improves existing access (or relocates existing access) to the site directly (Site must be physically adjacent to the project)
100
Project enhances economic development by improving congestion mobility access or operations in the vicinity of the site but the site is not physically adjacent to the project
50
Development NameTotal Points Square Footage Distance Site Access Access
AdjustmentAdjusted
Square Footage
Development A 5 250000 2Project enhances economic development by improving congestion mobility access or operations in the vicinity of the site but the site is not physically adjacent to the project
50 312500
Development B 5 250000 02Project improves existing access (or relocates existing access) to the site directly (Site must be physically adjacent to the project)
100 1250000
Economic Development ndash HowDevelopment Supported
61
62
Economic Development ndash HowIntermodal Access
bull Project can get up to 6 pointsbull Improve access to distribution centers or intermodalmanufacturing facilities
Within 1 mile ndash 2 points 1 to 3 miles ndash 1 point
bull Improve STAA Truck Route Improvement to STAA route - 2 points Improve access to STAA route ndash 1 point
bull Improve access or reduce congestion around portairports Within 1 mile - 2 points 1-3 miles ndash 1 point
bull Point are scaled by freight tonnage along corridor ndash IHS Transearch data was used to calculate daily tonnage on the project
Improve Access to distro intermodal and manufacturing
Improve STAA truck route
Improve access reduce congestion portsairports
Tonnage (1000s) per day
Measure Scaled by tonnage
Project A 200 200 000 16307 65228
Project B 100 200 000 20815 62445
Project C 200 100 000 477 1431
62
63
Measuring LAND USE
ndash 100 of score ndash Degree to which project will support transportation efficient land use patterns and local policies
bull Points awarded based onbull Promoting walkable bicycle friendly mixed use developmentbull Supporting in-fill developmentbull Having an adopted corridoraccess management plan that
exceeds VDOT standardsbull Points scaled by projected 2025 population and employment
density (from MPO approved travel demand model)
63
64
Land Use ndash HowLocalRegional Land Use Policies
bull LocalRegional Land Use Policiesndash Points awarded based on
Promoting walkable bicycle friendly mixed use development
Supporting in-fill development Having an adopted corridoraccess management plan that
exceeds VDOT standards
ndash Points scaled by projected population and employment density (from MPO approved travel demand model)
64
65
How Scoring Works
10090
8070 60
Everything is Relative
65
66
Everything is Relative
Project Measure ScoreA 250 50B 300 60C 75 15D 15 3E 500 100F 150 30
Highest Value Dictates Scores
Project Measure ScoreA 200 40B 300 60C 75 15D 15 3E 500 100F 150 30
Project Measure ScoreA 250 333B 300 40C 75 10D 15 2E 750 100F 150 20
Change here only affects one score
Change here affects all
scores
The best project for that measure dictates the score for all other projects
66
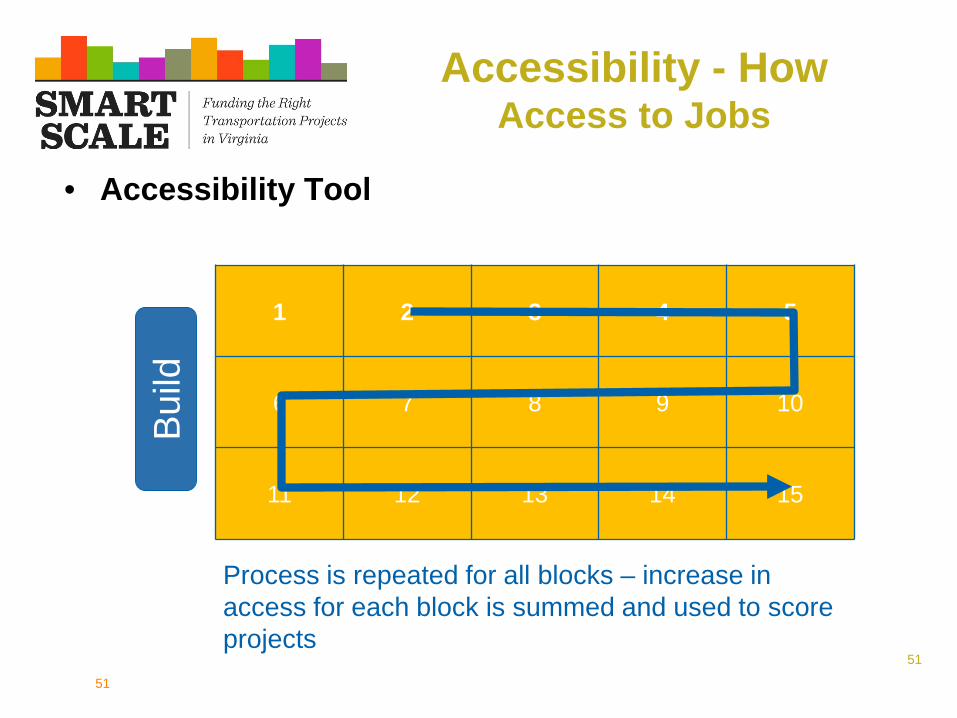
52
Disadvantaged Access to Jobs
bull Similar process in previous slides used for disadvantaged access to jobs
bull Main difference is the utilization of disadvantaged population data in the calculation
bull Disadvantaged populationbull Low income elderly minority and Limited English Proficiency
population percentage by Census Block Group
bull Compared block group and identified block groups in the 75th
percentile of the region ndash regions defined as PDCMPONVTA
52
53
Accessibility - HowAccess to Travel Options
bull Projects receive points based on features than enhance multimodal access (Max 5 points)bull Transitbull Park and Ridebull Bikebull Pedestrianbull HOVHOTbull Real time traveler info or wayfinding
bull Scaled by the number of anticipated Non-SOV usersbull Transit Users + Bike Users + Pedestrians +
HOVPark and Ride
53
54
Measuring ENVIRONMENTAL QUALITY
ndash 50 of score ndash Potential of project to reduce criteria air pollutant and greenhouse gas emissions
ndash 50 of Score ndash Potential impacts to natural and cultural resources
54
55
Environment ndash HowAir Quality and Energy
bull Air QualityEnergybull Points awarded based on
Providing bicycle or pedestrian facilities Improvements for transit Addressing freight bottlenecks New or expanded Park and Ride lot Provisions for hybridelectric vehicles or
energy efficient infrastructurebull Points scaled based on number of non-
SOV users and truck volume
55
56
Environment ndash HowNaturalCultural Resource Impact
Sum the total acreage of land (within frac14 mile of project) in four categories
bull Conservation Landbull SpeciesHabitatbull Cultural Resourcesbull Wetlands
(Data sources VOF VDCR VDOF VDGIF NPS VDHR USFWS)
Project Conservation SpeciesHabitat Cultural Resources
Wetlands Total Acres
A 100 25 25 150 300
Example
56
57
Environment ndash HowNaturalCultural Resource Impact
Scaling Impact and Assigning PointsThe type of environmental document required for each project
will be used to assess and scale the potential natural resource impacts
bull Environmental Impact Statement ndash 50 of acreage will be used for scoring
bull Environmental Assessment ndash 30 of acreage will be used for scoring
bull Categorical Exclusion ndash 10 of acreage will be used for scoring
bull Points based on the amount of potentially impacted area divided by the total buffer area (Lowest Impact = 100 points)
57
58
Environment ndash HowNaturalCultural Resource Impact
Project Conservation SpeciesHabitat
Cultural Resources Wetlands Total
AcresEnviro
DocScaled Acres
A 100 25 25 150 300 EA 100
B 100 25 25 150 300 EIS 150
C 20 0 0 5 25 CE 25
This value gets divided by the total acres within the frac14 mile project buffer
58
59
Measuring ECONOMIC DEVELOPMENT
ndash 60 of score ndash Assessment of progress made towards new economic development (new and expansion of existing)
ndash 20 of score - Rate projects based on the extent to which the project is deemed to enhance access to critical intermodal locations interregional freight movement andor freight intensive industries
ndash 20 of score ndash Projectrsquos impact to travel time reliability
59
60
Economic Development ndash HowDevelopment Supported
bull For each project development sites are identified that the project supports
bull Proposed transportation improvement is evaluated onbull Consistency with Local Comp PlanLocal Economic Development
Strategy ndash up to 1 pointbull Consistency with Regional Economic Development Strategy ndash up to
1 pointbull Each development site is evaluated on
bull Consistency with local comp planzoning ndash up to 1 pointbull Development status ndash up to 1 pointbull Site utilities ndash up to 1 point
bull Max 5 points per site ndash used to weight square footage
60
61
bull Adjusting Weighted Square Footagendash Two Adjustments
Distance from project in miles (except sites less than 1 mile) Type of access provided
bull Formula ndash (Points) x (Square Footage) (Distance) x (Access Adjustment)
Project provides a new direct (physically to the site) primary access to the site that does not exist today 100
Project improves existing access (or relocates existing access) to the site directly (Site must be physically adjacent to the project)
100
Project enhances economic development by improving congestion mobility access or operations in the vicinity of the site but the site is not physically adjacent to the project
50
Development NameTotal Points Square Footage Distance Site Access Access
AdjustmentAdjusted
Square Footage
Development A 5 250000 2Project enhances economic development by improving congestion mobility access or operations in the vicinity of the site but the site is not physically adjacent to the project
50 312500
Development B 5 250000 02Project improves existing access (or relocates existing access) to the site directly (Site must be physically adjacent to the project)
100 1250000
Economic Development ndash HowDevelopment Supported
61
62
Economic Development ndash HowIntermodal Access
bull Project can get up to 6 pointsbull Improve access to distribution centers or intermodalmanufacturing facilities
Within 1 mile ndash 2 points 1 to 3 miles ndash 1 point
bull Improve STAA Truck Route Improvement to STAA route - 2 points Improve access to STAA route ndash 1 point
bull Improve access or reduce congestion around portairports Within 1 mile - 2 points 1-3 miles ndash 1 point
bull Point are scaled by freight tonnage along corridor ndash IHS Transearch data was used to calculate daily tonnage on the project
Improve Access to distro intermodal and manufacturing
Improve STAA truck route
Improve access reduce congestion portsairports
Tonnage (1000s) per day
Measure Scaled by tonnage
Project A 200 200 000 16307 65228
Project B 100 200 000 20815 62445
Project C 200 100 000 477 1431
62
63
Measuring LAND USE
ndash 100 of score ndash Degree to which project will support transportation efficient land use patterns and local policies
bull Points awarded based onbull Promoting walkable bicycle friendly mixed use developmentbull Supporting in-fill developmentbull Having an adopted corridoraccess management plan that
exceeds VDOT standardsbull Points scaled by projected 2025 population and employment
density (from MPO approved travel demand model)
63
64
Land Use ndash HowLocalRegional Land Use Policies
bull LocalRegional Land Use Policiesndash Points awarded based on
Promoting walkable bicycle friendly mixed use development
Supporting in-fill development Having an adopted corridoraccess management plan that
exceeds VDOT standards
ndash Points scaled by projected population and employment density (from MPO approved travel demand model)
64
65
How Scoring Works
10090
8070 60
Everything is Relative
65
66
Everything is Relative
Project Measure ScoreA 250 50B 300 60C 75 15D 15 3E 500 100F 150 30
Highest Value Dictates Scores
Project Measure ScoreA 200 40B 300 60C 75 15D 15 3E 500 100F 150 30
Project Measure ScoreA 250 333B 300 40C 75 10D 15 2E 750 100F 150 20
Change here only affects one score
Change here affects all
scores
The best project for that measure dictates the score for all other projects
66
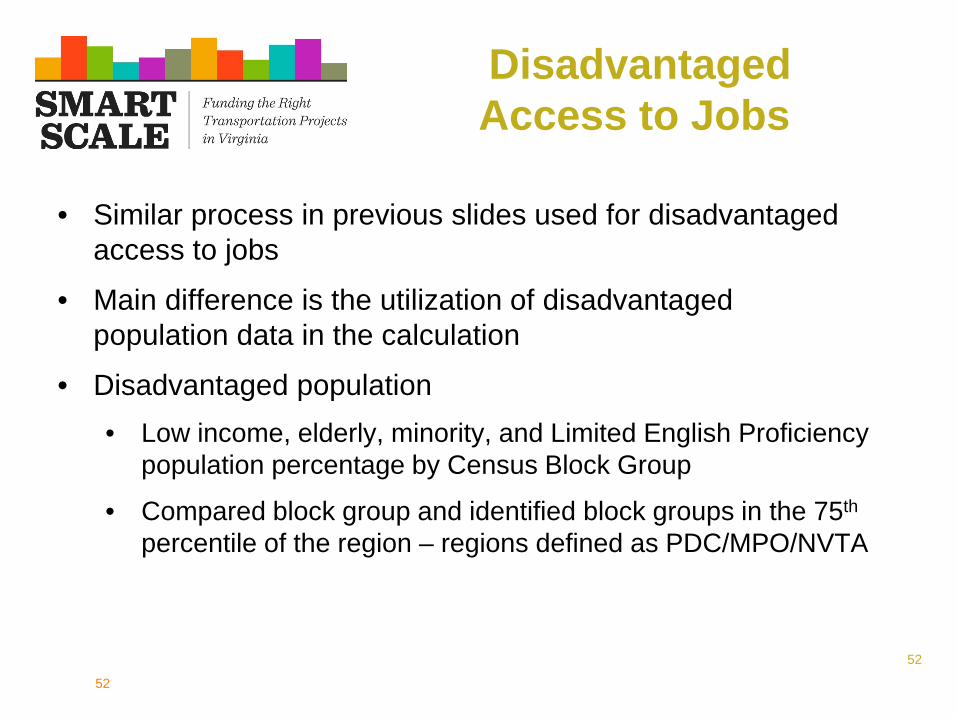
53
Accessibility - HowAccess to Travel Options
bull Projects receive points based on features than enhance multimodal access (Max 5 points)bull Transitbull Park and Ridebull Bikebull Pedestrianbull HOVHOTbull Real time traveler info or wayfinding
bull Scaled by the number of anticipated Non-SOV usersbull Transit Users + Bike Users + Pedestrians +
HOVPark and Ride
53
54
Measuring ENVIRONMENTAL QUALITY
ndash 50 of score ndash Potential of project to reduce criteria air pollutant and greenhouse gas emissions
ndash 50 of Score ndash Potential impacts to natural and cultural resources
54
55
Environment ndash HowAir Quality and Energy
bull Air QualityEnergybull Points awarded based on
Providing bicycle or pedestrian facilities Improvements for transit Addressing freight bottlenecks New or expanded Park and Ride lot Provisions for hybridelectric vehicles or
energy efficient infrastructurebull Points scaled based on number of non-
SOV users and truck volume
55
56
Environment ndash HowNaturalCultural Resource Impact
Sum the total acreage of land (within frac14 mile of project) in four categories
bull Conservation Landbull SpeciesHabitatbull Cultural Resourcesbull Wetlands
(Data sources VOF VDCR VDOF VDGIF NPS VDHR USFWS)
Project Conservation SpeciesHabitat Cultural Resources
Wetlands Total Acres
A 100 25 25 150 300
Example
56
57
Environment ndash HowNaturalCultural Resource Impact
Scaling Impact and Assigning PointsThe type of environmental document required for each project
will be used to assess and scale the potential natural resource impacts
bull Environmental Impact Statement ndash 50 of acreage will be used for scoring
bull Environmental Assessment ndash 30 of acreage will be used for scoring
bull Categorical Exclusion ndash 10 of acreage will be used for scoring
bull Points based on the amount of potentially impacted area divided by the total buffer area (Lowest Impact = 100 points)
57
58
Environment ndash HowNaturalCultural Resource Impact
Project Conservation SpeciesHabitat
Cultural Resources Wetlands Total
AcresEnviro
DocScaled Acres
A 100 25 25 150 300 EA 100
B 100 25 25 150 300 EIS 150
C 20 0 0 5 25 CE 25
This value gets divided by the total acres within the frac14 mile project buffer
58
59
Measuring ECONOMIC DEVELOPMENT
ndash 60 of score ndash Assessment of progress made towards new economic development (new and expansion of existing)
ndash 20 of score - Rate projects based on the extent to which the project is deemed to enhance access to critical intermodal locations interregional freight movement andor freight intensive industries
ndash 20 of score ndash Projectrsquos impact to travel time reliability
59
60
Economic Development ndash HowDevelopment Supported
bull For each project development sites are identified that the project supports
bull Proposed transportation improvement is evaluated onbull Consistency with Local Comp PlanLocal Economic Development
Strategy ndash up to 1 pointbull Consistency with Regional Economic Development Strategy ndash up to
1 pointbull Each development site is evaluated on
bull Consistency with local comp planzoning ndash up to 1 pointbull Development status ndash up to 1 pointbull Site utilities ndash up to 1 point
bull Max 5 points per site ndash used to weight square footage
60
61
bull Adjusting Weighted Square Footagendash Two Adjustments
Distance from project in miles (except sites less than 1 mile) Type of access provided
bull Formula ndash (Points) x (Square Footage) (Distance) x (Access Adjustment)
Project provides a new direct (physically to the site) primary access to the site that does not exist today 100
Project improves existing access (or relocates existing access) to the site directly (Site must be physically adjacent to the project)
100
Project enhances economic development by improving congestion mobility access or operations in the vicinity of the site but the site is not physically adjacent to the project
50
Development NameTotal Points Square Footage Distance Site Access Access
AdjustmentAdjusted
Square Footage
Development A 5 250000 2Project enhances economic development by improving congestion mobility access or operations in the vicinity of the site but the site is not physically adjacent to the project
50 312500
Development B 5 250000 02Project improves existing access (or relocates existing access) to the site directly (Site must be physically adjacent to the project)
100 1250000
Economic Development ndash HowDevelopment Supported
61
62
Economic Development ndash HowIntermodal Access
bull Project can get up to 6 pointsbull Improve access to distribution centers or intermodalmanufacturing facilities
Within 1 mile ndash 2 points 1 to 3 miles ndash 1 point
bull Improve STAA Truck Route Improvement to STAA route - 2 points Improve access to STAA route ndash 1 point
bull Improve access or reduce congestion around portairports Within 1 mile - 2 points 1-3 miles ndash 1 point
bull Point are scaled by freight tonnage along corridor ndash IHS Transearch data was used to calculate daily tonnage on the project
Improve Access to distro intermodal and manufacturing
Improve STAA truck route
Improve access reduce congestion portsairports
Tonnage (1000s) per day
Measure Scaled by tonnage
Project A 200 200 000 16307 65228
Project B 100 200 000 20815 62445
Project C 200 100 000 477 1431
62
63
Measuring LAND USE
ndash 100 of score ndash Degree to which project will support transportation efficient land use patterns and local policies
bull Points awarded based onbull Promoting walkable bicycle friendly mixed use developmentbull Supporting in-fill developmentbull Having an adopted corridoraccess management plan that
exceeds VDOT standardsbull Points scaled by projected 2025 population and employment
density (from MPO approved travel demand model)
63
64
Land Use ndash HowLocalRegional Land Use Policies
bull LocalRegional Land Use Policiesndash Points awarded based on
Promoting walkable bicycle friendly mixed use development
Supporting in-fill development Having an adopted corridoraccess management plan that
exceeds VDOT standards
ndash Points scaled by projected population and employment density (from MPO approved travel demand model)
64
65
How Scoring Works
10090
8070 60
Everything is Relative
65
66
Everything is Relative
Project Measure ScoreA 250 50B 300 60C 75 15D 15 3E 500 100F 150 30
Highest Value Dictates Scores
Project Measure ScoreA 200 40B 300 60C 75 15D 15 3E 500 100F 150 30
Project Measure ScoreA 250 333B 300 40C 75 10D 15 2E 750 100F 150 20
Change here only affects one score
Change here affects all
scores
The best project for that measure dictates the score for all other projects
66
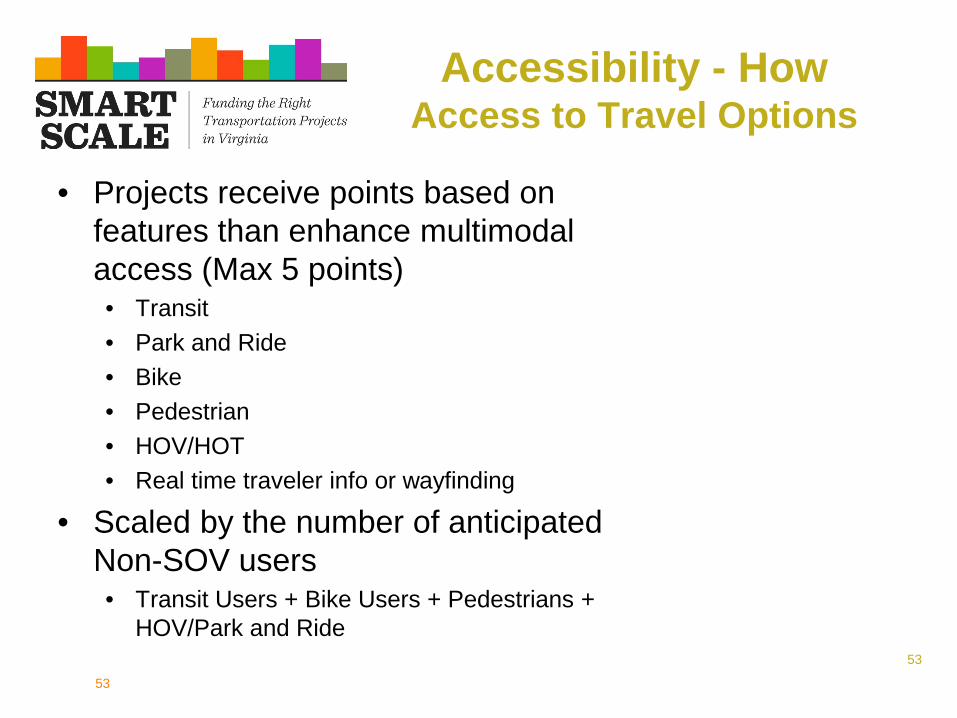
54
Measuring ENVIRONMENTAL QUALITY
ndash 50 of score ndash Potential of project to reduce criteria air pollutant and greenhouse gas emissions
ndash 50 of Score ndash Potential impacts to natural and cultural resources
54
55
Environment ndash HowAir Quality and Energy
bull Air QualityEnergybull Points awarded based on
Providing bicycle or pedestrian facilities Improvements for transit Addressing freight bottlenecks New or expanded Park and Ride lot Provisions for hybridelectric vehicles or
energy efficient infrastructurebull Points scaled based on number of non-
SOV users and truck volume
55
56
Environment ndash HowNaturalCultural Resource Impact
Sum the total acreage of land (within frac14 mile of project) in four categories
bull Conservation Landbull SpeciesHabitatbull Cultural Resourcesbull Wetlands
(Data sources VOF VDCR VDOF VDGIF NPS VDHR USFWS)
Project Conservation SpeciesHabitat Cultural Resources
Wetlands Total Acres
A 100 25 25 150 300
Example
56
57
Environment ndash HowNaturalCultural Resource Impact
Scaling Impact and Assigning PointsThe type of environmental document required for each project
will be used to assess and scale the potential natural resource impacts
bull Environmental Impact Statement ndash 50 of acreage will be used for scoring
bull Environmental Assessment ndash 30 of acreage will be used for scoring
bull Categorical Exclusion ndash 10 of acreage will be used for scoring
bull Points based on the amount of potentially impacted area divided by the total buffer area (Lowest Impact = 100 points)
57
58
Environment ndash HowNaturalCultural Resource Impact
Project Conservation SpeciesHabitat
Cultural Resources Wetlands Total
AcresEnviro
DocScaled Acres
A 100 25 25 150 300 EA 100
B 100 25 25 150 300 EIS 150
C 20 0 0 5 25 CE 25
This value gets divided by the total acres within the frac14 mile project buffer
58
59
Measuring ECONOMIC DEVELOPMENT
ndash 60 of score ndash Assessment of progress made towards new economic development (new and expansion of existing)
ndash 20 of score - Rate projects based on the extent to which the project is deemed to enhance access to critical intermodal locations interregional freight movement andor freight intensive industries
ndash 20 of score ndash Projectrsquos impact to travel time reliability
59
60
Economic Development ndash HowDevelopment Supported
bull For each project development sites are identified that the project supports
bull Proposed transportation improvement is evaluated onbull Consistency with Local Comp PlanLocal Economic Development
Strategy ndash up to 1 pointbull Consistency with Regional Economic Development Strategy ndash up to
1 pointbull Each development site is evaluated on
bull Consistency with local comp planzoning ndash up to 1 pointbull Development status ndash up to 1 pointbull Site utilities ndash up to 1 point
bull Max 5 points per site ndash used to weight square footage
60
61
bull Adjusting Weighted Square Footagendash Two Adjustments
Distance from project in miles (except sites less than 1 mile) Type of access provided
bull Formula ndash (Points) x (Square Footage) (Distance) x (Access Adjustment)
Project provides a new direct (physically to the site) primary access to the site that does not exist today 100
Project improves existing access (or relocates existing access) to the site directly (Site must be physically adjacent to the project)
100
Project enhances economic development by improving congestion mobility access or operations in the vicinity of the site but the site is not physically adjacent to the project
50
Development NameTotal Points Square Footage Distance Site Access Access
AdjustmentAdjusted
Square Footage
Development A 5 250000 2Project enhances economic development by improving congestion mobility access or operations in the vicinity of the site but the site is not physically adjacent to the project
50 312500
Development B 5 250000 02Project improves existing access (or relocates existing access) to the site directly (Site must be physically adjacent to the project)
100 1250000
Economic Development ndash HowDevelopment Supported
61
62
Economic Development ndash HowIntermodal Access
bull Project can get up to 6 pointsbull Improve access to distribution centers or intermodalmanufacturing facilities
Within 1 mile ndash 2 points 1 to 3 miles ndash 1 point
bull Improve STAA Truck Route Improvement to STAA route - 2 points Improve access to STAA route ndash 1 point
bull Improve access or reduce congestion around portairports Within 1 mile - 2 points 1-3 miles ndash 1 point
bull Point are scaled by freight tonnage along corridor ndash IHS Transearch data was used to calculate daily tonnage on the project
Improve Access to distro intermodal and manufacturing
Improve STAA truck route
Improve access reduce congestion portsairports
Tonnage (1000s) per day
Measure Scaled by tonnage
Project A 200 200 000 16307 65228
Project B 100 200 000 20815 62445
Project C 200 100 000 477 1431
62
63
Measuring LAND USE
ndash 100 of score ndash Degree to which project will support transportation efficient land use patterns and local policies
bull Points awarded based onbull Promoting walkable bicycle friendly mixed use developmentbull Supporting in-fill developmentbull Having an adopted corridoraccess management plan that
exceeds VDOT standardsbull Points scaled by projected 2025 population and employment
density (from MPO approved travel demand model)
63
64
Land Use ndash HowLocalRegional Land Use Policies
bull LocalRegional Land Use Policiesndash Points awarded based on
Promoting walkable bicycle friendly mixed use development
Supporting in-fill development Having an adopted corridoraccess management plan that
exceeds VDOT standards
ndash Points scaled by projected population and employment density (from MPO approved travel demand model)
64
65
How Scoring Works
10090
8070 60
Everything is Relative
65
66
Everything is Relative
Project Measure ScoreA 250 50B 300 60C 75 15D 15 3E 500 100F 150 30
Highest Value Dictates Scores
Project Measure ScoreA 200 40B 300 60C 75 15D 15 3E 500 100F 150 30
Project Measure ScoreA 250 333B 300 40C 75 10D 15 2E 750 100F 150 20
Change here only affects one score
Change here affects all
scores
The best project for that measure dictates the score for all other projects
66
55
Environment ndash HowAir Quality and Energy
bull Air QualityEnergybull Points awarded based on
Providing bicycle or pedestrian facilities Improvements for transit Addressing freight bottlenecks New or expanded Park and Ride lot Provisions for hybridelectric vehicles or
energy efficient infrastructurebull Points scaled based on number of non-
SOV users and truck volume
55
56
Environment ndash HowNaturalCultural Resource Impact
Sum the total acreage of land (within frac14 mile of project) in four categories
bull Conservation Landbull SpeciesHabitatbull Cultural Resourcesbull Wetlands
(Data sources VOF VDCR VDOF VDGIF NPS VDHR USFWS)
Project Conservation SpeciesHabitat Cultural Resources
Wetlands Total Acres
A 100 25 25 150 300
Example
56
57
Environment ndash HowNaturalCultural Resource Impact
Scaling Impact and Assigning PointsThe type of environmental document required for each project
will be used to assess and scale the potential natural resource impacts
bull Environmental Impact Statement ndash 50 of acreage will be used for scoring
bull Environmental Assessment ndash 30 of acreage will be used for scoring
bull Categorical Exclusion ndash 10 of acreage will be used for scoring
bull Points based on the amount of potentially impacted area divided by the total buffer area (Lowest Impact = 100 points)
57
58
Environment ndash HowNaturalCultural Resource Impact
Project Conservation SpeciesHabitat
Cultural Resources Wetlands Total
AcresEnviro
DocScaled Acres
A 100 25 25 150 300 EA 100
B 100 25 25 150 300 EIS 150
C 20 0 0 5 25 CE 25
This value gets divided by the total acres within the frac14 mile project buffer
58
59
Measuring ECONOMIC DEVELOPMENT
ndash 60 of score ndash Assessment of progress made towards new economic development (new and expansion of existing)
ndash 20 of score - Rate projects based on the extent to which the project is deemed to enhance access to critical intermodal locations interregional freight movement andor freight intensive industries
ndash 20 of score ndash Projectrsquos impact to travel time reliability
59
60
Economic Development ndash HowDevelopment Supported
bull For each project development sites are identified that the project supports
bull Proposed transportation improvement is evaluated onbull Consistency with Local Comp PlanLocal Economic Development
Strategy ndash up to 1 pointbull Consistency with Regional Economic Development Strategy ndash up to
1 pointbull Each development site is evaluated on
bull Consistency with local comp planzoning ndash up to 1 pointbull Development status ndash up to 1 pointbull Site utilities ndash up to 1 point
bull Max 5 points per site ndash used to weight square footage
60
61
bull Adjusting Weighted Square Footagendash Two Adjustments
Distance from project in miles (except sites less than 1 mile) Type of access provided
bull Formula ndash (Points) x (Square Footage) (Distance) x (Access Adjustment)
Project provides a new direct (physically to the site) primary access to the site that does not exist today 100
Project improves existing access (or relocates existing access) to the site directly (Site must be physically adjacent to the project)
100
Project enhances economic development by improving congestion mobility access or operations in the vicinity of the site but the site is not physically adjacent to the project
50
Development NameTotal Points Square Footage Distance Site Access Access
AdjustmentAdjusted
Square Footage
Development A 5 250000 2Project enhances economic development by improving congestion mobility access or operations in the vicinity of the site but the site is not physically adjacent to the project
50 312500
Development B 5 250000 02Project improves existing access (or relocates existing access) to the site directly (Site must be physically adjacent to the project)
100 1250000
Economic Development ndash HowDevelopment Supported
61
62
Economic Development ndash HowIntermodal Access
bull Project can get up to 6 pointsbull Improve access to distribution centers or intermodalmanufacturing facilities
Within 1 mile ndash 2 points 1 to 3 miles ndash 1 point
bull Improve STAA Truck Route Improvement to STAA route - 2 points Improve access to STAA route ndash 1 point
bull Improve access or reduce congestion around portairports Within 1 mile - 2 points 1-3 miles ndash 1 point
bull Point are scaled by freight tonnage along corridor ndash IHS Transearch data was used to calculate daily tonnage on the project
Improve Access to distro intermodal and manufacturing
Improve STAA truck route
Improve access reduce congestion portsairports
Tonnage (1000s) per day
Measure Scaled by tonnage
Project A 200 200 000 16307 65228
Project B 100 200 000 20815 62445
Project C 200 100 000 477 1431
62
63
Measuring LAND USE
ndash 100 of score ndash Degree to which project will support transportation efficient land use patterns and local policies
bull Points awarded based onbull Promoting walkable bicycle friendly mixed use developmentbull Supporting in-fill developmentbull Having an adopted corridoraccess management plan that
exceeds VDOT standardsbull Points scaled by projected 2025 population and employment
density (from MPO approved travel demand model)
63
64
Land Use ndash HowLocalRegional Land Use Policies
bull LocalRegional Land Use Policiesndash Points awarded based on
Promoting walkable bicycle friendly mixed use development
Supporting in-fill development Having an adopted corridoraccess management plan that
exceeds VDOT standards
ndash Points scaled by projected population and employment density (from MPO approved travel demand model)
64
65
How Scoring Works
10090
8070 60
Everything is Relative
65
66
Everything is Relative
Project Measure ScoreA 250 50B 300 60C 75 15D 15 3E 500 100F 150 30
Highest Value Dictates Scores
Project Measure ScoreA 200 40B 300 60C 75 15D 15 3E 500 100F 150 30
Project Measure ScoreA 250 333B 300 40C 75 10D 15 2E 750 100F 150 20
Change here only affects one score
Change here affects all
scores
The best project for that measure dictates the score for all other projects
66

56
Environment ndash HowNaturalCultural Resource Impact
Sum the total acreage of land (within frac14 mile of project) in four categories
bull Conservation Landbull SpeciesHabitatbull Cultural Resourcesbull Wetlands
(Data sources VOF VDCR VDOF VDGIF NPS VDHR USFWS)
Project Conservation SpeciesHabitat Cultural Resources
Wetlands Total Acres
A 100 25 25 150 300
Example
56
57
Environment ndash HowNaturalCultural Resource Impact
Scaling Impact and Assigning PointsThe type of environmental document required for each project
will be used to assess and scale the potential natural resource impacts
bull Environmental Impact Statement ndash 50 of acreage will be used for scoring
bull Environmental Assessment ndash 30 of acreage will be used for scoring
bull Categorical Exclusion ndash 10 of acreage will be used for scoring
bull Points based on the amount of potentially impacted area divided by the total buffer area (Lowest Impact = 100 points)
57
58
Environment ndash HowNaturalCultural Resource Impact
Project Conservation SpeciesHabitat
Cultural Resources Wetlands Total
AcresEnviro
DocScaled Acres
A 100 25 25 150 300 EA 100
B 100 25 25 150 300 EIS 150
C 20 0 0 5 25 CE 25
This value gets divided by the total acres within the frac14 mile project buffer
58
59
Measuring ECONOMIC DEVELOPMENT
ndash 60 of score ndash Assessment of progress made towards new economic development (new and expansion of existing)
ndash 20 of score - Rate projects based on the extent to which the project is deemed to enhance access to critical intermodal locations interregional freight movement andor freight intensive industries
ndash 20 of score ndash Projectrsquos impact to travel time reliability
59
60
Economic Development ndash HowDevelopment Supported
bull For each project development sites are identified that the project supports
bull Proposed transportation improvement is evaluated onbull Consistency with Local Comp PlanLocal Economic Development
Strategy ndash up to 1 pointbull Consistency with Regional Economic Development Strategy ndash up to
1 pointbull Each development site is evaluated on
bull Consistency with local comp planzoning ndash up to 1 pointbull Development status ndash up to 1 pointbull Site utilities ndash up to 1 point
bull Max 5 points per site ndash used to weight square footage
60
61
bull Adjusting Weighted Square Footagendash Two Adjustments
Distance from project in miles (except sites less than 1 mile) Type of access provided
bull Formula ndash (Points) x (Square Footage) (Distance) x (Access Adjustment)
Project provides a new direct (physically to the site) primary access to the site that does not exist today 100
Project improves existing access (or relocates existing access) to the site directly (Site must be physically adjacent to the project)
100
Project enhances economic development by improving congestion mobility access or operations in the vicinity of the site but the site is not physically adjacent to the project
50
Development NameTotal Points Square Footage Distance Site Access Access
AdjustmentAdjusted
Square Footage
Development A 5 250000 2Project enhances economic development by improving congestion mobility access or operations in the vicinity of the site but the site is not physically adjacent to the project
50 312500
Development B 5 250000 02Project improves existing access (or relocates existing access) to the site directly (Site must be physically adjacent to the project)
100 1250000
Economic Development ndash HowDevelopment Supported
61
62
Economic Development ndash HowIntermodal Access
bull Project can get up to 6 pointsbull Improve access to distribution centers or intermodalmanufacturing facilities
Within 1 mile ndash 2 points 1 to 3 miles ndash 1 point
bull Improve STAA Truck Route Improvement to STAA route - 2 points Improve access to STAA route ndash 1 point
bull Improve access or reduce congestion around portairports Within 1 mile - 2 points 1-3 miles ndash 1 point
bull Point are scaled by freight tonnage along corridor ndash IHS Transearch data was used to calculate daily tonnage on the project
Improve Access to distro intermodal and manufacturing
Improve STAA truck route
Improve access reduce congestion portsairports
Tonnage (1000s) per day
Measure Scaled by tonnage
Project A 200 200 000 16307 65228
Project B 100 200 000 20815 62445
Project C 200 100 000 477 1431
62
63
Measuring LAND USE
ndash 100 of score ndash Degree to which project will support transportation efficient land use patterns and local policies
bull Points awarded based onbull Promoting walkable bicycle friendly mixed use developmentbull Supporting in-fill developmentbull Having an adopted corridoraccess management plan that
exceeds VDOT standardsbull Points scaled by projected 2025 population and employment
density (from MPO approved travel demand model)
63
64
Land Use ndash HowLocalRegional Land Use Policies
bull LocalRegional Land Use Policiesndash Points awarded based on
Promoting walkable bicycle friendly mixed use development
Supporting in-fill development Having an adopted corridoraccess management plan that
exceeds VDOT standards
ndash Points scaled by projected population and employment density (from MPO approved travel demand model)
64
65
How Scoring Works
10090
8070 60
Everything is Relative
65
66
Everything is Relative
Project Measure ScoreA 250 50B 300 60C 75 15D 15 3E 500 100F 150 30
Highest Value Dictates Scores
Project Measure ScoreA 200 40B 300 60C 75 15D 15 3E 500 100F 150 30
Project Measure ScoreA 250 333B 300 40C 75 10D 15 2E 750 100F 150 20
Change here only affects one score
Change here affects all
scores
The best project for that measure dictates the score for all other projects
66
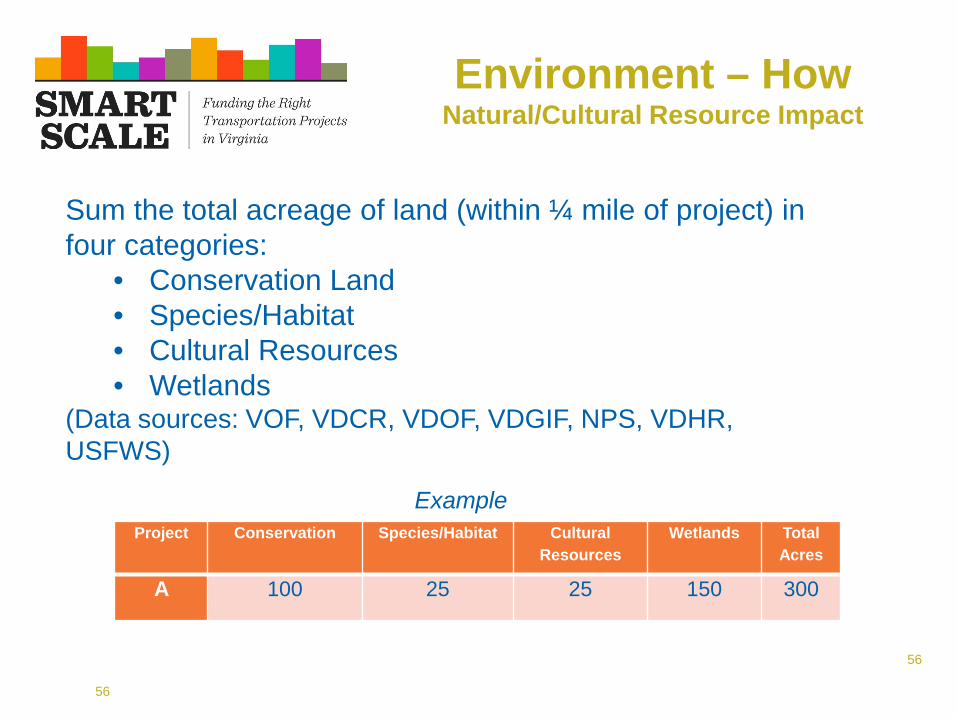
57
Environment ndash HowNaturalCultural Resource Impact
Scaling Impact and Assigning PointsThe type of environmental document required for each project
will be used to assess and scale the potential natural resource impacts
bull Environmental Impact Statement ndash 50 of acreage will be used for scoring
bull Environmental Assessment ndash 30 of acreage will be used for scoring
bull Categorical Exclusion ndash 10 of acreage will be used for scoring
bull Points based on the amount of potentially impacted area divided by the total buffer area (Lowest Impact = 100 points)
57
58
Environment ndash HowNaturalCultural Resource Impact
Project Conservation SpeciesHabitat
Cultural Resources Wetlands Total
AcresEnviro
DocScaled Acres
A 100 25 25 150 300 EA 100
B 100 25 25 150 300 EIS 150
C 20 0 0 5 25 CE 25
This value gets divided by the total acres within the frac14 mile project buffer
58
59
Measuring ECONOMIC DEVELOPMENT
ndash 60 of score ndash Assessment of progress made towards new economic development (new and expansion of existing)
ndash 20 of score - Rate projects based on the extent to which the project is deemed to enhance access to critical intermodal locations interregional freight movement andor freight intensive industries
ndash 20 of score ndash Projectrsquos impact to travel time reliability
59
60
Economic Development ndash HowDevelopment Supported
bull For each project development sites are identified that the project supports
bull Proposed transportation improvement is evaluated onbull Consistency with Local Comp PlanLocal Economic Development
Strategy ndash up to 1 pointbull Consistency with Regional Economic Development Strategy ndash up to
1 pointbull Each development site is evaluated on
bull Consistency with local comp planzoning ndash up to 1 pointbull Development status ndash up to 1 pointbull Site utilities ndash up to 1 point
bull Max 5 points per site ndash used to weight square footage
60
61
bull Adjusting Weighted Square Footagendash Two Adjustments
Distance from project in miles (except sites less than 1 mile) Type of access provided
bull Formula ndash (Points) x (Square Footage) (Distance) x (Access Adjustment)
Project provides a new direct (physically to the site) primary access to the site that does not exist today 100
Project improves existing access (or relocates existing access) to the site directly (Site must be physically adjacent to the project)
100
Project enhances economic development by improving congestion mobility access or operations in the vicinity of the site but the site is not physically adjacent to the project
50
Development NameTotal Points Square Footage Distance Site Access Access
AdjustmentAdjusted
Square Footage
Development A 5 250000 2Project enhances economic development by improving congestion mobility access or operations in the vicinity of the site but the site is not physically adjacent to the project
50 312500
Development B 5 250000 02Project improves existing access (or relocates existing access) to the site directly (Site must be physically adjacent to the project)
100 1250000
Economic Development ndash HowDevelopment Supported
61
62
Economic Development ndash HowIntermodal Access
bull Project can get up to 6 pointsbull Improve access to distribution centers or intermodalmanufacturing facilities
Within 1 mile ndash 2 points 1 to 3 miles ndash 1 point
bull Improve STAA Truck Route Improvement to STAA route - 2 points Improve access to STAA route ndash 1 point
bull Improve access or reduce congestion around portairports Within 1 mile - 2 points 1-3 miles ndash 1 point
bull Point are scaled by freight tonnage along corridor ndash IHS Transearch data was used to calculate daily tonnage on the project
Improve Access to distro intermodal and manufacturing
Improve STAA truck route
Improve access reduce congestion portsairports
Tonnage (1000s) per day
Measure Scaled by tonnage
Project A 200 200 000 16307 65228
Project B 100 200 000 20815 62445
Project C 200 100 000 477 1431
62
63
Measuring LAND USE
ndash 100 of score ndash Degree to which project will support transportation efficient land use patterns and local policies
bull Points awarded based onbull Promoting walkable bicycle friendly mixed use developmentbull Supporting in-fill developmentbull Having an adopted corridoraccess management plan that
exceeds VDOT standardsbull Points scaled by projected 2025 population and employment
density (from MPO approved travel demand model)
63
64
Land Use ndash HowLocalRegional Land Use Policies
bull LocalRegional Land Use Policiesndash Points awarded based on
Promoting walkable bicycle friendly mixed use development
Supporting in-fill development Having an adopted corridoraccess management plan that
exceeds VDOT standards
ndash Points scaled by projected population and employment density (from MPO approved travel demand model)
64
65
How Scoring Works
10090
8070 60
Everything is Relative
65
66
Everything is Relative
Project Measure ScoreA 250 50B 300 60C 75 15D 15 3E 500 100F 150 30
Highest Value Dictates Scores
Project Measure ScoreA 200 40B 300 60C 75 15D 15 3E 500 100F 150 30
Project Measure ScoreA 250 333B 300 40C 75 10D 15 2E 750 100F 150 20
Change here only affects one score
Change here affects all
scores
The best project for that measure dictates the score for all other projects
66
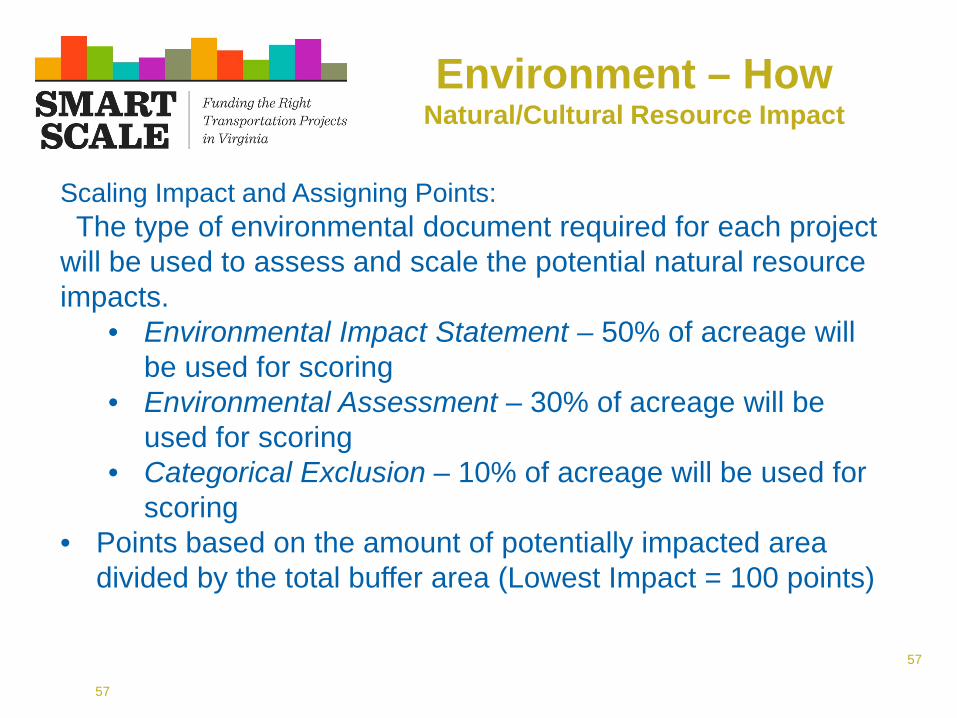
58
Environment ndash HowNaturalCultural Resource Impact
Project Conservation SpeciesHabitat
Cultural Resources Wetlands Total
AcresEnviro
DocScaled Acres
A 100 25 25 150 300 EA 100
B 100 25 25 150 300 EIS 150
C 20 0 0 5 25 CE 25
This value gets divided by the total acres within the frac14 mile project buffer
58
59
Measuring ECONOMIC DEVELOPMENT
ndash 60 of score ndash Assessment of progress made towards new economic development (new and expansion of existing)
ndash 20 of score - Rate projects based on the extent to which the project is deemed to enhance access to critical intermodal locations interregional freight movement andor freight intensive industries
ndash 20 of score ndash Projectrsquos impact to travel time reliability
59
60
Economic Development ndash HowDevelopment Supported
bull For each project development sites are identified that the project supports
bull Proposed transportation improvement is evaluated onbull Consistency with Local Comp PlanLocal Economic Development
Strategy ndash up to 1 pointbull Consistency with Regional Economic Development Strategy ndash up to
1 pointbull Each development site is evaluated on
bull Consistency with local comp planzoning ndash up to 1 pointbull Development status ndash up to 1 pointbull Site utilities ndash up to 1 point
bull Max 5 points per site ndash used to weight square footage
60
61
bull Adjusting Weighted Square Footagendash Two Adjustments
Distance from project in miles (except sites less than 1 mile) Type of access provided
bull Formula ndash (Points) x (Square Footage) (Distance) x (Access Adjustment)
Project provides a new direct (physically to the site) primary access to the site that does not exist today 100
Project improves existing access (or relocates existing access) to the site directly (Site must be physically adjacent to the project)
100
Project enhances economic development by improving congestion mobility access or operations in the vicinity of the site but the site is not physically adjacent to the project
50
Development NameTotal Points Square Footage Distance Site Access Access
AdjustmentAdjusted
Square Footage
Development A 5 250000 2Project enhances economic development by improving congestion mobility access or operations in the vicinity of the site but the site is not physically adjacent to the project
50 312500
Development B 5 250000 02Project improves existing access (or relocates existing access) to the site directly (Site must be physically adjacent to the project)
100 1250000
Economic Development ndash HowDevelopment Supported
61
62
Economic Development ndash HowIntermodal Access
bull Project can get up to 6 pointsbull Improve access to distribution centers or intermodalmanufacturing facilities
Within 1 mile ndash 2 points 1 to 3 miles ndash 1 point
bull Improve STAA Truck Route Improvement to STAA route - 2 points Improve access to STAA route ndash 1 point
bull Improve access or reduce congestion around portairports Within 1 mile - 2 points 1-3 miles ndash 1 point
bull Point are scaled by freight tonnage along corridor ndash IHS Transearch data was used to calculate daily tonnage on the project
Improve Access to distro intermodal and manufacturing
Improve STAA truck route
Improve access reduce congestion portsairports
Tonnage (1000s) per day
Measure Scaled by tonnage
Project A 200 200 000 16307 65228
Project B 100 200 000 20815 62445
Project C 200 100 000 477 1431
62
63
Measuring LAND USE
ndash 100 of score ndash Degree to which project will support transportation efficient land use patterns and local policies
bull Points awarded based onbull Promoting walkable bicycle friendly mixed use developmentbull Supporting in-fill developmentbull Having an adopted corridoraccess management plan that
exceeds VDOT standardsbull Points scaled by projected 2025 population and employment
density (from MPO approved travel demand model)
63
64
Land Use ndash HowLocalRegional Land Use Policies
bull LocalRegional Land Use Policiesndash Points awarded based on
Promoting walkable bicycle friendly mixed use development
Supporting in-fill development Having an adopted corridoraccess management plan that
exceeds VDOT standards
ndash Points scaled by projected population and employment density (from MPO approved travel demand model)
64
65
How Scoring Works
10090
8070 60
Everything is Relative
65
66
Everything is Relative
Project Measure ScoreA 250 50B 300 60C 75 15D 15 3E 500 100F 150 30
Highest Value Dictates Scores
Project Measure ScoreA 200 40B 300 60C 75 15D 15 3E 500 100F 150 30
Project Measure ScoreA 250 333B 300 40C 75 10D 15 2E 750 100F 150 20
Change here only affects one score
Change here affects all
scores
The best project for that measure dictates the score for all other projects
66
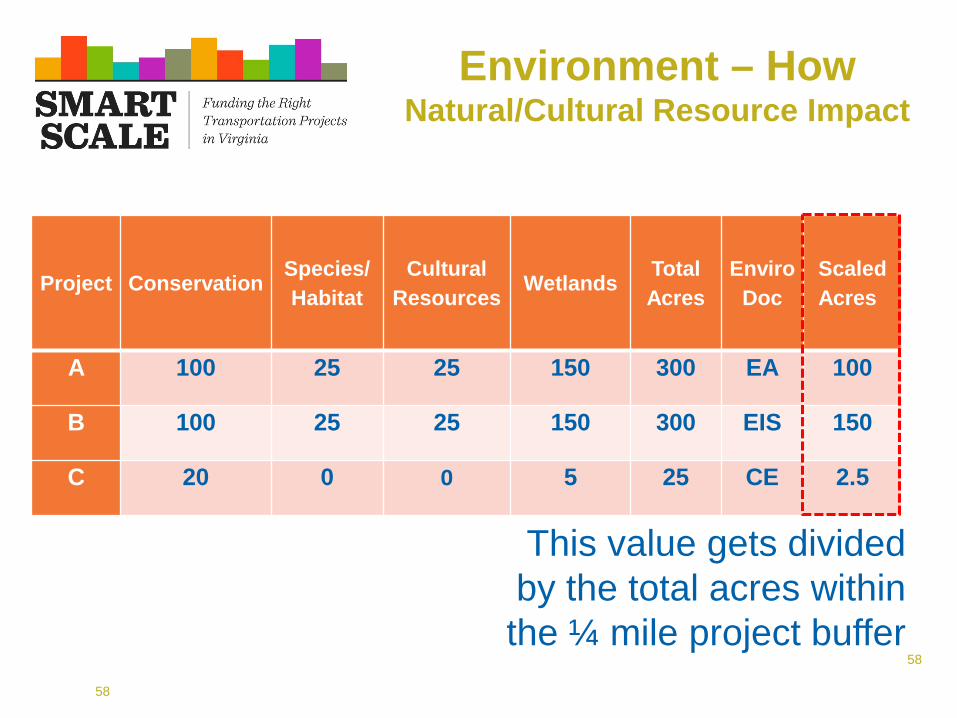
59
Measuring ECONOMIC DEVELOPMENT
ndash 60 of score ndash Assessment of progress made towards new economic development (new and expansion of existing)
ndash 20 of score - Rate projects based on the extent to which the project is deemed to enhance access to critical intermodal locations interregional freight movement andor freight intensive industries
ndash 20 of score ndash Projectrsquos impact to travel time reliability
59
60
Economic Development ndash HowDevelopment Supported
bull For each project development sites are identified that the project supports
bull Proposed transportation improvement is evaluated onbull Consistency with Local Comp PlanLocal Economic Development
Strategy ndash up to 1 pointbull Consistency with Regional Economic Development Strategy ndash up to
1 pointbull Each development site is evaluated on
bull Consistency with local comp planzoning ndash up to 1 pointbull Development status ndash up to 1 pointbull Site utilities ndash up to 1 point
bull Max 5 points per site ndash used to weight square footage
60
61
bull Adjusting Weighted Square Footagendash Two Adjustments
Distance from project in miles (except sites less than 1 mile) Type of access provided
bull Formula ndash (Points) x (Square Footage) (Distance) x (Access Adjustment)
Project provides a new direct (physically to the site) primary access to the site that does not exist today 100
Project improves existing access (or relocates existing access) to the site directly (Site must be physically adjacent to the project)
100
Project enhances economic development by improving congestion mobility access or operations in the vicinity of the site but the site is not physically adjacent to the project
50
Development NameTotal Points Square Footage Distance Site Access Access
AdjustmentAdjusted
Square Footage
Development A 5 250000 2Project enhances economic development by improving congestion mobility access or operations in the vicinity of the site but the site is not physically adjacent to the project
50 312500
Development B 5 250000 02Project improves existing access (or relocates existing access) to the site directly (Site must be physically adjacent to the project)
100 1250000
Economic Development ndash HowDevelopment Supported
61
62
Economic Development ndash HowIntermodal Access
bull Project can get up to 6 pointsbull Improve access to distribution centers or intermodalmanufacturing facilities
Within 1 mile ndash 2 points 1 to 3 miles ndash 1 point
bull Improve STAA Truck Route Improvement to STAA route - 2 points Improve access to STAA route ndash 1 point
bull Improve access or reduce congestion around portairports Within 1 mile - 2 points 1-3 miles ndash 1 point
bull Point are scaled by freight tonnage along corridor ndash IHS Transearch data was used to calculate daily tonnage on the project
Improve Access to distro intermodal and manufacturing
Improve STAA truck route
Improve access reduce congestion portsairports
Tonnage (1000s) per day
Measure Scaled by tonnage
Project A 200 200 000 16307 65228
Project B 100 200 000 20815 62445
Project C 200 100 000 477 1431
62
63
Measuring LAND USE
ndash 100 of score ndash Degree to which project will support transportation efficient land use patterns and local policies
bull Points awarded based onbull Promoting walkable bicycle friendly mixed use developmentbull Supporting in-fill developmentbull Having an adopted corridoraccess management plan that
exceeds VDOT standardsbull Points scaled by projected 2025 population and employment
density (from MPO approved travel demand model)
63
64
Land Use ndash HowLocalRegional Land Use Policies
bull LocalRegional Land Use Policiesndash Points awarded based on
Promoting walkable bicycle friendly mixed use development
Supporting in-fill development Having an adopted corridoraccess management plan that
exceeds VDOT standards
ndash Points scaled by projected population and employment density (from MPO approved travel demand model)
64
65
How Scoring Works
10090
8070 60
Everything is Relative
65
66
Everything is Relative
Project Measure ScoreA 250 50B 300 60C 75 15D 15 3E 500 100F 150 30
Highest Value Dictates Scores
Project Measure ScoreA 200 40B 300 60C 75 15D 15 3E 500 100F 150 30
Project Measure ScoreA 250 333B 300 40C 75 10D 15 2E 750 100F 150 20
Change here only affects one score
Change here affects all
scores
The best project for that measure dictates the score for all other projects
66
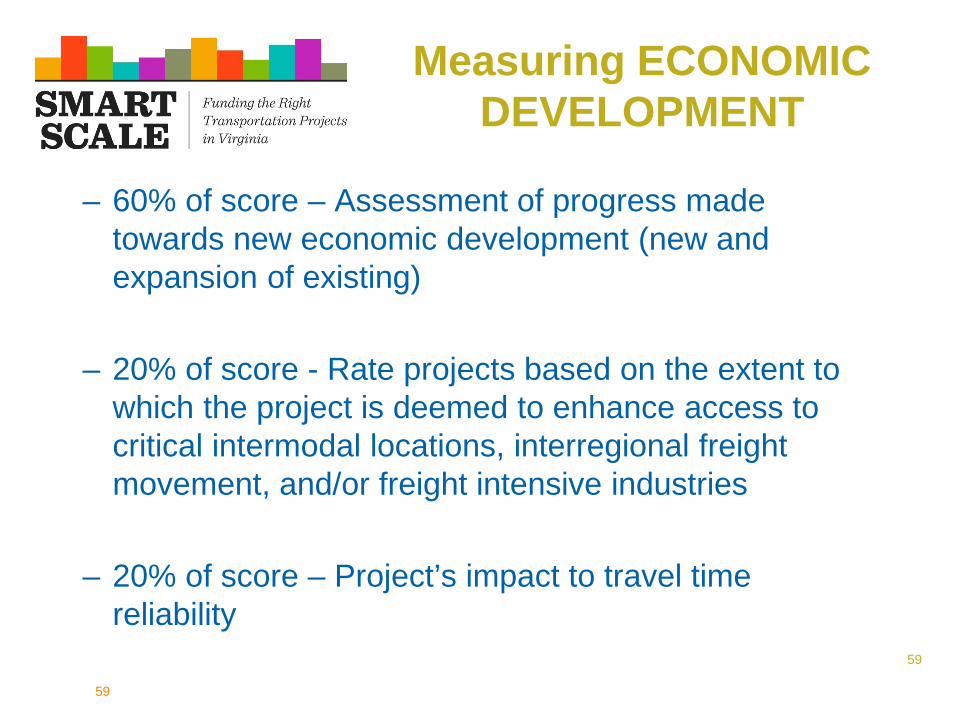
60
Economic Development ndash HowDevelopment Supported
bull For each project development sites are identified that the project supports
bull Proposed transportation improvement is evaluated onbull Consistency with Local Comp PlanLocal Economic Development
Strategy ndash up to 1 pointbull Consistency with Regional Economic Development Strategy ndash up to
1 pointbull Each development site is evaluated on
bull Consistency with local comp planzoning ndash up to 1 pointbull Development status ndash up to 1 pointbull Site utilities ndash up to 1 point
bull Max 5 points per site ndash used to weight square footage
60
61
bull Adjusting Weighted Square Footagendash Two Adjustments
Distance from project in miles (except sites less than 1 mile) Type of access provided
bull Formula ndash (Points) x (Square Footage) (Distance) x (Access Adjustment)
Project provides a new direct (physically to the site) primary access to the site that does not exist today 100
Project improves existing access (or relocates existing access) to the site directly (Site must be physically adjacent to the project)
100
Project enhances economic development by improving congestion mobility access or operations in the vicinity of the site but the site is not physically adjacent to the project
50
Development NameTotal Points Square Footage Distance Site Access Access
AdjustmentAdjusted
Square Footage
Development A 5 250000 2Project enhances economic development by improving congestion mobility access or operations in the vicinity of the site but the site is not physically adjacent to the project
50 312500
Development B 5 250000 02Project improves existing access (or relocates existing access) to the site directly (Site must be physically adjacent to the project)
100 1250000
Economic Development ndash HowDevelopment Supported
61
62
Economic Development ndash HowIntermodal Access
bull Project can get up to 6 pointsbull Improve access to distribution centers or intermodalmanufacturing facilities
Within 1 mile ndash 2 points 1 to 3 miles ndash 1 point
bull Improve STAA Truck Route Improvement to STAA route - 2 points Improve access to STAA route ndash 1 point
bull Improve access or reduce congestion around portairports Within 1 mile - 2 points 1-3 miles ndash 1 point
bull Point are scaled by freight tonnage along corridor ndash IHS Transearch data was used to calculate daily tonnage on the project
Improve Access to distro intermodal and manufacturing
Improve STAA truck route
Improve access reduce congestion portsairports
Tonnage (1000s) per day
Measure Scaled by tonnage
Project A 200 200 000 16307 65228
Project B 100 200 000 20815 62445
Project C 200 100 000 477 1431
62
63
Measuring LAND USE
ndash 100 of score ndash Degree to which project will support transportation efficient land use patterns and local policies
bull Points awarded based onbull Promoting walkable bicycle friendly mixed use developmentbull Supporting in-fill developmentbull Having an adopted corridoraccess management plan that
exceeds VDOT standardsbull Points scaled by projected 2025 population and employment
density (from MPO approved travel demand model)
63
64
Land Use ndash HowLocalRegional Land Use Policies
bull LocalRegional Land Use Policiesndash Points awarded based on
Promoting walkable bicycle friendly mixed use development
Supporting in-fill development Having an adopted corridoraccess management plan that
exceeds VDOT standards
ndash Points scaled by projected population and employment density (from MPO approved travel demand model)
64
65
How Scoring Works
10090
8070 60
Everything is Relative
65
66
Everything is Relative
Project Measure ScoreA 250 50B 300 60C 75 15D 15 3E 500 100F 150 30
Highest Value Dictates Scores
Project Measure ScoreA 200 40B 300 60C 75 15D 15 3E 500 100F 150 30
Project Measure ScoreA 250 333B 300 40C 75 10D 15 2E 750 100F 150 20
Change here only affects one score
Change here affects all
scores
The best project for that measure dictates the score for all other projects
66
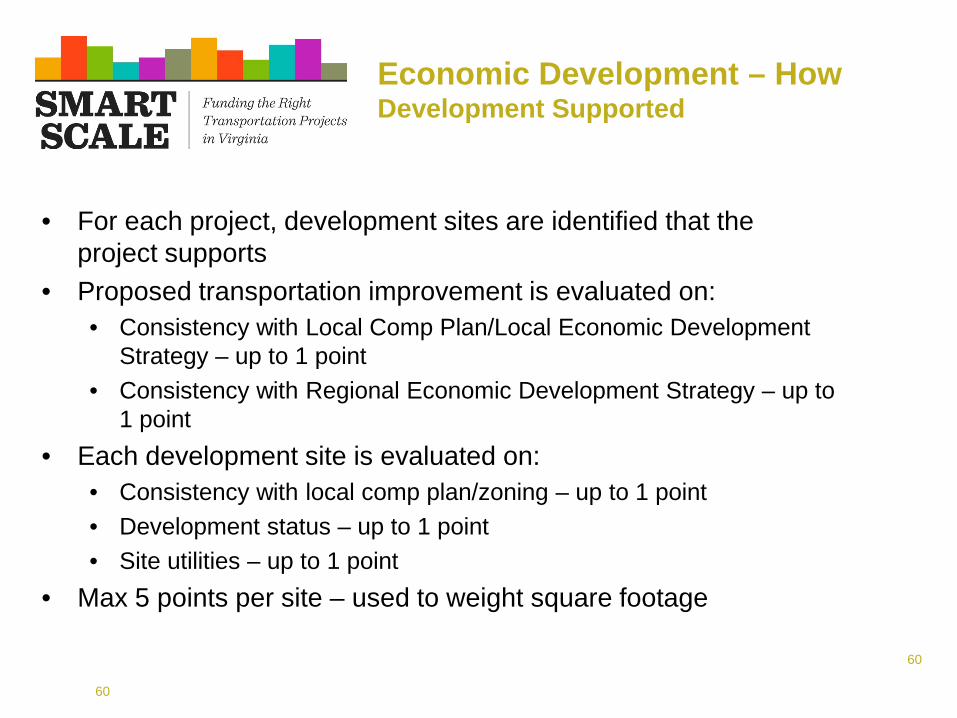
61
bull Adjusting Weighted Square Footagendash Two Adjustments
Distance from project in miles (except sites less than 1 mile) Type of access provided
bull Formula ndash (Points) x (Square Footage) (Distance) x (Access Adjustment)
Project provides a new direct (physically to the site) primary access to the site that does not exist today 100
Project improves existing access (or relocates existing access) to the site directly (Site must be physically adjacent to the project)
100
Project enhances economic development by improving congestion mobility access or operations in the vicinity of the site but the site is not physically adjacent to the project
50
Development NameTotal Points Square Footage Distance Site Access Access
AdjustmentAdjusted
Square Footage
Development A 5 250000 2Project enhances economic development by improving congestion mobility access or operations in the vicinity of the site but the site is not physically adjacent to the project
50 312500
Development B 5 250000 02Project improves existing access (or relocates existing access) to the site directly (Site must be physically adjacent to the project)
100 1250000
Economic Development ndash HowDevelopment Supported
61
62
Economic Development ndash HowIntermodal Access
bull Project can get up to 6 pointsbull Improve access to distribution centers or intermodalmanufacturing facilities
Within 1 mile ndash 2 points 1 to 3 miles ndash 1 point
bull Improve STAA Truck Route Improvement to STAA route - 2 points Improve access to STAA route ndash 1 point
bull Improve access or reduce congestion around portairports Within 1 mile - 2 points 1-3 miles ndash 1 point
bull Point are scaled by freight tonnage along corridor ndash IHS Transearch data was used to calculate daily tonnage on the project
Improve Access to distro intermodal and manufacturing
Improve STAA truck route
Improve access reduce congestion portsairports
Tonnage (1000s) per day
Measure Scaled by tonnage
Project A 200 200 000 16307 65228
Project B 100 200 000 20815 62445
Project C 200 100 000 477 1431
62
63
Measuring LAND USE
ndash 100 of score ndash Degree to which project will support transportation efficient land use patterns and local policies
bull Points awarded based onbull Promoting walkable bicycle friendly mixed use developmentbull Supporting in-fill developmentbull Having an adopted corridoraccess management plan that
exceeds VDOT standardsbull Points scaled by projected 2025 population and employment
density (from MPO approved travel demand model)
63
64
Land Use ndash HowLocalRegional Land Use Policies
bull LocalRegional Land Use Policiesndash Points awarded based on
Promoting walkable bicycle friendly mixed use development
Supporting in-fill development Having an adopted corridoraccess management plan that
exceeds VDOT standards
ndash Points scaled by projected population and employment density (from MPO approved travel demand model)
64
65
How Scoring Works
10090
8070 60
Everything is Relative
65
66
Everything is Relative
Project Measure ScoreA 250 50B 300 60C 75 15D 15 3E 500 100F 150 30
Highest Value Dictates Scores
Project Measure ScoreA 200 40B 300 60C 75 15D 15 3E 500 100F 150 30
Project Measure ScoreA 250 333B 300 40C 75 10D 15 2E 750 100F 150 20
Change here only affects one score
Change here affects all
scores
The best project for that measure dictates the score for all other projects
66
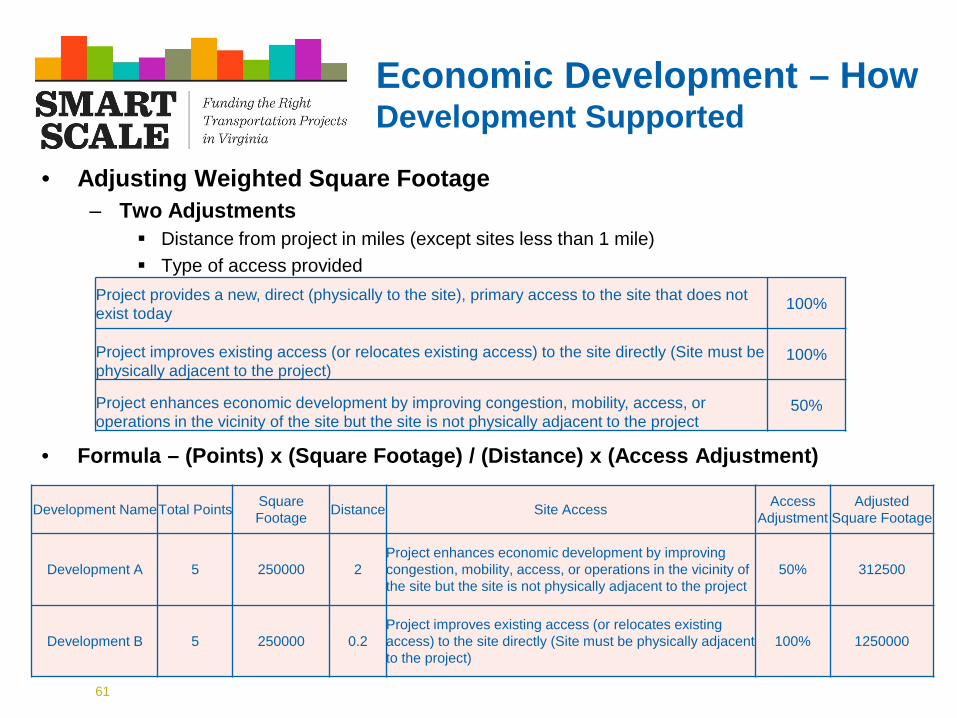
62
Economic Development ndash HowIntermodal Access
bull Project can get up to 6 pointsbull Improve access to distribution centers or intermodalmanufacturing facilities
Within 1 mile ndash 2 points 1 to 3 miles ndash 1 point
bull Improve STAA Truck Route Improvement to STAA route - 2 points Improve access to STAA route ndash 1 point
bull Improve access or reduce congestion around portairports Within 1 mile - 2 points 1-3 miles ndash 1 point
bull Point are scaled by freight tonnage along corridor ndash IHS Transearch data was used to calculate daily tonnage on the project
Improve Access to distro intermodal and manufacturing
Improve STAA truck route
Improve access reduce congestion portsairports
Tonnage (1000s) per day
Measure Scaled by tonnage
Project A 200 200 000 16307 65228
Project B 100 200 000 20815 62445
Project C 200 100 000 477 1431
62
63
Measuring LAND USE
ndash 100 of score ndash Degree to which project will support transportation efficient land use patterns and local policies
bull Points awarded based onbull Promoting walkable bicycle friendly mixed use developmentbull Supporting in-fill developmentbull Having an adopted corridoraccess management plan that
exceeds VDOT standardsbull Points scaled by projected 2025 population and employment
density (from MPO approved travel demand model)
63
64
Land Use ndash HowLocalRegional Land Use Policies
bull LocalRegional Land Use Policiesndash Points awarded based on
Promoting walkable bicycle friendly mixed use development
Supporting in-fill development Having an adopted corridoraccess management plan that
exceeds VDOT standards
ndash Points scaled by projected population and employment density (from MPO approved travel demand model)
64
65
How Scoring Works
10090
8070 60
Everything is Relative
65
66
Everything is Relative
Project Measure ScoreA 250 50B 300 60C 75 15D 15 3E 500 100F 150 30
Highest Value Dictates Scores
Project Measure ScoreA 200 40B 300 60C 75 15D 15 3E 500 100F 150 30
Project Measure ScoreA 250 333B 300 40C 75 10D 15 2E 750 100F 150 20
Change here only affects one score
Change here affects all
scores
The best project for that measure dictates the score for all other projects
66
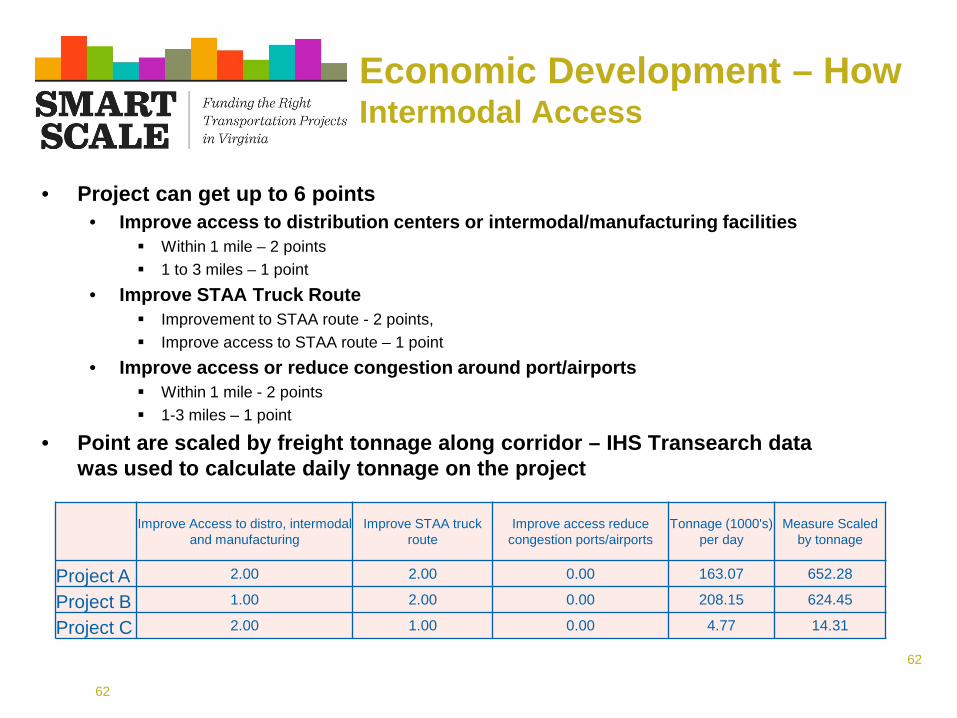
63
Measuring LAND USE
ndash 100 of score ndash Degree to which project will support transportation efficient land use patterns and local policies
bull Points awarded based onbull Promoting walkable bicycle friendly mixed use developmentbull Supporting in-fill developmentbull Having an adopted corridoraccess management plan that
exceeds VDOT standardsbull Points scaled by projected 2025 population and employment
density (from MPO approved travel demand model)
63
64
Land Use ndash HowLocalRegional Land Use Policies
bull LocalRegional Land Use Policiesndash Points awarded based on
Promoting walkable bicycle friendly mixed use development
Supporting in-fill development Having an adopted corridoraccess management plan that
exceeds VDOT standards
ndash Points scaled by projected population and employment density (from MPO approved travel demand model)
64
65
How Scoring Works
10090
8070 60
Everything is Relative
65
66
Everything is Relative
Project Measure ScoreA 250 50B 300 60C 75 15D 15 3E 500 100F 150 30
Highest Value Dictates Scores
Project Measure ScoreA 200 40B 300 60C 75 15D 15 3E 500 100F 150 30
Project Measure ScoreA 250 333B 300 40C 75 10D 15 2E 750 100F 150 20
Change here only affects one score
Change here affects all
scores
The best project for that measure dictates the score for all other projects
66
64
Land Use ndash HowLocalRegional Land Use Policies
bull LocalRegional Land Use Policiesndash Points awarded based on
Promoting walkable bicycle friendly mixed use development
Supporting in-fill development Having an adopted corridoraccess management plan that
exceeds VDOT standards
ndash Points scaled by projected population and employment density (from MPO approved travel demand model)
64
65
How Scoring Works
10090
8070 60
Everything is Relative
65
66
Everything is Relative
Project Measure ScoreA 250 50B 300 60C 75 15D 15 3E 500 100F 150 30
Highest Value Dictates Scores
Project Measure ScoreA 200 40B 300 60C 75 15D 15 3E 500 100F 150 30
Project Measure ScoreA 250 333B 300 40C 75 10D 15 2E 750 100F 150 20
Change here only affects one score
Change here affects all
scores
The best project for that measure dictates the score for all other projects
66
65
How Scoring Works
10090
8070 60
Everything is Relative
65
66
Everything is Relative
Project Measure ScoreA 250 50B 300 60C 75 15D 15 3E 500 100F 150 30
Highest Value Dictates Scores
Project Measure ScoreA 200 40B 300 60C 75 15D 15 3E 500 100F 150 30
Project Measure ScoreA 250 333B 300 40C 75 10D 15 2E 750 100F 150 20
Change here only affects one score
Change here affects all
scores
The best project for that measure dictates the score for all other projects
66
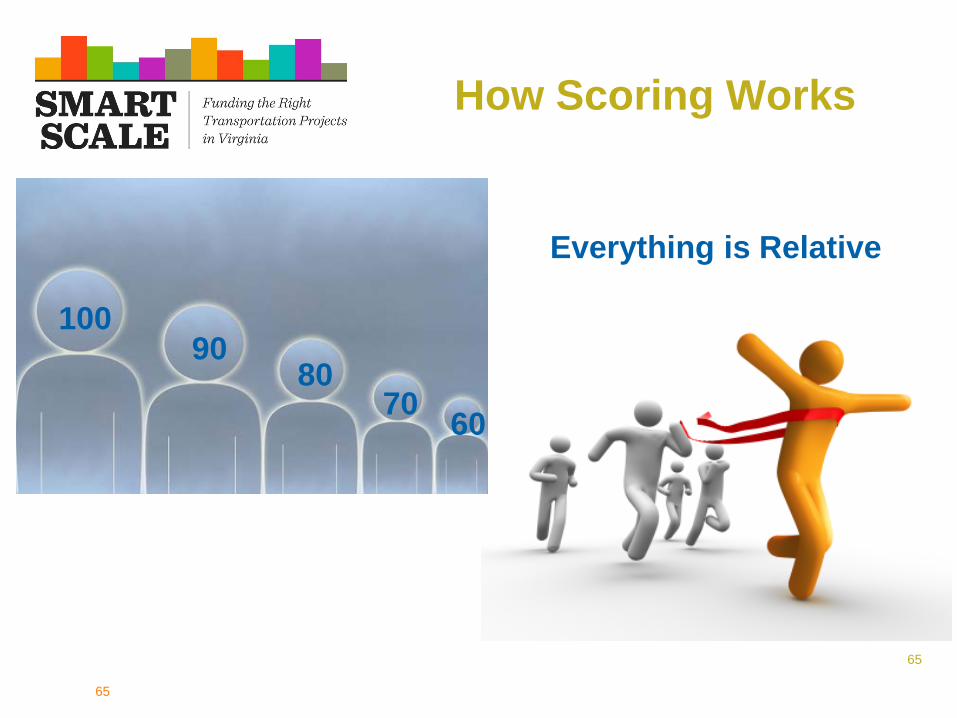
66
Everything is Relative
Project Measure ScoreA 250 50B 300 60C 75 15D 15 3E 500 100F 150 30
Highest Value Dictates Scores
Project Measure ScoreA 200 40B 300 60C 75 15D 15 3E 500 100F 150 30
Project Measure ScoreA 250 333B 300 40C 75 10D 15 2E 750 100F 150 20
Change here only affects one score
Change here affects all
scores
The best project for that measure dictates the score for all other projects
66
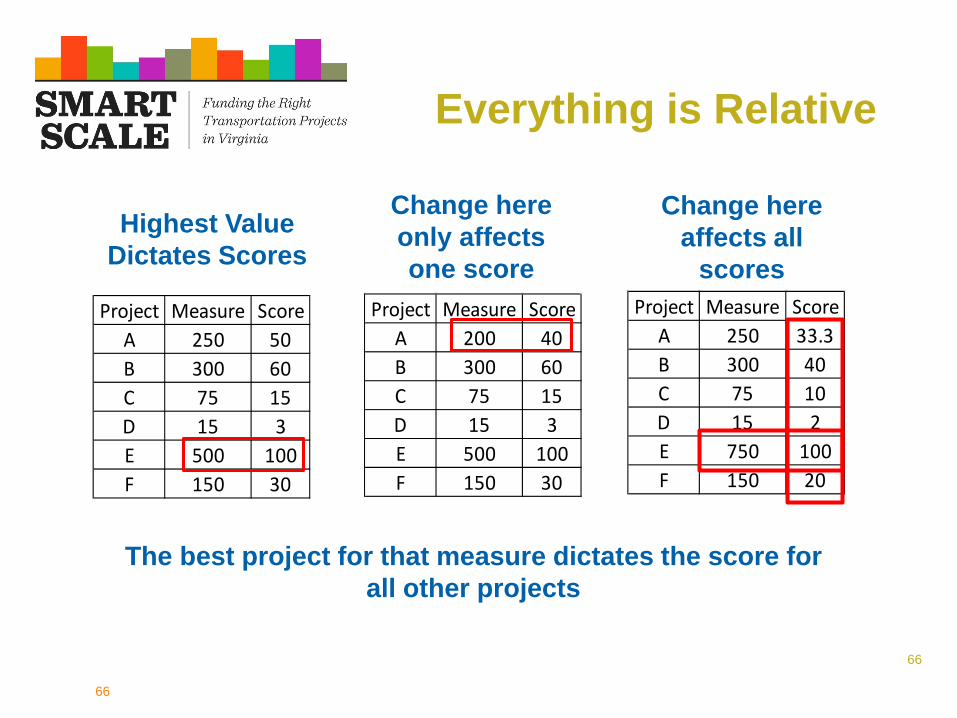
Area Type Weighting
Factor Congestion Mitigation
EconomicDevelopment Accessibility Safety Environmental
Quality Land Use
Category A 45 5 15 5 10 20
Category B 15 20 25 20 10 10Category C 15 25 25 25 10Category D 10 35 15 30 10
67
Sample Project Scoring
Project A - located in Typology A
Congestion Safety Accessibility Environ Econ Dev Land Use
Thro
ughp
ut
Del
ay
F amp
SI C
rash
es
F amp
SI C
rash
Rat
e
Acc
ess
to J
obs
Acc
ess
to J
obs
(Dis
Pop
)
Mul
timod
al C
hoic
es
Air
Qua
lity
Nat
ural
amp C
ult
Res
ourc
es
Eco
nom
ic D
evel
opm
ent
Goo
ds M
ovem
ent
Trav
el T
im R
elia
bilit
y
Tran
s E
ffici
ent L
and
Use
Measure Score 62 48 20 32 10 20 10 38 28 30 20 20 17
Measure Weight 50 50 50 50 60 20 20 50 50 60 20 20 100
Weighted Measure Score 31 24 10 16 6 4 2 19 14 18 4 4 17
Raw Factor Score 55 26 12 330 260 17
Factor Weighting (Typ A) 45 5 15 10 5 20
Weighted Factor Score 248 13 18 33 13 34
Project Score 359
Total Project Cost $20000000
Score Divided by Total Cost 1795
HB2 Cost $10000000
Score Divided by HB2 Cost 35968
69
How will cost affectthe HB2 score
bull House Bill 2 requires that benefits produced by a project be analyzed on a basis of relative costs
bull Results to be provided to CTB based onbull Benefits relative to HB2 costs
bull Benefits relative to Total costs
Benefit ScoreCost
69
Round 1 Summary and Lessons Learned
70
71
Summary of Applications Received
bull 321 applications submitted
bull 131 entities submitted at least one application
bull Requested $695 billion in Smart Scale funds
bull Applications include other funding equal to $62 billion
bull 287 projects advanced through validation and screening to measures development and scoring
72
Summary of Applications
District Apps Requested $Billions
Total Cost $ Billions
Bristol 32 $022 $023Culpeper 17 $031 $032Fredericksburg 22 $037 $045 Hampton Roads 45 $186 $466Lynchburg 38 $020 $023NOVA 46 $211 $519Richmond 54 $077 $085Salem 38 $070 $080Staunton 29 $040 $044Grand Total 321 $695 $1317
73
Funds Available for Smart Scale
(in millions)
HB 1887 Grant Programs Percentage Round 1 TotalDistrict Grant Program
Bristol 70 $622Culpeper 62 $549Fredericksburg 69 $605Hampton Roads 202 $1780Lynchburg 71 $631Northern Virginia 207 $1831Richmond 144 $1274Salem 96 $849Staunton 78 $689
High Priority ProjectsProgram (Statewide) $8331
Total 1000 $17162
74
$32 B Total Cost all Projects
Round 1 Results
$- $200 $400 $600
HPP and DGP Funds
HPP DPG
0
1000
2000
BR CU FR HR LY NO RI SA ST
Smart Scale $ vs Total $
Total Cost SmartScale Cost
Avg Score Smart Scale Cost 107
1011
19
21
2319
22
20
18
Number of Projects By District
BristolCulpeperFredericksburgHampton RoadsLynchburgNorthern VARichmondSalemStaunton
163 Total
75
Lessons Learned
bull Conducted Key Lessons Learned Activities
bull External Review Groupndash Review of measures development and scores
bull Internal and External Stakeholder Surveysndash Surveys focused on application in-take process screening and validation
bull Implementation Team Workshops (included OIPI DRPT VDOT staff)
ndash Workshops focused on all aspects of process
76
Areas for Improvement Identified by External Review Group
bull Consider approach to scale cost to avoid bias of low cost projects
bull Consider modifications to accessibility measure to include non-work accessibility
bull Provide additional feedback to applicants to improve application quality in future rounds
bull Process was transparent and a great deal of information was made available to facilitate understanding
77
Smart Scale Lessons Learned
bull Two stakeholder surveys were conducted in December 2015January 2016 focusing on the application intake screening and validation processesbull External Survey for Applicants and Sponsors received 114 responsesbull Internal Survey for VDOT and DRPT staff received 84 responses
bull Internal workshop with VDPTDRPT staff involved in Smart Scale process
bull Feedback helps us improve the process and better understand what worked and what didnrsquot work
bull As a result of the lessons learned identify possible changes to the process and policy
78
Survey Results - Challenges
bull Application Timing Insufficient time given to complete all the required collaboration application preparation and submission
bull Process Consistency Changing rules process and guidelines as the process evolved
bull Data amp Documentation Collection Significant data collection requirements for the pre-application and application including ldquoinformation documentation site plans etcrdquo
bull TimeStaffing Requirements Time required for applicants to collect data and prepare application travel and attend training sessions and understand all Smart Scale material on top of their daily work activities
bull Economic Development Factor Understanding the ED factor along with ldquotrying to estimate future economic benefitrdquo
bull Jurisdictional Equity Ability to compete against other jurisdictions that had other local funding sources
79
Survey Results - Successes
bull VDOTDRPT Staff Assistance VDOT DRPT staff praised for developing and implementing such a comprehensive process in such a short timeframe and subsequent assistance and over-and-beyond helpfulness
bull Smart Scale Outreach and Training VDOTDRPT staff lauded by applicants for provision and helpfulness during Smart Scale outreach and training Several District staff were specifically mentioned by applicants as being especially ldquoeasy to work withrdquo ldquohelpfulrdquo ldquoreassuringrdquo and ldquoquick respondingrdquo
bull Smart Scale Online Application Tool Smart Scale Online Application Tool was ldquouser-friendlyrdquo ldquomaking use of technology for ease of userdquo ldquoeasy-to-followrdquo and ldquothe ability to save work and resume at a later time without losing data or timerdquo
bull Smart Scalersquos Objectivity Best part of Smart Scale is its attempt to ldquolevel the playing fieldrdquo in terms of transportation projects across the State
80
Areas for Improvement Identified by Implementation Team
bull Guidance and Information Sourcesndash Update and improve clarity of Policy Guide and FAQs ndash Add tutorials and include example projects
bull Pre-Application Training and Coordinationndash Start coordination process nowndash Develop ldquoTrain the Trainerrdquo materials on process to ensure consistent guidance
statewidendash Provide clear direction on application requirements and ensure project readiness
before proceeding with applicationndash Require completion of the pre-application form
bull ValidationScreeningndash Define criteria for meeting VTrans needs and project type eligibility
bull Evaluation and Scoringndash Provide better definitions of inputs such as mixed-use land use and economic
development impactsndash Potentially consider tiers of projects based on size ndash so that a turn lane project is not
competing against a mega project
Recommendations to Improve Application Process
bull Update application tool to allow feedback during application submission (pre-screening and validation)
bull Strongly encourage submission of information earlyndash Advance knowledge of the number and types of applicationsndash Key fields of on-line application filled out by August 15th to guarantee technical
assistance from VDOT and DRPT ndash Notice of Intent to Apply
Over half the 321 submitted applications were created the final two weeks
82
Recommendations for Administrative Process
bull Project includes matching funds from other sources then documentation of availability of other funds will be required
bull If project cost at advertisement or award exceeds thresholds in Smart Scale policy then project Smart Scale benefits cost will be re-calculated
bull IF revised benefitscost is higher than lowest scoring funded district project then project moves forward
bull IF revised benefitscost is lower then funds will be de-allocated unless CTB takes action to retain funding on project and address shortfall
83
Recommendations for Factor Areas
bull Environmental Factorndash Projects receiving significant amount of points without providing any other
benefitsbull Determine points by scaling environmental score based on impact to
environment (current methodology) and benefits in other categories
bull Economic Development Site Supportndash Types of projects evaluated do not influence growth over the same
impact areandash In many localities zoning took place 30+ years ago and does not
necessarily have relationship to current growth patternsbull Restrict the distance around certain types of projects where benefits may
be considered ndash buffers by project typebull Eliminate the extra scaling point for having zoning in place
84
Recommendations for Factor Areas
bull Reliabilityndash Buffer Time Index (BTI) comes from INRIX data ndash does not provide
statewide coveragendash For facilities where data does not exist method pulls BTI from other
nearby facilities ndash this approach leads to questionable results on low volume roadways
bull If INRIX BTI data does not exist assume there is no reliability issue and score will be 0
bull Include scaling factor based on vehicle miles traveled ndash to better scale the benefit ndash testing underway
bull Intermodal Accessndash Questionable results when comparing measure scores to project types
specifically with using mainline tonnagebull Refine methodology to adjust tonnage for ramps
85
Recommendations for Factor Areas
bull Safetyndash Fatal and Severe Injury crashes represent about 7 of total crashesndash Some fatal and severe injuries crashes are random and due to factors
unrelated to roadway designbull Look at Fatal and All Injury crashes ndash apply federal EPDO weighting
bull Land Usendash Measure provides points based on projected future density but does not
consider whether there is any growth between today and the futurebull Base score on both future density and the change in density between
today and the future
86
Modification for Scoring Process ndashCorridor-based Transit Improvement
bull Transitndash ChickenEgg problem ndash all VRE platforms must be extended to add new
rail cars to all trains but only final platform extension would receive benefits under current methodology
ndash Example Brooke and Leeland platform extensions by themselves do not allow for longer trains but without those improvements longer trains will never be able to run
bull Analyze full corridor improvement (station + future capacity improvement) and assign benefit score on a pro-rata basisndash If station improvement is 10 of the cost then we take 10 of the ultimate benefit
bull $10000000 platform and station improvement that will facilitate a $90000000 future investment in rolling stock and service expansion We would analyze full improvement then take 10 of Total Benefit Score
87
Recommendations to Improve Application Process
bull Smart Scale on-line application tool undergoing improvements based on feedbackndash Improved logic for applicant eligibilityndash Improved logic for some factor areas (especially Economic Development)
bull Online application tool will be expanded to include other funding programsndash Revenue Sharing Programndash Transportation Alternatives Programndash Highway Safety Improvement Programndash Bicycle-Pedestrian Safety Program
88
Impact of SMART Scale
bull Stronger and more thorough project planningndash Planning before capital improvement program
bull Project Scopes and Estimates ndash focusing scope on problemneeds ndash trimming the fatndash Re-evaluating solutions to problemsndash Evaluate whether identified need can be addressed through
operational improvements or TDMndash Evaluate current scope to determine if there are components that
do not address identified need(s)ndash Evaluate current scope to determine whether design can be
modified or design exceptions utilized to reduce costs
bull Thinking beyond SOVs ndash opportunities for bikeped transit TDM
89
Biennial Cycle
90
Resources
bull Draft Smart Scale Policy Guide and Technical Guide -
httpvasmartscaleorg
bull VTrans
wwwvtransorg
91
QampA
92
THANK YOUA recording of this webinar will be on the SSTI
web site tomorrow
To find out about future SSTI webinars subscribe to our newsletter and follow us on
Twitter wwwsstius
SmartTransp72016 Revolution in project selection Virginia DOT Smart Scale
- Revolution in project selection Virginia DOT Smart Scale
- State Smart Transportation Initiative
- Virginiarsquos Smart Scale Prioritization Process ndash Implementing HB2
- Overview
- Slide Number 5
- Virginiarsquos Statewide Prioritization Process
- Broad-Based Evaluation Factors
- Three Key Goals
- Context for Reform
- Keys to Political Support
- Concerns of State and Local Officials
- Public Engagement is Critical
- Guiding Principles for Measures
- Process Used to Develop Measures
- Reformed Funding Formulas
- Benefits of Smart Scale
- Slide Number 17
- Life Cycle of a Candidate Project
- Slide Number 19
- Slide Number 20
- Slide Number 21
- VTrans - Needs Assessment
- Slide Number 23
- Slide Number 24
- Slide Number 25
- Slide Number 26
- Slide Number 27
- Slide Number 28
- How do they submit an application
- Slide Number 30
- Slide Number 31
- Slide Number 32
- Slide Number 33
- Validation Process
- Screening Process
- Slide Number 36
- SMART Scale Factors
- Factor AreasGoals that guided measure development
- Measuring SAFETY
- Safety - How
- Measuring CONGESTION MITIGATION
- Congestion ndash HowPerson Throughput
- Congestion ndash HowPerson Hours of Delay
- Congestion ndash HowAdjusting Volume to Capacity
- Measuring ACCESSIBILITY
- Accessibility - HowAccess to Jobs
- Accessibility - HowAccess to Jobs
- Accessibility - HowAccess to Jobs
- Accessibility - HowAccess to Jobs
- Accessibility - HowAccess to Jobs
- Accessibility - HowAccess to Jobs
- Accessibility - HowAccess to Jobs
- Disadvantaged Access to Jobs
- Accessibility - HowAccess to Travel Options
- Measuring ENVIRONMENTAL QUALITY
- Environment ndash HowAir Quality and Energy
- Environment ndash HowNaturalCultural Resource Impact
- Environment ndash HowNaturalCultural Resource Impact
- Environment ndash HowNaturalCultural Resource Impact
- Measuring ECONOMIC DEVELOPMENT
- Economic Development ndash HowDevelopment Supported
- Slide Number 62
- Economic Development ndash HowIntermodal Access
- Measuring LAND USE
- Land Use ndash HowLocalRegional Land Use Policies
- How Scoring Works
- Everything is Relative
- Slide Number 68
- Slide Number 69
- How will cost affectthe HB2 score
- Slide Number 71
- Summary of Applications Received
- Summary of Applications
- Funds Available for Smart Scale(in millions)
- Round 1 Results
- Lessons Learned
- Areas for Improvement Identified by External Review Group
- Smart Scale Lessons Learned
- Survey Results - Challenges
- Survey Results - Successes
- Areas for Improvement Identified by Implementation Team
- Recommendations to Improve Application Process
- Recommendations for Administrative Process
- Recommendations for Factor Areas
- Recommendations for Factor Areas
- Recommendations for Factor Areas
- Modification for Scoring Process ndash Corridor-based Transit Improvement
- Recommendations to Improve Application Process
- Impact of SMART Scale
- Biennial Cycle
- Resources
- Slide Number 92
- Slide Number 93
-
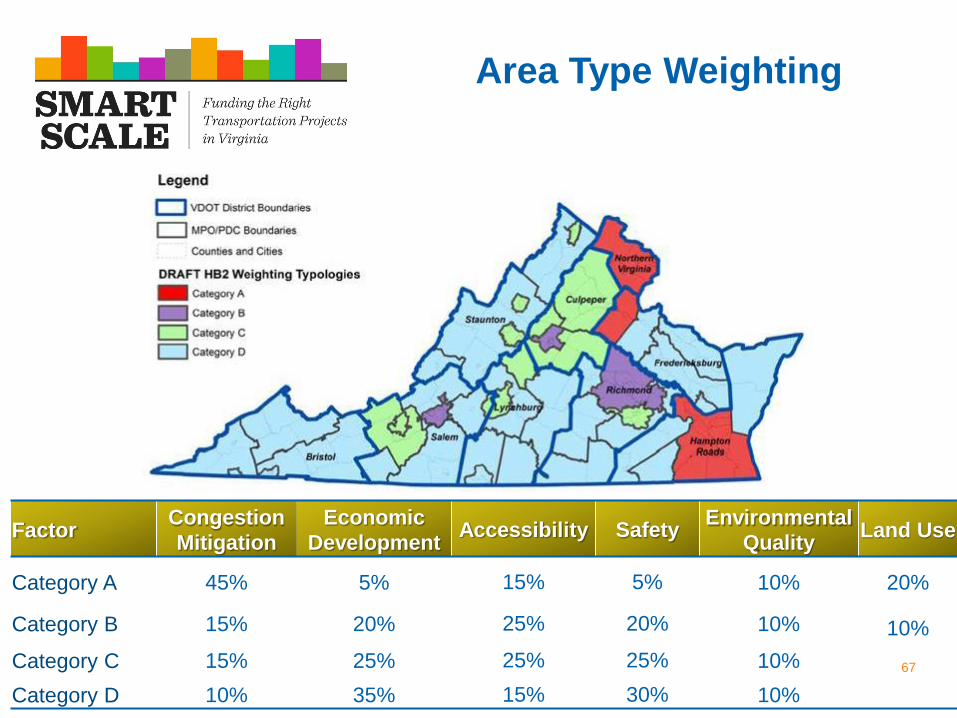

69
How will cost affectthe HB2 score
bull House Bill 2 requires that benefits produced by a project be analyzed on a basis of relative costs
bull Results to be provided to CTB based onbull Benefits relative to HB2 costs
bull Benefits relative to Total costs
Benefit ScoreCost
69
Round 1 Summary and Lessons Learned
70
71
Summary of Applications Received
bull 321 applications submitted
bull 131 entities submitted at least one application
bull Requested $695 billion in Smart Scale funds
bull Applications include other funding equal to $62 billion
bull 287 projects advanced through validation and screening to measures development and scoring
72
Summary of Applications
District Apps Requested $Billions
Total Cost $ Billions
Bristol 32 $022 $023Culpeper 17 $031 $032Fredericksburg 22 $037 $045 Hampton Roads 45 $186 $466Lynchburg 38 $020 $023NOVA 46 $211 $519Richmond 54 $077 $085Salem 38 $070 $080Staunton 29 $040 $044Grand Total 321 $695 $1317
73
Funds Available for Smart Scale
(in millions)
HB 1887 Grant Programs Percentage Round 1 TotalDistrict Grant Program
Bristol 70 $622Culpeper 62 $549Fredericksburg 69 $605Hampton Roads 202 $1780Lynchburg 71 $631Northern Virginia 207 $1831Richmond 144 $1274Salem 96 $849Staunton 78 $689
High Priority ProjectsProgram (Statewide) $8331
Total 1000 $17162
74
$32 B Total Cost all Projects
Round 1 Results
$- $200 $400 $600
HPP and DGP Funds
HPP DPG
0
1000
2000
BR CU FR HR LY NO RI SA ST
Smart Scale $ vs Total $
Total Cost SmartScale Cost
Avg Score Smart Scale Cost 107
1011
19
21
2319
22
20
18
Number of Projects By District
BristolCulpeperFredericksburgHampton RoadsLynchburgNorthern VARichmondSalemStaunton
163 Total
75
Lessons Learned
bull Conducted Key Lessons Learned Activities
bull External Review Groupndash Review of measures development and scores
bull Internal and External Stakeholder Surveysndash Surveys focused on application in-take process screening and validation
bull Implementation Team Workshops (included OIPI DRPT VDOT staff)
ndash Workshops focused on all aspects of process
76
Areas for Improvement Identified by External Review Group
bull Consider approach to scale cost to avoid bias of low cost projects
bull Consider modifications to accessibility measure to include non-work accessibility
bull Provide additional feedback to applicants to improve application quality in future rounds
bull Process was transparent and a great deal of information was made available to facilitate understanding
77
Smart Scale Lessons Learned
bull Two stakeholder surveys were conducted in December 2015January 2016 focusing on the application intake screening and validation processesbull External Survey for Applicants and Sponsors received 114 responsesbull Internal Survey for VDOT and DRPT staff received 84 responses
bull Internal workshop with VDPTDRPT staff involved in Smart Scale process
bull Feedback helps us improve the process and better understand what worked and what didnrsquot work
bull As a result of the lessons learned identify possible changes to the process and policy
78
Survey Results - Challenges
bull Application Timing Insufficient time given to complete all the required collaboration application preparation and submission
bull Process Consistency Changing rules process and guidelines as the process evolved
bull Data amp Documentation Collection Significant data collection requirements for the pre-application and application including ldquoinformation documentation site plans etcrdquo
bull TimeStaffing Requirements Time required for applicants to collect data and prepare application travel and attend training sessions and understand all Smart Scale material on top of their daily work activities
bull Economic Development Factor Understanding the ED factor along with ldquotrying to estimate future economic benefitrdquo
bull Jurisdictional Equity Ability to compete against other jurisdictions that had other local funding sources
79
Survey Results - Successes
bull VDOTDRPT Staff Assistance VDOT DRPT staff praised for developing and implementing such a comprehensive process in such a short timeframe and subsequent assistance and over-and-beyond helpfulness
bull Smart Scale Outreach and Training VDOTDRPT staff lauded by applicants for provision and helpfulness during Smart Scale outreach and training Several District staff were specifically mentioned by applicants as being especially ldquoeasy to work withrdquo ldquohelpfulrdquo ldquoreassuringrdquo and ldquoquick respondingrdquo
bull Smart Scale Online Application Tool Smart Scale Online Application Tool was ldquouser-friendlyrdquo ldquomaking use of technology for ease of userdquo ldquoeasy-to-followrdquo and ldquothe ability to save work and resume at a later time without losing data or timerdquo
bull Smart Scalersquos Objectivity Best part of Smart Scale is its attempt to ldquolevel the playing fieldrdquo in terms of transportation projects across the State
80
Areas for Improvement Identified by Implementation Team
bull Guidance and Information Sourcesndash Update and improve clarity of Policy Guide and FAQs ndash Add tutorials and include example projects
bull Pre-Application Training and Coordinationndash Start coordination process nowndash Develop ldquoTrain the Trainerrdquo materials on process to ensure consistent guidance
statewidendash Provide clear direction on application requirements and ensure project readiness
before proceeding with applicationndash Require completion of the pre-application form
bull ValidationScreeningndash Define criteria for meeting VTrans needs and project type eligibility
bull Evaluation and Scoringndash Provide better definitions of inputs such as mixed-use land use and economic
development impactsndash Potentially consider tiers of projects based on size ndash so that a turn lane project is not
competing against a mega project
Recommendations to Improve Application Process
bull Update application tool to allow feedback during application submission (pre-screening and validation)
bull Strongly encourage submission of information earlyndash Advance knowledge of the number and types of applicationsndash Key fields of on-line application filled out by August 15th to guarantee technical
assistance from VDOT and DRPT ndash Notice of Intent to Apply
Over half the 321 submitted applications were created the final two weeks
82
Recommendations for Administrative Process
bull Project includes matching funds from other sources then documentation of availability of other funds will be required
bull If project cost at advertisement or award exceeds thresholds in Smart Scale policy then project Smart Scale benefits cost will be re-calculated
bull IF revised benefitscost is higher than lowest scoring funded district project then project moves forward
bull IF revised benefitscost is lower then funds will be de-allocated unless CTB takes action to retain funding on project and address shortfall
83
Recommendations for Factor Areas
bull Environmental Factorndash Projects receiving significant amount of points without providing any other
benefitsbull Determine points by scaling environmental score based on impact to
environment (current methodology) and benefits in other categories
bull Economic Development Site Supportndash Types of projects evaluated do not influence growth over the same
impact areandash In many localities zoning took place 30+ years ago and does not
necessarily have relationship to current growth patternsbull Restrict the distance around certain types of projects where benefits may
be considered ndash buffers by project typebull Eliminate the extra scaling point for having zoning in place
84
Recommendations for Factor Areas
bull Reliabilityndash Buffer Time Index (BTI) comes from INRIX data ndash does not provide
statewide coveragendash For facilities where data does not exist method pulls BTI from other
nearby facilities ndash this approach leads to questionable results on low volume roadways
bull If INRIX BTI data does not exist assume there is no reliability issue and score will be 0
bull Include scaling factor based on vehicle miles traveled ndash to better scale the benefit ndash testing underway
bull Intermodal Accessndash Questionable results when comparing measure scores to project types
specifically with using mainline tonnagebull Refine methodology to adjust tonnage for ramps
85
Recommendations for Factor Areas
bull Safetyndash Fatal and Severe Injury crashes represent about 7 of total crashesndash Some fatal and severe injuries crashes are random and due to factors
unrelated to roadway designbull Look at Fatal and All Injury crashes ndash apply federal EPDO weighting
bull Land Usendash Measure provides points based on projected future density but does not
consider whether there is any growth between today and the futurebull Base score on both future density and the change in density between
today and the future
86
Modification for Scoring Process ndashCorridor-based Transit Improvement
bull Transitndash ChickenEgg problem ndash all VRE platforms must be extended to add new
rail cars to all trains but only final platform extension would receive benefits under current methodology
ndash Example Brooke and Leeland platform extensions by themselves do not allow for longer trains but without those improvements longer trains will never be able to run
bull Analyze full corridor improvement (station + future capacity improvement) and assign benefit score on a pro-rata basisndash If station improvement is 10 of the cost then we take 10 of the ultimate benefit
bull $10000000 platform and station improvement that will facilitate a $90000000 future investment in rolling stock and service expansion We would analyze full improvement then take 10 of Total Benefit Score
87
Recommendations to Improve Application Process
bull Smart Scale on-line application tool undergoing improvements based on feedbackndash Improved logic for applicant eligibilityndash Improved logic for some factor areas (especially Economic Development)
bull Online application tool will be expanded to include other funding programsndash Revenue Sharing Programndash Transportation Alternatives Programndash Highway Safety Improvement Programndash Bicycle-Pedestrian Safety Program
88
Impact of SMART Scale
bull Stronger and more thorough project planningndash Planning before capital improvement program
bull Project Scopes and Estimates ndash focusing scope on problemneeds ndash trimming the fatndash Re-evaluating solutions to problemsndash Evaluate whether identified need can be addressed through
operational improvements or TDMndash Evaluate current scope to determine if there are components that
do not address identified need(s)ndash Evaluate current scope to determine whether design can be
modified or design exceptions utilized to reduce costs
bull Thinking beyond SOVs ndash opportunities for bikeped transit TDM
89
Biennial Cycle
90
Resources
bull Draft Smart Scale Policy Guide and Technical Guide -
httpvasmartscaleorg
bull VTrans
wwwvtransorg
91
QampA
92
THANK YOUA recording of this webinar will be on the SSTI
web site tomorrow
To find out about future SSTI webinars subscribe to our newsletter and follow us on
Twitter wwwsstius
SmartTransp72016 Revolution in project selection Virginia DOT Smart Scale
- Revolution in project selection Virginia DOT Smart Scale
- State Smart Transportation Initiative
- Virginiarsquos Smart Scale Prioritization Process ndash Implementing HB2
- Overview
- Slide Number 5
- Virginiarsquos Statewide Prioritization Process
- Broad-Based Evaluation Factors
- Three Key Goals
- Context for Reform
- Keys to Political Support
- Concerns of State and Local Officials
- Public Engagement is Critical
- Guiding Principles for Measures
- Process Used to Develop Measures
- Reformed Funding Formulas
- Benefits of Smart Scale
- Slide Number 17
- Life Cycle of a Candidate Project
- Slide Number 19
- Slide Number 20
- Slide Number 21
- VTrans - Needs Assessment
- Slide Number 23
- Slide Number 24
- Slide Number 25
- Slide Number 26
- Slide Number 27
- Slide Number 28
- How do they submit an application
- Slide Number 30
- Slide Number 31
- Slide Number 32
- Slide Number 33
- Validation Process
- Screening Process
- Slide Number 36
- SMART Scale Factors
- Factor AreasGoals that guided measure development
- Measuring SAFETY
- Safety - How
- Measuring CONGESTION MITIGATION
- Congestion ndash HowPerson Throughput
- Congestion ndash HowPerson Hours of Delay
- Congestion ndash HowAdjusting Volume to Capacity
- Measuring ACCESSIBILITY
- Accessibility - HowAccess to Jobs
- Accessibility - HowAccess to Jobs
- Accessibility - HowAccess to Jobs
- Accessibility - HowAccess to Jobs
- Accessibility - HowAccess to Jobs
- Accessibility - HowAccess to Jobs
- Accessibility - HowAccess to Jobs
- Disadvantaged Access to Jobs
- Accessibility - HowAccess to Travel Options
- Measuring ENVIRONMENTAL QUALITY
- Environment ndash HowAir Quality and Energy
- Environment ndash HowNaturalCultural Resource Impact
- Environment ndash HowNaturalCultural Resource Impact
- Environment ndash HowNaturalCultural Resource Impact
- Measuring ECONOMIC DEVELOPMENT
- Economic Development ndash HowDevelopment Supported
- Slide Number 62
- Economic Development ndash HowIntermodal Access
- Measuring LAND USE
- Land Use ndash HowLocalRegional Land Use Policies
- How Scoring Works
- Everything is Relative
- Slide Number 68
- Slide Number 69
- How will cost affectthe HB2 score
- Slide Number 71
- Summary of Applications Received
- Summary of Applications
- Funds Available for Smart Scale(in millions)
- Round 1 Results
- Lessons Learned
- Areas for Improvement Identified by External Review Group
- Smart Scale Lessons Learned
- Survey Results - Challenges
- Survey Results - Successes
- Areas for Improvement Identified by Implementation Team
- Recommendations to Improve Application Process
- Recommendations for Administrative Process
- Recommendations for Factor Areas
- Recommendations for Factor Areas
- Recommendations for Factor Areas
- Modification for Scoring Process ndash Corridor-based Transit Improvement
- Recommendations to Improve Application Process
- Impact of SMART Scale
- Biennial Cycle
- Resources
- Slide Number 92
- Slide Number 93
-
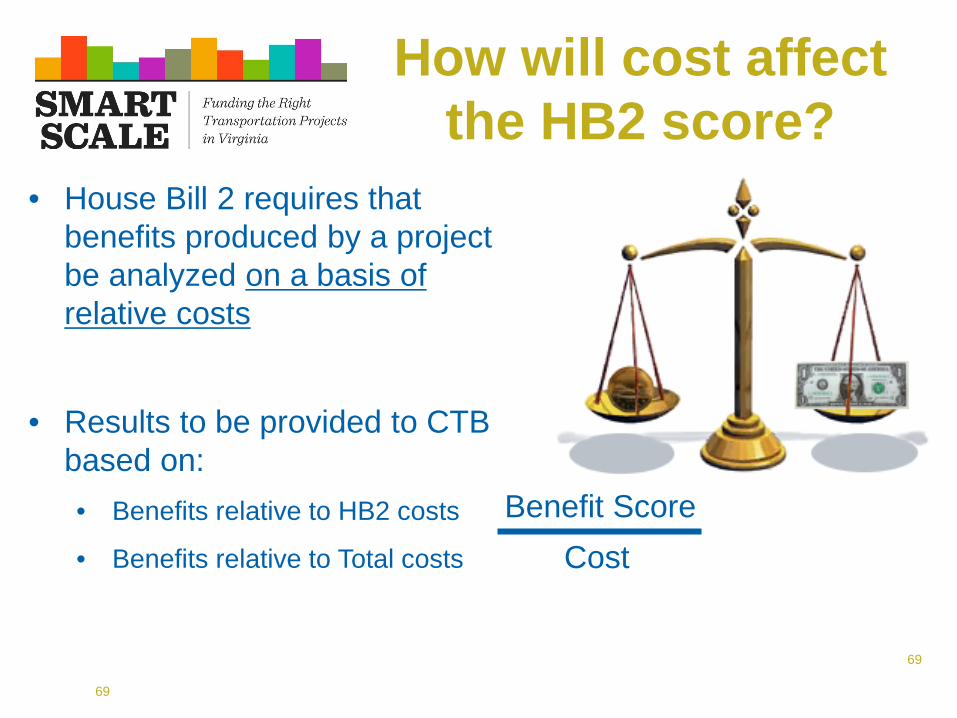
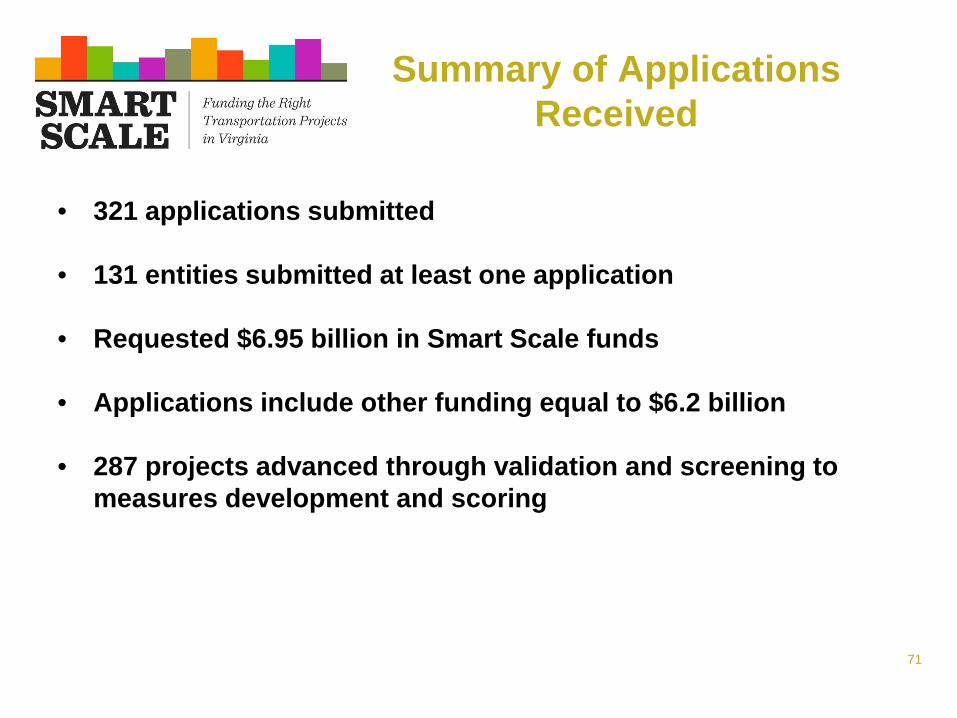
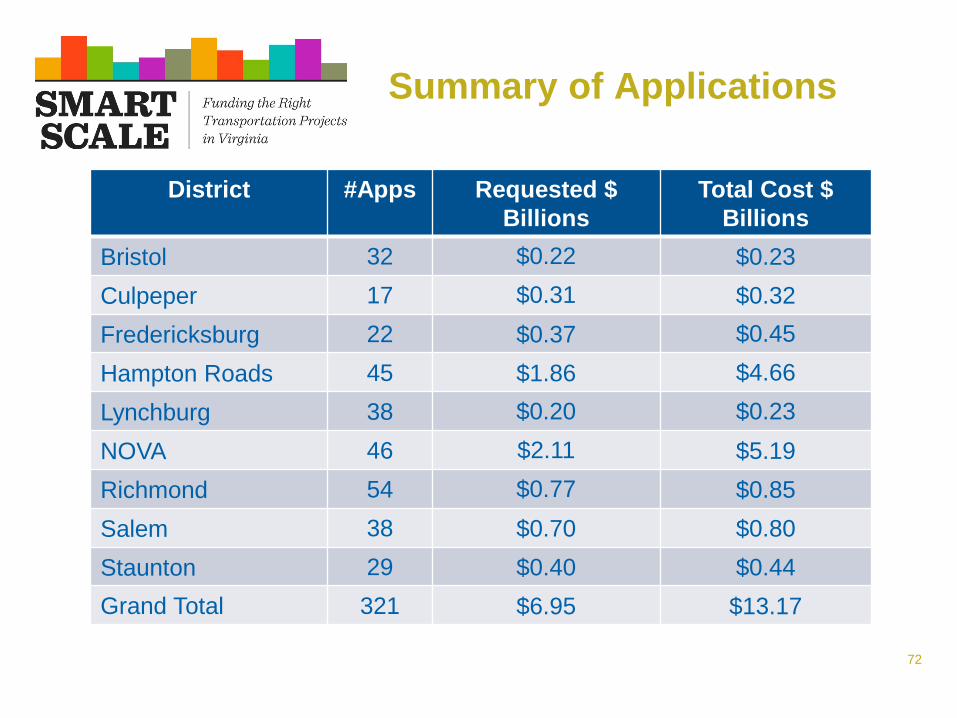
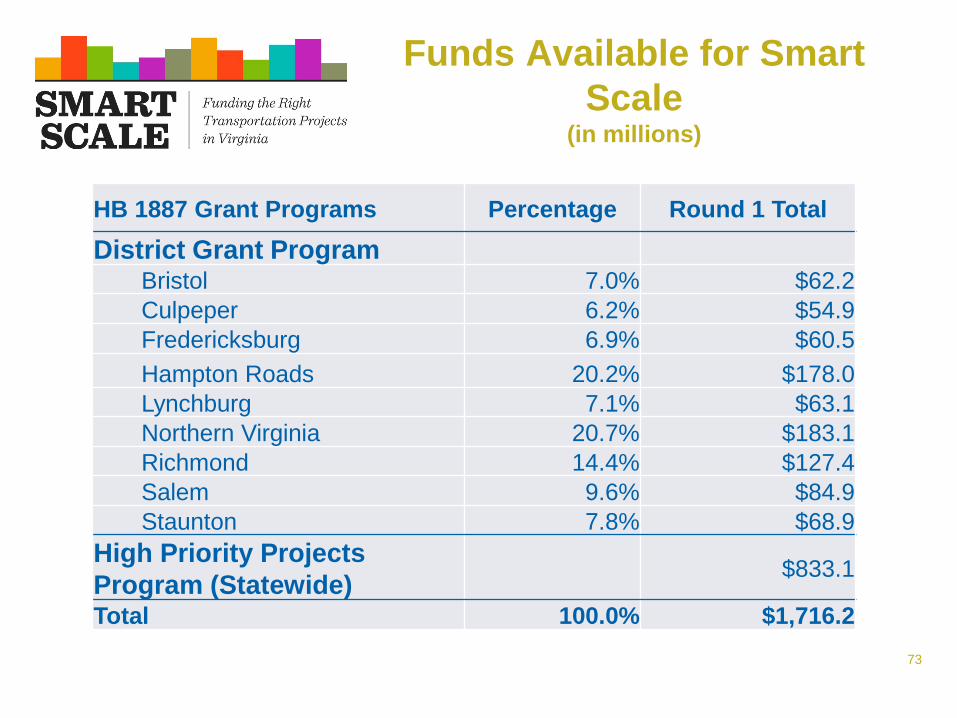
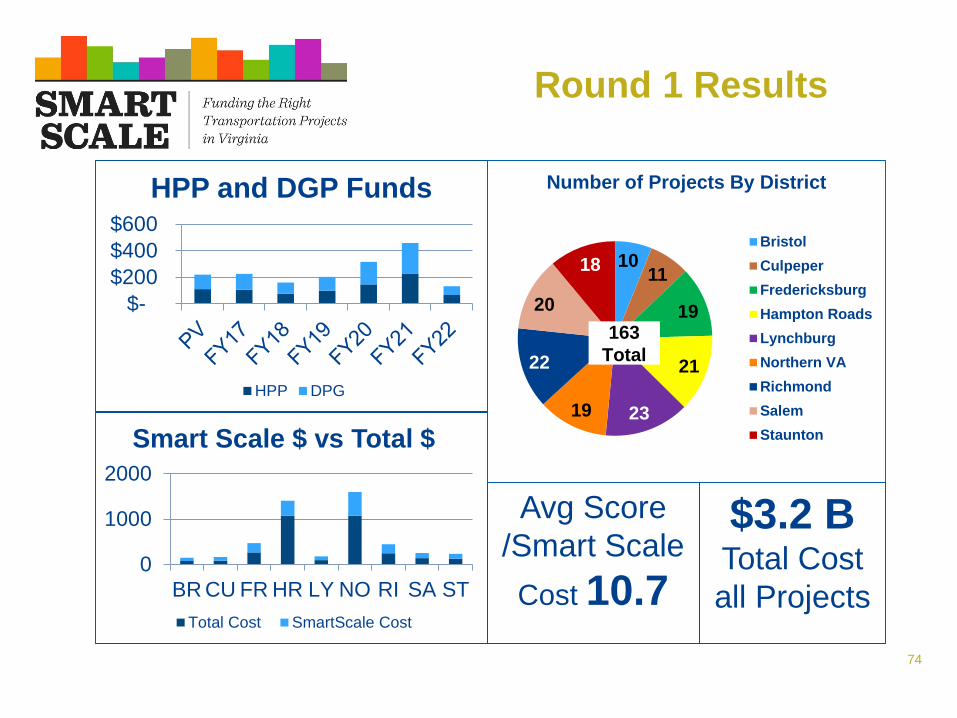
Recommendations to Improve Application Process
bull Update application tool to allow feedback during application submission (pre-screening and validation)
bull Strongly encourage submission of information earlyndash Advance knowledge of the number and types of applicationsndash Key fields of on-line application filled out by August 15th to guarantee technical
assistance from VDOT and DRPT ndash Notice of Intent to Apply
Over half the 321 submitted applications were created the final two weeks
82
Recommendations for Administrative Process
bull Project includes matching funds from other sources then documentation of availability of other funds will be required
bull If project cost at advertisement or award exceeds thresholds in Smart Scale policy then project Smart Scale benefits cost will be re-calculated
bull IF revised benefitscost is higher than lowest scoring funded district project then project moves forward
bull IF revised benefitscost is lower then funds will be de-allocated unless CTB takes action to retain funding on project and address shortfall
83
Recommendations for Factor Areas
bull Environmental Factorndash Projects receiving significant amount of points without providing any other
benefitsbull Determine points by scaling environmental score based on impact to
environment (current methodology) and benefits in other categories
bull Economic Development Site Supportndash Types of projects evaluated do not influence growth over the same
impact areandash In many localities zoning took place 30+ years ago and does not
necessarily have relationship to current growth patternsbull Restrict the distance around certain types of projects where benefits may
be considered ndash buffers by project typebull Eliminate the extra scaling point for having zoning in place
84
Recommendations for Factor Areas
bull Reliabilityndash Buffer Time Index (BTI) comes from INRIX data ndash does not provide
statewide coveragendash For facilities where data does not exist method pulls BTI from other
nearby facilities ndash this approach leads to questionable results on low volume roadways
bull If INRIX BTI data does not exist assume there is no reliability issue and score will be 0
bull Include scaling factor based on vehicle miles traveled ndash to better scale the benefit ndash testing underway
bull Intermodal Accessndash Questionable results when comparing measure scores to project types
specifically with using mainline tonnagebull Refine methodology to adjust tonnage for ramps
85
Recommendations for Factor Areas
bull Safetyndash Fatal and Severe Injury crashes represent about 7 of total crashesndash Some fatal and severe injuries crashes are random and due to factors
unrelated to roadway designbull Look at Fatal and All Injury crashes ndash apply federal EPDO weighting
bull Land Usendash Measure provides points based on projected future density but does not
consider whether there is any growth between today and the futurebull Base score on both future density and the change in density between
today and the future
86
Modification for Scoring Process ndashCorridor-based Transit Improvement
bull Transitndash ChickenEgg problem ndash all VRE platforms must be extended to add new
rail cars to all trains but only final platform extension would receive benefits under current methodology
ndash Example Brooke and Leeland platform extensions by themselves do not allow for longer trains but without those improvements longer trains will never be able to run
bull Analyze full corridor improvement (station + future capacity improvement) and assign benefit score on a pro-rata basisndash If station improvement is 10 of the cost then we take 10 of the ultimate benefit
bull $10000000 platform and station improvement that will facilitate a $90000000 future investment in rolling stock and service expansion We would analyze full improvement then take 10 of Total Benefit Score
87
Recommendations to Improve Application Process
bull Smart Scale on-line application tool undergoing improvements based on feedbackndash Improved logic for applicant eligibilityndash Improved logic for some factor areas (especially Economic Development)
bull Online application tool will be expanded to include other funding programsndash Revenue Sharing Programndash Transportation Alternatives Programndash Highway Safety Improvement Programndash Bicycle-Pedestrian Safety Program
88
Impact of SMART Scale
bull Stronger and more thorough project planningndash Planning before capital improvement program
bull Project Scopes and Estimates ndash focusing scope on problemneeds ndash trimming the fatndash Re-evaluating solutions to problemsndash Evaluate whether identified need can be addressed through
operational improvements or TDMndash Evaluate current scope to determine if there are components that
do not address identified need(s)ndash Evaluate current scope to determine whether design can be
modified or design exceptions utilized to reduce costs
bull Thinking beyond SOVs ndash opportunities for bikeped transit TDM
89
Biennial Cycle
90
Resources
bull Draft Smart Scale Policy Guide and Technical Guide -
httpvasmartscaleorg
bull VTrans
wwwvtransorg
91
QampA
92
THANK YOUA recording of this webinar will be on the SSTI
web site tomorrow
To find out about future SSTI webinars subscribe to our newsletter and follow us on
Twitter wwwsstius
SmartTransp72016 Revolution in project selection Virginia DOT Smart Scale
- Revolution in project selection Virginia DOT Smart Scale
- State Smart Transportation Initiative
- Virginiarsquos Smart Scale Prioritization Process ndash Implementing HB2
- Overview
- Slide Number 5
- Virginiarsquos Statewide Prioritization Process
- Broad-Based Evaluation Factors
- Three Key Goals
- Context for Reform
- Keys to Political Support
- Concerns of State and Local Officials
- Public Engagement is Critical
- Guiding Principles for Measures
- Process Used to Develop Measures
- Reformed Funding Formulas
- Benefits of Smart Scale
- Slide Number 17
- Life Cycle of a Candidate Project
- Slide Number 19
- Slide Number 20
- Slide Number 21
- VTrans - Needs Assessment
- Slide Number 23
- Slide Number 24
- Slide Number 25
- Slide Number 26
- Slide Number 27
- Slide Number 28
- How do they submit an application
- Slide Number 30
- Slide Number 31
- Slide Number 32
- Slide Number 33
- Validation Process
- Screening Process
- Slide Number 36
- SMART Scale Factors
- Factor AreasGoals that guided measure development
- Measuring SAFETY
- Safety - How
- Measuring CONGESTION MITIGATION
- Congestion ndash HowPerson Throughput
- Congestion ndash HowPerson Hours of Delay
- Congestion ndash HowAdjusting Volume to Capacity
- Measuring ACCESSIBILITY
- Accessibility - HowAccess to Jobs
- Accessibility - HowAccess to Jobs
- Accessibility - HowAccess to Jobs
- Accessibility - HowAccess to Jobs
- Accessibility - HowAccess to Jobs
- Accessibility - HowAccess to Jobs
- Accessibility - HowAccess to Jobs
- Disadvantaged Access to Jobs
- Accessibility - HowAccess to Travel Options
- Measuring ENVIRONMENTAL QUALITY
- Environment ndash HowAir Quality and Energy
- Environment ndash HowNaturalCultural Resource Impact
- Environment ndash HowNaturalCultural Resource Impact
- Environment ndash HowNaturalCultural Resource Impact
- Measuring ECONOMIC DEVELOPMENT
- Economic Development ndash HowDevelopment Supported
- Slide Number 62
- Economic Development ndash HowIntermodal Access
- Measuring LAND USE
- Land Use ndash HowLocalRegional Land Use Policies
- How Scoring Works
- Everything is Relative
- Slide Number 68
- Slide Number 69
- How will cost affectthe HB2 score
- Slide Number 71
- Summary of Applications Received
- Summary of Applications
- Funds Available for Smart Scale(in millions)
- Round 1 Results
- Lessons Learned
- Areas for Improvement Identified by External Review Group
- Smart Scale Lessons Learned
- Survey Results - Challenges
- Survey Results - Successes
- Areas for Improvement Identified by Implementation Team
- Recommendations to Improve Application Process
- Recommendations for Administrative Process
- Recommendations for Factor Areas
- Recommendations for Factor Areas
- Recommendations for Factor Areas
- Modification for Scoring Process ndash Corridor-based Transit Improvement
- Recommendations to Improve Application Process
- Impact of SMART Scale
- Biennial Cycle
- Resources
- Slide Number 92
- Slide Number 93
-
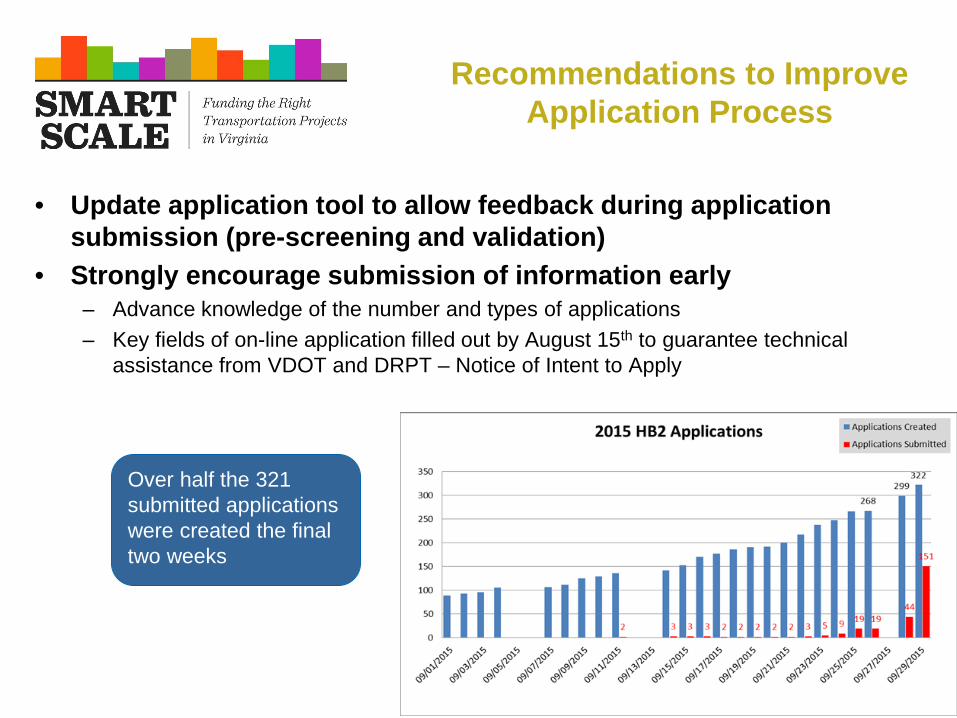
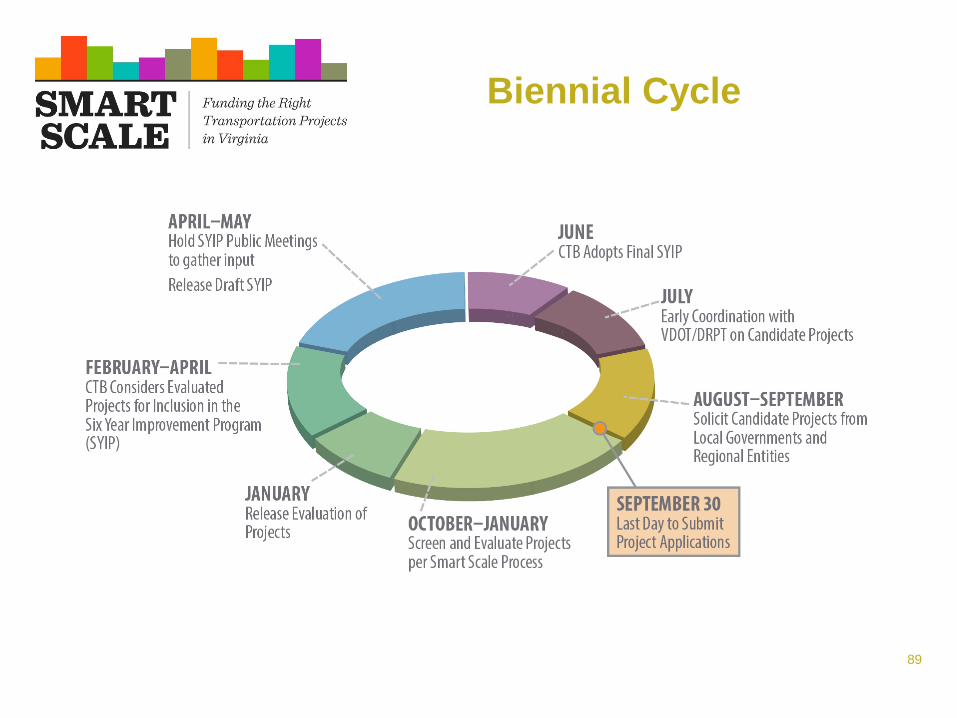