rf and microwave basics. objective: to familiarize test engineers with various terms and definitions...
TRANSCRIPT

RF and Microwave Basics

RF and Microwave Basics
Objective:
To familiarize test engineers with various terms anddefinitions related to testing RF and microwavecomponents. To define common tests performed on these devices and show some common test programs which use this information.

RF and Microwave Basics
What is RF ( Radio Frequency )?
RF is defined as a frequency range within whichradio waves may be transmitted, from about 10KHzto 300MHz.
What is Microwave ?
The term Microwave Frequencies is generally usedfor those wavelengths measured in centimeters,roughly from 30 cm to 1 mm. ( 1 to 300GHz )


RF and Microwave Basics

RF and Microwave Basics

RF and Microwave Basics
What is a transmission line ?
The term transmission line means a media by which a signal or power transferred from one point to another.
Two conductors form a transmission line. Between thesetwo conductors E and H fields are formed. There areseveral types of transmission lines, these include:
microstrip striplinecoax twin-leadslotline waveguide

RF and Microwave Basics

RF material
Waveguide
Coaxial cable
MicroStrip Line

RF and Microwave Basics

RF and Microwave Basics

RF and Microwave Basics
At lower frequencies, V and I can be considered equal at all points along the transmission line since the wavelength is much greater than the length of the transmission line. With respect to frequencies in the RF and Microwave bands, the reactive characteristics ( L,C ) of the trans-mission line model will dominate the voltage and current along the transmission line.
This is referred to as“Traveling Waves” and at higherfrequencies special considerations must be made.

RF and Microwave Basics

RF and Microwave Basics

RF and Microwave Basics

RF and Microwave Basics
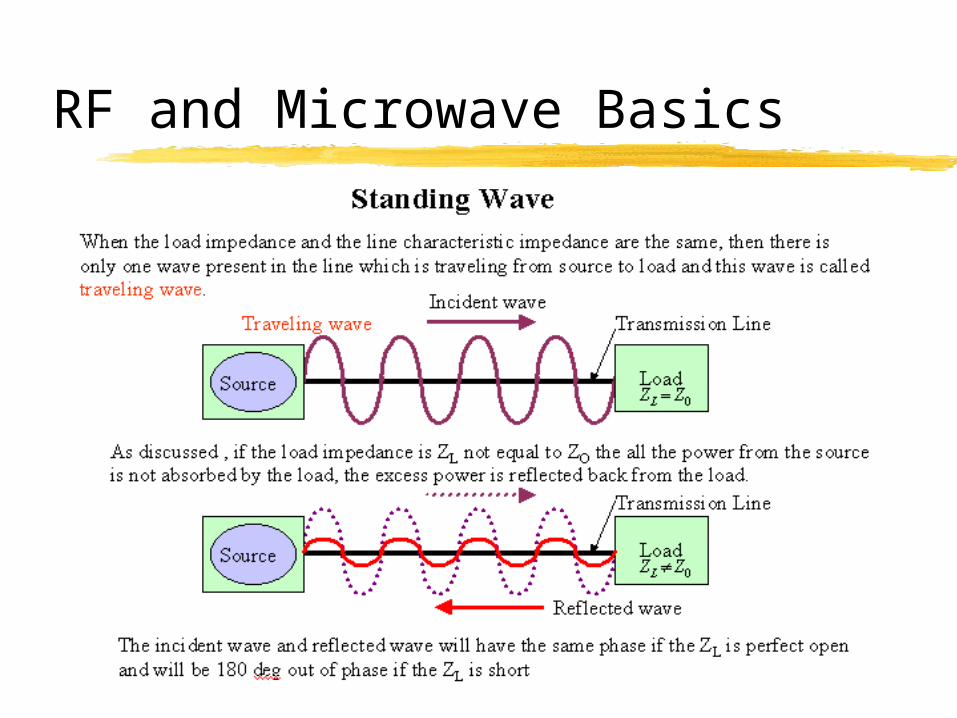
The same concept is applied to Energy traveling on Transmissionlines. If a transmission line is not terminated in the matching Zo,some of the incident energy is reflected back towards the sourcecausing a standing wave.
This reflected energy can be measured and the exact value of the load can be determined. The ratio of the reflected to incident energy is referred to as Gamma or the reflection coefficient. Gamma is a vector with both real and imaginary components.

RF and Microwave Basics
RF and Microwave Basics

RF and Microwave Basics

RF and Microwave Basics
RF and Microwave Basics

RF and Microwave Basics

RF and Microwave Basics

RF and Microwave Basics
RF and Microwave Basics

RF and Microwave Basics

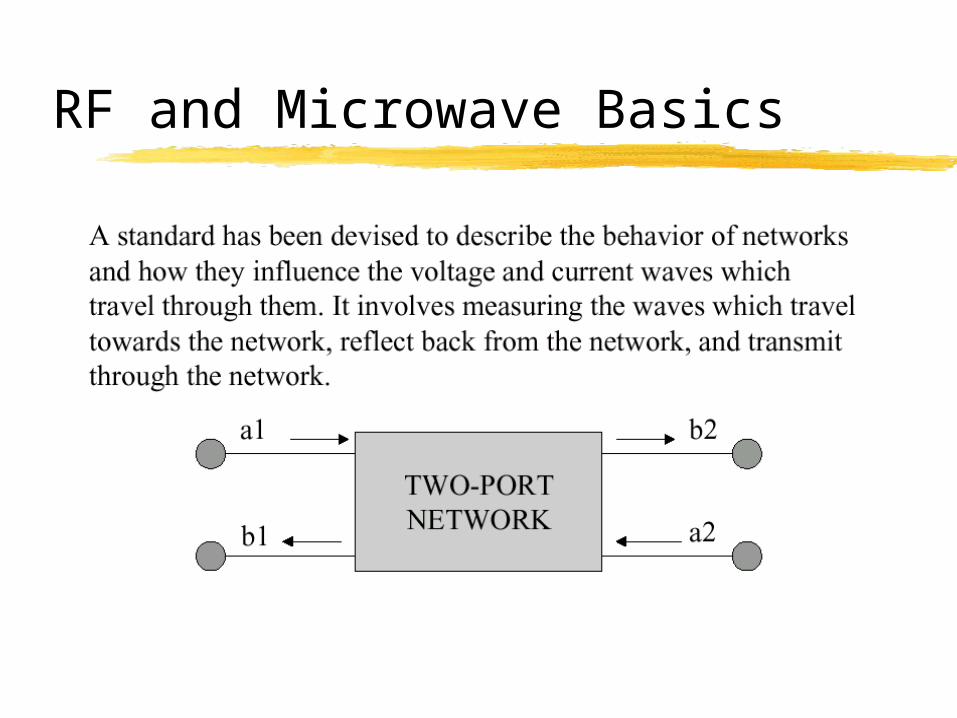
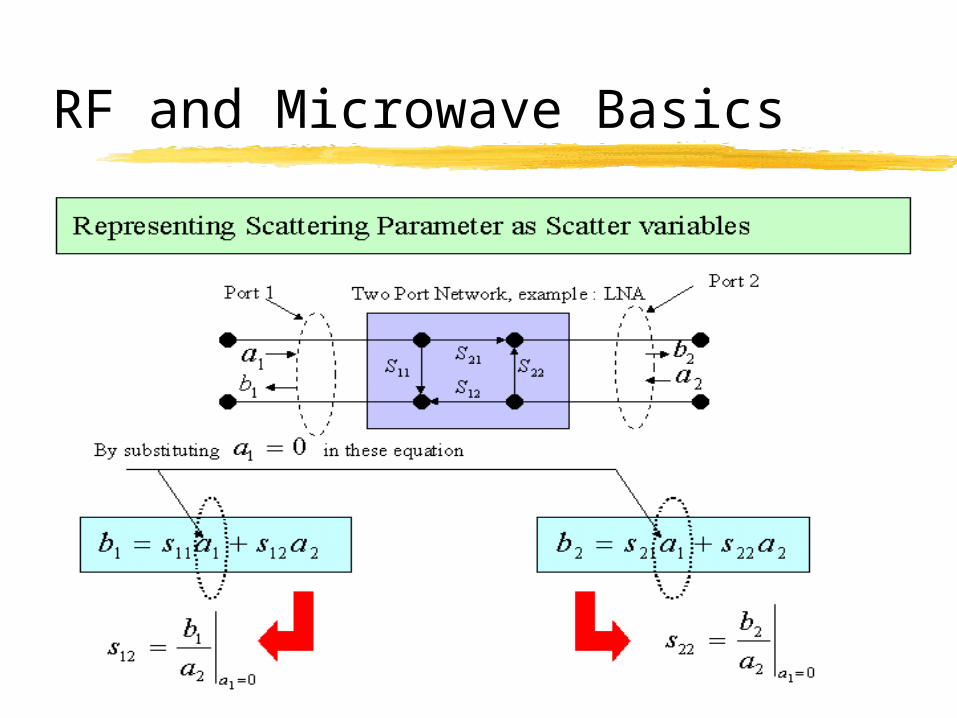
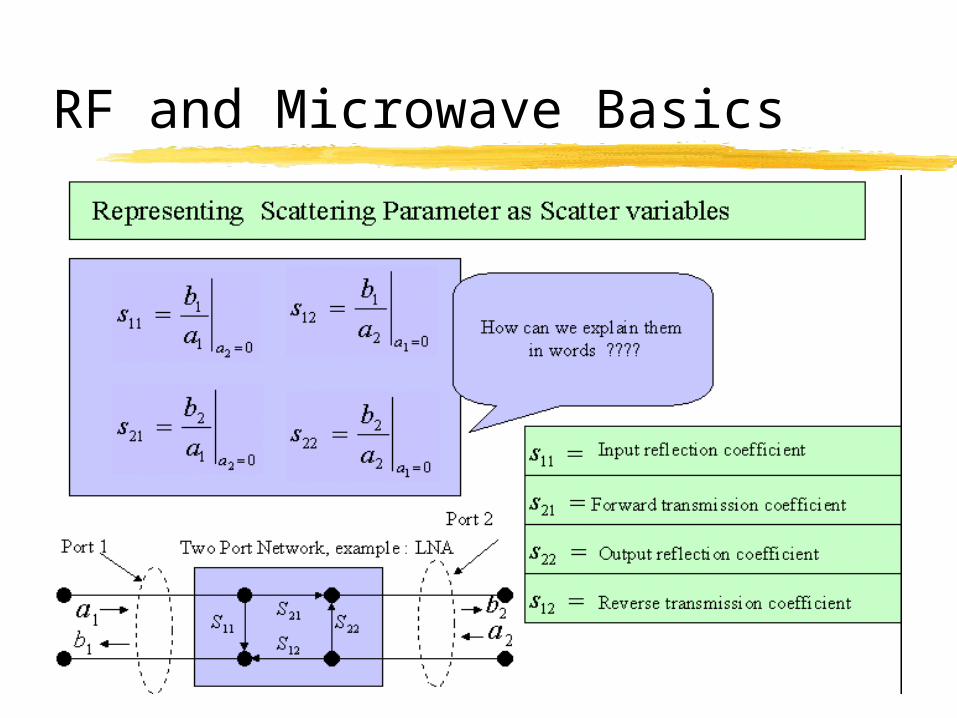
Scattering Parameter (S-parameter)
RF and Microwave Basics

RF and Microwave Basics
Units of Measure: Decibel (dB)
The Decibel is a logarithmic unit of measure originatedto quantify sound loudness. The use of dB allows fora wider range of values on a smaller scale and simplifiesmathematics by replacing multiplication and divisionwith addition and subtraction.
dBm Most microwave measurements are power measure- ments dBm is a reference to 1.0 mW and is used in 50 Ohms measurement systems.

RF and Microwave Basics

RF and Microwave Basics

RF and Microwave Basics
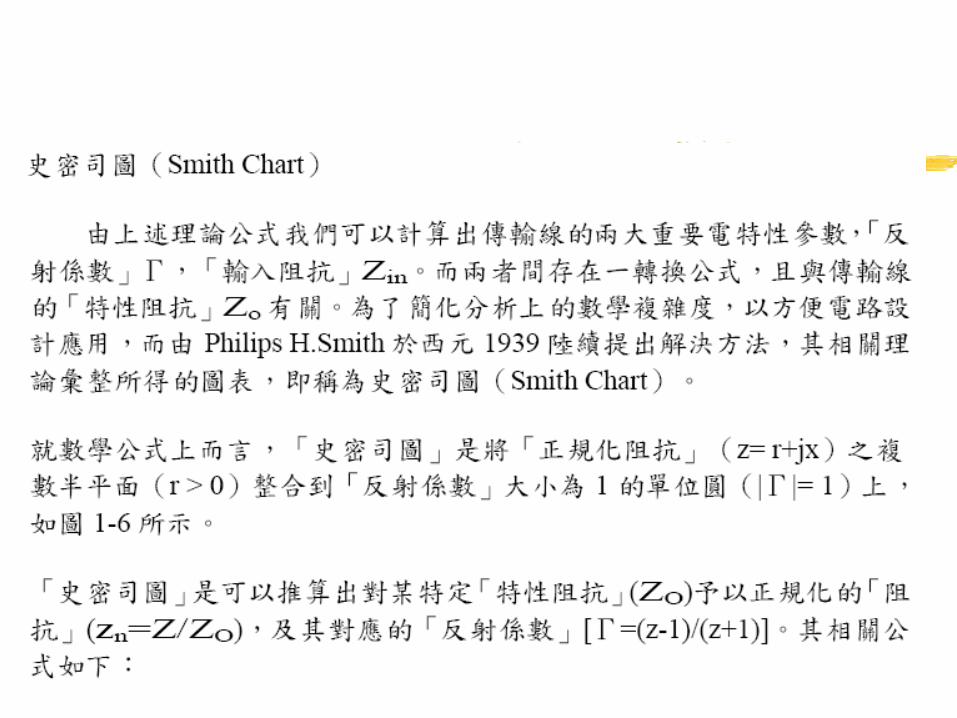

Smith ChartsWhy do we use Smith Charts for?
- To help us solve lengthy complex equations graphically on the chart.- To reduce the possible errors encountered during manual calculations.- Helps to match a given source to a specified load using graphical approach.
0

Smith ChartsHow do we interpret a Smith
Chart? Components of the Smith Chart:
- A family of circles - Constant resistance circles.- A family of arc of circles - Constant reactance circles.

Constant resistance circles
0.1 1.2 4.02.01.00.60.3 10.0 0
Note: Diagram not drawn to scale.

Constant reactance circles
X=0
Inductive Reactance
Capacitive Reactance
+jX
-jX
1.2
10
-0.5
0.8
0.1
0.3
3
-10
-3
-1.2-0.8
0.5
-0.3
-0.1
Note: Diagram not drawn to scale.

Combining the previous 2 charts
0
We have our Smith Chart!
Note: Diagram not drawn to scale.

Other components of the Smith Chart:- Translating impedance to reflection coefficient, .
where Z0 is defined as the characteristic impedance of the transmission medium.
0
0
ZZ
ZZ
Smith Charts

can be represented on the Smith Chart as a polar form, with magnitude and phase.
Smith Charts
1800
900
-900
00
Note: Diagram not drawn to scale.
0.8
0.30
0
0
6.997.0
18.03.0
18.03.0
j
j
ZZ
ZZ
+ Degrees
- Degrees

The center of the chart will be Z0=50 if the characteristic impedance is based on 50. At this point (Z=50), = 0.
Smith Charts
0
50Z Zand 0 00
Note: Diagram not drawn to scale.

Smith Charts
0
impedance, NormalizedZ
Zz
Note: Diagram not drawn to scale.
Smith Chart that is not normalized. Smith Chart that is normalized.
1jz
Z Z
1jz
1z
75jZ
75jZ
75Z0Z0Z

Smith Charts
Note: Diagram not drawn to scale.
The Admittance Smith Chart is a mirror image of the Impedance Smith Chart.
Impedance Smith Chart Admittance Smith Chart
0
Mirror
0
Capacitive +jCapacitive -j
Inductive -jInductive +j

0
Note: Diagram not drawn to scale.
Smith Charts
00
1Y and
1
ZZY
The admittance Smith Chart will take on the following parameters:
Where Y represents the admittance and it contains both real and imaginary parts.
jBGY G is the conductance in mhos and
B is the susceptance in mhos.
YY
YY
0
0

0
Note: Diagram not drawn to scale.
Smith ChartsManipulating impedance on the Smith Chart
1.2
0.90.6
-0.8
0.61.2j
1.2j 0.6 -2.0j
0.6 -0.8j
By moving downwards along the constant resistance circle in an counter-clockwise direction, we are adding a series capacitive reactance of -2j ohm to the original RL circuit of 0.6+1.2j. The resulting circuit is a RC circuit.
Adding a Series Capacitor

0
Note: Diagram not drawn to scale.
Smith ChartsManipulating impedance on the Smith Chart
1.2
0.90.6
-0.80.6 -0.8j
By moving upwards along the constant resistance circle in an clockwise direction, we are adding a series inductive reactance of +2j ohm to the original RC circuit of 0.6-0.8j. The resulting circuit is a RL circuit.
0.6 -0.8j +2j
0.61.2j
Adding a Series Inductor

Note: Diagram not drawn to scale.
Smith ChartsManipulating impedance on the Smith Chart
By moving downwards along the constant resistance circle in an clockwise direction, we are adding a parallel capacitive reactance of +1j ohm to the original RL parallel circuit of 0.1-0.5j. The resulting circuit is a RC parallel circuit.
Note that this is a Admittance Smith Chart.
Adding a Parallel Capacitor
0.1
-0.5j
0
-0.5
+0.5
0.1
-0.5j 0.1 +1j+0.5j
0.1

Smith ChartsManipulating impedance on the Smith Chart
By moving upwards along the constant resistance circle in an counter-clockwise direction, we are adding a parallel inductive reactance of -1j ohm to the original RL parallel circuit of 0.1+0.5j. The resulting circuit is a RL parallel circuit.
Note that this is a Admittance Smith Chart.
Adding a Parallel Inductor
0.1
+0.5j
+0.5j
0.1
0
-0.5
+0.5
0.1
-1j-0.5j 0.1
Smith Charts
Note: Diagram not drawn to scale.
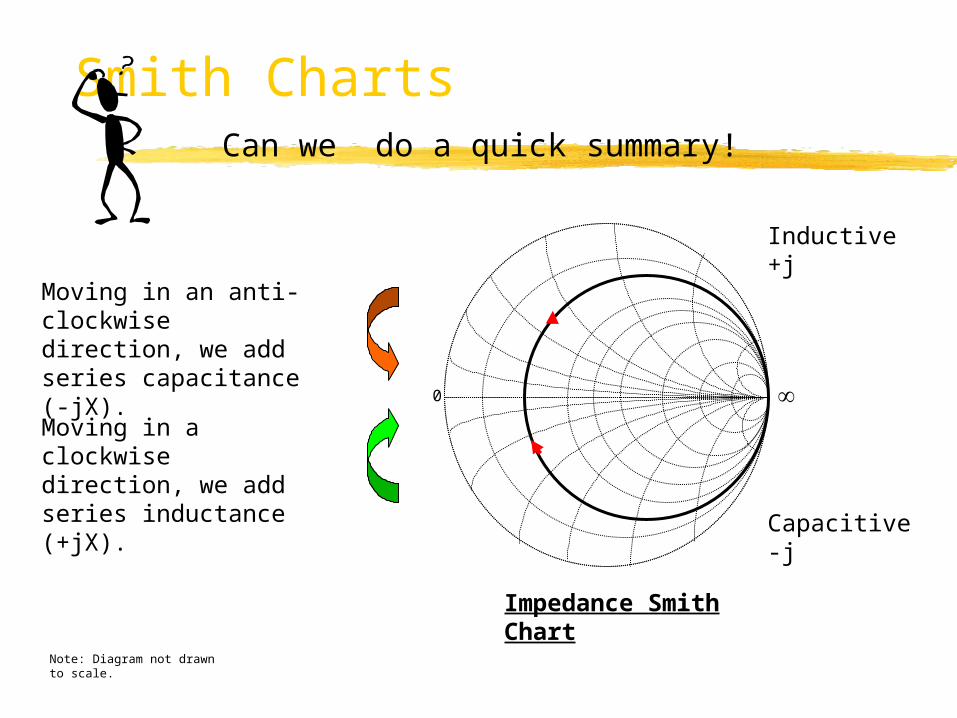
Can we do a quick summary!
0
Moving in an anti-clockwise direction, we add series capacitance (-jX).
Moving in a clockwise direction, we add series inductance (+jX).
Inductive +j
Capacitive -j
Impedance Smith Chart

Smith Charts
Note: Diagram not drawn to scale.
Moving in a clockwise direction, we add parallel capacitance (+jX).
Moving in an anti-clockwise direction, we add parallel inductance (-jX).
Inductive -j
Capacitive +j
Admittance Smith Chart
0


Smith ChartsTeradyne Smith Chart Display

RF Mixers, Synthesizers, LNAs, and Prescalars (900MHz & 1.9 GHz) Wireless LAN Chipset (2.4GHz) GSM IQ Transceiver (900MHz) Prescaler/Charge Pump (900Mhz & 1.9GHz) DECT Chipset (1.9GHz) LNA/Mixer/VCO (900MHz) Modulation Synthesizer Single chip RFID (2.4GHz) GPS Chipset (1.6GHz) IQ Modulator/Demodulator w/Digital BaseBand
Common Device Tested in ATE

RF and Microwave Basics

RF and Microwave Basics

RF and Microwave Basics

RF and Microwave Basics

RF and Microwave Basics

RF System
