rf design for wireless communications
TRANSCRIPT

Radio Frequency Design to Support Software Transceiver for
Wireless Communications
Author: Cazzie WilliamsWestern Michigan University
Whirlpool CorporationAdvisor/Sponsor:
Dr. Frank Severance and Dr. Bradley J. BazuinWestern Michigan University,
Dept. of Electrical and Computer Engineering

27 October, 2001 MSGC 2001 2
Presentation OverviewIntroductionProject Description
Need and ApplicationGoals and Benefits
Detailed DesignReceiverTransmitter
Test Results/ConclusionsAcknowledgmentsQuestions
27 October, 2001 MSGC 2001 3
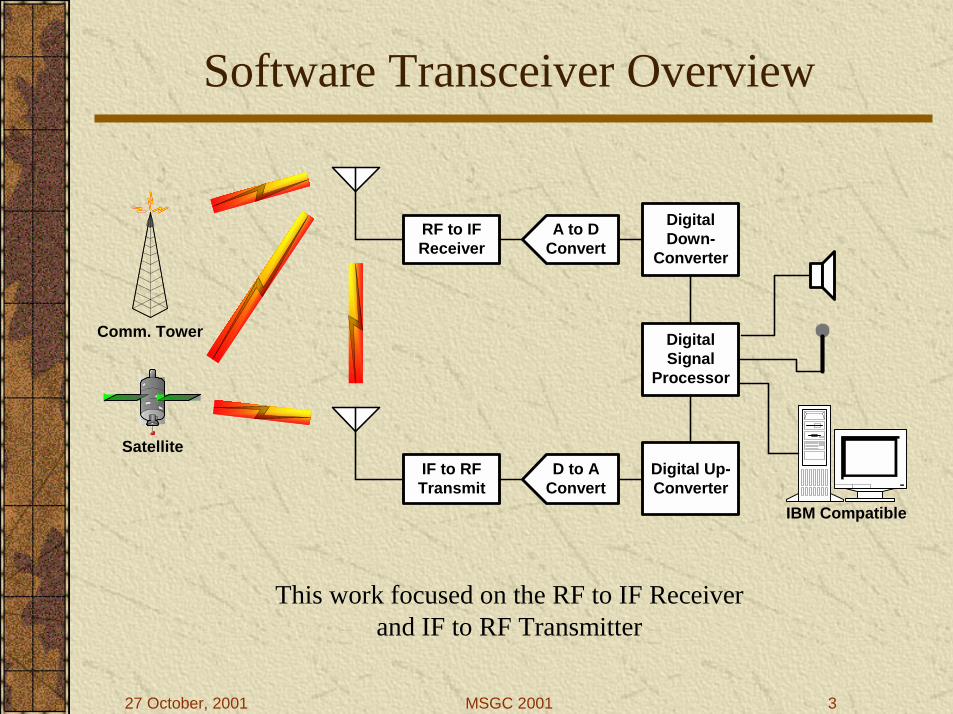
Software Transceiver Overview
This work focused on the RF to IF Receiver and IF to RF Transmitter
IBM Compatible
RF to IFReceiver
A to DConvert
DigitalDown-
Converter
DigitalSignal
Processor
Digital Up-Converter
D to AConvert
IF to RFTransmit
Comm. Tower
Satellite
27 October, 2001 MSGC 2001 4
Project Description
! The complete project goals were to define, design, develop, and demonstrate a flexible, electrical and software programmable transceiver (FEAST) for wireless communications.
! The receiver path collects, downconverts and filters radio frequency (RF) energy to an intermediate frequency (IF). The IF is digitally sampled, digitally filtered and downconverted, and then processed in a programmable digital signal processor (pDSP). Audio or data outputs may be provided.
! The transmitter path inputs audio or digital data to the pDSP. The pDSP processes the information before it is digitally upconverted and filtered into a digital IF. The digital IF is converted into analog and then filtered and upconverted to the desired RF band for transmission.

27 October, 2001 MSGC 2001 5
Needs and Applications
• Provide critical radio frequency (RF) to intermediate frequency (IF) translation.
• RF in the Instrumentation, Scientific, and Measurement (ISM) band (902-928 MHz)
• ADC/DAC IFs designed for 64 Msamples-per-sec, 16 MHz center frequency, 26 MHz bandwidth. Tested using 50 Msps, 12.5 MHz center frequency and 26 MHz (aliased) BW.
• Provide a useful dynamic range for signals and a low noise figure to
• Define and provide signal gain to load, not saturate, the ADC
• Define a low noise figure architecture to provide high dynamic range and high sensitivity to weak RF signals.

27 October, 2001 MSGC 2001 6
Stages of a Receiver
H P F
IFF ilter
L P F
902M hz to 928M hz
D to
AC
onve
rt
F s/2
H P F
LP F
S yn th esizer
F c = 915M hz
F ixedL ocal
O scilla to r
F c = 140M hzF c = 140M hz
F c = 788M hz
F c =152.5M hz
F c = 12 .5M hz
F c = 12 .5M hz
F c = 152 .5M hz

27 October, 2001 MSGC 2001 7
RF Receiver
LO Input to RFMixer7 dBm
IF Filter
LO
6
LowpassFilter Amp
7 8
IF to BB Converter Antialiasing
InputRF Waveform
Outputto ADC
-3 dBmAttenuatorLO Input to RF Mixer
7 dBm
LO output to RF Mixer10 dBm
Amp
5
IF Filter
43
SignalGenerator
RF to IF Converter
Amp
2
Pre-selector
1
Component List Type Company Make Model or Part Number1 High Pass Filter Mini-Curcuits SHP 4002 Low Noice Amplier (LNA) Mini-Curcuits ZFL 1000HLN3 Mixer Mini-Curcuits ZFM 5X4 IF Filter (BPF) SAWTEK 8549235 Amplier Mini-Curcuits ZFL 5006 Mixer Mini-Curcuits ZFM 37 Low Pass Filter Mini-Curcuits SLP 308 Amplier Mini-Curcuits ZFL 5009 Voltage Oscillator (VCO) Mini-Circuits ZOS 200
10 Signal Generator HP 8656A
Chart of the Components in RF-to-IF Converter
27 October, 2001 MSGC 2001 8
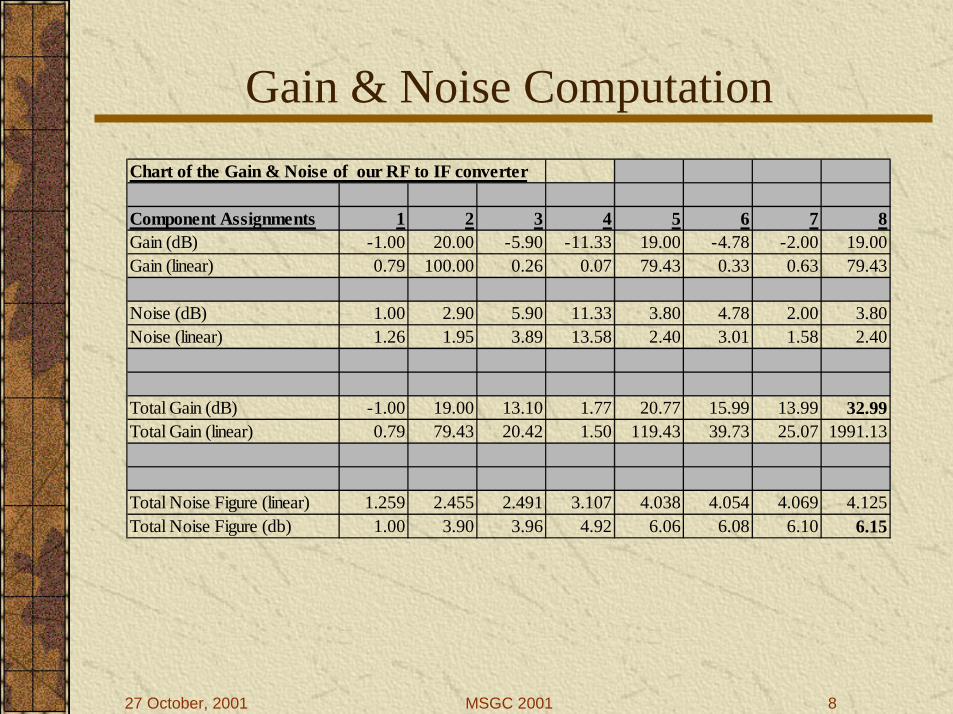
Gain & Noise ComputationChart of the Gain & Noise of our RF to IF converter
Component Assignments 1 2 3 4 5 6 7 8Gain (dB) -1.00 20.00 -5.90 -11.33 19.00 -4.78 -2.00 19.00Gain (linear) 0.79 100.00 0.26 0.07 79.43 0.33 0.63 79.43
Noise (dB) 1.00 2.90 5.90 11.33 3.80 4.78 2.00 3.80Noise (linear) 1.26 1.95 3.89 13.58 2.40 3.01 1.58 2.40
Total Gain (dB) -1.00 19.00 13.10 1.77 20.77 15.99 13.99 32.99Total Gain (linear) 0.79 79.43 20.42 1.50 119.43 39.73 25.07 1991.13
Total Noise Figure (linear) 1.259 2.455 2.491 3.107 4.038 4.054 4.069 4.125Total Noise Figure (db) 1.00 3.90 3.96 4.92 6.06 6.08 6.10 6.15
27 October, 2001 MSGC 2001 9
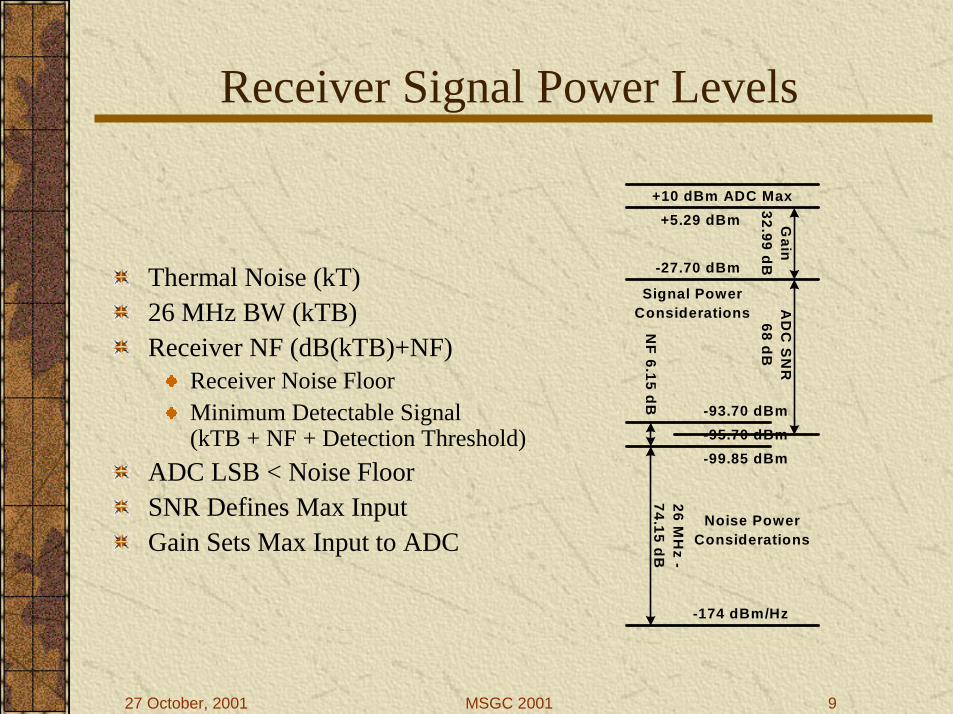
Receiver Signal Power Levels
Thermal Noise (kT)26 MHz BW (kTB)Receiver NF (dB(kTB)+NF)
Receiver Noise FloorMinimum Detectable Signal(kTB + NF + Detection Threshold)
ADC LSB < Noise FloorSNR Defines Max InputGain Sets Max Input to ADC
-174 dBm/Hz
-99.85 dBm
+10 dBm ADC Max
-27.70 dBm
-95.70 dBm
26 MH
z -74.15 dB
Gain
32.99 dBA
DC
SN
R68 dB
-93.70 dBm
NF 6.15 dB
Noise PowerConsiderations
+5.29 dBm
Signal PowerConsiderations
27 October, 2001 MSGC 2001 10
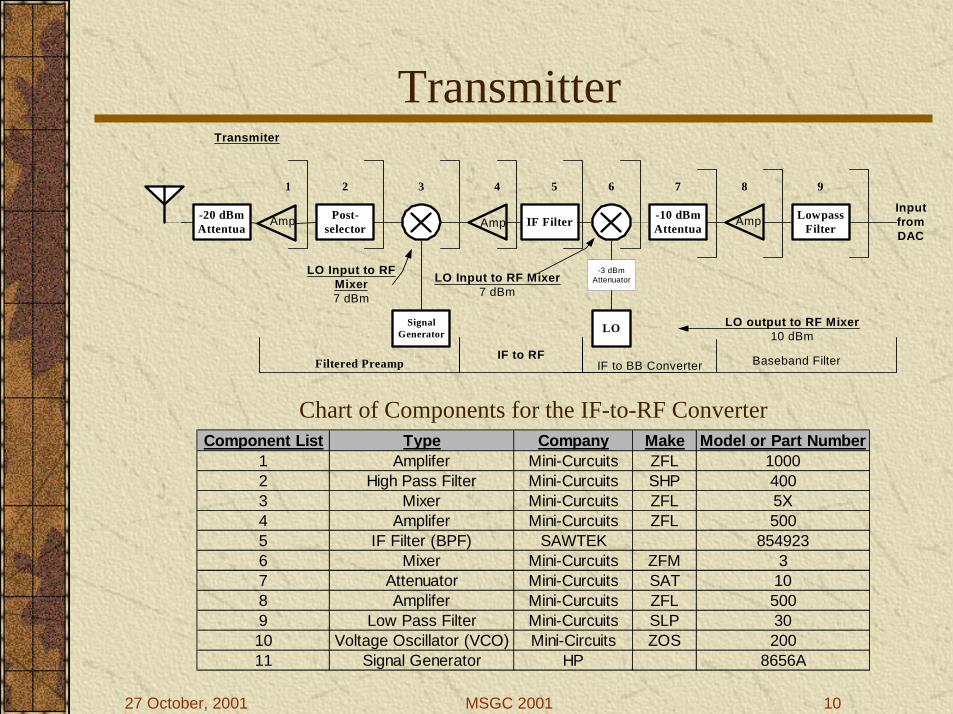
Transmitter
InputfromDAC
LO Input to RFMixer7 dBm
IF to RF
LO
6
-10 dBmAttentua
7 8
-3 dBmAttenuatorLO Input to RF Mixer
7 dBm
LO output to RF Mixer10 dBm
5
IF Filter
43
SignalGenerator
Filtered Preamp
21
AmpAmp Post-selector
LowpassFilter
9
Amp
Transmiter
IF to BB Converter Baseband Filter
-20 dBmAttentua
Component List Type Company Make Model or Part Number1 Amplifer Mini-Curcuits ZFL 10002 High Pass Filter Mini-Curcuits SHP 4003 Mixer Mini-Curcuits ZFL 5X4 Amplifer Mini-Curcuits ZFL 5005 IF Filter (BPF) SAWTEK 8549236 Mixer Mini-Curcuits ZFM 37 Attenuator Mini-Curcuits SAT 108 Amplifer Mini-Curcuits ZFL 5009 Low Pass Filter Mini-Curcuits SLP 3010 Voltage Oscillator (VCO) Mini-Circuits ZOS 20011 Signal Generator HP 8656A
Chart of Components for the IF-to-RF Converter
27 October, 2001 MSGC 2001 11
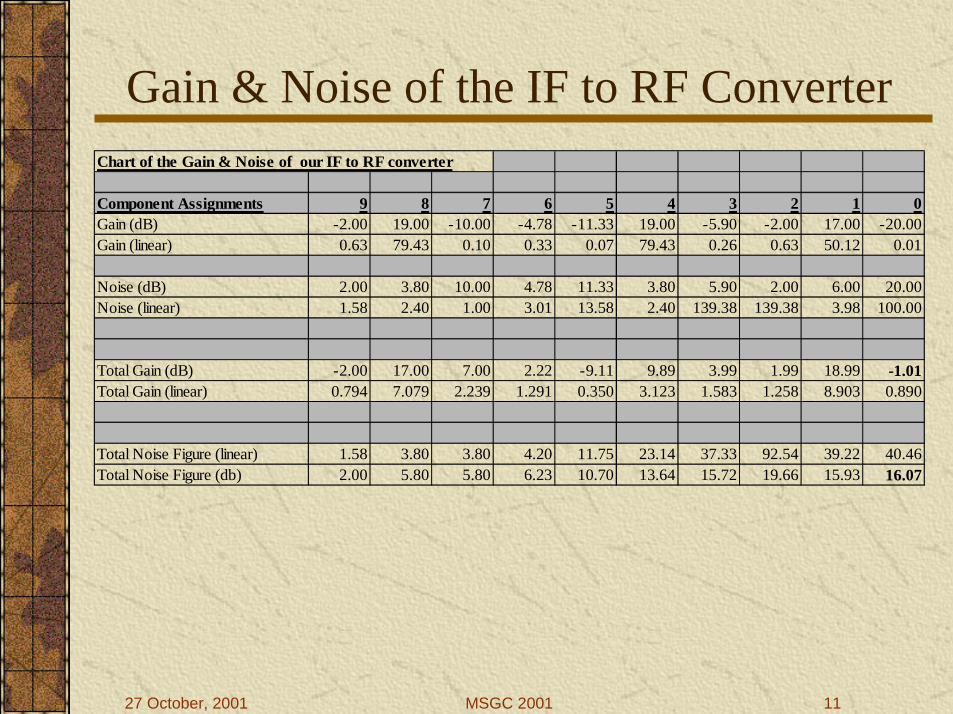
Gain & Noise of the IF to RF ConverterChart of the Gain & Noise of our IF to RF converter
Component Assignments 9 8 7 6 5 4 3 2 1 0Gain (dB) -2.00 19.00 -10.00 -4.78 -11.33 19.00 -5.90 -2.00 17.00 -20.00Gain (linear) 0.63 79.43 0.10 0.33 0.07 79.43 0.26 0.63 50.12 0.01
Noise (dB) 2.00 3.80 10.00 4.78 11.33 3.80 5.90 2.00 6.00 20.00Noise (linear) 1.58 2.40 1.00 3.01 13.58 2.40 139.38 139.38 3.98 100.00
Total Gain (dB) -2.00 17.00 7.00 2.22 -9.11 9.89 3.99 1.99 18.99 -1.01Total Gain (linear) 0.794 7.079 2.239 1.291 0.350 3.123 1.583 1.258 8.903 0.890
Total Noise Figure (linear) 1.58 3.80 3.80 4.20 11.75 23.14 37.33 92.54 39.22 40.46Total Noise Figure (db) 2.00 5.80 5.80 6.23 10.70 13.64 15.72 19.66 15.93 16.07
27 October, 2001 MSGC 2001 12
Test Plan
In order to test the validity of the system, it is planned to execute a series of operational tests based on the following capabilities:
• Continuous Wave (CW) Tests
• Amplitude Demodulation (AM)
• Frequency Demodulation (FM)
27 October, 2001 MSGC 2001 13
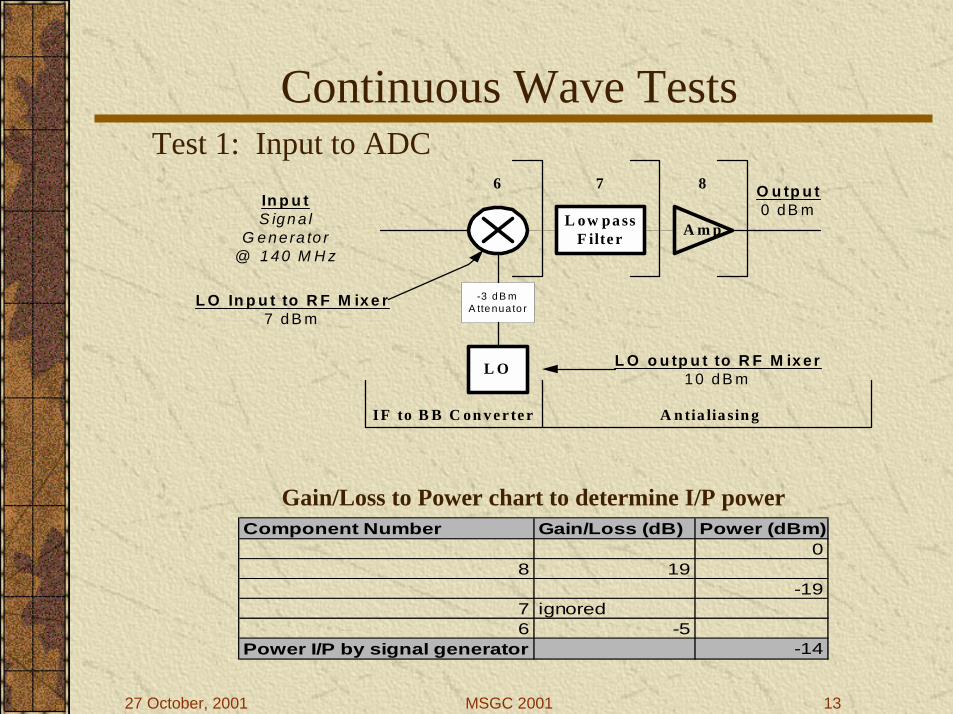
Continuous Wave TestsTest 1: Input to ADC
L O
6
L ow pa ssF ilter A m p
7 8
IF to B B C on v er ter A n tia lia sin g
In p u tS ign a l
G e ne ra to r@ 140 M H z
O u tp u t0 dB m
-3 d B mA tte nua to rL O In p u t to R F M ix e r
7 d B m
L O o u tp u t to R F M ix er10 d B m
Component Number Gain/Loss (dB) Power (dBm)0
8 19-19
7 ignored6 -5
Power I/P by signal generator -14
Gain/Loss to Power chart to determine I/P power
27 October, 2001 MSGC 2001 14
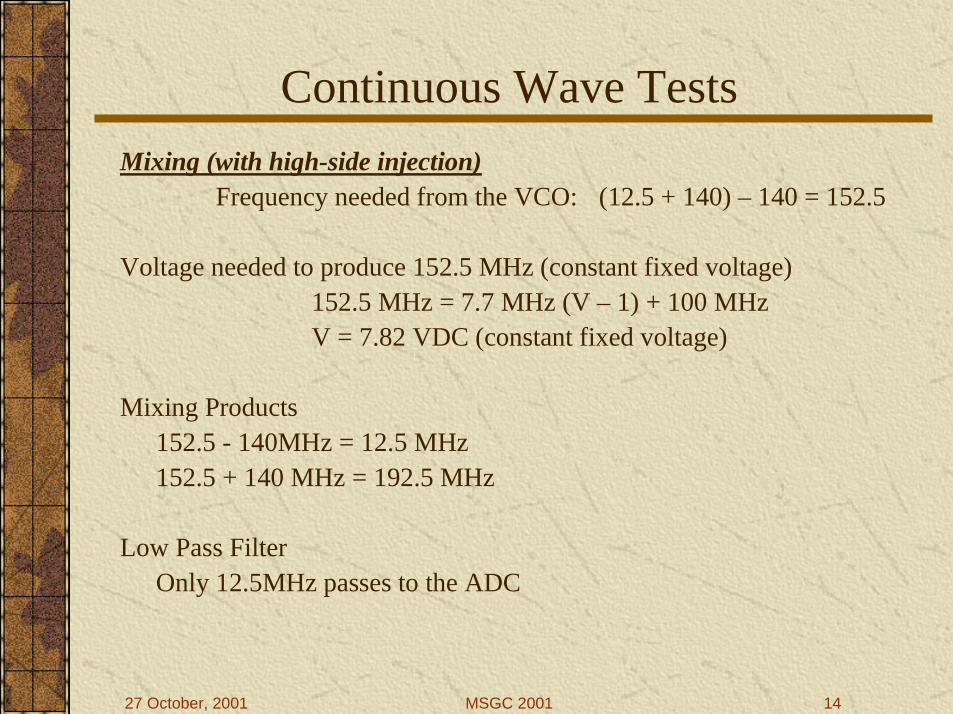
Continuous Wave TestsMixing (with high-side injection)
Frequency needed from the VCO: (12.5 + 140) – 140 = 152.5
Voltage needed to produce 152.5 MHz (constant fixed voltage)152.5 MHz = 7.7 MHz (V – 1) + 100 MHzV = 7.82 VDC (constant fixed voltage)
Mixing Products152.5 - 140MHz = 12.5 MHz152.5 + 140 MHz = 192.5 MHz
Low Pass FilterOnly 12.5MHz passes to the ADC

27 October, 2001 MSGC 2001 15
Test 1 ResultsSpectral Analysis of 140MHz Demodulated Signal
-90
-80
-70
-60
-50
-40
-30
-20
-10
00 5000000 10000000 15000000 20000000 25000000
Fre que nc y (Hz)
27 October, 2001 MSGC 2001 16
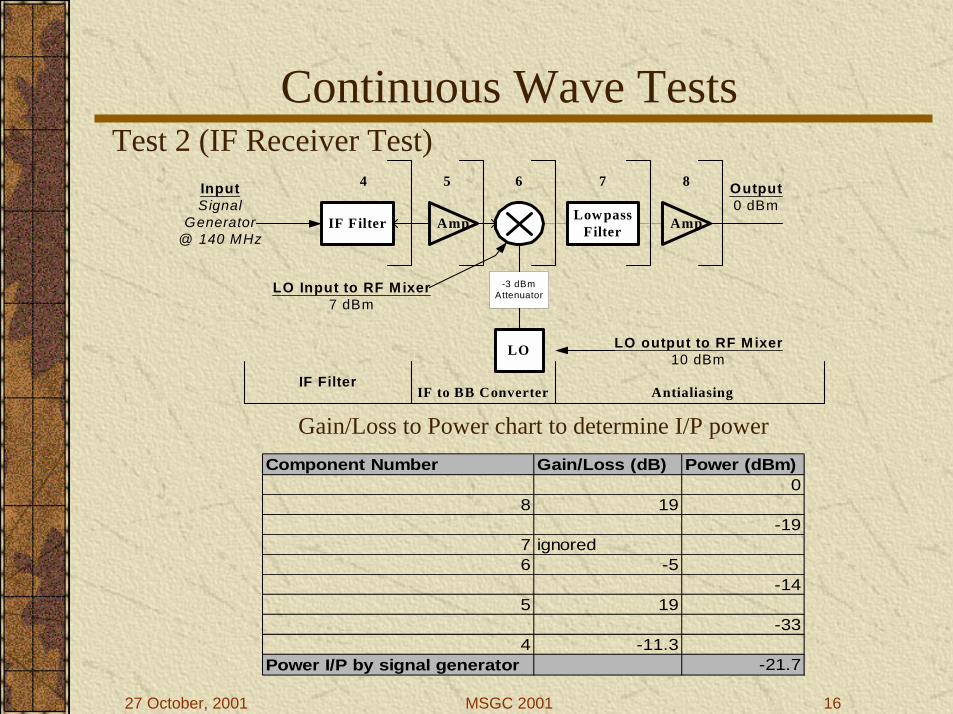
Continuous Wave TestsTest 2 (IF Receiver Test)
IF Filter
LO
6
LowpassFilter Amp
7 8
IF to BB Converter Antialiasing
InputSignal
Generator@ 140 MHz
Output0 dBm
-3 dBmAttenuatorLO Input to RF Mixer
7 dBm
LO output to RF Mixer10 dBm
Amp
5
IF Filter
4
Component Number Gain/Loss (dB) Power (dBm)0
8 19-19
7 ignored6 -5
-145 19
-334 -11.3
Power I/P by signal generator -21.7
Gain/Loss to Power chart to determine I/P power
27 October, 2001 MSGC 2001 17
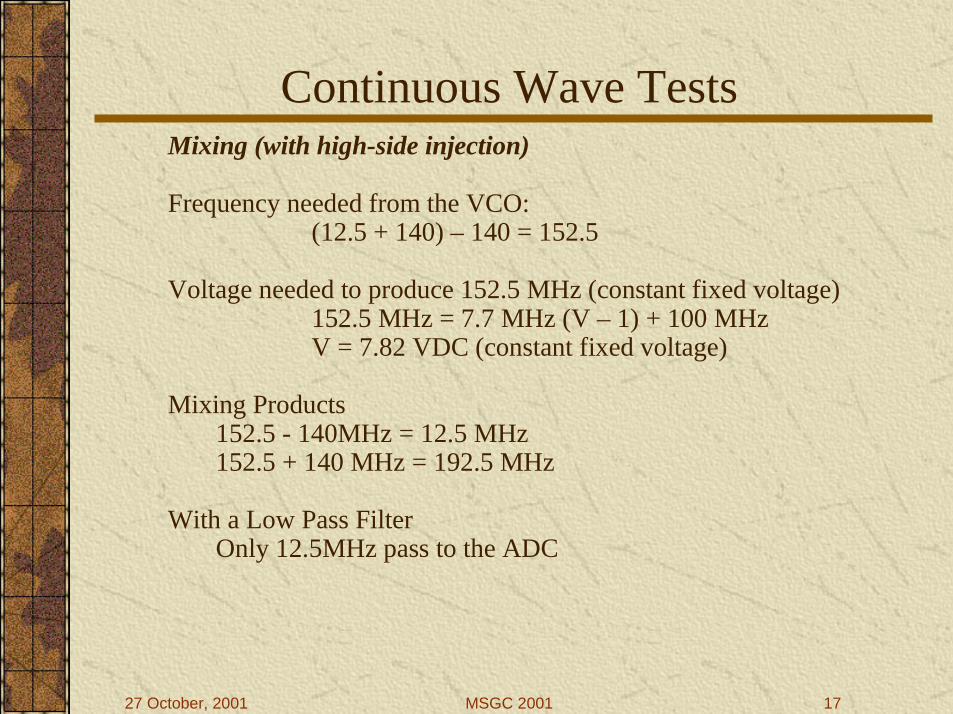
Continuous Wave TestsMixing (with high-side injection)
Frequency needed from the VCO: (12.5 + 140) – 140 = 152.5
Voltage needed to produce 152.5 MHz (constant fixed voltage)152.5 MHz = 7.7 MHz (V – 1) + 100 MHzV = 7.82 VDC (constant fixed voltage)
Mixing Products152.5 - 140MHz = 12.5 MHz152.5 + 140 MHz = 192.5 MHz
With a Low Pass FilterOnly 12.5MHz pass to the ADC

27 October, 2001 MSGC 2001 18
Test 2 ResultsSpectral Analysis of IF Receiver Test
-120
-100
-80
-60
-40
-20
00 5000000 10000000 15000000 20000000 25000000
Fre que nc y (Hz)
27 October, 2001 MSGC 2001 19
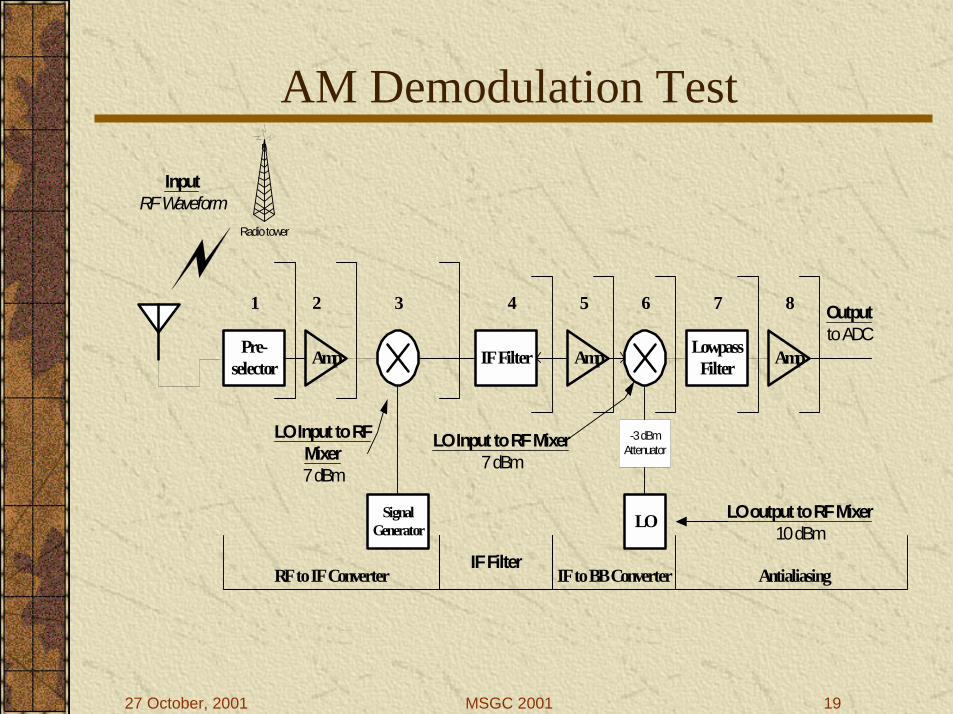
AM Demodulation Test
LO Input to RFMixer7 dBm
IF Filter
LO
6
LowpassFilter Amp
7 8
IF to BB Converter Antialiasing
InputRF Waveform
Outputto ADC
-3 dBmAttenuatorLO Input to RF Mixer
7 dBm
LO output to RF Mixer10 dBm
Amp
5
IF Filter
43
SignalGenerator
RF to IF Converter
Amp
2
Pre-selector
1
Radio tower
27 October, 2001 MSGC 2001 20
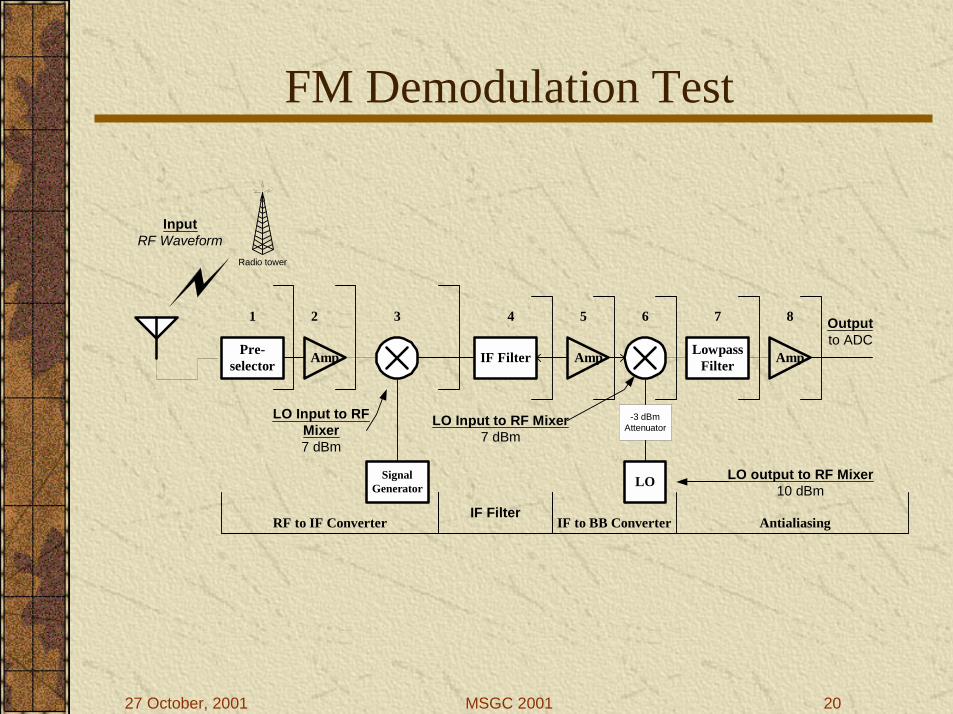
FM Demodulation Test
LO Input to RFMixer7 dBm
IF Filter
LO
6
LowpassFilter Amp
7 8
IF to BB Converter Antialiasing
InputRF Waveform
Outputto ADC
-3 dBmAttenuatorLO Input to RF Mixer
7 dBm
LO output to RF Mixer10 dBm
Amp
5
IF Filter
43
SignalGenerator
RF to IF Converter
Amp
2
Pre-selector
1
Radio tower

27 October, 2001 MSGC 2001 21
ISM Band

27 October, 2001 MSGC 2001 22
Project Results:ISM Transmitting & Receiving
LO Input to RFMixer7 dBm
IF Filter
LO
6
Low passFilter Amp
7 8
IF to BB Converter Antialiasing
-3 dBmAttenuatorLO Input to RF Mixer
7 dBm
LO output to RF M ixer10 dBm
Amp
5
IF Filter
43
SignalGenerator
RF to IF Converter
Amp
2
Pre-selector
1
Outputto
ADC
Receiver
LO Input to RFM ixer7 dBm
IF to RF
LO
6
-10 dBmAttentua
7 8
-3 dBmAttenuatorLO Input to RF M ixer
7 dBm
LO output to RF M ixer10 dBm
5
IF Filter
43
SignalGenerator
Filtered Preamp
21
AmpAmp Post-selector
Low passFilter
9
Amp
Transmiter
IF to BB Converter Baseband Filter
-20 dBmAttentua
InputSignal fromDUC to DAC@ 2 MHz
27 October, 2001 MSGC 2001 23
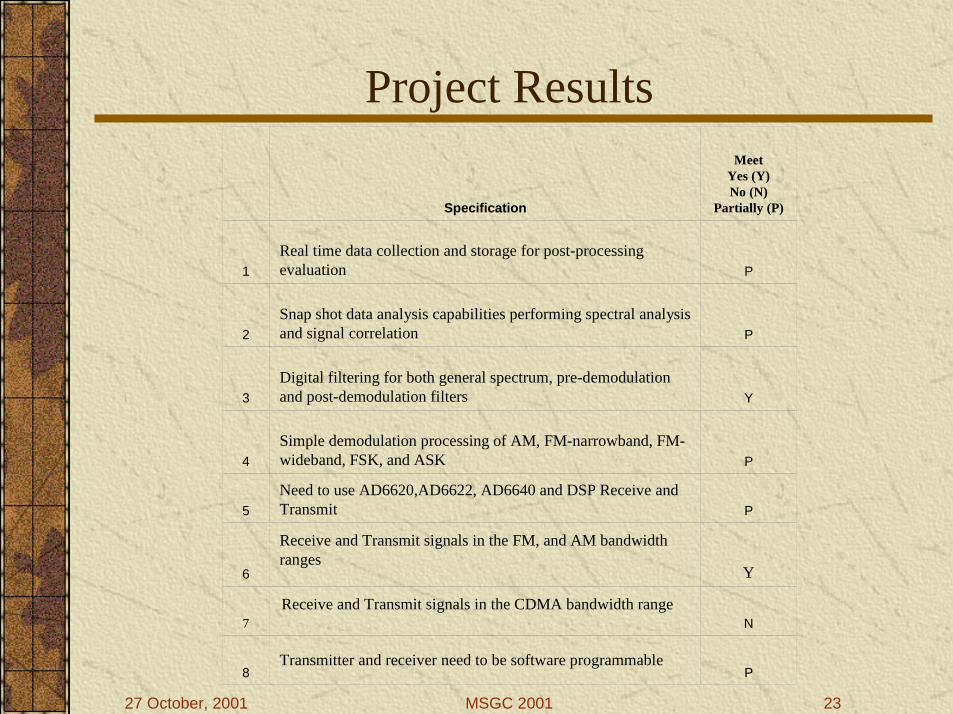
Project Results
Specification
MeetYes (Y)No (N)
Partially (P)
1Real time data collection and storage for post-processing evaluation P
2Snap shot data analysis capabilities performing spectral analysis and signal correlation P
3Digital filtering for both general spectrum, pre-demodulation and post-demodulation filters Y
4Simple demodulation processing of AM, FM-narrowband, FM-wideband, FSK, and ASK P
5Need to use AD6620,AD6622, AD6640 and DSP Receive and Transmit P
6 Y
7 N
8 P
Receive and Transmit signals in the FM, and AM bandwidth ranges
Receive and Transmit signals in the CDMA bandwidth range
Transmitter and receiver need to be software programmable
27 October, 2001 MSGC 2001 24
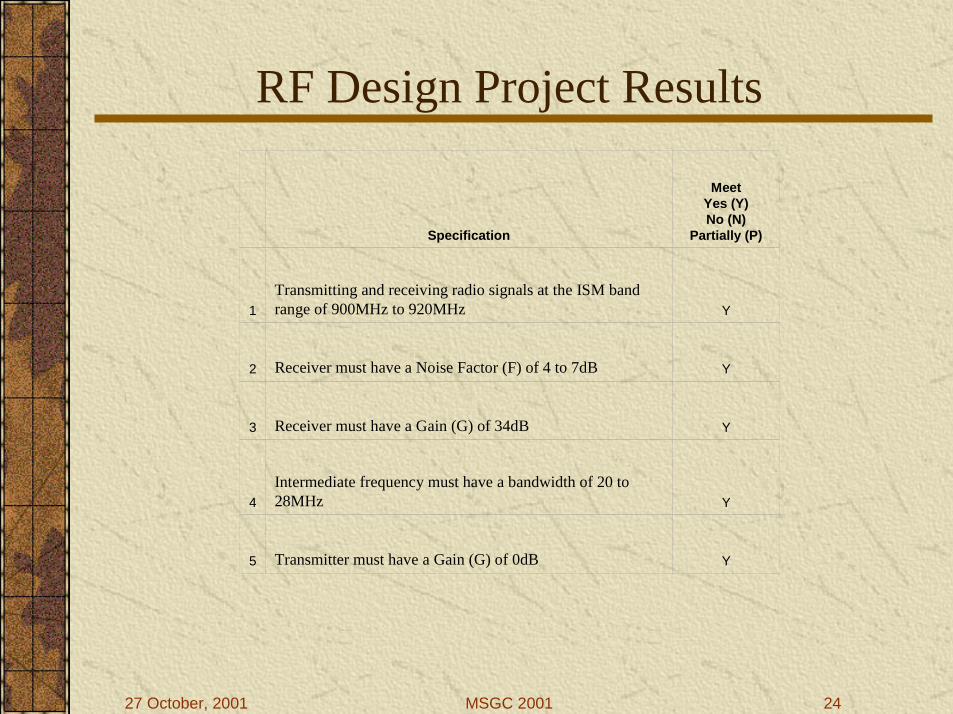
RF Design Project Results
Specification
MeetYes (Y)No (N)
Partially (P)
1Transmitting and receiving radio signals at the ISM band range of 900MHz to 920MHz Y
2 Receiver must have a Noise Factor (F) of 4 to 7dB Y
3 Receiver must have a Gain (G) of 34dB Y
4Intermediate frequency must have a bandwidth of 20 to 28MHz Y
5 Transmitter must have a Gain (G) of 0dB Y

27 October, 2001 MSGC 2001 25
Acknowledgments
ECE 481/482 Project Team Members: Garett Spalo and Jonathan BarberWMU – Department of Electrical and Computer EngineeringMichigan Space Grant Consortium – Seed and Fellowship GrantsBAE Systems donation of a Spectrum Analyzer and Synthesized Signal GeneratorDr. Bradley J. Bazuin – Advisor/SponsorDr. Frank Severance- MSGC Board MemberDr. John Gesink – Senior Design CoordinatorDr. S. H. Mousavinezhad – Chair of the Department of ECEDr. I. Abdel-Qader – providing support with DSPDavid F. Florida II, CNE – Lab Supervisor
27 October, 2001 MSGC 2001 26
RF Design to Support SoftwareTransceiver for Wireless
Communications