rf fundamentals part 2assets.penton.com/webcasts/keysight_12816.pdfrf fundamentals part 2 page...
TRANSCRIPT

RF Fundamentals Part 2 Spectral Analysis
Kevin Nguyen
Keysight Technologies
Dec 8, 2016

Page
Agenda – Overview
– Theory of Operation
• Traditional Spectrum Analyzers
• Modern Signal Analyzers
– Specifications
– Features
– Wrap-up
2
RF Fundamentals
Part 2

Page
Overview
–Passive Receiver
–Display and measure
amplitude versus frequency
–Separate or demodulate
complex signals into their
base components (sine
waves)
3
What is Spectrum Analysis
RF Fundamentals
Part 2

Page
Overview
4
Frequency vs Time Domain
Time domain
Measurements
(Oscilloscope)
Frequency Domain
Measurements
(Spectrum Analyzer)
Amplitude
(power)
RF Fundamentals
Part 2

Page
Overview
– Frequency, power,
modulation, distortion, and
noise
• Spectrum monitoring
• Spurious emissions
• Scalar network analysis
• Noise figure & phase noise
• Harmonic & intermodulation
distortion
• Analog, digital, burst, &
pulsed RF modulation
• Wide bandwidth vector
analysis
• Electromagnetic interference
– Measurement range: -172 dBm
to +30 dBm
– Frequency range: 3 Hz to 1.1
THz
5
Types of Measurements Available Modulation Noise
Spur Search ACP
RF Fundamentals
Part 2

Page
Overview
6
Different Types of Analyzers
A
f f 1 f 2
Filter 'sweeps' over range
of interest
LCD shows full
spectral display
Swept Analyzer
RF Fundamentals
Part 2

Page
Overview
7
Different Types of Analyzers
Parallel filters measured
simultaneously
LCD shows full
spectral display
A
f f 1 f 2
FFT Analyzer
RF Fundamentals
Part 2

Page
Analyzer Definitions
– Spectrum Analyzer: A spectrum analyzer measures the magnitude of an input signal versus frequency within the full frequency range of the instrument. The primary use is to display and measure Amplitude vs. Frequency of known and unknown RF and Microwave signals.
8
RF Fundamentals
Part 2

Page
Analyzer Definitions
– Vector Signal Analyzer: A vector signal analyzer measures the magnitude and phase of an input signal at a single frequency within the IF bandwidth of the instrument. The primary use is to make in-channel measurements, such as error vector magnitude, code domain power, and spectral flatness, on known signals.
9
RF Fundamentals
Part 2

Page
Analyzer Definitions
– Signal Analyzer: A signal analyzer provides the functions of a spectrum analyzer and a vector signal analyzer.
10
RF Fundamentals
Part 2

Page
Agenda – Overview
– Theory of Operation
• Traditional Spectrum Analyzers
• Modern Signal Analyzers
– Specifications
– Features
– Wrap-up
11
RF Fundamentals
Part 2
Page
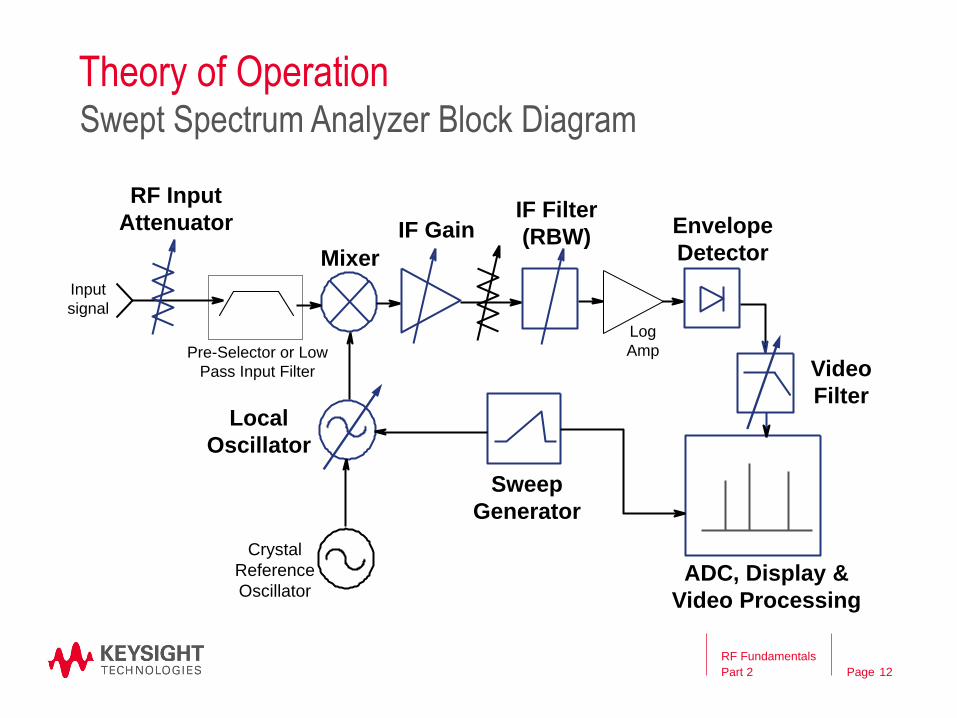
Theory of Operation
Swept Spectrum Analyzer Block Diagram
Pre-Selector or Low
Pass Input Filter
Crystal
Reference
Oscillator
Log
Amp
RF Input
Attenuator
Mixer
IF Filter
(RBW) Envelope
Detector
Video
Filter Local
Oscillator
Sweep
Generator
IF Gain
Input
signal
ADC, Display &
Video Processing
12
RF Fundamentals
Part 2
Page
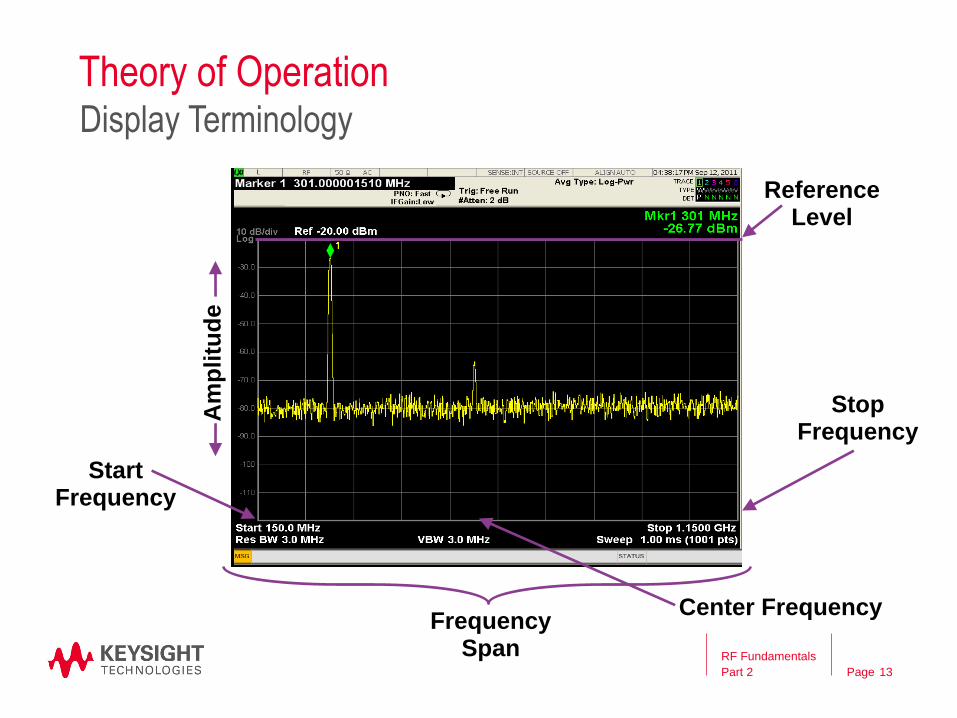
Theory of Operation
13
Display Terminology
Frequency Span
Stop Frequency
Center Frequency
Reference Level
Am
plitu
de
Start Frequency
RF Fundamentals
Part 2

Page
fsig
fsig fLO
RF
LO
IF
1.5 GHz
3.6 GHz 6.5 GHz
fsig - fLO fsig + fLO
fLO
Theory of Operation
14
Mixer
Mixer
RF Fundamentals
Part 2
Page
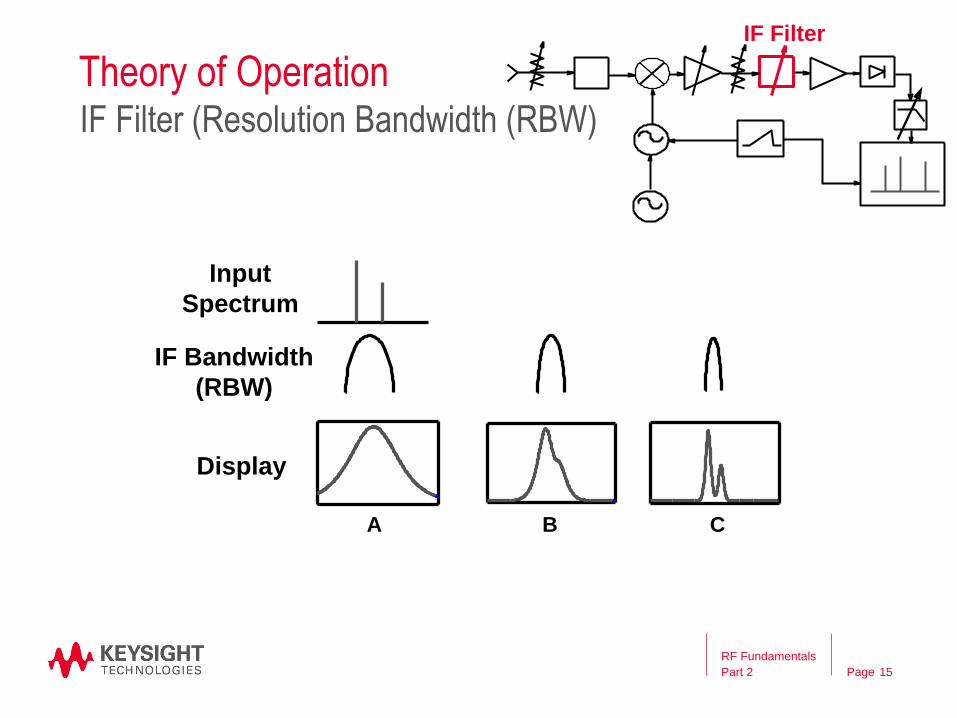
Theory of Operation
15
IF Filter (Resolution Bandwidth (RBW)
Display
Input
Spectrum
IF Bandwidth
(RBW)
A B C
IF Filter
RF Fundamentals
Part 2
Page
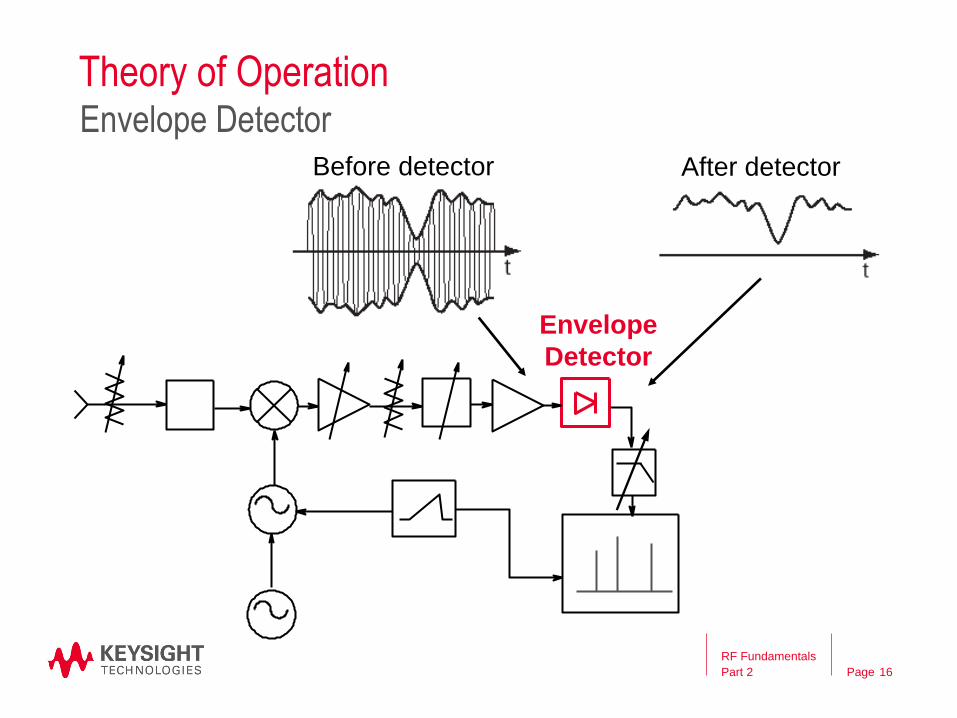
Theory of Operation
16
Envelope Detector
Envelope
Detector
Before detector After detector
RF Fundamentals
Part 2
Page
Theory of Operation
RF Fundamentals
Part 2 17
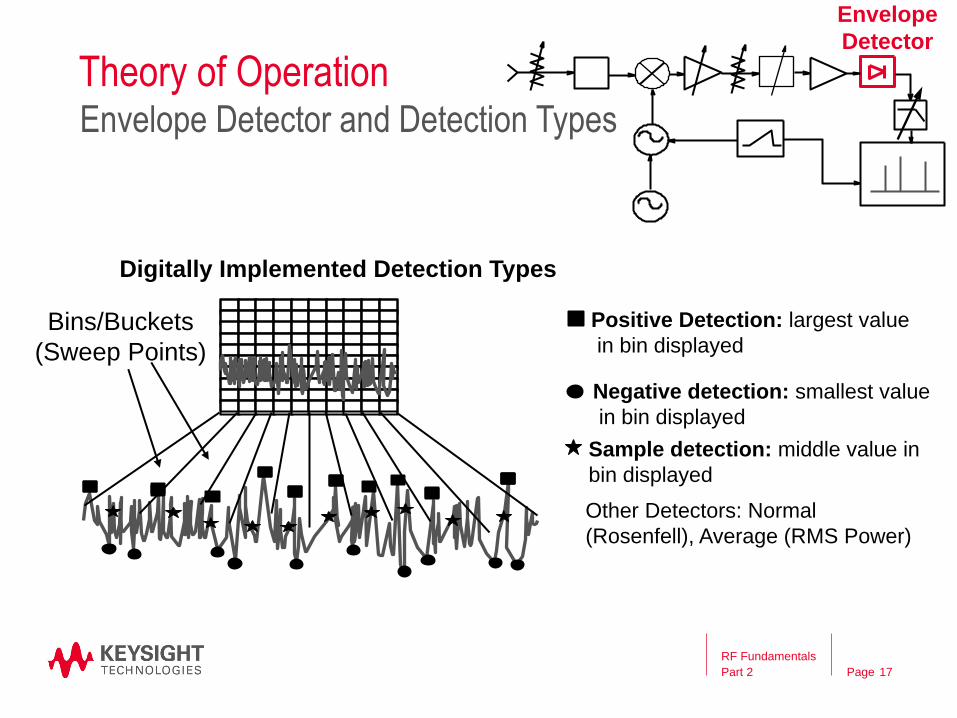
Envelope Detector and Detection Types
Negative detection: smallest value
in bin displayed
Positive Detection: largest value
in bin displayed
Sample detection: middle value in
bin displayed
Bins/Buckets
(Sweep Points)
Other Detectors: Normal
(Rosenfell), Average (RMS Power)
Digitally Implemented Detection Types
Envelope
Detector

Page
Theory of Operation
RF Fundamentals
Part 2 18
Average Detector Type
Time
Volts
bin
Power Average Detection (rms): Square root of the sum of the squares of ALL of the voltage data values in the bin divided by 50Ω
x
Negative Peak Detection x
x
Positive Peak Detection
Sample
Detection
Envelope
Detector

Page
Theory of Operation
19
Video Filter (Video Bandwidth – VBW)
Video
Filter
RF Fundamentals
Part 2

Page
Theory of Operation
20
How it All Works Together – 3 GHz Spectrum Analyzer
3.6
GHz
GHz
0 3 6 1 2 4 5
0 3 1 2
3 6 4 5
(GHz) 0 3 1 2
f IF
Signal Range LO Range
Sweep Generator
LO
LCD Display
Input
Mixer
IF Filter
Detector
A
f
fs
6.5
6.5
fs
fLO
fLO
3.6
fLO - fs fLO + fS
3.6
RF Fundamentals
Part 2

Page
Modern Signal Analyzer Block Diagram
RF Fundamentals
Part 2 21
YIG
ADC
Analog IF
Filter
Digital IF
Filter
Digital Log Amp
Digital Detectors
FFT
Swept vs . FFT Attenuation
Pre-amp
Replaced by

Page
Agenda – Overview
– Theory of Operation
• Traditional Spectrum Analyzers
• Modern Signal Analyzers
– Specifications
– Features
– Wrap-up
22
RF Fundamentals
Part 2

Page
Key Specifications
23
– Safe spectrum analysis
– Frequency Range
– Accuracy: Frequency & Amplitude
– Resolution
– Sensitivity
– Distortion
– Dynamic Range
RF Fundamentals
Part 2

Page
Specifications
– Specifications describe the performance of parameters covered by
the product warranty (temperature = 0 to 55°C, unless otherwise
noted).
– Typical values describe additional product performance information
that is not covered by the product warranty. It is performance beyond
specification that 80 % of the units exhibit with a 95 % confidence
level over the temperature range 20 to 30° C. Typical performance
does not include measurement uncertainty.
– Nominal values indicate expected performance, or describe product
performance that is useful in the application of the product, but is not
covered by the product warranty.
RF Fundamentals
Part 2 24
Definitions

Page
Specifications
– Use best practices to eliminate static discharge to the RF input!
– Do not exceed the Damage Level on the RF Input!
– Do not input signals with DC bias exceeding what the analyzer can tolerate while DC coupled!
25
Practicing Safe Spectrum Analysis - Safe Hookups to RF
!
0 V DC MAX
+30dBm (1W) MAX
RF Fundamentals
Part 2
Page
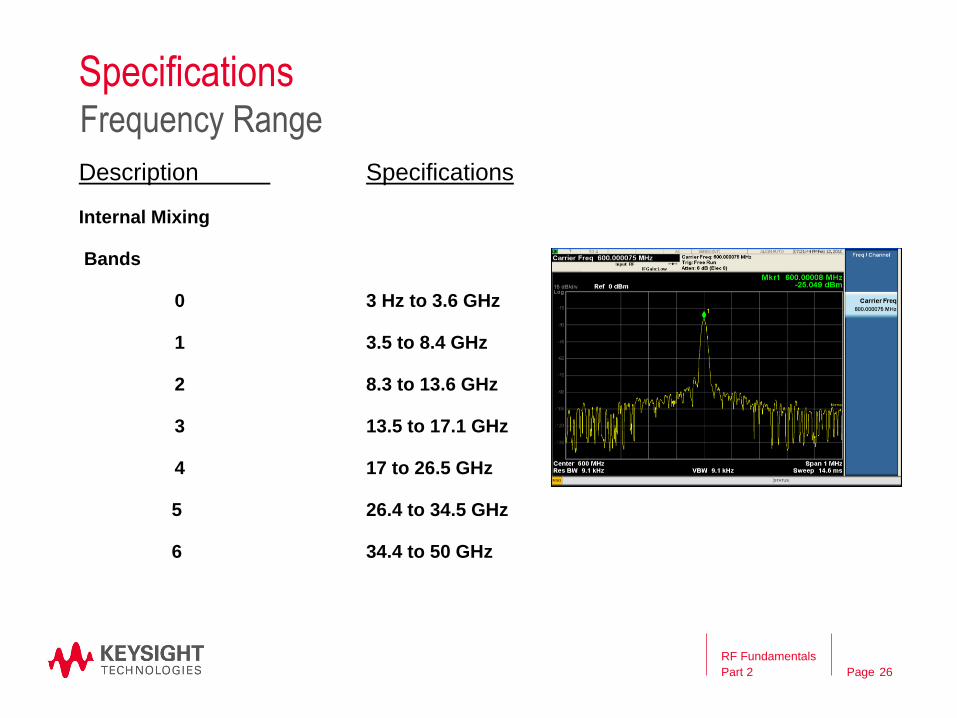
Specifications
Description Specifications
Internal Mixing
Bands
0 3 Hz to 3.6 GHz
1 3.5 to 8.4 GHz
2 8.3 to 13.6 GHz
3 13.5 to 17.1 GHz
4 17 to 26.5 GHz
5 26.4 to 34.5 GHz
6 34.4 to 50 GHz
26
Frequency Range
RF Fundamentals
Part 2

Page
Specifications
27
Accuracy: Frequency & Amplitude
- Components which contribute to uncertainty are:
• Input mismatch (VSWR)
• RF Input attenuator (Atten. switching uncertainty)
• Mixer and input filter (frequency response)
• IF gain/attenuation (reference level accuracy)
• RBW filters (RBW switching uncertainty)
• Log amp (display scale fidelity)
• Reference oscillator (frequency accuracy)
• Calibrator (amplitude accuracy)
RF Fundamentals
Part 2

Page
Specifications
28
Accuracy: Absolute vs Relative
Absolute
Amplitude
in dBm
Relative
Amplitude
in dB
Relative
Frequency Frequency
Absolute
Frequency
Am
plit
ud
e
Note: Absolute accuracy is also “relative” to the calibrator reference point
RF Fundamentals
Part 2

Page
Specifications
RF Fundamentals
Part 2 29
Accuracy: Frequency Response
- 1 dB
+1 dB
0
BAND 1
Absolute amplitude accuracy – Specification: ± 1 dB
Relative amplitude accuracy – Specification: ± 2 dB
Signals in the Same Harmonic Band

Page
Specifications
RF Fundamentals
Part 2 30
Accuracy: Frequency Readout Accuracy
± [(Marker Frequency x Frequency Reference Accuracy) + (0.1% x Span) + (5% x RBW) + 2Hz + (0.5 x Horizontal Resolution)]
Frequency Readout Accuracy =
Calculation: (1x10⁹Hz) x (±1.55x10⁻⁷/Year) = 155Hz
400kHz Span x 0.1% = 400Hz
3kHz RBW x 5% = 150Hz
2Hz + 0.5 x 400kHz/(1000-1) = 202Hz
Total uncertainty = ±907Hz
Example: 1 GHz Marker Frequency, 400 kHz Span,
3 kHz RBW, 1000 Sweep Points
= ± [(time since last
adjustment x aging rate)
+ temperature stability +
calibration accuracy] =
1.55 x 10⁻⁷/ year
= span / (sweep points – 1)
– Utilizing internal frequency counter improves accuracy to ±155 Hz
– The maximum number of sweep points for the X-Series Analyzers is 40,001 which
helps to achieve the best frequency readout accuracy

Page
Specifications
31
Resolution
Resolution
Bandwidth
Noise Sidebands
What Determines Resolution?
RBW Type and
Selectivity
RF Fundamentals
Part 2
Page
Specifications
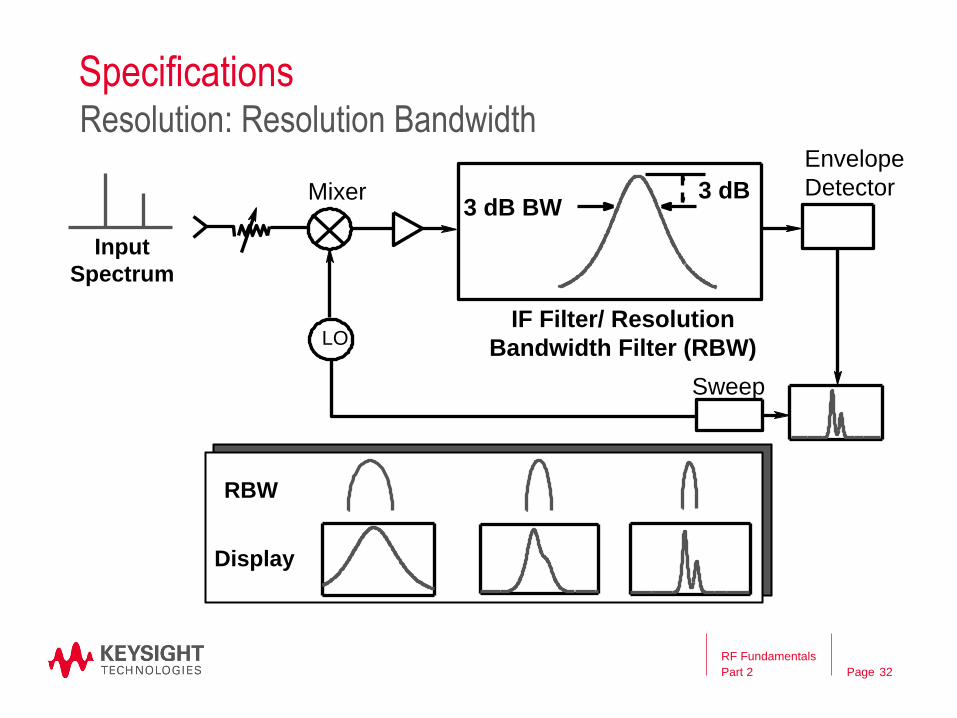
32
Resolution: Resolution Bandwidth
3 dB 3 dB BW
LO
Mixer
IF Filter/ Resolution
Bandwidth Filter (RBW)
Sweep
Envelope
Detector
Input
Spectrum
Display
RBW
RF Fundamentals
Part 2
Page
Specifications
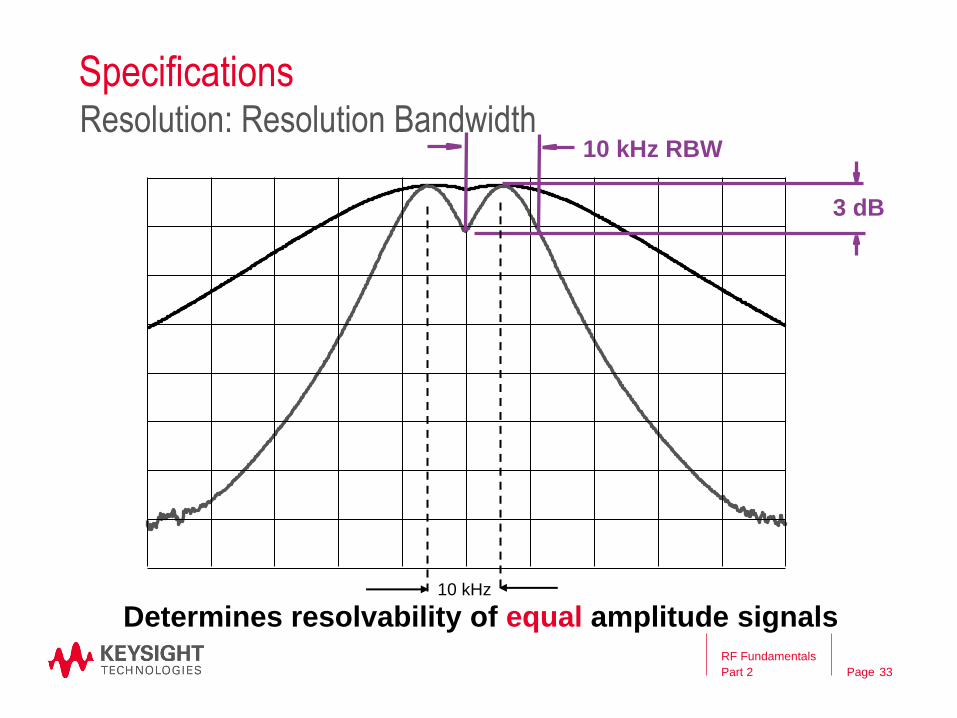
33
Resolution: Resolution Bandwidth
3 dB
10 kHz
10 kHz RBW
Determines resolvability of equal amplitude signals RF Fundamentals
Part 2
Page
Specifications
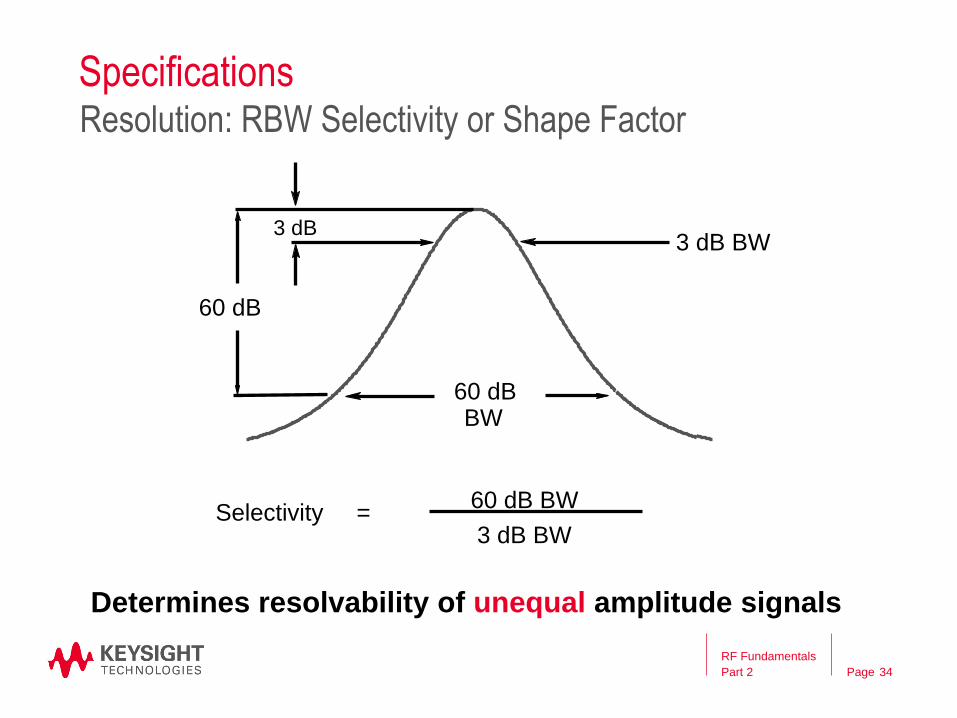
34
Resolution: RBW Selectivity or Shape Factor
3 dB
60 dB
60 dB BW
60 dB BW
3 dB BW
3 dB BW
Selectivity =
Determines resolvability of unequal amplitude signals
RF Fundamentals
Part 2

Page
10 kHz
RBW = 10 kHz RBW = 1 kHz
Selectivity 15:1
10 kHz
Distortion
Products
60 dB BW
= 15 kHz
7.5 kHz
3 dB
60 dB
Specifications
35
Resolution: RBW Selectivity or Shape Factor
RF Fundamentals
Part 2

Page
Specifications
36
Resolution: RBW Type and Selectivity
DIGITAL FILTER
ANALOG FILTER
SPAN 3 kHz RES BW 100 Hz
Typical Selectivity
Analog 15:1
Digital ≤5:1
The X-series RBW shape factor is 4.1:1
RF Fundamentals
Part 2

Page
Specifications
37
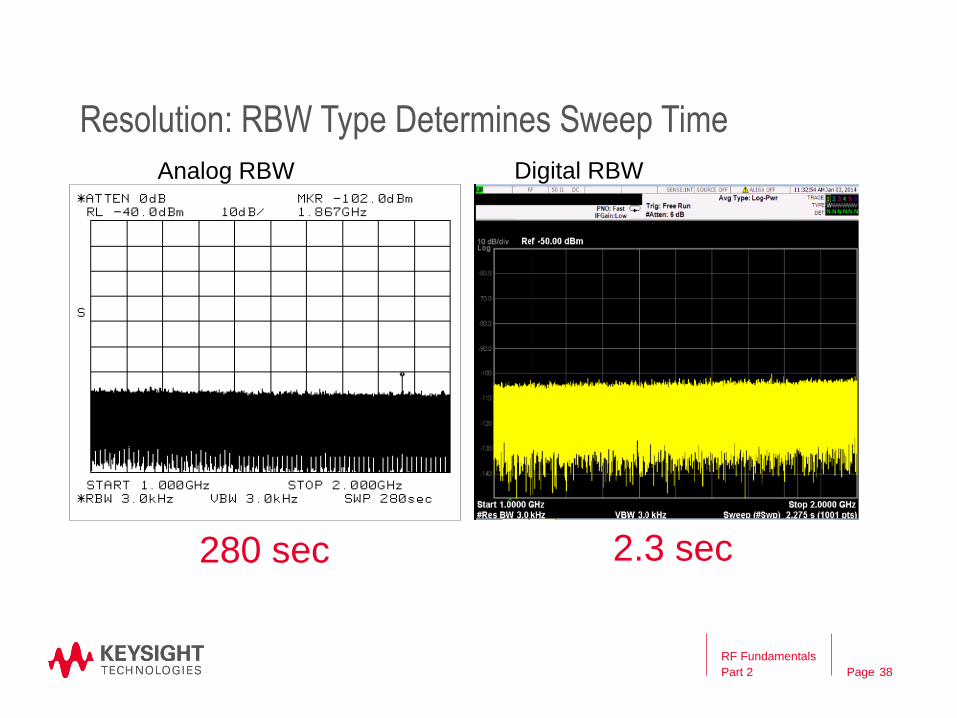
Resolution: RBW Determines Sweep Time
The penalty for sweeping too fast is an uncalibrated display.
Swept too fast
Meas Uncal
RF Fundamentals
Part 2
Page 38
Resolution: RBW Type Determines Sweep Time
280 sec 2.3 sec
Analog RBW Digital RBW
RF Fundamentals
Part 2

Page
Specifications
39
Resolution: Noise Sidebands
Noise sidebands can prevent resolution of unequal signals.
Phase Noise
RF Fundamentals
Part 2

Page
Specifications
40
Sensitivity/DANL
Sweep
LO
Mixer RF
Input
Res BW Filter
Detector
A spectrum analyzer generates and amplifies noise just like any active circuit.
RF Fundamentals
Part 2

Page
Specifications
41
Sensitivity/DANL
Sensitivity is the smallest signal that can be measured.
2.2 dB
RF Fundamentals
Part 2
Page
Specifications
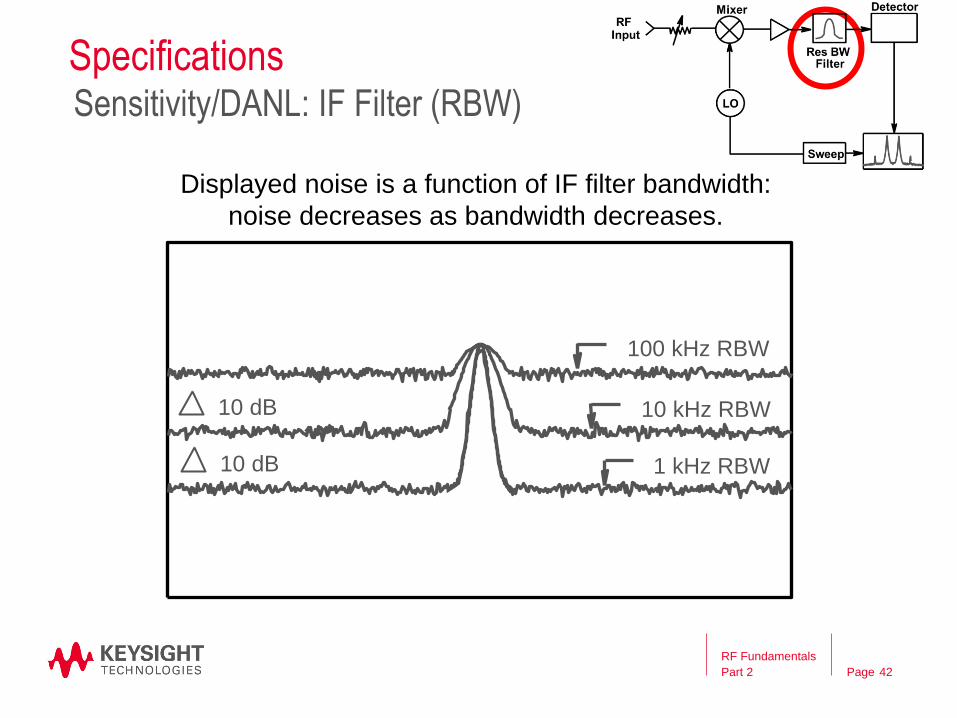
42
Sensitivity/DANL: IF Filter (RBW)
100 kHz RBW
10 kHz RBW
1 kHz RBW
10 dB
10 dB
Displayed noise is a function of IF filter bandwidth:
noise decreases as bandwidth decreases.
RF Fundamentals
Part 2

Page
Specifications
43
Sensitivity/DANL:
Video BW Filter or Trace Averaging
Video BW or trace averaging smoothes noise for easier
identification of low level signals.
Mixer
RF Fundamentals
Part 2

Page
Specifications
44
Sensitivity/DANL: Input Attenuation
10 dB
Attenuation = 10 dB Attenuation = 20 dB
signal level
Effective level of displayed noise is a function of RF input attenuation:
signal to noise ratio decreases as RF input attenuation increases.
RF Fundamentals
Part 2

Page
Specifications
45
Dynamic Range
Dynamic
Range
The ratio, expressed in dB, of the largest to the smallest signals simultaneously present at the input of the spectrum analyzer that allows
measurement of the smaller signal to a given degree of uncertainty.
RF Fundamentals
Part 2
Page
Specifications
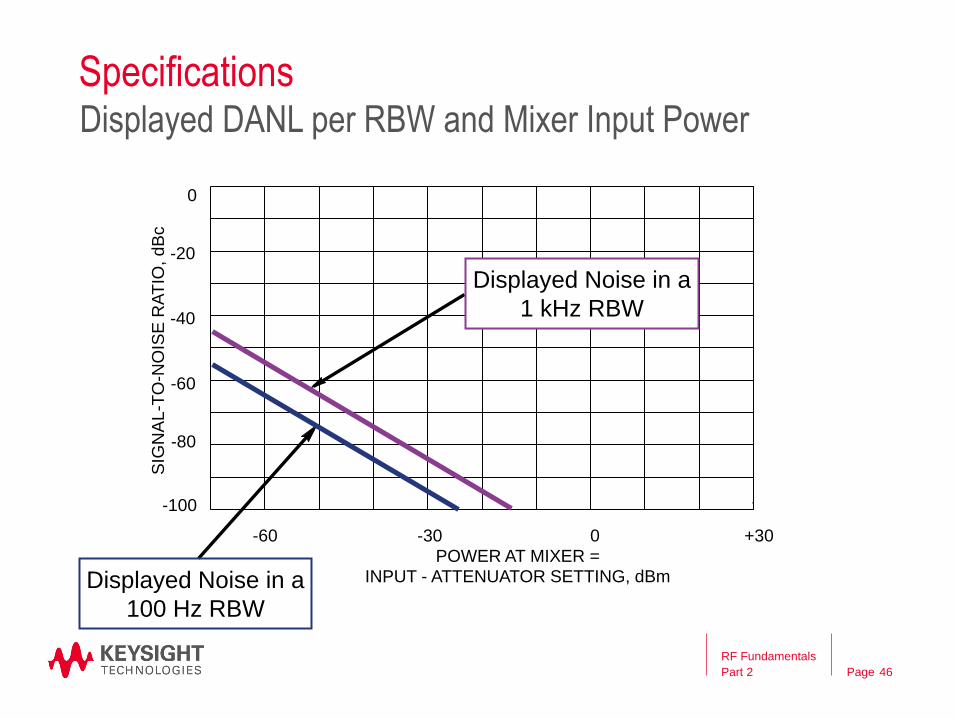
46
Displayed DANL per RBW and Mixer Input Power
.
POWER AT MIXER =
INPUT - ATTENUATOR SETTING, dBm
SIG
NA
L-T
O-N
OIS
E R
AT
IO, d
Bc
0
-20
-40
-60
-80
-100
-60 -30 0 +30
Displayed Noise in a
1 kHz RBW
Displayed Noise in a
100 Hz RBW
RF Fundamentals
Part 2

Page
Specifications
47
Distortion: Mixers
Frequency Translated Signals
Signal To Be Measured
Resultant
Mixer Generated Distortion
RF Fundamentals
Part 2

Page
Specifications
RF Fundamentals
Part 2 48
Distortion: Second and Third Order
Distortion products increase as a function of fundamental's power.
Power
in dB
f f 2f - f 1 2 1 2
Power
in dB
3 3
2 1 2f - f
Two-Tone Intermod
3
f 2f 3f
2
Harmonic Distortion
Second Order: 2 dB/dB of Fundamental Third Order: 3 dB/dB of Fundamental

Page
Specifications
49
Distortion: A Function of Mixer Level
POWER AT MIXER = INPUT - ATTENUATOR SETTING dBm
DIS
TO
RT
ION
, d
Bc
0
-20
-40
-60
-80
-100
-60 -30 0 +30
TOI
Second
Order
Third
Order
SHI
RF Fundamentals
Part 2

Page
Specifications
50
Dynamic Range (DANL, RBW, Distortion)
Dynamic range can be presented graphically. . .
POWER AT MIXER = INPUT - ATTENUATOR SETTING dBm
SIG
NA
L-T
O-N
OIS
E R
AT
IO,
dB
c
-20
-40
-
60
-
80
-
100 -
60
-
30 0 +30 TOI
Optimum Mixer Levels
Maximum 2nd Order
Dynamic Range
Maximum 3rd Order
Dynamic Range
SOI
RF Fundamentals
Part 2

Page
Specifications
51
Dynamic Range
Noise Sidebands
Dynamic Range Limited By Noise Sidebands
dBc/Hz
Displayed Average
Noise Level
Dynamic Range
Compression/Noise Limited By
100 kHz to
1 MHz
Dynamic range for spur search depends on closeness to carrier.
RF Fundamentals
Part 2

Page
SIGNAL/NOISE
SIDEBANDS
-129 dBc @ 10kHz
OFFSET
-165 dBm with preamp
+30 dBm
-155 dBm (1 Hz BW & 0 dB ATTENUATION)
MAXIMUM POWER LEVEL
DISPLAY RANGE
100 dB @ 10 dB/Div
(200 dB @ 20dB/Div)
+3 dBm
-40 dBm
-50 dBm
SECOND-ORDER DISTORTION
MIXER COMPRESSION
THIRD-ORDER DISTORTION
SIGNAL/NOISE
RANGE
158 dB
MEASUREMENT
RANGE
195 dB
MINIMUM NOISE FLOOR (DANL)
0 dBc
NOISE SIDEBANDS
SIGNAL /3rd ORDER
DISTORTION
115 dB range SIGNAL/ 2nd ORDER
DISTORTION
105 dB RANGE
INCREASING
RBW OR
ATTENUATION
(Dynamic Range)
(Dynamic Range)
(Dynamic Range)
Specifications
52
Dynamic Range vs Measurement Range
RF Fundamentals
Part 2

Page
Agenda – Overview
– Theory of Operation
• Traditional Spectrum Analyzers
• Modern Signal Analyzers
– Specifications
– Features
– Wrap-up
RF Fundamentals
Part 2 53

Page
N O I S E F L O O R E X T E N S I O N ( N F E )
– The PXA combines real-time measurement processing with an unprecedented characterization of
the analyzer’s own noise to allow that noise to be accurately removed from measurements.
– The improvement from noise floor extension varies from RF to millimeter wave. At RF, from about
3.5 dB for CW and pulsed signals to approximately 8 dB for noise-like signals, and up to 12 dB or
more in some applications.
– DANL at 2 GHz is –161 dBm without a preamp and –172 dBm with the preamp.
• Standard
• With NFE
• Standard
• With LNP
• With NFE
Features
RF Fundamentals
Part 2 54
Sensitivity/DANL: Noise Floor Extension

Page
– At microwave frequencies any sort of signal routing or switching results in signal path loss.
– Preamplifiers can compensate for this loss and improve signal/noise for small signals, but
they can cause distortion in the presence of larger signals
– LNP allows the “lossy” elements normally found in the RF input chain to be completely
bypassed for highest sensitivity without a preamplifier
– LNP allows measurements of small spurs w/o speed penalty imposed by narrow RBW that
would otherwise be needed for adequate noise level
Features
RF Fundamentals
Part 2 55
Sensitivity/DANL: Low Noise Path (LNP)

Page
Features
RF Fundamentals
Part 2 56
Sensitivity/DANL: Low Noise Path Block Diagram

Page
Features
By adjusting the phase response of the RBW filters, the LO can be
swept at a faster rate without creating errors.
57
Fast Sweep Processing
~36 seconds ~0.63 seconds
Sweep without fast sweep enabled Sweep with fast sweep enabled
RF Fundamentals
Part 2

Page
Data Acquisition and Processing
– A swept LO w/ an assigned RBW.
– Covers much wider span.
– Good for events that are stable in the frequency domain.
– Magnitude ONLY, no phase information (scalar info).
– Captures only events that occur at right time and right frequency point.
– Data (info) loss when LO is “not there”.
RF Fundamentals
Part 2 58
Swept Mode
Freq
Time
Lost Information
Lost Information
Lost Information
Swept LO

Page
Data Acquisition and Processing
– A parked LO w/ a given IF BW
– Collects IQ data over an interval of time.
– Performs FFT for time- freq-domain conversion
– Captures both magnitude and phase information (vector info).
– Data is collected in bursts with data loss between acquisitions.
RF Fundamentals
Part 2 59
Vector Signal Analyzer Mode
Freq
Meas Time
or
FFT
Window
Length
Meas Time
or
FFT
Window
Length
Lost Information
Time
Parked LO
Analysis BW
Page
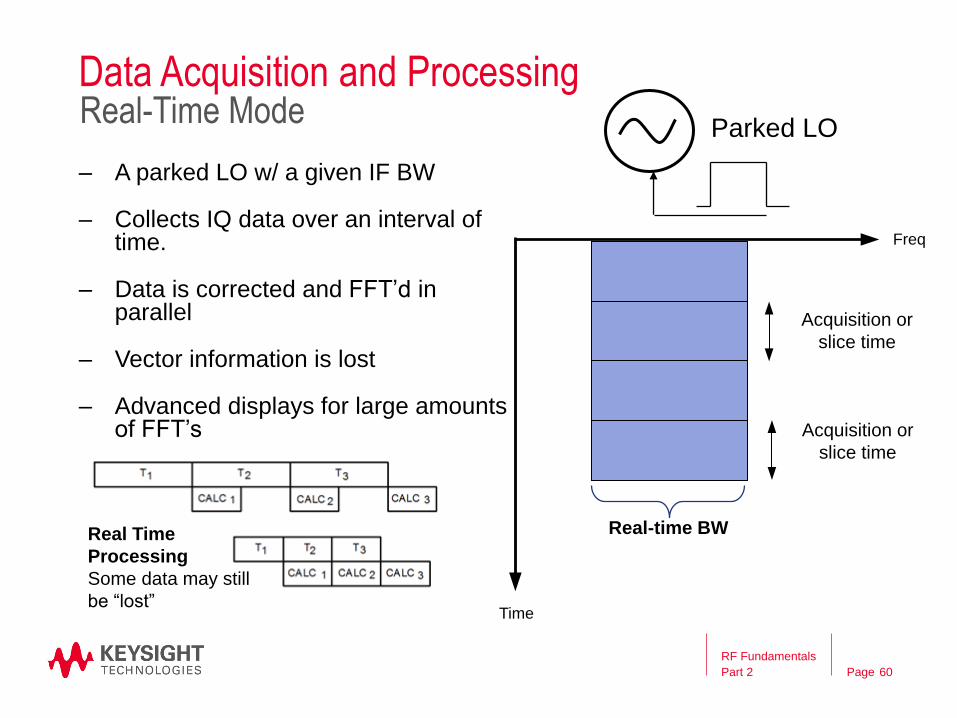
Data Acquisition and Processing
– A parked LO w/ a given IF BW
– Collects IQ data over an interval of time.
– Data is corrected and FFT’d in parallel
– Vector information is lost
– Advanced displays for large amounts of FFT’s
RF Fundamentals
Part 2 60
Real-Time Mode
Freq
Time
Parked LO
Real-time BW
Acquisition or
slice time
Acquisition or
slice time
Real Time
Processing
Some data may still
be “lost”

Page
From this… ...to this
Real-Time Spectrum Analysis
61
Swept vs RTSA
RF Fundamentals
Part 2
Page
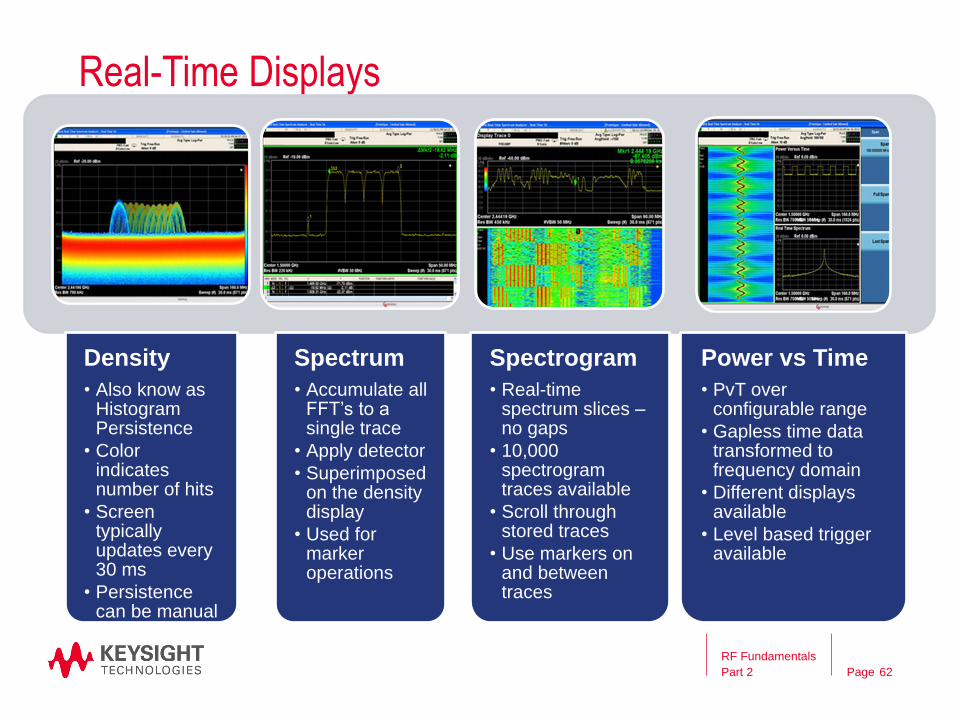
Real-Time Displays
Density
• Also know as Histogram Persistence
• Color indicates number of hits
• Screen typically updates every 30 ms
• Persistence can be manual or infinite
Spectrum
• Accumulate all FFT’s to a single trace
• Apply detector
• Superimposed on the density display
• Used for marker operations
Spectrogram
• Real-time spectrum slices – no gaps
• 10,000 spectrogram traces available
• Scroll through stored traces
• Use markers on and between traces
Power vs Time
• PvT over configurable range
• Gapless time data transformed to frequency domain
• Different displays available
• Level based trigger available
62
RF Fundamentals
Part 2

Page
P R O B A B I L I T Y O F I N T E R C E P T D E T E C T L O W L E V E L S I G N A L S W I T H P R E C I S I O N
– Short burst comms, LPI radar systems make it
very difficult to analyze jamming & interference
– Communication jamming needs to be done very
quickly for adaptive threats
– POI of 3.57 usec for 100% POI with full amplitude
accuracy to catch the most elusive signals
– Excellent noise performance at X-band further
improves POI
Real-Time Spectrum Analysis
63
Application: Detect Low Level Signals with Precision
RF Fundamentals
Part 2
Page
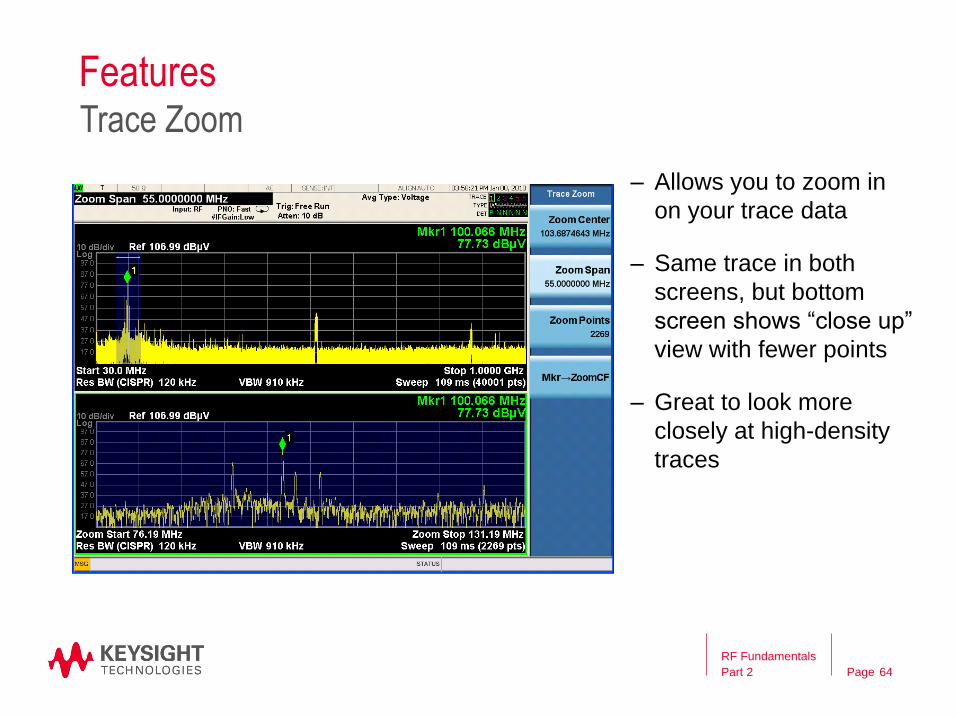
Features
– Allows you to zoom in
on your trace data
– Same trace in both
screens, but bottom
screen shows “close up”
view with fewer points
– Great to look more
closely at high-density
traces
RF Fundamentals
Part 2 64
Trace Zoom

Page
Scalability
65
Multi-Channel, Higher Speed/Throughput, Smaller Footprint
RF Fundamentals
Part 2

Page
– Supported measurements:
• Spectrum analysis
• PowerSuite one-button power
measurements
• N9068A phase noise
measurement application
• 89600A VSA
– Supported external mixers:
• M1970V/E/W
• 11970 Series
• OML Inc.
• VDI
Better close-in phase noise
performance than internally-
mixed 67 GHz analyzers!
Extend Frequencies to 325GHz and Beyond
66
RF Fundamentals
Part 2

Page
Aerospace and Defense
Wide Analysis Bandwidth
Modern designs demand more bandwidth for capturing high data rate
signals and analyzing the quality of digitally modulated bandwidths.
Emerging Communications Cellular Communications
– Radar: chirp errors &
modulation quality
– Satellite: capture 36/72 MHz
BWs with high data rates
– Military Communications:
capture high data rate digital
comms & measure EVM
– WLAN, 802.16 (wireless
last mile), mesh networks
– Measure EVM on
broadband, high data rate
signals
– W-CDMA ACPR & multi-
carrier pre-distortion
– High dynamic range over
60 MHz BW to see low level
3rd order distortion for 4
carrier pre-distortion
algorithms
67
RF Fundamentals
Part 2

Page
RF Measurement Resources
RF Fundamentals
Part 2 68
• Keysight RF Learning Center www.keysight.com/find/klc
• Webcast Recordings
• Application Notes • AN 150 – Spectrum Analysis Basics
• 8 Hints for Better Spectrum Analysis
• 10 Hints for Making Better Noise Figure Measurements
• Videos
• Register for Future Webcasts