rheological characterisation of cell walls from wheat
TRANSCRIPT
Accepted Manuscript
Rheological characterisation of cell walls from wheat flour and endosperm: Effects ofdiferulate crosslink hydrolysis
Ghanendra Gartaula, Sushil Dhital, Omkar Deshmukh, Gabriele Netzel, Michael J.Gidley
PII: S0268-005X(18)31278-5
DOI: 10.1016/j.foodhyd.2018.10.004
Reference: FOOHYD 4685
To appear in: Food Hydrocolloids
Received Date: 13 July 2018
Revised Date: 19 September 2018
Accepted Date: 5 October 2018
Please cite this article as: Gartaula, G., Dhital, S., Deshmukh, O., Netzel, G., Gidley, M.J., Rheologicalcharacterisation of cell walls from wheat flour and endosperm: Effects of diferulate crosslink hydrolysis,Food Hydrocolloids (2018), doi: https://doi.org/10.1016/j.foodhyd.2018.10.004.
This is a PDF file of an unedited manuscript that has been accepted for publication. As a service toour customers we are providing this early version of the manuscript. The manuscript will undergocopyediting, typesetting, and review of the resulting proof before it is published in its final form. Pleasenote that during the production process errors may be discovered which could affect the content, and alllegal disclaimers that apply to the journal pertain.
MANUSCRIP
T
ACCEPTED
ACCEPTED MANUSCRIPT
1
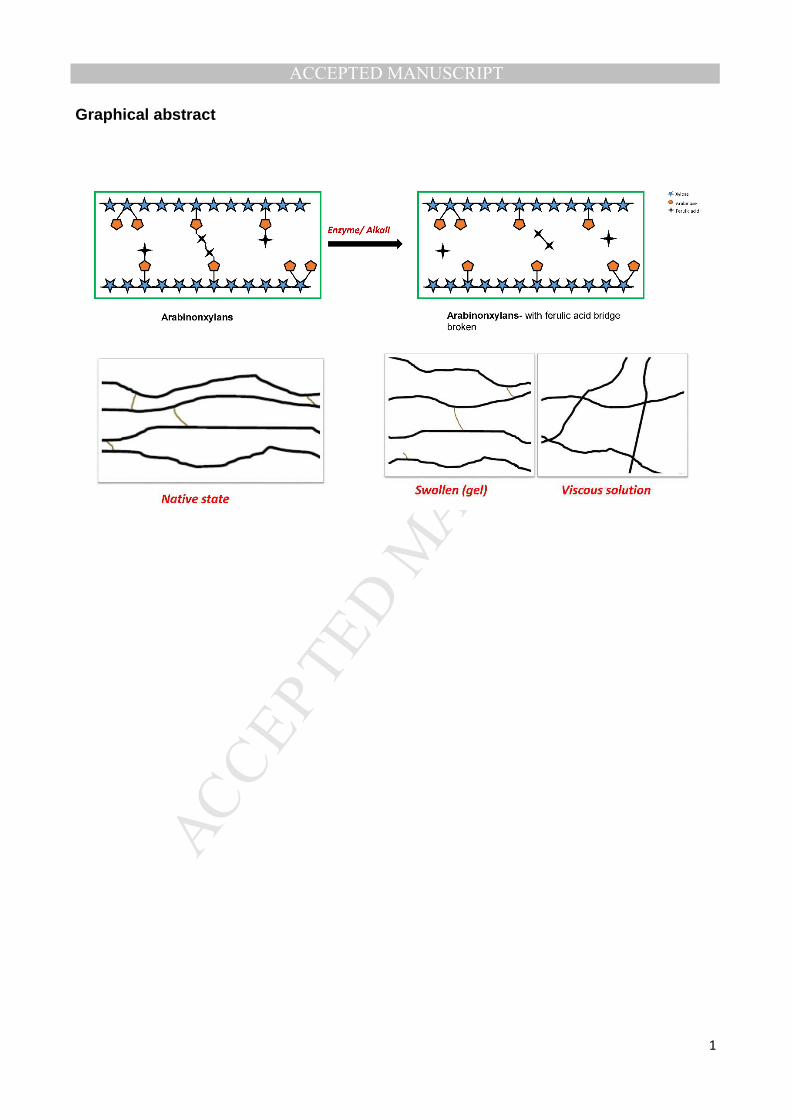
Graphical abstract
MANUSCRIP
T
ACCEPTED
ACCEPTED MANUSCRIPT
1
Rheological characterisation of cell walls from wheat flour and 1
endosperm: effects of diferulate crosslink hydrolysis 2
3
Ghanendra Gartaulaa, Sushil Dhitala, Omkar Deshmukhb, Gabriele Netzelc & Michael J 4
Gidleya* 5
a ARC Centre of Excellence in Plant Cell Walls, Centre for Nutrition and Food Sciences, Queensland Alliance 6
for Agriculture and Food Innovation, The University of Queensland, St Lucia, QLD 4072, Australia 7
b School of Chemical Engineering, The University of Queensland, St Lucia, QLD 4072, Australia 8
c Centre for Animal Science, Queensland Alliance for Agriculture and Food Innovation, The University of 9
Queensland, Coopers Plains, QLD 4108, Australia 10
11
12
*Corresponding author: [email protected] 13
Postal Address: ARC Centre of Excellence in Plant Cell Walls, Centre for Nutrition and Food Sciences, 14
Queensland Alliance for Agriculture and Food Innovation, Hartley Teakle Building [#83], The University of 15
Queensland, St Lucia, Queensland 4072, Australia; Tel: +61 7 3365 2145 16
17
Email addresses all authors: 18
Ghanendra Gartaula: [email protected] 19
Sushil Dhital: [email protected] 20
Omkar Deshmukh: [email protected] 21
Gabriele Netzel: [email protected] 22
Michael J Gidley: [email protected] 23

MANUSCRIP
T
ACCEPTED
ACCEPTED MANUSCRIPT
2
Abstract 24
The crosslinking of arabinoxylan chains with ferulic acid dimers in wheat endosperm cell 25
walls is hypothesised to limit the swelling and solubilisation of cell wall polysaccharides. In 26
this study, we report the changes in the rheological and chemical properties of cell walls 27
isolated from wheat flour and purified endosperm after treatments intended to cleave the 28
dimers using enzyme (feruloyl esterase) and alkali (NaOH). Treatment with enzyme at the 29
studied amount released less diferulic acid than alkali, and did not release 8-5’ dimers. All 30
treatments markedly altered viscoelastic behaviour. Before enzyme or alkali treatment, cell 31
walls behaved as structured soft solids with elastic modulus (G’) greater than loss modulus 32
(G’’) and limited frequency dependence. Both G’ and G’’ decreased following enzyme or 33
alkali treatments, and at higher frequencies, the resulting suspension changed behaviour 34
from solid-like to more liquid-like, with G’’ > G’. The alteration of rheological properties and 35
loss of ferulic acid and dimers correlated with the microscopic observation after 36
enzyme/alkali treatment that cell walls lose their structural integrity, as well as releasing 37
more polysaccharide into solution. These results suggest that the breakage of ferulic acid 38
crosslinks can be used as a technique to alter the rheological behaviour of cell wall 39
polysaccharides in wheat flour with consequences for both nutritional as well as 40
processing functionality. 41
42
Keywords: wheat cell walls; arabinoxylans; rheology; feruloyl esterase; ferulic acid 43
44
MANUSCRIP
T
ACCEPTED
ACCEPTED MANUSCRIPT
3
1. Introduction 45
Dietary fibres (DF) in refined wheat flour mainly consist of endosperm cell walls and 46
remnants of peripheral layers after milling of wheat grain. Consumption of foods that are 47
rich in DF helps in the regulation of human physiological health as has been reviewed 48
elsewhere (Gidley, 2013; Slavin & Green, 2007; Topping, 2007). Whilst wheat is a major 49
cereal crop across the globe, the nutritional functionality of wheat dietary fibre is regarded 50
as inferior to eg. oat and barley due to the lower amount and limited swelling or 51
solubilisation of wheat cell walls and hence less enhancement of viscosity in the 52
gastrointestinal tract (Daou & Zhang, 2012; Dikeman, Murphy, & Fahey, 2006). There is a 53
growing interest in enhancing the swelling and solubility of cell walls due to the fact that 54
soluble fibres eg. (1-3,1-4)-beta-glucans, contribute to the viscosity of digesta, and are 55
associated with physiological health benefits such as enhanced satiety, slower gastric 56
emptying, reduced cholesterol uptake, lower glycaemic response etc. (Cameron-Smith, 57
Collier, & O'Dea, 1994; Dikeman & Fahey, 2006; Gunness & Gidley, 2010; Mälkki & 58
Virtanen, 2001). 59
As shown in previous studies (Gartaula, et al., 2018; Gartaula, Dhital, Pleming, & Gidley, 60
2017), the cell walls of wheat contain high levels of arabinoxylans (Bacic & Stone, 1980), a 61
polysaccharide consisting of a linear backbone of β-(1-4)-linked D-xylopyranosyl units to 62
which α-L-arabinofuranose substituents are attached at the O2 and/or O3 positions of 63
some xylose residues. Some of the arabinose residues are further ester-linked on the (O)-64
5 position to ferulic acid (FA) which can form dimers that crosslink arabinoxylans 65
(Saulnier, Sado, Branlard, Charmet, & Guillon, 2007). Dimers of ferulic acid form due to 66
oxidative/radical mediated and/or light induced coupling reactions. The dominant dimers in 67
wheat endosperm cell walls are 8-5’ (benzofuran and open form), 8-O-4’ and 5-5’ diferulic 68
acid in decreasing order, whereas bran contains approximately equal quantities of 8-O-4’ 69
and 8-5’ diferulic acid (diFA) (Faulds, et al., 2003). Diferulic acids crosslink the cell wall 70
polymers (Bunzel, 2010; Hatfield, Ralph, & Grabber, 1999) which affects wall properties 71
such as extensibility and plasticity (Kamisaka, Takeda, Takahashi, & Shibata, 1990), and 72
possibly degradability (Eraso & Hartley, 1990; Hartley, Morrison III, Himmelsbach, & 73
Borneman, 1990). In a recent study (Gartaula, et al., 2018), it was found that in purified 74
starchy endosperm cell walls, 1 FA is associated with about 760 AX residues, and 1 diFA 75
with around 9000 AX residues which means there is one dimer of ferulic acid for about 76
every 12 monomers. The amounts of FA and diFA are, however, greater in cell walls from 77
flour due to contamination with non-endosperm components (Gartaula, et al., 2018). 78

MANUSCRIP
T
ACCEPTED
ACCEPTED MANUSCRIPT
4
Those crosslinks involving an ester-bond can be broken down with feruloyl esterase or 79
alkali (Bunzel, Ralph, Marita, Hatfield, & Steinhart, 2001; Faulds, et al., 2003). We 80
hypothesize that the breakage of FA crosslinks in the arabinoxylans of wheat cell walls will 81
increase cell wall swelling and solubility due to increases in the mobility of the polymers. 82
Hence the aim of this study is to understand how the cleavage of FA dimers affects the 83
functional/rheological properties of wheat endosperm cell walls in order to improve the 84
nutritional functionality of wheat flour. 85
2. Materials and methods 86
2.1. Materials 87
Cell walls were isolated from wheat flour and starchy endosperm of whole wheat (Lincoln 88
variety) as described in detail in Gartaula, et al. (2017). In brief, whole wheat grain was 89
used for the isolation of endosperm cell walls by a novel ‘popping’ method. This involves a 90
dry heat treatment (130 C, 1.5 h) to inactivate endogenous enzymes, a soaking treatment 91
to soften the tissue, then manual ‘popping’ of starchy endosperms. Wheat flour of 75% 92
extraction rate was produced on a Buhler MLU-202 laboratory test mill. Cell walls isolated 93
from ‘popped’ endosperm and 75% extraction rate at two different isolation temperatures 94
viz. 37 °C and 70 °C were compared for their rheological properties. 95
Thermostable alpha amylase from Bacillus licheniformis (E-BLAAM; EC 3.2.1.1) and 96
amyloglucosidase from A. niger (E-AMGDF; EC 3.2.1.3) were purchased from Megazyme 97
International (Wicklow, Ireland). Protease from B. licheniformis (P4860; EC 3.4.21.62) was 98
purchased from Sigma-Aldrich (Lane Cove, NSW, Australia). Feruloyl esterase 99
(Clostridium thermocellum) (E-FAEZCT) was purchased from Megazyme International. 100
Phosphate buffered saline (PBS) tablets were purchased from ThermoFisher Scientific 101
Australia Pty Ltd. (Scoresby, Vic, Australia). All other chemicals and reagents were 102
purchased from Sigma-Aldrich and Merck (Bayswater, Vic, Australia). 103
2.2. Effect of concentration on the rheology of cell walls 104
The required amount of cell walls was added to MilliQ water to obtain four different 105
concentrations, viz. 0.75, 1.0, 1.5 and 2.0 % (w/v). The samples were stored at 4 °C 106
overnight to ensure even hydration. Prior to experiments, the slurry/suspension was 107
thoroughly but gently mixed using a spatula. 108
The rheological measurements were carried out on a stress-controlled rheometer (AR-G2, 109
TA Instruments, New Castle, DE, USA). A sandblasted parallel plate geometry of 40 mm 110
diameter was used with a gap of 350 µm. The samples were subjected to an oscillatory 111
MANUSCRIP
T
ACCEPTED
ACCEPTED MANUSCRIPT
5
stress sweep at a frequency of 1 Hz to determine the linear viscoelastic region of samples 112
over a stress range from 0.01 to 1000 Pa. An oscillatory frequency sweep test over the 113
frequency range of 0.1-100 Hz was performed to determine the storage (G’) and loss (G”) 114
moduli, followed by steady shear viscosity measurements for shear rates ranging from 0.1-115
100 s-1. For all experiments, low viscosity silicone oil was used to cover the edges of the 116
samples to avoid evaporation during measurements. All measurements were carried out at 117
a temperature of 37 °C to approximate human body temperature. Measurements were 118
performed in duplicate on purified (‘popped’) endosperm cell walls and in triplicate on 119
wheat flour cell walls. 120
The Power Law function is generally used to describe non-Newtonian flow behaviour 121
under steady shear measurements (Holdsworth, 1971). The function is expressed as 122
follows: 123
� = � × ���
Where � = steady shear viscosity or apparent viscosity (eta), � = consistency constant, �� 124
= shear rate and � = Power Law index or flow behaviour index. The lower the value of �, 125
the greater the viscosity decrease with shear rate; � =1 corresponds to a Newtonian fluid 126
which has a constant viscosity, whilst � represents the viscosity at a shear rate of one. 127
An analogous Power Law model can be used for small deformation measurements, which 128
is as follows: 129
�∗ = ∗ × ɷ�∗
Where �∗ = dynamic viscosity, ∗ = consistency index, ɷ = frequency, and �∗ = Power 130
Law index or flow behaviour index for dynamic viscosity. 131
2.3. Effect of enzyme/alkali on the rheology of cell walls 132
Cell walls from flour and purified endosperm isolated at 37 °C were used in this study. Five 133
different treatments were assessed. Isolated cell walls were added to MOPS buffer 134
(control; 100 mM, pH 6.0), MOPS buffer+15 µl feruloyl esterase (7U/ml), 0.1 M NaOH, 1.0 135
M NaOH and 2.0 M NaOH in order to make a 1% suspension (w/v). The first two samples 136
were incubated at 60 °C for 7h, while the alkali treatments were carried out at 25 °C for 24 137
h. The rheological measurements of the samples were carried out as described in 2.2 138
without adjustment of pH. 139
The extraction and quantification of the phenolic acids were done as described previously 140
(Gartaula, et al., 2018). The supernatant after the extraction of phenolic acids was 141
MANUSCRIP
T
ACCEPTED
ACCEPTED MANUSCRIPT
6
collected and trans-cinnamic acid (10 µg) added as internal standard. The solutions were 142
acidified to pH<2 with concentrated HCl and the phenolic compounds extracted three 143
times with 1 ml ethyl acetate. The extracts were evaporated to dryness (miVac 144
concentrator, GeneVac Ltd, Ipswich, UK) and re-dissolved in 200 µl 50% MeOH. Filtration 145
(0.2 µm syringe filter) was done prior to UPLC injection. 146
The contents of phenolic compounds in cell walls were measured using a Waters® Acquity 147
UPLC equipped with a PDA detector (Waters, Rydalmere, NSW, Australia). A Vision HT 148
C18 column (100 × 2 mm I.D. 1.5 µm) (Grace Discovery Sciences, Epping, Vic, Australia) 149
was utilised. The gradient profile for the separation of cell wall bound phenolic monomers 150
and dimers was formed using solvent A (1 mM TFA in 10% (v/v) aqueous acetonitrile) and 151
solvent B (1 mM TFA in 40% methanol, 40% acetonitrile and 20% water (v/v/v)) as follows: 152
Solvent A 90-25% from 0 to 5 min; 25-0% from 5 to 5.5 min; isocratic from 5.5 to 8 min; 153
back to 90% A followed by an equilibration phase (7 min) before the next injection. The 154
flow rate was 0.4 mL/min, and the column temperature was kept at 30 °C. The injection 155
volume of sample was 5 µL and the detection wavelength was 320 nm. 156
Peak identification and quantification of FA and p-coumaric acid was based on the UV 157
spectrum and retention times of authentic standards and their calibration curves at 320 158
nm. Values were reported as micrograms per gram (µg/g) of the sample. The identification 159
and quantification of dimers were performed by comparison with UV spectra (Dobberstein 160
& Bunzel, 2010; Waldron, Parr, Ng, & Ralph, 1996). The analyses were carried out in 161
duplicate. 162
2.4. Effect of enzyme and alkali on solubilisation of cell walls 163
The solubilisation of cell wall polysaccharides was monitored as total carbohydrate present 164
in the supernatant after enzyme/alkali treatment using the phenol-sulphuric acid method 165
(DuBois, Gilles, Hamilton, Rebers, & Smith, 1956) with xylose as standard. The cell walls 166
used were isolated from wheat flour at an isolation temperature of 37 °C. Supernatants 167
after the enzyme/alkali treatments were used in the study. The enzyme treatment was 168
carried out for 7 h at 60 °C using MOPS buffer as a control. Two alkali concentrations of 169
0.1 M and 1.0 M NaOH were used for 1h and 24 h extractions so as to assess any time-170
dependent effects. Briefly, 200 µl of the blank, xylose standards or the (diluted) 171
supernatant after enzyme or alkali treatment of the cell wall were transferred into a tube 172
and 200 µl 5% (w/v) aqueous phenol was added. In a single rapid movement, 1.0 mL 173
conc. H2SO4 was dispensed into the centre of the liquid in the tube. After allowing to cool 174
for 10 minutes, absorbance was read at 480 nm. The supernatants for sugar estimation 175
MANUSCRIP
T
ACCEPTED
ACCEPTED MANUSCRIPT
7
after enzyme/alkali treatment of the cell walls (1% w/v suspension) were obtained by 176
centrifuging at 16000 g for 10 min. 177
2.5. Microscopic examination 178
The morphology of cell walls after enzyme/alkali treatment was observed using an 179
Olympus BX-61 light microscope (LM) (Tokyo, Japan). 180
3. Results and discussion 181
3.1. Effect of concentration and source of cell walls on rheological properties 182
The effect of concentration on the rheology of cell walls isolated from wheat flour and 183
endosperm cell walls was studied. The cell walls were isolated at two different isolation 184
temperatures viz. 37 and 70 °C, and the concentrations of the cell walls used were 0.75, 185
1.0, 1.5 and 2%. It was found that in all cases, the elastic modulus was greater than the 186
viscous modulus (G’>G”) by up to one order of magnitude, and both moduli showed limited 187
frequency dependence within the studied frequency regime, consistent with a weakly 188
structured system (Chamberlain & Rao, 1999; Clark & Ross-Murphy, 1987). There was 189
also a reduction of steady shear and dynamic viscosity over the applied shear rate and 190
frequency respectively. This behaviour is consistent at all the concentrations (0.75, 1, 1.5 191
and 2%) of cell walls. Example mechanical spectra are shown in Supplementary Figs. S1 192
and S2. 193
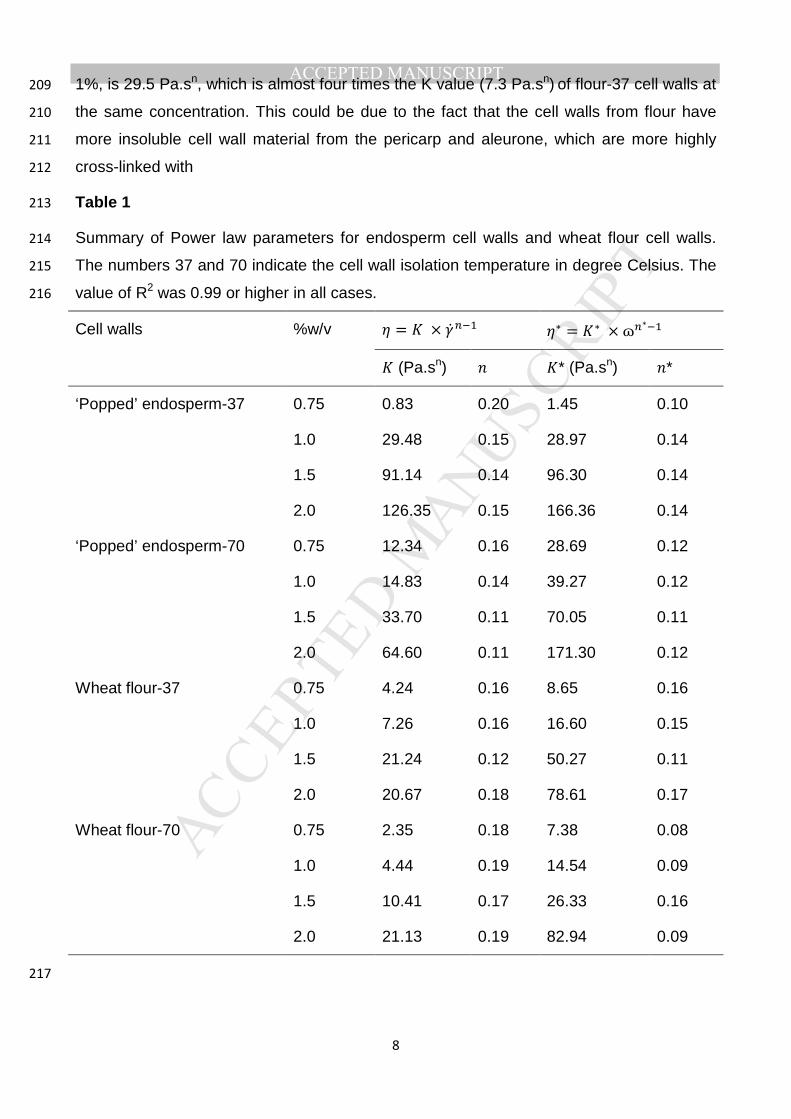
As can be seen from Table 1, the dynamic viscosity (η*) is higher than (or in some cases 194
almost equal to, eg. P-37- 1 and 1.5%) the steady shear viscosity (η). The empirical 195
relationship between dynamic and apparent viscosities is described using the Cox-Merz 196
rule, which states that the dynamic viscosity (η *) at a given frequency is equal to the 197
apparent viscosity (η) at the same shear rate (Cox & Merz, 1958). In almost all of the cell 198
wall samples, η * > η which indicates that there is structural breakdown of particles or 199
networks under steady shear deformation conditions. This deviation from the Cox-Merz 200
rule has been previously reported for a variety of colloidal suspensions (Al-Hadithi, Barnes, 201
& Walters, 1992; Shelat, et al., 2015; Wu, Dhital, Williams, Chen, & Gidley, 2016). 202
Also, the values of flow behaviour index (n) for all the samples are less than 1, indicating a 203
typical shear thinning behaviour. The concentration of cell walls does not seem to affect 204
greatly the values of n. The viscosity of the suspension increased with concentration for all 205
samples, with values for endosperm cell walls higher than those of flour cell walls. A 206
simple way to compare the viscosities is through the flow consistency index K which is 207
equal to the viscosity at 1 s-1. The K value of endosperm-37 cell walls at a concentration of 208
MANUSCRIP
T
ACCEPTED
ACCEPTED MANUSCRIPT
8
1%, is 29.5 Pa.sn, which is almost four times the K value (7.3 Pa.sn) of flour-37 cell walls at 209
the same concentration. This could be due to the fact that the cell walls from flour have 210
more insoluble cell wall material from the pericarp and aleurone, which are more highly 211
cross-linked with 212
Table 1 213
Summary of Power law parameters for endosperm cell walls and wheat flour cell walls. 214
The numbers 37 and 70 indicate the cell wall isolation temperature in degree Celsius. The 215
value of R2 was 0.99 or higher in all cases. 216
Cell walls %w/v � = � × ��� �∗ = ∗ × ɷ�∗
� (Pa.sn) � �* (Pa.sn) �*
‘Popped’ endosperm-37 0.75 0.83 0.20 1.45 0.10
1.0 29.48 0.15 28.97 0.14
1.5 91.14 0.14 96.30 0.14
2.0 126.35 0.15 166.36 0.14
‘Popped’ endosperm-70 0.75 12.34 0.16 28.69 0.12
1.0 14.83 0.14 39.27 0.12
1.5 33.70 0.11 70.05 0.11
2.0 64.60 0.11 171.30 0.12
Wheat flour-37 0.75 4.24 0.16 8.65 0.16
1.0 7.26 0.16 16.60 0.15
1.5 21.24 0.12 50.27 0.11
2.0 20.67 0.18 78.61 0.17
Wheat flour-70 0.75 2.35 0.18 7.38 0.08
1.0 4.44 0.19 14.54 0.09
1.5 10.41 0.17 26.33 0.16
2.0 21.13 0.19 82.94 0.09
217

MANUSCRIP
T
ACCEPTED
ACCEPTED MANUSCRIPT
9
FA compared to starchy endosperm cell walls (Gartaula, et al., 2018; Gartaula, et al., 218
2017). The temperature of cell wall isolation also seems to have an effect on the viscosity 219
of the samples. The cell walls isolated at 37 °C have higher viscosity values than those 220
isolated at 70 °C. For instance, K-values from endosperm-37 and flour-37 cell walls are 221
typically greater than for endosperm-70 and flour-70 cell walls respectively (Table 1). The 222
reduction in viscosity at 70 °C is most likely due to the loss of mixed linkage glucans during 223
the high temperature isolation process (Gartaula, et al., 2018). This is consistent with 224
mixed linkage glucans being present on the exterior of purified cell walls due to less 225
restriction from diFA crosslinks, and suggests that the rheology of cereal endosperm cell 226
walls is likely to depend on the source from which they are isolated. 227
The values of G’ or G” at low frequency (1 Hz) were chosen as response variables to 228
evaluate the effect of concentration on the rheology of cell walls (Fig. 1). 229
230
Fig. 1. Comparison of storage (filled symbols) and loss (open symbols) moduli of different 231
concentrations of cell walls suspension at 1 Hz for ‘popped’ endosperm cell walls (a) and 232
cell walls isolated from wheat flour (b). The numbers 37 and 70 represent the cell wall 233
isolation temperature. 234
For all samples (Fig. 1), the elastic modulus (G’) is greater than the loss modulus (G”) 235
indicating a characteristic weak gel-like behaviour or weakly-structured system. The cell 236
wall isolation temperature did not seem to have much effect on the values of the moduli 237
except for 0.75% which shows almost 10-fold difference in both the moduli. At this 238
concentration, there is also a large difference in the values of K* (Table 1). As the 239
concentration increases, both G’ and G” increases indicating that the gel becomes denser 240
with concentration (Löfgren, Walkenström, & Hermansson, 2002). In the case of cell walls 241
isolated from flour, there were no marked effect of isolation temperature on moduli, except 242
for 1.5% concentration. Similar G’ and G” values indicate a similarity in gel microstructure. 243
The tan delta values in all cases were less than 0.25, indicating solid-like behaviour of the 244
MANUSCRIP
T
ACCEPTED
ACCEPTED MANUSCRIPT
10
samples. The moduli of pure endosperm cell walls are always greater than that of cell 245
walls from flour at the same concentration. This suggests a higher water holding 246
capacity/swelling capacity of endosperm cell walls compared with flour cell walls, 247
presumably reflecting the denser and less swollen walls from contaminating pericarp and 248
aleurone tissues in the flour sample (Gartaula, et al., 2017). 249
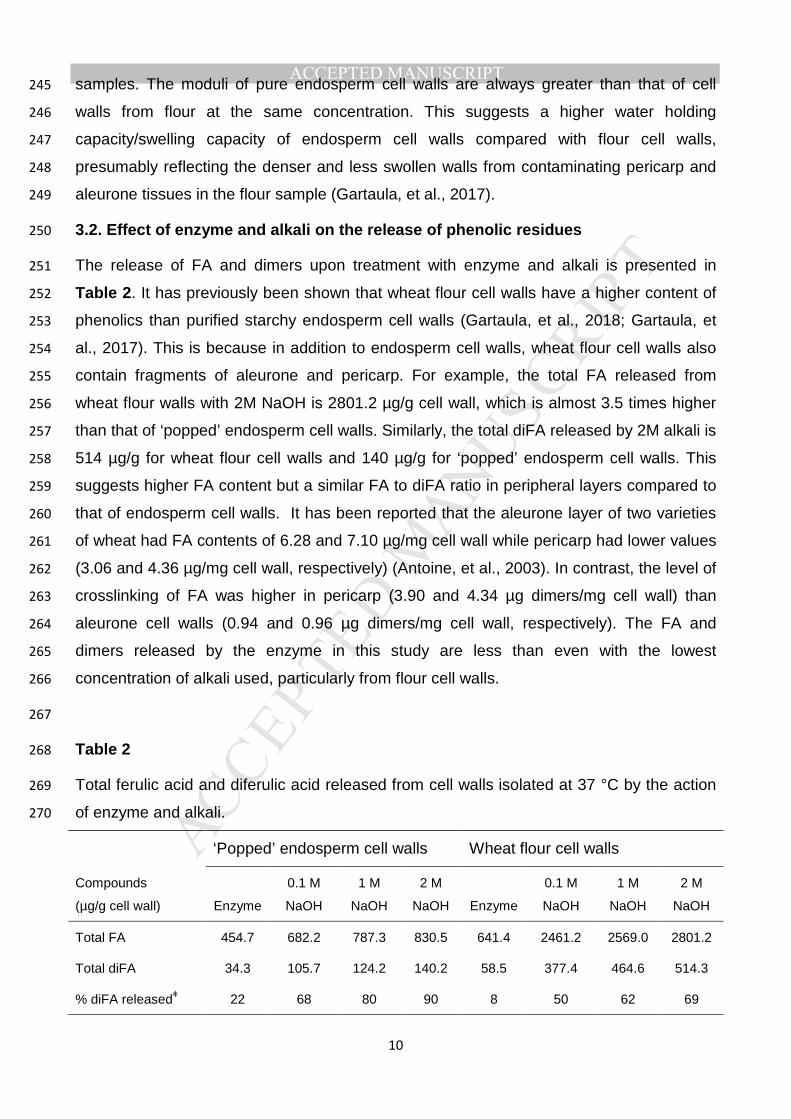
3.2. Effect of enzyme and alkali on the release of phenolic residues 250
The release of FA and dimers upon treatment with enzyme and alkali is presented in 251
Table 2. It has previously been shown that wheat flour cell walls have a higher content of 252
phenolics than purified starchy endosperm cell walls (Gartaula, et al., 2018; Gartaula, et 253
al., 2017). This is because in addition to endosperm cell walls, wheat flour cell walls also 254
contain fragments of aleurone and pericarp. For example, the total FA released from 255
wheat flour walls with 2M NaOH is 2801.2 µg/g cell wall, which is almost 3.5 times higher 256
than that of ‘popped’ endosperm cell walls. Similarly, the total diFA released by 2M alkali is 257
514 µg/g for wheat flour cell walls and 140 µg/g for ‘popped’ endosperm cell walls. This 258
suggests higher FA content but a similar FA to diFA ratio in peripheral layers compared to 259
that of endosperm cell walls. It has been reported that the aleurone layer of two varieties 260
of wheat had FA contents of 6.28 and 7.10 µg/mg cell wall while pericarp had lower values 261
(3.06 and 4.36 µg/mg cell wall, respectively) (Antoine, et al., 2003). In contrast, the level of 262
crosslinking of FA was higher in pericarp (3.90 and 4.34 µg dimers/mg cell wall) than 263
aleurone cell walls (0.94 and 0.96 µg dimers/mg cell wall, respectively). The FA and 264
dimers released by the enzyme in this study are less than even with the lowest 265
concentration of alkali used, particularly from flour cell walls. 266
267
Table 2 268
Total ferulic acid and diferulic acid released from cell walls isolated at 37 °C by the action 269
of enzyme and alkali. 270
‘Popped’ endosperm cell walls Wheat flour cell walls
Compounds
(µg/g cell wall) Enzyme
0.1 M
NaOH
1 M
NaOH
2 M
NaOH Enzyme
0.1 M
NaOH
1 M
NaOH
2 M
NaOH
Total FA 454.7 682.2 787.3 830.5 641.4 2461.2 2569.0 2801.2
Total diFA 34.3 105.7 124.2 140.2 58.5 377.4 464.6 514.3
% diFA releasedǂ 22 68 80 90 8 50 62 69
MANUSCRIP
T
ACCEPTED
ACCEPTED MANUSCRIPT
11
ǂ The percentage release is based on the total FA and diFA calculated after sequential 271
extraction in Gartaula, et al. (2018). 272
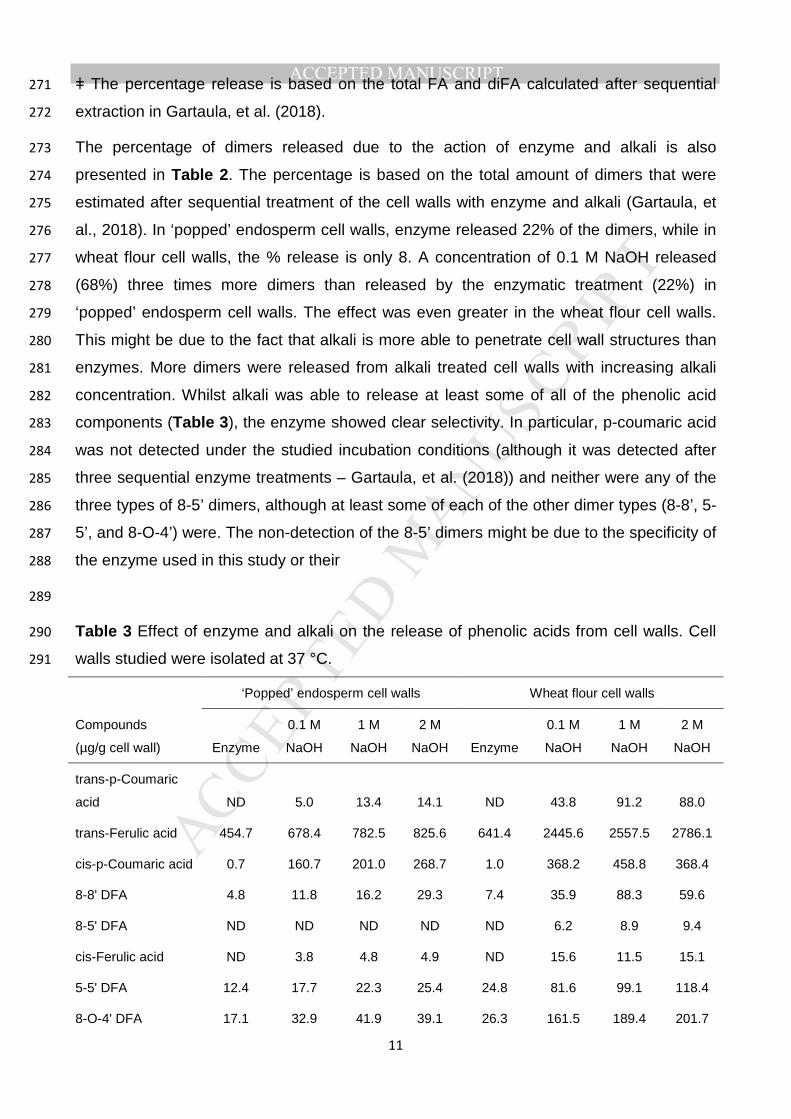
The percentage of dimers released due to the action of enzyme and alkali is also 273
presented in Table 2. The percentage is based on the total amount of dimers that were 274
estimated after sequential treatment of the cell walls with enzyme and alkali (Gartaula, et 275
al., 2018). In ‘popped’ endosperm cell walls, enzyme released 22% of the dimers, while in 276
wheat flour cell walls, the % release is only 8. A concentration of 0.1 M NaOH released 277
(68%) three times more dimers than released by the enzymatic treatment (22%) in 278
‘popped’ endosperm cell walls. The effect was even greater in the wheat flour cell walls. 279
This might be due to the fact that alkali is more able to penetrate cell wall structures than 280
enzymes. More dimers were released from alkali treated cell walls with increasing alkali 281
concentration. Whilst alkali was able to release at least some of all of the phenolic acid 282
components (Table 3), the enzyme showed clear selectivity. In particular, p-coumaric acid 283
was not detected under the studied incubation conditions (although it was detected after 284
three sequential enzyme treatments – Gartaula, et al. (2018)) and neither were any of the 285
three types of 8-5’ dimers, although at least some of each of the other dimer types (8-8’, 5-286
5’, and 8-O-4’) were. The non-detection of the 8-5’ dimers might be due to the specificity of 287
the enzyme used in this study or their 288
289
Table 3 Effect of enzyme and alkali on the release of phenolic acids from cell walls. Cell 290
walls studied were isolated at 37 °C. 291
‘Popped’ endosperm cell walls Wheat flour cell walls
Compounds
(µg/g cell wall) Enzyme
0.1 M
NaOH
1 M
NaOH
2 M
NaOH Enzyme
0.1 M
NaOH
1 M
NaOH
2 M
NaOH
trans-p-Coumaric
acid ND 5.0 13.4 14.1 ND 43.8 91.2 88.0
trans-Ferulic acid 454.7 678.4 782.5 825.6 641.4 2445.6 2557.5 2786.1
cis-p-Coumaric acid 0.7 160.7 201.0 268.7 1.0 368.2 458.8 368.4
8-8' DFA 4.8 11.8 16.2 29.3 7.4 35.9 88.3 59.6
8-5' DFA ND ND ND ND ND 6.2 8.9 9.4
cis-Ferulic acid ND 3.8 4.8 4.9 ND 15.6 11.5 15.1
5-5' DFA 12.4 17.7 22.3 25.4 24.8 81.6 99.1 118.4
8-O-4' DFA 17.1 32.9 41.9 39.1 26.3 161.5 189.4 201.7
MANUSCRIP
T
ACCEPTED
ACCEPTED MANUSCRIPT
12
8-5' DFA
benzofuran form ND 38.5 40.7 42.8 ND 80.2 68.9 109.5
8-5' decarboxylated
DFA ND 4.8 3.1 3.6 ND 12.0 10.0 15.7
ND- not detected 292
concentration being too low to be detected. Similar to our findings, alkali extraction 293
released five different dimers from wheat bran, but enzyme treatment (feruloyl esterase-III 294
from Aspergillus niger) released only a small amount of 5-5’ dimer (Bartolomé, et al., 295
1997). In another study, out of three sources tested, one (from Aspergillus niger) could 296
release 5-5’ dimer from wheat arabinoxylans, but only upon addition of xylanase (Faulds, 297
et al., 2003). Hence, it is likely that the enzyme lacks the specificity to cleave 8-5’ dimers, 298
and this may have limited both access of enzyme to cell wall interiors and the consequent 299
swelling and rheological changes. 300
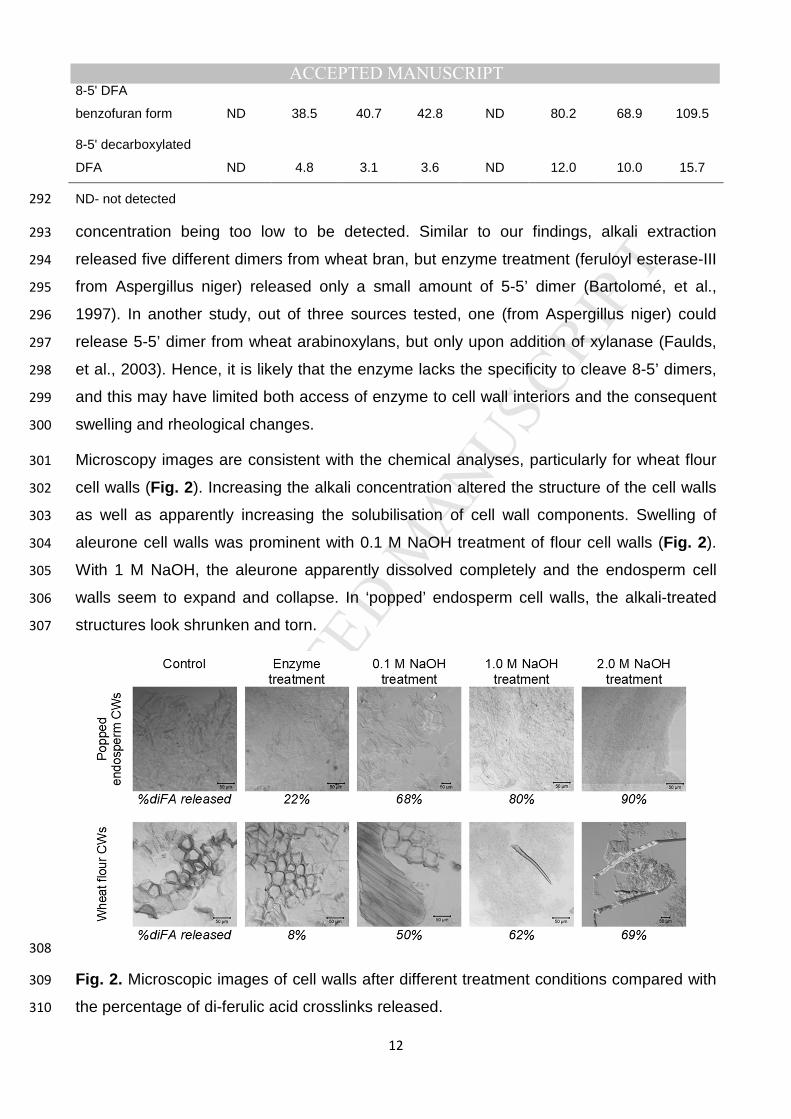
Microscopy images are consistent with the chemical analyses, particularly for wheat flour 301
cell walls (Fig. 2). Increasing the alkali concentration altered the structure of the cell walls 302
as well as apparently increasing the solubilisation of cell wall components. Swelling of 303
aleurone cell walls was prominent with 0.1 M NaOH treatment of flour cell walls (Fig. 2). 304
With 1 M NaOH, the aleurone apparently dissolved completely and the endosperm cell 305
walls seem to expand and collapse. In ‘popped’ endosperm cell walls, the alkali-treated 306
structures look shrunken and torn. 307
308
Fig. 2. Microscopic images of cell walls after different treatment conditions compared with 309
the percentage of di-ferulic acid crosslinks released. 310
MANUSCRIP
T
ACCEPTED
ACCEPTED MANUSCRIPT
13
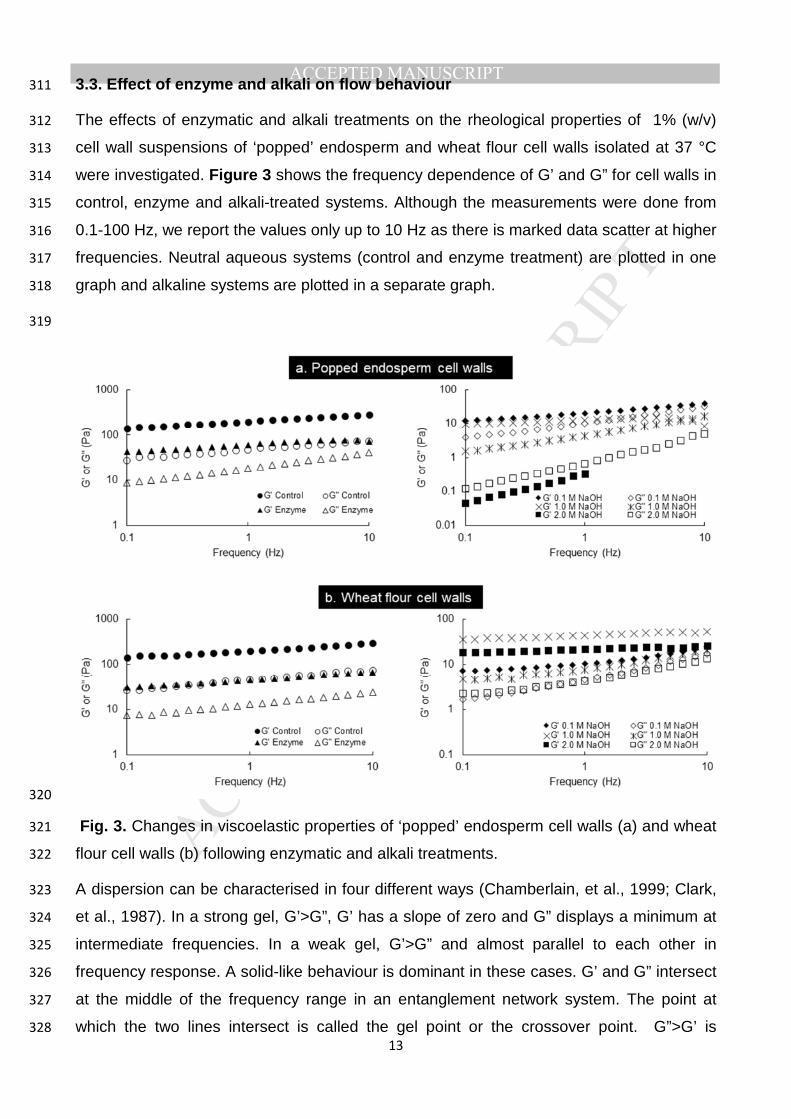
3.3. Effect of enzyme and alkali on flow behaviour 311
The effects of enzymatic and alkali treatments on the rheological properties of 1% (w/v) 312
cell wall suspensions of ‘popped’ endosperm and wheat flour cell walls isolated at 37 °C 313
were investigated. Figure 3 shows the frequency dependence of G’ and G” for cell walls in 314
control, enzyme and alkali-treated systems. Although the measurements were done from 315
0.1-100 Hz, we report the values only up to 10 Hz as there is marked data scatter at higher 316
frequencies. Neutral aqueous systems (control and enzyme treatment) are plotted in one 317
graph and alkaline systems are plotted in a separate graph. 318
319
320
Fig. 3. Changes in viscoelastic properties of ‘popped’ endosperm cell walls (a) and wheat 321
flour cell walls (b) following enzymatic and alkali treatments. 322
A dispersion can be characterised in four different ways (Chamberlain, et al., 1999; Clark, 323
et al., 1987). In a strong gel, G’>G”, G’ has a slope of zero and G” displays a minimum at 324
intermediate frequencies. In a weak gel, G’>G” and almost parallel to each other in 325
frequency response. A solid-like behaviour is dominant in these cases. G’ and G” intersect 326
at the middle of the frequency range in an entanglement network system. The point at 327
which the two lines intersect is called the gel point or the crossover point. G”>G’ is 328
MANUSCRIP
T
ACCEPTED
ACCEPTED MANUSCRIPT
14
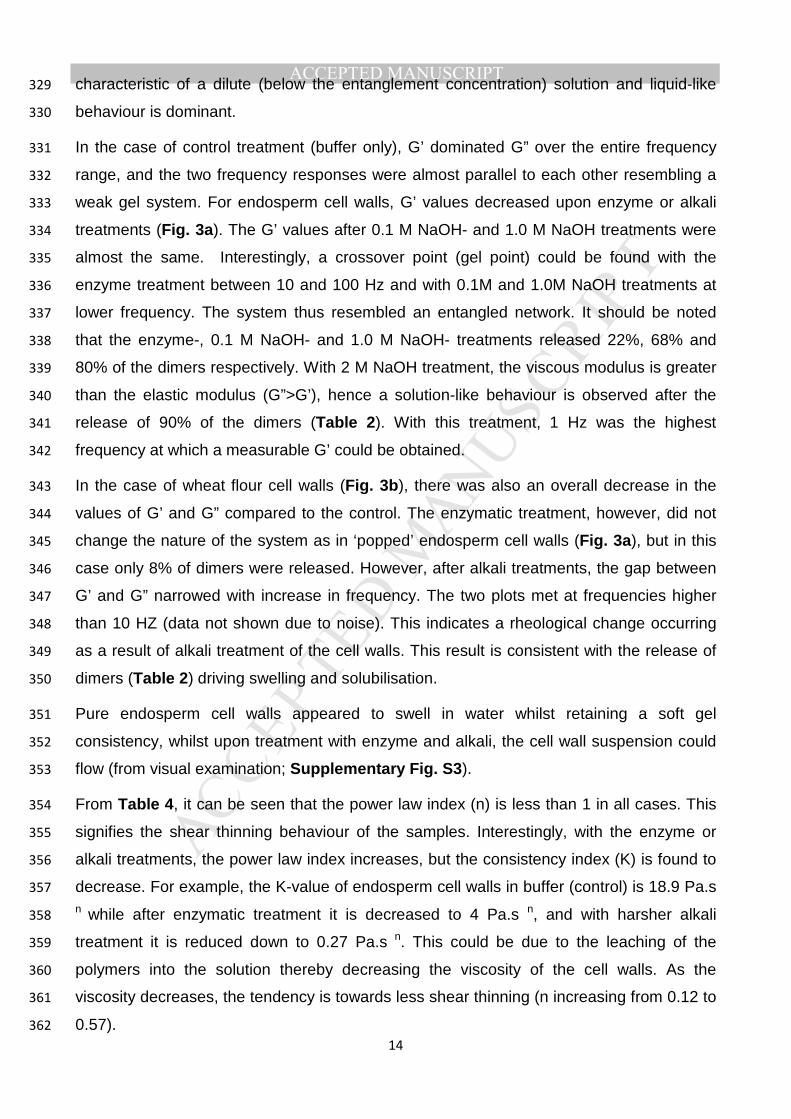
characteristic of a dilute (below the entanglement concentration) solution and liquid-like 329
behaviour is dominant. 330
In the case of control treatment (buffer only), G’ dominated G” over the entire frequency 331
range, and the two frequency responses were almost parallel to each other resembling a 332
weak gel system. For endosperm cell walls, G’ values decreased upon enzyme or alkali 333
treatments (Fig. 3a). The G’ values after 0.1 M NaOH- and 1.0 M NaOH treatments were 334
almost the same. Interestingly, a crossover point (gel point) could be found with the 335
enzyme treatment between 10 and 100 Hz and with 0.1M and 1.0M NaOH treatments at 336
lower frequency. The system thus resembled an entangled network. It should be noted 337
that the enzyme-, 0.1 M NaOH- and 1.0 M NaOH- treatments released 22%, 68% and 338
80% of the dimers respectively. With 2 M NaOH treatment, the viscous modulus is greater 339
than the elastic modulus (G”>G’), hence a solution-like behaviour is observed after the 340
release of 90% of the dimers (Table 2). With this treatment, 1 Hz was the highest 341
frequency at which a measurable G’ could be obtained. 342
In the case of wheat flour cell walls (Fig. 3b), there was also an overall decrease in the 343
values of G’ and G” compared to the control. The enzymatic treatment, however, did not 344
change the nature of the system as in ‘popped’ endosperm cell walls (Fig. 3a), but in this 345
case only 8% of dimers were released. However, after alkali treatments, the gap between 346
G’ and G” narrowed with increase in frequency. The two plots met at frequencies higher 347
than 10 HZ (data not shown due to noise). This indicates a rheological change occurring 348
as a result of alkali treatment of the cell walls. This result is consistent with the release of 349
dimers (Table 2) driving swelling and solubilisation. 350
Pure endosperm cell walls appeared to swell in water whilst retaining a soft gel 351
consistency, whilst upon treatment with enzyme and alkali, the cell wall suspension could 352
flow (from visual examination; Supplementary Fig. S3). 353
From Table 4, it can be seen that the power law index (n) is less than 1 in all cases. This 354
signifies the shear thinning behaviour of the samples. Interestingly, with the enzyme or 355
alkali treatments, the power law index increases, but the consistency index (K) is found to 356
decrease. For example, the K-value of endosperm cell walls in buffer (control) is 18.9 Pa.s 357
n while after enzymatic treatment it is decreased to 4 Pa.s n, and with harsher alkali 358
treatment it is reduced down to 0.27 Pa.s n. This could be due to the leaching of the 359
polymers into the solution thereby decreasing the viscosity of the cell walls. As the 360
viscosity decreases, the tendency is towards less shear thinning (n increasing from 0.12 to 361
0.57). 362
MANUSCRIP
T
ACCEPTED
ACCEPTED MANUSCRIPT
15
363
364
365
366
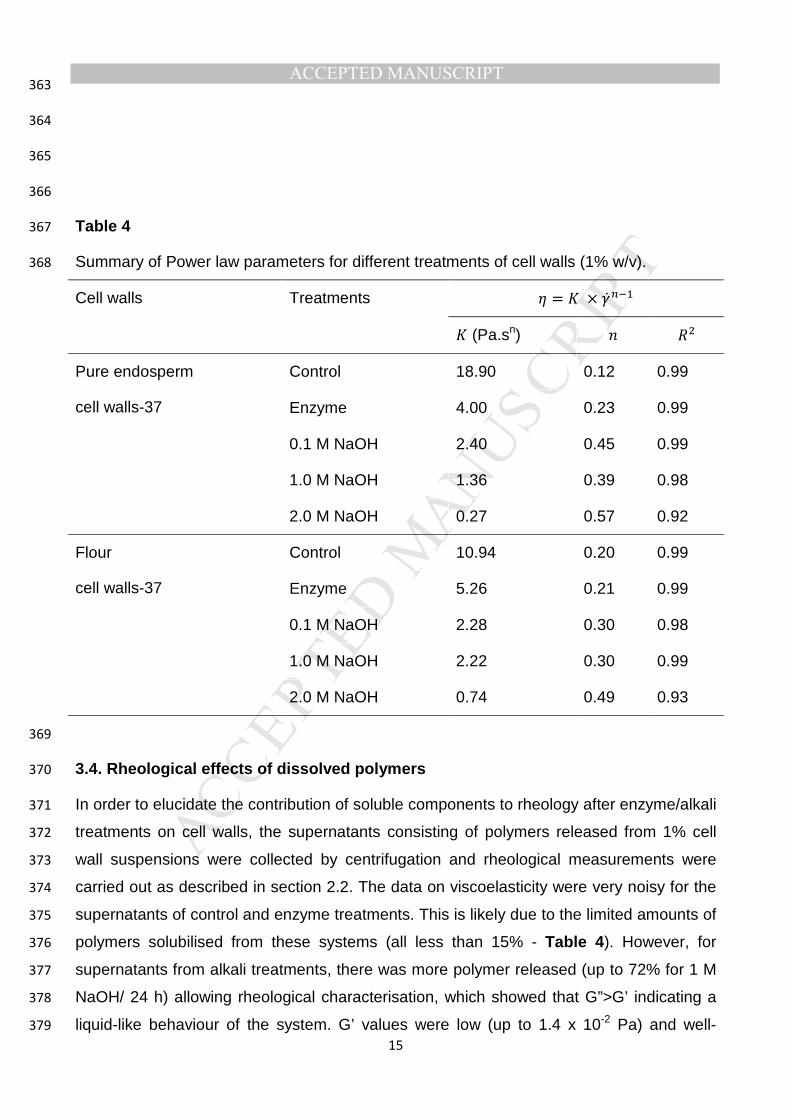
Table 4 367
Summary of Power law parameters for different treatments of cell walls (1% w/v). 368
Cell walls Treatments � = � × ���
� (Pa.sn) � ��
Pure endosperm
cell walls-37
Control 18.90 0.12 0.99
Enzyme 4.00 0.23 0.99
0.1 M NaOH 2.40 0.45 0.99
1.0 M NaOH 1.36 0.39 0.98
2.0 M NaOH 0.27 0.57 0.92
Flour
cell walls-37
Control 10.94 0.20 0.99
Enzyme 5.26 0.21 0.99
0.1 M NaOH 2.28 0.30 0.98
1.0 M NaOH 2.22 0.30 0.99
2.0 M NaOH 0.74 0.49 0.93
369
3.4. Rheological effects of dissolved polymers 370
In order to elucidate the contribution of soluble components to rheology after enzyme/alkali 371
treatments on cell walls, the supernatants consisting of polymers released from 1% cell 372
wall suspensions were collected by centrifugation and rheological measurements were 373
carried out as described in section 2.2. The data on viscoelasticity were very noisy for the 374
supernatants of control and enzyme treatments. This is likely due to the limited amounts of 375
polymers solubilised from these systems (all less than 15% - Table 4). However, for 376
supernatants from alkali treatments, there was more polymer released (up to 72% for 1 M 377
NaOH/ 24 h) allowing rheological characterisation, which showed that G”>G’ indicating a 378
liquid-like behaviour of the system. G’ values were low (up to 1.4 x 10⁻² Pa) and well-379
MANUSCRIP
T
ACCEPTED
ACCEPTED MANUSCRIPT
16
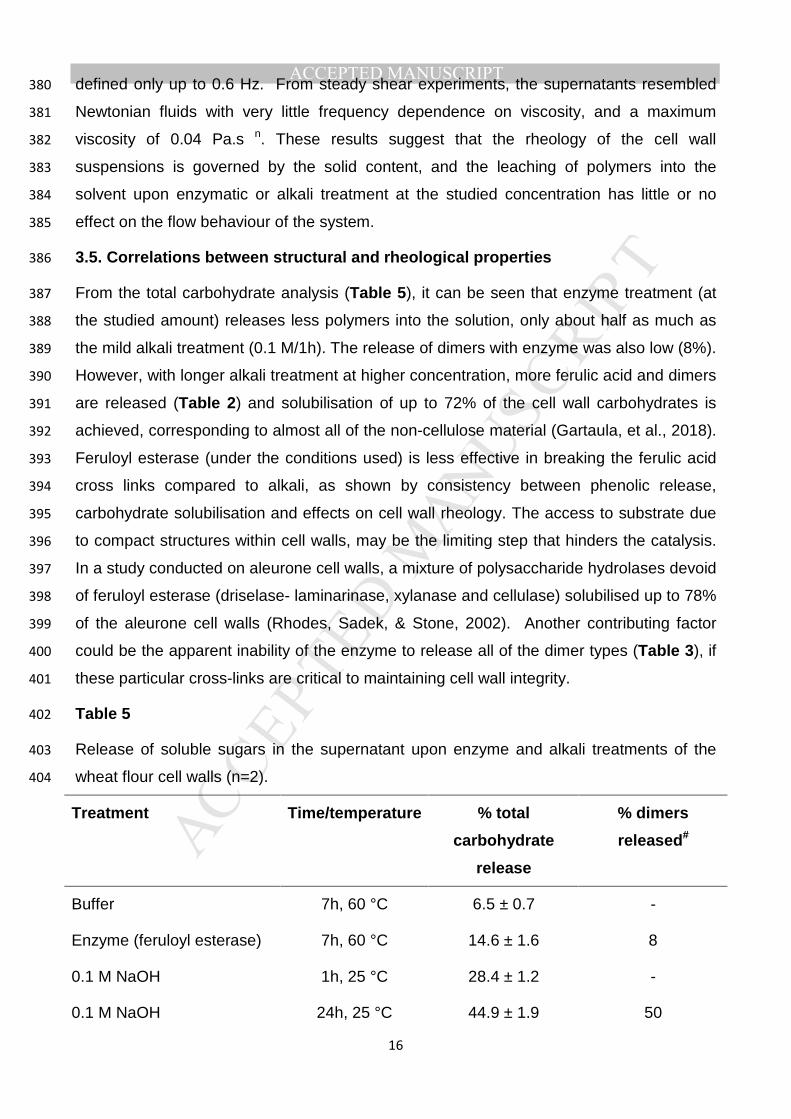
defined only up to 0.6 Hz. From steady shear experiments, the supernatants resembled 380
Newtonian fluids with very little frequency dependence on viscosity, and a maximum 381
viscosity of 0.04 Pa.s n. These results suggest that the rheology of the cell wall 382
suspensions is governed by the solid content, and the leaching of polymers into the 383
solvent upon enzymatic or alkali treatment at the studied concentration has little or no 384
effect on the flow behaviour of the system. 385
3.5. Correlations between structural and rheological properties 386
From the total carbohydrate analysis (Table 5), it can be seen that enzyme treatment (at 387
the studied amount) releases less polymers into the solution, only about half as much as 388
the mild alkali treatment (0.1 M/1h). The release of dimers with enzyme was also low (8%). 389
However, with longer alkali treatment at higher concentration, more ferulic acid and dimers 390
are released (Table 2) and solubilisation of up to 72% of the cell wall carbohydrates is 391
achieved, corresponding to almost all of the non-cellulose material (Gartaula, et al., 2018). 392
Feruloyl esterase (under the conditions used) is less effective in breaking the ferulic acid 393
cross links compared to alkali, as shown by consistency between phenolic release, 394
carbohydrate solubilisation and effects on cell wall rheology. The access to substrate due 395
to compact structures within cell walls, may be the limiting step that hinders the catalysis. 396
In a study conducted on aleurone cell walls, a mixture of polysaccharide hydrolases devoid 397
of feruloyl esterase (driselase- laminarinase, xylanase and cellulase) solubilised up to 78% 398
of the aleurone cell walls (Rhodes, Sadek, & Stone, 2002). Another contributing factor 399
could be the apparent inability of the enzyme to release all of the dimer types (Table 3), if 400
these particular cross-links are critical to maintaining cell wall integrity. 401
Table 5 402
Release of soluble sugars in the supernatant upon enzyme and alkali treatments of the 403
wheat flour cell walls (n=2). 404
Treatment Time/temperature % total
carbohydrate
release
% dimers
released#
Buffer 7h, 60 °C 6.5 ± 0.7 -
Enzyme (feruloyl esterase) 7h, 60 °C 14.6 ± 1.6 8
0.1 M NaOH 1h, 25 °C 28.4 ± 1.2 -
0.1 M NaOH 24h, 25 °C 44.9 ± 1.9 50

MANUSCRIP
T
ACCEPTED
ACCEPTED MANUSCRIPT
17
1.0 M NaOH 1h, 25 °C 65.3 ± 0.1 -
1.0 M NaOH 24h, 25 °C 71.9 ± 0.9 62
# Data from Table 2. – No dimer analysis done under these conditions. 405
Hence, from the combined results of rheology and the content of sugars in the supernatant 406
(Table 5), it is confirmed that the solutes in the supernatant do not contribute in a major 407
way to the rheological properties of the whole suspension. Our results are consistent with 408
studies carried out on digesta from animals, which showed that the removal of particles 409
from digesta altered the viscous behaviour of solutions, changing them from non-410
Newtonian to Newtonian (Dikeman, Barry, Murphy, & Fahey, 2007; Takahashi & Sakata, 411
2004). More generally, as a target for enhanced nutritional functionality through physical 412
structuring in the digestive tract, overall digesta structuring should be considered as more 413
important than maximising the solubility of cell wall polysaccharides. 414
4. Conclusions 415
The effects of feruloyl esterase and sodium hydroxide on the rheological and structural 416
properties of cell walls from refined wheat flour and purified endosperm were studied. Our 417
results show that the rheological properties of the cell walls of starchy endosperm are 418
different to those of cell walls isolated from wheat flour that also contain some peripheral 419
layers, with endosperm cell walls having a higher swelling capacity leading to more elastic 420
behaviour. The effect of enzyme and alkali treatment was evident in the flow behaviour of 421
the cell walls, and correlated well with the relative loss of phenolic acids and dimers. With 422
enzyme treatment, changes were modest. However, with alkali treatments, the rheological 423
properties altered markedly. These experiments lend support to the hypothesis that there 424
is a role for ferulic acid crosslinking in the insolubilisation of cell walls, even for endosperm 425
cell walls where it has been estimated (Gartaula, et al., 2018) that there is only one 426
phenolic acid dimer per 12 arabinoxylan molecules on average. The ability to enhance the 427
swelling (and subsequent solubilisation) of wheat flour cell walls offers a potential route to 428
increasing the physical structuring of digesta for nutritional benefits. This knowledge may 429
be able to be applied to wheat flour so as to produce foods based on wheat with increased 430
soluble/swellable fibre functionality. 431
432
MANUSCRIP
T
ACCEPTED
ACCEPTED MANUSCRIPT
18
Acknowledgements 433
The first author would like to acknowledge the support of University of Queensland 434
International Scholarship (UQI). Dr Gleb Yakubov and Dr Heather Shewan are gratefully 435
acknowledged for helpful discussions. This work was supported by the Australian 436
Research Council Centre of Excellence in Plant Cell Walls (CE110001007). 437
438
MANUSCRIP
T
ACCEPTED
ACCEPTED MANUSCRIPT
19
References 439
Al-Hadithi, T. S. R., Barnes, H. A., & Walters, K. (1992). The relationship between the 440
linear (oscillatory) and nonlinear (steady-state) flow properties of a series of 441
polymer and colloidal systems. Colloid and Polymer Science, 270(1), 40-46. 442
Antoine, C., Peyron, S., Mabille, F., Lapierre, C., Bouchet, B., Abecassis, J., & Rouau, X. 443
(2003). Individual contribution of grain outer layers and their cell wall structure to the 444
mechanical properties of wheat bran. Journal of Agricultural and Food Chemistry, 445
51(7), 2026-2033. 446
Bacic, A., & Stone, B. A. (1980). A (1→3)- and (1→4)-linked β-d-glucan in the endosperm 447
cell-walls of wheat. Carbohydrate Research, 82(2), 372-377. 448
Bartolomé, B., Faulds, C. B., Kroon, P. A., Waldron, K., Gilbert, H. J., Hazlewood, G., & 449
Williamson, G. (1997). An Aspergillus niger esterase (ferulic acid esterase III) and a 450
recombinant Pseudomonas fluorescens subsp. cellulosa esterase (Xy1D) release a 451
5-5' ferulic dehydrodimer (diferulic acid) from barley and wheat cell walls. Applied 452
and Environmental Microbiology, 63(1), 208-212. 453
Bunzel, M. (2010). Chemistry and occurrence of hydroxycinnamate oligomers. 454
Phytochemistry Reviews, 9(1), 47-64. 455
Bunzel, M., Ralph, J., Marita, J. M., Hatfield, R. D., & Steinhart, H. (2001). Diferulates as 456
structural components in soluble and insoluble cereal dietary fibre. Journal of the 457
Science of Food and Agriculture, 81(7), 653-660. 458
Cameron-Smith, D., Collier, G. R., & O'Dea, K. (1994). Effect of soluble dietary fibre on the 459
viscosity of gastrointestinal contents and the acute glycaemic response in the rat. 460
British Journal of Nutrition, 71(4), 563-571. 461
Chamberlain, E. K., & Rao, M. A. (1999). Rheological properties of acid converted waxy 462
maize starches in water and 90% DMSO/10% water. Carbohydrate Polymers, 463
40(4), 251-260. 464
Clark, A. H., & Ross-Murphy, S. B. (1987). Structural and mechanical properties of 465
biopolymer gels. In (pp. 57-192). Berlin, Heidelberg: Springer Berlin Heidelberg. 466
Cox, W. P., & Merz, E. H. (1958). Correlation of dynamic and steady flow viscosities. 467
Journal of Polymer Science, 28(118), 619-622. 468
Daou, C., & Zhang, H. (2012). Oat Beta-Glucan: Its Role in Health Promotion and 469
Prevention of Diseases. Comprehensive Reviews in Food Science and Food 470
Safety, 11(4), 355-365. 471
Dikeman, C. L., Barry, K. A., Murphy, M. R., & Fahey, G. C. (2007). Diet and measurement 472
techniques affect small intestinal digesta viscosity among dogs. Nutrition Research, 473
27(1), 56-65. 474
Dikeman, C. L., & Fahey, G. C. (2006). Viscosity as related to dietary fiber: A review. 475
Critical Reviews in Food Science and Nutrition, 46(8), 649-663. 476
Dikeman, C. L., Murphy, M. R., & Fahey, J. G. C. (2006). Dietary Fibers Affect Viscosity of 477
Solutions and Simulated Human Gastric and Small Intestinal Digesta. The Journal 478
of Nutrition, 136(4), 913-919. 479
Dobberstein, D., & Bunzel, M. (2010). Separation and Detection of Cell Wall-Bound Ferulic 480
Acid Dehydrodimers and Dehydrotrimers in Cereals and Other Plant Materials by 481
Reversed Phase High-Performance Liquid Chromatography With Ultraviolet 482
Detection. Journal of Agricultural and Food Chemistry, 58(16), 8927-8935. 483
DuBois, M., Gilles, K. A., Hamilton, J. K., Rebers, P. t., & Smith, F. (1956). Colorimetric 484
method for determination of sugars and related substances. Analytical chemistry, 485
28(3), 350-356. 486
Eraso, F., & Hartley, R. D. (1990). Monomeric and dimeric phenolic constituents of plant 487
cell walls—possible factors influencing wall biodegradability. Journal of the Science 488
of Food and Agriculture, 51(2), 163-170. 489
MANUSCRIP
T
ACCEPTED
ACCEPTED MANUSCRIPT
20
Faulds, C. B., Zanichelli, D., Crepin, V. F., Connerton, I. F., Juge, N., Bhat, M. K., & 490
Waldron, K. W. (2003). Specificity of feruloyl esterases for water-extractable and 491
water-unextractable feruloylated polysaccharides: influence of xylanase. Journal of 492
Cereal Science, 38(3), 281-288. 493
Gartaula, G., Dhital, S., Netzel, G., Flanagan, B. M., Yakubov, G. E., Beahan, C. T., 494
Collins, H. M., Burton, R. A., Bacic, A., & Gidley, M. J. (2018). Quantitative 495
structural organisation model for wheat endosperm cell walls: Cellulose as an 496
important constituent. Carbohydrate Polymers, 196, 199-208. 497
Gartaula, G., Dhital, S., Pleming, D., & Gidley, M. J. (2017). Isolation of wheat endosperm 498
cell walls: Effects of non-endosperm flour components on structural analyses. 499
Journal of Cereal Science, 74, 165-173. 500
Gidley, M. J. (2013). Hydrocolloids in the digestive tract and related health implications. 501
Current Opinion in Colloid & Interface Science, 18(4), 371-378. 502
Gunness, P., & Gidley, M. J. (2010). Mechanisms underlying the cholesterol-lowering 503
properties of soluble dietary fibre polysaccharides. Food & Function, 1(2), 149-155. 504
Hartley, R. D., Morrison III, W. H., Himmelsbach, D. S., & Borneman, W. S. (1990). Cross-505
linking of cell wall phenolic arabinoxylans in graminaceous plants. Phytochemistry, 506
29(12), 3705-3709. 507
Hatfield, R. D., Ralph, J., & Grabber, J. H. (1999). Cell wall cross-linking by ferulates and 508
diferulates in grasses. Journal of the Science of Food and Agriculture, 79(3), 403-509
407. 510
Holdsworth, S. D. (1971). Applicability of rheological models to the interpretation of flow 511
and processing behaviour of fluid food products. Journal of Texture Studies, 2(4), 512
393-418. 513
Kamisaka, S., Takeda, S., Takahashi, K., & Shibata, K. (1990). Diferulic and ferulic acid in 514
the cell wall of Avena coleoptiles—Their relationships to mechanical properties of 515
the cell wall. Physiologia Plantarum, 78(1), 1-7. 516
Löfgren, C., Walkenström, P., & Hermansson, A.-M. (2002). Microstructure and 517
Rheological Behavior of Pure and Mixed Pectin Gels. Biomacromolecules, 3(6), 518
1144-1153. 519
Mälkki, Y., & Virtanen, E. (2001). Gastrointestinal Effects of Oat Bran and Oat Gum: A 520
Review. LWT-Food Science and Technology, 34(6), 337-347. 521
Rhodes, D., Sadek, M., & Stone, B. A. (2002). Hydroxycinnamic acids in walls of wheat 522
aleurone cells. Journal of Cereal Science, 36(1), 67-81. 523
Saulnier, L., Sado, P.-E., Branlard, G., Charmet, G., & Guillon, F. (2007). Wheat 524
arabinoxylans: exploiting variation in amount and composition to develop enhanced 525
varieties. Journal of Cereal Science, 46(3), 261-281. 526
Shelat, K. J., Nicholson, T., Flanagan, B. M., Zhang, D., Williams, B. A., & Gidley, M. J. 527
(2015). Rheology and microstructure characterisation of small intestinal digesta 528
from pigs fed a red meat-containing Western-style diet. Food Hydrocolloids, 44, 529
300-308. 530
Slavin, J., & Green, H. (2007). Dietary fibre and satiety. Nutrition Bulletin, 32, 32-42. 531
Takahashi, T., & Sakata, T. (2004). Viscous properties of pig cecal contents and the 532
contribution of solid particles to viscosity. Nutrition, 20(4), 377-382. 533
Topping, D. (2007). Cereal complex carbohydrates and their contribution to human health. 534
Journal of Cereal Science, 46(3), 220-229. 535
Waldron, K. W., Parr, A. J., Ng, A., & Ralph, J. (1996). Cell wall esterified phenolic dimers: 536
Identification and quantification by reverse phase high performance liquid 537
chromatography and diode array detection. Phytochemical Analysis, 7(6), 305-312. 538
Wu, P., Dhital, S., Williams, B. A., Chen, X. D., & Gidley, M. J. (2016). Rheological and 539
microstructural properties of porcine gastric digesta and diets containing pectin or 540
mango powder. Carbohydrate Polymers, 148, 216-226. 541
MANUSCRIP
T
ACCEPTED
ACCEPTED MANUSCRIPT
21
Figure Captions 542
Fig. 1. Comparison of storage (filled symbols) and loss (open symbols) moduli of different 543
concentrations of cell walls suspension at 1 Hz for ‘popped’ endosperm cell walls (a) and 544
cell walls isolated from wheat flour (b). The numbers 37 and 70 represent the cell wall 545
isolation temperature. 546
Fig. 2. Microscopic images of cell walls after different treatment conditions compared with 547
the percentage of di-ferulic acid crosslinks released. 548
Fig. 3. Changes in viscoelastic properties of ‘popped’ endosperm cell walls (a) and wheat 549
flour cell walls (b) following enzymatic and alkali treatments. 550
MANUSCRIP
T
ACCEPTED
ACCEPTED MANUSCRIPT
Highlights:
• Pure wheat endosperm cell walls differ rheologically to those isolated from
flour
• Enzyme and alkali treatment alters the rheological properties of wheat cell
walls
• Cell walls lose their structural integrity after enzyme/alkali treatments
• Changes in rheology correlate well with relative loss of phenolic acids