rheology of oil well cement slurries
TRANSCRIPT
8/18/2019 Rheology of Oil Well Cement Slurries
http://slidepdf.com/reader/full/rheology-of-oil-well-cement-slurries 1/274
INVESTIGATION ON RHEOLOGY OF OIL WELL CEMENT SLURRIES
(Spine title: Rheology of oil well cement slurries)
(Thesis format: Integrated Article)
by
Anjuman Shahriar
Graduate Program in Engineering ScienceDepartment of Civil and Environmental Engineering
A thesis submitted in partial fulfillmentof the requirements for the degree of
Doctor of Philosophy
The School of Graduate and Postdoctoral StudiesThe University of Western Ontario
London, Ontario, Canada
© Anjuman Shahriar 2011
8/18/2019 Rheology of Oil Well Cement Slurries
http://slidepdf.com/reader/full/rheology-of-oil-well-cement-slurries 2/274
ii
THE UNIVERSITY OF WESTERN ONTARIOSchool of Graduate and Postdoctoral Studies
CERTIFICATE OF EXAMINATION
Supervisor
______________________________Dr. Moncef Nehdi
Supervisory Committee
______________________________
______________________________
Examiners
______________________________Dr. Maged A. Youssef
______________________________Dr. Craig Miller
______________________________Dr. Liying Jiang
______________________________Dr. Ammar Yahia
The thesis by
Anjuman Shahriar
entitled:
Investigation on Rheology of Oil Well Cement Slurr ies
is accepted in partial fulfillment of therequirements for the degree of
Doctor of Philosophy
______________________ _______________________________Date Chair of the Thesis Examination Board
8/18/2019 Rheology of Oil Well Cement Slurries
http://slidepdf.com/reader/full/rheology-of-oil-well-cement-slurries 3/274
iii
ABSTRACT
The rheology of oil well cement (OWC) slurries is generally more complicated than that of
conventional cement paste. In order to contend with bottom hole conditions (wide range of
pressure and temperature), a number of additives are usually used in the OWC slurries, whichexhibit different characteristics depending on the combination of admixture used. The
objective of this research is to develop a fundamental understanding of the important
mechanisms that affect the rheology of OWC slurry incorporating various chemical and
mineral admixtures. The partial replacement of OWC using different mineral admixtures,
offers both environmental and economic benefits.
The mechanisms underlying the effects of chemical admixtures on the rheology of OWC
slurry were investigated at different temperatures using an advanced shear-stress/shear-straincontrolled rheometer. The compatibility and interactions between the binder and chemical
admixtures were explored. It was found that the rheological properties of OWC slurries are
highly dependent on the temperature, water/cement ratio, and the admixture used. Coupled
effects of temperature and chemical admixtures had a substantial effect on the flow properties of
the slurries. The results indicated that current technical data for chemical admixtures need to
be validated for oil well cementing; admixtures proven effective in normal cementing work
at moderate temperature may become ineffective for oil well cementing at high temperature.
The coupled effects of temperature and supplementary cementing materials (SCMs) on the
rheology of OWC slurry were also investigated. Because of differences in their chemical
compositions and the mechanisms by which they act, OWC slurries incorporating SCMs
exhibit different rheological behaviour than those prepared with pure OWC. It was found that
not all SCMs act in similar manner when used as partial replacement for cement. For
example, fly ash, owing to its spherical particle shape, reduces the water demand when used.
On the other hand, silica fume increased the water demand because of its higher surface area.
Results suggested that new generation polycarboxylate-based high-range water reducing
admixtures (PCH) improved the rheological properties of all slurries at all temperature tested.
However, lower PCH dosage was found to be less efficient in reducing the yield stress or
plastic viscosity of OWC slurries when metakaolin (MK) or rice husk ash (RHA) were used
8/18/2019 Rheology of Oil Well Cement Slurries
http://slidepdf.com/reader/full/rheology-of-oil-well-cement-slurries 4/274
8/18/2019 Rheology of Oil Well Cement Slurries
http://slidepdf.com/reader/full/rheology-of-oil-well-cement-slurries 5/274
v
COPYRIGHT AND CO-AUTHORSHIP
This thesis has been prepared in accordance with the specifications of Integrated Article
(Formerly Manuscript) format stipulated by the Faculty of Graduate Studies at The
University of Western Ontario. All the experimental works were conducted in the Advanced
Concrete Technology Laboratory at the University of Western Ontario by the author under
the supervision of Prof. Moncef Nehdi. Major portions of the work outlined in this thesis
have been published or are under review (see list below) for possible publication in peer-reviewed technical journals and conferences. The author carried out all experimental work,
data analysis, modeling process, and writing of the initial draft of all papers listed below. The
contribution of her research advisor consisted of providing guidance and supervision, and
helping in the development of the final versions of the publications.
Refereed Journal Publications
1. Shahriar, A., and Nehdi, M. (2010) Effect of chemical admixture on rheology of oil well
cement slurries. Accepted in Construction Materials, ICE, Jul 2010, 40 p, (ID: COMA-D-
10-00023R1).
2. Shahriar, A., and Nehdi, M. (2010) Artificial intelligence model for rheological
properties of oil well cement slurries. Submitted to ASCE Journal of Materials in Civil
Engineering.
3. Shahriar, A., and Nehdi, M. (2011) Modeling rheological properties of oil well cement
slurries using artificial neural networks and multiple regression analysis. Submitted to
Construction & Building Materials.
8/18/2019 Rheology of Oil Well Cement Slurries
http://slidepdf.com/reader/full/rheology-of-oil-well-cement-slurries 6/274
vi
4. Shahriar, A., and Nehdi, M. (2011) Artificial intelligence model for rheological
properties of oil well cement slurries incorporating supplementary cementitious materials.
Submitted to Advances in Cement Research.
5. Shahriar, A., and Nehdi, M. (2011) Optimization of Rheological Properties of Oil WellCement Slurries Using Experimental Design. Submitted to Cement and Concrete
research.
6. Shahriar, A., and Nehdi, M. (2008) Effect of supplementary cementitious materials on
rheology of oil well cement slurries. Proc. of Annual Conference - Canadian Society for
Civil Engineering, Vol. 3, 10-13 Jun, 1494-1502 (Ph.D. Work)

8/18/2019 Rheology of Oil Well Cement Slurries
http://slidepdf.com/reader/full/rheology-of-oil-well-cement-slurries 7/274
vii
DEDICATION
I dedicate this thesis to my parents, Salma Begum and Md. Amjad Hossain who have always
been a great encouragement for this great achievement, and to my twin baby girls, Saniya
and Sabrina and to my husband, Shahria Alam who make my life meaningful and enjoyable.
8/18/2019 Rheology of Oil Well Cement Slurries
http://slidepdf.com/reader/full/rheology-of-oil-well-cement-slurries 8/274
viii
ACKNOWLEDGEMENTS
I would like to express my appreciation and sincere gratitude to my research supervisor Prof.
Moncef L. Nehdi for his consistent support all through my study period at the University of
Western Ontario. His invaluable guidance and inspiration helped me grow confidence and
develop both academically and personally. Being his supervisee, it had been a wonderful
experience for me.
I would like to thank my family for their constant support and encouragement throughout my
study period. In particular, I would like to thank my mother, father and my husband. Without
their encouragement and support, this achievement could not have been possible.
I would like to acknowledge the input of Mr. Wilbert Logan and Mr. Aiham Adawi for their
assistance in conducting the experimental work. Special thanks are due to the Department of
Civil and Environmental Engineering at the University of Western Ontario, including
Faculty, Staff, Fellow Graduate Students and Summer Work Study Students. Special thanks
are also due to all Technicians, Secretaries, and Personnel in the Department of Civil and
Environmental Engineering at The University of Western Ontario, who contributed directly
or indirectly to the accomplishments of this work.
I also gratefully acknowledge the donation of materials by Lafarge cement, the Association
of Canadian Industries Recycling Coal Ash, Advanced Cement Technologies, LLC, USA,
and BASF Construction Chemicals, and the funding provided by Imperial Oil, Canada
8/18/2019 Rheology of Oil Well Cement Slurries
http://slidepdf.com/reader/full/rheology-of-oil-well-cement-slurries 9/274
ix
TABLE OF CONTENTS
CERTIFICATE OF EXAMINATION ……………………………………………….
ABSTRACT …………………………………………………………………………...
COPYRIGHT AND CO-AUTHORSHIP ………………………………………..........
DEDICATION ………………………………………...................................................
ACKNOWLEDGEMENTS …………………………………………………………...
TABLE OF CONTENTS ……………………………………………………………...
LIST OF FIGURES ……………………………………………………………………
LIST OF TABLES…... ………………………………………………………………..
LIST OF NOTATIONS ……………………………………………………………......
ii
iii
v
vii
viii
ix
xv
xx
xxii
1. INTRODUCTION
1.1 Introduction ……………………………………………………………………...
1.2 Objectives and Scope of the Study…..………………………...............................
1.3 Organization of Dissertation …………………..………........................................
1.4 Original Contributions of Thesis…………………………………………………
1.5 References ...…………………………………………………………..................
1
1
3
5
8
9
2. STATE OF THE ART ON OIL WELL CEMENT2.1 introduction ………………………………………………..………......................
2.2 Basic Cementing Process……………………………….......................................
2.3 Oil Well Cements ……………………...………..................................................
2.3.1 Classification Of Oil Well Cements ……………………...………......... .....
2.3.2 Other Types Of Oil Well Cements ………………………..….……........
2.4 Admixtures for Well Cementing …………………...……….............................
2.4.1 Types of Admixtures Used in OWC Slurries ……………………………
2.5 Density Of OWC Slurries …………………………. ……..…………………….
2.6 Setting Time and Thickening Time of OWC Slurries ………………..……...
2.7 Hydration of Oil Well Cement …………………………..……………………
2.8 Mechanical Properties of Hydrated OWC Slurry ..……..…………………….
1010
11
13
13
16
17
17
18
20
23
24
8/18/2019 Rheology of Oil Well Cement Slurries
http://slidepdf.com/reader/full/rheology-of-oil-well-cement-slurries 10/274
x
2.9 Durability of Hardened OWC Slurries ………………………………………...
2.9.1 Porosity and Permeability ………………….…………………………...
2.9.2 Shrinkage, Expansion and Dimensional Stability …………….………....
2.9.3 Corrosion and Acid Attack ………………………………………… ………..
2.9.4 Sulphate Attack …………………………………………………………..
2.10 Conclusions………………………………………... …………………………
2.11 References ……………………………………………………………………...
27
27
28
29
31
32
33
3. RHEOLOGY OF OIL WELL CEMENT SLURRIES
3.1 Introduction…………………………………………………………………….
3.1.1 Newtonian Fluid …………………………………………………………
3.1.2 Non-Newtonian Fluid ……………………………………………………
3.1.3 Thixotropy……………………………………………………………………….
3.2 Rheology of Oil Well Cement Slurries……………………...............................
3.2.1 Time-Independent Rheological Models…… ………………….…………
3.2.2 Effect of Time, Temperature and Pressure on Rheology of Cement
Slurry…………………………………………………………………………...
3.2.3 Equipment and Testing Methods for Rheology of OWC Slurries ………..
3.3 Conclusions ……………………………………………………………………..
3.4 References…………………………………………………………......................
43
43
46
47
51
52
55
57
59
61
62
4. COUPLED EFFECTS OF CHEMICAL ADMIXTURES ANDTEMPERATURE ON RHEOLOGICAL PROPERTIES OF OIL WELLCEMENT SLURRIES
4.1 Introduction ……………………………………………………………………...
4.2 Rheology of Cement Slurries …………………….……………………………...
4.3 Materials………………………….. ……………………………………………
4.4 Apparatus…………………………………………………………………………4.5 Experimental Procedure………………………………………………………...
4.5.1 Mixing and Preparing Cement Slurry…… ……………………………….
4.5.2 Rheometric Tests… ……………………………………………………. ....
4.5.3 Gel strength ………………………………………………………………
66
66
67
69
70
72
72
72
73
8/18/2019 Rheology of Oil Well Cement Slurries
http://slidepdf.com/reader/full/rheology-of-oil-well-cement-slurries 11/274
xi
4.6 Results And Discussion……………………………………………………….....
4.6.1 Effect of W/C and Temperature on Rheological Properties ……………
4.6.2 Coupled Effects of Temperature and Chemical Admixtures on Yield
Stress…………………………………………………………………………….
4.6.3 Coupled Effects of Temperature and Chemical Admixtures on Plastic
Viscosity ………………………………………………………………...
4.6.4 Coupled Effects of Temperature and Chemical Admixtures on Apparent
Viscosity …………………………………………………………………..
4.6.5 Coupled Effects of Temperature and Chemical Admixtures on Thixotropy… ..
4.6.6 Effect of Temperature and Chemical Admixtures on Gel Strength …………
4.6.7 Comparison of Effects of Various Admixtures on Rheology of Oil Well
Cement Slurries……………………………………………………………………… 4.7 Conclusions……………………………………………………………………...
4.8 References ……………………………………………………………………..
75
75
78
82
85
89
93
96103
104
5. EFFECT OF SUPPLEMENTARY CEMENTITIOUS MATERIALS ONRHEOLOGY OF OIL WELL CEMENT SLURRIES
107
5.1 Introduction ……………………………………………………………………...
5.2 Principles of Flow Properties ....………………………………………………...
5.3 Materials …………………………………………………………………………5.4 Apparatus…………………………………………………………………………
5.5 Experimental Procedure………………………………………………………...
5.5.1 Mixing and Preparation of Oil Well Cement Slurry ……………………
5.5.2 Rheometric Tests ………………………………………………………..
5.6 Results And Discussion……………………………………………………….....
5.6.1 Reliability of Rheometer and Rheometric Test …………………………...
5.6.2 Effect of Type and Dosage of SCM on Rheological Properties of OWC
Slurries ……………………………………………………………………
5.6.3 Coupled Effect of SCMS and PCH Dosage on Yield Stress of OWC
Slurries …………………………………………………………………….
5.6.4 Coupled Effects of SCMS and PCH Dosage on Viscosity and Shear
107
108
110112
113
113
113
115
115
116
121
8/18/2019 Rheology of Oil Well Cement Slurries
http://slidepdf.com/reader/full/rheology-of-oil-well-cement-slurries 12/274
xii
Thinning/Thickening Behaviour of OWC Slurries ……………………......
5.7 Discussion………………………………..…………………………….................
5.8 Conclusions ……………………………………………………………………...
5.9 References …………………………………………………………….................
125
133
137
138
6. MODELING RHEOLOGICAL PROPERTIES OF OIL WELL CEMENTSLURRIES USING MULTIPLE REGRESSION ANALYSIS ANDARTIFICIAL NEURAL NETWORKS
6.1 Introduction ……….……….……….……….……….……….…….....................
6.2 Experimental Program……………………………………………………………
6.2.1 Materials…………………………………………………………………..
6.2.2 Apparatus………………………………………………………………….
6.3 Experimental Procedure……………………………………………………….....
6.4 Experimental Results………………………………………………………….....
6.5 Artificial Neural Network Approach…………………………………………...
6.5.1 Selection of Database………………………………………………… ………...
6.5.2 Network Architecture………………………………………………... ................
6.5.3 Training Process……………………………………………………... ................
6.6 Multiple Regression Analysis………………………………………………….....
6.7 Model Performance……………………………………………………………....6.7.1 Validation of ANN and MRA-Based Models …………………………….....
6.7.2 Performance of ANN and MRA in Predicting Rheological Properties of
OWC Slurries ……………………………………………………………….
6.8 Conclusions ……….……….……….……….……….……….……………….....
6.9 References ……….……….……….……….……….……….…………………...
144
144
146
146
146
147
148
151
153
154
156
157
158158
165
170
171
7. ARTIFICIAL INTELLIGENCE MODEL FOR RHEOLOGICALPROPERTIES OF OIL WELL CEMENT SLURRIES INCORPORATING
SCMs 7.1 Introduction ……….……….……….……….……….……….…….....................
7.2 Materials And Apparatus………………..……………………………………......
7.3 Experimental Procedure……………………………………………………….....
174
174
176
177
8/18/2019 Rheology of Oil Well Cement Slurries
http://slidepdf.com/reader/full/rheology-of-oil-well-cement-slurries 13/274
8/18/2019 Rheology of Oil Well Cement Slurries
http://slidepdf.com/reader/full/rheology-of-oil-well-cement-slurries 14/274
xiv
9. SUMMARY AND CONCLUSIONS
9.1 Summary ……….……….……….……….……….…………...………................
9.2 Conclusions ……….……….……….……….……………….…………………..
9.3 Recommendations for Future Research ………….………………………………
9.4 References ……….……….……….……….……….……….………………….
VITA ………………………………………………………………………………….
240
240
242
246
247
249
8/18/2019 Rheology of Oil Well Cement Slurries
http://slidepdf.com/reader/full/rheology-of-oil-well-cement-slurries 15/274
xv
LIST OF FIGURES
Figure 2.1 Schematic representation of a cemented well (Plank 2011) .....…………. 12Figure 2.2 Densification of cement slurries with various weighting agents
(PNS: Polynepthalyne Sulfonate) (Nelson et al. 1990, 2006)……………... 19
Figure 2.3 Effect of NaCl on thickening time (Nelson et al. 1990, 2006)…………. 22Figure 2.4 Effect of time on (a) shear bond strength behaviour, and (b) compressive
strength behaviour of portland cement system containing 35% silica flourand 3% BWOC of neat magnesite at various temperature (Buntoro andRubiandini, 2000)………………………………………………………….. 25
Figure 3.1 Flow between parallel plates…………………………………………… 44Figure 3.2 Sketch of the parallel plate geometry…………………………………... 45Figure 3.3 Schematic representation of coaxial concentric cylinder with
cylindrical conical end geometry… ……………………………………… 46Figure 3.4 Shear stress-shear rate relationship for a Newtonian fluid……………... 47Figure 3.5 Shear stress-shear rate relationship for a Bingham plastic fluid……….. 48Figure 3.6 Shear stress-shear rate relationship for a Power-law with n<1………… 49Figure 3.7 Typical shear thinning behaviour: (a) shear stress vs. shear rate, and (b)
viscosity vs. shear rate… …………………………………………………. 49Figure 3.8 Typical shear thinning behaviour: (a) shear stress vs. shear rate, and (b)
viscosity vs. shear rate………………………………………………….. 50Figure 3.9 Typical hysteresis loop of a thixotropic fluid… ……………………….... 52Figure 3.10 Viscosity of slurry as a function of the shear rate (Saasen et al., 1991)... 54Figure 3.11 Examples of flow curves used in the petroleum industry (Guillot, 1990)… 56Figure 3.12 Temperature dependence of plastic viscosity and yield stress of a
cement slurry with (a) cellulose derivatives and (b) a dispersant and a
latex (Guillot, 1990)……………………………………………………. 57Figure 3.13 Effect of (a) temperature, and (b) pressure on the apparent viscosity of
oil well cement slurries (Kellingray et al., 1990). Slurry A preparedusing cement, silica flour, fluid loss aid (cellulose derivatives),dispersant (naphthalene sulphonate), and retarder (Calciumlignosulphonate) whereas Slurry B prepared using cement, silica flourand retarder (calcium lignosulphonate)… ……………………………….. 59
Figure 4.1 Illustration of, (a) advanced rheometer with coaxial cylinder geometry,and (b) coaxial concentric cylinder with cylindrical conical endgeometry… ………………………………………………………………... 71
Figure 4.2 (a) Schematic representation of stepped ramp, and (b) rheometer test
sequence (shear rate history used in rheological tests)…………………….. 74Figure 4.3 Generated (a) yield stress, and (b) plastic viscosity from Bingham model... 75Figure 4.4 Variation of apparent viscosity (a) with variable w/c, and (b) at different
temperatures……………………………………………………………….. 76Figure 4.5 Hysteresis loop for an oil well cement slurry with w/c = 0.44……..……... 76Figure 4.6 Variation of yield stress oil well cement slurry with temperature and w/c... 77Figure 4.7 Variation of plastic viscosity of cement slurry with temperature and w/c… 77
8/18/2019 Rheology of Oil Well Cement Slurries
http://slidepdf.com/reader/full/rheology-of-oil-well-cement-slurries 16/274
xvi
Figure 4.8 Yield stress of oil well cement slurries at various temperatures anddifferent dosages of admixtures, (a) PCH, (b) LSM, and (c) PCM (w/c =0.44)………………………………………………………..……………… 79
Figure 4.9 Yield stress of oil well cement slurries at various temperatures anddifferent dosages of SRA admixtures (w/c = 0.44)……………………….. 80
Figure 4.10 Yield stress of oil well cement slurries at various temperatures anddifferent dosages of admixtures, (a) HCR, and (b) RA (w/c = 0.44)…........ 81
Figure 4.11 Plastic viscosity of oil well cement slurries at various temperatures anddifferent dosages of admixtures, (a) PCH, (b) LSM, and (c) PCM (w/c =0.44)……………………………………………………………………….. 83
Figure 4.12 Plastic viscosity of oil well cement slurries at various temperatures anddifferent dosages of admixtures, (a) SRA, and (b) HCR (w/c = 0.44)…...... 84
Figure 4.13 Plastic viscosity of oil well cement slurries at various temperatures anddifferent dosages of RA admixtures (w/c = 0.44)…………………………. 85
Figure 4.14 Apparent viscosity of oil well cement slurries at various temperatures anddifferent dosages of admixtures, (a) PCH, and (b) LSM (w/c = 0.44). …… 86
Figure 4.15 Apparent viscosity of oil well cement slurries at various temperatures and
different dosages of admixtures, (a) PCM, and (b) SRA(w/c = 0.44)……... 87Figure 4.16 Apparent viscosity of oil well cement slurries at various temperatures and
different dosages of admixtures, (a) HCR, and (b) RA(w/c = 0.44). ……... 88Figure 4.17 Thixotropy of oil well cement slurries at various temperatures and
different dosages of admixtures, (a) PCH, (b) LSM, and (c) PCM (w/c =0.44)……………………………………………………………………….. 90
Figure 4.18 Thixotropy of oil well cement slurries at various temperatures anddifferent dosages of admixtures, (a) SRA, (b) HCR, and (c) RA (w/c =0.44)……………………………………………………………………….. 92
Figure 4.19 Variation of rheological properties of cement slurries with water cementratio and temperature (a) at 23 oC, (b) at 45 oC, and (c) at 60 oC……………. 94
Figure 4.20 Variation of rheological properties of oil well cement slurries withtemperature at w/c = 0.44………………………………………………….. 96
Figure 4.21 Yield stress and apparent viscosity of oil well cement slurriesincorporating different admixtures at various temperatures, (a) T=23 oC,(b) T=45 oC, and (c) T=60 oC (w/c = 0.44). ……………………………....... 98
Figure 4.22 10-sec and 10-min gel strength of oil well cement slurries incorporatingdifferent admixtures at various temperatures, (a) T=23 oC, (b) T=45 oC, and(c) T=60 oC (w/c = 0.44)………………………………………………….... 100
Figure 4.23 Plastic Viscosity of oil well cement slurries incorporating differentadmixtures at various temperatures (a) T=23 oC, (b) T=45 oC, and (c)T=60 oC (w/c = 0.44)……………………………………………………….. 101
Figure 5.1 (a) Schematic representation of stepped ramp, and (b) rheometer test
sequence (shear rate history used in rheological tests) for OWC-SCMslurry ………………………………………………...… ……………….. 114Figure 5.2 Variation of yield stress of OWC slurries with type and dosage of SCM
at (a) 23°C, (b) 45°C and (c) 60°C… ……………………………………. 118Figure 5.3 Variation of yield stress with temperature for OWC slurries prepared
by partial replace of OWC by (a) MK, (b) SF, (c) RHA, and (d) FA… .. 119Figure 5.4 Variation of plastic viscosity of OWC slurries with type and dosage of
8/18/2019 Rheology of Oil Well Cement Slurries
http://slidepdf.com/reader/full/rheology-of-oil-well-cement-slurries 17/274
xvii
SCM at (a) 23°C, (b) 45°C and (c) 60°C. ……………………………….. 120Figure 5.5 Variation of plastic viscosity with temperature for OWC slurries
prepared by partial replace of OWC by (a) MK, (b) SF, (c) RHA, and(d) FA. …………………………………………………………………….. 121
Figure 5.6 Variation of yield stress with dosage of PCH and SCM for OWC
slurries incorporating MK [(a) at 23°C; (b) 45°C; and (c) 60°C], SF[(d) at 23°C; (e) 45°C; and (f) 60°C]. …………………………………… 123Figure 5.6 Variation of yield stress with dosage of PCH and SCM for OWC
slurries incorporating RHA[(g) at 23°C; (h) 45°C; and (i) 60°C], andFA [(j) at 23°C; (k) 45°C; and (l) 60°C]. ………………………………...
124Figure 5.7 Variation of plastic viscosity with dosage of PCH and SCM for OWC
slurries incorporating MK [(a) at 23°C; (b) 45°C; and (c) 60°C], SF[(d) at 23°C; (e) 45°C; and (f) 60°C]. …………………………………… 128
Figure 5.7 Variation of plastic viscosity with dosage of PCH and SCM for OWCslurries incorporating RHA[(g) at 23°C; (h) 45°C; and (i) 60°C], andFA [(j) at 23°C; (k) 45°C; and (l) 60°C]. …………………………………
129
Figure 5.8 Flow curve of oil well cement slurry incorporating 5% of SCMs anddifferent dosage of PCH Admixture at 60ºC, (a) MK; (b) SF; (c) RHA;and (d) FA. ……………………………………………………………..…. 130
Figure 5.9 Apparent viscosity curve of oil well cement slurry incorporating 5% ofSCMs and different dosage of PCH Admixture at 60ºC, (a) MK; (b)SF; (c) RHA; and (d) FA. ………………………………………………… 131
Figure 5.10 Variation of exponent n with dosage of PCH and SCMs at 60ºC, (a)MK; (b) SF; (c) RHA; and (d) FA. ……………………………………… 133
Figure 6.1 Shear stress-shear rate down curve for OWC slurries prepared usingdifferent dosage of PCH at 60°C. ………………………………………… 148
Figure 6.2 Effect of temperature on (a) yield stress, and (b) plastic viscosity of
OWC slurry prepared using different admixtures (0.5% BWOC). …….. 149Figure 6.3 Effect of admixture dosage on (a) yield stress, and (b) plastic viscosityof OWC slurry prepared using different admixtures at 60°C………….. 150
Figure 6.4 Simplified model of artificial neural network. …………………………... 151Figure 6.5 Architecture of developed ANN model. …………………………………. 155Figure 6.6 Selection of number of hidden layer nodes for slurries prepared using
LSM. ………………………………………………………………………. 156Figure 6.7 Measured versus predicted shear stress for OWC slurries incorporating
PCH (a) Training data and (b) Testing Data…………………………… 160Figure 6.8 Measured versus predicted shear stress for OWC slurries incorporating
PCM (a) Training data and (b) Testing Data ... …………………………. 161
Figure 6.9 Measured versus predicted shear stress for OWC slurries incorporatingLSM (a) Training data and (b) Testing Data ……………………………. 162
Figure 6.10 Measured versus MRA–model predicted shear stress for OWC slurriesincorporating (a) PCH, (b) PCM, and (c) LSM………………………… 163
Figure 6.11 Variation of (a) yield stress, and (b) plastic viscosity of OWC slurriesat different temperatures (Dosage of admixture = 0.5% BWOC)……… 168
Figure 6.12 Variation of (a) yield stress, and (b) plastic viscosity of OWC slurries
8/18/2019 Rheology of Oil Well Cement Slurries
http://slidepdf.com/reader/full/rheology-of-oil-well-cement-slurries 18/274
xviii
with admixture dosage and at a temperature of 60°C… ………………… 169Figure 7.1 Flow curve of oil well cement slurry incorporating 5% of SCMs and
different dosage of PCH Admixture at 60ºC, (a) MK; (b) SF; (c) RHA;and (d) FA. ………………………………………………………………… 178
Figure 7.2 Variation of rheological properties of OWC slurries with type and
dosage of SCM but without PCH at 60°C; (a) yield stress and (b) plastic viscosity. …………………………………………………………... 179Figure 7.3 Variation of rheological properties with temperature for OWC slurries
prepared by 10% replacement of OWC by SCM (MK, SF, RHA, andFA); (a) yield stress and (b) plastic viscosity. …………………………… 180
Figure 7.4 Variation of rheological properties with dosage of PCH for OWCslurries prepared by 10% replacement of OWC by SCM (MK, SF,RHA, and FA) at 60ºC; (a) yield stress and (b) plastic viscosity… ……. 181
Figure 7.5 Architecture of developed ANN model. …………………………………. 185Figure 7.6 Selection of number of hidden layer nodes for OWC slurries prepared
by partial replacement of RHA. ………………………………………….. 186
Figure 7.7 Graphical representation of the change in MSE of the training andcross-validation data set in training process. ……………………………. 188
Figure 7.8 Measured versus predicted shear stress for OWC slurries at differenttemperature and dosage of PCH when MK was used as SCM to
prepare slurries. (a) Training data and (b) Testing Data …….………... 190Figure 7.9 Measured versus predicted shear stress for OWC slurries at different
temperature and dosage of PCH when SF was used as SCM to prepareslurries. (a) Training data and (b) Testing Data ………………………. 190
Figure 7.10 Measured versus predicted shear stress for OWC slurries at differenttemperature and dosage of PCH when RHA was used as SCM to
prepare slurries. (a) Training data and (b) Testing Data……………….. 191
Figure 7.11 Measured versus predicted shear stress for OWC slurries at differenttemperature and dosage of PCH when FA was used as SCM to prepareslurries.(a) Training data and (b) Testing Data ……………………...….. 191
Figure 7.12 Variation of rheological properties with temperature for OWC slurries prepared with 10% replacement of OWC by (a) MK, (b) SF, (c) RHA,and (d) FA with 0.5% PCH. ……………………………………………… 194
Figure 7.13 Variation of rheological properties with dosage of SCM for OWCslurries prepared by partial replacement of (a) MK, (b) SF, (c) RHA,and (d) FA at 60ºC and with 0.5% PCH… ………………………………. 195
Figure 7.14 Variation of rheological properties of OWC slurries with dosage ofPCH at 60ºC and 10% replacement of OWC by (a) MK, (b) SF, (c)
RHA, and (d) FA. …………………………………………………………. 196Figure 8.1 Variation of yield stress of OWC slurries with type and dosage of SCMat (a) 23°C, and (b) 60°C. ………………………………………………… 208
Figure 8.2 Variation of plastic viscosity of OWC slurries with type and dosage ofSCM at (a) 23°C, and (b) 60°C. ………………………………………….. 209
Figure 8.3 Response surface of yield stress of OWC slurries prepared by MK withPCH dosage of (a) 0.25% and (b) 0.75% ……………………………….. 219
8/18/2019 Rheology of Oil Well Cement Slurries
http://slidepdf.com/reader/full/rheology-of-oil-well-cement-slurries 19/274
xix
Figure 8.4 Response surface of plastic viscosity of OWC slurries prepared by MKwith PCH dosage of (a) 0.25% and (b) 0.75%......................................... 220
Figure 8.5 Variation of yield stress with dosage of PCH and temperature for OWCslurries incorporating MK [(a) 5% replacement level; and (b) 15%replacement level]. ………………………………………………………... 222
Figure 8.6 Variation of yield stress with dosage of PCH and temperature for OWCslurries incorporating SF [(a) 5% replacement level; and (b) 15%replacement level]. ………………………………………………………... 223
Figure 8.7 Variation of yield stress with dosage of PCH and temperature for OWCslurries incorporating RHA [(a) 5% replacement level; and (b) 15%replacement level]. ……………………………………………………….. 224
Figure 8.8 Variation of yield stress with dosage of PCH and temperature for OWCslurries incorporating FA [(a) 5% replacement level; and (b) 15%replacement level]. ………………………………………………………... 225
Figure 8.9 Variation of Plastic viscosity with dosage of PCH and temperature forOWC slurries incorporating MK [(a) 5% replacement level; and (b)
15% replacement level]. …………………………………………………..227
Figure 8.10 Variation of plastic viscosity stress with dosage of PCH andtemperature for OWC slurries incorporating SF [(a) 5% replacementlevel; and (b) 15% replacement level]… ………………………………… 228
Figure 8.11 Variation of plastic viscosity stress with dosage of PCH andtemperature for OWC slurries incorporating RHA [(a) 5% replacementlevel; and (b) 15% replacement level]… ………………………………… 229
Figure 8.12 Variation of plastic viscosity stress with dosage of PCH andtemperature for OWC slurries incorporating FA [(a) 5% replacementlevel; and (b) 15% replacement level]… ………………………………… 230
Figure 8.13 Isoresponse curve of yield stress of OWC slurries incorporating (a)MK, (b) SF, (c) RHA, and (d) FA as replacement of OWC at 60ºC…… 231
Figure 8.14 Isoresponse curve of plastic viscosity of OWC slurries incorporating(a) MK, (b) SF, (c) RHA, and (d) FA as replacement of OWC at 60ºC.. 233
8/18/2019 Rheology of Oil Well Cement Slurries
http://slidepdf.com/reader/full/rheology-of-oil-well-cement-slurries 20/274
xx
LIST OF TABLES
Table 2.1 Key features of API Oil Well Cement………………………………………. 15
Table 2.2 Chemical and physical properties of API Class G and Class H OWC……... 16Table 2.3 Typical properties of common weighting agents used in well cementing….. 20Table 2.4 Summary of properties of extenders used in OWC slurries………………… 20Table 2.5 Acid- resistance light-weight cement formulations…………………………. 31Table 3.1 Rheological parameters for Class G cement slurries with and without a
dispersant (Guillot, 1990)………………………………………………... 54Table 3.2 Various time-independent rheological models for cement slurries…………. 56Table 4.1 Chemical and physical properties of API Class G OWC…………………… 70Table 4.2 Thixotropy of oil well cement slurry incorporating different admixtures…... 91Table 4.3 Gel strength and yield stress of oil well cement slurry incorporating different
admixtures………..…………………………………………………………….
95Table 5.1 Properties of materials used ………………………………………………... 111Table 5.2 Composition of cement slurry ……………………………………………… 111Table 5.3a Reliability of flow test using neat cement slurry at w/c=0.44…………… 115Table 5.3b Reliability of flow test using cement slurry with SCM at 60°C with
w/c=0.44 …………………………………………………………………….. 116Table 5.4 Saturation dosage of SCM used at different temperature………………... 125Table 6.1 Chemical admixtures used for preparing oil well cement slurries………. 147Table 6.2 Range, average (Avg.), and standard deviation (SD) of input and output
variables ………………………………………………………………………154
Table 6.3 Topography and training parameters for the developed ANN model……. 155Table 6.4 Model Parameters …………………………………………………………… 166Table 6.5 Performance of ANN-based model in predicting the shear stress of cement
slurries prepared with different chemical admixtures……………. 166Table 6.6 Performance of MRA-based model in predicting the shear stress of
cement slurries prepared with different chemical admixtures……………. 166Table 7.1 Range, average ( Avg .), and standard deviation ( SD) of input and output
variables ……………………………………………………………………… 184Table 7.2 Topography and training parameters for the developed ANN model……. 185Table 7.3 Performance of ANN in predicting the shear stress of cement slurries
prepared with different supplementary cementitious materials…………... 192
Table 8.1 Coded and absolute values for investigated parameters………………….. 210Table 8.2 Coded and absolute values for mixture proportions used in validationmodels ………………………………………………………………………… 211
Table 8.3 ANOVA of yield stress for OWC slurries with different SCM…………… 214Table 8.4 ANOVA of plastic viscosity for OWC slurries with different SCM……… 214Table 8.5 Derived quadratic models for the yield stress and plastic viscosity of
OWC slurries incorporating four different SCMs ………………………... 215
8/18/2019 Rheology of Oil Well Cement Slurries
http://slidepdf.com/reader/full/rheology-of-oil-well-cement-slurries 21/274
xxi
Table 8.6 ANOVA for significance of regression models …………………………... 216Table 8.7 Repeatability of test results based on 5 replicate center points…………… 216Table 8.8 Performance of proposed model in predicting the yield stress of cement
slurries prepared with different SCM……………………………………... 218Table 8.9 Performance of proposed model in predicting the plastic viscosity of
cement slurries prepared with different SCM…………………………….. 218Table 8.10 Comparison of plastic viscosity values for PCH dosages of 0.25% and 1%
at two different levels of SCM (5% and 15%) at 60°C…………………… 226
8/18/2019 Rheology of Oil Well Cement Slurries
http://slidepdf.com/reader/full/rheology-of-oil-well-cement-slurries 22/274
xxii
LIST OF NOTATIONS
Shear rate Viscosity
Shear stress
P Plastic viscosity
0 Yield stress
Constant slope for Newtonian model
Viscosity at infinite shear rate
l jiW The connection strength between neurons i and j in layers l and l-1,
respectively
a, b Model constant
a, b, c, d, e, f, g, and h Regression coefficient
a 1 to a 9 Model coefficient
AAE Average absolute error
0a and 0b The overall mean of the total effect estimates of all factors for yield stressand plastic viscosity, respectively
ANN Artificial neural network
ANOVA Analysis of variance
API American Petroleum Institute
Avg. Averageb1 to b9 The contribution of the corresponding factor to the response
BWOC By weight of concrete
BWOW By weight of water
c Regression constant
CCD Central composite design
D A Dosage of admixture
E st System error
f Activation functionFA Fly ash
HCR Hydroxylated carboxylic acid-based retarding admixture
HSR High sulphate-resistant
I Identity matrix
8/18/2019 Rheology of Oil Well Cement Slurries
http://slidepdf.com/reader/full/rheology-of-oil-well-cement-slurries 23/274
xxiii
J Jacobian matrix
J T Transpose matrix of J
K Consistency
LSM Lignosulphonate -based mid-range water reducing admixture
MK MetakaolinMRA Multiple regression analysis
MSR Moderate sulphate resistant
n Power law exponent
OWC Oil well cement
P No of training pattern
PCH New generation polycarboxylate-based high-range water reducingadmixture
PCM Polycarboxlate-based mid-range water reducing admixture Prob Probability
PV Plastic viscosity
R2 Correlation coefficient
RA Rheoplastic solid admixture
RHA Rice husk ash
SCM Supplementary cementitious material
SD Standard deviation
SF Silica fume
SRA Phosphonate-based set retarding admixture
T Temperature
T Temperature
Temp Temperature
t pk and o pk The predicted output and provided target of pattern p at output unit k ,respectively
w/c water-to-cement ratio
X i -1 Input at each neuron J in layer l in ANN
Y j Output from ANN
YS Yield stress
ε Noise or error observed in the responses
θ j A threshold value assigned to neuron j in layer l
μ Learning rate
8/18/2019 Rheology of Oil Well Cement Slurries
http://slidepdf.com/reader/full/rheology-of-oil-well-cement-slurries 24/274
1
C h a p t e r 1
INTRODUCTION
1.1 Introduction
Petroleum production and exploration has a paramount influence on the global economic
structure. The world's oil consumption has been increasing day by day. It grew by 171%
during the period from 1965 to 2008 (Yahaba, 2010). Over the last two decades, the amount
of oil consumption per year has exceeded the amount of newly found oil reserves. Therefore,
with time, the possibility of an ultimate decrease in oil production is becoming a realistic
scenario. However, the exact amount of undiscovered oil reserves is not well known. Hence,it is difficult to predict when the ultimate decrease in oil production will initiate and affect
the overall global economy. The human culture and modern technological society are very
much dependent on the earth’s oil and chemical feedstock. A significant decrease in oil
production may trigger substantial economic hardship, such as a recession or depression due
to higher energy prices, unless cost-effective and competitive alternative energy sources will
be put in place.
Improper oil and gas well design and well cementing can jeopardise oil production. Oil spillssuch as the recent Gulf of Mexico deepwater horizon oil spill are some of the causes of oil
loss from the global reserve. Besides economic losses, oil spills cause environmental
disasters particularly in marine habitats because of toxic substances. The oil industry has
been spending billions of dollars to invent more technologically advanced materials and
equipment to improve oil extraction and to minimize loss of oil and gas. Nonetheless, the fact
remains that it is virtually impossible to solve every new problem that may arise.
Well cementing is the process of placing a cement slurry in the annulus space between the
well casing and the geological formations surrounding the well bore in order to provide zonal
isolation in oil, gas, and water wells. The goal is to exclude fluids such as water or gas to
move from one zone to another zone in the well. Incomplete zonal isolation and/or a weak
hydraulic seal between the casing and the cement and between the cement and the
formations, may cause oil spills and the well may never run at its full producing potential
8/18/2019 Rheology of Oil Well Cement Slurries
http://slidepdf.com/reader/full/rheology-of-oil-well-cement-slurries 25/274
2
(Calvert, 2006). The appropriate cement slurry design for well cementing is a function of
various parameters, including the well bore geometry, casing hardware, formation integrity,
drilling mud characteristics, presence of spacers and washers, and mixing conditions. The
rheological behaviour of oil well cement (OWC) slurries must be optimized to achieve an
effective well cementing operation.
Over the last few decades, several types of new chemical admixtures such as
superplasticizers, retarders, viscosity modifying admixtures, etc. have been introduced to
optimize the flow properties of cement-based products. Early age and hardened properties of
cement based systems are highly depended on the type and dosage of chemical admixtures
used. The proper selection of chemical admixtures is mainly based on a trial and error
procedure using tests such as the Marsh cone flow, mini slump test, and other rheological
tests. The performance of chemical admixtures is strongly influenced by the chemical and
physical properties of the cement. Most of the commercial chemical admixtures have been
used with Ordinary Portland cement and for general purpose use. Therefore, the technical
data sheets provided by the manufacturers are not generally applicable for oil well
cementing. In order to contend with bottom hole conditions (wide range of pressure and
temperature), a special class of cements called OWCs, specified by the American Petroleum
Institute (API) (API Specification 10A, 2002) are usually used in the slurry composition. The
interactions of OWC with different types of admixtures and the associated cement-admixture
compatibility at high temperature are still largely unexplored.
This high cement production to meet the needs of modern urbanization and other industrial
purposes is both an ecological and economic concern. The production of one ton of cement
releases about one ton of CO 2 into the atmosphere and consumes a substantial amount of
energy. In the wake of a potential energy crisis, the threat of global warming, and the
increasing cement consumption of a rapidly growing world population, the uses of
supplementary cementitious materials (SCMs) are being encouraged considering their
significant environmental and economic benefit and their potential as a sustainable solution.
Most of these SCMs are recycled industrial by-products that save fossil fuels, preserve
cement raw materials, and reduce hazardous emissions into the atmosphere due to cement
production. Moreover, some of these materials impart to the cement-based systems improved
early age behaviour, superior workability, strength, and durability. The mechanisms
8/18/2019 Rheology of Oil Well Cement Slurries
http://slidepdf.com/reader/full/rheology-of-oil-well-cement-slurries 26/274
3
underlying these improvements imparted by SCMs are still a matter of controversy. Over the
last few decades, a number of researches have been conducted to characterize the influence
of SCMs in ordinary concrete. However, very scant information can be found on the
rheological properties of oil well cement slurries when SCMs are used as partial replacement
for oil well cement.
The rheological properties of cement-based materials determine the quality of the hardened
cementitious matrix and help predicting its end use performance and its physical properties
during and after processing. Measuring the rheological properties of cement-based materials
in the laboratory remains a challenging task. The rheological properties are affected by
numerous factors including the water-to-cement ratio (w/c), size and shape of cement grains,
chemical composition of the cement and the relative distribution of its components at the
surface of grains, presence and type of additives, compatibility between cement and chemical
admixtures, mixing and testing procedures, etc. Moreover, slip at the slurry-shearing surface
interface during rheological tests, particle-particle interactions, chemical reactions, non-
homogeneous flow fields, and human errors can make the rheological experiments difficult
to reproduce. Above all, the equipment used to properly quantify the rheological properties
of cement-based materials is relatively expensive, difficult to operate, and may not be
suitable for use in construction sites because of its large size and/or complicated set up.
1.2 Objective and Scope of the Study
Cement slurry can be considered as a composite suspension of cement and supplementary
cementitious materials in water, one or multiple chemical admixtures, fillers, etc. Oil well
cement (OWC) slurries are pumped between the well bore and the steel casing inserted in the
well to seal off all strata of the formation, except those that have oil so that gases and water
do not contaminate the oil bearing strata. OWCs are sometimes pumped to depths in excess
of 6000 m (20000 ft). At such depths, the temperature may rise up to 205 oC (400°F), but is
normally reduced by the circulation of cooler drilling mud (Orchard, 1962). The cement
slurry may also be subjected to very high pressures reaching over 200 MPa (30000 psi)
(Joshi and Lohita, 1997) depending on the height and density of the column of material
above it. Thus, oil/gas well cementing operations face additional challenges in contrast to
common cementing work above ground. In addition to the high pressure and temperature, the
8/18/2019 Rheology of Oil Well Cement Slurries
http://slidepdf.com/reader/full/rheology-of-oil-well-cement-slurries 27/274
4
OWC must be able to contend with weak or porous formations, corrosive fluids, etc. A
number of additives have been used to alter the chemical and physical properties of the OWC
slurry as required for flow-ability and stability of the slurry and the long term performance of
wells. The conventional admixtures which have been developed in countries with mild
climates for cementing jobs above ground, may lead to inadequate results when exposed to
high temperatures. Likewise, there is still a lack of information in the open literature
regarding the effects of various chemical admixtures, such as new generation
superplasticizers, on the rheological properties of cement-based materials at high
temperature. Hence, this research investigates the effects of a number of conventional
chemical admixtures along with new-generation chemical admixtures on the rheology of oil
well cement slurries.
Mineral and chemical admixtures play an important role in controlling the physical and
chemical properties of cement slurries and hardened cementitious systems. However, not all
minerals and supplementary cementitious materials act in the same way on the rheological
properties, primarily because of their different physical and chemical properties. Typically,
published research has been conducted on ordinary portland cement. There is still a lack of
information regarding the coupled effects of chemical and mineral admixtures at high
temperature on the rheology of oil well cement slurries.
The present study attempts to develop a better understanding of the important mechanisms
that controls the rheology of OWC slurry subjected to severe conditions such as high
temperature, and to investigate the performance of various chemical admixtures in
controlling the rheological behaviour of oil well cement slurries.
The present study also undertakes the task of clarifying the mechanisms of various SCMs in
controlling the OWC slurry rheology at high temperature. The knowledge thus gained could
ultimately allow the optimization of blended oil well cements, leading both to ecological andeconomic benefits.
The specific objectives of this study are provided below:
1. Develop an improved understanding of the effects of temperature on the rheological
properties of oil well cement slurries incorporating various chemical admixtures.
8/18/2019 Rheology of Oil Well Cement Slurries
http://slidepdf.com/reader/full/rheology-of-oil-well-cement-slurries 28/274
5
2. Investigate the coupled effects of supplementary cementitious materials and new
generation chemical admixtures on the rheological properties of oil well cement
slurries.
3. Develop a versatile model to predict the Bingham parameters of oil well cementslurries incorporating various chemical admixtures and subjected to various
temperatures.
4. Develop a design chart to identify the influence of adjusting oil well cement slurry
mixture variables, such as the type of dosage of chemical and mineral admixture, on
rheological properties, such as yield stress and plastic viscosity, and to simplify the
test protocol and number of experiments required to achieve an optimum balance
amongst various parameters involved in slurry rheology tailoring.
1.3 Organization of Dissertation
This thesis has been prepared according to the guidelines specified by the Faculty of
Graduate Studies at the University of Western Ontario for an Integrated Article (formerly
Manuscript) format. It has been divided into nine chapters, six of which have been written as
self-contained documents and have been either accepted or submitted for possible publication
in various peer-reviewed technical journals and international conferences. Related literature
and necessary background to each subject have been included in each corresponding chapter.
The subsequent sections provide in sequence a concise description of the contents of each
chapter in order to address the objectives of the study presented in Section 1.2.
Chapter 2
In Chapter 2, the basic concepts involved in oil well cementing, the chemical and physical
properties of oil well cements and the role of related additives and chemical admixtures are
discussed. Although mechanical properties and durability aspects are not a part of the present
investigation, the chapter provides a review on the mechanical properties of hydrated OWC
slurries and their durability, and critically examines state-of-the-art practice, and identifies
future research directions and technology development needs.
8/18/2019 Rheology of Oil Well Cement Slurries
http://slidepdf.com/reader/full/rheology-of-oil-well-cement-slurries 29/274
6
Chapter 3
Chapter 3 is divided in to two parts. The first part presents a brief theoretical background on
the rheology and rheological parameters used to characterize materials. The second part
presents the rheology of oil well cement slurries, time-independent rheological models, theeffect of time and temperature, and the current practice for rheological tests and equipment.
Chapter 4
In this chapter, the rheological properties, including yield stress, plastic viscosity, thixotropy
and gel strength of Class G API oil well cement slurries having w/c of 0.35, 0.44, and 0.50
were investigated at different temperatures in the range of 23 to 60ºC using an advanced
shear-stress/shear-strain controlled rheometer. The interactions of Class G OWC withdifferent types of admixtures such as a new generation polycarboxylate-based high-range
water reducing admixture (PCH), lignosulphonate-based mid-range water reducing
admixture (LSM), polycarboxlate-based mid-range water reducing admixture (PCM),
phosphonate-based set retarding admixture (SRA), hydroxylated carboxylic acid-based
retarding admixture (HCR) and a rheoplastic solid admixture (RA) have been investigated
and discussed.
Chapter 5
In this chapter, the interactions of Class G oil well cement and four different types of SCMs
including metakaolin (MK), silica fume (SF), rice husk ash (RHA), and class F fly ash (FA)
on the rheological properties of oil well cement slurries have been investigated. The flow
properties of Class G oil well cement slurries at w/c=0.44 and incorporating those SCMs
along with a new generation polycarboxylate-based high-range water-reducing admixture
were tested at different test temperatures (23, 45 and 60°C). A series of flow tests using an
advanced rheometer were carried out to determine optimum dosage of admixture.
Chapter 6
This chapter is divided into two parts. In the first part, an artificial neural networks (ANN)-
model was developed to predict the shear stress versus shear rate flow curves for OWC
slurries. The slurries were prepared using class G oil well cement with a water-cement ratio
8/18/2019 Rheology of Oil Well Cement Slurries
http://slidepdf.com/reader/full/rheology-of-oil-well-cement-slurries 30/274
7
(w/c) of 0.44, and incorporating three different chemical admixtures, namely a new
generation polycarboxylate-based high-range water reducing admixture, polycarboxlate-
based mid-range water reducing admixture, and a lingosulphonate-based mid-range water
reducing admixture. The flow curves developed using the ANN-model have been employed
to predict the Bingham parameters (yield stress and plastic viscosity) of OWC slurries. A
parametric study was performed to evaluate the performance of the ANN-model in predicting
the rheological behaviour of OWC slurries with variation of temperature and type and dosage
of the admixture.
In the second part, multiple regression analysis (MRA) was employed to develop equations
for the shear stress of OWC slurries as a function of the shear rate, dosage of chemical
admixture, and temperature. Subsequently, the Bingham model was used to determine the
rheological properties including yield stress and plastic viscosity. A parametric study was
conducted to evaluate the ability of the MRA equations thus developed to capture the effects
of test parameters on the yield stress and plastic viscosity. Finally, the performance of both
the ANN and MRA models was compared.
Chapter 7
In chapter 7, the shear stress versus shear rate curves for OWC slurries incorporating the
various supplementary cementitious materials (metakaolin, silica fume, rice husk ask and fly
ash) and a new generation polycarboxylate-based high-range water reducing admixture
(PCH) at various temperatures were predicted using an artificial neural network model. A
sensitivity analysis was performed to evaluate the effects of mixture variables, such as
dosage of PCH, type and dosage of SCM, and test variables such as time, on the predicted
yield stress and plastic viscosity of oil well cement slurries. Model predictions were validated
using experimental data.
Chapter 8
In this chapter, a second order 2 k central composite response surface model was developed to
evaluate the effects of temperature, superplasticizer dosage, and dosage of SCM on the
rheological properties of OWC slurries using a statistical design approach and design of
8/18/2019 Rheology of Oil Well Cement Slurries
http://slidepdf.com/reader/full/rheology-of-oil-well-cement-slurries 31/274
8
experiments. This model was used to evaluate the two-way interaction of parameters that had
a significant influence on the rheological properties of OWC slurries.
Chapter 9
Chapter 9 presents a summary of the study along with the main conclusions obtained based
on the research program undertaken. A few recommendations for future research have also
been formulated.
1.4 Original Contributions of Thesis
This thesis provides a comprehensive study on the effects of conventional chemical
admixture and supplementary cementitious materials on the rheological properties of oil well
cement slurries subjected to high temperature. This work is a step towards formulating
guidelines and specifications for using these admixtures in oil well cementing.
The main contributions of the current study can be summarised as follows:
1. The study explored the effects of conventional chemical admixtures which have been
developed in countries with moderate temperatures for cementing jobs above ground.
The results of this study reveal that not all the admixtures tested may be suitable for
oil well cementing work because they may lead to disappointing results when
exposed to high temperature. However, a new generation polycarboxylate-based high-
range water-reducing admixture, a polycarboxylate-based mid-range water reducing
admixture and hydroxylated carboxylic acid-based retarding admixture improved OWC
slurry fluidity at all temperatures tested. Likewise, the results of this thesis indicate that
technical data for chemical admixtures need to be revised for oil well cementing
applications considering the extreme down-hole environment.
2. This study explored the effects of supplementary cementitious materials, such as
metakaolin (MK), silica fume (SF), rice husk ash (RHA) and fly ash (FA) in tailoring
the rheological properties of OWC slurries. This work is a contribution towards a
more fundamental understanding of the mechanism of the tested SCMs in changing
the rheology of oil well cement slurries at high temperature, which should help in
8/18/2019 Rheology of Oil Well Cement Slurries
http://slidepdf.com/reader/full/rheology-of-oil-well-cement-slurries 32/274
9
selecting adequate admixtures and their effective dosages to overcome difficulties
encountered during the construction of oil and gas wells.
3. A versatile model has been developed to learn the relationships between different
shear flow parameters for various OWC slurries using artificial intelligence. Themodel can successfully predict the rheological properties of OWC slurries within the
range of tested admixture dosages and temperatures investigated.
4. A set of empirical equations using multiple regression analysis has been developed to
predict the shear flow behaviour of OWC slurries prepared using chemical and
mineral admixtures and subjected to high temperature.
5.
Isoresponse curves and contour charts have been created, which can simplify the test protocol and reduce the number of experimental tests required to achieve an optimum
balance amongst the various parameters involved and to gain a better understanding
of trade-offs between key mixture parameters such as the superplasticizer dosage and
type and content of supplementary cementitious materials.
1.5 Reference
API Specification 10A (2002). Specifications for Cementing and Materials for WellCementing , April 2002. 23 rd Edition. 58 p.
Calvert, D.G. (2006). Preface. In: Nelson, E.B. and Guillot, D. (Ed.), Well Cementing ,
Schlumberger, Texas, pp. 1-11.
Joshi, R.C., and Lohita, R.P. (Eds.) (1997). Advances in Concrete Technology , 2, Fly Ash in
Concrete: Production, Properties and Uses. Amsterdam, the Netherlands: Gordon and
Breach Science Publishers, 269 p.
Orchard, D.F. (1962). Concrete technology, Properties of Materials , Vol. 1, 2 nd ed. 1962,
358 pp.
Yahaba, N. (2010) How Does A Decrease in Oil Production Affect The World Economy?
ASIA Pacific Economic Papers , No. 388, pp. 32.
8/18/2019 Rheology of Oil Well Cement Slurries
http://slidepdf.com/reader/full/rheology-of-oil-well-cement-slurries 33/274
10
C h a p t e r 2
STATE-OF-THE-ART REVIEW ON OIL WELL CEMENTS
2.1 Introduction
Oil well cementing is the process of placing a cement slurry in the annulus space between the
well casing and the geological formations surrounding to the well bore. When a certain
section of the depth of an oil or gas well has been drilled successfully, the drilling fluid
cannot permanently prevent the well bore from collapsing. Therefore, oil well cementing was
introduced in the late 1920s (Joshi and Lohita, 1997) with a number of objectives: (i)
protecting oil producing zones from salt water flow, (ii) protecting the well casing from
collapse under pressure, (iii) protecting well casings from corrosion, (iv) reducing the risk of
ground water contamination by oil, gas or salt water, (v) bonding and supporting the casing,
and (vi) providing zonal isolation of different subterranean formations in order to prevent
exchange of gas or fluids among different geological formations. In addition to their
exposure to severe temperature and pressure, oil well cements (OWCs) are often designed to
cope with weak or porous formations, corrosive fluids, and over-pressured formations.
The appropriate cement slurry design for well cementing is a function of various parameters,
including the well bore geometry, casing hardware, formation integrity, drilling mud
characteristics, presence of spacers and washers, and mixing conditions. The rheological
behaviour of OWC slurries must be optimized to achieve effective well cementing operation.
Strict control of the hardened cement mechanical properties and durability during the service
life of the well are very important criteria, especially under such severe environments. Thus,
a special class of cements called oil well cements (OWCs), has emerged and is specified by
the American Petroleum Institute (API) (API Specification 10A, 2002). A number of
additives have also been used to alter the chemical and physical properties of the OWC
slurries as required for the flowability, and stability of the slurry and long term performance
of wells.
8/18/2019 Rheology of Oil Well Cement Slurries
http://slidepdf.com/reader/full/rheology-of-oil-well-cement-slurries 34/274
11
Substantial research has been conducted to improve the efficiency of oil well production by
improving the physical and mechanical properties of OWC slurries. This chapter discusses
the basic concepts involved in oil well cementing, the different types of OWCs, and their
chemical and physical properties. An insight into the additives that can modify the behaviour
of the OWC systems and allow successful slurry placement between the casing and the
formation, rapid compressive strength development, and adequate zonal isolation during the
lifetime of the well is also provided. Furthermore, research on the rheology, mechanical
properties and durability of OWCs under severe environmental exposure is critically
examined, and technology development needs and future research directions are identified.
This critical review paper should provide a concise yet in-depth source of information to
assist professionals understanding oil-well cementing projects.
2.2 Basic Cementing Process
A typical oil/gas well can be several thousand meters in depth, less than a meter in diameter
(Lafarge, 2009), and is usually constructed using a metal casing surrounded by a special
cement slurry mix that fills the annulus space between the outer face of the tubing and the
wall formation of the hole. OWCs are sometimes pumped to depths in excess of 6000 m
(20000 ft). At such depth the temperature may rise up to 205 oC (400°F), but is normally
reduced by the circulation of cooler drilling mud (Orchard, 1962). The cement slurry may
also be subjected to very high pressures reaching over 200 MPa (30000 psi) (Joshi and
Lohita, 1997) depending on the height and density of the column of material above it. Thus,
oil/gas well cementing operations face additional challenges in contrast to common
cementing work above ground. Contaminations from the formations can pose additional
problems. Thus, OWC slurries are pumped between the well bore and the steel casing
inserted in the well to seal off all strata of the formation, except those that have oil so that
gases and water do not contaminate the oil bearing strata.
After drilling the well to the desired depth, the drill pipe is removed and a longer string of
casing is run into the well until it reaches its bottom. The circulatable completion fluids such
as drilling mud must be removed and replaced with a hardened cement to ensure intimate
contact and bonding of the cement with the casing and formation surfaces. Sufficient cement
slurry is pumped down the inside of the casing and forced up the outside of the casing
8/18/2019 Rheology of Oil Well Cement Slurries
http://slidepdf.com/reader/full/rheology-of-oil-well-cement-slurries 35/274
12
through the annular space between the casing and subterranean bore hole wall (Powers et al.,
1977; Detroit et al., 1981) using two-plug cementing method (Calvert, 2006; Oilfield
Glossary, 2009). Pressure is applied above plugs by an aqueous displacement fluid to
displace any remaining cement slurry (Detroit et al., 1981). Two types of cementing plug
(top and bottom) are typically used on a cementing operation to allow the cement slurry to
pass through the casing and to reduce the contamination of cement slurries by other fluids
that remain inside the casing prior to pumping cement slurry (Oilfield Glossary, 2009).
Typically, the cement slurry is brought much higher than the production zones into the well
bore to exclude undesirable fluids from the well bore so as to protect fresh water zones and
corrosion of the casing (Calvert, 2006). After the cementing process, a curing time is allowed
for the slurry to harden before beginning completion work or drilling to a deeper horizon.
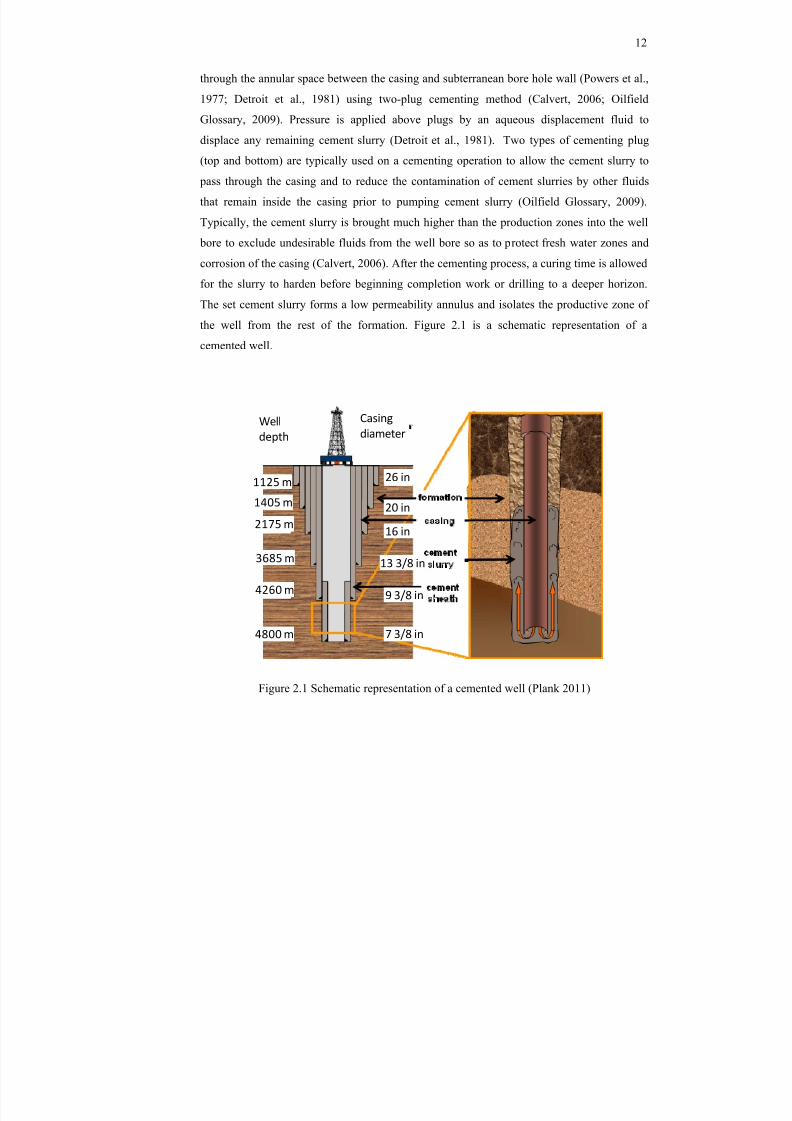
The set cement slurry forms a low permeability annulus and isolates the productive zone ofthe well from the rest of the formation. Figure 2.1 is a schematic representation of a
cemented well.
Well depth
Casing diameter
1125 m1405 m
2175 m
3685 m
4260 m
4800 m 7 3/8 in
9 3/8 in
13 3/8 in
16 in
20 in
26 in
Figure 2.1 Schematic representation of a cemented well (Plank 2011)
8/18/2019 Rheology of Oil Well Cement Slurries
http://slidepdf.com/reader/full/rheology-of-oil-well-cement-slurries 36/274
13
2.3 Oil Well Cements
The productivity of an oil well is significantly affected by the quality of cementing between
the well casing and the surrounding strata. Cement slurry flowability and stability are major
requirements for successful oil well cementing. The properties of oil well cement slurriesdepend on its mixture design and the quality of its components. Because the cement is the
most active component of the slurry and usually has the greatest unit cost, its selection and
proper use are important in obtaining an effective, yet economical material meeting the
expected service life performance of the well.
Type I/II ordinary portland cements can provide adequate strength and durability for
common applications (US Department of Transportation, 2009). However, some demanding
applications may require the use of other cements to meet specific performance criteria. For
instance, the need for high-early strength cements in pavement repairs, the use of blended
cements with aggregates susceptible to alkali-aggregate reactions, and the use of oil well
cements in the exploration and production of oil and gas in onshore as well as offshore wells
are examples of such applications. Although slightly modified Type I, II and III portland
cements can be used for cementing around the steel casing of gas and oil wells having depths
not exceeding 1800 m (6000 ft), deeper wells usually require special oil well cements
(Popovics, 1992).
2.3.1 Classification of Oil Well Cements
Oil-well cements are usually made from portland cement clinker or from blended hydraulic
cements. OWCs provide a base ingredient in the slurry mix that is pumped into the interior
metal casing of the well and forced back toward the surface from the base of the borehole
filling the annulus (Powers et al., 1977, Detroit et al., 1981, Calvert, 2006). Initially, only one
or two types of oil well cement were available. As oil/gas wells became deeper and subjected
to more adverse environments, the more stringent performance criteria could not be satisfied
by those cements. With the advent of the API Standardization Committee in 1937, improved
OWCs were developed (Smith, 1987). The API Specifications for Materials and Testing for
Well Cements (API Specification 10A, 2002) include requirements for eight classes of
OWCs (classes A through H). OWCs are classified into grades based upon their C 3A
(Tricalcium Aluminate) content: Ordinary (O), Moderate Sulphate Resistant (MSR), and
8/18/2019 Rheology of Oil Well Cement Slurries
http://slidepdf.com/reader/full/rheology-of-oil-well-cement-slurries 37/274
14
High Sulphate Resistant (HSR). Each class is applicable for a certain range of well depth,
temperature, pressure, and sulphate environments. Class A, Class G and Class H are the three
most commonly used oil well cements. Class A is used in milder, less demanding well
conditions, while Class G and H cements are usually specified for deeper, hotter and higher
pressure well conditions (Lafarge, 2009). Conventional types of portland cement
incorporating suitable additives have also been used.
The chemical composition of cement is what distinguishes one type of oil well cement from
another and determines the suitability of the cement for specific uses. The chemical
composition of OWC is slightly different from that of regular portland cement. OWCs
usually have lower C 3A contents, are coarsely ground, may contain friction-reducing
additives and special retarders such as starch, sugars, etc, in addition to or in place of gypsum
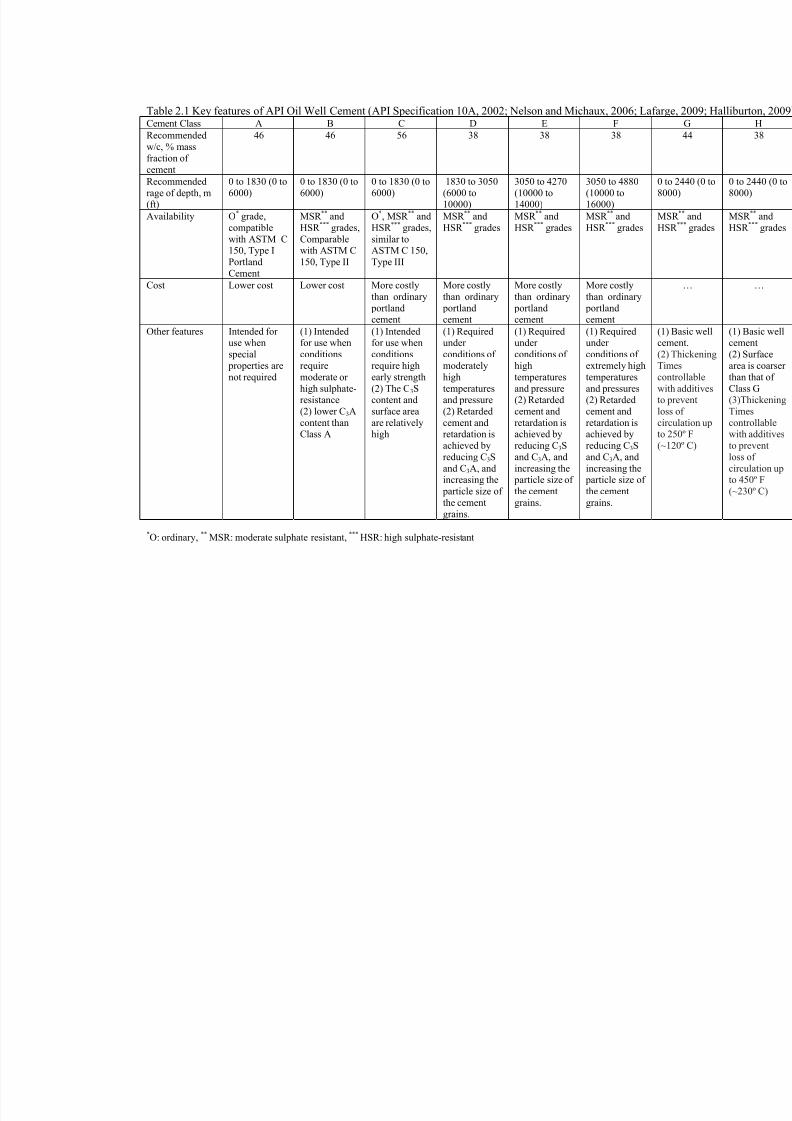
(Popovics, 1992). The key features of commonly used OWCs are summarized in Table 2.1
(API Specification 10A, 2002; Michaux and Nelson, 1990; Nelson et al., 2006; Lafarge,
2009; Halliburton, 2009).
API Class G and H are by far the most commonly used OWCs today. The chemical
composition of these two cements is similar. The basic difference is in their surface area.
Class H is coarser than Class G cement and thus has a lower water requirement (Table 2.1).
The chemical composition and physical properties of typical class G and H cement areillustrated in Table 2.2 (API Specification 10A, 2002; Michaux and Nelson, 1990; Nelson et
al., 2006).
A cement that is ground too fine should not be used as oil well cement. Microfine cements
and ultra-fine (blain surface> 9000 cm 2/gm) portland cements cannot be used for primary
cementing because it does not develop sufficient compressive strength to hold the casing in
downhole condition and it does not generally have adequate sulphate resistance. However,
microfine cement is a good option for oil well repairing since typical OWCs can not be used because of their larger particle size and the subsequent difficulty to penetrate in extremely
small cracks/channels (Kumar et al ., 2002).
8/18/2019 Rheology of Oil Well Cement Slurries
http://slidepdf.com/reader/full/rheology-of-oil-well-cement-slurries 38/274
Table 2.1 Key features of API Oil Well Cement (API Specification 10A, 2002; Nelson and Michaux, 2006; Lafarge, 2009; HCement Class A B C D E F Recommended
w/c, % massfraction ofcement
46 46 56 38 38 38
Recommendedrage of depth, m(ft)
0 to 1830 (0 to6000)
0 to 1830 (0 to6000)
0 to 1830 (0 to6000)
1830 to 3050(6000 to10000)
3050 to 4270(10000 to14000)
3050 to 4880(10000 to16000)
08
Availability O * grade,compatiblewith ASTM C150, Type IPortlandCement
MSR ** andHSR *** grades,Comparablewith ASTM C150, Type II
O*, MSR ** andHSR *** grades,similar toASTM C 150,Type III
MSR ** andHSR *** grades
MSR ** andHSR *** grades
MSR ** andHSR *** grades
MH
Cost Lower cost Lower cost More costlythan ordinary
portlandcement
More costlythan ordinary
portlandcement
More costlythan ordinary
portlandcement
More costlythan ordinary
portlandcement
Other features Intended foruse whenspecial
properties arenot required
(1) Intendedfor use whenconditionsrequiremoderate orhigh sulphate-resistance(2) lower C 3Acontent thanClass A
(1) Intendedfor use whenconditionsrequire highearly strength(2) The C 3Scontent andsurface areaare relativelyhigh
(1) Requiredunderconditions ofmoderatelyhightemperaturesand pressure(2) Retardedcement andretardation isachieved byreducing C 3Sand C 3A, andincreasing the
particle size ofthe cementgrains.
(1) Requiredunderconditions ofhightemperaturesand pressure(2) Retardedcement andretardation isachieved byreducing C 3Sand C 3A, andincreasing the
particle size ofthe cementgrains.
(1) Requiredunderconditions ofextremely hightemperaturesand pressures(2) Retardedcement andretardation isachieved byreducing C 3Sand C 3A, andincreasing the
particle size ofthe cementgrains.
(1c(2Tcwtolocto(~
*O: ordinary, ** MSR: moderate sulphate resistant, *** HSR: high sulphate-resistant
8/18/2019 Rheology of Oil Well Cement Slurries
http://slidepdf.com/reader/full/rheology-of-oil-well-cement-slurries 39/274
16
2.3.2 Other Types of Oil Well Cements
In addition to API class OWCs, other cements can also serve the purpose for well cementing.
For instance grey cement, which is a mineral mixture of chalk (Dusseault et al ., 2009), and
limestone containing silica and alumina (Portland Grey Cement, 2009) having cementitious
properties when exposed to water, can be used for cementing oil wells. Hardened grey
cement was found to be stronger and stiffer than hardened conventional OWCs (Dusseault et
al., 2009). It is non-shrinking and has higher resistance to tension. Moreover, it has been
claimed that grey cement is less costly than API Class G cement, provides a better final
product since it reduces leakage behind the casing, improves the cement squeeze success
ratio, provides better thermal well completion, and better resists acid attack and osmotic
drying (Dusseault et al., 2009). Expansive cements have also performed adequately as well
cements (Kosmatka, 1990). Latex and monomer-modified cementitious systems have been
used for oil-well and geo-thermal cementing, respectively (Ramachandran, 1984). Moreover,
a product known as Ceramicrete, which is a chemically bonded phosphate ceramic is claimed
to provide a tight bond to the earth materials and casings in the presence of drilling fluids or
hydrocarbons (Argonne National Laboratory, 2003). The hardened Ceramicrete is not
affected by severe down-hole conditions and is stable in a wide range of adverse chemical
environments. It has low thermal conductivity and can be pumped at a very low viscosity.For this reason, it is particularly useful for drilling in permafrost regions (Argonne National
Laboratory, 2003).
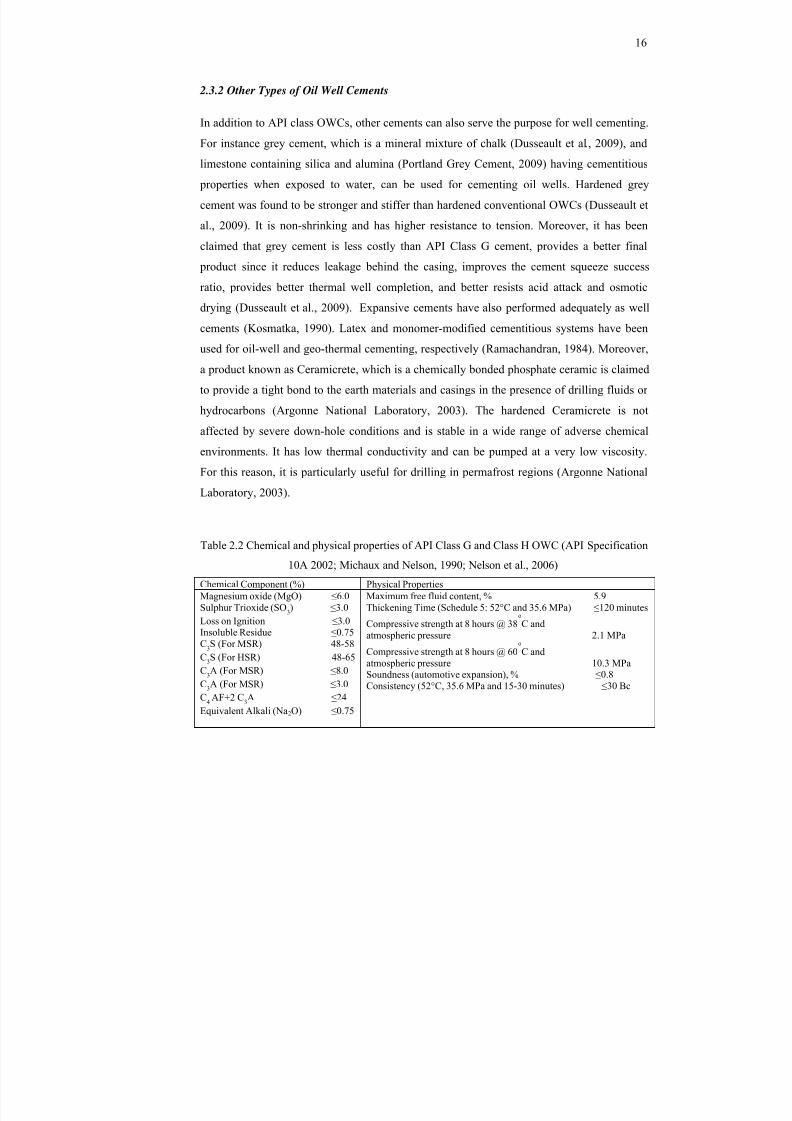
Table 2.2 Chemical and physical properties of API Class G and Class H OWC (API Specification
10A 2002; Michaux and Nelson, 1990; Nelson et al., 2006)
Chemical Component (%) Physical PropertiesMagnesium oxide (MgO) ≤ 6.0Sulphur Trioxide (SO 3) ≤ 3.0Loss on Ignition ≤ 3.0Insoluble Residue ≤ 0.75C3S (For MSR) 48-58C3S (For HSR) 48-65C3A (For MSR) ≤ 8.0C3A (For MSR) ≤ 3.0C4 AF+2 C 3A ≤ 24Equivalent Alkali (Na 2O) ≤ 0.75
Maximum free fluid content, % 5.9Thickening Time (Schedule 5: 52°C and 35.6 MPa) ≤ 120 minutesCompressive strength at 8 hours @ 38
o
C andatmospheric pressure 2.1 MPa
Compressive strength at 8 hours @ 60o
C andatmospheric pressure 10.3 MPaSoundness (automotive expansion), % ≤ 0.8Consistency (52°C, 35.6 MPa and 15-30 minutes) ≤ 30 Bc
8/18/2019 Rheology of Oil Well Cement Slurries
http://slidepdf.com/reader/full/rheology-of-oil-well-cement-slurries 40/274
17
2.4 Admixtures for Well Cementing
Oil well cementing is generally less tolerant to errors than conventional cementing work.
Thus, the OWC slurry must be carefully designed to meet demanding requirements such as a
predictable thickening time (set time), fluid loss control, consistency, low viscosity, low freefluid, adequate strength, high sulphate resistance and overall high durability. OWC slurries
must have a particularly low viscosity to be pumped into great depths. The down-hole high
temperatures and pressures compel severe requirements on the setting behaviour of OWCs.
OWC slurries usually incorporate Class G or H or other adequate cements, water, and
chemical admixtures. They are formulated to provide the required physical properties at the
conditions of pressure and temperature of the hole as well as the nature of the geological
formations. However, they often have to contend with weak or porous formation, corrosive
fluids, and over pressured formation fluids.
A wide variety of cement admixtures are currently available to enhance the OWC slurry
properties and achieve successful placement between the casing and the geological
formation, rapid compressive strength development, and adequate zonal isolation during the
lifetime of the well. The effect of these admixtures depends on a number of OWC
parameters, such as the particle size distribution and chemical composition of the cement,
distribution of silicate and aluminate phases, reactivity of hydrating phases,gypsum/hemihydrate ratio, total sulphate content, free alkali content, and the quantity and
specific surface area of the initial hydration products. The temperature, pressure, admixture
dosage, mixing energy, mixing sequence, and water/cement ratio also have a significant
effect on the behaviour of admixtures in OWC slurries (Nelson et al., 1990; Nelson et al.,
2006).
2.4.1 Types of Admixtures Used in OWC Slurries
Typical admixtures for OWC slurries can be categorized into eight groups: set accelerators,
set retarders, extenders, weighting agents, dispersants, fluid-loss control agents, lost
circulation control agents, and other specialty additives (antifoam agents, fibers, etc.). The
OWC slurry may incorporate retarders or accelerators to control the setting behaviour,
weighting agents are light-weight systems to increase the density of the OWC slurry system,
and extenders to lower the density of the cement system and increase its yield. Similarly,
8/18/2019 Rheology of Oil Well Cement Slurries
http://slidepdf.com/reader/full/rheology-of-oil-well-cement-slurries 41/274
18
different admixtures are used as dispersants or viscosifiers to control the viscosity of the
slurry. For instance, fluid loss additives are used to control the loss of the aqueous phase of
the OWC slurry to the geological formation and to maintain constant water to solid ratio in
cement slurries, while lost circulation control agents are used to control the loss of the
cement slurry to weak or regular formations. A detailed review of cement additives has been
provided by Nelson et al. (1990 and 2006). In addition to chemical admixtures, a number of
mineral additives such as fly ash, silica ( α -quartz and condensed silica fume), diatomaceous
earth, gilsonite, powdered coal (Nelson et al. 1990; Nelson et al., 2006), etc, have been used
to alter certain properties of OWC slurries. A new generation of engineered cement set
control (ECSC) additive has been developed and successfully used to cement long casing
sections. The ECSC overcomes the well integrity problems due to huge temperature
differential exist between the bottom and the top of a long cement column (Moradi et al.,2006; Sorgard and Viali, 2007).
2.5 Density of OWC Slurries
The density of neat cement slurry, i.e., mixture of water and cement, varies from 1773 kg/m 3
(110 lb/ft 3) to 1965 kg/m 3 (123 lb/ft 3) depending on the API Class of the cement and the
water/cement ratio (w/c). Higher density cement slurry may be required to control well fluids
subjected to high bottomhole formation pressures. It is desirable to increase the density ofOWC slurries to minimize the diffusion of heavy drilling muds. Usually bentonite and
organic gums are used to prevent segregation of the heavy constituents from the cement
slurry (Ramachandran, 1984). In other cases, lower density cements may be required to
prevent lost circulation during well cementing.
Density altering additives (weighting agents or extenders) are used to achieve specific
density requirements. Weighting agents add weight to the slurry to achieve higher density,
while extenders are low specific gravity materials that are used to reduce the slurry densityand to increase slurry yield. For instance, Barite, sand and microsand have relatively high
specific gravity and are finely divided solid materials used to increase the density of a
drilling mud or OWC slurry. Barite (BaSO 4) is the most commonly available weighting agent
in oil/ gas well cementing, with a minimum specific gravity of 4200 kg/m 3 (262 lb/ft 3)
(Oilfield Glossary, 2009) and its particle size distribution is predominantly in the range of 3
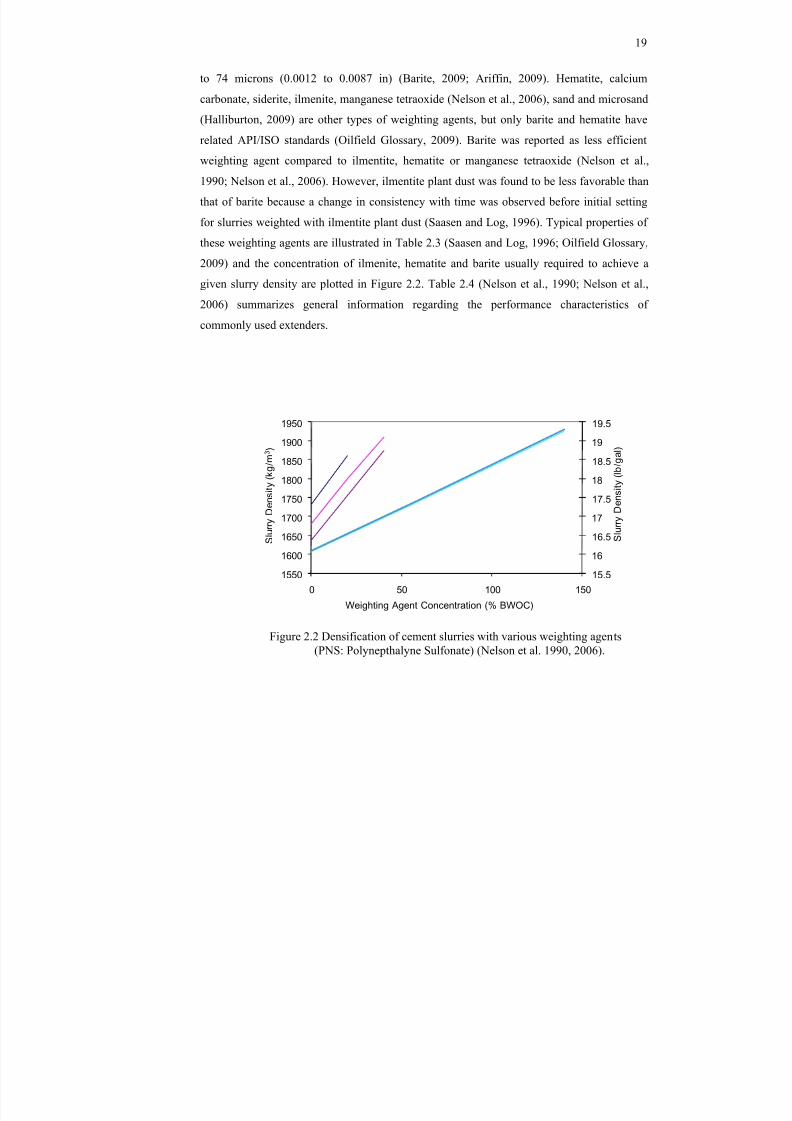
8/18/2019 Rheology of Oil Well Cement Slurries
http://slidepdf.com/reader/full/rheology-of-oil-well-cement-slurries 42/274
19
to 74 microns (0.0012 to 0.0087 in) (Barite, 2009; Ariffin, 2009). Hematite, calcium
carbonate, siderite, ilmenite, manganese tetraoxide (Nelson et al., 2006), sand and microsand
(Halliburton, 2009) are other types of weighting agents, but only barite and hematite have
related API/ISO standards (Oilfield Glossary, 2009). Barite was reported as less efficient
weighting agent compared to ilmentite, hematite or manganese tetraoxide (Nelson et al.,
1990; Nelson et al., 2006). However, ilmentite plant dust was found to be less favorable than
that of barite because a change in consistency with time was observed before initial setting
for slurries weighted with ilmentite plant dust (Saasen and Log, 1996). Typical properties of
these weighting agents are illustrated in Table 2.3 (Saasen and Log, 1996; Oilfield Glossary,
2009) and the concentration of ilmenite, hematite and barite usually required to achieve a
given slurry density are plotted in Figure 2.2. Table 2.4 (Nelson et al., 1990; Nelson et al.,
2006) summarizes general information regarding the performance characteristics ofcommonly used extenders.
15.5
16
16.5
17
17.5
18
18.5
19
19.5
1550
1600
1650
1700
1750
1800
1850
1900
1950
0 50 100 150
S l u r r y
D e n s
i t y ( l b / g a l )
S l u r r y
D e n s
i t y ( k g
/ m 3 )
Weighting Agent Concentration (% BWOC)
Figure 2.2 Densification of cement slurries with various weighting agents(PNS: Polynepthalyne Sulfonate) (Nelson et al. 1990, 2006).
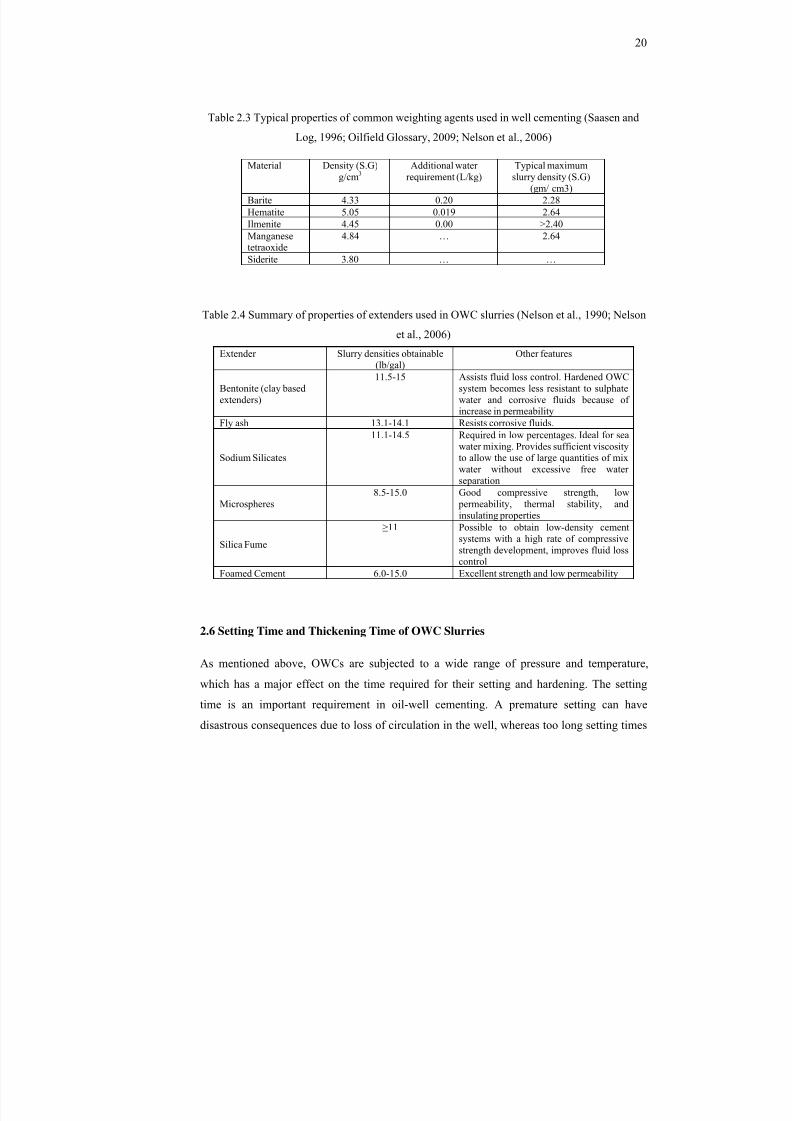
8/18/2019 Rheology of Oil Well Cement Slurries
http://slidepdf.com/reader/full/rheology-of-oil-well-cement-slurries 43/274
20
Table 2.3 Typical properties of common weighting agents used in well cementing (Saasen and
Log, 1996; Oilfield Glossary, 2009; Nelson et al., 2006)
Table 2.4 Summary of properties of extenders used in OWC slurries (Nelson et al., 1990; Nelson
et al., 2006)
Extender Slurry densities obtainable(lb/gal)
Other features
Bentonite (clay basedextenders)
11.5-15 Assists fluid loss control. Hardened OWCsystem becomes less resistant to sulphatewater and corrosive fluids because ofincrease in permeability
Fly ash 13.1-14.1 Resists corrosive fluids.
Sodium Silicates
11.1-14.5 Required in low percentages. Ideal for seawater mixing. Provides sufficient viscosityto allow the use of large quantities of mixwater without excessive free waterseparation
Microspheres8.5-15.0 Good compressive strength, low
permeability, thermal stability, andinsulating properties
Silica Fume
≥ 11 Possible to obtain low-density cementsystems with a high rate of compressivestrength development, improves fluid losscontrol
Foamed Cement 6.0-15.0 Excellent strength and low permeability
2.6 Setting Time and Thickening Time of OWC Slurries
As mentioned above, OWCs are subjected to a wide range of pressure and temperature,
which has a major effect on the time required for their setting and hardening. The setting
time is an important requirement in oil-well cementing. A premature setting can have
disastrous consequences due to loss of circulation in the well, whereas too long setting times
Material Density (S.G)g/cm 3
Additional waterrequirement (L/kg)
Typical maximumslurry density (S.G)
(gm/ cm3)Barite 4.33 0.20 2.28Hematite 5.05 0.019 2.64Ilmenite 4.45 0.00 >2.40Manganesetetraoxide
4.84 … 2.64
Siderite 3.80 … …
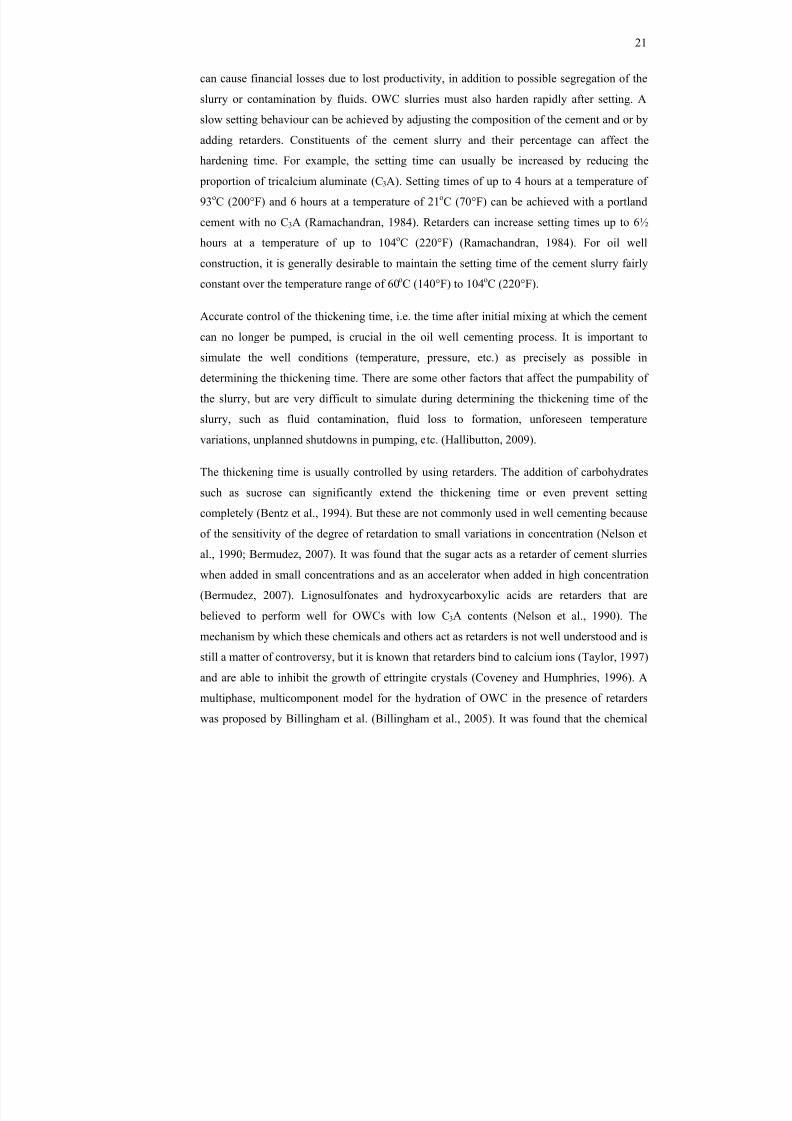
8/18/2019 Rheology of Oil Well Cement Slurries
http://slidepdf.com/reader/full/rheology-of-oil-well-cement-slurries 44/274
21
can cause financial losses due to lost productivity, in addition to possible segregation of the
slurry or contamination by fluids. OWC slurries must also harden rapidly after setting. A
slow setting behaviour can be achieved by adjusting the composition of the cement and or by
adding retarders. Constituents of the cement slurry and their percentage can affect the
hardening time. For example, the setting time can usually be increased by reducing the
proportion of tricalcium aluminate (C 3A). Setting times of up to 4 hours at a temperature of
93oC (200°F) and 6 hours at a temperature of 21 oC (70°F) can be achieved with a portland
cement with no C 3A (Ramachandran, 1984). Retarders can increase setting times up to 6½
hours at a temperature of up to 104 oC (220°F) (Ramachandran, 1984). For oil well
construction, it is generally desirable to maintain the setting time of the cement slurry fairly
constant over the temperature range of 60 oC (140°F) to 104 oC (220°F).
Accurate control of the thickening time, i.e. the time after initial mixing at which the cement
can no longer be pumped, is crucial in the oil well cementing process. It is important to
simulate the well conditions (temperature, pressure, etc.) as precisely as possible in
determining the thickening time. There are some other factors that affect the pumpability of
the slurry, but are very difficult to simulate during determining the thickening time of the
slurry, such as fluid contamination, fluid loss to formation, unforeseen temperature
variations, unplanned shutdowns in pumping, etc. (Hallibutton, 2009).
The thickening time is usually controlled by using retarders. The addition of carbohydrates
such as sucrose can significantly extend the thickening time or even prevent setting
completely (Bentz et al., 1994). But these are not commonly used in well cementing because
of the sensitivity of the degree of retardation to small variations in concentration (Nelson et
al., 1990; Bermudez, 2007). It was found that the sugar acts as a retarder of cement slurries
when added in small concentrations and as an accelerator when added in high concentration
(Bermudez, 2007). Lignosulfonates and hydroxycarboxylic acids are retarders that are
believed to perform well for OWCs with low C 3A contents (Nelson et al., 1990). The
mechanism by which these chemicals and others act as retarders is not well understood and is
still a matter of controversy, but it is known that retarders bind to calcium ions (Taylor, 1997)
and are able to inhibit the growth of ettringite crystals (Coveney and Humphries, 1996). A
multiphase, multicomponent model for the hydration of OWC in the presence of retarders
was proposed by Billingham et al. (Billingham et al., 2005). It was found that the chemical
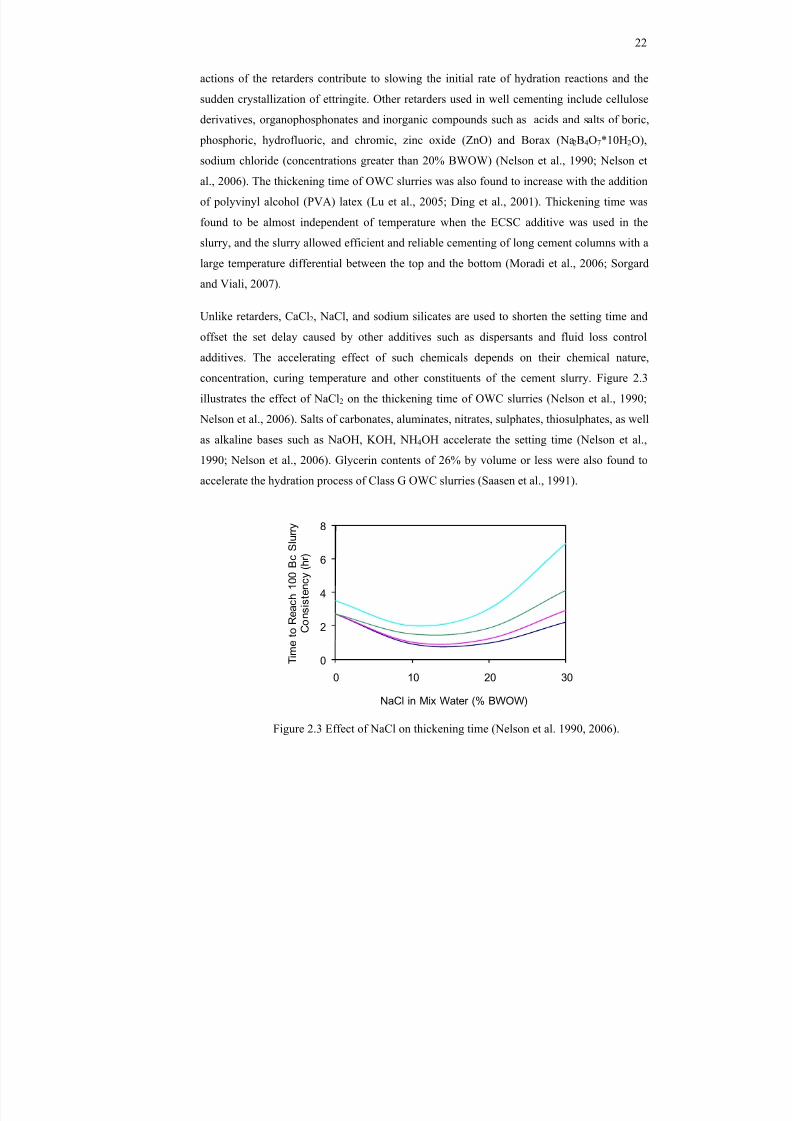
8/18/2019 Rheology of Oil Well Cement Slurries
http://slidepdf.com/reader/full/rheology-of-oil-well-cement-slurries 45/274
22
actions of the retarders contribute to slowing the initial rate of hydration reactions and the
sudden crystallization of ettringite. Other retarders used in well cementing include cellulose
derivatives, organophosphonates and inorganic compounds such as acids and salts of boric,
phosphoric, hydrofluoric, and chromic, zinc oxide (ZnO) and Borax (Na 2B4O7*10H 2O),
sodium chloride (concentrations greater than 20% BWOW) (Nelson et al., 1990; Nelson et
al., 2006). The thickening time of OWC slurries was also found to increase with the addition
of polyvinyl alcohol (PVA) latex (Lu et al., 2005; Ding et al., 2001). Thickening time was
found to be almost independent of temperature when the ECSC additive was used in the
slurry, and the slurry allowed efficient and reliable cementing of long cement columns with a
large temperature differential between the top and the bottom (Moradi et al., 2006; Sorgard
and Viali, 2007).
Unlike retarders, CaCl 2, NaCl, and sodium silicates are used to shorten the setting time and
offset the set delay caused by other additives such as dispersants and fluid loss control
additives. The accelerating effect of such chemicals depends on their chemical nature,
concentration, curing temperature and other constituents of the cement slurry. Figure 2.3
illustrates the effect of NaCl 2 on the thickening time of OWC slurries (Nelson et al., 1990;
Nelson et al., 2006). Salts of carbonates, aluminates, nitrates, sulphates, thiosulphates, as well
as alkaline bases such as NaOH, KOH, NH 4OH accelerate the setting time (Nelson et al.,
1990; Nelson et al., 2006). Glycerin contents of 26% by volume or less were also found to
accelerate the hydration process of Class G OWC slurries (Saasen et al., 1991).
0
2
4
6
8
0 10 20 30
T i m e
t o R e a c
h 1 0 0 B c
S l u r r y
C o n s i s
t e n c y
( h r )
NaCl in Mix Water (% BWOW)
Figure 2.3 Effect of NaCl on thickening time (Nelson et al. 1990, 2006).
8/18/2019 Rheology of Oil Well Cement Slurries
http://slidepdf.com/reader/full/rheology-of-oil-well-cement-slurries 46/274
23
The criterion for evaluating the setting time of OWCs is different than that for other
conventional cements. The setting time for OWCs is usually measured in terms of the change
in viscosity/consistency at elevated temperature. The initial setting/thickening time is
measured using a consistometer in terms of Bearden units of consistency (B C). At a
consistency of 30 B C, a slurry is considered to be too viscous to be pumped, and this is
usually the maximum consistency requirement during the 15 to 30 min stirring period for all
classes of OWC (API Specification 10A, 2002). The time at which the consistency of an
OWC slurry reaches 30 B C corresponds to the time of initial set of the cement. The time to
reach 100 B C is referred as the thickening time of the cement slurry (API Specification 10A,
2002) and is usually expected to be slightly larger than that to reach 30 B C (Saasen and Log,
1996).
2.7 Hydration of Oil Well Cement
The setting and hardening of an OWC slurry are the result of a series of simultaneous and
consecutive reactions between water and the constituents of the cement. Vlachou and Piau
(1997) studied the microstructural and chemical evolution of Class G OWC slurry from the
first minutes after mixing the cement powder with water until the beginning of setting. Based
on scanning electron microscopy (SEM) and X-ray Diffraction (XRD), it was concluded that
the form and structure of the hydration products were a function of experimental conditions,
such as hydration time since mixing, stirring conditions (Vlachou and Piau, 1997),
temperature (Justnes et al., 1995), chemical composition of cement and additive used
(Vidick, 1989) etc. The slurry hydrated under continuous stirring showed constant viscosity
and adequate fluidity over several hours. The formation of small spheres of hydration
particles of the aluminate phases had no influence on the flow curve probably because these
particles created no bonds between them and they moved freely into the inter-particle spaces.
Subsequently, the slurry thickened rapidly with the multiplication of hydrated crystals andthe start of setting processes (Vlachou and Piau, 1997). On the other hand, slurries hydrated
at rest showed a much more increase of viscosity during the first hours, after which the
evolution process slowed down (Vlachou and Piau, 1997). It was reported that in case of
slurries hydrated at rest, an over-saturation of ions in the grain neighborhood leads to the
formation of aluminate hydration crystals of colloidal size (Vlachou and Piau, 1997). These
8/18/2019 Rheology of Oil Well Cement Slurries
http://slidepdf.com/reader/full/rheology-of-oil-well-cement-slurries 47/274
24
crystal cover the surface of the grains and the hydration reaction eventually slows down. On
the other hand, ions dispersed all over the sample volume and dissolution continues until
saturation in case of slurries hydrated under stirring. The chemical composition of cement
and additives used can affect the evolution of the chemical composition of the liquid phase of
the cement paste (Michaux et al., 1989, Vidick et al., 1989). X-ray diffraction and scanning
electron microscopy showed that a neat cement slurry changes from CSH(II), C2SH2,
C3S2H3 to dicalcium silicate hydrate (C2SH) when the temperature exceeds 110°C and the
microstructure of hardened slurry changes from a three-dimensional fiber network to a blank-
block or mass block for different curing temperature conditions (Zhang et al., 2008). On the
other hand, the major products of cement slurry with silica sands changes into C5S6H5,
C6S6H (> 150°C), C5S5A0.5H5.5, C3.2S2H0.8 or other kinds of calcium silicate hydrate at
high curing temperatures and the microstructures are transformed into a fiber network, roughframe network, short-parallel-needle fiber or mass block structure (Zhang et al., 2008).
Different cements show different sensitivity to additives, thus exhibiting different behaviours
when mixed with the same additives (Vidick et al., 1989; Jupe et al., 2007). According to
Justnes et al. (1995) only about 10% hydration is necessary for a plain API class G cement
slurry with w/c = 0.5 to retain its shape at atmospheric pressure. Even though, changes in the
hydration of C3S with pumping time of cement slurries could not be correlated, it was found
that the largest changes in pumping time as a function of temperature occurred in a
temperature interval where ettringite/monosulphate decomposes and crystalline hydro garnet
started to be formed (Jupe, 2005).
2.8 Mechanical Properties of Hydrated OWC Slurry
Myers et al. (2005) argued that compressive strength is not the main parameter in well
cement slurry design rather elasticity and tensile strength of the cement system is more
important for casing support and zonal isolation. However, an effective and long term zonal
isolation requires the consideration of other mechanical properties such as the flexural
strength, shear strength and elastic properties (Young's modulus and Poisson’s ratio),
particularly when wells are subjected to anisotropic earth stresses. Such properties are
especially important in the case of multilateral junction cementing, which has evolved as an
economic means for increasing reservoir productivity and reducing development plan costs
(Blanco et al., 2002). Various models have been developed to quantify stresses induced in
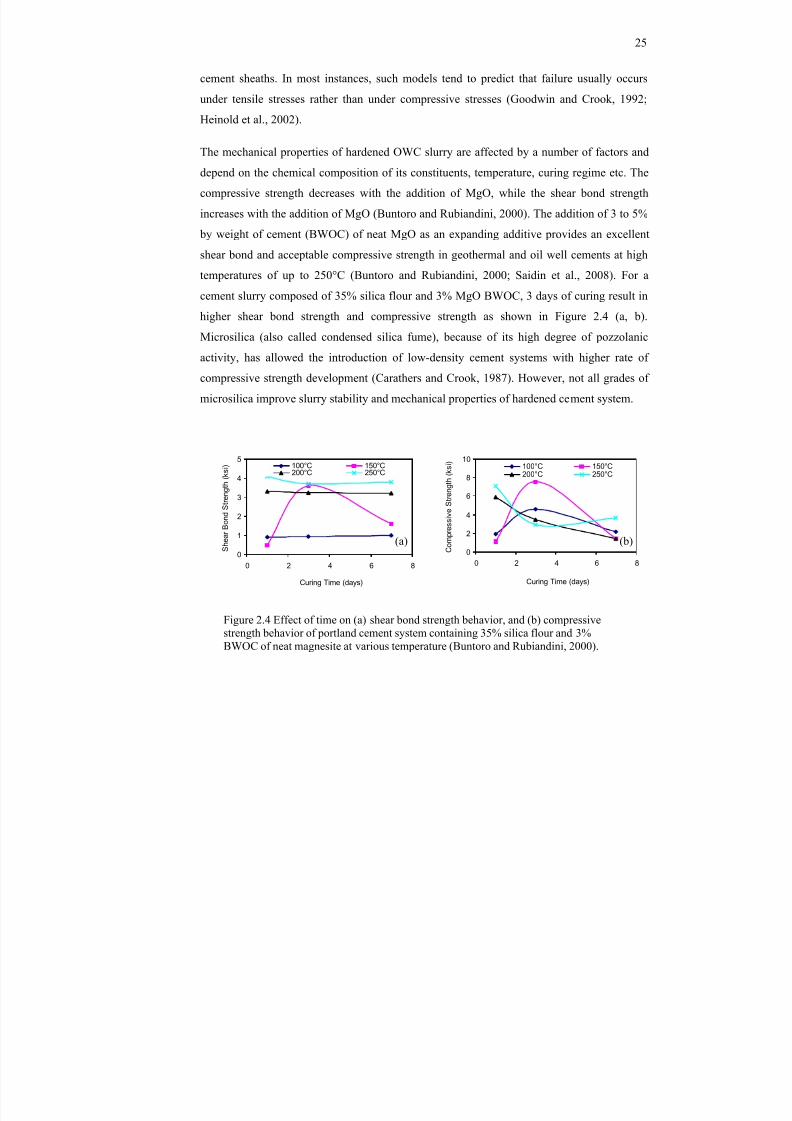
8/18/2019 Rheology of Oil Well Cement Slurries
http://slidepdf.com/reader/full/rheology-of-oil-well-cement-slurries 48/274
25
cement sheaths. In most instances, such models tend to predict that failure usually occurs
under tensile stresses rather than under compressive stresses (Goodwin and Crook, 1992;
Heinold et al., 2002).
The mechanical properties of hardened OWC slurry are affected by a number of factors anddepend on the chemical composition of its constituents, temperature, curing regime etc. The
compressive strength decreases with the addition of MgO, while the shear bond strength
increases with the addition of MgO (Buntoro and Rubiandini, 2000). The addition of 3 to 5%
by weight of cement (BWOC) of neat MgO as an expanding additive provides an excellent
shear bond and acceptable compressive strength in geothermal and oil well cements at high
temperatures of up to 250°C (Buntoro and Rubiandini, 2000; Saidin et al., 2008). For a
cement slurry composed of 35% silica flour and 3% MgO BWOC, 3 days of curing result in
higher shear bond strength and compressive strength as shown in Figure 2.4 (a, b).
Microsilica (also called condensed silica fume), because of its high degree of pozzolanic
activity, has allowed the introduction of low-density cement systems with higher rate of
compressive strength development (Carathers and Crook, 1987). However, not all grades of
microsilica improve slurry stability and mechanical properties of hardened cement system.
0
1
2
3
4
5
0 2 4 6 8
Curing Time (days)
S h e a r
B o n
d S t r e n g
t h ( k s
i ) 100°C 150°C200°C 250°C
(a)0
2
4
6
8
10
0 2 4 6 8
Curing Time (days)
C o m p r e s s
i v e
S t r e n g
t h ( k s
i )100°C 150°C200°C 250°C
(b)
Figure 2.4 Effect of time on (a) shear bond strength behavior, and (b) compressivestrength behavior of portland cement system containing 35% silica flour and 3%BWOC of neat magnesite at various temperature (Buntoro and Rubiandini, 2000).
8/18/2019 Rheology of Oil Well Cement Slurries
http://slidepdf.com/reader/full/rheology-of-oil-well-cement-slurries 49/274
26
Cement slurries prepared using densified microsilica neither improves the slurry stability nor
the set cement permeability and mechanical properties (Daou, F. and Piot, 2008). Mechanical
properties are not only dependant on the type of additives, but also on the slurry density.
Thus, additives which are known to improve the flexural and tensile strength of hardened
cementitious materials in low to medium density systems may not be as effective in higher
density systems (Heinold et al., 2002). It has been found that incorporating polymeric latex
particles improved the tensile strength and toughness of hydrated cementitious materials
(Isenburg and Vanderhoff, 1974). Fibre-reinforced cement-based systems have been proven
to be useful in various cementing applications. An increase in flexural strength and in energy
absorption before fracture can be achieved by incorporating relatively small amounts of
polymer latex together with short fibers. Approximately 0.8% by volume of a styrene-
butadiene copolymer latex added to a glass fiber-reinforced Class G OWC improved theenergy to fracture by a factor of four due to an enhancement of the interfacial shear strength
between fibers and the cementitious matrix (Pafitis, 1995). It was reported that combined
addition of fibers and latex increased both the strength and fracture energy to values greater
than that found by the incorporation of either fibers or latex alone (Pafitis, 1995). On the
contrary, a decrease in compressive strength was observed with increasing amount of fiber in
latex modified cement since the increased amount of fiber led to an increase in the porosity
and permeability of the hydrated OWC (Trabelsi and Al-Samarraie, 1999). Ultra lightweight
slurries with densities from 9 to 11 ppg provide adequate mechanical properties (flexible and
tension strengths) and resistance to H 2S and CO 2 (Mata et al., 2006). The inert fibers, added
to ultra lightweight slurries, improve the mechanical properties of the cement by creating a
network across the loss zone during cementing in highly permeable and depleted formation,
and the created net provide additional stability to resist tensile stresses (Garduño et al., 2006).
Cestari et al. (2008 and 2009) studied the kinetic parameters of HCl interaction with an
epoxy-modified cement slurry and a standard cement slurry and found that the epoxy-
modified cement slurry have good potential to be used in environmental-friendly oil well
operations. Portland cement and polyurethane nonionic composites was found to provide
improved the mechanical properties compared with the slurry prepared using only Portland
cement (Nascimento et al., 2008). Fiber-toughening agent, consisted of carboxylated nitrile
rubber particles at 5.5% BWOC and a polypropylene fiber at 0.2% BWOC, was found to
significantly increase both the elasticity and the toughness of set cement (Yao and Hua,
8/18/2019 Rheology of Oil Well Cement Slurries
http://slidepdf.com/reader/full/rheology-of-oil-well-cement-slurries 50/274
27
2007). A high performance light weight (HPLW) slurry along with an engineered fiber
material (EFM) resulted in improved zonal isolation and less reservoir damage by reducing
the hydrostatic pressure in the annulus and artificially increasing the fracture pressure during
placement, and cost savings by avoiding remedial cementing and non productive time
(Tranquini et al., 2007).
2.9 DURABILITY of HARDENED OWC SLURRIES
Cement-based materials are subjected to deterioration under aggressive environments. The
extreme temperature cycling of the well bore results in severe mechanical damage and
ultimate failure of the cement sheath, potentially leading to microannulus (Saidin et al 2008).
The rate of deterioration is generally aggravated at high temperature and pressure such as in
the case of oil and gas bores. A strict control of cement reactivity and mechanical properties
during the life cycle of the well is thus very important. The oil well cemented system should
meet a wide range of short-term criteria such as free water, thickening time, filtrate loss,
development of strength, shrinkage, etc., in addition to various long-term requirements
including resistance to chemical attack, thermal stability and mechanical integrity of the
cement sheath (Ravi et al., 2002).
2.9.1 Porosity and Permeability
The volume and size distribution of pores affect not only the mechanical strength of cement-
based materials, but also its durability. The porosity and pore size distribution of a hardened
OWC slurry depends on a number of factors such as the w/c ratio, degree of hydration, type
of cement, mixing conditions, chemical admixtures and mineral additives, etc. High
temperature has a drastic effect on the pore structure and compressive strength of cement-
based materials. The total porosity is more than doubled when the curing or casting
temperature increases from 20°C to 1000°C (Komonen and Penttala, 2001; 2004). Based on
experimental results, Komonen and Penttala (2001) argued that exposure to a temperature
from 50°C to 120°C can be as detrimental to the residual strength of a cement paste with a
low water cement ratio as exposure to a temperature of 400-500°C. Justnes et al. (1995)
studied the change in porosity and pore size distribution as a function of time during the
setting period for a plain API Class G cement with a w/c ratio = 0.5 at both 20°C and 60°C. It
was found that although there was enough liquid volume to allow gas intrusion and
8/18/2019 Rheology of Oil Well Cement Slurries
http://slidepdf.com/reader/full/rheology-of-oil-well-cement-slurries 51/274
28
percolation to occur, the pore entries were so small (1.0-1.6 µm in diameter) that gas could
enter only as small bubbles or when dissolved without disruption of the matrix. Polymeric
latexes were found to improve the ability of the hardened OWC to prevent migration of
reservoir fluids from one zone to another by decreasing permeability and preventing gas
migration through the set slurry in the semi-solid state (Nakayama ad Beaudoin, 1987; Su et
al., 1991). It was reported that the increased amount of fiber in latex modified cement led to
an increase in the porosity and permeability of the hydrated OWC (Trabelsi and Al-
Samarraie, 1999). Light weight cement systems cured for 7 days at 185°F and 3000 psi
exhibited lower permeability and porosity (Moulin and Revil, 1997).
2.9.2 Shrinkage, Expansion and Dimensional Stability
The expansion of OWC slurries is important to improve the quality of the well cementing
sealing. Expansion should take place after pumping cement slurry into the annulus and the
process should begin after the formation of the hardened cement structure starts but not after
the formation of a rigid crystalline structure, as it can cause fracturing and adversely affect
the porosity. On the other hand, if the expansion takes place too early, i.e. when the
suspension is in a liquid state, the quality of formation isolation get worsens. The well casing
is in an expanded state during the initial setting of the cement slurry due to the heat of
hydration. Subsequent internal temperature reduction resulting from mud circulation maycause the casing to contract and destroy the cement/casing bond partially or entirely (Buntoro
and Rubiandini, 2000). Expanding additives can overcome this problem as they tend to
expand after the initial set, thus maintaining the bond between formation, cement and casing
during pressure and temperature changes. Gypsum and gypsum containing substances can be
used as expanding additives (Agzamov et al., 2001). The addition of gypsum with high-
alumina binders, high-alumina slags, or anhydrous calcium sulfoaluminate makes the
resultant cement quick solidifying and late expansive (Agzamov et al., 2001). The slurry
mixing time and type of additive used have a significant influence on the expansion of the
hydrated cement. Mixing OWC with CaO additives for three hours, which simulates cement
slurry pumping into the well, ceases the expansion, whereas MgO does not change the
cement expansion after the same treatment at a temperature of 80°C (Agzamov et al., 2001).
Expansion is reduced by 30% and 70% when the pressure is increased up to 50 MPa and 100
MPa, respectively for cement with a CaO additive (Agzamov et al., 2001). In the case of
8/18/2019 Rheology of Oil Well Cement Slurries
http://slidepdf.com/reader/full/rheology-of-oil-well-cement-slurries 52/274
29
chromate aluminate cements, expansion is reduced by 25% with the addition of NaCl, and by
30% when the pressure increases from 10 to 100 MPa (Agzamov et al., 2001).
Gas leakage into and through the cemented annulus in oil and gas wells can cause
environmental problems and compromise well safety. It is believed that a low shrinkage ofthe OWC slurry reduces the risk of gas migration (Backe et al., 1999; Backe, 1998).
Shrinkage or expansion of a hydrating OWC slurry is dependant on the chemical
composition and dosage of the constituents of the slurry, temperature and pressure. Chemical
shrinkage, the volume reduction associated with the reaction between cement and water in a
hydrating cement system, may be divided into two parts: external shrinkage and total
shrinkage. The external shrinkage is the bulk volume change of cement slurry leading to a
possible microannulus between the cement and the wellbore, whereas the total shrinkage is
the sum of the external shrinkage and the contraction of pores of the slurry. The total
chemical shrinkage of a given cement system can be reduced by increasing the slurry yield
(Chenevert and Shrestha, 1991) or by decreasing the amount of water by adding sodium
chloride, silica flour, bentonite, or sodium silicate (55) (Chenevert and Shrestha, 1991). Both
the total and external chemical shrinkage of hardening Class G cement slurries seem to be
independent of the w/c ratio at the early stage (during the first 48 hrs) (Justnes et al., 1995).
The use of an extender reduces the shrinkage and the risk of gas migration provided that the
mechanical strength development of the cement slurry is satisfactory (Backe, 1998). The
external and total shrinkages of a neat Class G cement slurry cured at 20°C and atmospheric
pressure were found to be about 1.0 ml/100g cement and 2.2 ml/100 g cement, respectively
after 48 hours (Justnes et al., 1995). Human hair fibers reduces the plastic shrinkage cracks
area of mortar by a remarkable percentage up to 92% and are claimed to commercially use in
oil and gas well (Al-Darbi et al., 2006).
2.9.3 Corrosion and Acid Attack
Corrosion of hydrated OWC and the exterior wall of the well casing is common in oil wells.
CO 2 corrosion was found to be the dominant mechanism of OWC deterioration in the form of
carbonic acid leaching intensified by high temperature (Krilov et al., 2000). Yang et al.
(2001) reported that the unconsolidated phase and diffusional effect as a result of the action
of the formation water solution matrix Ca(OH) 2 with Ca(OH) 2 are the basic reasons causing
8/18/2019 Rheology of Oil Well Cement Slurries
http://slidepdf.com/reader/full/rheology-of-oil-well-cement-slurries 53/274
30
this form of corrosion while according to Zhang et al. (2009) the cement corrosion by CO 2
occurs by the destruction of the microstructure formed by the original hydration products of
oil well cement and is affected by CaCO 3, with different crystal structure, which is produced
by the chemical reaction between CO 2 and the original hydration products.
Pyrite (FeS 2), a common constituent of reservoir rocks, can be easily oxidized to sulfuric acid
(H 2SO 4) and sulphate ions (SO 42-) by exposure to moderately oxidizing conditions, including
de-oxygenated injection or process water or steam. Pyrite oxidation causes excessive
degradation of well cements and replacement of cement by structurally less stable products
such as calcium sulphates (Hutcheon, 1998). Sulfuric acid may also cause the corrosion of
the well tube and subsequent casing leak, which may lead to a failure of the casing due to
cement collapse, tubing corrosion or both (Hutcheon, 1998).
The durability of hardened OWC to acid exposure has not been well studied. About 40% of
the world’s remaining gas reserves contain more than 2% of CO 2 and/or more than 100 ppm
of H 2S (Lecolier, 2006). Therefore, a comprehensive investigation of the durability of OWC
exposed to CO 2 and H 2S is of paramount importance to optimize oil/gas well production and
special attention has to be provided to the design of the well system including the casing and
cementing materials subjected to corrosive gases.
The subsurface conditions that may exist in CO 2 sequestration sites can damage the cement
that makes the primary plug in abandoned wells. Duguid et al. (2004 and 2005) conducted
experiments at ambient pressure and various temperatures (20°C, 23°C and 50°C) with the
pH adjusted using HCl. Extensive degradation was observed in these experiments due to the
continuous flow of acidified, carbonated brine. These results showed that lower pH and
higher temperature cause faster degradation and temperature had more effect on degradation
rates than pH (Duguid et al., 2004 and 2005). The rate of mass loss of the hardened OWC
slurry usually slows down with time. Duguid et al. (2004) found that cement slurrycontaining bentonite deteriorated at a faster rate than that of a neat Class H cement slurry.
Even a short exposure to carbonated brine can damage the sealing properties of the cement in
an abandoned well (Duguid et al., 2004). Light-weight cement slurries are usually more
resistant to acid attack and the resistance also improves when latex is used in the formulation
as shown in Table 2.5 (Moulin and Revil, 1997). It was reported that hardened OWC
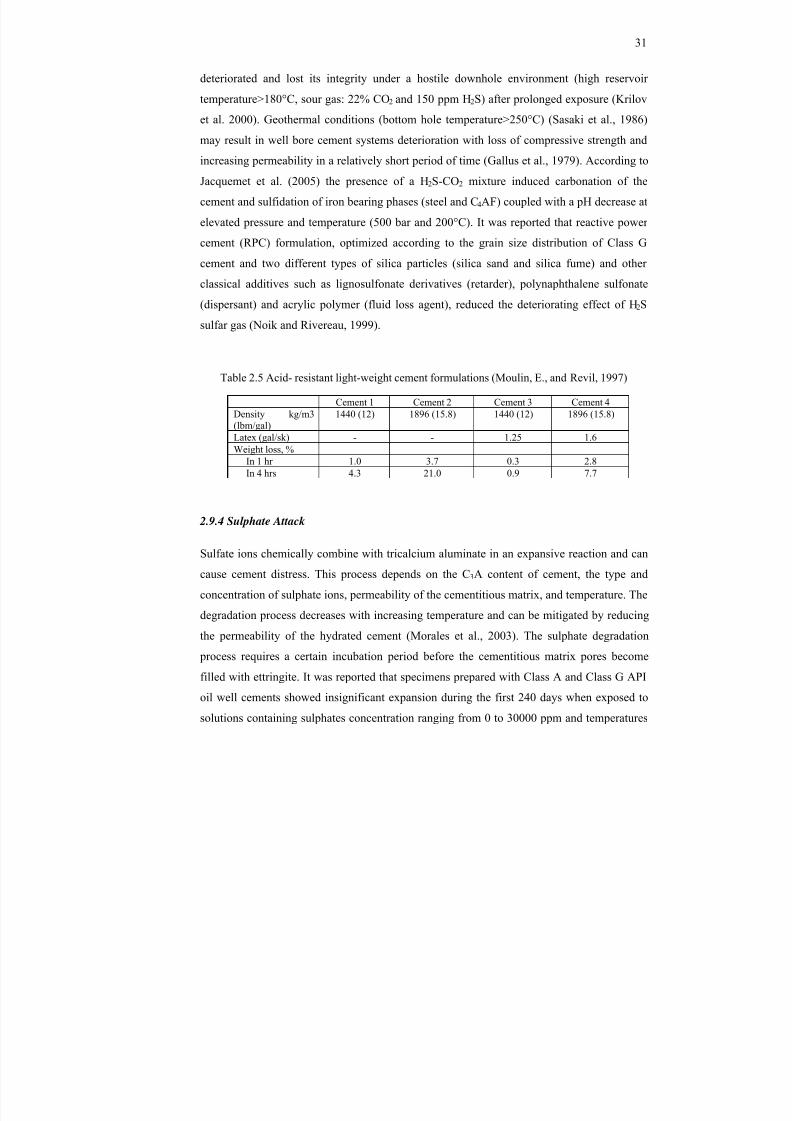
8/18/2019 Rheology of Oil Well Cement Slurries
http://slidepdf.com/reader/full/rheology-of-oil-well-cement-slurries 54/274
31
deteriorated and lost its integrity under a hostile downhole environment (high reservoir
temperature>180°C, sour gas: 22% CO 2 and 150 ppm H 2S) after prolonged exposure (Krilov
et al. 2000). Geothermal conditions (bottom hole temperature>250°C) (Sasaki et al., 1986)
may result in well bore cement systems deterioration with loss of compressive strength and
increasing permeability in a relatively short period of time (Gallus et al., 1979). According to
Jacquemet et al. (2005) the presence of a H 2S-CO 2 mixture induced carbonation of the
cement and sulfidation of iron bearing phases (steel and C 4AF) coupled with a pH decrease at
elevated pressure and temperature (500 bar and 200°C). It was reported that reactive power
cement (RPC) formulation, optimized according to the grain size distribution of Class G
cement and two different types of silica particles (silica sand and silica fume) and other
classical additives such as lignosulfonate derivatives (retarder), polynaphthalene sulfonate
(dispersant) and acrylic polymer (fluid loss agent), reduced the deteriorating effect of H 2Ssulfar gas (Noik and Rivereau, 1999).
Table 2.5 Acid- resistant light-weight cement formulations (Moulin, E., and Revil, 1997)
Cement 1 Cement 2 Cement 3 Cement 4Density kg/m3(lbm/gal)
1440 (12) 1896 (15.8) 1440 (12) 1896 (15.8)
Latex (gal/sk) - - 1.25 1.6Weight loss, %
In 1 hr 1.0 3.7 0.3 2.8In 4 hrs 4.3 21.0 0.9 7.7
2.9.4 Sulphate Attack
Sulfate ions chemically combine with tricalcium aluminate in an expansive reaction and can
cause cement distress. This process depends on the C 3A content of cement, the type and
concentration of sulphate ions, permeability of the cementitious matrix, and temperature. The
degradation process decreases with increasing temperature and can be mitigated by reducing
the permeability of the hydrated cement (Morales et al., 2003). The sulphate degradation
process requires a certain incubation period before the cementitious matrix pores become
filled with ettringite. It was reported that specimens prepared with Class A and Class G API
oil well cements showed insignificant expansion during the first 240 days when exposed to
solutions containing sulphates concentration ranging from 0 to 30000 ppm and temperatures
8/18/2019 Rheology of Oil Well Cement Slurries
http://slidepdf.com/reader/full/rheology-of-oil-well-cement-slurries 55/274
32
of 32 and 84°C (Morales et al., 2003). Pore blocking additives, dispersants and low w/c can
improve the sulphate resistance and durability performance of Class A cement (Morales et
al., 2003).
2.10 CONCLUSIONS
Research on oil well cementing has been reviewed in this paper along with existing studies
conducted on rheology, additives, mechanical properties and durability of oil/gas well
cements. A successful oil well cementing should satisfy two basic criteria: (a) it should be
easily pumpable for a sufficient time to allow proper placement of the slurry in the well bore
subjected to extreme levels of temperature and pressure, and (b) the cement slurry should
develop and maintain sufficient mechanical strength to support and protect the casing, and
must have low permeability and adequate durability to ensure the long-term isolation of the
producing formation. With the advent of API oil well cements, achieving these goals has
become easier than before when only one or two Portland cements were available for well
cementing. Chemical admixtures and mineral additives play an important role by altering the
chemical and physical properties of the oil/gas well cement slurry and maintaining the proper
rheology necessary for the placement of the cement slurry in typically deep well bores. The
appropriate oil/gas well cement slurry design is a function of many parameters including the
well bore geometry, casing hardware, formation integrity, drilling mud characteristics, presence of spacers and washers, and mixing conditions. An adequate rheological
characterization of the slurry is required to optimize cementing properties. Though cement
slurry rheology is a widely studied subject, correlations between rheological properties and
the chemical, microstructural and mechanical behaviour of the slurry after setting have not
yet been fully defined. The oil/gas well cement should meet various long-term requirements
such as resistance to chemical attack by CO 2, acids and sulphates, thermal stability and
mechanical integrity of the cement sheath. There is an opportunity for researchers to develop
novel oil/gas well cementitious systems that have stable rheology and appropriate setting
properties under high temperature and pressure, and excellent durability in much adverse
environments including CO 2, acid and sulphate attack. This warrants further dedicated
research.
8/18/2019 Rheology of Oil Well Cement Slurries
http://slidepdf.com/reader/full/rheology-of-oil-well-cement-slurries 56/274
33
2.11 REFERENCES
Agzamov, F., Karimov, N., and Akchurin, K. (2001). Preparation of Expanding Oil-Well
Cements. Oil and Gas Business Journal. available online at
http://www.ogbus.com/eng/authors /Agzamov/preparation.pdf , accessed on 27th
September, 2009.
Al-Darbi, M.M., Saeed, N.O., Ajijolaiya, L.O., and Islam, M.R. (2006). A Novel Oil Well
Cementing Technology Using Natural Fibers. Petroleum Science and Technology .
Vol. 24, No. 11, pp. 1267-1282.
API Specification 10A: Specifications for Cementing and Materials for Well Cementing,
April 2002. 23 rd Ed. 58p.
Argonne National Laboratory, (2003). Ceramicrete Provides Concrete Evidence of Superior
Performance, The University of Chicago, available online at http://www.anl.gov
/techtransfer/pdf/ceramicrete4-7-03.pdf , accessed on 24 th September, 2009.
Ariffin K.S. Barite (Barium), 9 p, available online at http://mineral.eng.usm.my/web%20
halaman%20mineral/Baryte.pdf ., accessed on September 25 th, 2009.
Backe, K.R., Lile, O.B., Lyomov, S.K., Elvebakk, H., and Skalle, P. (1999). Characterizing
Curing-Cement Slurries By Permeability, Tensile Strength, and Shrinkage. SPE
Drilling and Completion . Vol. 14, No. 3, pp. 162-167.
Backe, K.R., Skalle, P., Lile, O.B., Lyomov, S.K., Justnes, H. and Sveen, J. (1998).
Shrinkage of Oil Well Cement Slurries. Journal of Canadian Petroleum Technology .
Vol. 37, No. 9, pp. 63-67.
Barite, available online at http://www.redironoxide.com/barite/barite.php#drilling , accessed
on September 25 th, 2009.
Bentz, D.P., Coveney, P.V., Garboczi, E.J. Kleyn, M.F., and Stutzman, P.E. (1994). CellularAutomaton Simulations of Cement Hydration and Microstructure Development.
Modelling and Simulation in Materials Science and Engineering . Vol. 2, No. 4, July
1994, pp. 783-808.
8/18/2019 Rheology of Oil Well Cement Slurries
http://slidepdf.com/reader/full/rheology-of-oil-well-cement-slurries 57/274
34
Bermudez, M. (2007). Effect of Sugar on The Thickening Time of Cement Slurries. SPE
Annual Technical Conference and Exhibition , Anaheim, California, USA, 11 -14
November, 7 p.
Billingham, J., Francis, D.T.I., King, A.C., and Harrisson, A.M. (2005). A Multiphase ModelFor The Early Stages Of The Hydration Of Retarded Oilwell Cement. Journal of
Engineering Mathematics . Vol. 53, No. 2, October 2005, pp. 99-112.
Blanco, A., Centeno, A., Trujillo, M., Cadenas, C., and Martin, R. (2002). Cement Slurries
for Multilateral Junctions. Oil and Gas Journal’s International . Multilateral Well
Conference, The San Luis Resort, Galveston, Texas, 5-7 March, 2002, 10 pp.,
available online at http://downloads.pennnet.com/events/htw02/htw02tp4.pdf .
accesses on 27 th September, 2009.
Buntoro, A., and Rubiandini, R.S. (2000). The Effect of Neat Magnesium Oxide (MgO) as
Expanding Additive on Cement Shear Bond Strength at High Temperature Up To
250°C. Proceedings of World Geothermal Congress , Kyushu-Tohoku, Japan, May
28-June 10, pp. 2325-2333.
Calvert, D.G. Preface. (2006). In: Nelson, E.B. and Guillot, D. (Ed.), Well Cementing,
Schlumberger, Texas, 1-11.
Carathers, k. and Crook, R. (1987). Surface pipe cement gives high early strength with new
cement additives. Proceedings of South-Western Petroleum Short Course, Lubbock,
TX, 12-19.
Cestari, A.R., Vieira, E.F.S., Pinto, A.A., and da Rocha, F.C. (2008). Synthesis and
Characterization Of Epoxy-Modified Cement Slurries-Kinetic Data at Hardened
Slurries/HCl Interfaces. Journal of Colloid and Interface Science . Vol. 327, No. 2,
pp. 267-274.
Cestari, A.R., Vieira, E.F.S., Tavares, A.M.G., and Andrade Jr. M.A.S. (2009). An Oilwell
Cement Slurry Additivated With Bisphenol Diglycidilether/Isophoronediamine-
Kinetic Analysis and Multivariate Modelings At Slurry/HCl Interfaces. Journal of
Hazardous Materials. Vol. 170, No. 1, pp. 374-381.
Chenevert, M.E., Shrestha, B.K. (1991). Chemical Shrinkage Properties Of Oilfield Cements,
SPE Drilling Engineering . Vol. 6, No. 1, pp. 37-43.
8/18/2019 Rheology of Oil Well Cement Slurries
http://slidepdf.com/reader/full/rheology-of-oil-well-cement-slurries 58/274
35
Coveney, P.V., and Humphries, W. (1996). Molecular Modelling of The Mechanism of
Action Of Phosphonate Retarders On Hydrating Cements. Journal of the Chemical
Society . Faraday Transactions, Vol. 92, pp. 831 – 841.
Daou, F. and Piot, B. (2008). Cement Slurry Performance And Set Cement Properties Vs.Microsilica Densification. Proceedings of SPE/IADC Drilling Conference and
Exhibition 2008-Sustainable Strategies for Today's Realities, 2, March, 2008, pp.
971-983.
Detroit, W.J., Sanford, M.E., Chatterji, J., George, C.R., Childs, J.D., and Love, R. (1983).
Oil well Cementing Process. United States Patent RE31190.
Ding, G., Ni, H.J. and Wu, H.W. (2001). Experimental Study On Action Of Latex On
Cement Slurry Of Oil Well. Journal of the University of Petroleum China . Vol. 25, No. 2, pp. 16-18.
Duguid, A., Radonjic, M., Bruant, R., Mandecki, T., Scherer, G., and Celia, M. (2004). The
Effect of CO 2 Sequestration On Oil Well Cements. The 7th International Conference
on Greenhouse Gas Control Technologies, September 5-9, Vancouver, Canada, 4 p.
Duguid, A., Radonjic, M., Scherer, G. (2005). Degradation of Well Cement Exposed To
Carbonated Brine. Proceedings of the 4th Annual Conference on Carbon Capture and
Sequestration, Alexandria, VA, 12 p.
Dusseault, M., Gray, M., and Chalaturnyk, R. Mechanical behaviour of grey cement.
available online at http://www.ptac.org/drl/dl/drlt0101p.pdf , accessed on 21 st
September, 2009.
Gallus, J.P., Pyle, D.E., and Moran, L.K. (1979). Physical And Chemical Properties Of
Cement Exposed To Geothermal Dry Steam. SPE Oilfield and Geothermal Chemistry
Symposium, Houston, Texas, 22-24 January, Paper No. 7876-MS, 6 p.
Garduño, R.Z., Martinez, J.A., and Maldonado, R. (2006). Synergy Between Engineered
Fibers And Lightweight Cement Slurries To Cement Depleted Formations.
Proceedings of the IADC/SPE Asia Pacific Drilling Technology Conference 2006 -
Meeting the Value Challenge: Performance, Deliverability and Cost, Bangkok,
Thailand, Paper No. 103885-MS, pp. 445-449.
8/18/2019 Rheology of Oil Well Cement Slurries
http://slidepdf.com/reader/full/rheology-of-oil-well-cement-slurries 59/274
36
Goodwin, K.J., and Crook, R.J. (1992). Cement Sheath Stress Failure. SPE Drilling
Engineering, Vol. 7, No. 4, Paper No. 20453-Pa, pp. 291-296.
Halliburton. Technical Data, Oil Well Cements And Cement Additives, Section No. 230,
available online at http://www.halliburton.com/esg/redbook/metric/RB230A.pdf ,accessed on 27 th September, 2009.
Heinold, T., Dillenbeck, R.L., and Rogers, M.J. (2002). The Effect of Key Cement Additives
On The Mechanical Properties Of Normal Density Oil And Gas Well Cement
Systems. The SPE Asia Pacific Oil and Gas Conference and Exhibition, Melbourne,
Australia, 8-10 October, Paper No. SPE 77867, 12 p.
Hutcheon, I. (1998). The Potential Role Of Pyrite Oxidation In Corrosion And Reservoir
Souring. Journal of Canadian Petroleum Technology . Vol.37, No. 1, January 1998, pp. 27-31.
Isenburg, J.E. and Vanderhoff, J.W. (1974). Hypothesis For Reinforcement Of Portland
Cement By Polymer Latexes. Journal of The American Ceramics Society. Vol. 57,
No. 6, pp. 242-245.
Jacquemet, N., Pironon, J., and Carali, E. (2005). A New Experimental Procedure For
Simulation of H 2S+CO 2 Geological Storage. Oil and Gas Science and Technology-
Rev. IFP. Vol. 60, No. 1, pp. 193-206.
Joshi, R.C., and Lohtia, R.P. (Eds.), (1997). Advances in Concrete Technology, 2, Fly Ash in
Concrete: Production, Properties and Uses. Amsterdam, the Netherlands: Gordon and
Breach Science Publishers, 269 p.
Jupe, A.C, Wilkinson, A.P., Luke, K. Funkhouser, G.P. (2005). Class H Oil Well Cement
Hydration At Elevated Temperatures in The Presence Of Retarding Agents: An In
Situ High-Energy X-Ray Diffraction Study. Industrial and Engineering Chemistry
Research . Vol. 44, No. 15, pp. 5579-5584.
Jupe, A.C., Wilkinson, A.P., Luke, K., and Funkhouser, G.P. (2007). Slurry Consistency And
In Situ Synchrotron X-Ray Diffraction During The Early Hydration Of Portland
Cements With Calcium Chloride. Journal of the American Ceramic Society . Vol. 90,
No. 8, pp. 2595-2602.
8/18/2019 Rheology of Oil Well Cement Slurries
http://slidepdf.com/reader/full/rheology-of-oil-well-cement-slurries 60/274
37
Justnes, H., Loo, D., Reyniers, B., Skalle, P., Sveen, J., and Sellevold, E.J. (1995). Chemical
Shrinkage Of Oil Well Cement Slurries. Advances in Cement Research. Vol. 7, No.
26, pp. 85-90.
Justnes, H., Skalle, P., Sveen, J., and Øye, B.A. (1995). Porosity Of Oil Well Cement SlurriesDuring Setting. Advances in Cement Research . Vol. 7, No. 25, pp. 9-12.
Komonen, J., and Penttala, V. (2001). Effect Of High Temperature On The Pore Structure
And Strength Of Cement Paste. In: N. Banthia, K. Sakai, and O.E. Gjorv (Eds.),
Proceedings of the Third International Conference on Concrete Under Severe
Conditions, Environment and Loading, CONSEC’01, Vol. 1, Vancouver, BC,
Canada, 18-20 June, pp. 269-276.
Komonen, J., and Penttala, V. (2004). Effects Of High Temperature On The Pore StructureAnd Strength Of Plain And Polypropylene Fiber Reinforced Cement Pastes, Fire
Technology , Vol. 39, No. 1, pp. 23-34.
Kosmatka, S.H. (1990). Cementitious grouts and grouting, Portland Cement Association, 59
pp.
Krilov, Z., Loncaric, B., Naftaplin, I.N.A., and Miksa, Z. (2000). Investigation of A Long-
Term Cement Deterioration Under A High-Temperature, Sour Gas Downhole
Environment. The 2000 SPE International Symposium on Formation Damage
Control, Lafayette, Louisiana, 23-24 February, Paper No. SPE 58771, pp. 547-555.
Kumar, S., Singh, C.J., Singh, R.P. and Kachari, J. (2002). Microfine Cement: Special
Superfine Portland Cement. 7th NCB International Seminar, New Delhi, 30th April,
10 pp., available at http://www.ongcindia.com/techpaper1.asp?fold=
techpaper&file=techpaper1.txt , acceseed on 17 th September, 2009.
Lafarge. Oil Well Cements: Quality And Consistency For Over 50 Years, available online at
http://www.lafargecorp.com/wps/wcm/resources/file/ebe2760b4c01402/Oil%20
Well%20Cements%20-%20PBOWCE.pdf , accessed on 27 th September, 2009.
Lecolier, E., Rivereau, A, Ferrer, N., Audibert, A., and Longaygue, X. (2006). Durability of
Oilwell Cement Formulations Aged In H 2S-Containing Fluids. IADC/SPE Drilling
Conference, Miami, Florida, USA, 21-23 February, Paper No. 99105-MS, 9 p.
8/18/2019 Rheology of Oil Well Cement Slurries
http://slidepdf.com/reader/full/rheology-of-oil-well-cement-slurries 61/274
38
Lu, Y., Guo, X., Huang, Z., Hu, X., and Liu, Y. (2005). Research Of Polyvinyl Alcohol As
Fluid Loss Additive Of Oil Well Cement. Natural Gas Industry Journal . Vol. 25, No.
10, pp. 61-63.
Mata, F., Diaz, G., and Villa, H. (2006). Ultra Light Weight And Gas Migration Slurries: AnExcellent Solution For Gas Wells. Proceedings of SPE Annual Technical Conference
and Exhibition, 2, San Antonio, Texas, U.S.A, pp. 1341-1348.
Michaux, M., Fletcher, P., and Vidick, B. (1989). Evolution At Early Hydration Times Of
The Chemical Composition Of Liquid Phase Of Oil-Well Cement Pastes With And
Without Additives. Part I. Additive Free Cement Pastes. Cement and Concrete
Research . Vol. 19, No. 3, pp. 443-456, ISSN: 0008-8846.
Michaux, M., Nelson, E.B., and Vidik, B. (1990). Chemistry and Characterization OfPortland Cement. In: E.B. Nelson (Ed.), Well Cementing, Elsevier Science
Publishers, Amsterdam, pp. 2-1–2-17.
Moradi, S., Zonzee, P., Sandhu, D., Elarda, H., Jain, B., and Salazar, J. (2006). Engineered
Cement Set Control Additive - Solution For A Long Standing Cementing Challenge.
12th Abu Dhabi International Petroleum Exhibition and Conference, ADIPEC 2006:
Meeting the Increasing Oil and Gas Demand Through Innovation, 1, Abu Dhabi,
UAE, 2006, Paper No. 101332-MS, pp. 390-398.
Morales, M., Morris, W., Criado, M.A., Robles, J., and Bianchi, G. (2003). Improving The
Sulfate Resistance Performance Of Api Cement Class A Upon Appropriate Slurry
Design. Proceedings of the SPE Latin American and Caribbean Petroleum
Engineering Conference, Port of Spain, Trinidad and Tobago, 27-30 April, SPE
81000, pp. 35-47.
Moulin, E., and Revil, R. (1997). Improved Performance Of Lightweight Cement Slurries.
Journal of Petroleum Technology . Vol. 49, No. 8, pp. 852-853.
Myers, S., Shaari, N. EL. and Dillenbeck, L. (2005). A New Method To Evaluate Cement
Systems Design Requirements For Cyclic Steam Wells, SPE Western Regional
Meeting, Irvine, California, March 30 - April 01, Paper no. 93909-MS, 5 p.
8/18/2019 Rheology of Oil Well Cement Slurries
http://slidepdf.com/reader/full/rheology-of-oil-well-cement-slurries 62/274
39
Nakayama, M., and Beaudoin, J.J. (1987). Bond Strength Development Between Latex-
Modified Cement Paste And Steel. Cement and Concrete Research . Vol. 17, pp. 562-
572.
Nascimento, J.H.O., Martinelli, A.E., Melo, D.M.A., Nóbrega, A.C.V., Martinelli, D.M.H.,and Pinto, E.N.M.G. (2008). Portland Cement Polyurethane Composites For
Cementing Oilwell. Materials Science Forum , Vol. 591-593, pp. 423-429.
Nelson, E.B., Michaux, M., and Drochon, B. (2006). Chemistry And Characterization Of
Portland Cement. In: E.B. Nelson and Guillot, D. (Eds.), Well Cementing ,
Schlumberger, Texas, pp. 23-48.
Nelson, E.B., Baret, J.F., and Michaux, M. (1990). Cement Additives And Mechanism Of
Action. In: E.B. Nelson (Ed.), Well Cementing , Elsevier Science Publishers,Amsterdam, pp. 3-1–3-37.
Nelson, E.B., Michaux, M., and Drocho, B. (2006). Cement Additives And Mechanism Of
Action. In: E.B. Nelson and Guillot, D. (Eds.), Well Cementing , Schlumberger,
Texas, pp. 49-91.
Noik, Ch., and Rivereau, A. (1999). Oilwell Cement Durability. Proceedings - SPE Annual
Technical Conference and Exhibition, Houston, TX, USA, 3-6 October, pp. 303-308.
Oilfield Glossary, Cementing Plug. Schlumberger Limited, available online at,
http://www.glossary.oilfield.slb.com/Display.cfm?Term=weighting%20material ,
accessed on 24 th September, 2009.
Oilfield Glossary, Weighting Material. Schlumberger Limited, available online at,
http://www.glossary.oilfield.slb.com/Display.cfm?Term=weighting%20material ,
accessed on 24 th September, 2009.
Orchard, D.F. (1962). Concrete Technology, Properties of Materials. Vol. 1, 2 nd ed. 1962,
358 pp.
Pafitis, D.G. (1995). Improving The Flexural Strength Of Fibre Reinforced Oil Well Cements
By Addition Of A Polymer Latex. Materials Research Society Symposium -
Proceedings, Vol. 370, Microstructrure of Cement-Based Systems/Bonding and
Interfaces in Cementitious Materials, 1995, pp. 565-571.
8/18/2019 Rheology of Oil Well Cement Slurries
http://slidepdf.com/reader/full/rheology-of-oil-well-cement-slurries 63/274
40
Plank, J. (2011). Oil well Cementing, available online at http://www.bauchemie-
tum.de/master-framework/index.php?p=Tief&i=13&m=1&lang=en , accessed on 22 nd
April, 2011.
Popovics, S. (1992). Concrete Materials: Properties, Specifications, And Testing. 2nd
edition, Noyes Publication, 661 p.
Portland Grey Cement, available online at, http://www.alibaba.com/ catalog/10492216/
Portland_Grey_Cement.html , accessed on 24 th September, 2009.
Powers, C.A., Holman, G.B., and Smith, R.C. (1977). Process and Composition For
Cementing Casing In A Well. United States Patent 4036301.
Ramachandran, V.S. (1984). Concrete Admixtures Handbook: Properties, Science And
Technology. 626 p.
Ravi, K., Bosma, M., and Gastebled, O. (2002). Improve The Economics Of Oil And Gas
Wells By Reducing The Risk Of Cement Failure. The 2002 IADC/SPE Drilling
Conference, Dallas, February 26-28, Paper No. 74497, pp. 377-389.
Saasen, A., and Log, P.A. (1996). Effect Of Ilmenite Plant Dusts On Rheological Properties
Of Class G Oil Well Cement Slurries. Cement and Concrete Research . Vol. 26, No.
5, pp. 707-715.
Saasen, A., Rafoss, E., and Behzadi, A. (1991). Experimental Investigation Of Rheology And
Thickening Time Of Class G Oil Well Cement Slurries Containing Glycerin. Cement
and Concrete Research . Vol. 21, No. 5, pp. 911-916.
Saidin, S., Sonny, I., and Nuruddin, M.F. (2008). A New Approach For Optimizing Cement
Design To Eliminate Microannulus In Steam Injection Wells. International Petroleum
Technology Conference, IPTC 2008. 3, Kaula Lumpur, Malaysia, pp. 1527-1541.
Sasaki, S., Kobayashi, W., and Okabajashi, S. (1986). Strength Development of 2CaO.SiO 2 –Silica Cement Under High Temperature And High Pressure Conditions. SPE
Production Engineering . 1 (1), pp. 42-48.
Smith, D.K. (1987). Cementing. Monograph Series, 4, SPE, Dallas, 264 p.
8/18/2019 Rheology of Oil Well Cement Slurries
http://slidepdf.com/reader/full/rheology-of-oil-well-cement-slurries 64/274
41
Sorgard, E., and Viali, R. (2007). Solution For A Long-Standing Cementing Challenge-
Engineered Cement Set Control Additive. Proceedings of Offshore Europe Oil and
Gas Conference and Exhibition, Scotland, UK, Paper No. 106964-MS, pp. 20-25.
Su, Z., Bijen J.M., and Larbi J.A. (1991). The Influence Of Polymer Modification On TheAdhesion Of Cement Pastes To Aggregates. Cement and Concrete Research . Vol. 21,
No. 5, pp. 727-736.
Taylor, H.F.W. (1997). Cement Chemistry. London: Academic Press, 475 p.
Trabelsi, A.M.S., and Al-Samarraie, L.S. (1999). Fiber Content Affects Porosity,
Permeability And Strength Of Cement. Oil and Gas Journal . Vol. 97, No. 18, May 3,
pp. 108-114.
Tranquini, N., Soto, J., Reveth, V., Prato, L., and Williams, H. (2007). Proven Synergistic
Approach In Well Cementing Across Thief Zones: East Venezuela. Proceedings of
the SPE Latin American and Caribbean Petroleum Engineering Conference, Vol. 2,
pp. 814-822.
US Department of Transportation, Federal Highway Administration, Portland Cement,
available online at http://www.fhwa.dot.gov/infrastructure/materialsgrp/ cement.html ,
accessed on 24 th September, 2009.
Vidick, B., Fletcher, P., and Michaux, M. (1989). Evolution At Early Hydration Times Of
The Chemical Composition Of Liquid Phase Of Oil-Well Cement Pastes With And
Without Additives. Part II. Cement Pastes Containing Additives. Cement and
Concrete Research . Vol. 19, No. 4, pp. 567-578, ISSN: 0008-8846.
Vlachou, P.V., and Piau, J.M. (1997). The Influence Of The Shear Field On The
Microstrctural And Chemical Evolution Of An Oil Well Cement Slurry And Its
Rheological Impact. Cement and Concrete Research . Vol. 27, No. 6, pp. 869-881.
Yang, Y., Guo, X., Zhang, Y., and Liao, G. (2001). Study And Application Of Corrosion-
Resistant Low-Density Cement System. Tianranqi Gongye/Natural Gas Industry,
Vol. 21, No. 2, pp. 48-51.

8/18/2019 Rheology of Oil Well Cement Slurries
http://slidepdf.com/reader/full/rheology-of-oil-well-cement-slurries 65/274
42
Yao, X., and Hua, S.D. (2007). Design of a Novel Composite Agent For Improving The
Toughness Of Oilwell Cement Sheath. Proceedings of SPE International Symposium
on Oilfield Chemistry, Houston, Texas, U.S.A, pp. 191-197.
Zhang, J., Wang, Y., Xu, M., and Zhao, Q. (2009). Effect of Carbon Dioxide Corrosion OnCompressive Strength Of Oilwell Cement. Journal of the Chinese Ceramic Society.
Vol. 37, No. 4, pp. 642-647.
Zhang, J., Xu, M., Yan, Z., and Gao, L. (2008). Hydration And Hardening Of Class G
Oilwell Cement With And Without Silica Sands Under High Temperatures. Journal
of the Chinese Ceramic Society . Vol. 36, No. 7, pp. 939-945.
8/18/2019 Rheology of Oil Well Cement Slurries
http://slidepdf.com/reader/full/rheology-of-oil-well-cement-slurries 66/274
43
C h a p t e r 3
RHEOLOGY OF OIL WELL CEMENT SLURRIES
3.1 Introduction
The word “Rheology” originates from the Greek word “reo”, meaning flow. Rheology is the
study of the deformation and flow of materials. Typically, rheology studies the deformation
of those materials whose behaviour falls between solids and fluids (viscoelastic materials)
(Barnes et al., 1989). The study of rheological properties attempts to determine the intrinsic
fluid properties; mainly viscosity, which is necessary to determine the relationships between
the flow rate (shear rate) and the pressure gradient (shear stress) that causes the movement of
a fluid (Guillot, 2006). The science of rheology can be employed for instance for achieving
the following goals:
• To understand the interactions between different ingredients in a material to get an
insight into its structure.
• To control the quality of a raw material by measuring its rheological properties. The
acceptance/rejection of a product can be determined based on rheological results.
• To evaluate the mixability and pumpability of a slurry.
• To determine the frictional pressure when a slurry flows in pipes and annuli.
• To evaluate the capability of a slurry or paste to transport large particles (e.g., some
lost circulation materials and fibres).
• To evaluate how the surrounding temperature profile affects the placement of a slurry
or paste.
• To design a processing equipment such as selecting the appropriate pump to provide
sufficient power for a material to flow over a certain distance in pipelines. Therelationship between the pump and flow in pipelines is governed by the rheological
properties of the material.
Fluid movement may be compared to a large number of platelets moving parallel to one
another at different velocities (Guillot, 2006) (Fig. 3.1). In this simple flow geometry, the
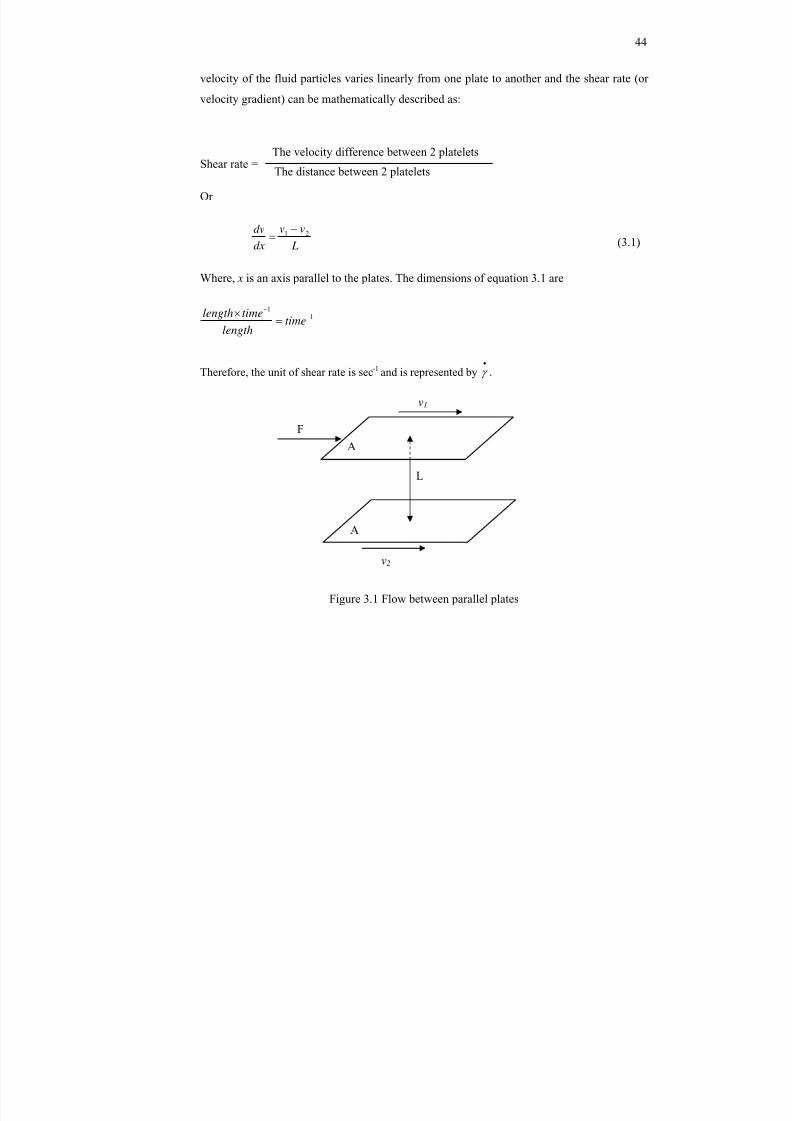
8/18/2019 Rheology of Oil Well Cement Slurries
http://slidepdf.com/reader/full/rheology-of-oil-well-cement-slurries 67/274
44
velocity of the fluid particles varies linearly from one plate to another and the shear rate (or
velocity gradient) can be mathematically described as:
Shear rate =
Or
Lvv
dxdv 21
(3.1)
Where, x is an axis parallel to the plates. The dimensions of equation 3.1 are
11
timelength
timelength
Therefore, the unit of shear rate is sec -1 and is represented by .
Figure 3.1 Flow between parallel plates
The velocity difference between 2 plateletsThe distance between 2 platelets
FA
A
v1
v2
L
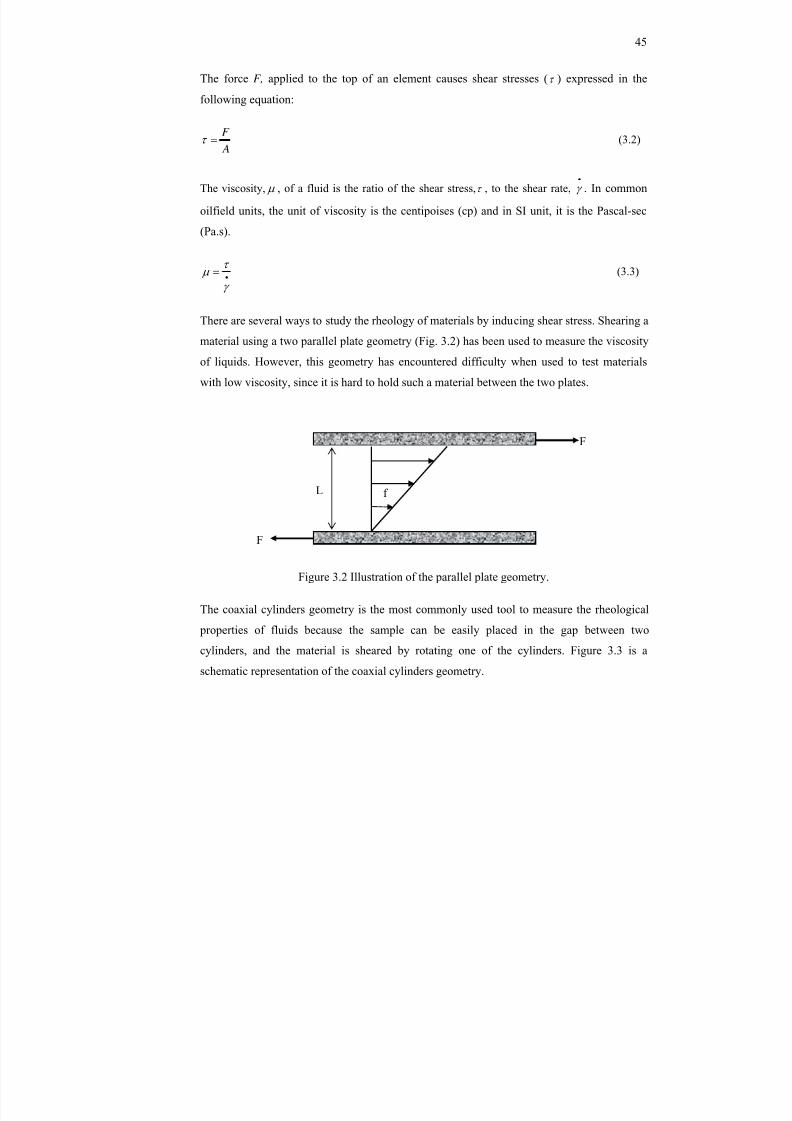
8/18/2019 Rheology of Oil Well Cement Slurries
http://slidepdf.com/reader/full/rheology-of-oil-well-cement-slurries 68/274
45
The force F, applied to the top of an element causes shear stresses ( ) expressed in the
following equation:
A
F (3.2)
The viscosity, , of a fluid is the ratio of the shear stress, , to the shear rate, . In common
oilfield units, the unit of viscosity is the centipoises (cp) and in SI unit, it is the Pascal-sec
(Pa.s).
(3.3)
There are several ways to study the rheology of materials by inducing shear stress. Shearing a
material using a two parallel plate geometry (Fig. 3.2) has been used to measure the viscosity
of liquids. However, this geometry has encountered difficulty when used to test materials
with low viscosity, since it is hard to hold such a material between the two plates.
Figure 3.2 Illustration of the parallel plate geometry.
The coaxial cylinders geometry is the most commonly used tool to measure the rheological
properties of fluids because the sample can be easily placed in the gap between two
cylinders, and the material is sheared by rotating one of the cylinders. Figure 3.3 is a
schematic representation of the coaxial cylinders geometry.
f
F
F
L
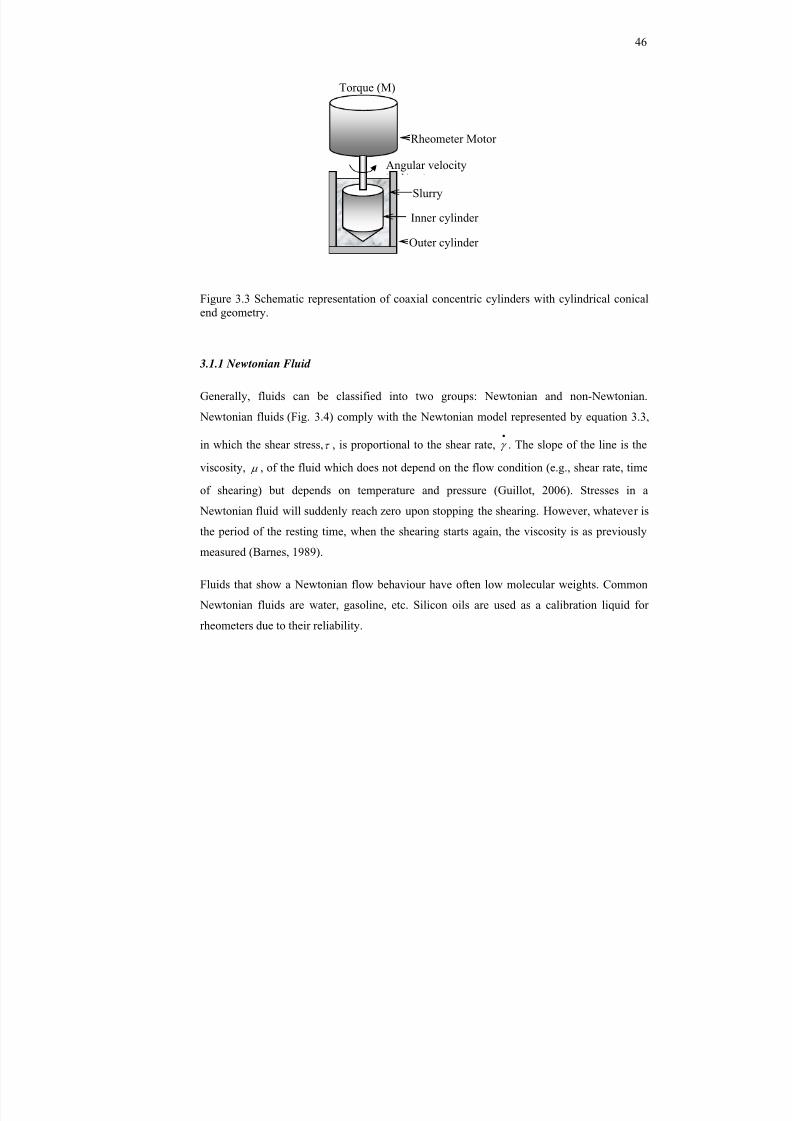
8/18/2019 Rheology of Oil Well Cement Slurries
http://slidepdf.com/reader/full/rheology-of-oil-well-cement-slurries 69/274
46
Figure 3.3 Schematic representation of coaxial concentric cylinders with cylindrical conicalend geometry.
3.1.1 Newtonian Fluid
Generally, fluids can be classified into two groups: Newtonian and non-Newtonian.
Newtonian fluids (Fig. 3.4) comply with the Newtonian model represented by equation 3.3,
in which the shear stress, , is proportional to the shear rate, . The slope of the line is the
viscosity, , of the fluid which does not depend on the flow condition (e.g., shear rate, time
of shearing) but depends on temperature and pressure (Guillot, 2006). Stresses in a
Newtonian fluid will suddenly reach zero upon stopping the shearing. However, whatever is
the period of the resting time, when the shearing starts again, the viscosity is as previously
measured (Barnes, 1989).
Fluids that show a Newtonian flow behaviour have often low molecular weights. Common
Newtonian fluids are water, gasoline, etc. Silicon oils are used as a calibration liquid forrheometers due to their reliability.
Angular velocity
Torque (M)
Inner cylinder
Outer cylinder
Slurry
Rheometer Motor
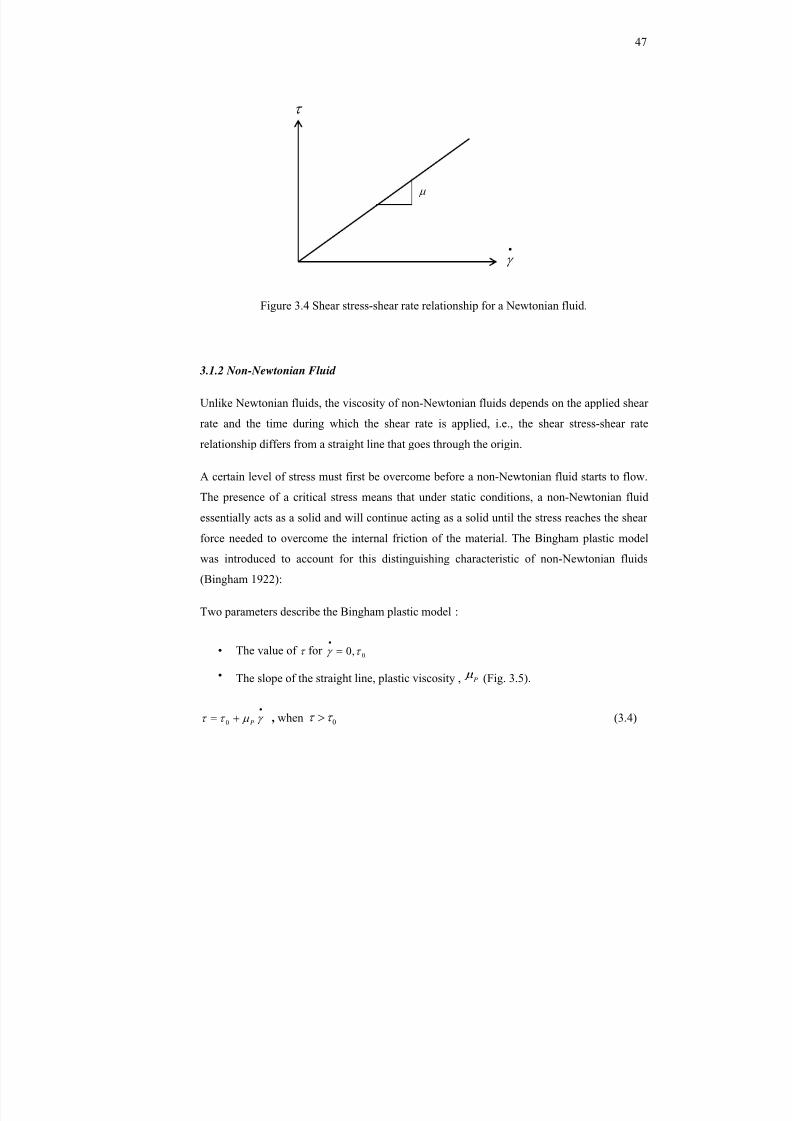
8/18/2019 Rheology of Oil Well Cement Slurries
http://slidepdf.com/reader/full/rheology-of-oil-well-cement-slurries 70/274
47
Figure 3.4 Shear stress-shear rate relationship for a Newtonian fluid.
3.1.2 Non-Newtonian Fluid
Unlike Newtonian fluids, the viscosity of non-Newtonian fluids depends on the applied shear
rate and the time during which the shear rate is applied, i.e., the shear stress-shear rate
relationship differs from a straight line that goes through the origin.
A certain level of stress must first be overcome before a non-Newtonian fluid starts to flow.
The presence of a critical stress means that under static conditions, a non-Newtonian fluid
essentially acts as a solid and will continue acting as a solid until the stress reaches the shear
force needed to overcome the internal friction of the material. The Bingham plastic model
was introduced to account for this distinguishing characteristic of non-Newtonian fluids
(Bingham 1922):
Two parameters describe the Bingham plastic model :
• The value of for 0,0
• The slope of the straight line, plastic viscosity , P (Fig. 3.5).
P0 , when 0 (3.4)
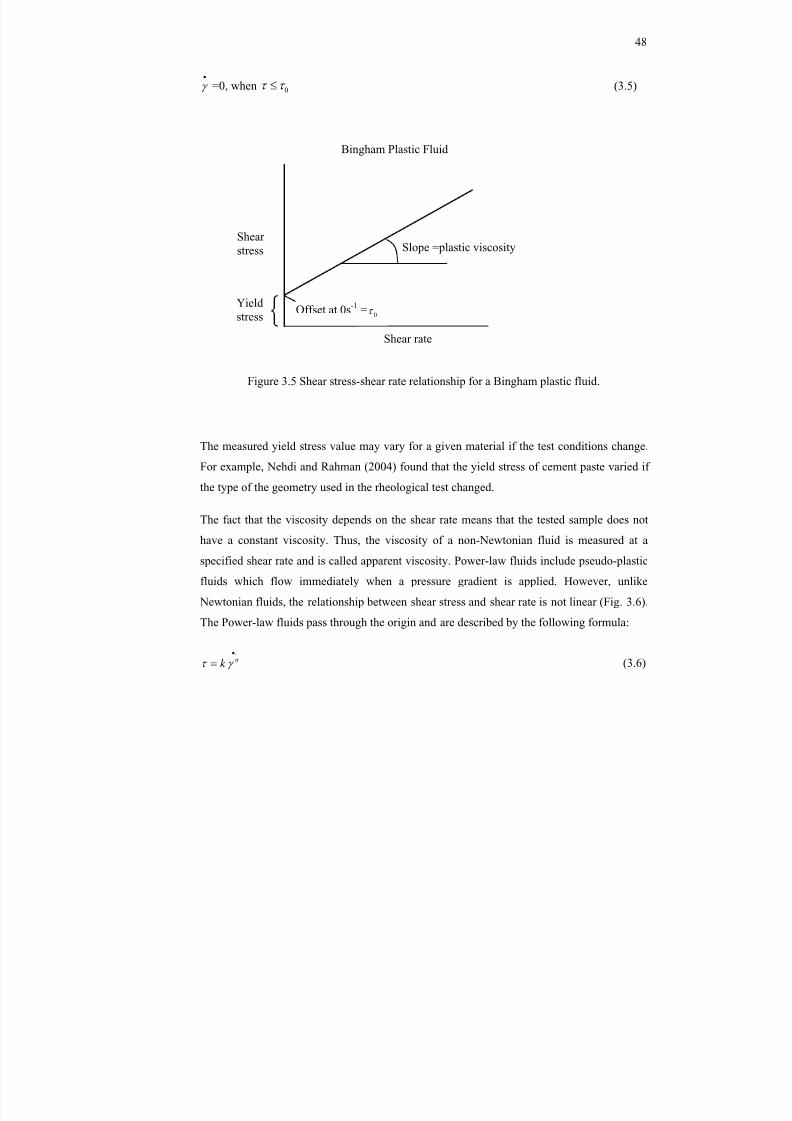
8/18/2019 Rheology of Oil Well Cement Slurries
http://slidepdf.com/reader/full/rheology-of-oil-well-cement-slurries 71/274
48
=0, when 0 (3.5)
Figure 3.5 Shear stress-shear rate relationship for a Bingham plastic fluid.
The measured yield stress value may vary for a given material if the test conditions change.
For example, Nehdi and Rahman (2004) found that the yield stress of cement paste varied if
the type of the geometry used in the rheological test changed.
The fact that the viscosity depends on the shear rate means that the tested sample does not
have a constant viscosity. Thus, the viscosity of a non-Newtonian fluid is measured at a
specified shear rate and is called apparent viscosity. Power-law fluids include pseudo-plastic
fluids which flow immediately when a pressure gradient is applied. However, unlike
Newtonian fluids, the relationship between shear stress and shear rate is not linear (Fig. 3.6).The Power-law fluids pass through the origin and are described by the following formula:
.nk (3.6)
Slope =plastic viscosity
Offset at 0s -1 = 0
Shearstress
Shear rate
Bingham Plastic Fluid
Yieldstress
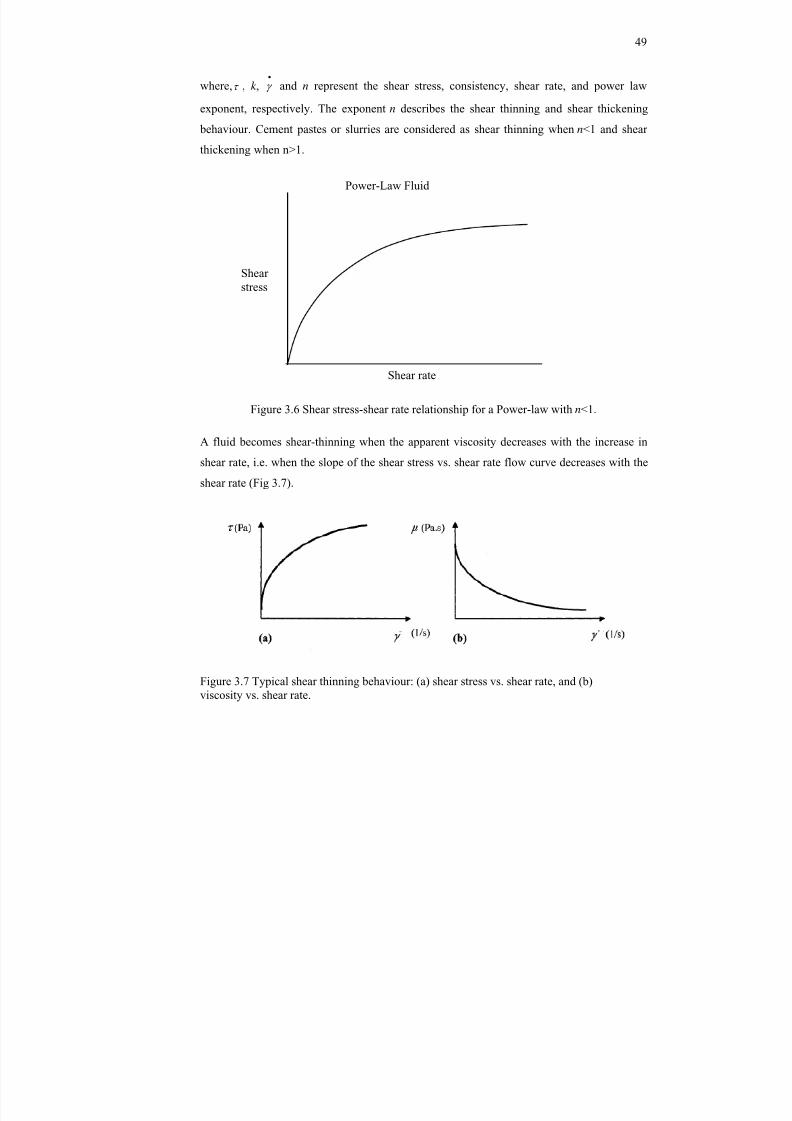
8/18/2019 Rheology of Oil Well Cement Slurries
http://slidepdf.com/reader/full/rheology-of-oil-well-cement-slurries 72/274
49
where, , k , and n represent the shear stress, consistency, shear rate, and power law
exponent, respectively. The exponent n describes the shear thinning and shear thickening
behaviour. Cement pastes or slurries are considered as shear thinning when n<1 and shear
thickening when n>1.
Figure 3.6 Shear stress-shear rate relationship for a Power-law with n<1.
A fluid becomes shear-thinning when the apparent viscosity decreases with the increase in
shear rate, i.e. when the slope of the shear stress vs. shear rate flow curve decreases with the
shear rate (Fig 3.7).
Figure 3.7 Typical shear thinning behaviour: (a) shear stress vs. shear rate, and (b)viscosity vs. shear rate.
Shearstress
Shear rate
Power-Law Fluid
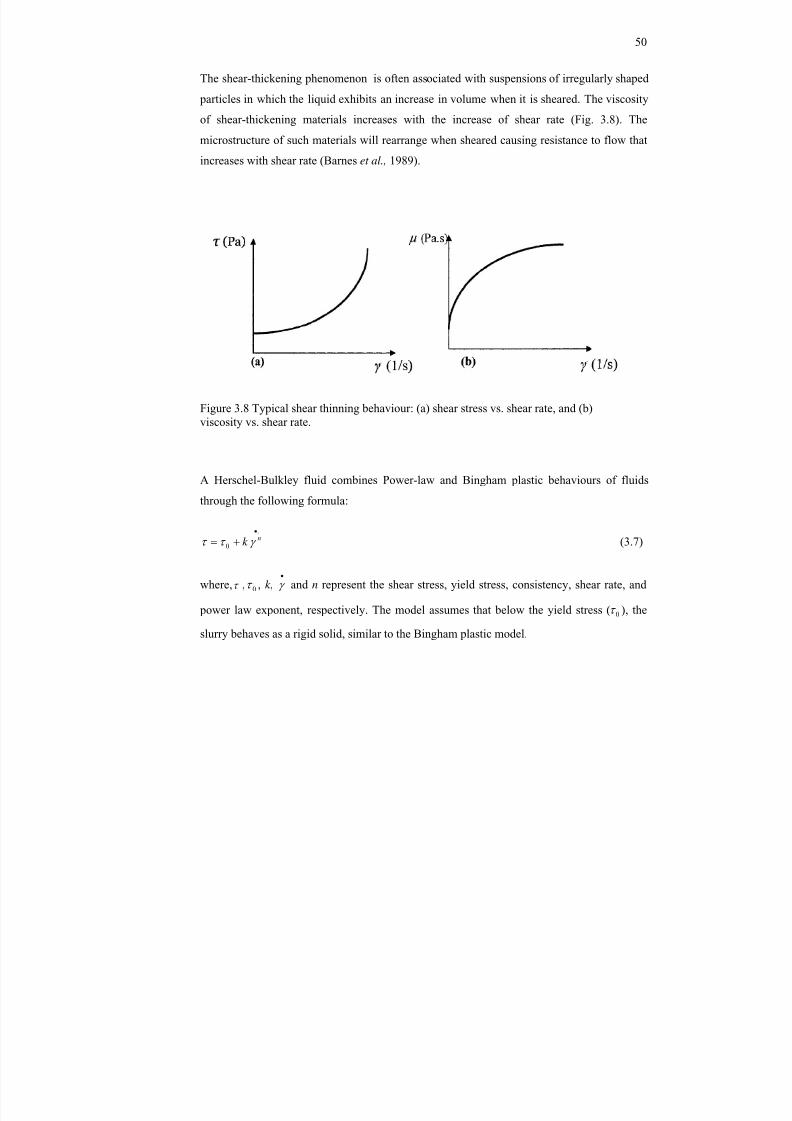
8/18/2019 Rheology of Oil Well Cement Slurries
http://slidepdf.com/reader/full/rheology-of-oil-well-cement-slurries 73/274
50
The shear-thickening phenomenon is often associated with suspensions of irregularly shaped
particles in which the liquid exhibits an increase in volume when it is sheared. The viscosity
of shear-thickening materials increases with the increase of shear rate (Fig. 3.8). The
microstructure of such materials will rearrange when sheared causing resistance to flow that
increases with shear rate (Barnes et al., 1989).
Figure 3.8 Typical shear thinning behaviour: (a) shear stress vs. shear rate, and (b)viscosity vs. shear rate.
A Herschel-Bulkley fluid combines Power-law and Bingham plastic behaviours of fluids
through the following formula:
.
0nk (3.7)
where, , 0 , k , and n represent the shear stress, yield stress, consistency, shear rate, and
power law exponent, respectively. The model assumes that below the yield stress ( 0 ), the
slurry behaves as a rigid solid, similar to the Bingham plastic model.
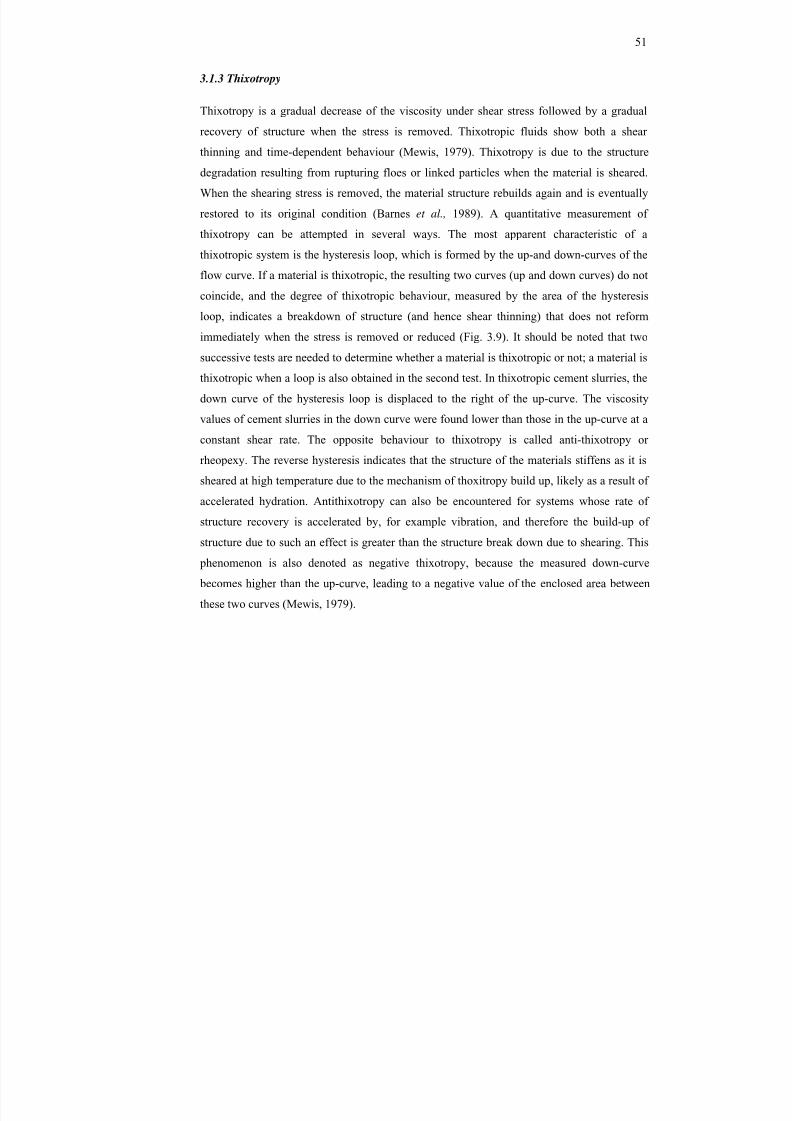
8/18/2019 Rheology of Oil Well Cement Slurries
http://slidepdf.com/reader/full/rheology-of-oil-well-cement-slurries 74/274
51
3.1.3 Thixotropy
Thixotropy is a gradual decrease of the viscosity under shear stress followed by a gradual
recovery of structure when the stress is removed. Thixotropic fluids show both a shear
thinning and time-dependent behaviour (Mewis, 1979). Thixotropy is due to the structuredegradation resulting from rupturing floes or linked particles when the material is sheared.
When the shearing stress is removed, the material structure rebuilds again and is eventually
restored to its original condition (Barnes et al., 1989). A quantitative measurement of
thixotropy can be attempted in several ways. The most apparent characteristic of a
thixotropic system is the hysteresis loop, which is formed by the up-and down-curves of the
flow curve. If a material is thixotropic, the resulting two curves (up and down curves) do not
coincide, and the degree of thixotropic behaviour, measured by the area of the hysteresis
loop, indicates a breakdown of structure (and hence shear thinning) that does not reform
immediately when the stress is removed or reduced (Fig. 3.9). It should be noted that two
successive tests are needed to determine whether a material is thixotropic or not; a material is
thixotropic when a loop is also obtained in the second test. In thixotropic cement slurries, the
down curve of the hysteresis loop is displaced to the right of the up-curve. The viscosity
values of cement slurries in the down curve were found lower than those in the up-curve at a
constant shear rate. The opposite behaviour to thixotropy is called anti-thixotropy or
rheopexy. The reverse hysteresis indicates that the structure of the materials stiffens as it is
sheared at high temperature due to the mechanism of thoxitropy build up, likely as a result of
accelerated hydration. Antithixotropy can also be encountered for systems whose rate of
structure recovery is accelerated by, for example vibration, and therefore the build-up of
structure due to such an effect is greater than the structure break down due to shearing. This
phenomenon is also denoted as negative thixotropy, because the measured down-curve
becomes higher than the up-curve, leading to a negative value of the enclosed area between
these two curves (Mewis, 1979).
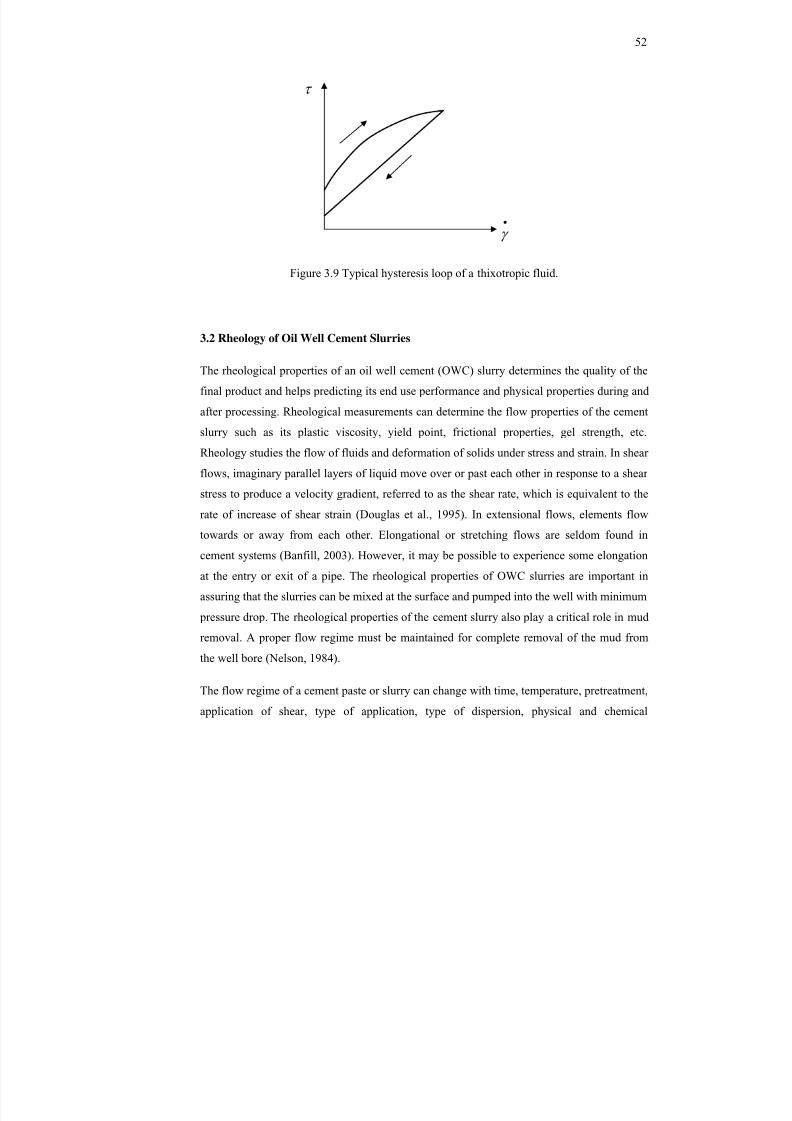
8/18/2019 Rheology of Oil Well Cement Slurries
http://slidepdf.com/reader/full/rheology-of-oil-well-cement-slurries 75/274
52
Figure 3.9 Typical hysteresis loop of a thixotropic fluid.
3.2 Rheology of Oil Well Cement Slurries
The rheological properties of an oil well cement (OWC) slurry determines the quality of the
final product and helps predicting its end use performance and physical properties during and
after processing. Rheological measurements can determine the flow properties of the cement
slurry such as its plastic viscosity, yield point, frictional properties, gel strength, etc.
Rheology studies the flow of fluids and deformation of solids under stress and strain. In shearflows, imaginary parallel layers of liquid move over or past each other in response to a shear
stress to produce a velocity gradient, referred to as the shear rate, which is equivalent to the
rate of increase of shear strain (Douglas et al., 1995). In extensional flows, elements flow
towards or away from each other. Elongational or stretching flows are seldom found in
cement systems (Banfill, 2003). However, it may be possible to experience some elongation
at the entry or exit of a pipe. The rheological properties of OWC slurries are important in
assuring that the slurries can be mixed at the surface and pumped into the well with minimum
pressure drop. The rheological properties of the cement slurry also play a critical role in mud
removal. A proper flow regime must be maintained for complete removal of the mud from
the well bore (Nelson, 1984).
The flow regime of a cement paste or slurry can change with time, temperature, pretreatment,
application of shear, type of application, type of dispersion, physical and chemical
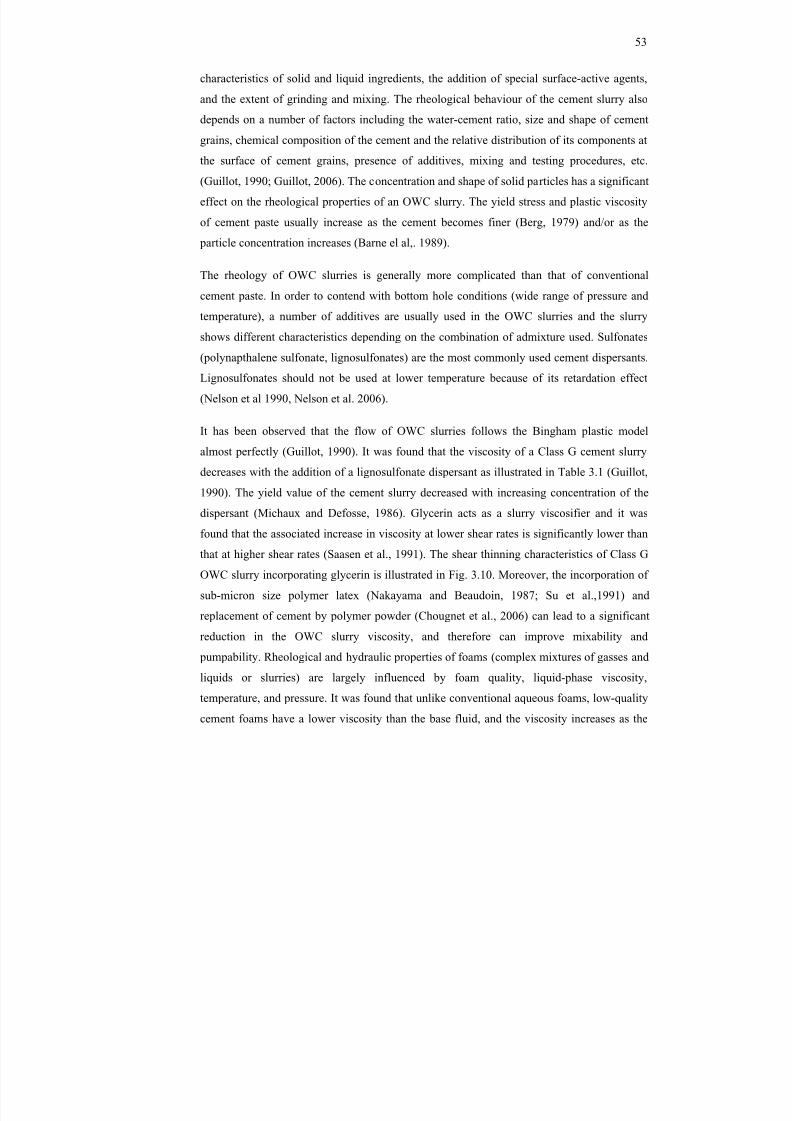
8/18/2019 Rheology of Oil Well Cement Slurries
http://slidepdf.com/reader/full/rheology-of-oil-well-cement-slurries 76/274
53
characteristics of solid and liquid ingredients, the addition of special surface-active agents,
and the extent of grinding and mixing. The rheological behaviour of the cement slurry also
depends on a number of factors including the water-cement ratio, size and shape of cement
grains, chemical composition of the cement and the relative distribution of its components at
the surface of cement grains, presence of additives, mixing and testing procedures, etc.
(Guillot, 1990; Guillot, 2006). The concentration and shape of solid particles has a significant
effect on the rheological properties of an OWC slurry. The yield stress and plastic viscosity
of cement paste usually increase as the cement becomes finer (Berg, 1979) and/or as the
particle concentration increases (Barne el al,. 1989).
The rheology of OWC slurries is generally more complicated than that of conventional
cement paste. In order to contend with bottom hole conditions (wide range of pressure and
temperature), a number of additives are usually used in the OWC slurries and the slurry
shows different characteristics depending on the combination of admixture used. Sulfonates
(polynapthalene sulfonate, lignosulfonates) are the most commonly used cement dispersants.
Lignosulfonates should not be used at lower temperature because of its retardation effect
(Nelson et al 1990, Nelson et al. 2006).
It has been observed that the flow of OWC slurries follows the Bingham plastic model
almost perfectly (Guillot, 1990). It was found that the viscosity of a Class G cement slurrydecreases with the addition of a lignosulfonate dispersant as illustrated in Table 3.1 (Guillot,
1990). The yield value of the cement slurry decreased with increasing concentration of the
dispersant (Michaux and Defosse, 1986). Glycerin acts as a slurry viscosifier and it was
found that the associated increase in viscosity at lower shear rates is significantly lower than
that at higher shear rates (Saasen et al., 1991). The shear thinning characteristics of Class G
OWC slurry incorporating glycerin is illustrated in Fig. 3.10. Moreover, the incorporation of
sub-micron size polymer latex (Nakayama and Beaudoin, 1987; Su et al.,1991) and
replacement of cement by polymer powder (Chougnet et al., 2006) can lead to a significant
reduction in the OWC slurry viscosity, and therefore can improve mixability and
pumpability. Rheological and hydraulic properties of foams (complex mixtures of gasses and
liquids or slurries) are largely influenced by foam quality, liquid-phase viscosity,
temperature, and pressure. It was found that unlike conventional aqueous foams, low-quality
cement foams have a lower viscosity than the base fluid, and the viscosity increases as the
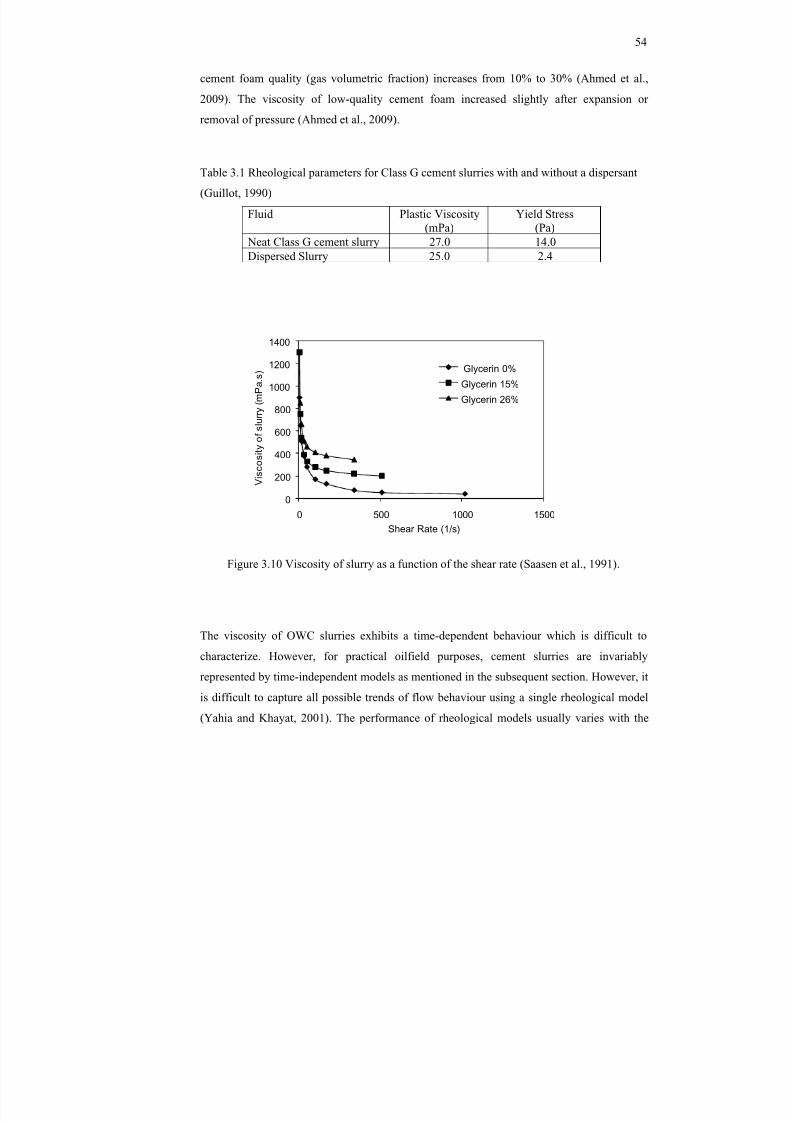
8/18/2019 Rheology of Oil Well Cement Slurries
http://slidepdf.com/reader/full/rheology-of-oil-well-cement-slurries 77/274
54
cement foam quality (gas volumetric fraction) increases from 10% to 30% (Ahmed et al.,
2009). The viscosity of low-quality cement foam increased slightly after expansion or
removal of pressure (Ahmed et al., 2009).
Table 3.1 Rheological parameters for Class G cement slurries with and without a dispersant
(Guillot, 1990)
Fluid Plastic Viscosity(mPa)
Yield Stress(Pa)
Neat Class G cement slurry 27.0 14.0Dispersed Slurry 25.0 2.4
0
200
400
600
800
1000
1200
1400
0 500 1000 1500
V i s c o s i
t y o
f s
l u r r y
( m P a . s
)
Shear Rate (1/s)
Glycerin 0%
Glycerin 15%
Glycerin 26%
Figure 3.10 Viscosity of slurry as a function of the shear rate (Saasen et al., 1991).
The viscosity of OWC slurries exhibits a time-dependent behaviour which is difficult to
characterize. However, for practical oilfield purposes, cement slurries are invariably
represented by time-independent models as mentioned in the subsequent section. However, it
is difficult to capture all possible trends of flow behaviour using a single rheological model
(Yahia and Khayat, 2001). The performance of rheological models usually varies with the
8/18/2019 Rheology of Oil Well Cement Slurries
http://slidepdf.com/reader/full/rheology-of-oil-well-cement-slurries 78/274
55
test geometries, gap between shearing surfaces and their friction capacity, which makes the
measurements more complicated (Nehdi and Rahman, 2004).
3.2.1 Time-Independent Rheological Models
Though there are qualitative and quantitative discrepancies between the rheological results
for cement paste reported by different researchers, it is worthwhile to present the most
commonly used rheological models to describe the rheological behaviour of cement slurries.
These rheological models are usually mathematical expressions (Guillot, 1990; Banfill, 2003;
Nehdi, 1998) of the shear stress or usually viscosity as a function of the shear rate. Figure
3.11 shows examples of slurry flow curves used in the petroleum industry (Guillot, 1990).
Various rheological models used to describe cement slurry rheology are summarized in Table
3.2.
Existing time-independent rheological models allow fitting shear stress, shear strain rate and
viscosity experimental data to specific trends using rheological data analysis software.
However, no model is free from statistical error (Nehdi and Rahman, 2004). The Bingham
plastic model and the power law model are widely used to describe the rheological properties
of cement slurries (Guillot, 1990). The Bingham plastic model includes both yield stress, 0
and a limiting viscosity,P
at finite shear rates, which the Power law model fails to consider.
However, the Bingham plastic model tends to overestimate the shear stress at both low and
high shear rates in a manner opposite to that of the power law model (Guillot, 1990). It was
argued that friction pressures of cement slurries are better described by a modified form of
the theoretical Bingham plastic friction pressure equations (Shah and Sutton, 1990).
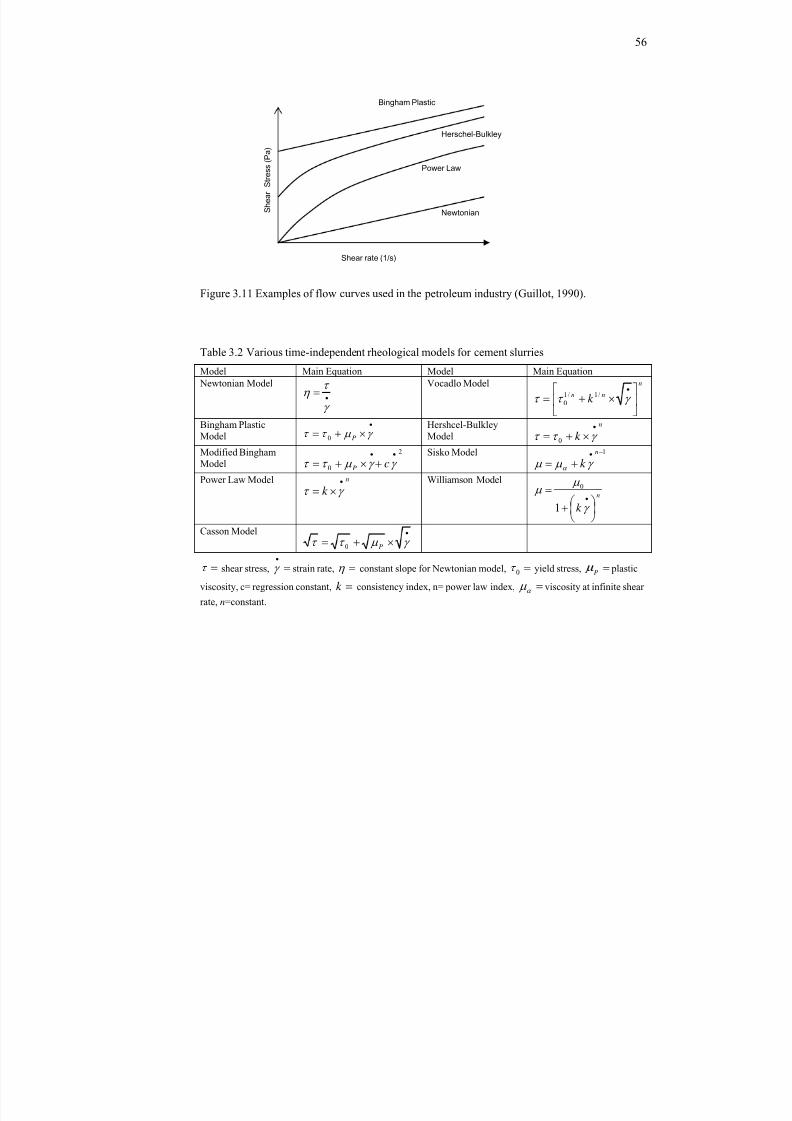
8/18/2019 Rheology of Oil Well Cement Slurries
http://slidepdf.com/reader/full/rheology-of-oil-well-cement-slurries 79/274
56
Figure 3.11 Examples of flow curves used in the petroleum industry (Guillot, 1990).
Table 3.2 Various time-independent rheological models for cement slurries
Model Main Equation Model Main Equation Newtonian Model
Vocadlo Model n
nn k
/1/1
0
Bingham PlasticModel P0
Hershcel-BulkleyModel
n
k 0
Modified BinghamModel2
0 cP Sisko Model 1nk
Power Law Model n
k Williamson Model
n
k
1
0
Casson Model P0
shear stress, strain rate, constant slope for Newtonian model, 0 yield stress, P plastic
viscosity, c= regression constant, k consistency index, n= power law index, viscosity at infinite shear
rate, n=constant.
S h e a r
S t r e s s
( P a )
Newtonian
Power Law
Herschel-Bulkley
Bingham Plastic
Shear rate (1/s)
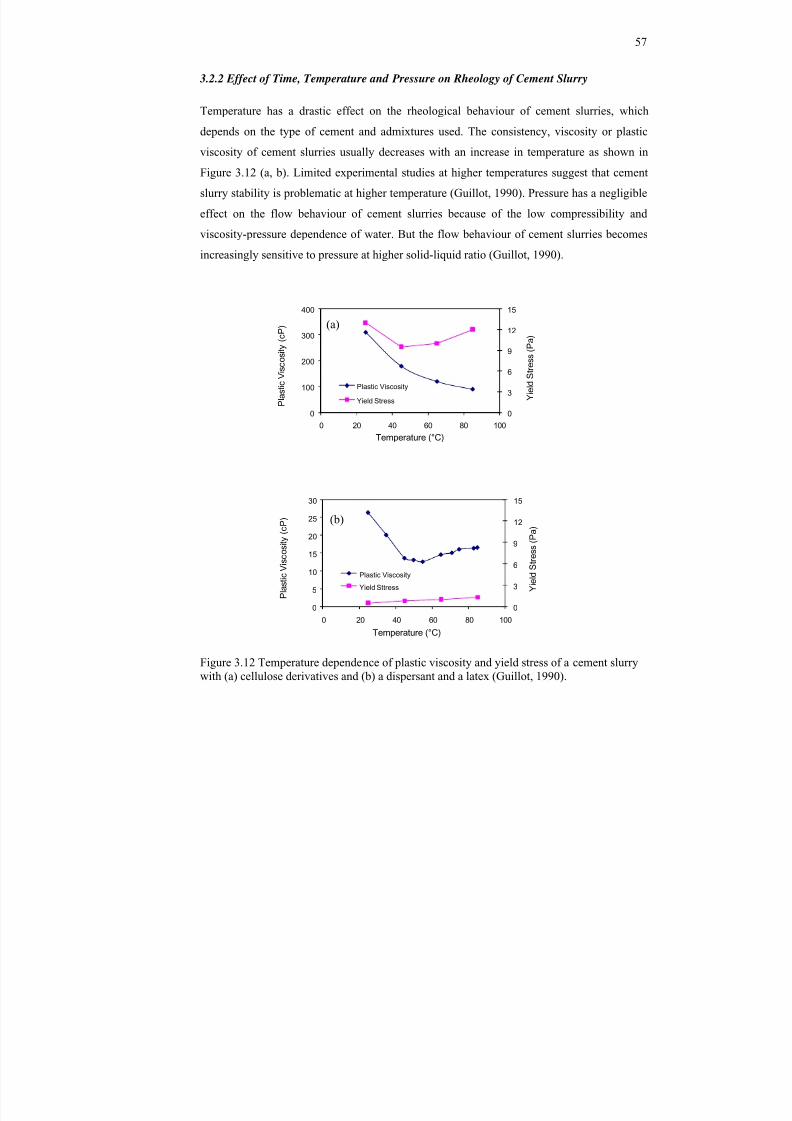
8/18/2019 Rheology of Oil Well Cement Slurries
http://slidepdf.com/reader/full/rheology-of-oil-well-cement-slurries 80/274
57
3.2.2 Effect of Time, Temperature and Pressure on Rheology of Cement Slurry
Temperature has a drastic effect on the rheological behaviour of cement slurries, which
depends on the type of cement and admixtures used. The consistency, viscosity or plastic
viscosity of cement slurries usually decreases with an increase in temperature as shown inFigure 3.12 (a, b). Limited experimental studies at higher temperatures suggest that cement
slurry stability is problematic at higher temperature (Guillot, 1990). Pressure has a negligible
effect on the flow behaviour of cement slurries because of the low compressibility and
viscosity-pressure dependence of water. But the flow behaviour of cement slurries becomes
increasingly sensitive to pressure at higher solid-liquid ratio (Guillot, 1990).
0
3
6
9
12
15
0
100
200
300
400
0 20 40 60 80 100
Y i e l d S t r e s s
( P a
)
P l a s t i c
V i s c o s i t y
( c P )
Temperature (°C)
Plastic Viscosity
Yield Stress
0
3
6
9
12
15
0
5
10
15
20
25
30
0 20 40 60 80 100
Y i e l d S t r e s s
( P a
)
P l a s t i c
V i s c o s i t y
( c P )
Temperature (°C)
Plastic Viscosity
Yield Sttress
Figure 3.12 Temperature dependence of plastic viscosity and yield stress of a cement slurrywith (a) cellulose derivatives and (b) a dispersant and a latex (Guillot, 1990).
(b)
(a)
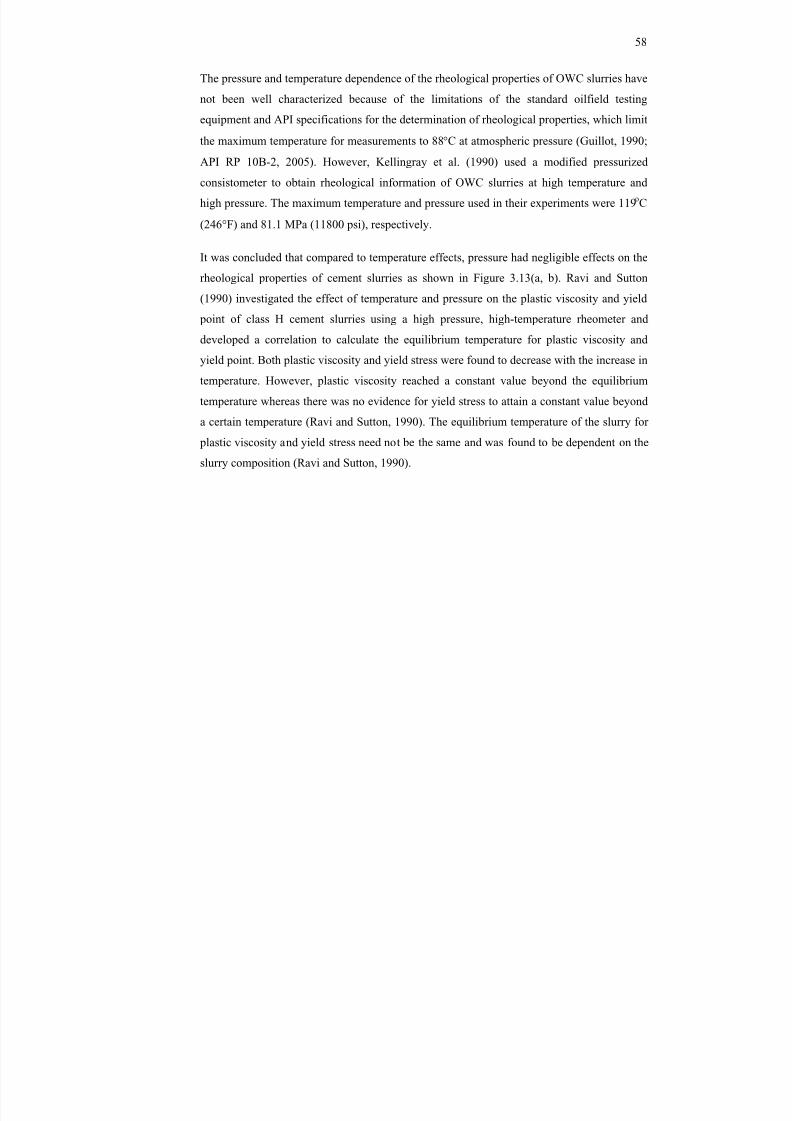
8/18/2019 Rheology of Oil Well Cement Slurries
http://slidepdf.com/reader/full/rheology-of-oil-well-cement-slurries 81/274
58
The pressure and temperature dependence of the rheological properties of OWC slurries have
not been well characterized because of the limitations of the standard oilfield testing
equipment and API specifications for the determination of rheological properties, which limit
the maximum temperature for measurements to 88 C at atmospheric pressure (Guillot, 1990;
API RP 10B-2, 2005). However, Kellingray et al. (1990) used a modified pressurized
consistometer to obtain rheological information of OWC slurries at high temperature and
high pressure. The maximum temperature and pressure used in their experiments were 119 oC
(246 F) and 81.1 MPa (11800 psi), respectively.
It was concluded that compared to temperature effects, pressure had negligible effects on the
rheological properties of cement slurries as shown in Figure 3.13(a, b). Ravi and Sutton
(1990) investigated the effect of temperature and pressure on the plastic viscosity and yield point of class H cement slurries using a high pressure, high-temperature rheometer and
developed a correlation to calculate the equilibrium temperature for plastic viscosity and
yield point. Both plastic viscosity and yield stress were found to decrease with the increase in
temperature. However, plastic viscosity reached a constant value beyond the equilibrium
temperature whereas there was no evidence for yield stress to attain a constant value beyond
a certain temperature (Ravi and Sutton, 1990). The equilibrium temperature of the slurry for
plastic viscosity and yield stress need not be the same and was found to be dependent on the
slurry composition (Ravi and Sutton, 1990).
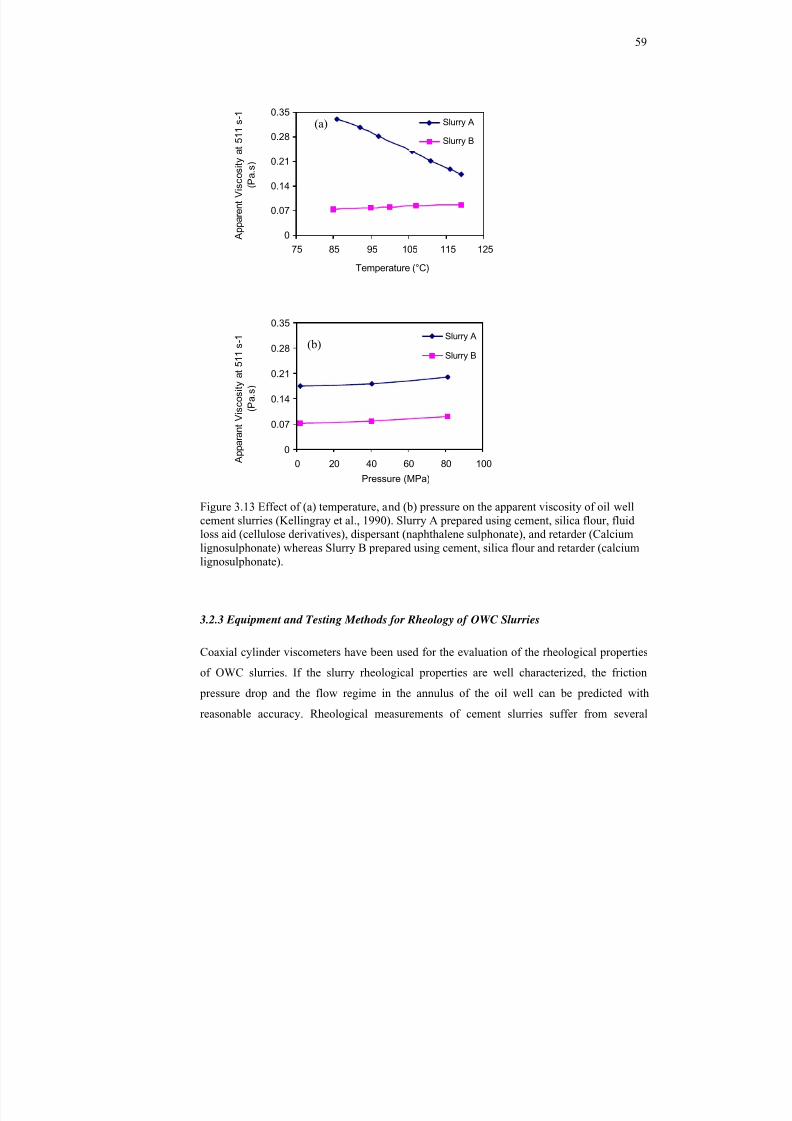
8/18/2019 Rheology of Oil Well Cement Slurries
http://slidepdf.com/reader/full/rheology-of-oil-well-cement-slurries 82/274
59
0
0.07
0.14
0.21
0.28
0.35
0 20 40 60 80 100
Pressure (MPa)
A p p a r a n
t V i s c o s
i t y a
t 5 1 1 s - 1
( P a . s
)
Slurry A
Slurry B
Figure 3.13 Effect of (a) temperature, and (b) pressure on the apparent viscosity of oil wellcement slurries (Kellingray et al., 1990). Slurry A prepared using cement, silica flour, fluidloss aid (cellulose derivatives), dispersant (naphthalene sulphonate), and retarder (Calciumlignosulphonate) whereas Slurry B prepared using cement, silica flour and retarder (calciumlignosulphonate).
3.2.3 Equipment and Testing Methods for Rheology of OWC Slurries
Coaxial cylinder viscometers have been used for the evaluation of the rheological properties
of OWC slurries. If the slurry rheological properties are well characterized, the friction
pressure drop and the flow regime in the annulus of the oil well can be predicted with
reasonable accuracy. Rheological measurements of cement slurries suffer from several
0
0.07
0.14
0.21
0.28
0.35
75 85 95 105 115 125
Temperature (°C)
A p p a r e n
t V i s c o s
i t y a
t 5 1 1 s - 1
( P a . s
)
Slurry A
Slurry B
(b)
(a)
8/18/2019 Rheology of Oil Well Cement Slurries
http://slidepdf.com/reader/full/rheology-of-oil-well-cement-slurries 83/274
60
limitations including slip at the walls of the measuring device (Saak et al., 2001; Banfill and
Kitching, 1991; Guillot 1990), migration of the particles due to centrifugal forces (Guillot,
1990; Denis and Guillot, 1987), shear induced migration (Coussot and Piau, 1995) or gravity
induced migration known as settlement/sedimentation, and plug flow (Banfill, 2003; Guillot,
1990). A review of the literature concerning these effects is provided elsewhere (Banfill,
2003; Guillot, 1990). Similar problems have also been encountered in the case of pile-flow
viscometers and vane rheometers.
More satisfactory results can be obtained by introducing devices in the measurement
geometries to keep the paste homogeneous. These include angled blades (interrupted helical
impeller) to lift particles (Bhatty and Banfill, 1982), re-circulating pumps to provide a
circulation of the fluid through the sample cup and around the rotor-stator assembly
(Meeten, 1990), blades with interlocking fingers (Vlachou and Piau, 2000) and more
conventional mixers (Nachbaur et al., 2001). A modified cone and plate geometry was found
efficient against settlement error, especially for relatively liquid suspensions with weak
structures (Piau, 1997). Vlachou and Piau (2000) found that a modified parallel-plate
geometry attached to commercial rotational rheometers reduced the settlement and slippage
of OWC slurry particles at the walls and allowed to study the settling process of the cement
slurries as a function of the intensity of the shear.
Most conventional rheometers limit the maximum temperature for measurements too much
lower than the actual bottom hole temperature and limit the pressure to only atmospheric
levels. Such measurements may lead to poor predictions of OWC slurry properties in the
actual oil bore, which in turn can increase the risk of cementing failures. Kellingray et al.
(1990) used a modified high-temperature and high-pressure consistometer to investigate the
OWC slurry rheology under simulated bottom hole conditions. A number of rheometers
capable of withstanding high temperature and pressure have been developed. However,
research studies in this area are still needed to further refine the testing equipment and
procedures. Though OWC slurry rheology is a widely studied subject, correlations between
chemical, microstructural and mechanical behaviour of the slurry before and after setting
have not yet been clearly defined, and thus require more dedicated research.
8/18/2019 Rheology of Oil Well Cement Slurries
http://slidepdf.com/reader/full/rheology-of-oil-well-cement-slurries 84/274
61
3.3 Conclusions
The rheological properties of cement-based materials determine the quality of the hardened
cementitious matrix and help predicting its end use performance and its physical properties
during and after processing. Measuring rheological properties of cement based materials inthe laboratory remain a challenging task. The rheological properties are affected by numerous
factors including the w/c, size and shape of cement grains, chemical composition of the
cement and relative distribution of its components at the surface of grains, presence and type
of additives, compatibility between cement and chemical admixtures, mixing and testing
procedures, etc. Moreover, slip at the slurry-shearing surface interface, particle-particle
interactions, chemical reactions, non-homogeneous flow fields, and human errors can make
the rheological experiments difficult to reproduce. Above all, the equipment used to quantify
the rheological properties of cement based materials is relatively expensive, difficult to
operate, and may not be suitable for use in construction sites because of its large size and/or
complicated set up.
Rheological characterization is a tool that can evaluate the rheology of cement-based
materials. By examining a suspension of cement particles in water, one can apply well
established rheological theories. Hence, producing good quality paste or slurry incorporating
superplasticizers at high temperature can be achieved by controlling its rheological properties. Yield stress, viscosity and the degree of thixotropy are crucial parameters that
affect the rheology of cement-based materials.
For the particular case of the petroleum industry, cement slurries are pumped down to several
thousand meters into the ground to anchor and seal the casing to the borehole of oil or gas
wells. Thus, an accurate characterization of the rheology of cement slurries is critical.
However, oil well cement slurry rheology is more complicated than that of cement paste. In
order to contend with bottom hole conditions (wide range of pressure and temperature), aspecial class of cements called oil well cements (OWCs), specified by the American
Petroleum Institute (API) (API Specification 10A, 2002) and various additives are usually
used in the slurry composition. Among the eight (8) different types of available OWC, Class
G and H cements are usually specified for deeper, hotter and higher pressure well conditions.
A thorough review of the types of admixtures used in the petroleum industry and the
8/18/2019 Rheology of Oil Well Cement Slurries
http://slidepdf.com/reader/full/rheology-of-oil-well-cement-slurries 85/274
62
rheology of oil well cement (OWC) slurries has been provided in the literature (e.g. Nelson et
al., 2006, and Guillot, 2006). But comparing the effects of different admixtures on the
rheological properties of oil well slurries at different temperatures remains largely
unexplored and substantial research work is needed to develop fundamental knowledge for
the effective use of superplasticizers in oil well cementing.
3.4 Reference
Ahmed, R.M., Takach, N.E., Khan, U.M., Taoutaou, S., James, S., Saasen, A., and Gody, R.
(2009). Rheology of Foamed Cement. Cement and Concrete research , Vol. 39, No.
4, pp. 353-361.
API RP 10B-2. (2005). Recommended Practice for Testing Well Cements, ANSI/API
recommended practice 10B-2 (Formerly 10B), 2005. First Edition, 188p.
Banfill, P.F.G. (2003). The Rheology of Fresh Cement And Concrete-A Review. The
Proceedings of the 11 th International Cement Chemistry Congress, Durban, May
2003, 13 p.
Banfill, P.F.G., and Kitching, D.R. (1991) Use of a Controlled Stress Rheometer to Study
The Yield Stress of Oilwell Cement Slurries. In: Rheology of Fresh Cement and
Concrete, P.F.G. Banfill (Ed.), London, pp. 125-136.
Barnes, H. A. Hutton, J. F. and Walters, K. (1989). An Introduction to Rheology, Elsevier
Science Publishers., Amsterdam-Oxford-Tokyo, pp. 115-139.
Berg, W.V. (1979). Influence of Specific Surface and Concentration of Solids Upon The
Flow Behaviour of Cement Paste. Magazine of Concrete Research , Vol. 31, No. 109,
pp. 211-216.
Bhatty, J.I., and Banfill, P.F.G. (1982). Sedimentation Behaviour of Cement Pastes Subject
To Continuous Shear in Rotational Viscometers, Cement and Concrete Research ,Vol. 12, No. 1, pp. 69-78.
Bingham, F. C. (1922), Fluidity and Plasticity, First edition, McGraw Hill, New York, pp.
215-240.
8/18/2019 Rheology of Oil Well Cement Slurries
http://slidepdf.com/reader/full/rheology-of-oil-well-cement-slurries 86/274
63
Chougnet, A., Audibert, A., Lecolier, E., Moan, M., Guichard, B., Mazard, C., and Valenti,
A. (2006). Polymer Powder/Cement Composites. Proceedings - SPE Annual
Technical Conference and Exhibition , 2, San Antonio, Texas, U.S.A., pp. 1176-1183.
Coussot, P. and Piau, J.M. (1995). A Large-Scale Field Coaxial Cylinder Rheometer for TheStudy of The Rheology of Natural Coarse Suspensions, Journal of Rheology . Vol. 39,
No. 1, pp. 105-124.
Denis, J.H., and Guillot, D.J. (1987). Prediction of Cement Slurry Laminar Pressure Drops
by Rotational Viscometry. Paper SPE/IADC 16137, 1987, 8 pp.
Douglas J.F., Gassiorek J.M. and Swaffield J.A. (1995). Fluid Mechanics. Longman
Scientific and Technical, Third Edition, ISBN 0582234085, pp. 287-292.
Guillot, D., (1990). Rheology of Well Cement Slurries. In: E.B. Nelson (Ed.), Well
Cementing, Elsevier Science Publishers, Amsterdam, pp. 4-1–4-37.
Guillot, D., (2006). Rheology of Well Cement Slurries. In: E.B. Nelson and Guillot, D.
(Eds.), Well Cementing, Schlumberger, Texas, pp. 93-142.
Kellingray, D.S., Greaves, C., and Dallimer, R.P. (1990). High Temperature and High
Pressure Rheology of Oil Well Cement Slurries. In: P.F.G. Banfill (Ed.),
International Conference on Rheology of Fresh Cement and Concrete , British
Society of Rheology, Liverpool, March 26-29, 1990, pp. 159-169.
Meeten, G. H. (1990). Rheometer. British Patent Application UK 99026294.0.
Mewis, J. (1979). Thixotropy- A General Review, Journal of Non-Newtonian Fluid
Mechanics, Vol. 6, No. 1, pp. 1-20.
Michaux, M., and Defosse, C. (1986). Oil Well Cement Slurries: I. Microstructural Approach
of Their Rheology. Cement and Concrete Research , Vol. 16, No. 1, pp. 23-30.
Nachbaur, L., Mutin, J.C., Nonat, A., and Choplin, L. (2001). Dynamic Mode Rheology Of
Cement And Tricalcium Silicate Pastes From Mixing To Setting. Cement and
Concrete Research , Vol. 31, No. 2, pp. 183-192.
Nakayama, M., and Beaudoin, J.J. (1987). Bond Strength Development Between Latex-
Modified Cement Paste And Steel. Cement and Concrete Research . Vol. 17, pp. 562-
572.
8/18/2019 Rheology of Oil Well Cement Slurries
http://slidepdf.com/reader/full/rheology-of-oil-well-cement-slurries 87/274
64
Nehdi, M. (1998). Microfiller Effect on Rheology, Microstructure and Mechanical Properties
of High-Performance Concrete. PhD Thesis , The University of British Columbia,
April 1998, 204 pp.
Nehdi, M., and Rahman, M.A. (2004). Estimating Rheological Properties of Cement PastesUsing Various Rheological Models for Different Test Geometry, Gap and Surface
Friction. Cement and Concrete Research , Vol. 34, No. 11, pp. 1993-2007.
Nelson, E.B. (1984). What We Like Or What We Don’t Like In An Oil Well Cement,
Remarks on Oil Well Cement Panel Discussion. In: James Bayles (Ed.), Proceedings
of the Sixth International Conference on Cement Microscopy, , Albuquerque, New
Mexico, USA, March 26-29, pp. 175-181.
Nelson, E.B., Baret, J.F., and Michaux, M. (1990). Cement Additives and Mechanism ofAction. In: E.B. Nelson (Ed.), Well Cementing, Elsevier Science Publishers,
Amsterdam, 3-1–3-37.
Nelson, E.B., Michaux, M., and Drochon, B. (2006). Chemistry and Characterization of
Portland Cement. In: E.B. Nelson and Guillot, D. (Eds.), Well Cementing ,
Schlumberger, Texas, pp. 23-48.
Piau, J.M. (1997). Crucial Elements of Yield Stress Fluid Rheology. In: Adams, M.J.,
Mashelkar, R.A., Pearson, J.R.A., and Rennie, A.R. (Eds.), Dynamics of Complex
Fluids, Imperial College Press, The Royal Society, London, 1997, Paper D1, pp. 351-
371
Ravi, K.M., and Sutton, D.L. (1990). New Rheological Correlation for Cement Slurries as a
Function of Temperature. SPE 20499, The 65 th Annual Technical Conference and
Exhibition of the Society of Petroleum Engineers, New Orleans, LA, September 23-
26, 455-462.
Saak, A.W., Jennings, H.M., and Shah, S.P. (2001). The Influence of Wall Slip on Yield
Stress and Viscoelastic Measurements of Cement Paste. Cement and Concrete
Research . Vol. 31, No. 2, pp. 205-212.
Saasen, A., Rafoss, E., and Behzadi, A. (1991). Experimental Investigation of Rheology and
Thickening Time of Class G Oil Well Cement Slurries Containing Glycerin. Cement
and Concrete Research . Vol. 21, No. 5, pp. 911-916.

8/18/2019 Rheology of Oil Well Cement Slurries
http://slidepdf.com/reader/full/rheology-of-oil-well-cement-slurries 88/274
65
Shah, S.N., and Sutton, D.L. (1990). New Friction Correlation for Cements From Pipe and
Rotational-Viscometer Data. SPE Production Engineering .Vol. 5, No. 4, November,
1990, pp. 415-424.
Su, Z., Bijen J.M., and Larbi J.A. (1991). The Influence of Polymer Modification on TheAdhesion of Cement Pastes To Aggregates. Cement and Concrete Research . Vol 21,
No. 5, pp. 727-736.
Vlachou, P.V. and Piau, J.M. (2000). A New Tool for the Rheometric Study of Oil Well
Cement Slurries and Other Settling Suspensions. Cement and Concrete Research .
Vol. 30, No. 10, pp. 1551-1557.
Yahia, A., and Khayat, K.H. (2001). Analytical Models for Estimating Yield Stress of High
Performance Pseudoplastic Grout. Cement and Concrete Research . Vol. 31, No. 5, pp. 731-738.
8/18/2019 Rheology of Oil Well Cement Slurries
http://slidepdf.com/reader/full/rheology-of-oil-well-cement-slurries 89/274
66
C h a p t e r 4
COUPLED EFFECTS OF CHEMICAL ADMIXTURES AND
TEMPERATURE ON RHEOLOGICAL PROPERTIES OF OIL WELLCEMENT SLURRIES *
4.1 Introduction
Chemical admixtures play an important role in controlling the early-age physical and chemical
properties of cement slurries, and subsequently those of the hardened cementitious system.
However, admixtures are associated with some shortcomings including variation of the initial
slump, rapid loss of fluidity of cement slurries, and binder-admixture compatibility problems.Cement slurries prepared with various kinds of admixtures using the same type of cement can
exhibit large variations in flow. The rheological properties of cement slurries can be strongly
affected by a number of factors including the water-cement ratio (w/c), size and shape of cement
grains, chemical composition of the cement and relative distribution of its components at the
surface of grains, presence of additives, interactions between the cement and chemical
admixtures, mixing and testing procedures, time and temperature, etc.
For the particular case of the petroleum industry, cement slurries are pumped down to several
thousand meters into the ground to anchor and seal the casing to the borehole of oil or gas wells.
Thus, an accurate characterization of the rheology of cement slurries is critical. However, oil well
cement slurry rheology is more complicated than that of cement paste. In order to contend with
bottom hole conditions (wide range of pressure and temperature), a special class of cements
called oil well cements (OWCs), specified by the American Petroleum Institute (API) (API
Specification 10A, 2002) and various additives are usually used in the slurry composition.
Among the eight (8) different types of available OWC, Class G and H cements are usually
specified for deeper, hotter and higher pressure well conditions (Lafarge, 2010). A thoroughreview of the types of admixtures used in the petroleum industry and the rheology of oil well
cement (OWC) slurries has been provided in the literature (e.g. Nelson et al., 2006, and Guillot,
2006). But comparing the effects of different admixtures on the rheological properties of oil well
slurries at different temperatures remains largely unexplored.
* A version of this chapter has been accepted in Construction Materials, ICE, Jul 2010, 40 p, (ID: COMA-D-10-00023R1).
8/18/2019 Rheology of Oil Well Cement Slurries
http://slidepdf.com/reader/full/rheology-of-oil-well-cement-slurries 90/274
67
The objective of this study is to investigate the interactions of Class G OWC with different types
of admixtures and the associated cement-admixture compatibility. A series of flow tests using an
advanced rheometer were carried out to determine the optimum dosage of admixtures at various
temperatures. Pressure has been found to have a less significant influence on the rheological
properties of OWC slurries compared to that of temperature (Guillot, 2006, Ravi and Sutton,
1990, and Kellingray et al., 1990). Therefore, the rheological properties of cement slurries having
w/c of 0.35, 0.44, and 0.50 were investigated at temperatures of 23, 45, and 60 oC but at ambient
pressure. Moreover, the flow properties of cement slurries with a w/c of 0.44 and incorporating
various dosages of six different chemical admixtures were investigated at the same temperatures.
The admixtures included a new generation polycarboxylate-based high-range water reducing
admixture (PCH), lignosulphonate-based mid-range water reducing admixture (LSM),
polycarboxlate-based mid-range water reducing admixture (PCM), phosphonate-based set
retarding admixture (SRA), hydroxylated carboxylic acid-based retarding admixture (HCR) and a
rheoplastic solid admixture (RA). The rheological tests were performed as per the American
Petroleum Institute (API) recommended procedure using an atmospheric rheometer. However,
pertinent data could not be found in the open literature to compare it to the rheological properties
of slurries prepared with Class G oil well cement and the admixtures used for this study. The
present study allowed gaining an improved understanding of the effect of chemical admixtures on
the rheology of OWC slurries at high temperature. This should contribute to the selection of
adequate admixtures and their effective dosages to overcome difficulties encountered during theconstruction of oil and gas wells including the rapid loss of workability, pumping problems,
acceleration of cement hydration, fast evaporation of mixing water and zonal isolation.
4.2 Rheology of Cement Slurries
The rheological properties of cement-based materials determine the quality of the hardened
cementitious matrix and help predicting its end use performance and its physical properties
during and after processing. To characterize the rheology of a cement slurry, rheological parameters such as the yield stress, apparent viscosity, plastic viscosity, shear thinning, or shear
thickening behaviour need to be studied. The yield stress indicates the minimum effort needed for
a material to start flowing. Below the yield stress, cement slurries behave like a solid. The
apparent viscosity is the slope of the straight line connecting the origin and any point on the shear
stress-shear strain rate flow curve, i.e. it is the viscosity at a particular shear rate. If the points on
the flow curve are fitted to a straight line, the slope of such a straight line represents the plastic
8/18/2019 Rheology of Oil Well Cement Slurries
http://slidepdf.com/reader/full/rheology-of-oil-well-cement-slurries 91/274
68
viscosity. Usually the plastic viscosity of a cement slurry is evaluated using the linear portion of
the down-curve of the hysteresis loop. For a nonlinear flow curve, shear-thinning or shear-
thickening behaviour may be observed. Shear thinning is when the apparent viscosity decreases
with the increase in the shear rate, i.e. when the slope of the shear stress vs. shear rate flow curve
decreases with the shear rate. Shear thickening is when viscosity of the cement slurry increases
with the shear rate.
For fluids such as cement slurries, viscosity exhibits a time-dependent behaviour, which is
difficult to characterize. However, for practical oilfield purposes, cement slurries are invariably
represented by time-independent models. It has been observed that it is difficult to capture all
possible trends of flow behaviour using a single rheological model (Yahia and Khayat, 2001).
The performance of rheological models usually varies with the test geometries, gap between
shearing surfaces and their friction capacity, which makes calculations of various rheological
models complicated (Nehdi and Rahman, 2004).
Existing time-independent rheological models allow fitting shear stress, shear rate and viscosity
data to specific trends using rheological data analysis software. However, no model is free from
statistical error. The Bingham plastic model and the Power law are widely used to describe the
rheological properties of cement slurries (Guillot, 2006). The Bingham plastic model includes
both yield stress, y and a limiting viscosity, P at finite shear rates, which the Power law model
fails to consider. Therefore, the Bingham plastic model (equation 1) was used in this study to
calculate the yield stress and plastic viscosity from the shear rate-shear stress down-curve.
P0 (4.1)
Where, , 0 , P , and
.
represent the shear stress, yield stress, plastic viscosity, and shear rate,
respectively.
The down-curve was chosen since it better fits to the Bingham plastic model than the up-curve.
The down-curve is normally lower in shear stress values than the up-curve because of the
breakdown in the slurry structure due to shear flow. The degree of thixotropic behaviour
measured by the hysteresis loop, which is the area enclosed by the up and down curves (Saak,
2000), indicates a breakdown of structure. Conversely, a reverse hysteresis loop indicates that the
structure of the material stiffens when sheared due to a mechanism of thixotropy build-up (Eirich,
8/18/2019 Rheology of Oil Well Cement Slurries
http://slidepdf.com/reader/full/rheology-of-oil-well-cement-slurries 92/274
69
1960). The reverse hysteresis behaviour is called anti-thixotropy or rheopexy (Ferguson and
Kemblowski, 1991).
4.3 Materials
Cement slurries used in this study were prepared using a high sulfate-resistant API Class G oil
well cement with a specific gravity of 3.14. The chemical and physical properties of this cement
are summarized in Table 4.1. De-ionized distilled water was used for the mixing, and its
temperature was maintained at 23±1°C using an isothermal container. A number of conventional
chemical admixtures along with new-generation admixtures were used and their effects on the
rheological properties of cement slurries at different temperatures were evaluated. These
admixtures include:
(1) A new generation polycarboxylate-based high-range water reducing admixture (PCH),
meeting ASTM C494 requirements as a Type A water-reducing and Type F high-range water
reducing admixture was used at selected dosages of 0.25%, 0.50%, 0.75% and 1.0% by weight of
cement.
(2) Mid-range water reducing admixture (LSM) which is a lignosulphonate-based admixture
meeting the ASTM C494 requirements as a Type A water reducing and Type F high-range water-
reducing admixture. Four dosages of LSM, namely 0.5%, 1.0%, 1.5% and 2.0% by weight ofcement were used in this study.
(3) Polycarboxylate-based mid-range water reducing admixture (PCM) meeting the ASTM C494
requirements as a Type A water reducing and Type F high-range water reducing admixture. Four
dosages of PCM, namely 0.25%, 0.50%, 0.75%, and 1.0% by weight of cement were used in this
study.
(4) Set-retarding admixture (SRA) meeting the ASTM C 494 requirements for Type B, retarding,
and Type D, water reducing and retarding admixture. It is an organic phosphonate-based
admixture commonly used in the petroleum industry. The dosages used were 0.3%, 0.6%, 1.0%,
and 1.5% by weight of cement.
(5) Hydroxylated carboxylic acid-based retarding admixture (HCR) complying with the ASTM
C494 requirements for Type B, retarding, and Type D, water reducing and retarding admixture.
8/18/2019 Rheology of Oil Well Cement Slurries
http://slidepdf.com/reader/full/rheology-of-oil-well-cement-slurries 93/274
70
Four dosages of HCR (0.5%, 1.0%, 2.0%, and 3.0%) by weight of cement were used to examine
the effect of HCR on the rheological properties of cement slurries at high temperature.
(6) Rheoplastic admixture (RA) is a solid admixture especially designed for cementitious grouts
to reduce the required mixing water and produce flowable, pumpable, thixotropic, non-segregating high-strength cement slurry. Three dosages of RA (2.0%, 4.0%, and 6.0%) were used
in this study.
Table 4.1 Chemical and physical properties of API Class G OWC
Chemical Component (%) Physical PropertiesSilica (SiO 2) 21.6 Fineness 45 μ m sieve 92.4% passingAlumina (Al
2O
3) 3.3 Blaine (Spec. Surf.)
385 m
2
/kgIron Oxide (Fe 2O3) 4.9 Thickening Time (Schedule 5) 110 minutes
Calcium Oxide, Total (TCaO) 64.2 Compressive strength at 8 hours @
38oC
2.1 MPa
Magnesium Oxide (MgO) 1.1 Compressive strength at 8 hours @
60oC
10.3 MPa
Sulphur Trioxide (SO 3) 2.2Loss on Ignition 0.60Insoluble Residue 0.30Equivalent Alkali (as Na 2O) 0.41C3A <1C3S 62C2S 15C4 AF+2 C 3A 16
4.4 Apparatus
The cement slurry preparation is very important because of the influence of the shear history of
the mixture on its rheological properties (Orban et al ., 1986). The cement slurries were prepared
using a variable speed high-shear blender type mixer with bottom drive blades as per the
ANSI/API Recommended Practice 10B-2.
A high accuracy advanced rheometer (TA instruments AR 2000) (Fig. 4.1(a)) was used to
measure the rheological properties of cement slurries. The rheometer is capable of continuous
shear rate sweep, stress sweep and strain sweep. The geometry of the test accessory and the gap
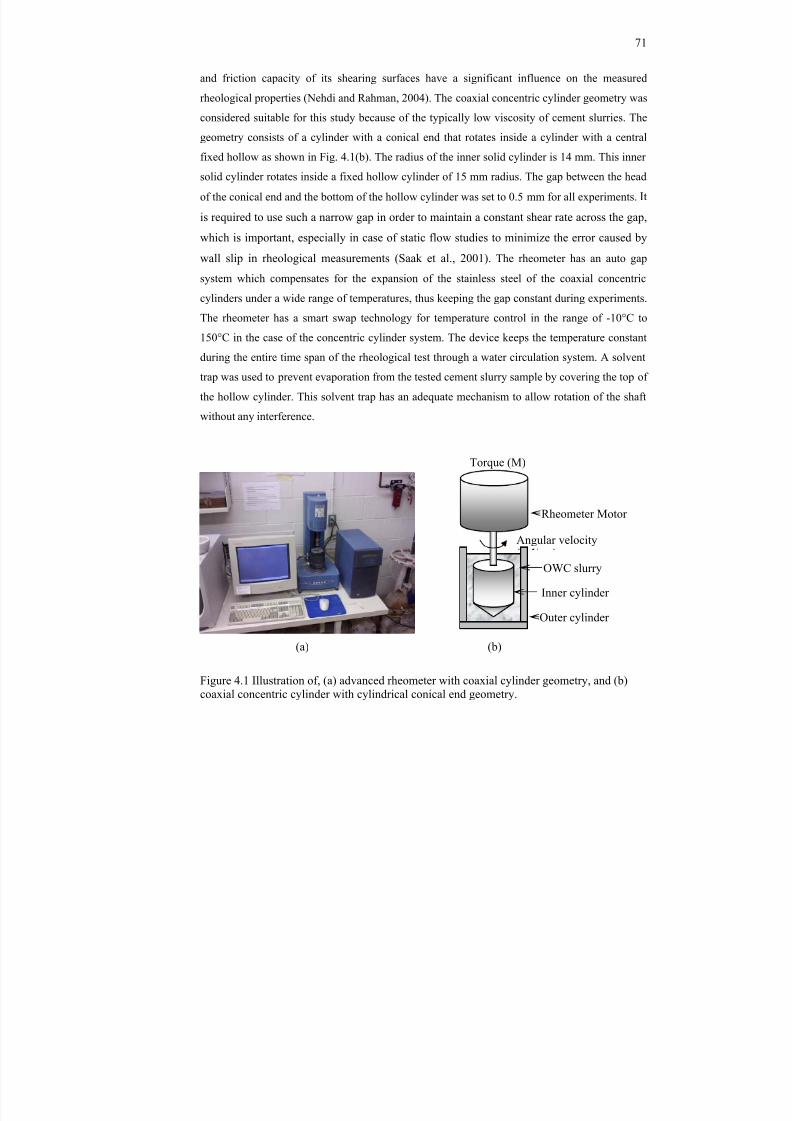
8/18/2019 Rheology of Oil Well Cement Slurries
http://slidepdf.com/reader/full/rheology-of-oil-well-cement-slurries 94/274
71
and friction capacity of its shearing surfaces have a significant influence on the measured
rheological properties (Nehdi and Rahman, 2004). The coaxial concentric cylinder geometry was
considered suitable for this study because of the typically low viscosity of cement slurries. The
geometry consists of a cylinder with a conical end that rotates inside a cylinder with a central
fixed hollow as shown in Fig. 4.1(b). The radius of the inner solid cylinder is 14 mm. This inner
solid cylinder rotates inside a fixed hollow cylinder of 15 mm radius. The gap between the head
of the conical end and the bottom of the hollow cylinder was set to 0.5 mm for all experiments. It
is required to use such a narrow gap in order to maintain a constant shear rate across the gap,
which is important, especially in case of static flow studies to minimize the error caused by
wall slip in rheological measurements (Saak et al., 2001). The rheometer has an auto gap
system which compensates for the expansion of the stainless steel of the coaxial concentric
cylinders under a wide range of temperatures, thus keeping the gap constant during experiments.The rheometer has a smart swap technology for temperature control in the range of -10°C to
150°C in the case of the concentric cylinder system. The device keeps the temperature constant
during the entire time span of the rheological test through a water circulation system. A solvent
trap was used to prevent evaporation from the tested cement slurry sample by covering the top of
the hollow cylinder. This solvent trap has an adequate mechanism to allow rotation of the shaft
without any interference.
Figure 4.1 Illustration of, (a) advanced rheometer with coaxial cylinder geometry, and (b)coaxial concentric cylinder with cylindrical conical end geometry.
Angular velocity
Torque (M)
Inner cylinder
Outer cylinder
OWC slurry
Rheometer Motor
(b)(a)
8/18/2019 Rheology of Oil Well Cement Slurries
http://slidepdf.com/reader/full/rheology-of-oil-well-cement-slurries 95/274
72
The rheometer was calibrated using a certified standard Newtonian oil with a known viscosity of
1.0 Pa.s and yield stress = 0 Pa at 20°C. The measured yield stress was 0 Pa and viscosity was
1.009 Pa.s with an error of 0.9%, which is less than the tolerated error of 4% specified by the
manufacturer. This computer controlled rheometer is equipped with rheological data analysis
software, which can fit the shear stress-strain rate data to several rheological models. The
Bingham model was used throughout this study to calculate the rheological properties of cement
slurries.
4.5 Experimental Procedure
4.5.1 Mixing and Preparing Cement Slurry
The cement slurries were prepared using a high-shear blender type mixer with bottom driven
blades according to the following procedure. First, the weighed amount of cement and the solid
admixture (if any) were dry mixed in a bowl by hand using a spatula for about 30 sec. The
mixing water was subsequently poured into the blender. Then the required quantity of liquid
admixture was added into the mixing water using a needle, and the mixing started at a slow speed
for 15 sec so that chemical admixtures could be thoroughly dispersed in the water. The cement-
solid admixture was added to the liquids (liquid admixture and water) over a period of 15 sec.
Manual mixing was conducted for 15 sec and a rubber spatula was used to recover material
sticking to the wall of the mixing container to ensure homogeneity. Finally, mixing resumed foranother 35 sec at high speed. This mixing procedure was strictly followed for all cement slurries.
All mixing was conducted at a controlled ambient room temperature of 23±1°C. The prepared
slurry was then placed into the bowl of a mixer for preconditioning over 20 minutes at the test
temperature (23°C, 45°C, or 60°C) at a speed of 150 rpm. The total time between the beginning
of mixing and the start of the rheological tests was kept constant to avoid the effect of exogenous
variables on the results. The rheometer set-up was also maintained constant for all slurries. The
concentric cylinder test geometry was kept at the test temperature so as to avoid sudden thermal
shock of the slurry.
4.5.2 Rheometric Tests
After mixing and preconditioning, the cement slurry sample was placed in the coaxial cylinder of
the rheometer. The temperature of the rheometer was adjusted to the required level. The sample
was then subjected to a stepped ramp or steady state flow and viscosity measurements were taken
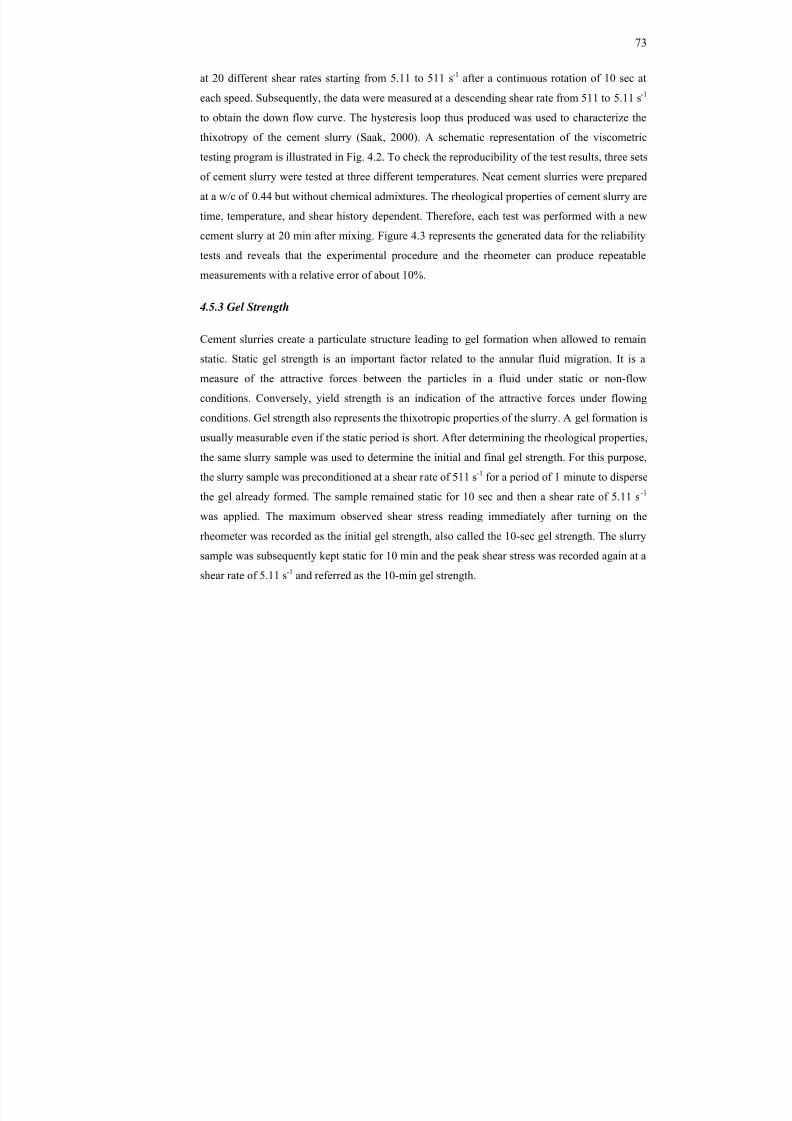
8/18/2019 Rheology of Oil Well Cement Slurries
http://slidepdf.com/reader/full/rheology-of-oil-well-cement-slurries 96/274
73
at 20 different shear rates starting from 5.11 to 511 s -1 after a continuous rotation of 10 sec at
each speed. Subsequently, the data were measured at a descending shear rate from 511 to 5.11 s -1
to obtain the down flow curve. The hysteresis loop thus produced was used to characterize the
thixotropy of the cement slurry (Saak, 2000). A schematic representation of the viscometric
testing program is illustrated in Fig. 4.2. To check the reproducibility of the test results, three sets
of cement slurry were tested at three different temperatures. Neat cement slurries were prepared
at a w/c of 0.44 but without chemical admixtures. The rheological properties of cement slurry are
time, temperature, and shear history dependent. Therefore, each test was performed with a new
cement slurry at 20 min after mixing. Figure 4.3 represents the generated data for the reliability
tests and reveals that the experimental procedure and the rheometer can produce repeatable
measurements with a relative error of about 10%.
4.5.3 Gel Strength
Cement slurries create a particulate structure leading to gel formation when allowed to remain
static. Static gel strength is an important factor related to the annular fluid migration. It is a
measure of the attractive forces between the particles in a fluid under static or non-flow
conditions. Conversely, yield strength is an indication of the attractive forces under flowing
conditions. Gel strength also represents the thixotropic properties of the slurry. A gel formation is
usually measurable even if the static period is short. After determining the rheological properties,
the same slurry sample was used to determine the initial and final gel strength. For this purpose,
the slurry sample was preconditioned at a shear rate of 511 s -1 for a period of 1 minute to disperse
the gel already formed. The sample remained static for 10 sec and then a shear rate of 5.11 s -1
was applied. The maximum observed shear stress reading immediately after turning on the
rheometer was recorded as the initial gel strength, also called the 10-sec gel strength. The slurry
sample was subsequently kept static for 10 min and the peak shear stress was recorded again at a
shear rate of 5.11 s -1 and referred as the 10-min gel strength.
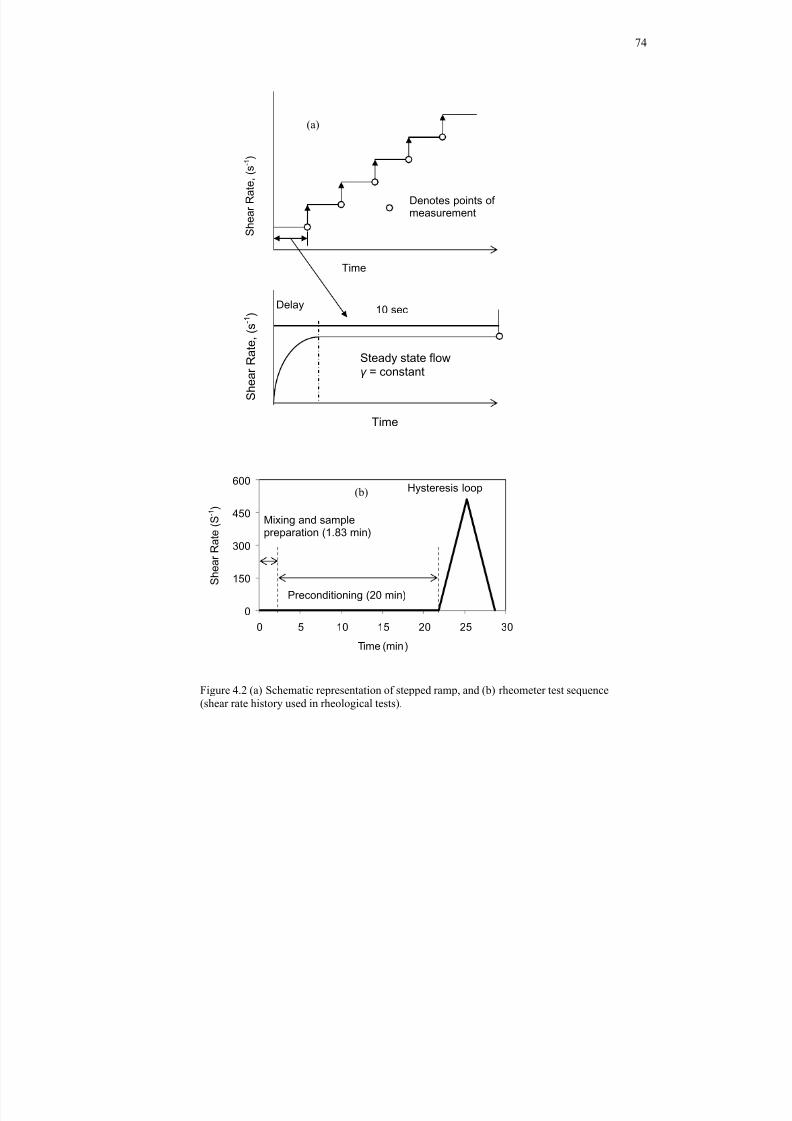
8/18/2019 Rheology of Oil Well Cement Slurries
http://slidepdf.com/reader/full/rheology-of-oil-well-cement-slurries 97/274
74
0
150
300
450
600
0 5 10 15 20 25 30
Time (min )
Figure 4.2 (a) Schematic representation of stepped ramp, and (b) rheometer test sequence(shear rate history used in rheological tests).
Time
S h e a r
R a
t e ,
( s - 1 )
Delay
Steady state flowγ = constant
10 sec
Denotes points ofmeasurement
Time
S h e a r
R a
t e ,
( s - 1 )
Preconditioning (20 min) S h e a r
R a
t e ( S - 1 )
(a)
(b) Hysteresis loop
Mixing and samplepreparation (1.83 min)
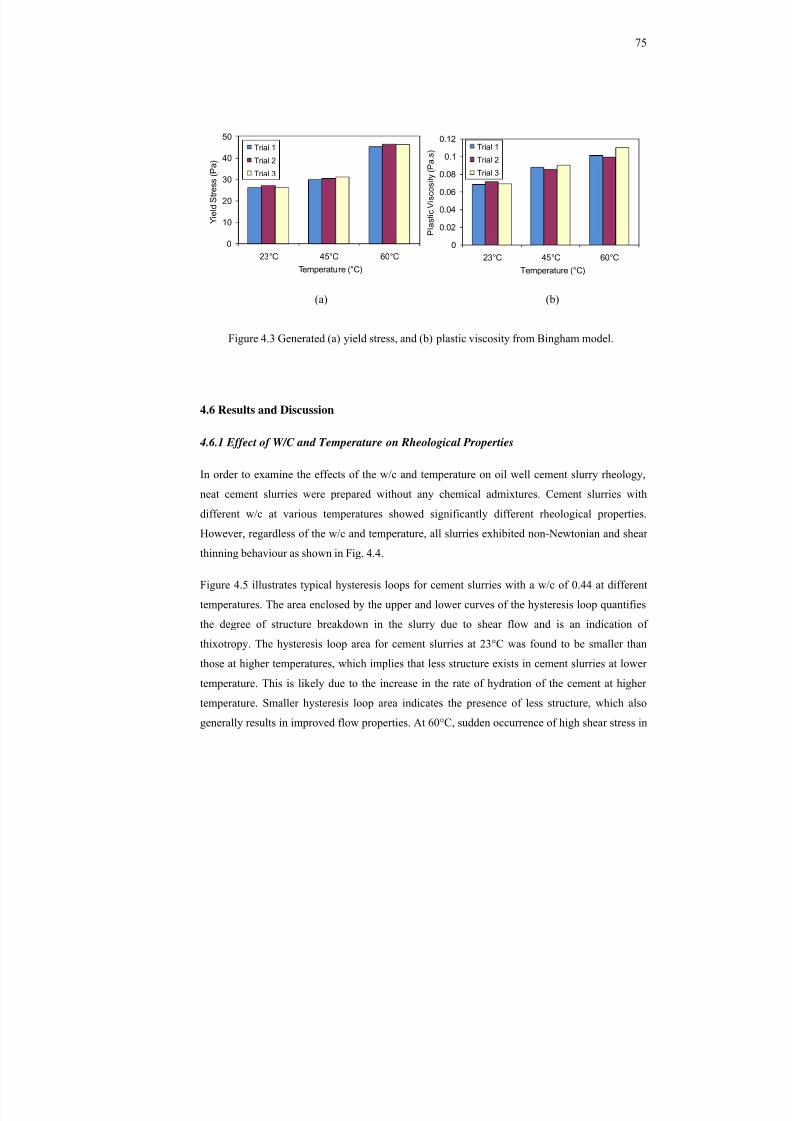
8/18/2019 Rheology of Oil Well Cement Slurries
http://slidepdf.com/reader/full/rheology-of-oil-well-cement-slurries 98/274
75
0
10
20
30
40
50
23°C 45°C 60°C
Y i e l d S t r e s s
( P a
)
Temperature (°C)
Trial 1Trial 2
Trial 3
0
0.02
0.04
0.06
0.08
0.1
0.12
23°C 45°C 60°C
P l a s t i c
V i s c o s
i t y ( P a . s )
Temperature (°C)
Trial 1
Trial 2
Trial 3
4.6 Results and Discussion
4.6.1 Effect of W/C and Temperature on Rheological Properties
In order to examine the effects of the w/c and temperature on oil well cement slurry rheology,
neat cement slurries were prepared without any chemical admixtures. Cement slurries with
different w/c at various temperatures showed significantly different rheological properties.
However, regardless of the w/c and temperature, all slurries exhibited non-Newtonian and shear
thinning behaviour as shown in Fig. 4.4.
Figure 4.5 illustrates typical hysteresis loops for cement slurries with a w/c of 0.44 at different
temperatures. The area enclosed by the upper and lower curves of the hysteresis loop quantifiesthe degree of structure breakdown in the slurry due to shear flow and is an indication of
thixotropy. The hysteresis loop area for cement slurries at 23°C was found to be smaller than
those at higher temperatures, which implies that less structure exists in cement slurries at lower
temperature. This is likely due to the increase in the rate of hydration of the cement at higher
temperature. Smaller hysteresis loop area indicates the presence of less structure, which also
generally results in improved flow properties. At 60°C, sudden occurrence of high shear stress in
Figure 4.3 Generated (a) yield stress, and (b) plastic viscosity from Bingham model.
(a) (b)
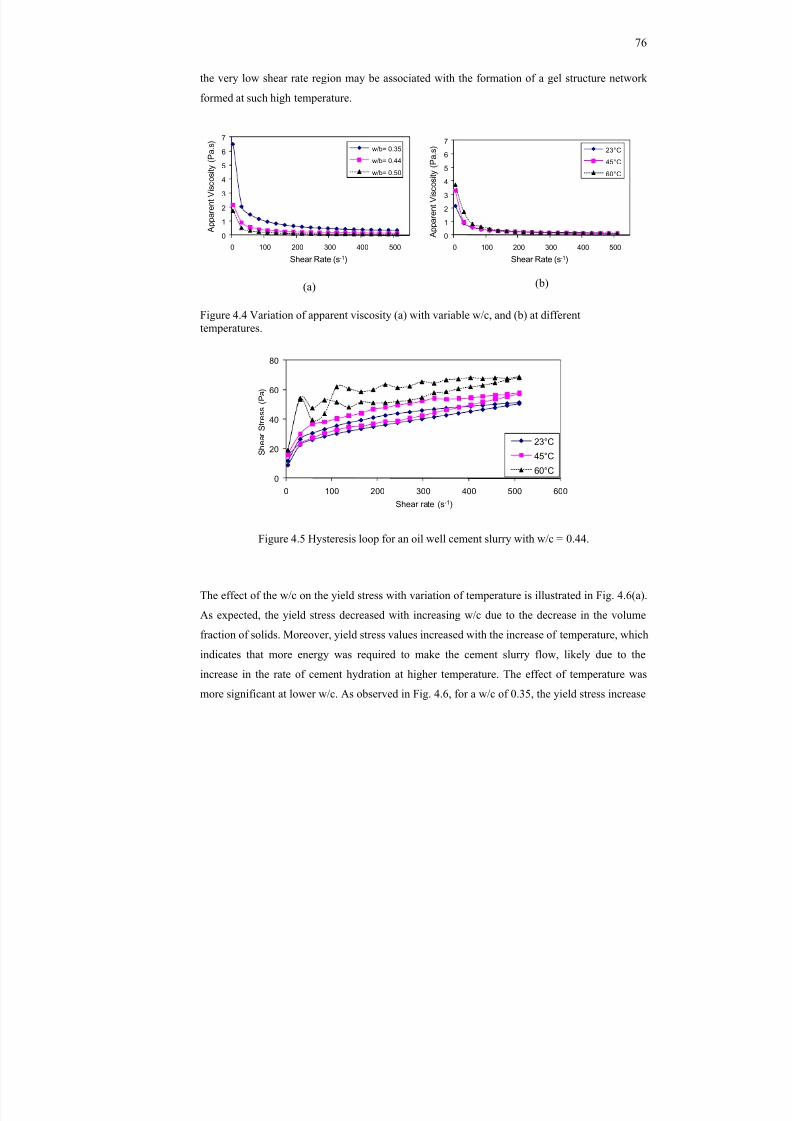
8/18/2019 Rheology of Oil Well Cement Slurries
http://slidepdf.com/reader/full/rheology-of-oil-well-cement-slurries 99/274
76
the very low shear rate region may be associated with the formation of a gel structure network
formed at such high temperature.
0
1
2
3
4
5
6
7
0 100 200 300 400 500
A p p a r e n
t V i s c o s i t y
( P a . s )
Shear Rate (s -1)
w/b= 0.35w/b= 0.44
w/b= 0.50
0
1
2
3
4
5
6
7
0 100 200 300 400 500
A p p a r e n
t V i s c o s i t y
( P a . s
)
Shear Rate (s -1)
23°C45°C
60°C
Figure 4.4 Variation of apparent viscosity (a) with variable w/c, and (b) at differenttemperatures.
0
20
40
60
80
0 100 200 300 400 500 600
S
h e a r
S t r e s s
( P a
)
Shear rate (s -1)
23°C
45°C60°C
Figure 4.5 Hysteresis loop for an oil well cement slurry with w/c = 0.44.
The effect of the w/c on the yield stress with variation of temperature is illustrated in Fig. 4.6(a).
As expected, the yield stress decreased with increasing w/c due to the decrease in the volume
fraction of solids. Moreover, yield stress values increased with the increase of temperature, which
indicates that more energy was required to make the cement slurry flow, likely due to the
increase in the rate of cement hydration at higher temperature. The effect of temperature was
more significant at lower w/c. As observed in Fig. 4.6, for a w/c of 0.35, the yield stress increase
(a) (b)
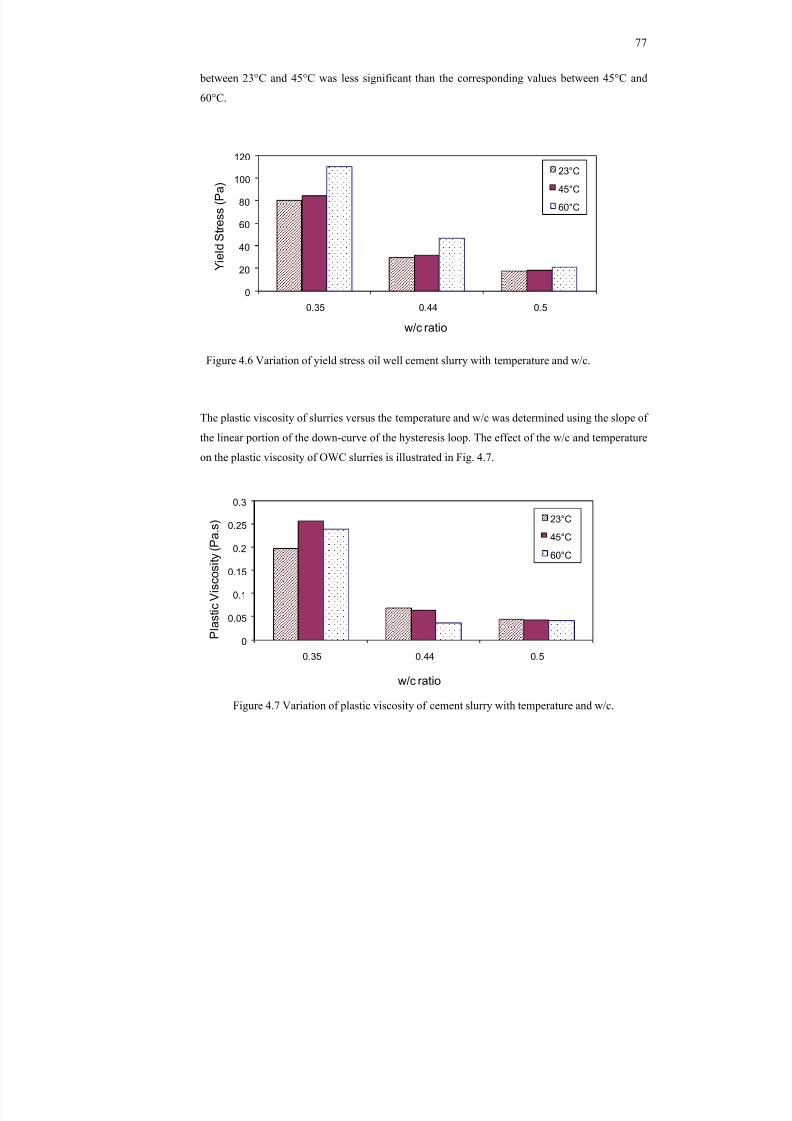
8/18/2019 Rheology of Oil Well Cement Slurries
http://slidepdf.com/reader/full/rheology-of-oil-well-cement-slurries 100/274
77
between 23°C and 45°C was less significant than the corresponding values between 45°C and
60°C.
0
20
40
60
80
100
120
0.35 0.44 0.5
Y i e l d S t r e s s
( P a
)
w/c ratio
23°C
45°C
60°C
Figure 4.6 Variation of yield stress oil well cement slurry with temperature and w/c.
The plastic viscosity of slurries versus the temperature and w/c was determined using the slope of
the linear portion of the down-curve of the hysteresis loop. The effect of the w/c and temperature
on the plastic viscosity of OWC slurries is illustrated in Fig. 4.7.
0
0.05
0.1
0.15
0.2
0.25
0.3
0.35 0.44 0.5
P l a s t i c
V i s c o s
i t y ( P a . s
)
w/c ratio
23°C
45°C
60°C
Figure 4.7 Variation of plastic viscosity of cement slurry with temperature and w/c.
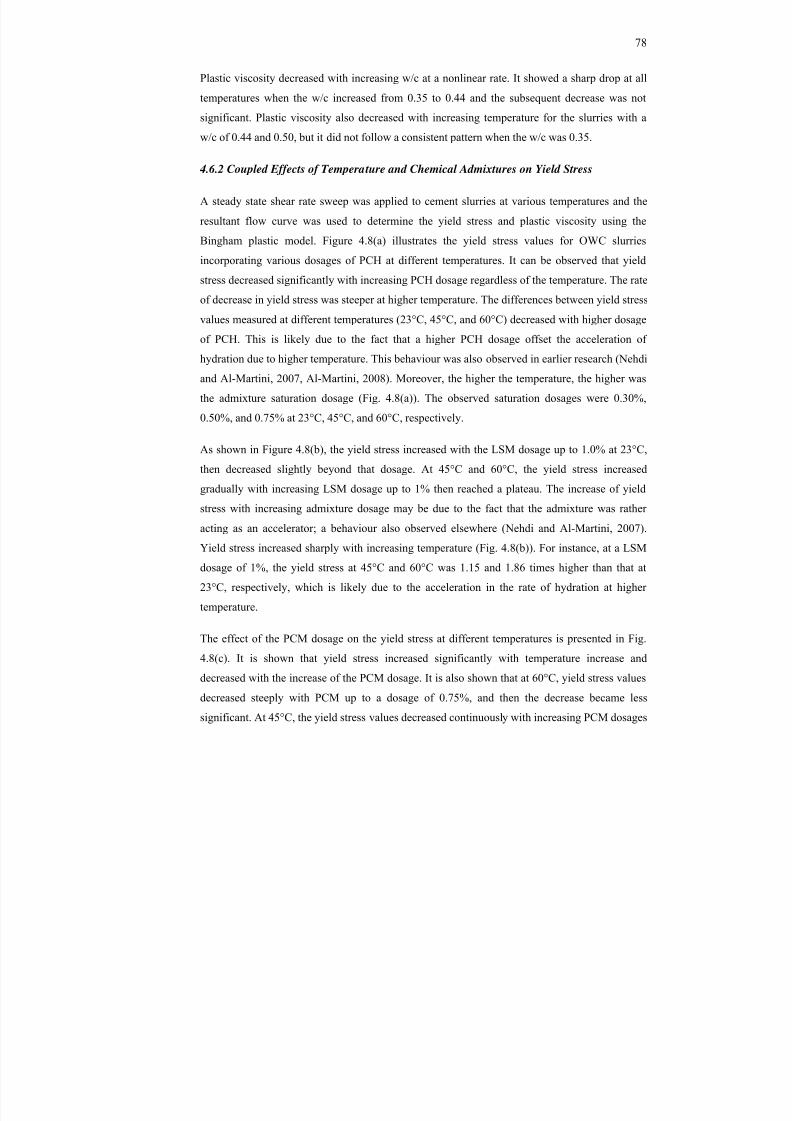
8/18/2019 Rheology of Oil Well Cement Slurries
http://slidepdf.com/reader/full/rheology-of-oil-well-cement-slurries 101/274
78
Plastic viscosity decreased with increasing w/c at a nonlinear rate. It showed a sharp drop at all
temperatures when the w/c increased from 0.35 to 0.44 and the subsequent decrease was not
significant. Plastic viscosity also decreased with increasing temperature for the slurries with a
w/c of 0.44 and 0.50, but it did not follow a consistent pattern when the w/c was 0.35.
4.6.2 Coupled Effects of Temperature and Chemical Admixtures on Yield Stress
A steady state shear rate sweep was applied to cement slurries at various temperatures and the
resultant flow curve was used to determine the yield stress and plastic viscosity using the
Bingham plastic model. Figure 4.8(a) illustrates the yield stress values for OWC slurries
incorporating various dosages of PCH at different temperatures. It can be observed that yield
stress decreased significantly with increasing PCH dosage regardless of the temperature. The rate
of decrease in yield stress was steeper at higher temperature. The differences between yield stressvalues measured at different temperatures (23°C, 45°C, and 60°C) decreased with higher dosage
of PCH. This is likely due to the fact that a higher PCH dosage offset the acceleration of
hydration due to higher temperature. This behaviour was also observed in earlier research (Nehdi
and Al-Martini, 2007, Al-Martini, 2008). Moreover, the higher the temperature, the higher was
the admixture saturation dosage (Fig. 4.8(a)). The observed saturation dosages were 0.30%,
0.50%, and 0.75% at 23°C, 45°C, and 60°C, respectively.
As shown in Figure 4.8(b), the yield stress increased with the LSM dosage up to 1.0% at 23°C,then decreased slightly beyond that dosage. At 45°C and 60°C, the yield stress increased
gradually with increasing LSM dosage up to 1% then reached a plateau. The increase of yield
stress with increasing admixture dosage may be due to the fact that the admixture was rather
acting as an accelerator; a behaviour also observed elsewhere (Nehdi and Al-Martini, 2007).
Yield stress increased sharply with increasing temperature (Fig. 4.8(b)). For instance, at a LSM
dosage of 1%, the yield stress at 45°C and 60°C was 1.15 and 1.86 times higher than that at
23°C, respectively, which is likely due to the acceleration in the rate of hydration at higher
temperature.
The effect of the PCM dosage on the yield stress at different temperatures is presented in Fig.
4.8(c). It is shown that yield stress increased significantly with temperature increase and
decreased with the increase of the PCM dosage. It is also shown that at 60°C, yield stress values
decreased steeply with PCM up to a dosage of 0.75%, and then the decrease became less
significant. At 45°C, the yield stress values decreased continuously with increasing PCM dosages
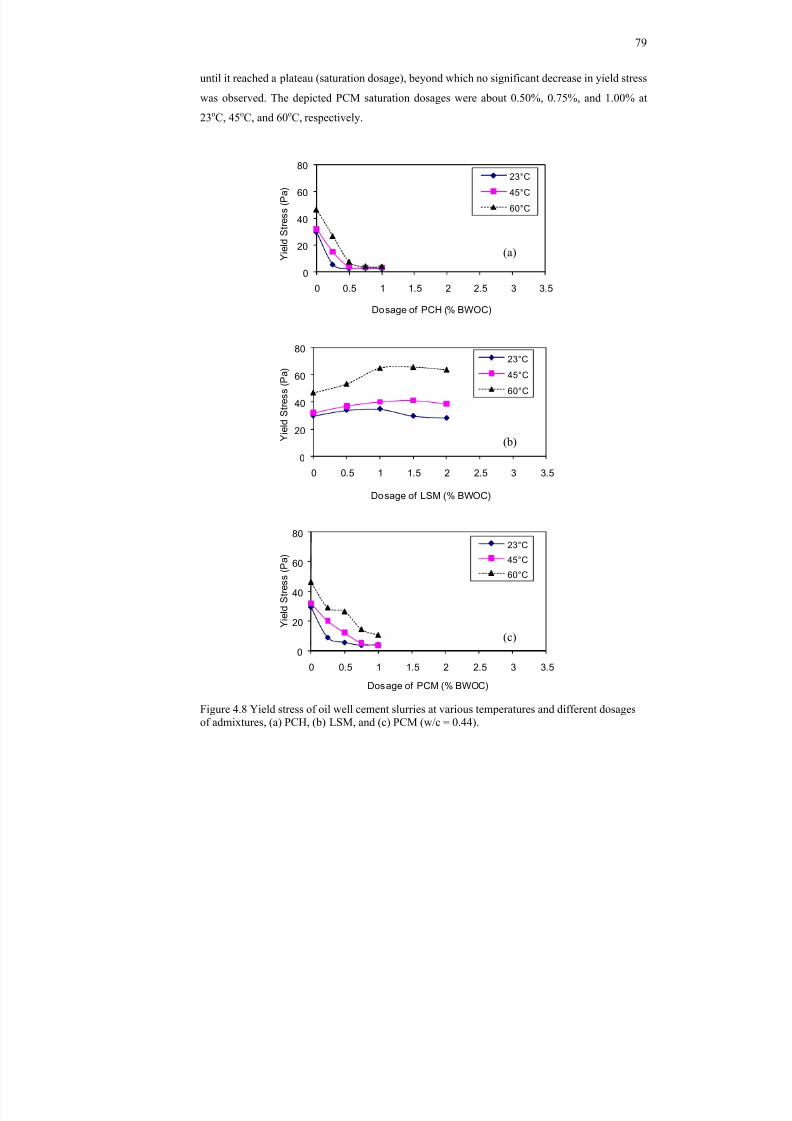
8/18/2019 Rheology of Oil Well Cement Slurries
http://slidepdf.com/reader/full/rheology-of-oil-well-cement-slurries 102/274
79
until it reached a plateau (saturation dosage), beyond which no significant decrease in yield stress
was observed. The depicted PCM saturation dosages were about 0.50%, 0.75%, and 1.00% at
23oC, 45 oC, and 60 oC, respectively.
0
20
40
60
80
0 0.5 1 1.5 2 2.5 3 3.5
Y i e l d S t r e s s
( P a
)
Dosage of PCH (% BWOC)
23°C
45°C
60°C
0
20
40
60
80
0 0.5 1 1.5 2 2.5 3 3.5
Y i e l d S t r e s s
( P a
)
Dosage of LSM (% BWOC)
23°C
45°C
60°C
0
20
40
60
80
0 0.5 1 1.5 2 2.5 3 3.5
Y i e l d S t r e s s
( P a
)
Dosage of PCM (% BWOC)
23°C
45°C
60°C
Figure 4.8 Yield stress of oil well cement slurries at various temperatures and different dosagesof admixtures, (a) PCH, (b) LSM, and (c) PCM (w/c = 0.44).
(a)
(b)
(c)
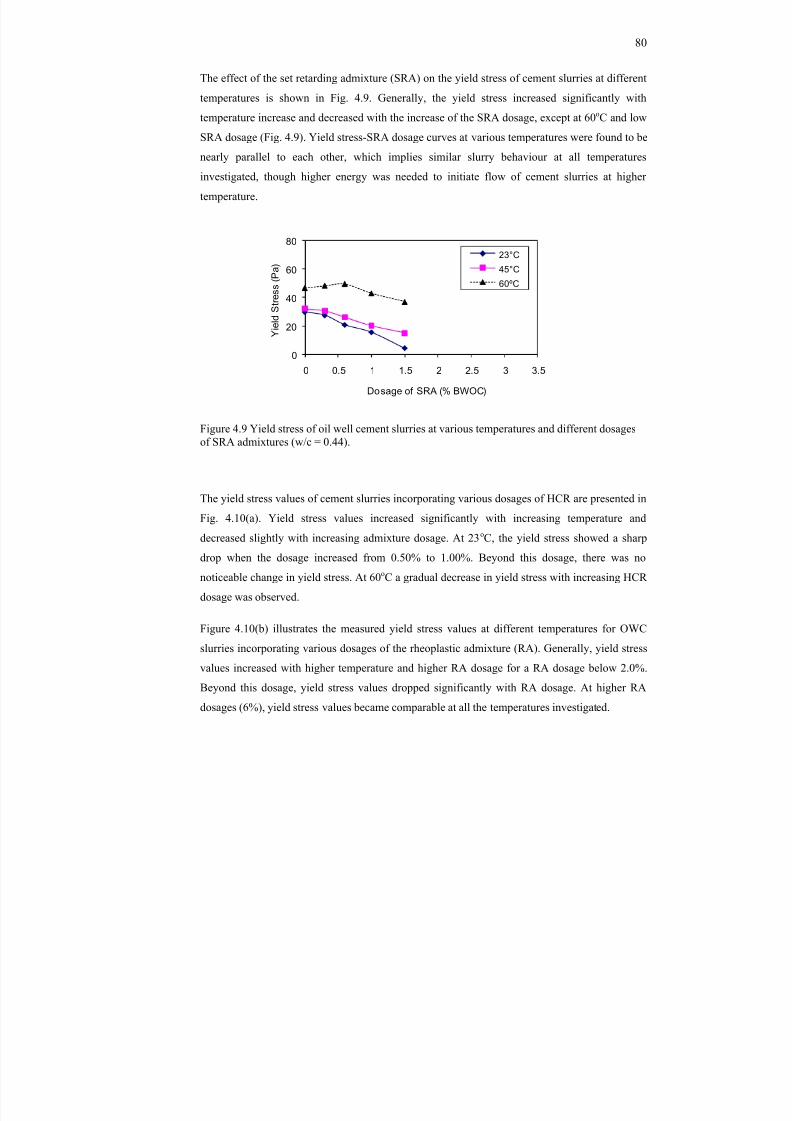
8/18/2019 Rheology of Oil Well Cement Slurries
http://slidepdf.com/reader/full/rheology-of-oil-well-cement-slurries 103/274
80
The effect of the set retarding admixture (SRA) on the yield stress of cement slurries at different
temperatures is shown in Fig. 4.9. Generally, the yield stress increased significantly with
temperature increase and decreased with the increase of the SRA dosage, except at 60 oC and low
SRA dosage (Fig. 4.9). Yield stress-SRA dosage curves at various temperatures were found to be
nearly parallel to each other, which implies similar slurry behaviour at all temperatures
investigated, though higher energy was needed to initiate flow of cement slurries at higher
temperature.
0
20
40
60
80
0 0.5 1 1.5 2 2.5 3 3.5
Y i e l d S t r e s s
( P a
)
Dosage of SRA (% BWOC)
23°C
45°C
60ºC
Figure 4.9 Yield stress of oil well cement slurries at various temperatures and different dosagesof SRA admixtures (w/c = 0.44).
The yield stress values of cement slurries incorporating various dosages of HCR are presented in
Fig. 4.10(a). Yield stress values increased significantly with increasing temperature and
decreased slightly with increasing admixture dosage. At 23 oC, the yield stress showed a sharp
drop when the dosage increased from 0.50% to 1.00%. Beyond this dosage, there was no
noticeable change in yield stress. At 60 oC a gradual decrease in yield stress with increasing HCR
dosage was observed.
Figure 4.10(b) illustrates the measured yield stress values at different temperatures for OWC
slurries incorporating various dosages of the rheoplastic admixture (RA). Generally, yield stress
values increased with higher temperature and higher RA dosage for a RA dosage below 2.0%.
Beyond this dosage, yield stress values dropped significantly with RA dosage. At higher RA
dosages (6%), yield stress values became comparable at all the temperatures investigated.
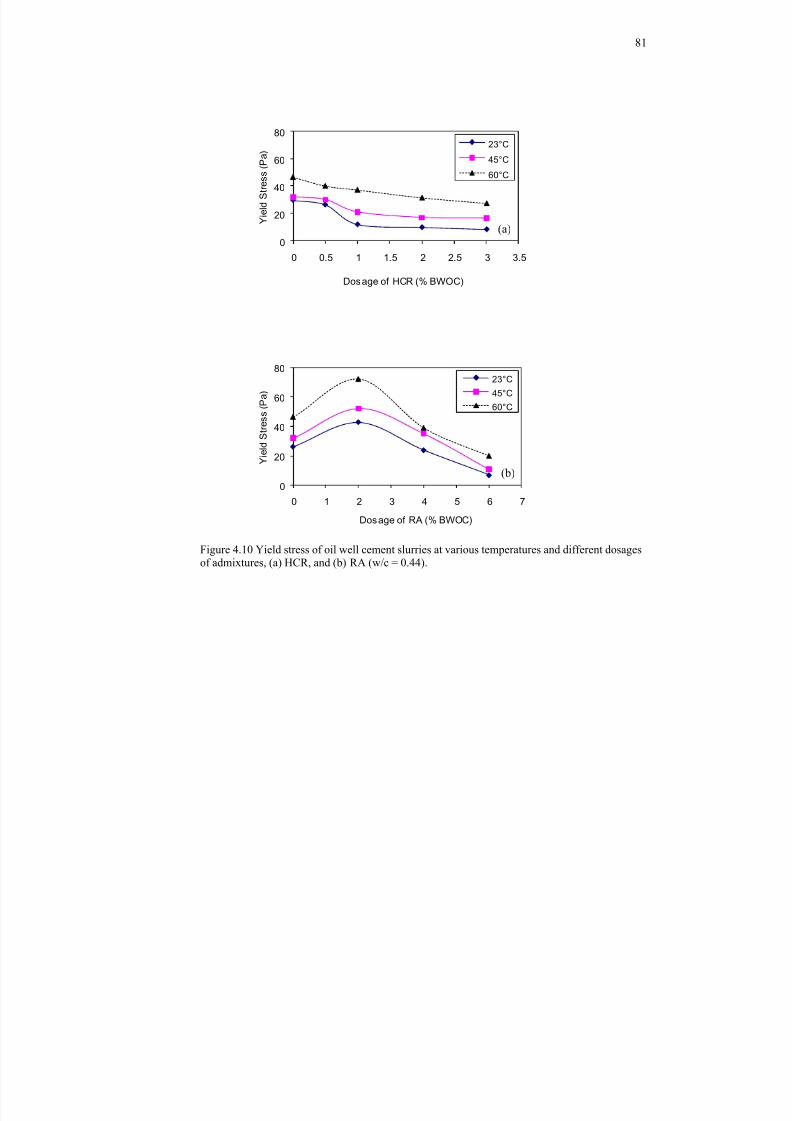
8/18/2019 Rheology of Oil Well Cement Slurries
http://slidepdf.com/reader/full/rheology-of-oil-well-cement-slurries 104/274
81
0
20
40
60
80
0 0.5 1 1.5 2 2.5 3 3.5
Y i e l d S t r e s s
( P a )
Dosage of HCR (% BWOC)
23°C
45°C
60°C
0
20
40
60
80
0 1 2 3 4 5 6 7
Y i e
l d S t r e s s
( P a
)
Dosage of RA (% BWOC)
23°C
45°C
60°C
Figure 4.10 Yield stress of oil well cement slurries at various temperatures and different dosagesof admixtures, (a) HCR, and (b) RA (w/c = 0.44).
(b)
(a)
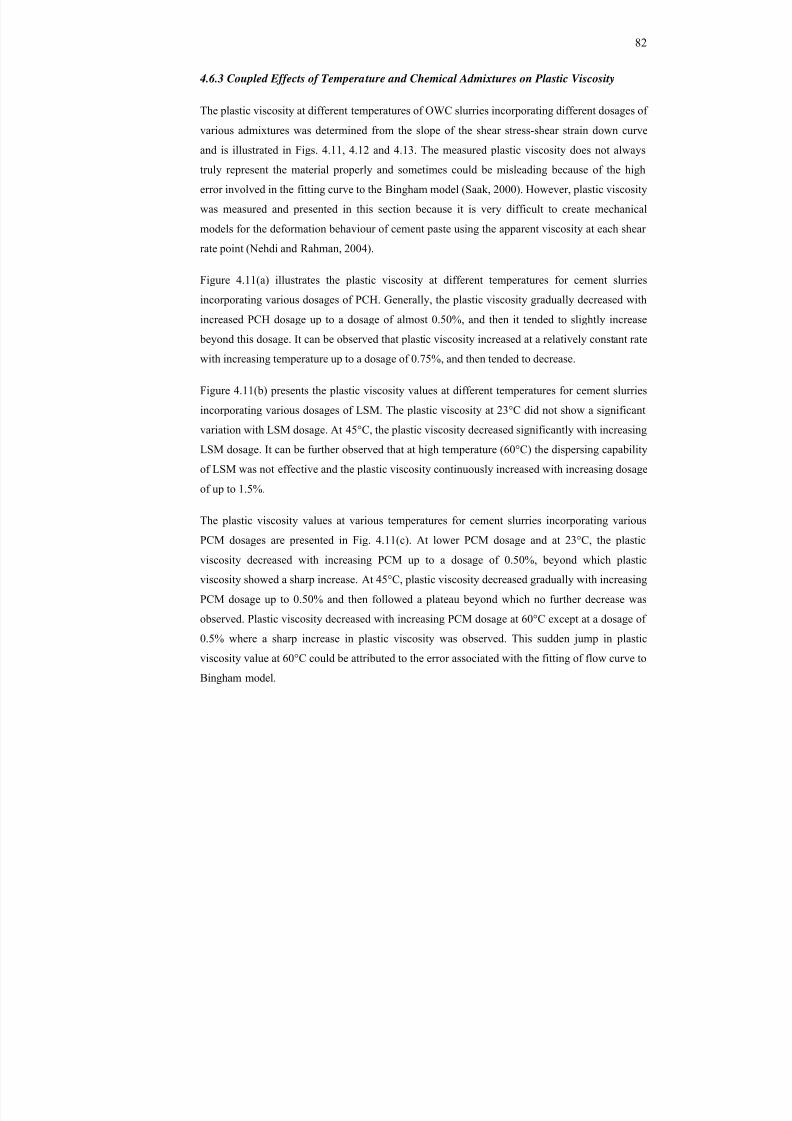
8/18/2019 Rheology of Oil Well Cement Slurries
http://slidepdf.com/reader/full/rheology-of-oil-well-cement-slurries 105/274
82
4.6.3 Coupled Effects of Temperature and Chemical Admixtures on Plastic Viscosity
The plastic viscosity at different temperatures of OWC slurries incorporating different dosages of
various admixtures was determined from the slope of the shear stress-shear strain down curve
and is illustrated in Figs. 4.11, 4.12 and 4.13. The measured plastic viscosity does not alwaystruly represent the material properly and sometimes could be misleading because of the high
error involved in the fitting curve to the Bingham model (Saak, 2000). However, plastic viscosity
was measured and presented in this section because it is very difficult to create mechanical
models for the deformation behaviour of cement paste using the apparent viscosity at each shear
rate point (Nehdi and Rahman, 2004).
Figure 4.11(a) illustrates the plastic viscosity at different temperatures for cement slurries
incorporating various dosages of PCH. Generally, the plastic viscosity gradually decreased withincreased PCH dosage up to a dosage of almost 0.50%, and then it tended to slightly increase
beyond this dosage. It can be observed that plastic viscosity increased at a relatively constant rate
with increasing temperature up to a dosage of 0.75%, and then tended to decrease.
Figure 4.11(b) presents the plastic viscosity values at different temperatures for cement slurries
incorporating various dosages of LSM. The plastic viscosity at 23°C did not show a significant
variation with LSM dosage. At 45°C, the plastic viscosity decreased significantly with increasing
LSM dosage. It can be further observed that at high temperature (60°C) the dispersing capabilityof LSM was not effective and the plastic viscosity continuously increased with increasing dosage
of up to 1.5%.
The plastic viscosity values at various temperatures for cement slurries incorporating various
PCM dosages are presented in Fig. 4.11(c). At lower PCM dosage and at 23°C, the plastic
viscosity decreased with increasing PCM up to a dosage of 0.50%, beyond which plastic
viscosity showed a sharp increase. At 45°C, plastic viscosity decreased gradually with increasing
PCM dosage up to 0.50% and then followed a plateau beyond which no further decrease was
observed. Plastic viscosity decreased with increasing PCM dosage at 60°C except at a dosage of
0.5% where a sharp increase in plastic viscosity was observed. This sudden jump in plastic
viscosity value at 60°C could be attributed to the error associated with the fitting of flow curve to
Bingham model.
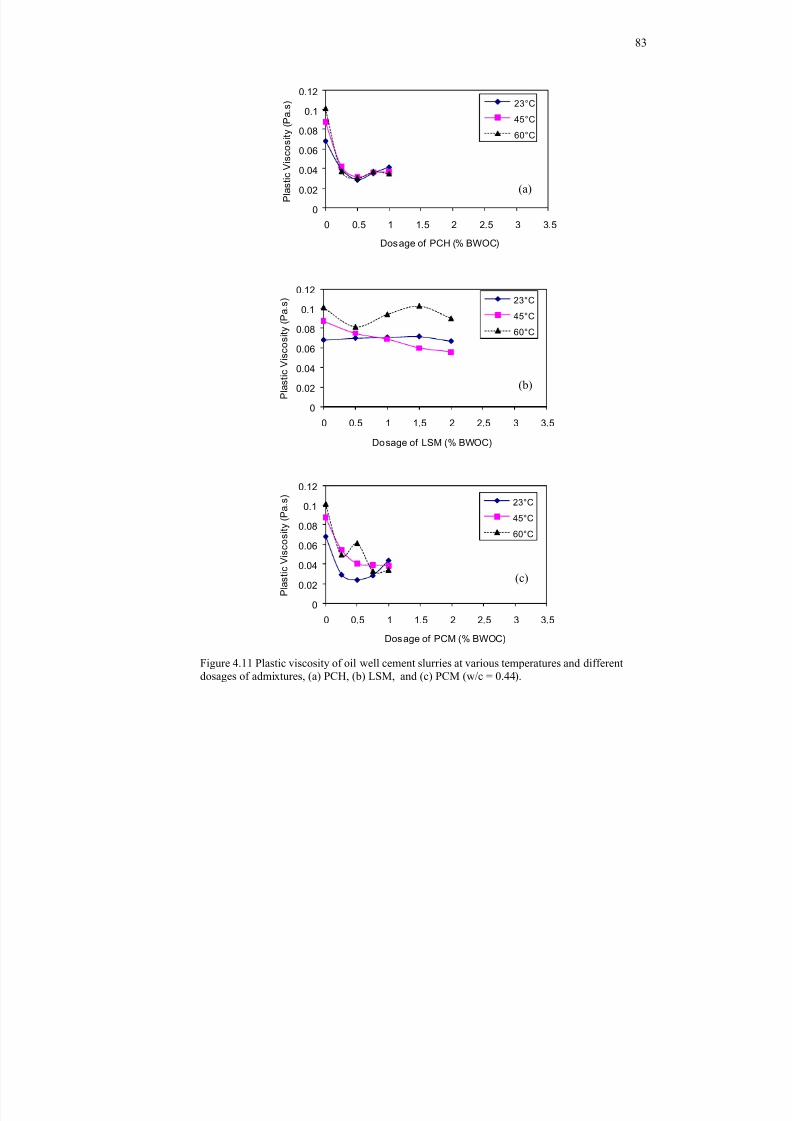
8/18/2019 Rheology of Oil Well Cement Slurries
http://slidepdf.com/reader/full/rheology-of-oil-well-cement-slurries 106/274
83
0
0.02
0.04
0.06
0.08
0.1
0.12
0 0.5 1 1.5 2 2.5 3 3.5
P l a s
t i c V i s c o s
i t y ( P a . s
)
Dosage of PCH (% BWOC)
23°C
45°C
60°C
0
0.02
0.04
0.06
0.08
0.1
0.12
0 0.5 1 1.5 2 2.5 3 3.5
P l a s
t i c V i s c o s
i t y ( P a . s
)
Dosage of LSM (% BWOC)
23°C45°C
60°C
0
0.02
0.04
0.06
0.08
0.1
0.12
0 0.5 1 1.5 2 2.5 3 3.5
P l a s
t i c V i s c o s
i t y ( P a . s
)
Dosage of PCM (% BWOC)
23°C
45°C
60°C
Figure 4.11 Plastic viscosity of oil well cement slurries at various temperatures and differentdosages of admixtures, (a) PCH, (b) LSM, and (c) PCM (w/c = 0.44).
(b)
(a)
(c)
8/18/2019 Rheology of Oil Well Cement Slurries
http://slidepdf.com/reader/full/rheology-of-oil-well-cement-slurries 107/274
84
As shown in Fig. 4.12(a), the plastic viscosity generally increased with temperature increase, and
decreased with increased SRA dosage, except at 60°C where plastic viscosity increased up to
0.6% SRA dosage and then decreased at higher dosage. Figure 4.12(b) shows that at 23°C plastic
viscosity values increased up to about 0.50% HCR dosage, beyond which it decreased until it
reached a plateau. At 45°C and 60°C, plastic viscosity generally decreased gradually with
increasing HCR dosage.
0
0.020.04
0.06
0.08
0.1
0.12
0 0.5 1 1.5 2 2.5 3 3.5
P l a s
t i c V i s c o s
i t y ( P a . s
)
Dosage of SRA (% BWOC)
23°C
45°C
60ºC
0
0.02
0.04
0.06
0.08
0.1
0.12
0 0.5 1 1.5 2 2.5 3 3.5
P l a s
t i c V i s c o s
i t y ( P a . s
)
Dosage of HCR (% BWOC)
23°C45°C
60°C
Figure 4.12 Plastic viscosity of oil well cement slurries at various temperatures and differentdosages of admixtures, (a) SRA, and (b) HCR (w/c = 0.44).
(b)
(a)
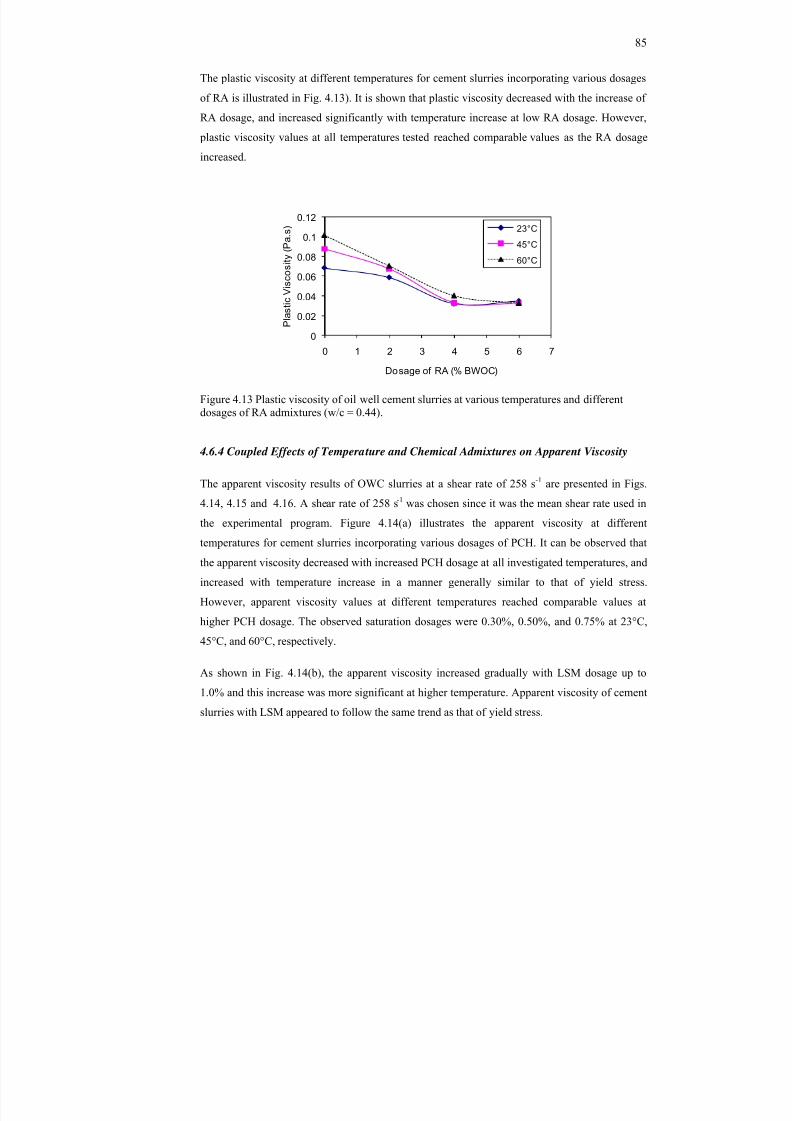
8/18/2019 Rheology of Oil Well Cement Slurries
http://slidepdf.com/reader/full/rheology-of-oil-well-cement-slurries 108/274
85
The plastic viscosity at different temperatures for cement slurries incorporating various dosages
of RA is illustrated in Fig. 4.13). It is shown that plastic viscosity decreased with the increase of
RA dosage, and increased significantly with temperature increase at low RA dosage. However,
plastic viscosity values at all temperatures tested reached comparable values as the RA dosage
increased.
0
0.02
0.04
0.06
0.08
0.1
0.12
0 1 2 3 4 5 6 7
P l a s t i c
V i s c o s
i t y ( P a . s
)
Dosage of RA (% BWOC)
23°C
45°C
60°C
Figure 4.13 Plastic viscosity of oil well cement slurries at various temperatures and differentdosages of RA admixtures (w/c = 0.44).
4.6.4 Coupled Effects of Temperature and Chemical Admixtures on Apparent Viscosity
The apparent viscosity results of OWC slurries at a shear rate of 258 s -1 are presented in Figs.
4.14, 4.15 and 4.16. A shear rate of 258 s -1 was chosen since it was the mean shear rate used in
the experimental program. Figure 4.14(a) illustrates the apparent viscosity at different
temperatures for cement slurries incorporating various dosages of PCH. It can be observed that
the apparent viscosity decreased with increased PCH dosage at all investigated temperatures, and
increased with temperature increase in a manner generally similar to that of yield stress.
However, apparent viscosity values at different temperatures reached comparable values athigher PCH dosage. The observed saturation dosages were 0.30%, 0.50%, and 0.75% at 23°C,
45°C, and 60°C, respectively.
As shown in Fig. 4.14(b), the apparent viscosity increased gradually with LSM dosage up to
1.0% and this increase was more significant at higher temperature. Apparent viscosity of cement
slurries with LSM appeared to follow the same trend as that of yield stress.
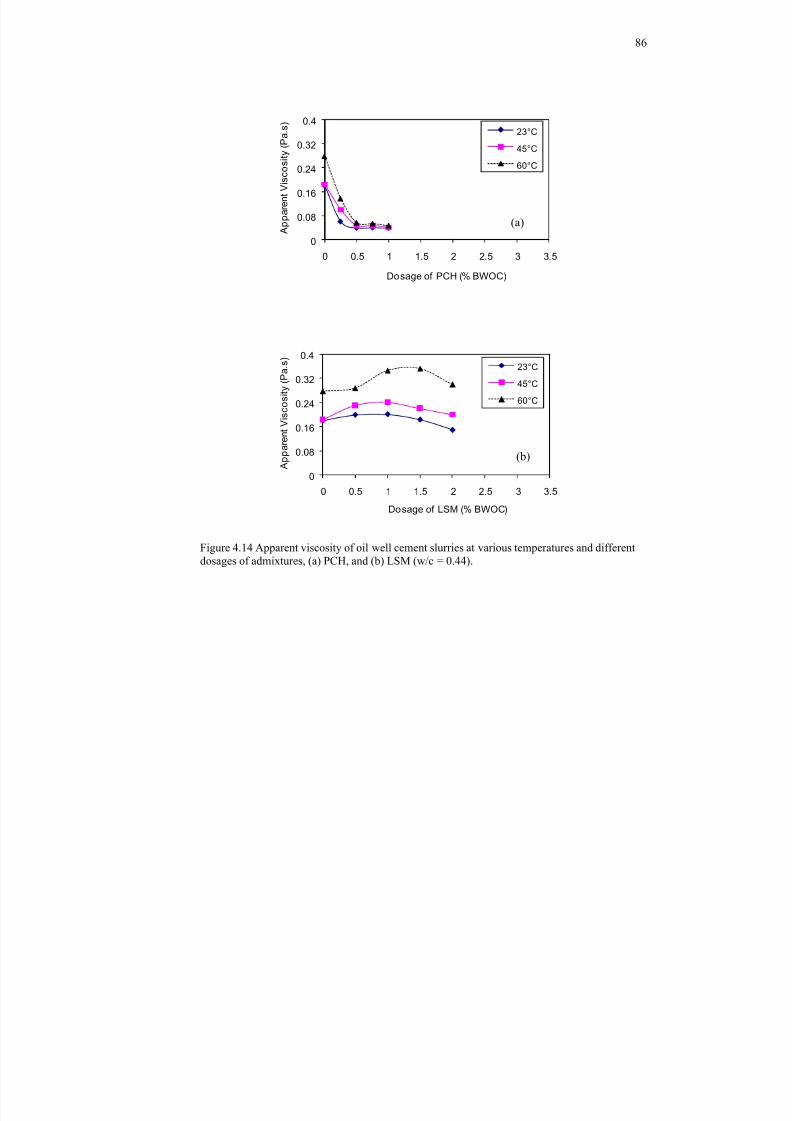
8/18/2019 Rheology of Oil Well Cement Slurries
http://slidepdf.com/reader/full/rheology-of-oil-well-cement-slurries 109/274
86
0
0.08
0.16
0.24
0.32
0.4
0 0.5 1 1.5 2 2.5 3 3.5
A p p a r e n
t V i s c o s
i t y ( P a . s
)
Dosage of PCH (% BWOC)
23°C
45°C60°C
0
0.08
0.16
0.24
0.32
0.4
0 0.5 1 1.5 2 2.5 3 3.5
A p p a r e n
t V i s c o s
i t y ( P a . s
)
Dosage of LSM (% BWOC)
23°C
45°C
60°C
Figure 4.14 Apparent viscosity of oil well cement slurries at various temperatures and differentdosages of admixtures, (a) PCH, and (b) LSM (w/c = 0.44).
(a)
(b)
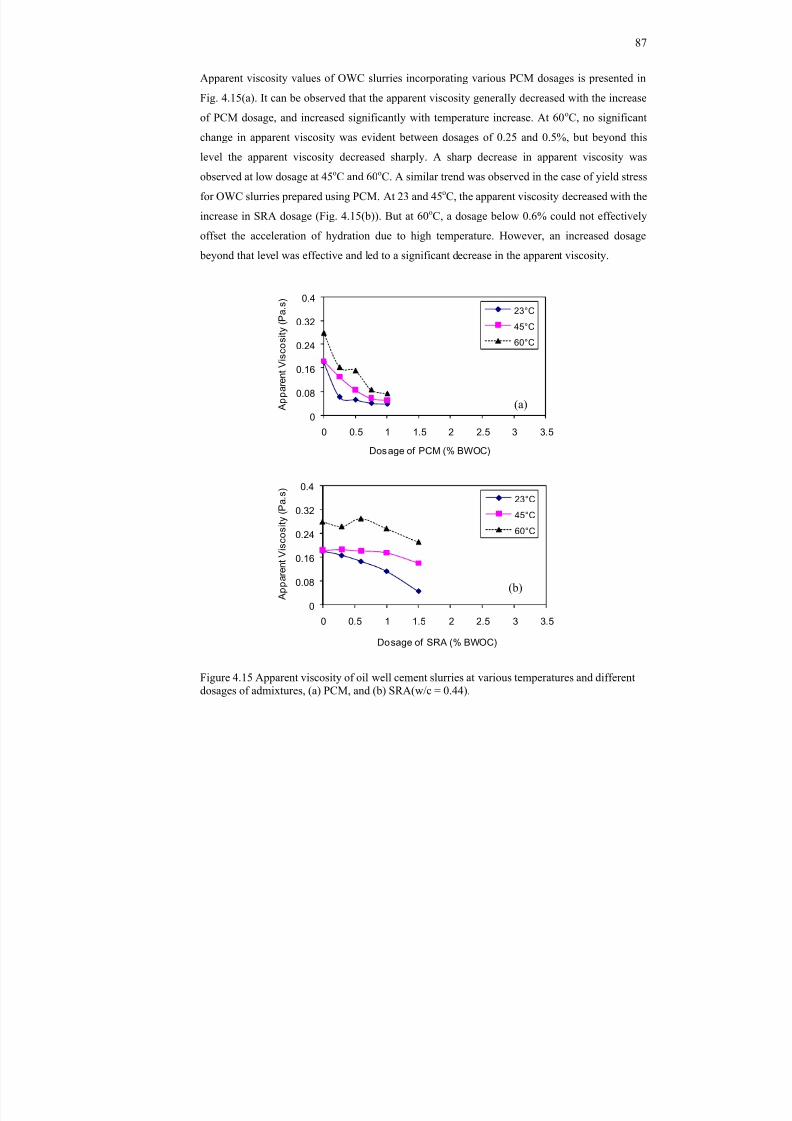
8/18/2019 Rheology of Oil Well Cement Slurries
http://slidepdf.com/reader/full/rheology-of-oil-well-cement-slurries 110/274
87
Apparent viscosity values of OWC slurries incorporating various PCM dosages is presented in
Fig. 4.15(a). It can be observed that the apparent viscosity generally decreased with the increase
of PCM dosage, and increased significantly with temperature increase. At 60 oC, no significant
change in apparent viscosity was evident between dosages of 0.25 and 0.5%, but beyond this
level the apparent viscosity decreased sharply. A sharp decrease in apparent viscosity was
observed at low dosage at 45 oC and 60 oC. A similar trend was observed in the case of yield stress
for OWC slurries prepared using PCM. At 23 and 45 oC, the apparent viscosity decreased with the
increase in SRA dosage (Fig. 4.15(b)). But at 60 oC, a dosage below 0.6% could not effectively
offset the acceleration of hydration due to high temperature. However, an increased dosage
beyond that level was effective and led to a significant decrease in the apparent viscosity.
0
0.08
0.16
0.24
0.32
0.4
0 0.5 1 1.5 2 2.5 3 3.5
A p p a r e n
t V i s c o s
i t y ( P a . s
)
Dosage of PCM (% BWOC)
23°C
45°C
60°C
0
0.08
0.16
0.24
0.32
0.4
0 0.5 1 1.5 2 2.5 3 3.5
A p p a r e n
t V i s c o s
i t y ( P a . s
)
Dosage of SRA (% BWOC)
23°C
45°C
60°C
Figure 4.15 Apparent viscosity of oil well cement slurries at various temperatures and differentdosages of admixtures, (a) PCM, and (b) SRA(w/c = 0.44).
(a)
(b)
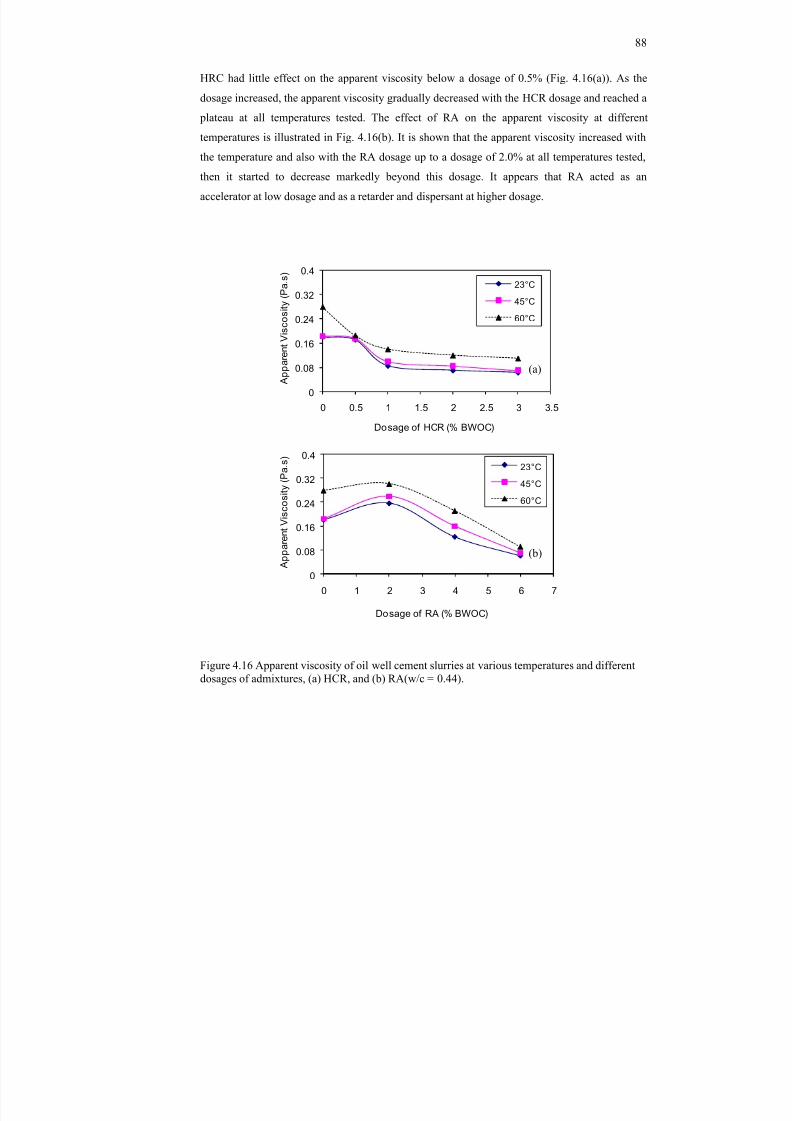
8/18/2019 Rheology of Oil Well Cement Slurries
http://slidepdf.com/reader/full/rheology-of-oil-well-cement-slurries 111/274
88
HRC had little effect on the apparent viscosity below a dosage of 0.5% (Fig. 4.16(a)). As the
dosage increased, the apparent viscosity gradually decreased with the HCR dosage and reached a
plateau at all temperatures tested. The effect of RA on the apparent viscosity at different
temperatures is illustrated in Fig. 4.16(b). It is shown that the apparent viscosity increased with
the temperature and also with the RA dosage up to a dosage of 2.0% at all temperatures tested,
then it started to decrease markedly beyond this dosage. It appears that RA acted as an
accelerator at low dosage and as a retarder and dispersant at higher dosage.
0
0.08
0.16
0.24
0.32
0.4
0 0.5 1 1.5 2 2.5 3 3.5
A p p a r e n
t V i s c o s
i t y
( P a . s
)
Dosage of HCR (% BWOC)
23°C
45°C60°C
0
0.08
0.16
0.24
0.32
0.4
0 1 2 3 4 5 6 7
A p p a r e n
t V i s c o s
i t y ( P a . s )
Dosage of RA (% BWOC)
23°C
45°C
60°C
Figure 4.16 Apparent viscosity of oil well cement slurries at various temperatures and differentdosages of admixtures, (a) HCR, and (b) RA(w/c = 0.44).
(a)
(b)
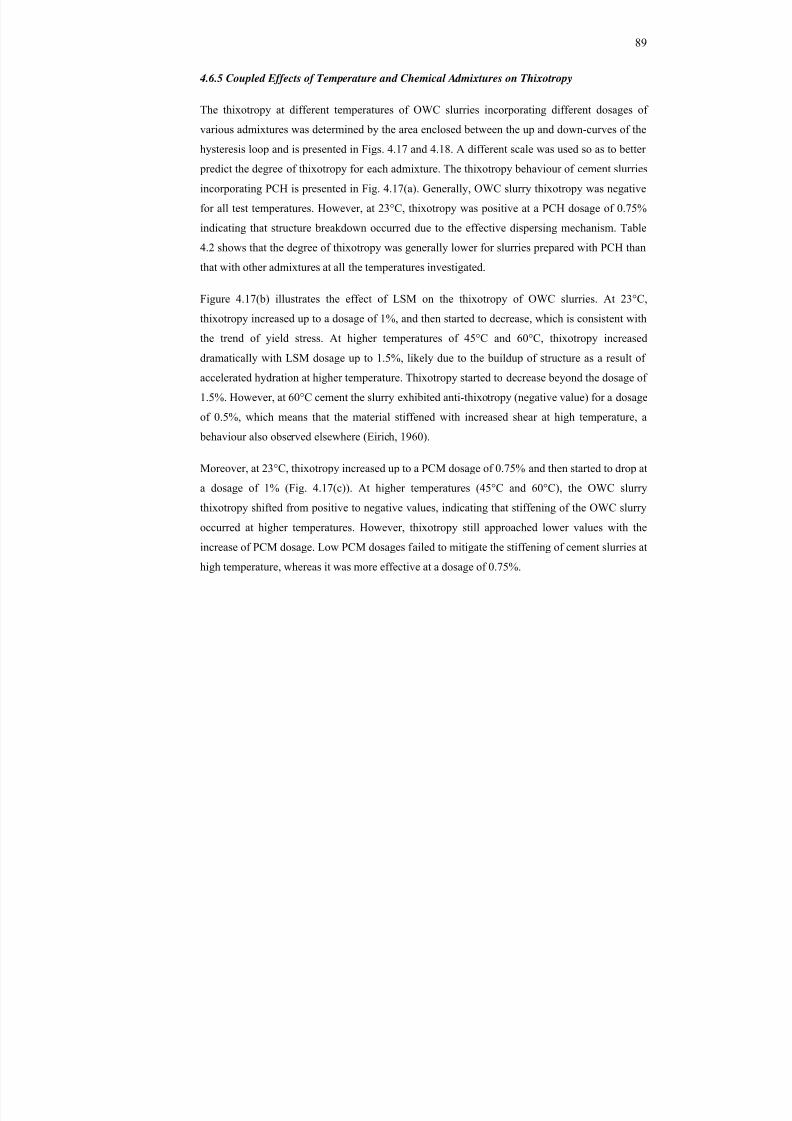
8/18/2019 Rheology of Oil Well Cement Slurries
http://slidepdf.com/reader/full/rheology-of-oil-well-cement-slurries 112/274
89
4.6.5 Coupled Effects of Temperature and Chemical Admixtures on Thixotropy
The thixotropy at different temperatures of OWC slurries incorporating different dosages of
various admixtures was determined by the area enclosed between the up and down-curves of the
hysteresis loop and is presented in Figs. 4.17 and 4.18. A different scale was used so as to better predict the degree of thixotropy for each admixture. The thixotropy behaviour of cement slurries
incorporating PCH is presented in Fig. 4.17(a). Generally, OWC slurry thixotropy was negative
for all test temperatures. However, at 23°C, thixotropy was positive at a PCH dosage of 0.75%
indicating that structure breakdown occurred due to the effective dispersing mechanism. Table
4.2 shows that the degree of thixotropy was generally lower for slurries prepared with PCH than
that with other admixtures at all the temperatures investigated.
Figure 4.17(b) illustrates the effect of LSM on the thixotropy of OWC slurries. At 23°C,thixotropy increased up to a dosage of 1%, and then started to decrease, which is consistent with
the trend of yield stress. At higher temperatures of 45°C and 60°C, thixotropy increased
dramatically with LSM dosage up to 1.5%, likely due to the buildup of structure as a result of
accelerated hydration at higher temperature. Thixotropy started to decrease beyond the dosage of
1.5%. However, at 60°C cement the slurry exhibited anti-thixotropy (negative value) for a dosage
of 0.5%, which means that the material stiffened with increased shear at high temperature, a
behaviour also observed elsewhere (Eirich, 1960).
Moreover, at 23°C, thixotropy increased up to a PCM dosage of 0.75% and then started to drop at
a dosage of 1% (Fig. 4.17(c)). At higher temperatures (45°C and 60°C), the OWC slurry
thixotropy shifted from positive to negative values, indicating that stiffening of the OWC slurry
occurred at higher temperatures. However, thixotropy still approached lower values with the
increase of PCM dosage. Low PCM dosages failed to mitigate the stiffening of cement slurries at
high temperature, whereas it was more effective at a dosage of 0.75%.
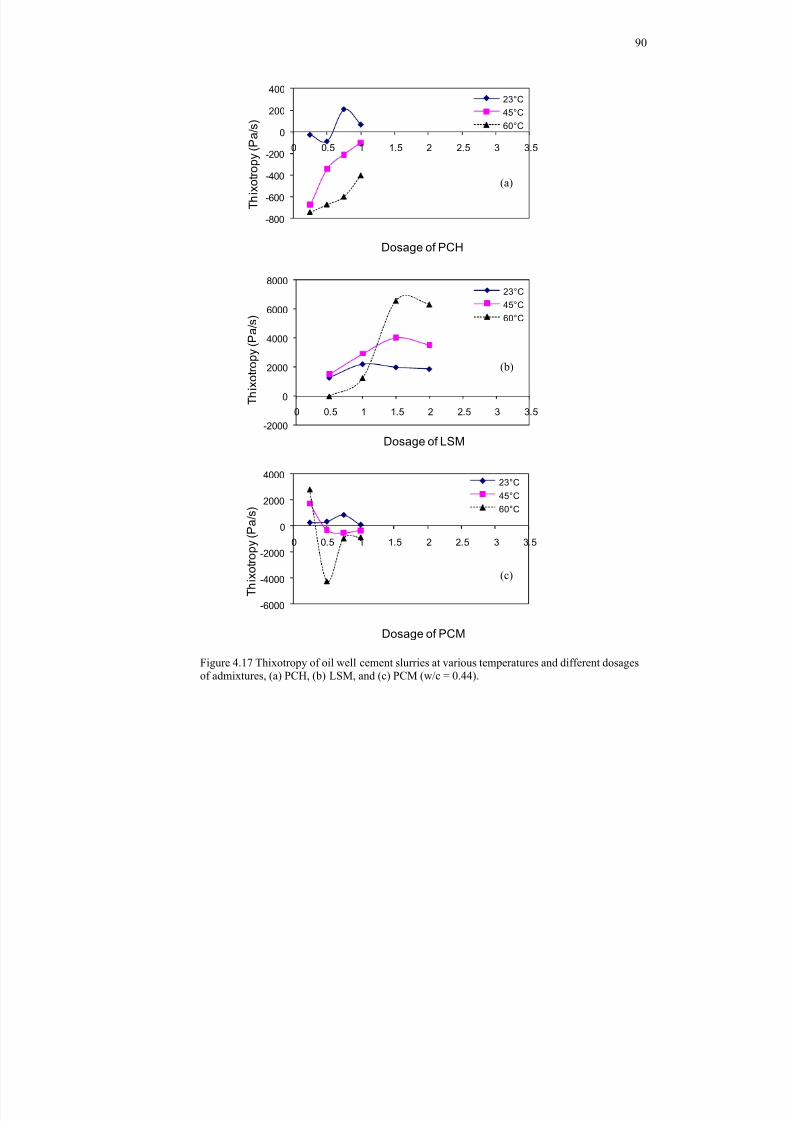
8/18/2019 Rheology of Oil Well Cement Slurries
http://slidepdf.com/reader/full/rheology-of-oil-well-cement-slurries 113/274
90
-800
-600
-400
-200
0
200
400
0 0.5 1 1.5 2 2.5 3 3.5
T h i x o
t r o p y
( P a
/ s )
Dosage of PCH
23°C45°C60°C
-2000
0
2000
4000
6000
8000
0 0.5 1 1.5 2 2.5 3 3.5 T h i x o
t r o p y
( P a
/ s )
Dosage of LSM
23°C
45°C60°C
-6000
-4000
-2000
0
2000
4000
0 0.5 1 1.5 2 2.5 3 3.5
T h i x o
t r o p y
( P a
/ s )
Dosage of PCM
23°C45°C60°C
Figure 4.17 Thixotropy of oil well cement slurries at various temperatures and different dosagesof admixtures, (a) PCH, (b) LSM, and (c) PCM (w/c = 0.44).
(a)
(b)
(c)
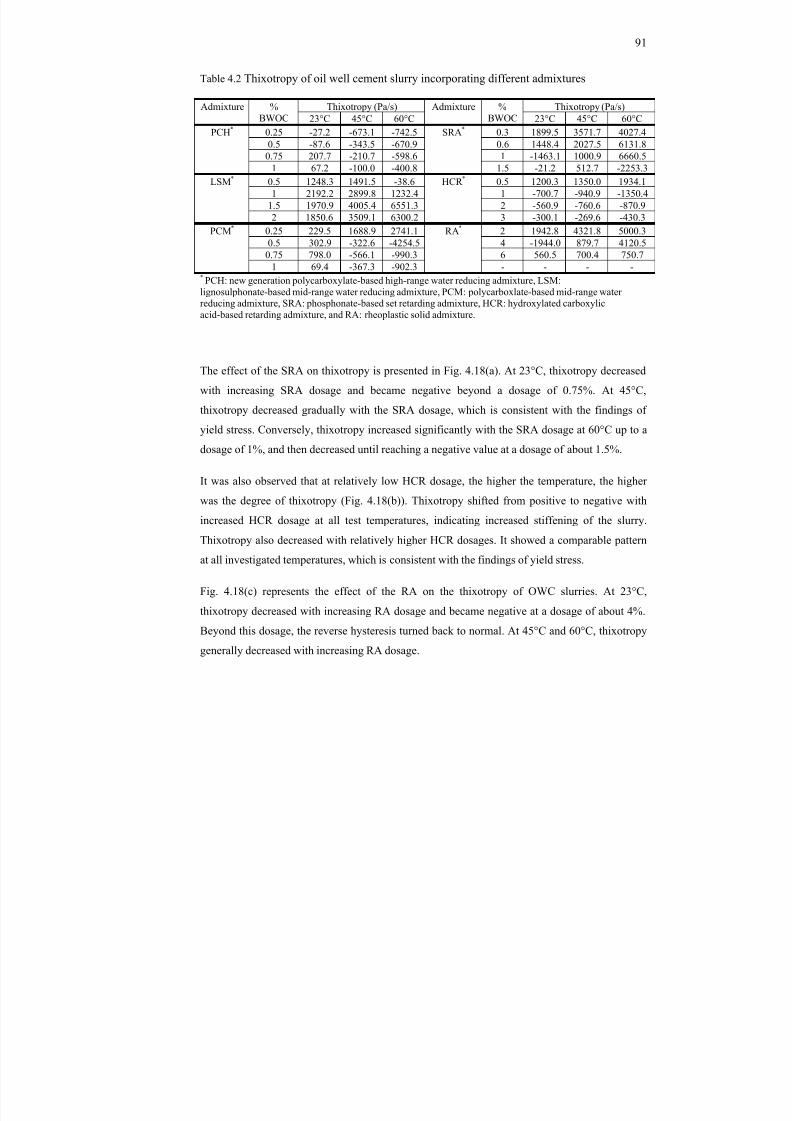
8/18/2019 Rheology of Oil Well Cement Slurries
http://slidepdf.com/reader/full/rheology-of-oil-well-cement-slurries 114/274
91
Table 4.2 Thixotropy of oil well cement slurry incorporating different admixtures
Admixture %BWOC
Thixotropy (Pa/s) Admixture %BWOC
Thixotropy (Pa/s)23°C 45°C 60°C 23°C 45°C 60°C
PCH * 0.25 -27.2 -673.1 -742.5 SRA * 0.3 1899.5 3571.7 4027.40.5 -87.6 -343.5 -670.9 0.6 1448.4 2027.5 6131.8
0.75 207.7 -210.7 -598.6 1 -1463.1 1000.9 6660.51 67.2 -100.0 -400.8 1.5 -21.2 512.7 -2253.3
LSM * 0.5 1248.3 1491.5 -38.6 HCR * 0.5 1200.3 1350.0 1934.11 2192.2 2899.8 1232.4 1 -700.7 -940.9 -1350.4
1.5 1970.9 4005.4 6551.3 2 -560.9 -760.6 -870.92 1850.6 3509.1 6300.2 3 -300.1 -269.6 -430.3
PCM * 0.25 229.5 1688.9 2741.1 RA * 2 1942.8 4321.8 5000.30.5 302.9 -322.6 -4254.5 4 -1944.0 879.7 4120.5
0.75 798.0 -566.1 -990.3 6 560.5 700.4 750.71 69.4 -367.3 -902.3 - - - -
* PCH: new generation polycarboxylate-based high-range water reducing admixture, LSM:lignosulphonate-based mid-range water reducing admixture, PCM: polycarboxlate-based mid-range water
reducing admixture, SRA: phosphonate-based set retarding admixture, HCR: hydroxylated carboxylicacid-based retarding admixture, and RA: rheoplastic solid admixture.
The effect of the SRA on thixotropy is presented in Fig. 4.18(a). At 23°C, thixotropy decreased
with increasing SRA dosage and became negative beyond a dosage of 0.75%. At 45°C,
thixotropy decreased gradually with the SRA dosage, which is consistent with the findings of
yield stress. Conversely, thixotropy increased significantly with the SRA dosage at 60°C up to a
dosage of 1%, and then decreased until reaching a negative value at a dosage of about 1.5%.
It was also observed that at relatively low HCR dosage, the higher the temperature, the higher
was the degree of thixotropy (Fig. 4.18(b)). Thixotropy shifted from positive to negative with
increased HCR dosage at all test temperatures, indicating increased stiffening of the slurry.
Thixotropy also decreased with relatively higher HCR dosages. It showed a comparable pattern
at all investigated temperatures, which is consistent with the findings of yield stress.
Fig. 4.18(c) represents the effect of the RA on the thixotropy of OWC slurries. At 23°C,
thixotropy decreased with increasing RA dosage and became negative at a dosage of about 4%.
Beyond this dosage, the reverse hysteresis turned back to normal. At 45°C and 60°C, thixotropy
generally decreased with increasing RA dosage.
8/18/2019 Rheology of Oil Well Cement Slurries
http://slidepdf.com/reader/full/rheology-of-oil-well-cement-slurries 115/274
92
-4000
-2000
0
2000
4000
6000
8000
0 0.5 1 1.5 2 2.5 3 3.5 T h i x o t r o p y
( P a
/ s )
Dosage of SRA
23°C45°C60°C
-2000
-1000
0
1000
2000
3000
0 0.5 1 1.5 2 2.5 3 3.5
T h i x o
t r o p y
( P a
/ s )
Dosage of HCR
23°C45°C
60°C
-4000
-2000
0
2000
4000
6000
0 1 2 3 4 5 6 7
T h i x o
t r o p y
( P a
/ s )
Dosage of RA
23°C45°C
60°C
Figure 4.18 Thixotropy of oil well cement slurries at various temperatures and different dosagesof admixtures, (a) SRA, (b) HCR, and (c) RA (w/c = 0.44).
(a)
(b)
(c)
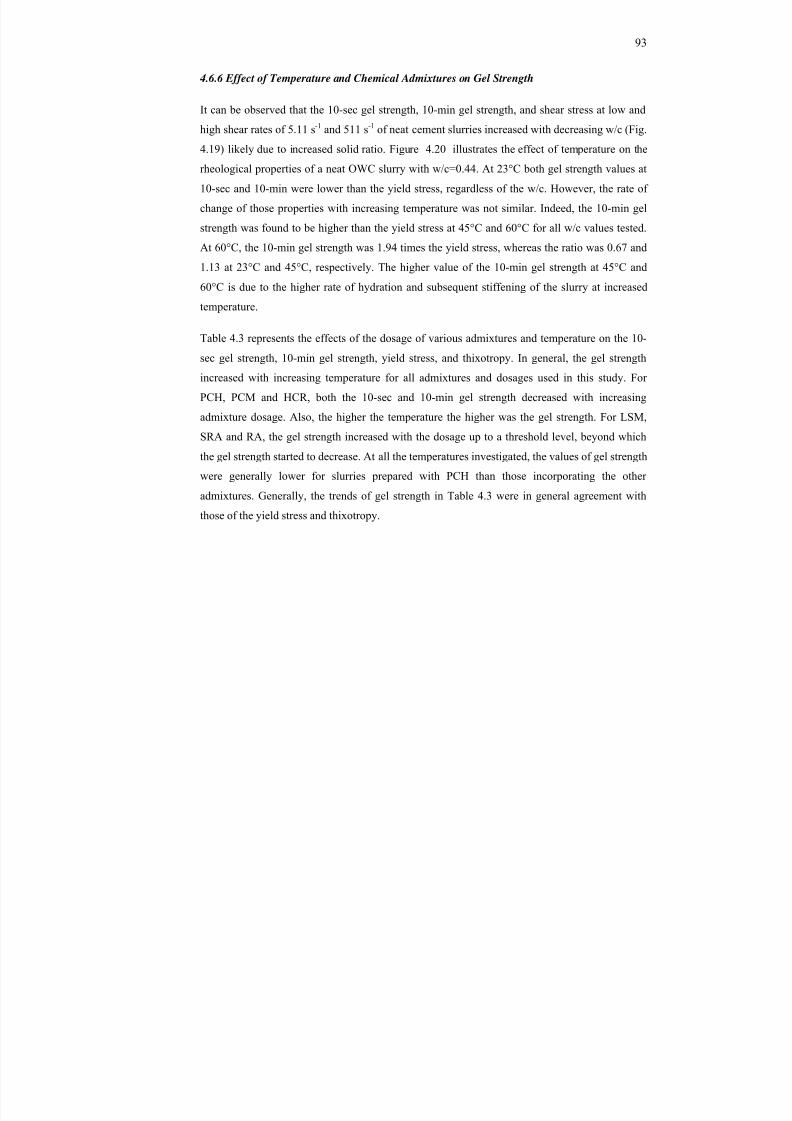
8/18/2019 Rheology of Oil Well Cement Slurries
http://slidepdf.com/reader/full/rheology-of-oil-well-cement-slurries 116/274
93
4.6.6 Effect of Temperature and Chemical Admixtures on Gel Strength
It can be observed that the 10-sec gel strength, 10-min gel strength, and shear stress at low and
high shear rates of 5.11 s -1 and 511 s -1 of neat cement slurries increased with decreasing w/c (Fig.
4.19) likely due to increased solid ratio. Figure 4.20 illustrates the effect of temperature on therheological properties of a neat OWC slurry with w/c=0.44. At 23°C both gel strength values at
10-sec and 10-min were lower than the yield stress, regardless of the w/c. However, the rate of
change of those properties with increasing temperature was not similar. Indeed, the 10-min gel
strength was found to be higher than the yield stress at 45°C and 60°C for all w/c values tested.
At 60°C, the 10-min gel strength was 1.94 times the yield stress, whereas the ratio was 0.67 and
1.13 at 23°C and 45°C, respectively. The higher value of the 10-min gel strength at 45°C and
60°C is due to the higher rate of hydration and subsequent stiffening of the slurry at increased
temperature.
Table 4.3 represents the effects of the dosage of various admixtures and temperature on the 10-
sec gel strength, 10-min gel strength, yield stress, and thixotropy. In general, the gel strength
increased with increasing temperature for all admixtures and dosages used in this study. For
PCH, PCM and HCR, both the 10-sec and 10-min gel strength decreased with increasing
admixture dosage. Also, the higher the temperature the higher was the gel strength. For LSM,
SRA and RA, the gel strength increased with the dosage up to a threshold level, beyond which
the gel strength started to decrease. At all the temperatures investigated, the values of gel strengthwere generally lower for slurries prepared with PCH than those incorporating the other
admixtures. Generally, the trends of gel strength in Table 4.3 were in general agreement with
those of the yield stress and thixotropy.
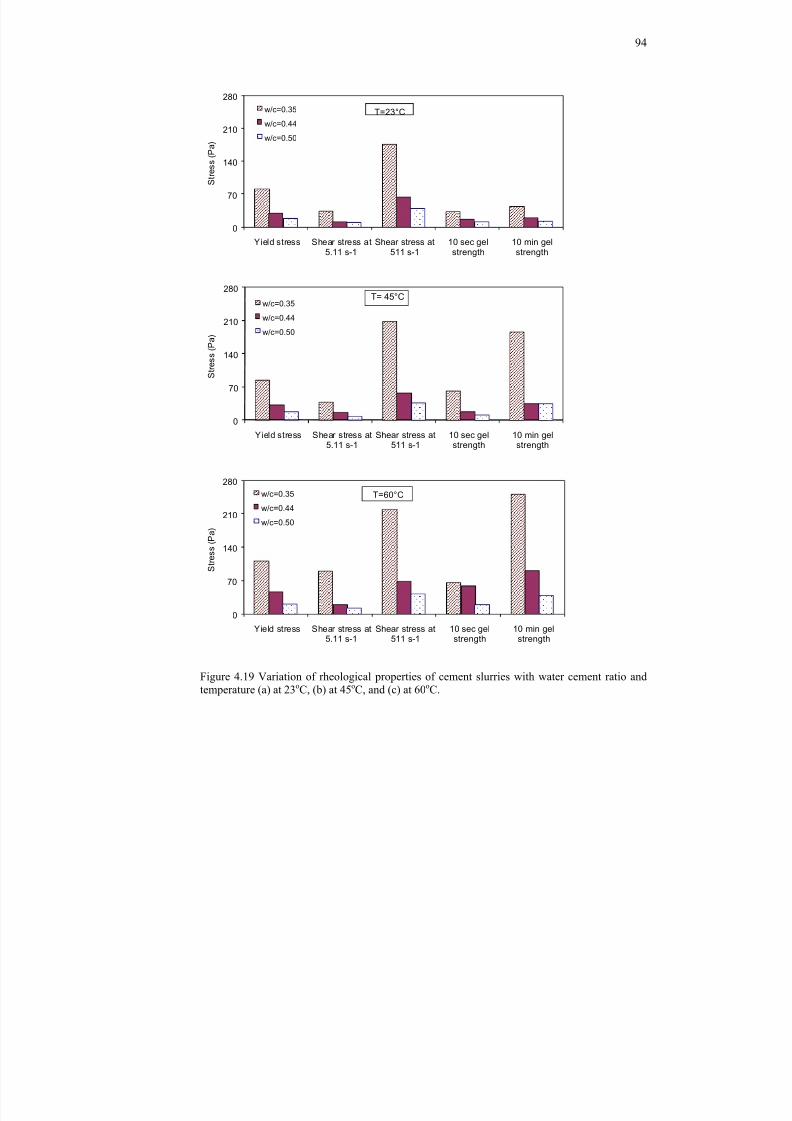
8/18/2019 Rheology of Oil Well Cement Slurries
http://slidepdf.com/reader/full/rheology-of-oil-well-cement-slurries 117/274
94
0
70
140
210
280
Yield stress Shear stress at5.11 s-1
Shear stress at511 s-1
10 sec gelstrength
10 min gelstrength
S t r e s s
( P a
)
w/c=0.35
w/c=0.44
w/c=0.50
T=23°C
0
70
140
210
280
Yield stress Shear stress at5.11 s-1
Shear stress at511 s-1
10 sec gelstrength
10 min gelstrength
S t r e s s
( P a
)
w/c=0.35w/c=0.44
w/c=0.50
0
70
140
210
280
Yield stress Shear stress at5.11 s-1
Shear stress at511 s-1
10 sec gelstrength
10 min gelstrength
S t r e s s
( P a
)
w/c=0.35
w/c=0.44
w/c=0.50
T=60°C
Figure 4.19 Variation of rheological properties of cement slurries with water cement ratio andtemperature (a) at 23 oC, (b) at 45 oC, and (c) at 60 oC.
T= 45°C
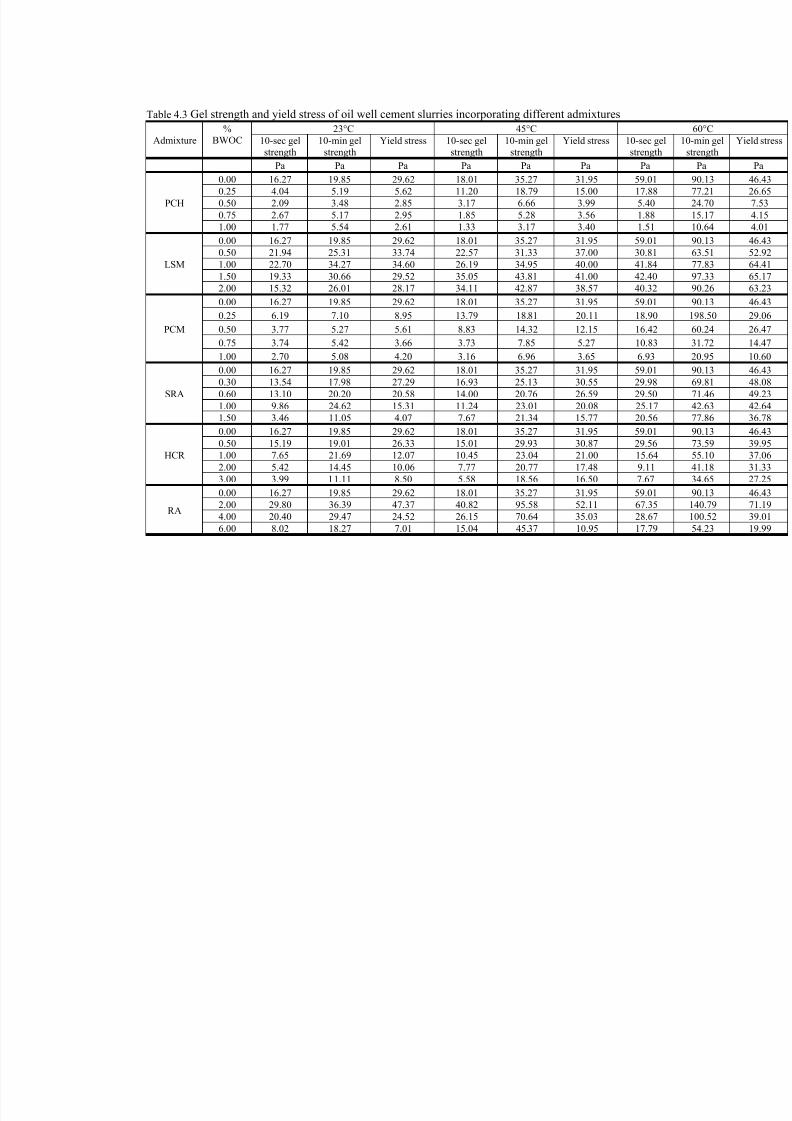
8/18/2019 Rheology of Oil Well Cement Slurries
http://slidepdf.com/reader/full/rheology-of-oil-well-cement-slurries 118/274
Table 4.3 Gel strength and yield stress of oil well cement slurries incorporating different admixtures
Admixture%
BWOC23°C 45°C
10-sec gelstrength
10-min gelstrength
Yield stress 10-sec gelstrength
10-min gelstrength
Yield stress 10-sec gelstrength
Pa Pa Pa Pa Pa Pa Pa
PCH
0.00 16.27 19.85 29.62 18.01 35.27 31.95 59.01 0.25 4.04 5.19 5.62 11.20 18.79 15.00 17.88 0.50 2.09 3.48 2.85 3.17 6.66 3.99 5.40 0.75 2.67 5.17 2.95 1.85 5.28 3.56 1.88 1.00 1.77 5.54 2.61 1.33 3.17 3.40 1.51
LSM
0.00 16.27 19.85 29.62 18.01 35.27 31.95 59.01 0.50 21.94 25.31 33.74 22.57 31.33 37.00 30.81 1.00 22.70 34.27 34.60 26.19 34.95 40.00 41.84 1.50 19.33 30.66 29.52 35.05 43.81 41.00 42.40 2.00 15.32 26.01 28.17 34.11 42.87 38.57 40.32
PCM
0.00 16.27 19.85 29.62 18.01 35.27 31.95 59.01 0.25 6.19 7.10 8.95 13.79 18.81 20.11 18.90 0.50 3.77 5.27 5.61 8.83 14.32 12.15 16.42 0.75 3.74 5.42 3.66 3.73 7.85 5.27 10.83 1.00 2.70 5.08 4.20 3.16 6.96 3.65 6.93
SRA
0.00 16.27 19.85 29.62 18.01 35.27 31.95 59.01 0.30 13.54 17.98 27.29 16.93 25.13 30.55 29.98 0.60 13.10 20.20 20.58 14.00 20.76 26.59 29.50 1.00 9.86 24.62 15.31 11.24 23.01 20.08 25.17 1.50 3.46 11.05 4.07 7.67 21.34 15.77 20.56
HCR
0.00 16.27 19.85 29.62 18.01 35.27 31.95 59.01 0.50 15.19 19.01 26.33 15.01 29.93 30.87 29.56 1.00 7.65 21.69 12.07 10.45 23.04 21.00 15.64 2.00 5.42 14.45 10.06 7.77 20.77 17.48 9.11 3.00 3.99 11.11 8.50 5.58 18.56 16.50 7.67
RA
0.00 16.27 19.85 29.62 18.01 35.27 31.95 59.01 2.00 29.80 36.39 47.37 40.82 95.58 52.11 67.35 4.00 20.40 29.47 24.52 26.15 70.64 35.03 28.67 6.00 8.02 18.27 7.01 15.04 45.37 10.95 17.79
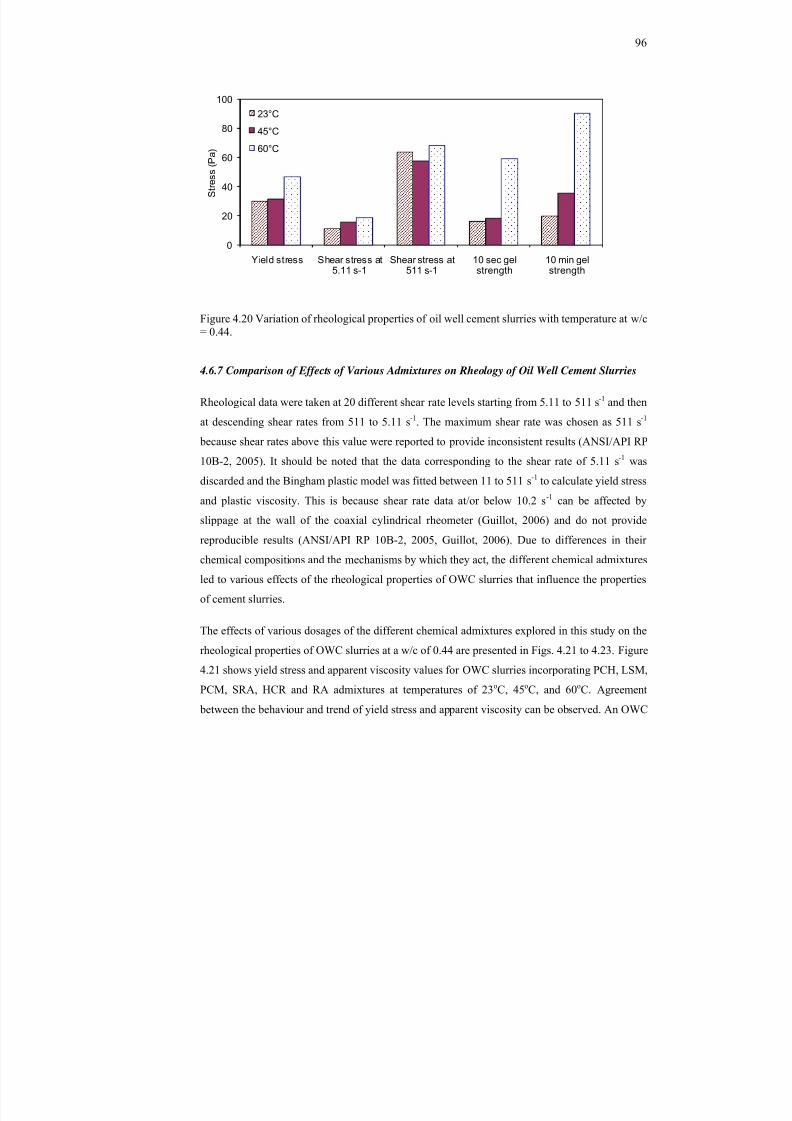
8/18/2019 Rheology of Oil Well Cement Slurries
http://slidepdf.com/reader/full/rheology-of-oil-well-cement-slurries 119/274
96
0
20
40
60
80
100
Yield stress Shear stress at5.11 s-1
Shear stress at511 s-1
10 sec gelstrength
10 min gelstrength
S t r e s s
( P a )
23°C
45°C
60°C
Figure 4.20 Variation of rheological properties of oil well cement slurries with temperature at w/c= 0.44.
4.6.7 Comparison of Effects of Various Admixtures on Rheology of Oil Well Cement Slurries
Rheological data were taken at 20 different shear rate levels starting from 5.11 to 511 s -1 and then
at descending shear rates from 511 to 5.11 s -1. The maximum shear rate was chosen as 511 s -1
because shear rates above this value were reported to provide inconsistent results (ANSI/API RP
10B-2, 2005). It should be noted that the data corresponding to the shear rate of 5.11 s -1 was
discarded and the Bingham plastic model was fitted between 11 to 511 s -1 to calculate yield stress
and plastic viscosity. This is because shear rate data at/or below 10.2 s -1 can be affected by
slippage at the wall of the coaxial cylindrical rheometer (Guillot, 2006) and do not provide
reproducible results (ANSI/API RP 10B-2, 2005, Guillot, 2006). Due to differences in their
chemical compositions and the mechanisms by which they act, the different chemical admixtures
led to various effects of the rheological properties of OWC slurries that influence the properties
of cement slurries.
The effects of various dosages of the different chemical admixtures explored in this study on the
rheological properties of OWC slurries at a w/c of 0.44 are presented in Figs. 4.21 to 4.23. Figure
4.21 shows yield stress and apparent viscosity values for OWC slurries incorporating PCH, LSM,
PCM, SRA, HCR and RA admixtures at temperatures of 23 oC, 45 oC, and 60 oC. Agreement
between the behaviour and trend of yield stress and apparent viscosity can be observed. An OWC
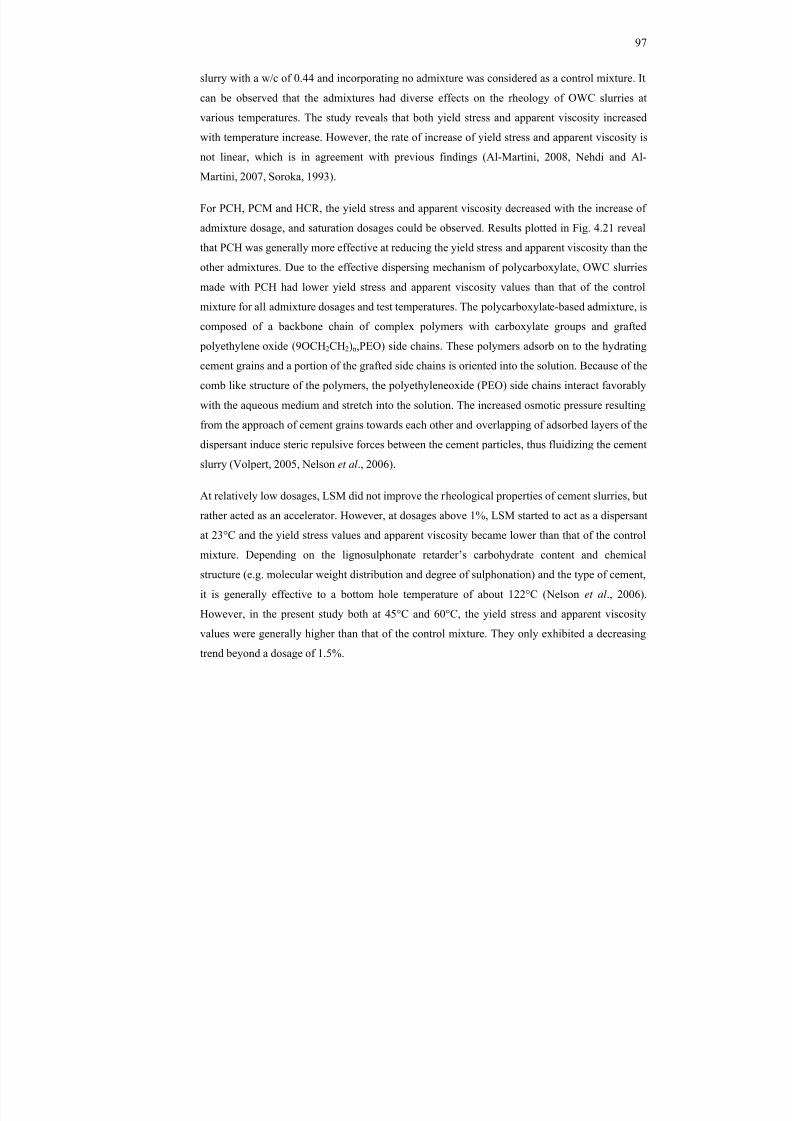
8/18/2019 Rheology of Oil Well Cement Slurries
http://slidepdf.com/reader/full/rheology-of-oil-well-cement-slurries 120/274
97
slurry with a w/c of 0.44 and incorporating no admixture was considered as a control mixture. It
can be observed that the admixtures had diverse effects on the rheology of OWC slurries at
various temperatures. The study reveals that both yield stress and apparent viscosity increased
with temperature increase. However, the rate of increase of yield stress and apparent viscosity is
not linear, which is in agreement with previous findings (Al-Martini, 2008, Nehdi and Al-
Martini, 2007, Soroka, 1993).
For PCH, PCM and HCR, the yield stress and apparent viscosity decreased with the increase of
admixture dosage, and saturation dosages could be observed. Results plotted in Fig. 4.21 reveal
that PCH was generally more effective at reducing the yield stress and apparent viscosity than the
other admixtures. Due to the effective dispersing mechanism of polycarboxylate, OWC slurries
made with PCH had lower yield stress and apparent viscosity values than that of the control
mixture for all admixture dosages and test temperatures. The polycarboxylate-based admixture, is
composed of a backbone chain of complex polymers with carboxylate groups and grafted
polyethylene oxide (9OCH 2CH 2)n,PEO) side chains. These polymers adsorb on to the hydrating
cement grains and a portion of the grafted side chains is oriented into the solution. Because of the
comb like structure of the polymers, the polyethyleneoxide (PEO) side chains interact favorably
with the aqueous medium and stretch into the solution. The increased osmotic pressure resulting
from the approach of cement grains towards each other and overlapping of adsorbed layers of the
dispersant induce steric repulsive forces between the cement particles, thus fluidizing the cement
slurry (Volpert, 2005, Nelson et al ., 2006).
At relatively low dosages, LSM did not improve the rheological properties of cement slurries, but
rather acted as an accelerator. However, at dosages above 1%, LSM started to act as a dispersant
at 23°C and the yield stress values and apparent viscosity became lower than that of the control
mixture. Depending on the lignosulphonate retarder’s carbohydrate content and chemical
structure (e.g. molecular weight distribution and degree of sulphonation) and the type of cement,
it is generally effective to a bottom hole temperature of about 122°C (Nelson et al ., 2006).
However, in the present study both at 45°C and 60°C, the yield stress and apparent viscosity
values were generally higher than that of the control mixture. They only exhibited a decreasing
trend beyond a dosage of 1.5%.
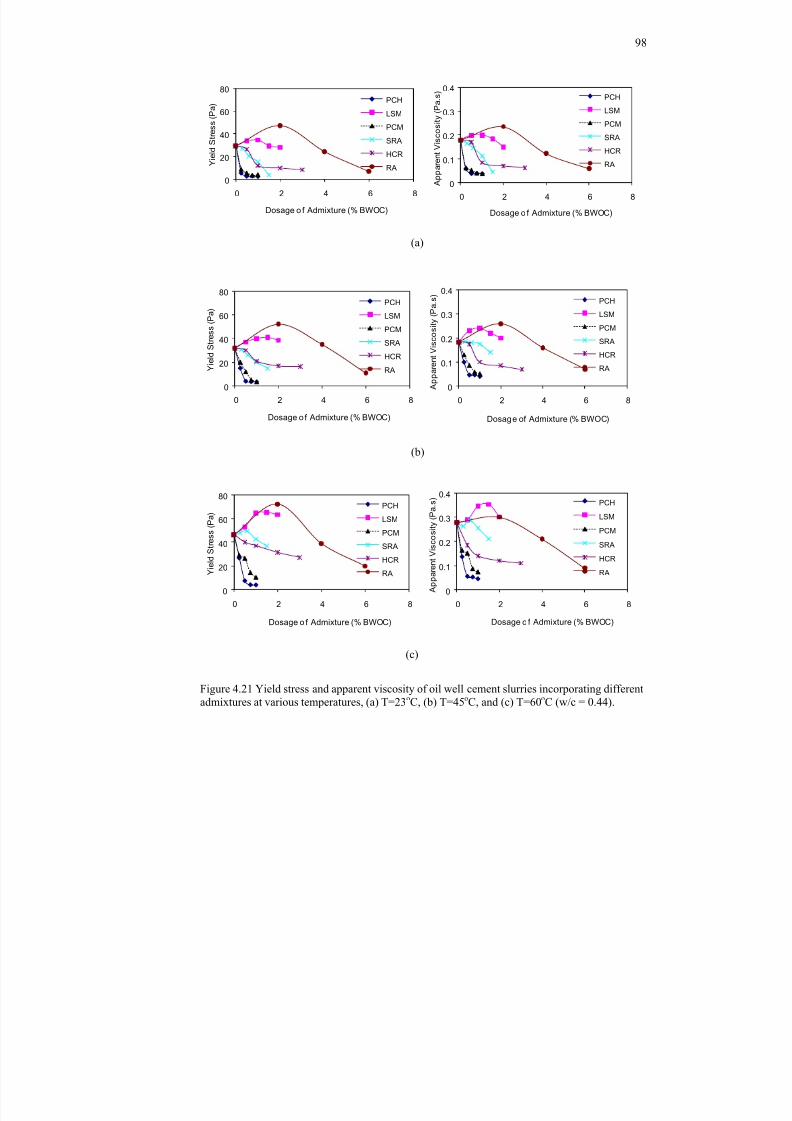
8/18/2019 Rheology of Oil Well Cement Slurries
http://slidepdf.com/reader/full/rheology-of-oil-well-cement-slurries 121/274
98
0
20
40
60
80
0 2 4 6 8
Y i e l d
S t r e s s
( P a
)
Dosage o f Admixture (% BWOC)
PCH
LSM
PCM
SRA
HCR
RA
0
0.1
0.2
0.3
0.4
0 2 4 6 8
A p p a r e n t
V i s c o s
i t y ( P a . s
)
Dosage o f Admixture (% BWOC)
PCH
LSM
PCM
SRA
HCRRA
0
20
40
60
80
0 2 4 6 8
Y i e l d S t r e s s
( P a
)
Dosage o f Admixture (% BWOC)
PCHLSM
PCM
SRA
HCR
RA
0
0.1
0.2
0.3
0.4
0 2 4 6 8
A p p a r e n
t V i s c o s
i t y ( P a . s
)
Dosage of Admixture (% BWOC)
PCHLSM
PCM
SRA
HCR
RA
0
20
40
60
80
0 2 4 6 8
Y i e l d S t r e s s
( P a
)
Dosage o f Admixture (% BWOC)
PCH
LSM
PCM
SRA
HCR
RA
0
0.1
0.2
0.3
0.4
0 2 4 6 8
A p p a r e n
t V i s c o s
i t y ( P a . s
)
Dosage o f Admixture (% BWOC)
PCH
LSM
PCM
SRA
HCR
RA
Figure 4.21 Yield stress and apparent viscosity of oil well cement slurries incorporating differentadmixtures at various temperatures, (a) T=23 oC, (b) T=45 oC, and (c) T=60 oC (w/c = 0.44).
(a)
(b)
(c)
8/18/2019 Rheology of Oil Well Cement Slurries
http://slidepdf.com/reader/full/rheology-of-oil-well-cement-slurries 122/274
99
The effects of PCM and HCR were found to be similar to that of PCH, but somewhat less
significant. At 23°C and 45°C, the yield stress and apparent viscosity started to decrease with
increasing SRA dosage. But at 60°C, both values increased slightly at SRA dosage below 0.50%.
At higher dosages, SRA effectively offset the acceleration of hydration and the yield stress and
apparent viscosity started to decrease. For the rheoplastic admixture RA, it was found that the
yield stress and apparent viscosity increased up to 2% RA and then decreased beyond that level
since RA could effectively offset the acceleration of hydration at such a high dosage. It can be
concluded that, the effect of LSM, SRA and RA on yield stress and apparent viscosity was
dosage-dependent as observed elsewhere (Ramachandran et al ., 1997).
Figure 4.22 illustrates the effects of different admixtures and temperatures (23 oC, 45 oC, and
60oC) on the 10-sec and 10-min gel strength of OWC slurries. The 10-sec and 10-min gel
strength followed a similar trend to that of yield stress and apparent viscosity. However, there
exists no simple correlation between the values of yield stress and gel strength. Depending on the
admixtures dosage and temperature, the ratio of the 10-sec gel strength to yield stress was found
to be in the range of 0.50 to 1.37, whereas the range was found to be 0.67 to 7 for the 10-min gel
strength to yield stress ratio.
Figure 4.23(a, b, and c) illustrates the effect of different admixtures on the plastic viscosity of
OWC slurries at different temperatures (23 oC, 45 oC, and 60 oC) along with that of the control
mixture. It was reported that plastic viscosity of cement slurries generally decreases with anincrease in temperature (Ravi et al ., 1990 and Ramachandran et al. , 1997). But it is not possible
to provide such a conclusion based on the current study. In order to evaluate the reproducibility
of test results, some selected tests were performed several times and the results were reproducible
within a variability of 5%. At 23°C, plastic viscosity decreased with increased admixture dosage
up to a certain level and then started to increase in the case of PCH, PCM, and RA at associated
dosages of 0.50%, 0.50% and 4.0%, respectively. Plastic viscosity gradually increased with
increased dosage in the case of LSM, whereas it decreased with increased SRA dosage. In the
case of HCR, plastic viscosity generally decreased with increased dosage. At 45°C, admixtures
showed almost similar behaviour in terms of plastic viscosity except for LSM. At 60°C, slurries
incorporating PCH did not exhibit a regular behaviour and plastic viscosity increased with
increased admixture dosage. In the case of PCM, SRA and HCR, plastic viscosity increased up to
a certain limit and then started to decrease at associated critical dosages of 0.50%, 0.75% and
0.50%, respectively. However, it was not possible to provide a simple correlation of the effect of
8/18/2019 Rheology of Oil Well Cement Slurries
http://slidepdf.com/reader/full/rheology-of-oil-well-cement-slurries 123/274
100
chemical admixtures and temperatures on the plastic viscosity based on the present study, which
was also noted previously (Nehdi and Al-Martini, 2007, Al-Martini, 2008).
0
20
40
60
80
0 2 4 6 8
1 0 s e c
G e
l S t r e n g
t h ( P a
)
Dosage o f Ad mixtures (% BWOC)
PCHLSMPCMSRAHCRRA
T=23°C
0
40
80
120
160
200
0 2 4 6 8
1 0 m
i n G e
l S t r e n g
t h ( P a
)
Dosage of Admixtures (% BWOC)
PCHLSMPCMSRAHCRRA
T=23°C
0
20
40
60
80
0 2 4 6 8
1 0 s e c
G e
l S t r e n g
t h ( P a
)
Dosage of Admixtures (% BWOC)
PCHLSMPCMSRAHCRRA
T=45°C
0
40
80
120
160
200
0 2 4 6 8
1 0 m
i n G e
l S t r e n g
t h ( P a
)
Dosage of Ad mixtures (% BWOC)
PCHLSMPCMSRAHCRRA
T=45°C
0
20
40
60
80
0 2 4 6 8
1 0 s e c
G e
l S t r e n g
t h ( P a
)
Dosage of Admixtures (% BWOC)
PCHLSMPCMSRAHCRRA
T=60°C
0
40
80
120
160
200
0 2 4 6 8
1 0 m
i n G e
l S t r e n g
t h ( P a
)
Dosage of Admixtures (% BWOC)
PCHLSMPCMSRAHCRRA
T=60°C
Figure 4.22 10-sec and 10-min gel strength of oil well cement slurries incorporating differentadmixtures at various temperatures, (a) T=23 oC, (b) T=45 oC, and (c) T=60 oC (w/c = 0.44).
(a)
(b)
(c)
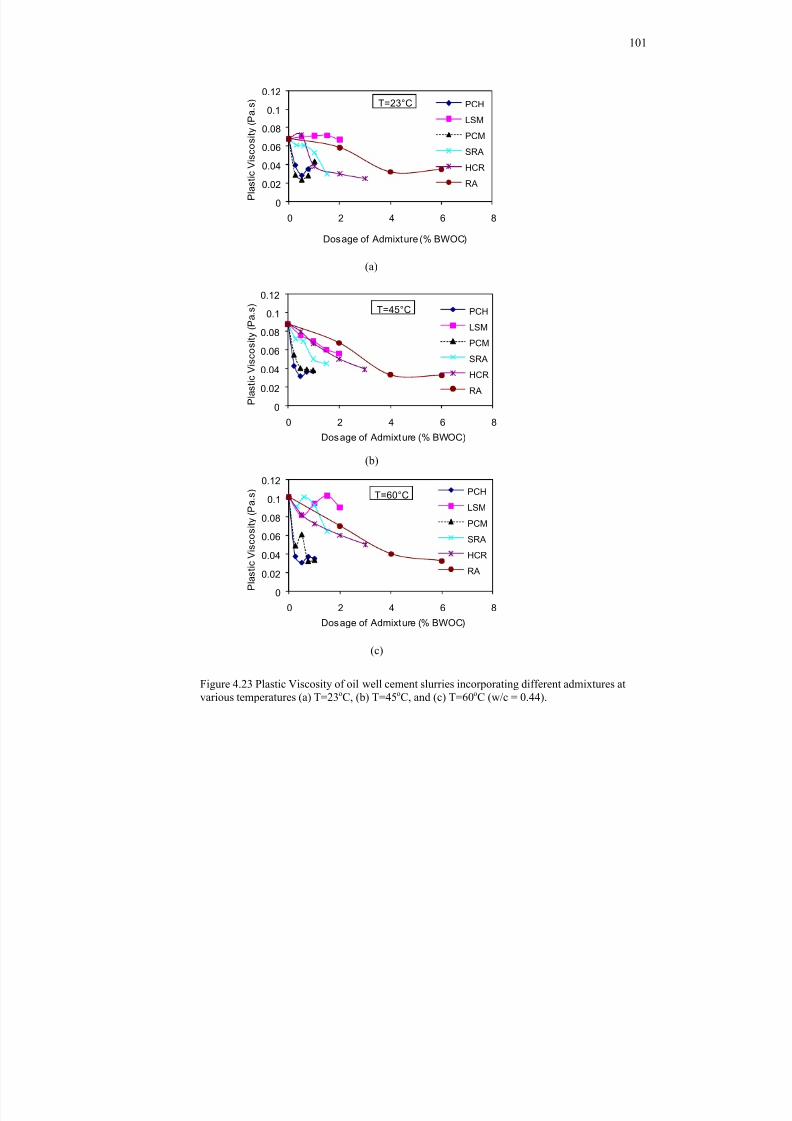
8/18/2019 Rheology of Oil Well Cement Slurries
http://slidepdf.com/reader/full/rheology-of-oil-well-cement-slurries 124/274
101
0
0.02
0.040.06
0.08
0.1
0.12
0 2 4 6 8
P l a s
t i c V i s c o s
i t y ( P a . s
)
Dosage of Admixture (% BWOC)
PCH
LSM
PCM
SRAHCR
RA
T=23°C
0
0.02
0.04
0.06
0.08
0.1
0.12
0 2 4 6 8
P l a s
t i c V i s c o s
i t y ( P a . s )
Dosage of Admixture (% BWOC)
PCH
LSM
PCM
SRA
HCR
RA
T=45°C
0
0.02
0.04
0.06
0.08
0.1
0.12
0 2 4 6 8
P l a s
t i c V i s c o s
i t y ( P a . s
)
Dosage of Admixture (% BWOC)
PCH
LSM
PCM
SRA
HCR
RA
T=60°C
Figure 4.23 Plastic Viscosity of oil well cement slurries incorporating different admixtures atvarious temperatures (a) T=23 oC, (b) T=45 oC, and (c) T=60 oC (w/c = 0.44).
(a)
(b)
(c)
8/18/2019 Rheology of Oil Well Cement Slurries
http://slidepdf.com/reader/full/rheology-of-oil-well-cement-slurries 125/274
102
Thixotropy measurements of OWC slurries showed that at lower dosage of admixtures (except
for LSM), the higher the temperature the higher was the degree of thixotropy. This is probably
because at lower dosages the admixtures are not effective enough to disperse the structures
formed as a result of the acceleration of hydration at higher temperature. Thixotropy values were
observed to decrease with increasing admixture dosage, indicating that higher dosages reduced
the degree of stiffening. Similar findings were also observed in previous work (Nehdi and Al-
Martini, 2007, Al-Martini, 2008) using ordinary Portland cement pastes.
As mentioned earlier, the rheology of OWC slurries depends on a number of factors, such as
cement hydration kinetics (Saak, 2000), supporting liquid rheology (Nelson et al ., 2006), inter-
particle forces (Saak, 2000, Nelson et al. , 2006), and solid volume fraction (Nelson et al ., 2006).
A number of chemical admixtures such as plasticizers/water reducer (dispersants), retarders,
weighting agents, extenders, etc, have been used to modify the rheological properties of OWC
slurries for proper placement in deep and narrow oil well annulus. Most water reducing
admixtures retard the cement hydration rate in addition to acting as a deflocculant due to
electrostatic repulsion (Ramachandran et al. , 1997, Saak, 2000, Nelson et al ., 2006), steric
repulsion, or both (Nelson et al ., 2006). Moreover, the performance of chemical admixtures also
depends on other factors including the type of cement and its fineness, nature and amount of
calcium sulfates and soluble alkali sulfates, C 3A content and distribution of aluminate and silicate
phases at the surface of cement grains (Vidick et al. , 1987), reactivity of cement phases (Michaux
and Nelson, 1992), time, mixing energy and mixing method, water temperature, w/c, etc.
The mechanisms by which chemical admixtures act are still a matter of controversy. It was
documented that the combined effect of adsorption and nucleation are responsible for the
hydration retardation induced by admixtures (Ramachandran et al. , 1997 and Nelson et al. ,
2006). Admixtures inhibit the contact of cement grains with water by adsorbing on to the surface
of cement grains and the hydration products throughout the hydration process and thereby delay
the hydration process. Retarders may also adsorb onto the nuclei of hydration products and can
inhibit the further hydration. But at higher temperature, this layer can break down and the rate of
hydration is accelerated. This may be one reason why LSM, SRA and RA seem to increase the
yield stress and viscosity at high temperature.
Moreover, at lower dosage the adsorbed layer of admixture might not be sufficiently effective to
act as a barrier to prevent the contact of water and cement grains, which promotes the
acceleration of hydration reactions. This could be the reason why relatively higher yield stress
8/18/2019 Rheology of Oil Well Cement Slurries
http://slidepdf.com/reader/full/rheology-of-oil-well-cement-slurries 126/274
103
and viscosity values were observed at low dosages of LSM, SRA and RA. Moreover, lower water
content reduces the space between solid particles. Hence, hydration products can easily come in
closer contact with each other, resulting in faster rate of hydration reactions and earlier stiffening.
This could probably be another reason why LSM, SRA and RA acted as accelerators up to a
certain dosage.
It was documented that a portion of the chemical admixture is consumed by the initial hydration
products if it is added in the mixing water during the pre-induction period, and thus does not
contribute effectively to reducing the slurry viscosity and yield stress (Michaux and Nelson,
1992, Hanehara and Yamada, 1999, Nelson et al , 2006). This could also have contributed to
getting increased yield stress and viscosity for slurries incorporating LSM, SRA and RA.
4.7 Conclusions
The rheological properties of OWC slurries are affected by numerous factors including the w/c,
size and shape of cement grains, chemical composition of the cement and relative distribution of
its components at the surface of grains, presence and type of additives, compatibility between
cement and chemical admixtures, mixing and testing procedures, etc. Moreover, slip at the slurry-
shearing surface interface, particle-particle interactions, chemical reactions, non-homogeneous
flow fields, and human errors can make the rheological experiments difficult to reproduce.
However, during the present tests, every effort was made to minimize experimental error bystrictly following a consistent mixing and testing procedure. The effect of the w/c and
temperature on the rheological properties of OWC slurries incorporating various chemical
admixtures was studied using an advanced rheometer. Six admixtures were used in this study
including a new generation polycarboxylate-based high-range water reducing admixture (PCH),
lignosulphonate-based mid-range water reducing admixture (LSM), polycarboxylate-based mid-
range water reducing admixture (PCM), phosphonate-based set retarding admixture (SRA),
hydroxylated carboxylic acid-based retarding admixture (HCR), and a rheoplastic solid
admixture (RA). The coupled effects of the temperature and type and dosage of admixture onyield stress, plastic viscosity, apparent viscosity, and gel strength were studied. Based on the
experimental results, the following conclusions can be drawn:
The rheological properties of OWC slurries are highly dependent on temperature; they
generally increased nonlinearly with temperature increase. This is mainly due to the
dependence of the formation of hydration products on temperature.
8/18/2019 Rheology of Oil Well Cement Slurries
http://slidepdf.com/reader/full/rheology-of-oil-well-cement-slurries 127/274
104
As expected, the viscosity of OWC slurries decreased significantly with the increase of the
w/c.
The rheological properties of OWC slurries depended on the type of admixture used. PCH,
PCM, and HCR improved fluidity at all test temperatures and for all dosages used, whileslurries incorporating LSM required more energy to initiate slurry flow since the yield stress
increased at all dosages tested.
The admixture dosage had a significant effect on the slurry rheology. At lower dosages
LSM, SRA and RA acted as accelerators, thus enhancing the thixotropic behaviour of OWC
slurries. This was more pronounced at higher temperature. However, beyond certain
threshold dosages, such admixtures became effective dispersants and reduced the extent of
cement slurry thixotropy.
PCH was found to be more effective at improving the rheological properties of OWC
slurries at all test temperatures even at relatively lower dosages compared to the other
admixtures tested.
It should be noted that the findings reported in this study are valid for the cement and admixtures
used herein. Other cement/admixture combinations can exhibit different characteristics. Even
admixtures from the same category could behave differently, and thus need to be investigated
separately.
4.8 References
Al-Martini, S. (2008) Investigation on Rheology of Cement Paste and Concrete at High
Temperature. PhD Thesis ., The University of Western Ontario, 353 p.
ANSI/API RP 10B-2. (2005). Recommended Practice for Testing Well Cements, First Edition,
July 2005, 171 p.
API Specification 10A (2002). Specifications for cementing and materials for well cementing ,
April 2002. 23 rd Edition. 58pp.
Eirich, R. F. (ed.). Rheology Theory and Applications . Academic Press, New York and London,
1960, pp. 205-248.
Ferguson, J., and Kenblowski, Z. (ed.). Applied Fluid Rheology. Elsevier Applied Science,
London and New York, 1991, pp. 209-210.
8/18/2019 Rheology of Oil Well Cement Slurries
http://slidepdf.com/reader/full/rheology-of-oil-well-cement-slurries 128/274
105
Guillot, D. Rheology of Well Cement Slurries. in Well Cementing, (E.B. Nelson and Guillot, D.
(ed.)). Schlumberger, Texas, 2006, pp. 93-142.
Hanehara, S., and Yamada, K. (1999). Interaction between Cement and Chemical Admixtures
from the Point of Cement Hydration, Adsorption Behaviour of Admixtures and Paste
Rheology. Cement and Concrete Research , 29 , No. 8, 1159-1165.
Kellingray, D.S., Greaves, C., and Dallimer, R.P. (1990). High Temperature and High Pressure
Rheology of Oil Well Cement Slurries. Proceedings of the International Conference on
Rheology of Fresh Cement and Concrete , British Society of Rheology, Liverpool, March
26-29, 1990, pp. 159-169.
Lafarge. (2010). Oil well cements: Quality and consistency for over 50 years, see
http://www.lafargecorp.com/wps/wcm/resources/file/ebe2760b4c01402/Oil%20Well%20
Cements%20-%20PBOWCE.pdf, accessed 17/05/2010.
Michaux, M., and Nelson, E.B. (1992). Flash-Set Behaviour of Oil Well Cement Slurries
Containing Lignosulphonates. Proceedings of the 9 th International Congress on the
Chemistry of Cement, New Delhi, Vol. 4, 1992, pp. 584-590.
Nehdi, M., and Rahman, M.A. (2004). Estimating Rheological Properties of Cement Pastes
Using Various Rheological Models for Different Test Geometry, Gap and Surface
Friction. Cement and Concrete Research , 34 , No. 11, 1993-2007.
Nehdi, M. and Al-Martini, S. (2007). Effect of Chemical Admixtures on Rheology of Cement
Pastes at High Temperature. Journal of ASTM International , 4, No. 3, 17 p.
Nelson, E.B., Michaux, M., and Drochon, B. Chemistry and Characterization of Portland Cement
in Well Cementing, (E.B. Nelson and Guillot, D. (ed.)). Schlumberger, Texas, 2006, pp.
23-48.
Orban, J., Parcevaux, P., Guillot, D. (1986) Influence of Shear History on the Rheological
Properties of Oil Well Cement Slurries. Proceedings of the 8 th International Congress on
Chemistry of Cement , Rio de Janeiro Vol. 6, Abla Gráfica Editora, Rio de Janiero,
Brazil , pp. 243 − 247.
Ramachandran, V.S., Malhotra, V.M., Jolicoeur, C., and Spiratos, N. (1997). Superplasticizers:
Properties and Applications in Concrete . Materials Technology Laboratory, CANMET,
Natural Resources Canada. Ottawa, Ontario, pp. 43-150.
8/18/2019 Rheology of Oil Well Cement Slurries
http://slidepdf.com/reader/full/rheology-of-oil-well-cement-slurries 129/274
106
Ravi, K.M. and Sutton, D.L. (1990). New Rheological Correlation for Cement Slurries as a
Function of Temperature. SPE 20499, Proceedings of the 65 th Annual Technical
Conference and Exhibition of the Society of Petroleum Engineers , New Orleans, LA,
September 23-26, published by Society of Petroleum Engineers of AIME,
Richardson, TX, United States , pp. 455-462.
Saak, W.A. (2000). Characterization and Modeling of the Rheology of Cement Paste: With
Application Toward Self-Flowing Materials. Ph.D. Thesis , University of Northwestern,
Evanston, Illinois, USA, 283p.
Saak, W. A., Jennings, M. H., and Shah, P. S. (2001). The influence of wall slip on yield
stress and viscoelastic measurements of cement paste. Cement and Concrete
Research , Vol. 31, n. 2, pp. 205–212.
Soroka, I. (1993). Concrete in Hot Environments. E & FN Spon, London, 1993, 243 p.
Vidick, B., Oberste-Padtberg, R., Rondelez, F. (1987). Selective Surface Determination of the
Silicate Phases in Portland Cement Powders Using Alkyltrichlorosilane. Cement and
Concrete Research , 17 , No. 4, 1987, 624-632.
Volpert, E., Cementing Compositions Including a Dispersant Agent for Cementing Operation in
Oil Wells , US Patent 6953091, 2005.
Yahia, A., and Khayat, K.H (2001). Analytical Models for Estimating Yield Stress of High
Performance Pseudoplastic Grout. Cement and Concrete Research , 31 , No. 5, 2001, 731-
738.
8/18/2019 Rheology of Oil Well Cement Slurries
http://slidepdf.com/reader/full/rheology-of-oil-well-cement-slurries 130/274
107
C h a p t e r 5
EFFECT OF SUPPLEMENTARY CEMENTITIOUS MATERIALSON RHEOLOGY OF OIL WELL CEMENT SLURRIES *
5.1 Introduction
The use of supplementary cementitious materials (SCMs) has received increased attentionover the last few decades. Mineral and chemical admixtures play an important role incontrolling the physical and chemical properties of fresh and hardened cementitioussystems. Partial replacement of cement using SCMs is increasingly perceived as asustainable solution. It reduces the cement factor thus reducing CO2 emission fromcement production, and mitigates disposal of various industrial by products. A largenumber of industrial and naturally occurring materials including fly ash, volcanic ash,ground granulated blast furnace slag, silica fume, Zeolite, diatomaceous earth, metal powder, and rice husk ash can be used as partial replacement for cement.
Due to differences in their chemical and physical properties, SCMs have diverse effectson the rheological, mechanical and long-term durability performance of cementitious
systems. For the particular case of the petroleum industry, cement slurries are pumped toseveral thousand meters into the ground to anchor and seal the casing to the borehole ofoil or gas wells. Thus, an advanced characterization of the rheology of oil well cementslurries is critical. However, the investigation of oil well cement slurry rheology is morecomplicated than that of cement paste. In order to contend with the bottom-holeconditions (wide range of pressure and temperature), various additives are usually used inthe slurry composition. A thorough review of the different types of admixtures used in the petroleum industry and the rheology of oil well cement is available in the open literature
(Nelson et al., 2006; Guillot 2006).
A number of studies (e.g. Janotka et al., 2010; Golaszewski et al., 2005; Vikan andJustnes, 2003; Sabir et al., 2001; Zhang and Han, 2000; Sybert and Reick 1990; Ivanovand Roshavelov, 1990; Saasen and Log, 1996; White et al., 1985) used supplementary
* Part of this chapter has been published in the proceeding of the Canadian Society of Civil EngineeringConference, 2008.
8/18/2019 Rheology of Oil Well Cement Slurries
http://slidepdf.com/reader/full/rheology-of-oil-well-cement-slurries 131/274
108
cementitious materials (FA, SF, MK and RHA) either in conventional portland cement paste or slurries. However, very scant information can be found on the rheological properties of oil well cement slurries incorporating SCMs as partial replacement for
cement. Moreover, the coupled effects of temperature, chemical admixtures and mineraladmixtures on the rheological properties of oil well cement slurries remain largelyunexplored.
In this study, the flow properties of Class G oil well cement slurries with a water tocement ratio (w/c) of 0.44 and incorporating four different SCMs including metakaolin(MK), silica fume (SF), rice husk ash (RHA), and class F fly ash (FA) along with a newgeneration polycarboxylate-based high-range water reducing admixture (PCH) were
tested at different temperatures (23, 45 and 60°C). Their behaviour was compared to thatof a control slurry without admixtures. A series of flow tests using an advanced rheometerwere carried out to determine the optimum dosage of admixtures. The effect of pressurehas been ignored in this study since previous research (Guillot, 2006) indicated that it hasan insignificant effect on the rheological properties of cement slurries compared to that oftemperature.
The present study allowed gaining an improved understanding of the effect of SCMs onthe rheology of oil well cement slurries at high temperature, which should help inselecting adequate admixtures and their effective dosages to overcome difficultiesencountered during the construction of oil and gas wells.
5.2 Principles of Flow Properties
Rheological properties control the flow, workability, pumpability, finishing, and othercharacteristics of cementitious slurries and mortar. Workability is the energy required tohandle and finish a cementitious mixture, whereas pumpabiliy is better represented by
fundamental properties such as yield stress. The rheological properties of cement-basedmaterials are not only shear rate and shear history dependent, but also time dependent,which is difficult to characterize. However, for practical oilfield purposes, cement slurriesare usually represented by time-independent models. It has been observed that it isdifficult to capture all possible trends of flow behaviour using a single rheological model(Yahia and Khayat, 2001). The performance of rheological models usually varies with the
8/18/2019 Rheology of Oil Well Cement Slurries
http://slidepdf.com/reader/full/rheology-of-oil-well-cement-slurries 132/274
109
test geometries, gap between shearing surfaces and their friction capacity, which makesthe measurements even more complicated (Nehdi and Rahman, 2004).
Existing empirical and time-independent rheological models (e.g. Bingham, Herschel-Bulckley, Modified Bingham, Casson, etc.) allow fitting shear stress, shear rate andviscosity data to specific trends using rheological data analysis software. However, nomodel is free from statistical error. The estimated rheological properties can varysignificantly when calculated using various models (Nehdi and Rahman, 2004). TheBingham plastic model and the Power Law model are widely used in the petroleumindustry to describe the rheological properties of cement slurries (Guillot, 2006). The
Bingham plastic model includes both yield stress, y and a limiting viscosity, P at finite
shear rates, which the Power Law model fails to consider. Therefore, the Bingham plasticmodel (equation 5.1) was used in this study to calculate the yield stress and plasticviscosity from the shear rate-shear stress experimental down-curve. The down-curve(unloading) does not usually follow the same path as that of the up-curve because of thestructural breakdown of the cement paste/slurry with the increase of shear rate. However,it was argued that the down-curve better fits the Bingham model than the up-curve(Ferguson and Kenblowski, 1991)
P0 (5.1)
where, , 0 , P , and represent the shear stress, yield stress, plastic viscosity, and shear
rate, respectively.
To characterize the rheology of cement slurry, rheological parameters such as the yieldstress, apparent viscosity, plastic viscosity, shear thinning, or shear thickening behaviourneed to be studied. The yield stress indicates the minimum effort needed for a material to
start moving and is the intercept of the flow curve (shear stress vs. shear rate) with theshear stress axis. Below the yield stress, a material behaves like a solid. The plasticviscosity is the slope of the fitted straight line of the flow curve. Usually the plasticviscosity of cement slurry is evaluated using the linear portion of the down curve of thehystersis loop. For a nonlinear flow curve, shear-thinning or shear-thickening behaviourmay be observed and the assumption of constant plastic viscosity is not valid. In suchcase, Herschel-Bulkley’s model (equation 5.2) becomes more suitable.
8/18/2019 Rheology of Oil Well Cement Slurries
http://slidepdf.com/reader/full/rheology-of-oil-well-cement-slurries 133/274
110
.
0nk (5.2)
where, ,0 , k , and n represent the shear stress, yield stress, consistency, shear rate,
and power law exponent, respectively. The model assumes that below the yield stress
( 0 ), the slurry behaves as a rigid solid, similar to the Bingham plastic model. The
exponentn describes the shear thinning and shear thickening behaviour. Cement pastes orslurries are considered as shear thinning whenn<1 and shear thickening when n>1. Afluid becomes shear thinning when the apparent viscosity decreases with the increase inshear rate, i.e. when the slope of the shear stress vs. shear rate flow curve decreases withthe shear rate. Shear thickening is when viscosity of the cement slurry increases with the
shear rate.
5.3 Materials
Cement slurries tested in this study had a w/c = 0.44 and were prepared using a highsulphate resistant API Class G oil well cement (OWC) with various dosages of SCMsincluding metakaolin (MK), silica fume (SF), rice husk ash (RHA) and Class F fly ash(FA). The chemical and physical properties of the cement and SCMs are summarized inTable 5.1. Deionized distilled water was used for the mixing, and its temperature wasmaintained at 23±1°C using an isothermal container. The mixture composition of theslurries are provided in Table 5.2. A new generation polycarboxylate-based high-rangewater reducing (HRWR) admixture (PCH) meeting ASTM C 494 requirements as a Type-A water-reducing and Type-F high-range water-reducing admixture was used at dosagesfrom 0.25 % to 2.5% by mass of binder for MK, SF, RHA, and FA.
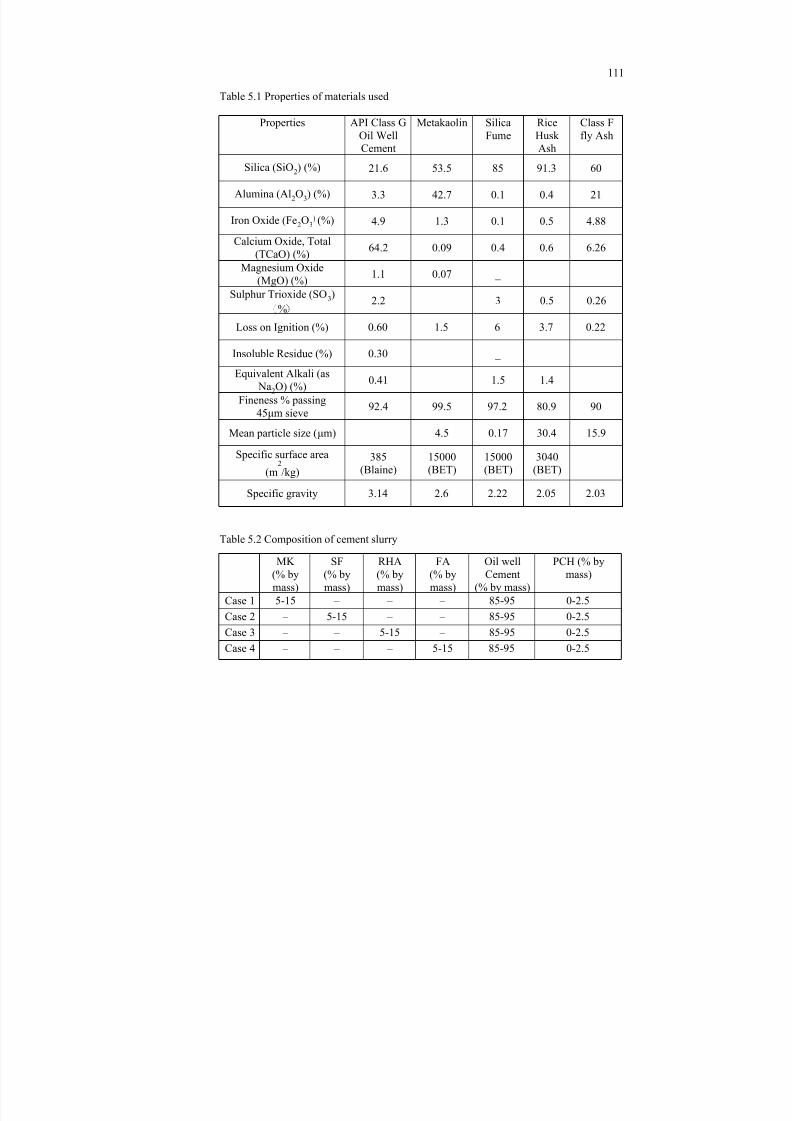
8/18/2019 Rheology of Oil Well Cement Slurries
http://slidepdf.com/reader/full/rheology-of-oil-well-cement-slurries 134/274
111
Table 5.1 Properties of materials used
Properties API Class GOil Well
Cement
Metakaolin SilicaFume
RiceHusk
Ash
Class Ffly Ash
Silica (SiO2) (%) 21.6 53.5 85 91.3 60
Alumina (Al2O3) (%) 3.3 42.7 0.1 0.4 21
Iron Oxide (Fe2O3) (%) 4.9 1.3 0.1 0.5 4.88
Calcium Oxide, Total(TCaO) (%) 64.2 0.09 0.4 0.6 6.26
Magnesium Oxide(MgO) (%) 1.1 0.07 _
Sulphur Trioxide (SO3)% 2.2 3 0.5 0.26
Loss on Ignition (%) 0.60 1.5 6 3.7 0.22
Insoluble Residue (%) 0.30 _
Equivalent Alkali (as Na2O) (%) 0.41 1.5 1.4
Fineness % passing45μm sieve 92.4 99.5 97.2 80.9 90
Mean particle size (μm) 4.5 0.17 30.4 15.9
Specific surface area(m
2/kg)
385(Blaine)
15000(BET)
15000(BET)
3040(BET)
Specific gravity 3.14 2.6 2.22 2.05 2.03
Table 5.2 Composition of cement slurry
MK(% bymass)
SF(% bymass)
RHA(% bymass)
FA(% bymass)
Oil wellCement
(% by mass)
PCH (% bymass)
Case 1 5-15 – – – 85-95 0-2.5Case 2 – 5-15 – – 85-95 0-2.5Case 3 – – 5-15 – 85-95 0-2.5Case 4 – – – 5-15 85-95 0-2.5
8/18/2019 Rheology of Oil Well Cement Slurries
http://slidepdf.com/reader/full/rheology-of-oil-well-cement-slurries 135/274
112
5.4 Apparatus
The particle size distribution of the cement, SF, MK, RHA and FA was determined using
a Malvern Mastersizer 2000 laser diffraction particle size analyzer. The cement slurry preparation is very important because of the influence of the shear history of the mixtureon its rheological properties (Orbanet al. , 1986). The cement slurries were prepared usinga variable speed high-shear blender type mixer with bottom drive blades as recommended by the ANSI/API Recommended Practice 10B-2 (ANSI/API RP 10B-2, 2005).
A high accuracy advanced rheometer (TA instruments AR 2000) (Fig. 4.1(a)), capable ofcontinuous shear rate sweep, stress sweep and strain sweep was used throughout thisstudy to measure the rheological properties of cement slurries. Because of relatively thelow viscosity of cement slurries, the coaxial concentric cylinder geometry was consideredsuitable for this study. The geometry consists of a cylinder with a conical end that rotatesinside a cylinder with a central fixed hollow as shown in Fig. 4.1(b). The radius of theinner solid smooth cylinder is 14 mm. This smooth inner solid cylinder rotates inside afixed hollow cylinder of 15 mm in diameter. The gap between the head of the conical endand the bottom of the hollow cylinder was set to 0.5 mm for all experiments. Such anarrow gap is necessary in order to maintain a constant shear rate across the gap tominimize the error caused by wall slip in rheological measurements (Saak et al., 2001).The rheometer features an auto gap in order to compensate for the expansion of thestainless steel of the coaxial concentric cylinders under a wide range of temperatures, thuskeeping the gap constant during experiments. The device keeps the temperature constantduring the entire time span of the rheological test through a water circulation system. Inorder to prevent evaporation from the tested cement slurry, a solvent trap was used tocover the top of the hollow cylinder. This solvent trap has an adequate mechanism toallow rotation of the shaft without any interference.
The rheometer was calibrated using a certified standard Newtonian oil with a knownviscosity of 1.0 Pa.s and yield stress of 0 Pa at 20°C. The measured yield stress was 0 Paand viscosity was 1.009 Pa.s with an error of 0.9%, which is less than the tolerated errorof 4% specified by the manufacturer. The rheometer is computer controlled and equippedwith a rheological data analysis software, which can fit the shear stress-strain rate data toseveral rheological models. The Bingham and Herschel-Bulkley’s models were usedthroughout this study to calculate the rheological properties of cement slurries.
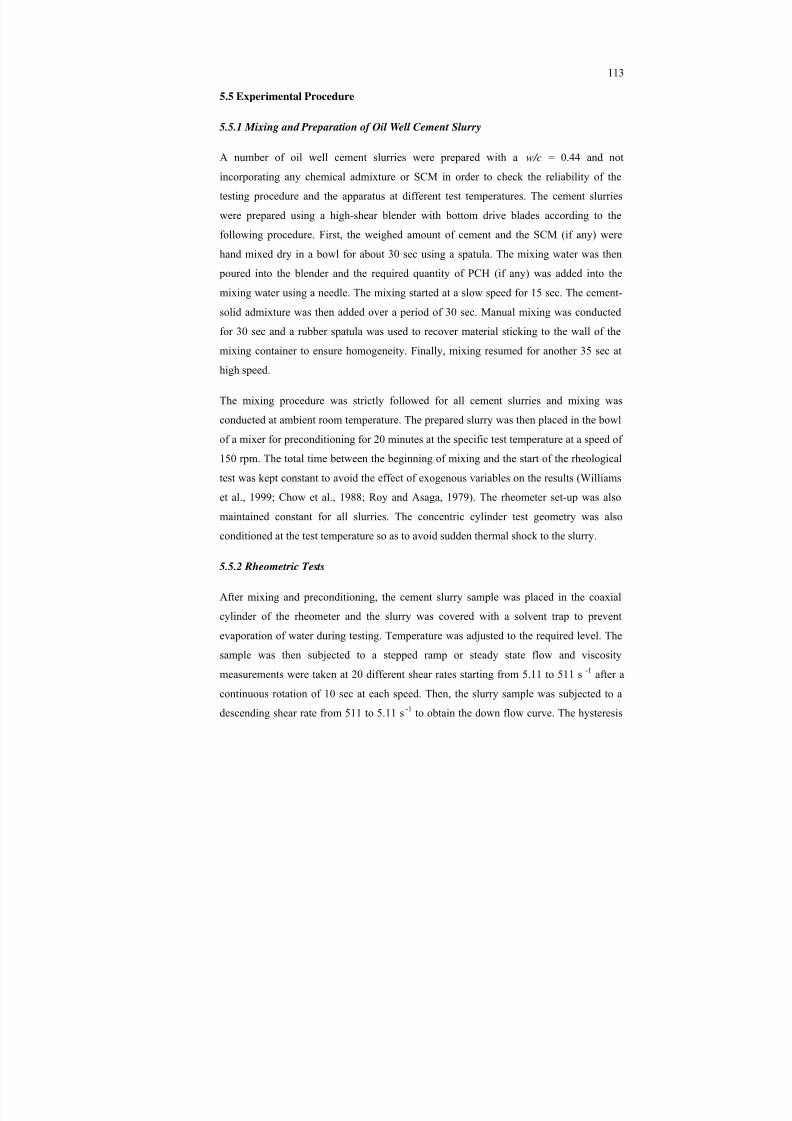
8/18/2019 Rheology of Oil Well Cement Slurries
http://slidepdf.com/reader/full/rheology-of-oil-well-cement-slurries 136/274
113
5.5 Experimental Procedure
5.5.1 Mixing and Preparation of Oil Well Cement Slurry
A number of oil well cement slurries were prepared with aw/c = 0.44 and notincorporating any chemical admixture or SCM in order to check the reliability of thetesting procedure and the apparatus at different test temperatures. The cement slurrieswere prepared using a high-shear blender with bottom drive blades according to thefollowing procedure. First, the weighed amount of cement and the SCM (if any) werehand mixed dry in a bowl for about 30 sec using a spatula. The mixing water was then poured into the blender and the required quantity of PCH (if any) was added into themixing water using a needle. The mixing started at a slow speed for 15 sec. The cement-solid admixture was then added over a period of 30 sec. Manual mixing was conductedfor 30 sec and a rubber spatula was used to recover material sticking to the wall of themixing container to ensure homogeneity. Finally, mixing resumed for another 35 sec athigh speed.
The mixing procedure was strictly followed for all cement slurries and mixing wasconducted at ambient room temperature. The prepared slurry was then placed in the bowlof a mixer for preconditioning for 20 minutes at the specific test temperature at a speed of
150 rpm. The total time between the beginning of mixing and the start of the rheologicaltest was kept constant to avoid the effect of exogenous variables on the results (Williamset al., 1999; Chow et al., 1988; Roy and Asaga, 1979). The rheometer set-up was alsomaintained constant for all slurries. The concentric cylinder test geometry was alsoconditioned at the test temperature so as to avoid sudden thermal shock to the slurry.
5.5.2 Rheometric Tests
After mixing and preconditioning, the cement slurry sample was placed in the coaxialcylinder of the rheometer and the slurry was covered with a solvent trap to preventevaporation of water during testing. Temperature was adjusted to the required level. Thesample was then subjected to a stepped ramp or steady state flow and viscositymeasurements were taken at 20 different shear rates starting from 5.11 to 511 s-1 after acontinuous rotation of 10 sec at each speed. Then, the slurry sample was subjected to adescending shear rate from 511 to 5.11 s-1 to obtain the down flow curve. The hysteresis
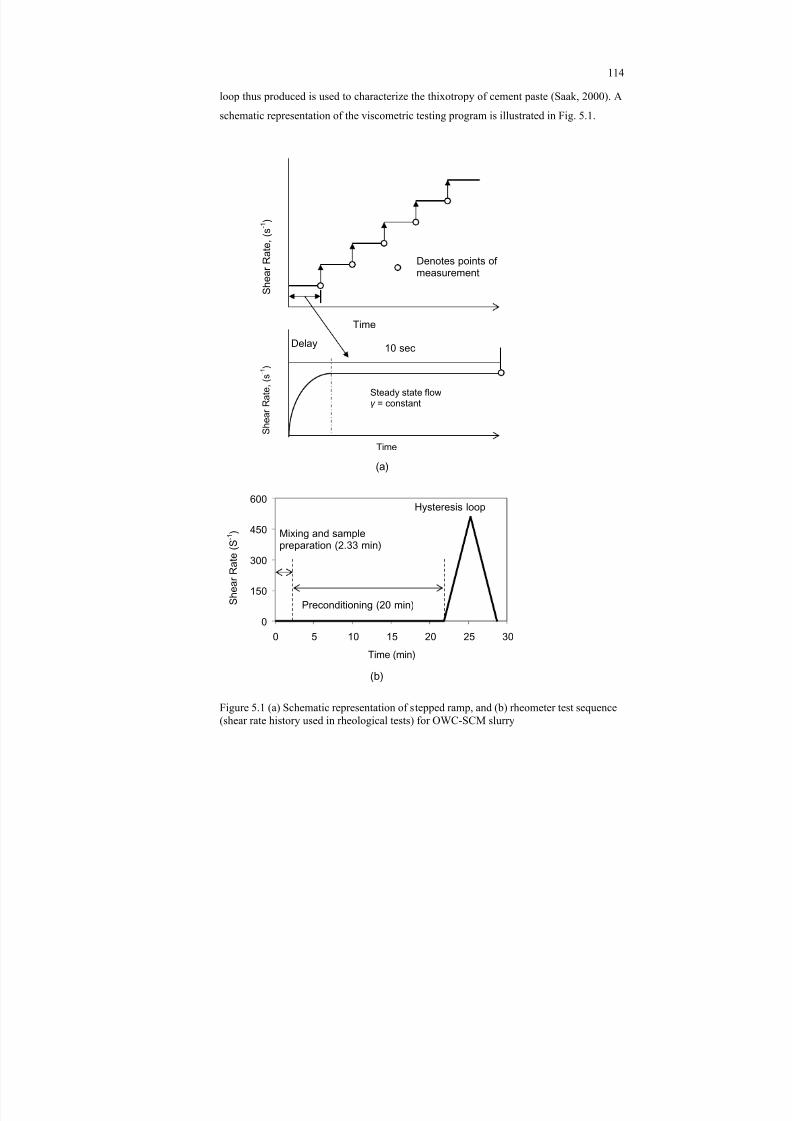
8/18/2019 Rheology of Oil Well Cement Slurries
http://slidepdf.com/reader/full/rheology-of-oil-well-cement-slurries 137/274
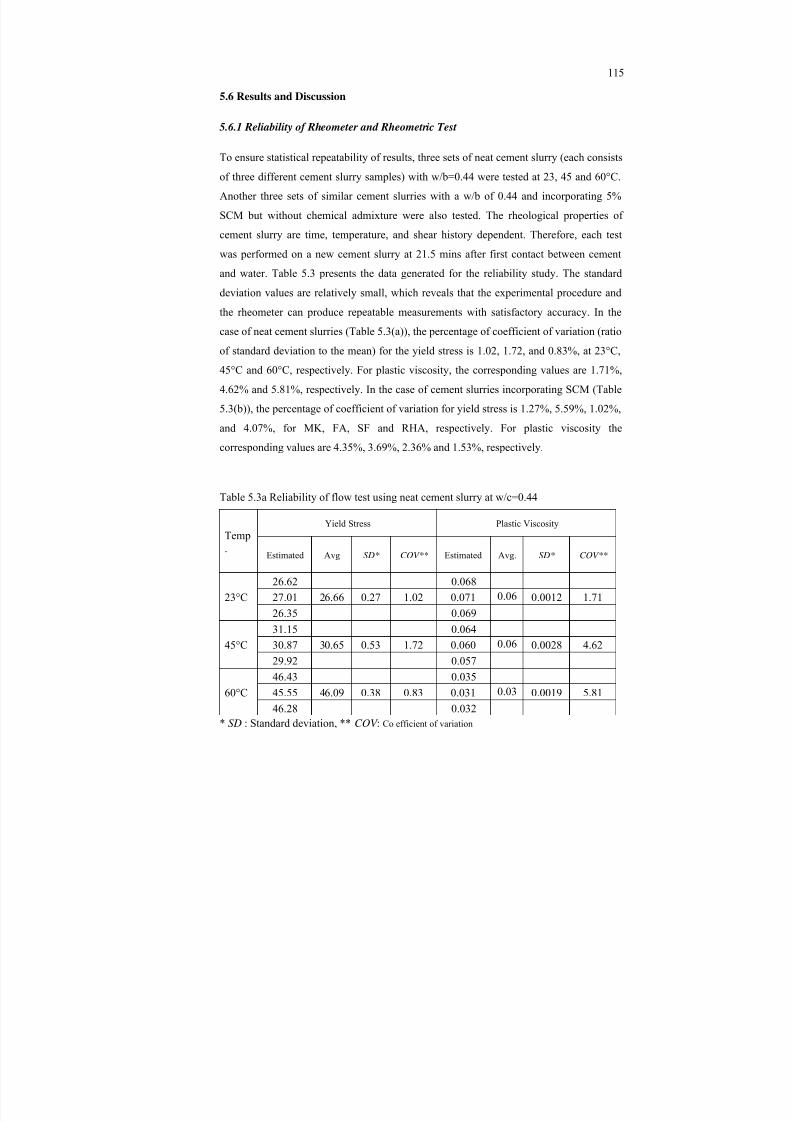
8/18/2019 Rheology of Oil Well Cement Slurries
http://slidepdf.com/reader/full/rheology-of-oil-well-cement-slurries 138/274
115
5.6 Results and Discussion
5.6.1 Reliability of Rheometer and Rheometric Test
To ensure statistical repeatability of results, three sets of neat cement slurry (each consistsof three different cement slurry samples) with w/b=0.44 were tested at 23, 45 and 60°C.Another three sets of similar cement slurries with a w/b of 0.44 and incorporating 5%SCM but without chemical admixture were also tested. The rheological properties ofcement slurry are time, temperature, and shear history dependent. Therefore, each testwas performed on a new cement slurry at 21.5 mins after first contact between cementand water. Table 5.3 presents the data generated for the reliability study. The standarddeviation values are relatively small, which reveals that the experimental procedure andthe rheometer can produce repeatable measurements with satisfactory accuracy. In thecase of neat cement slurries (Table 5.3(a)), the percentage of coefficient of variation (ratioof standard deviation to the mean) for the yield stress is 1.02, 1.72, and 0.83%, at 23°C,45°C and 60°C, respectively. For plastic viscosity, the corresponding values are 1.71%,4.62% and 5.81%, respectively. In the case of cement slurries incorporating SCM (Table5.3(b)), the percentage of coefficient of variation for yield stress is 1.27%, 5.59%, 1.02%,and 4.07%, for MK, FA, SF and RHA, respectively. For plastic viscosity thecorresponding values are 4.35%, 3.69%, 2.36% and 1.53%, respectively.
Table 5.3a Reliability of flow test using neat cement slurry at w/c=0.44
Temp.
Yield Stress Plastic Viscosity
Estimated Avg SD* COV** Estimated Avg. SD* COV**
23°C26.62 0.06827.01 26.66 0.27 1.02 0.071 0.06 0.0012 1.7126.35 0.069
45°C31.15 0.06430.87 30.65 0.53 1.72 0.060 0.06 0.0028 4.6229.92 0.057
60°C46.43 0.03545.55 46.09 0.38 0.83 0.031 0.03 0.0019 5.8146.28 0.032
* SD : Standard deviation, **COV : Co efficient of variation
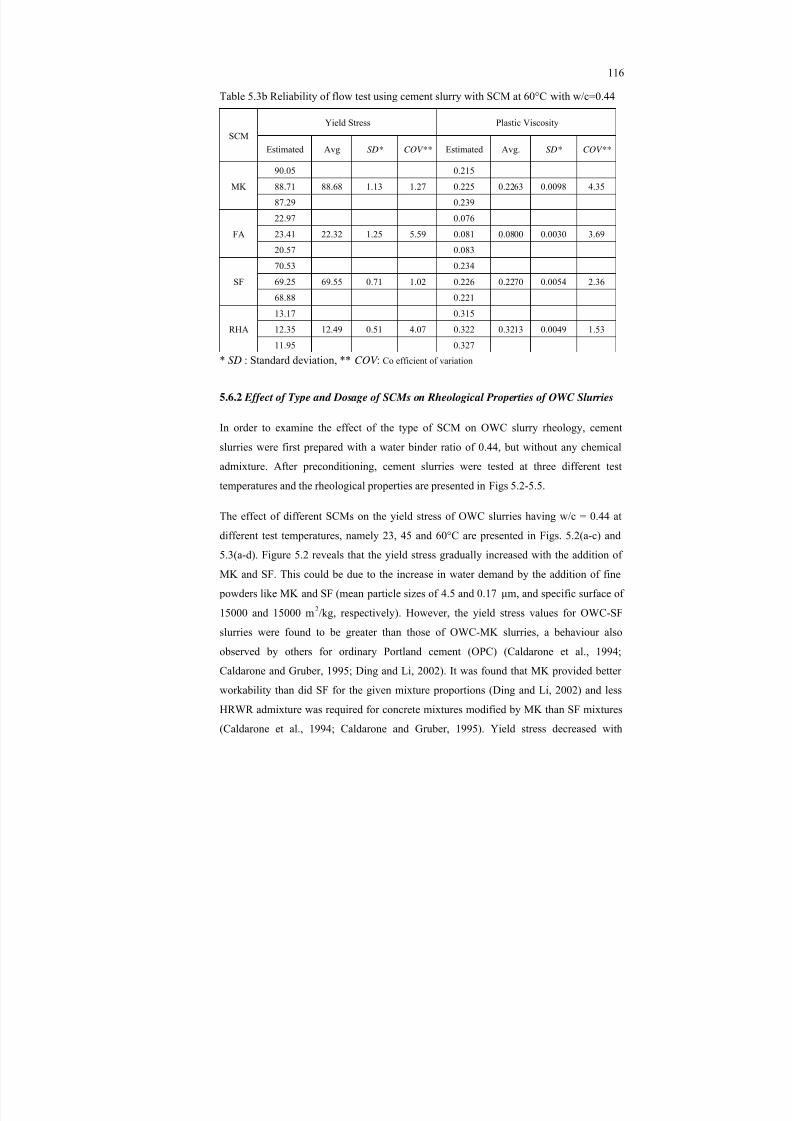
8/18/2019 Rheology of Oil Well Cement Slurries
http://slidepdf.com/reader/full/rheology-of-oil-well-cement-slurries 139/274
116
Table 5.3b Reliability of flow test using cement slurry with SCM at 60°C with w/c=0.44
SCMYield Stress Plastic Viscosity
Estimated Avg SD* COV** Estimated Avg. SD* COV**
MK90.05 0.21588.71 88.68 1.13 1.27 0.225 0.2263 0.0098 4.3587.29 0.239
FA22.97 0.07623.41 22.32 1.25 5.59 0.081 0.0800 0.0030 3.6920.57 0.083
SF70.53 0.23469.25 69.55 0.71 1.02 0.226 0.2270 0.0054 2.3668.88 0.221
RHA13.17 0.31512.35 12.49 0.51 4.07 0.322 0.3213 0.0049 1.5311.95 0.327
* SD : Standard deviation, **COV : Co efficient of variation
5.6.2 Effect of Type and Dosage of SCMs on Rheological Properties of OWC Slurries
In order to examine the effect of the type of SCM on OWC slurry rheology, cementslurries were first prepared with a water binder ratio of 0.44, but without any chemicaladmixture. After preconditioning, cement slurries were tested at three different testtemperatures and the rheological properties are presented in Figs 5.2-5.5.
The effect of different SCMs on the yield stress of OWC slurries having w/c = 0.44 atdifferent test temperatures, namely 23, 45 and 60°C are presented in Figs. 5.2(a-c) and5.3(a-d). Figure 5.2 reveals that the yield stress gradually increased with the addition ofMK and SF. This could be due to the increase in water demand by the addition of fine powders like MK and SF (mean particle sizes of 4.5 and 0.17μm, and specific surface of15000 and 15000 m2/kg, respectively). However, the yield stress values for OWC-SFslurries were found to be greater than those of OWC-MK slurries, a behaviour alsoobserved by others for ordinary Portland cement (OPC) (Caldarone et al., 1994;Caldarone and Gruber, 1995; Ding and Li, 2002). It was found that MK provided betterworkability than did SF for the given mixture proportions (Ding and Li, 2002) and lessHRWR admixture was required for concrete mixtures modified by MK than SF mixtures(Caldarone et al., 1994; Caldarone and Gruber, 1995). Yield stress decreased with
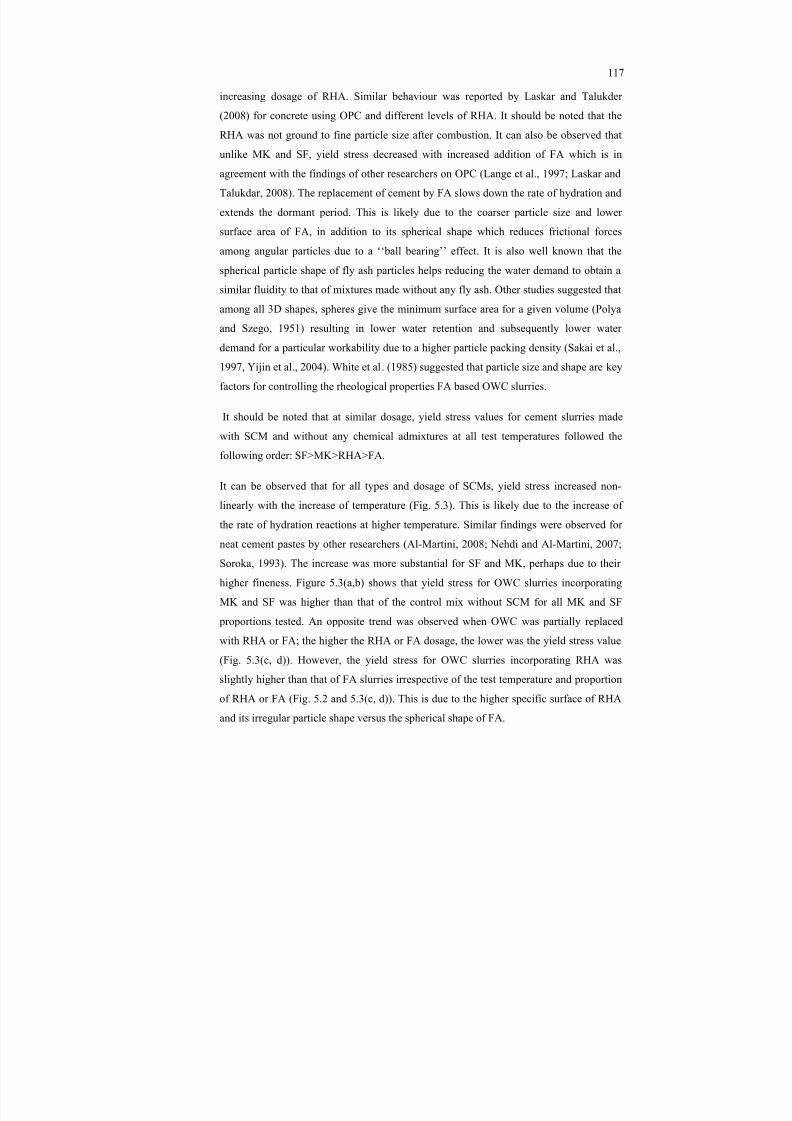
8/18/2019 Rheology of Oil Well Cement Slurries
http://slidepdf.com/reader/full/rheology-of-oil-well-cement-slurries 140/274
117
increasing dosage of RHA. Similar behaviour was reported by Laskar and Talukder(2008) for concrete using OPC and different levels of RHA. It should be noted that theRHA was not ground to fine particle size after combustion. It can also be observed that
unlike MK and SF, yield stress decreased with increased addition of FA which is inagreement with the findings of other researchers on OPC (Lange et al., 1997; Laskar andTalukdar, 2008). The replacement of cement by FA slows down the rate of hydration andextends the dormant period. This is likely due to the coarser particle size and lowersurface area of FA, in addition to its spherical shape which reduces frictional forcesamong angular particles due to a ‘‘ball bearing’’ effect. It is also well known that thespherical particle shape of fly ash particles helps reducing the water demand to obtain asimilar fluidity to that of mixtures made without any fly ash. Other studies suggested that
among all 3D shapes, spheres give the minimum surface area for a given volume (Polyaand Szego, 1951) resulting in lower water retention and subsequently lower waterdemand for a particular workability due to a higher particle packing density (Sakai et al.,1997, Yijin et al., 2004). White et al. (1985) suggested that particle size and shape are keyfactors for controlling the rheological properties FA based OWC slurries.
It should be noted that at similar dosage, yield stress values for cement slurries madewith SCM and without any chemical admixtures at all test temperatures followed the
following order: SF>MK>RHA>FA.
It can be observed that for all types and dosage of SCMs, yield stress increased non-linearly with the increase of temperature (Fig. 5.3). This is likely due to the increase ofthe rate of hydration reactions at higher temperature. Similar findings were observed forneat cement pastes by other researchers (Al-Martini, 2008; Nehdi and Al-Martini, 2007;Soroka, 1993). The increase was more substantial for SF and MK, perhaps due to theirhigher fineness. Figure 5.3(a,b) shows that yield stress for OWC slurries incorporating
MK and SF was higher than that of the control mix without SCM for all MK and SF proportions tested. An opposite trend was observed when OWC was partially replacedwith RHA or FA; the higher the RHA or FA dosage, the lower was the yield stress value(Fig. 5.3(c, d)). However, the yield stress for OWC slurries incorporating RHA wasslightly higher than that of FA slurries irrespective of the test temperature and proportionof RHA or FA (Fig. 5.2 and 5.3(c, d)). This is due to the higher specific surface of RHAand its irregular particle shape versus the spherical shape of FA.
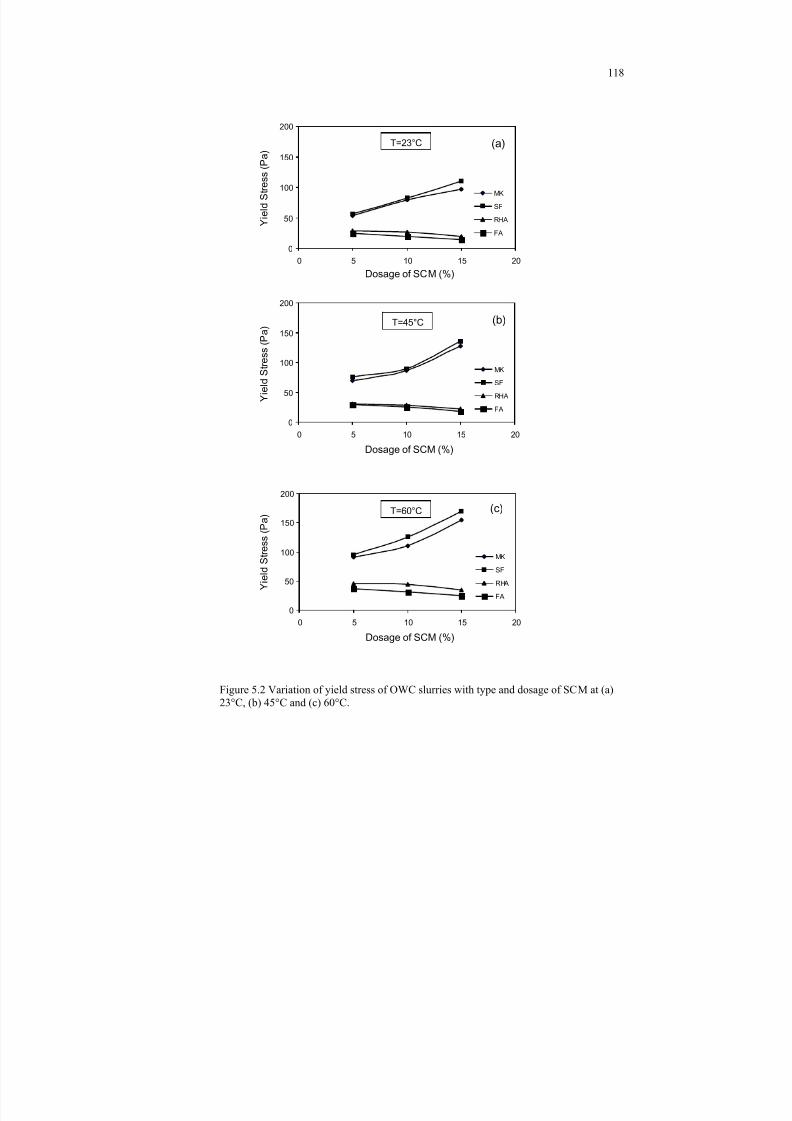
8/18/2019 Rheology of Oil Well Cement Slurries
http://slidepdf.com/reader/full/rheology-of-oil-well-cement-slurries 141/274
118
Figure 5.2 Variation of yield stress of OWC slurries with type and dosage of SCM at (a)23°C, (b) 45°C and (c) 60°C.
0
50
100
150
200
0 5 10 15 20
Dosage of SCM (%)
Y i e l d S t r e s s
( P a )
MK
SF
RHA
FA
0
50
100
150
200
0 5 10 15 20
Dosage of SCM (%)
Y i e l d S t r e s s
( P a
)
MK
SF
RHA
FA
0
50
100
150
200
0 5 10 15 20
Dosage of SCM (%)
Y i e l d S t r e s s
( P a
)
MK
SF
RHA
FA
(a)
(b)
(c)
T=23°C
T=45°C
T=60°C
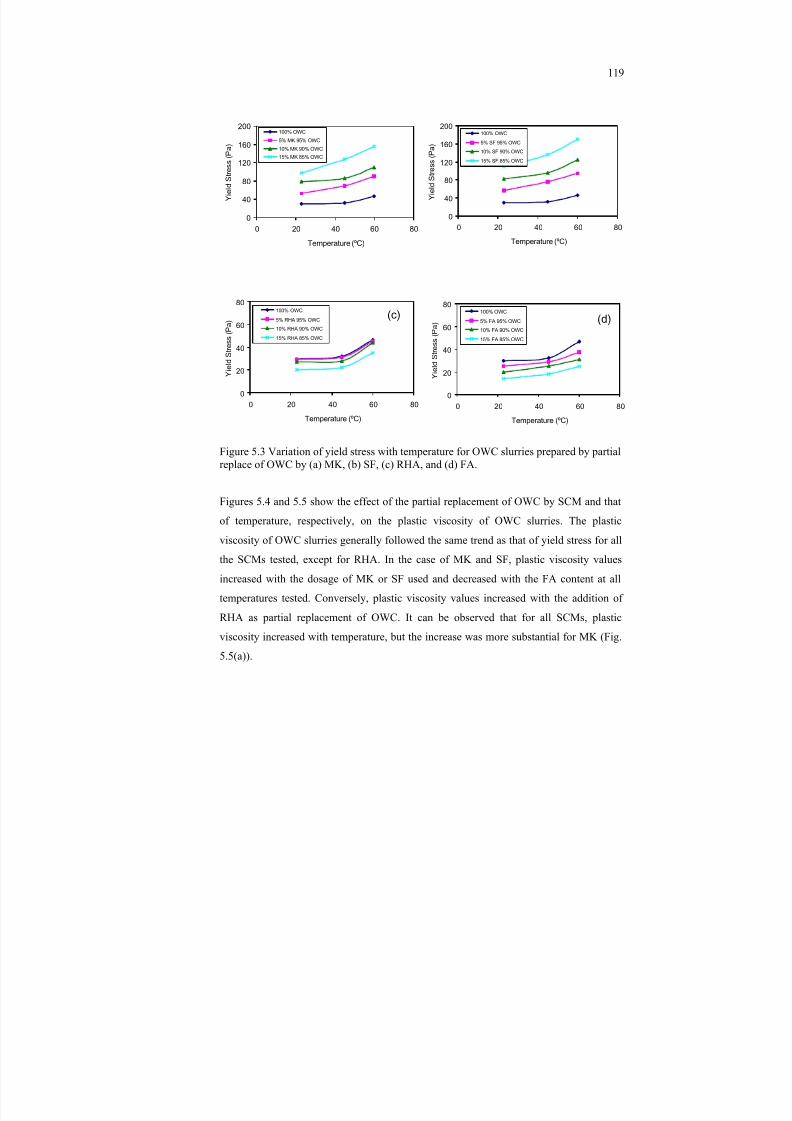
8/18/2019 Rheology of Oil Well Cement Slurries
http://slidepdf.com/reader/full/rheology-of-oil-well-cement-slurries 142/274
119
Figure 5.3 Variation of yield stress with temperature for OWC slurries prepared by partialreplace of OWC by (a) MK, (b) SF, (c) RHA, and (d) FA.
Figures 5.4 and 5.5 show the effect of the partial replacement of OWC by SCM and thatof temperature, respectively, on the plastic viscosity of OWC slurries. The plasticviscosity of OWC slurries generally followed the same trend as that of yield stress for allthe SCMs tested, except for RHA. In the case of MK and SF, plastic viscosity valuesincreased with the dosage of MK or SF used and decreased with the FA content at alltemperatures tested. Conversely, plastic viscosity values increased with the addition ofRHA as partial replacement of OWC. It can be observed that for all SCMs, plasticviscosity increased with temperature, but the increase was more substantial for MK (Fig.5.5(a)).
0
20
40
60
80
0 20 40 60 80
Temperature (ºC)
Y i e l d S t r e s s
( P a
)
100% OWC
5% FA 95% OWC
10% FA 90% OWC
15% FA 85% OWC
0
20
40
60
80
0 20 40 60 80
Temperature (ºC)
Y i e l d S t r e s s
( P a
)
100% OWC
5% RHA 95% OWC
10% RHA 90% OWC
15% RHA 85% OWC
(a) (b)
(c) (d)
0
40
80
120
160
200
0 20 40 60 80
Temperature (ºC)
Y i e l d S t r e s s
( P a
)
100% OWC
5% MK 95% OWC
10% MK 90% OWC15% MK 85% OWC
0
40
80
120
160
200
0 20 40 60 80
Temperature (ºC)
Y i e l d S t r e s s
( P a
)
100% OWC
5% SF 95% OWC
10% SF 90% OWC15% SF 85% OWC
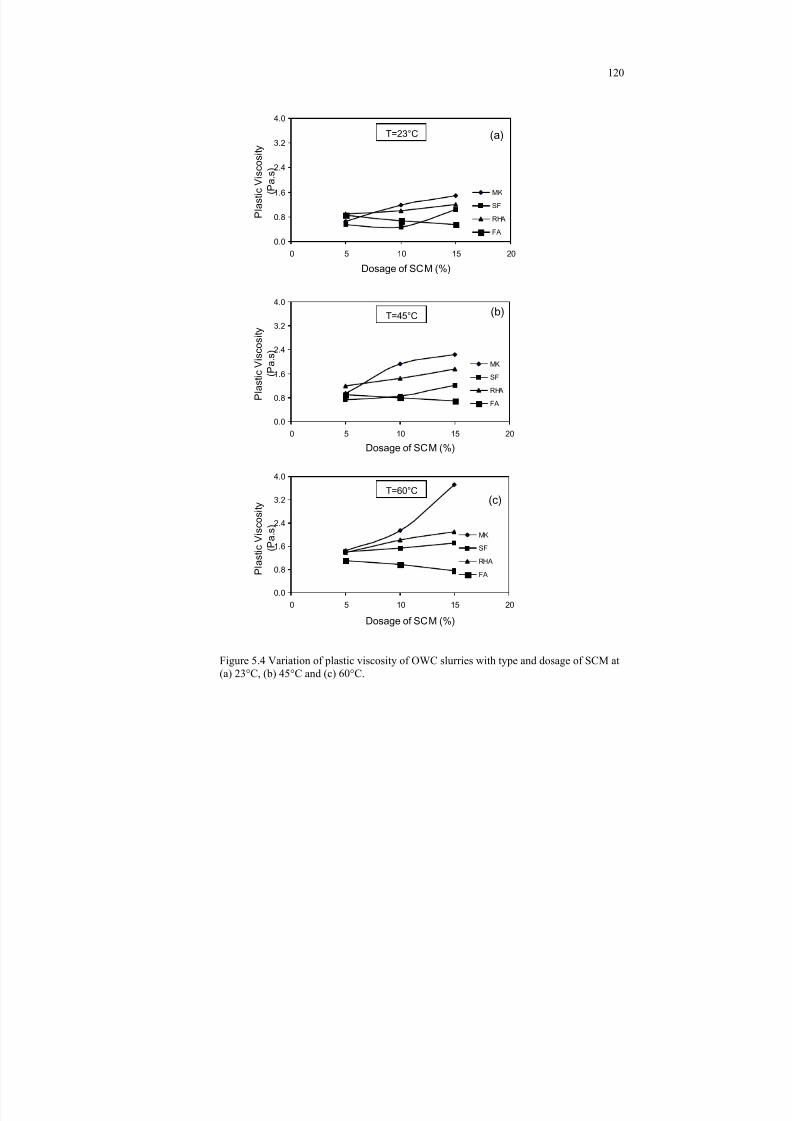
8/18/2019 Rheology of Oil Well Cement Slurries
http://slidepdf.com/reader/full/rheology-of-oil-well-cement-slurries 143/274
120
Figure 5.4 Variation of plastic viscosity of OWC slurries with type and dosage of SCM at(a) 23°C, (b) 45°C and (c) 60°C.
0.0
0.8
1.6
2.4
3.2
4.0
0 5 10 15 20
Dosage of SCM (%)
P l a s
t i c V i s c o s i t y
( P a . s
)
MK
SF
RHA
FA
0.0
0.8
1.6
2.4
3.2
4.0
0 5 10 15 20
Dosage of SCM (%)
P l a s
t i c V i s c o s
i t y
( P a . s
)
MK
SF
RHA
FA
0.0
0.8
1.6
2.4
3.2
4.0
0 5 10 15 20Dosage of SCM (%)
P l a s
t i c V i s c o s
i t y
( P a . s
)MK
SF
RHA
FA
(a)
(b)
(c)T=60°C
T=45°C
T=23°C
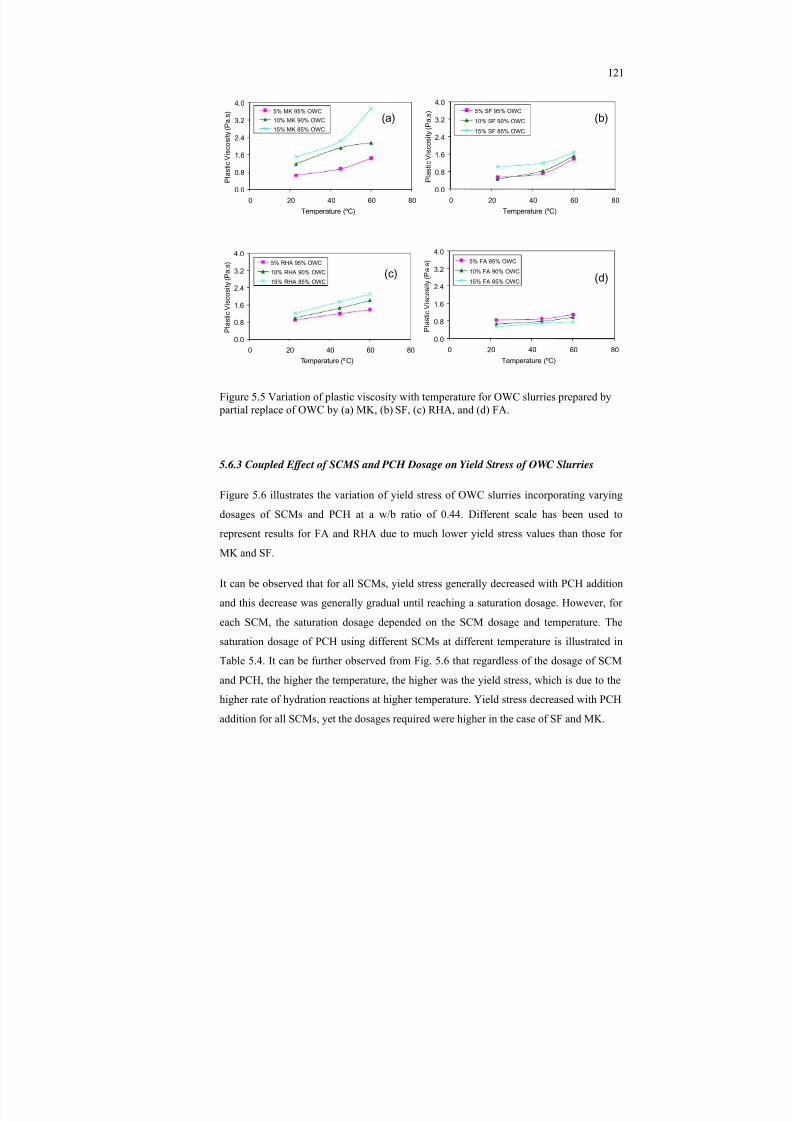
8/18/2019 Rheology of Oil Well Cement Slurries
http://slidepdf.com/reader/full/rheology-of-oil-well-cement-slurries 144/274
121
0.0
0.8
1.6
2.4
3.2
4.0
0 20 40 60 80
P l a s
t i c V i s c o s
i t y ( P a . s
)
Temperature (ºC)
5% MK 95% OWC
10% MK 90% OWC
15% MK 85% OWC
0.0
0.8
1.6
2.4
3.2
4.0
0 20 40 60 80
P l a s
t i c V i s c o s
i t y ( P a . s
)
Temperature (ºC)
5% SF 95% OWC
10% SF 90% OWC
15% SF 85% OWC
0.0
0.8
1.6
2.4
3.2
4.0
0 20 40 60 80
P l a s
t i c V i s
c o s
i t y ( P a . s
)
Temperature (ºC)
5% RHA 95% OWC
10% RHA 90% OWC
15% RHA 85% OWC
0.0
0.8
1.6
2.4
3.2
4.0
0 20 40 60 80
P l a s
t i c V i s c o s
i t y ( P a . s
)
Temperature (ºC)
5% FA 95% OWC
10% FA 90% OWC
15% FA 85% OWC
Figure 5.5 Variation of plastic viscosity with temperature for OWC slurries prepared by partial replace of OWC by (a) MK, (b) SF, (c) RHA, and (d) FA.
5.6.3 Coupled Effect of SCMS and PCH Dosage on Yield Stress of OWC Slurries
Figure 5.6 illustrates the variation of yield stress of OWC slurries incorporating varyingdosages of SCMs and PCH at a w/b ratio of 0.44. Different scale has been used torepresent results for FA and RHA due to much lower yield stress values than those forMK and SF.
It can be observed that for all SCMs, yield stress generally decreased with PCH addition
and this decrease was generally gradual until reaching a saturation dosage. However, foreach SCM, the saturation dosage depended on the SCM dosage and temperature. Thesaturation dosage of PCH using different SCMs at different temperature is illustrated inTable 5.4. It can be further observed from Fig. 5.6 that regardless of the dosage of SCMand PCH, the higher the temperature, the higher was the yield stress, which is due to thehigher rate of hydration reactions at higher temperature. Yield stress decreased with PCHaddition for all SCMs, yet the dosages required were higher in the case of SF and MK.
(a) (b)
(c) (d)
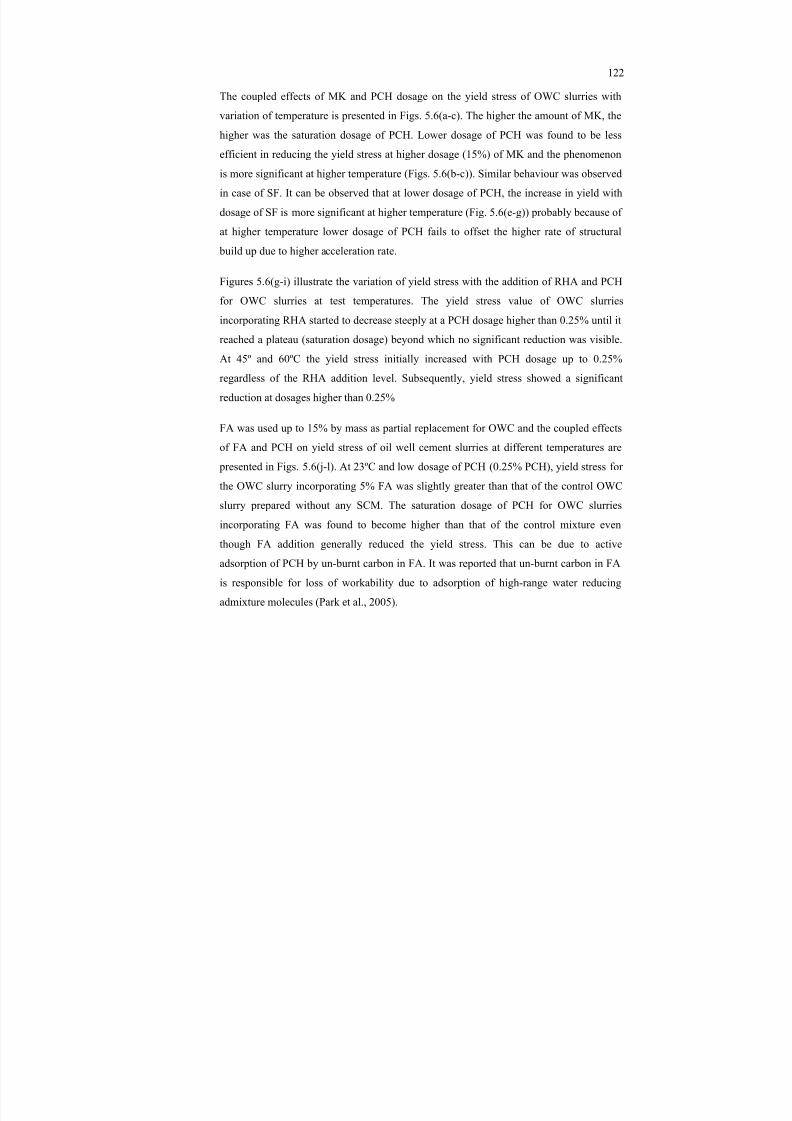
8/18/2019 Rheology of Oil Well Cement Slurries
http://slidepdf.com/reader/full/rheology-of-oil-well-cement-slurries 145/274
122
The coupled effects of MK and PCH dosage on the yield stress of OWC slurries withvariation of temperature is presented in Figs. 5.6(a-c). The higher the amount of MK, thehigher was the saturation dosage of PCH. Lower dosage of PCH was found to be less
efficient in reducing the yield stress at higher dosage (15%) of MK and the phenomenonis more significant at higher temperature (Figs. 5.6(b-c)). Similar behaviour was observedin case of SF. It can be observed that at lower dosage of PCH, the increase in yield withdosage of SF is more significant at higher temperature (Fig. 5.6(e-g)) probably because ofat higher temperature lower dosage of PCH fails to offset the higher rate of structural build up due to higher acceleration rate.
Figures 5.6(g-i) illustrate the variation of yield stress with the addition of RHA and PCH
for OWC slurries at test temperatures. The yield stress value of OWC slurriesincorporating RHA started to decrease steeply at a PCH dosage higher than 0.25% until itreached a plateau (saturation dosage) beyond which no significant reduction was visible.At 45º and 60ºC the yield stress initially increased with PCH dosage up to 0.25%regardless of the RHA addition level. Subsequently, yield stress showed a significantreduction at dosages higher than 0.25%
FA was used up to 15% by mass as partial replacement for OWC and the coupled effectsof FA and PCH on yield stress of oil well cement slurries at different temperatures are presented in Figs. 5.6(j-l). At 23ºC and low dosage of PCH (0.25% PCH), yield stress forthe OWC slurry incorporating 5% FA was slightly greater than that of the control OWCslurry prepared without any SCM. The saturation dosage of PCH for OWC slurriesincorporating FA was found to become higher than that of the control mixture eventhough FA addition generally reduced the yield stress. This can be due to activeadsorption of PCH by un-burnt carbon in FA. It was reported that un-burnt carbon in FAis responsible for loss of workability due to adsorption of high-range water reducing
admixture molecules (Park et al., 2005).
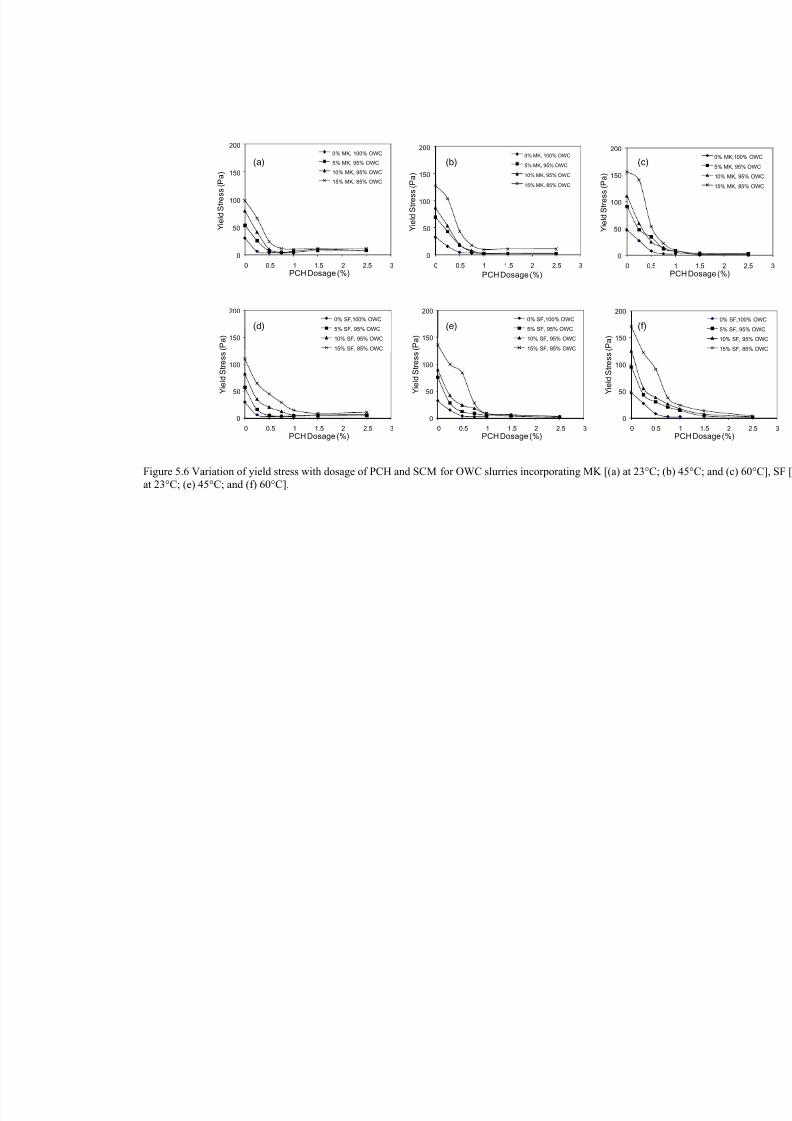
8/18/2019 Rheology of Oil Well Cement Slurries
http://slidepdf.com/reader/full/rheology-of-oil-well-cement-slurries 146/274
0
50
100
150
200
0 0.5 1 1.5 2 2.5 3
Y i e l d S t r e s s
( P a
)
PCH Dosage (%)
0% MK, 100% OWC
5% MK, 95% OWC
10% MK, 95% OWC
15% MK, 85% OWC
0
50
100
150
200
0 0.5 1 1.5 2 2.5 3
Y i e l d S t r e s s
( P a
)
PCH Dosage (%)
0% MK, 100% OWC
5% MK, 95% OWC
10% MK, 95% OWC
15% MK, 85% OWC
0
50
100
150
200
0 0.5
Y i e l d S t r e s s
( P a
)
0
50
100
150
200
0 0.5 1 1.5 2 2.5 3
Y i e l d S t r e s s
( P a
)
PCH Dosage (%)
0% SF,100% OWC
5% SF, 95% OWC
10% SF, 95% OWC
15% SF, 85% OWC
0
50
100
150
200
0 0.5 1 1.5 2 2.5 3
Y i e l d S t r e s s
( P a
)
PCH Dosage (%)
0% SF,100% OWC
5% SF, 95% OWC
10% SF, 95% OWC
15% SF, 85% OWC
0
50
100
150
200
0 0.5
Y i e l d S t r e s s
( P a
)
Figure 5.6 Variation of yield stress with dosage of PCH and SCM for OWC slurries incorporating MK [(a)at 23°C; (e) 45°C; and (f) 60°C].
(a) (b) (c)
(d) (e) (f)
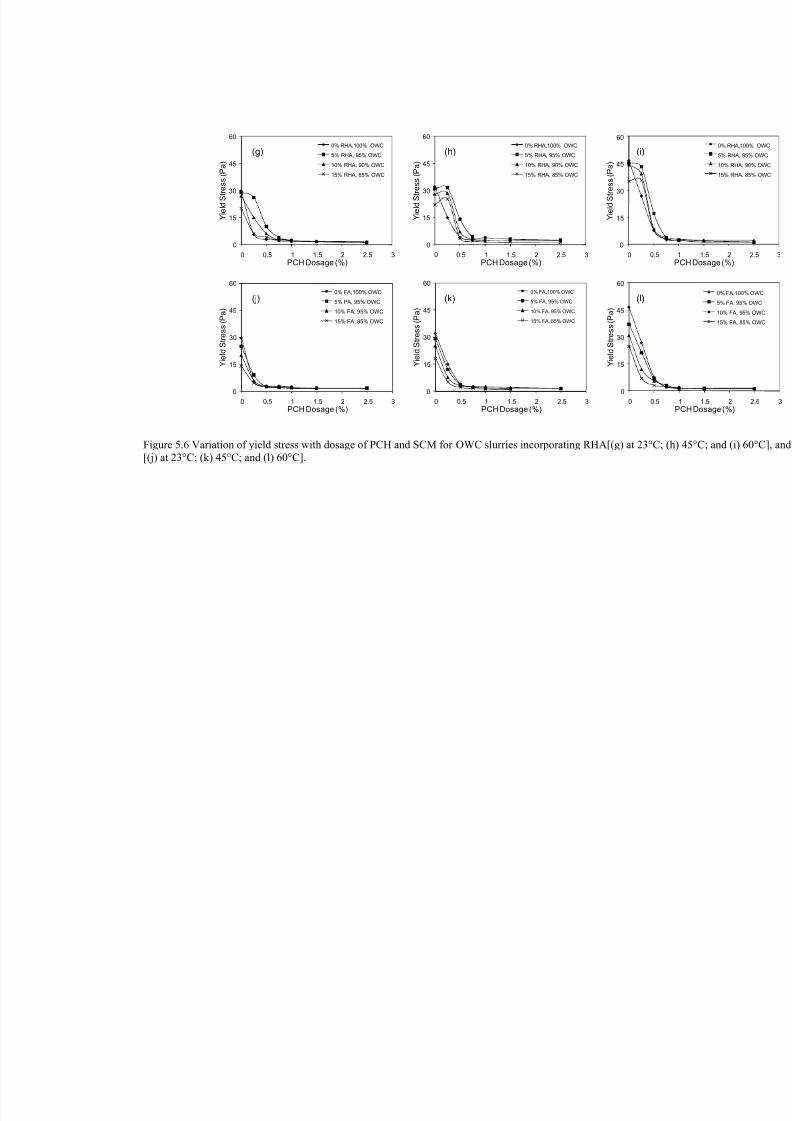
8/18/2019 Rheology of Oil Well Cement Slurries
http://slidepdf.com/reader/full/rheology-of-oil-well-cement-slurries 147/274
0
15
30
45
60
0 0.5 1 1.5 2 2.5 3
Y i e l d S t r e s s
( P a
)
PCH Dosage (%)
0% RHA,100% OWC
5% RHA, 95% OWC
10% RHA, 90% OWC
15% RHA, 85% OWC
0
15
30
45
60
0 0.5 1 1.5 2 2.5 3
Y i e l d S t r e s s
( P a
)
PCH Dosage (%)
0% RHA,100% OWC
5% RHA, 95% OWC
10% RHA, 90% OWC
15% RHA, 85% OWC
0
15
30
45
60
0 0.5
Y i e l d S t r e s s
( P a
)
0
15
30
45
60
0 0.5 1 1.5 2 2.5 3
Y i e l d S t r e s s
( P a
)
PCH Dosage (%)
0% FA,100% OWC
5% FA, 95% OWC10% FA, 95% OWC
15% FA, 85% OWC
0
15
30
45
60
0 0.5 1 1.5 2 2.5 3
Y i e l d S t r e s s
( P a
)
PCH Dosage (%)
0% FA,100% OWC
5% FA, 95% OWC10% FA, 95% OWC
15% FA, 85% OWC
0
15
30
45
60
0 0.5
Y i e l d S t r e s s
( P a
)
Figure 5.6 Variation of yield stress with dosage of PCH and SCM for OWC slurries incorporating RHA[(g[(j) at 23°C; (k) 45°C; and (l) 60°C].
(g) (h) (i)
(j) (k) (l)
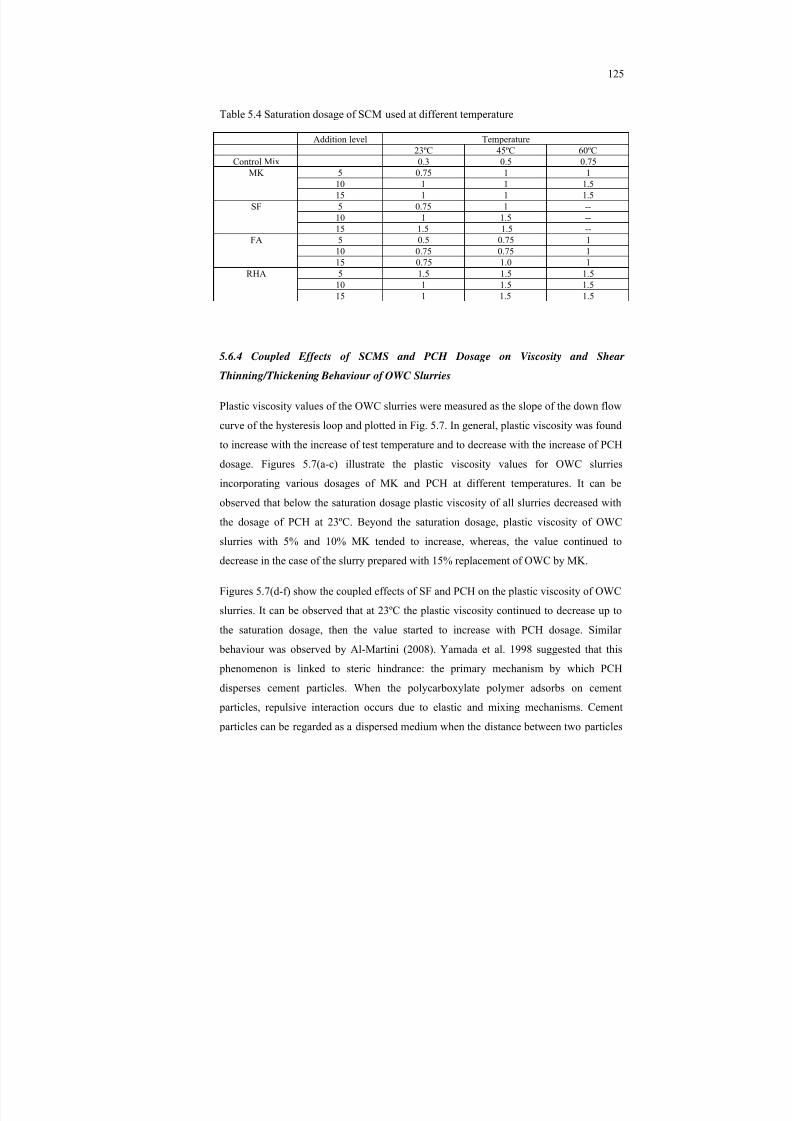
8/18/2019 Rheology of Oil Well Cement Slurries
http://slidepdf.com/reader/full/rheology-of-oil-well-cement-slurries 148/274
125
Table 5.4 Saturation dosage of SCM used at different temperature
Addition level Temperature
23ºC 45ºC 60ºCControl Mix 0.3 0.5 0.75MK 5 0.75 1 1
10 1 1 1.515 1 1 1.5
SF 5 0.75 1 --10 1 1.5 --15 1.5 1.5 --
FA 5 0.5 0.75 110 0.75 0.75 115 0.75 1.0 1
RHA 5 1.5 1.5 1.510 1 1.5 1.515 1 1.5 1.5
5.6.4 Coupled Effects of SCMS and PCH Dosage on Viscosity and Shear
Thinning/Thickening Behaviour of OWC Slurries
Plastic viscosity values of the OWC slurries were measured as the slope of the down flowcurve of the hysteresis loop and plotted in Fig. 5.7. In general, plastic viscosity was foundto increase with the increase of test temperature and to decrease with the increase of PCHdosage. Figures 5.7(a-c) illustrate the plastic viscosity values for OWC slurriesincorporating various dosages of MK and PCH at different temperatures. It can beobserved that below the saturation dosage plastic viscosity of all slurries decreased withthe dosage of PCH at 23ºC. Beyond the saturation dosage, plastic viscosity of OWCslurries with 5% and 10% MK tended to increase, whereas, the value continued todecrease in the case of the slurry prepared with 15% replacement of OWC by MK.
Figures 5.7(d-f) show the coupled effects of SF and PCH on the plastic viscosity of OWC
slurries. It can be observed that at 23ºC the plastic viscosity continued to decrease up tothe saturation dosage, then the value started to increase with PCH dosage. Similar behaviour was observed by Al-Martini (2008). Yamada et al. 1998 suggested that this phenomenon is linked to steric hindrance: the primary mechanism by which PCHdisperses cement particles. When the polycarboxylate polymer adsorbs on cement particles, repulsive interaction occurs due to elastic and mixing mechanisms. Cement particles can be regarded as a dispersed medium when the distance between two particles
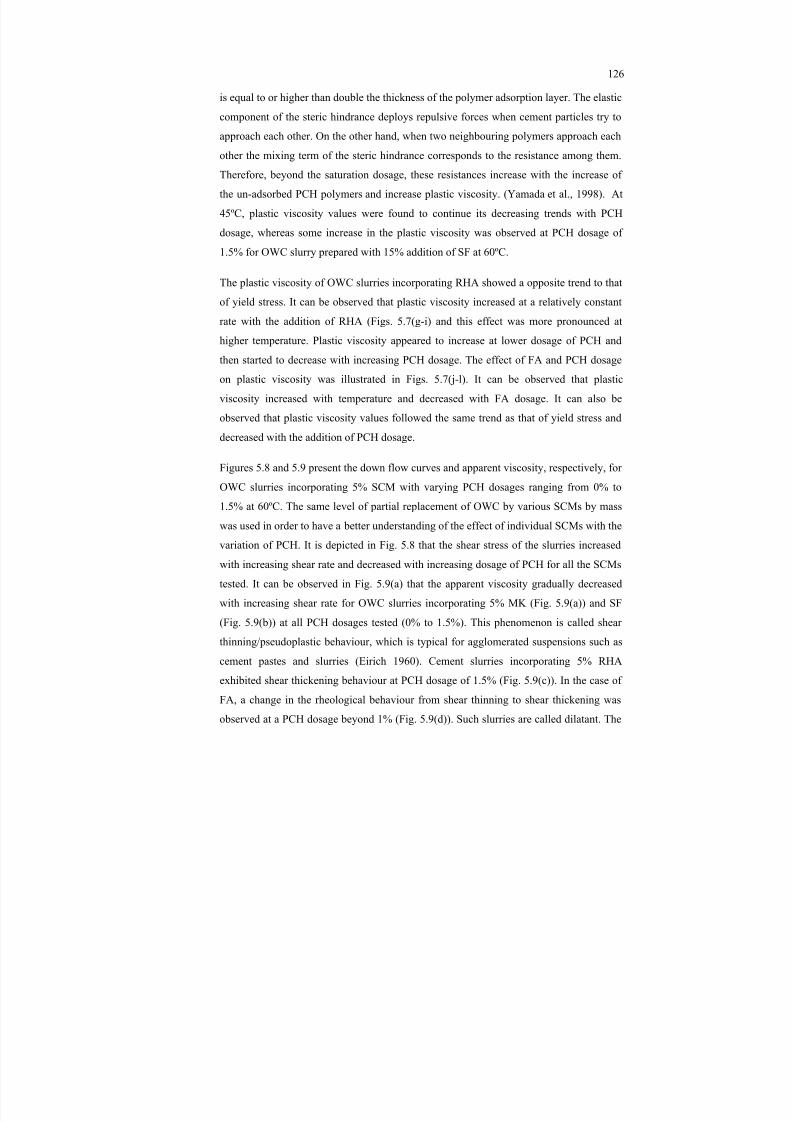
8/18/2019 Rheology of Oil Well Cement Slurries
http://slidepdf.com/reader/full/rheology-of-oil-well-cement-slurries 149/274
126
is equal to or higher than double the thickness of the polymer adsorption layer. The elasticcomponent of the steric hindrance deploys repulsive forces when cement particles try toapproach each other. On the other hand, when two neighbouring polymers approach each
other the mixing term of the steric hindrance corresponds to the resistance among them.Therefore, beyond the saturation dosage, these resistances increase with the increase ofthe un-adsorbed PCH polymers and increase plastic viscosity. (Yamada et al., 1998). At45ºC, plastic viscosity values were found to continue its decreasing trends with PCHdosage, whereas some increase in the plastic viscosity was observed at PCH dosage of1.5% for OWC slurry prepared with 15% addition of SF at 60ºC.
The plastic viscosity of OWC slurries incorporating RHA showed a opposite trend to that
of yield stress. It can be observed that plastic viscosity increased at a relatively constantrate with the addition of RHA (Figs. 5.7(g-i) and this effect was more pronounced athigher temperature. Plastic viscosity appeared to increase at lower dosage of PCH andthen started to decrease with increasing PCH dosage. The effect of FA and PCH dosageon plastic viscosity was illustrated in Figs. 5.7(j-l). It can be observed that plasticviscosity increased with temperature and decreased with FA dosage. It can also beobserved that plastic viscosity values followed the same trend as that of yield stress anddecreased with the addition of PCH dosage.
Figures 5.8 and 5.9 present the down flow curves and apparent viscosity, respectively, forOWC slurries incorporating 5% SCM with varying PCH dosages ranging from 0% to1.5% at 60ºC. The same level of partial replacement of OWC by various SCMs by masswas used in order to have a better understanding of the effect of individual SCMs with thevariation of PCH. It is depicted in Fig. 5.8 that the shear stress of the slurries increasedwith increasing shear rate and decreased with increasing dosage of PCH for all the SCMstested. It can be observed in Fig. 5.9(a) that the apparent viscosity gradually decreased
with increasing shear rate for OWC slurries incorporating 5% MK (Fig. 5.9(a)) and SF(Fig. 5.9(b)) at all PCH dosages tested (0% to 1.5%). This phenomenon is called shearthinning/pseudoplastic behaviour, which is typical for agglomerated suspensions such ascement pastes and slurries (Eirich 1960). Cement slurries incorporating 5% RHAexhibited shear thickening behaviour at PCH dosage of 1.5% (Fig. 5.9(c)). In the case ofFA, a change in the rheological behaviour from shear thinning to shear thickening wasobserved at a PCH dosage beyond 1% (Fig. 5.9(d)). Such slurries are called dilatant. The
8/18/2019 Rheology of Oil Well Cement Slurries
http://slidepdf.com/reader/full/rheology-of-oil-well-cement-slurries 150/274
127
apparent viscosity of the OWC slurries incorporating PCH dosages of 1% and 1.5%increased gradually with the increase of the shear rate.
Cyr et al. (2000) argued that the dispersing mechanisms of superplasticizers areresponsible for the shear thickening behaviour. They used the Herschel-Bulkley equation(equation 5.2) to characterize the rheological properties of cement pastes. Cement slurriestesting results demonstrate that Bingham model is not appropriate for describing cementslurries’ shear thinning or thickening behaviour because of distortion of flow curve bydecreasing or increasing of viscosity with increasing shear stress (Skripkiūnas andDaukšys, 2004). Even though the Bingham model has been used throughout the presentstudy to characterize the rheological properties of OWC slurries, the Herschel-Bulkley
model has been used in this section to identify the shear thinning or shear thickening behaviour of OWC slurries as a function of chemical and mineral admixtures. Thevariation of the exponentn with the dosage of PCH is presented in Fig. 5.10. It can beobserved in Fig. 5.10 that the exponentn varies with the admixture dosage. Regardless ofthe SCM type, all OWC slurries showed shear thinning behaviour at lower dosages ofPCH. Then, the exponent continued to increase with increased dosage of PCH and theslurry behaviour changed from shear thinning to shear thickening.
8/18/2019 Rheology of Oil Well Cement Slurries
http://slidepdf.com/reader/full/rheology-of-oil-well-cement-slurries 151/274
0
1
2
3
4
5
0 0.5 1 1.5 2 2.5 3
P l a s
t i c V i s c o s
i t y ( P a . s
)
PCH Dosage (%)
5% MK, 95% OWC
10% MK, 95% OWC
15% MK, 85% OWC
0
1
2
3
4
5
0 0.5 1 1.5 2 2.5 3
P l a s
t i c V i s c o s
i t y ( P a . s
)
PCH Dosage (%)
5% MK, 95% OWC
10% MK, 95% OWC
15% MK, 85% OWC
0
1
2
3
4
5
0 0.5 1
P l a s
t i c V i s c o s
i t y ( P a . s
)
PC
0
1
2
3
4
5
0 0.5 1 1.5 2 2.5 3
P l a s
t i c V i s c o s
i t y ( P a . s
)
PCH Dosage (%)
5% SF, 95% OWC
10% SF, 95% OWC
15% SF, 85% OWC
0
1
2
3
4
5
0 0.5 1 1.5 2 2.5 3
P l a s
t i c V i s c o s
i t y ( P a . s
)
PCH Dosage (%)
5% SF, 95% OWC
10% SF, 95% OWC
15% SF, 85% OWC
0
1
2
3
4
5
0 0.5 1
P l a s
t i c V i s c o s
i t y ( P a . s
)
PCH
Figure 5.7 Variation of plastic viscosity with dosage of PCH and SCM for OWC slurries incorporating MK[(d) at 23°C; (e) 45°C; and (f) 60°C].
(a) (b) (c)
(d) (e) (f)
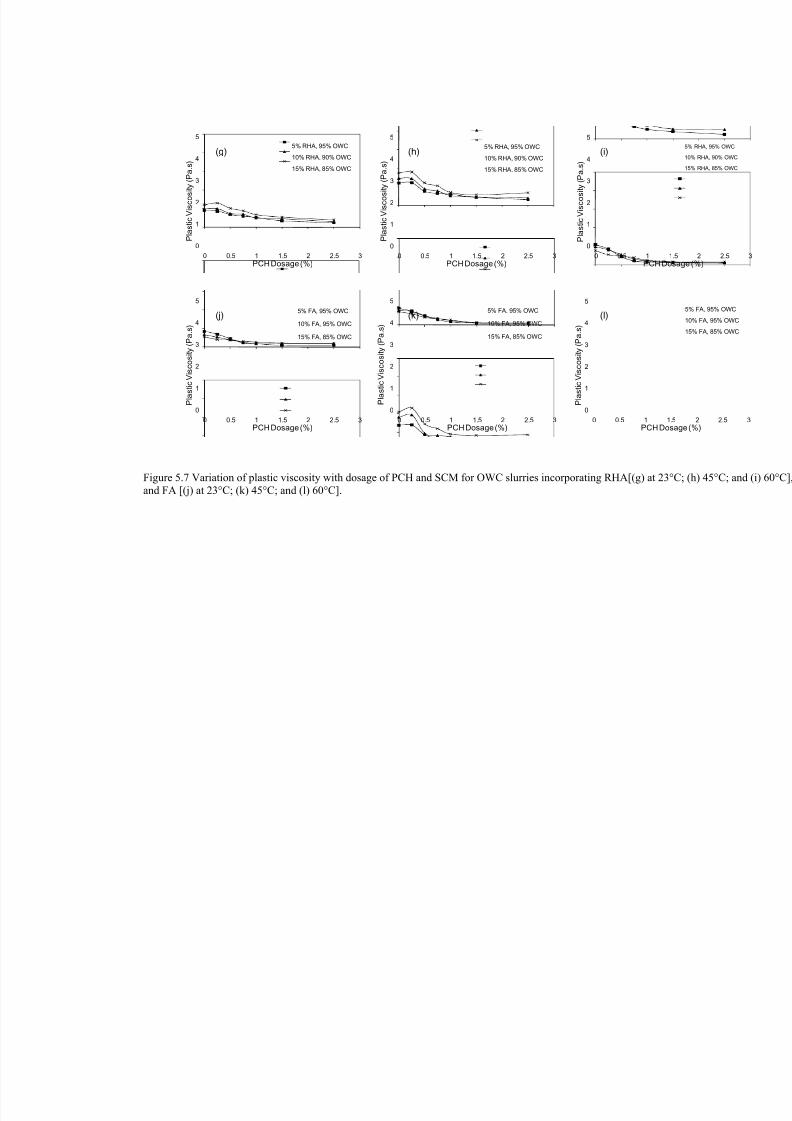
8/18/2019 Rheology of Oil Well Cement Slurries
http://slidepdf.com/reader/full/rheology-of-oil-well-cement-slurries 152/274
0
1
2
3
4
5
0 0.5 1 1.5 2 2.5 3
P l a s
t i c V i s c o s
i t y ( P a . s
)
PCH Dosage (%)
5% RHA, 95% OWC
10% RHA, 90% OWC
15% RHA, 85% OWC
0
1
2
3
4
5
0 0.5 1 1.5 2 2.5 3
P l a s
t i c V i s c o s
i t y ( P a . s
)
PCH Dosage (%)
5% RHA, 95% OWC
10% RHA, 90% OWC
15% RHA, 85% OWC
0
1
2
3
4
5
0 0.5 1
P l a s
t i c V i s c o s
i t y ( P a . s
)
PCH D
0
1
2
3
4
5
0 0.5 1 1.5 2 2.5 3
P l a s
t i c V i s c o s
i t y ( P a . s
)
PCH Dosage (%)
5% FA, 95% OWC
10% FA, 95% OWC
15% FA, 85% OWC
0
1
2
3
4
5
0 0.5 1 1.5 2 2.5 3
P l a s
t i c V i s c o s
i t y ( P a . s
)
PCH Dosage (%)
5% FA, 95% OWC
10% FA, 95% OWC
15% FA, 85% OWC
0
1
2
3
4
5
0 0.5 1
P l a s
t i c V i s c o s
i t y ( P a . s
)
PCH D
Figure 5.7 Variation of plastic viscosity with dosage of PCH and SCM for OWC slurries incorporating RHand FA [(j) at 23°C; (k) 45°C; and (l) 60°C].
(g) (h) (i)
(j) (k) (l)
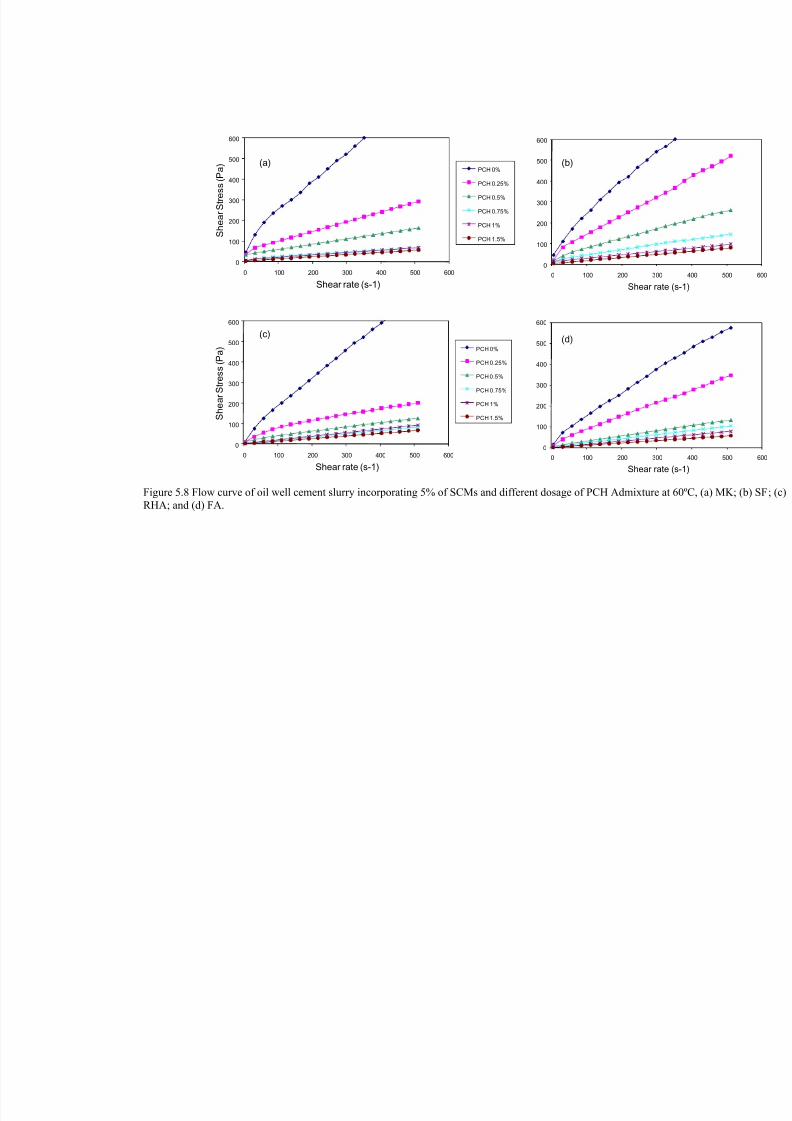
8/18/2019 Rheology of Oil Well Cement Slurries
http://slidepdf.com/reader/full/rheology-of-oil-well-cement-slurries 153/274
0
100
200
300
400
500
600
0 100 200 300 400 500 600
S h e a r
S t r e s s
( P a
)
Shear rate (s-1)
PCH 0%
PCH 0.25%
PCH 0.5%
PCH 0.75%
PCH 1%
PCH 1.5%
0
100
200
300
400
500
600
0 100 200 300
Shear rate
0
100
200
300
400
500
600
0 100 200 300 400 500 600
S h e a r
S t r e s s
( P a
)
Shear rate (s-1)
PCH 0%
PCH 0.25%
PCH 0.5%
PCH 0.75%
PCH 1%
PCH 1.5%
0
100
200
300
400
500
600
0 100 200 300
Shear rate
Figure 5.8 Flow curve of oil well cement slurry incorporating 5% of SCMs and different dosage of PCH ARHA; and (d) FA.
(a) (b)
(c) (d)
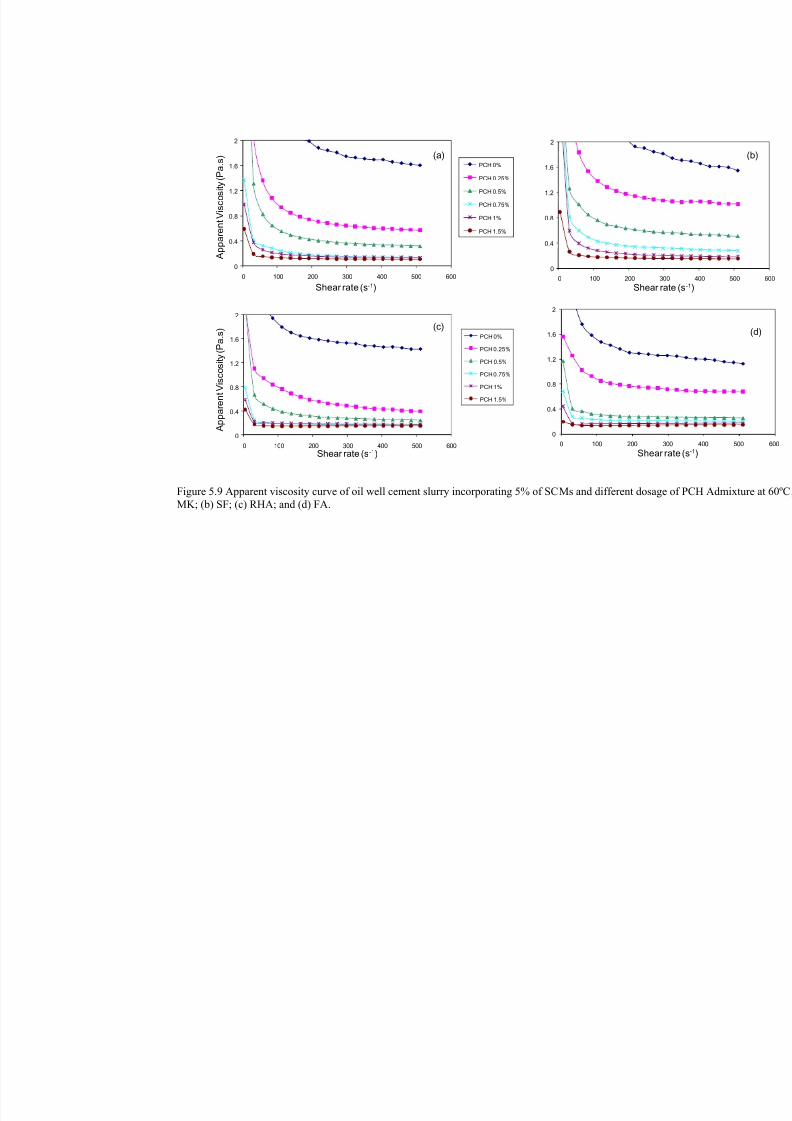
8/18/2019 Rheology of Oil Well Cement Slurries
http://slidepdf.com/reader/full/rheology-of-oil-well-cement-slurries 154/274
0
0.4
0.8
1.2
1.6
2
0 100 200 300 400 500 600
A p p a r e n
t V i s c o s
i t y ( P a . s
)
Shear rate (s -1)
PCH 0%
PCH 0.25%
PCH 0.5%
PCH 0.75%
PCH 1%
PCH 1.5%
0
0.4
0.8
1.2
1.6
2
0 100 200 30
Shear rat
0
0.4
0.8
1.2
1.6
2
0 100 200 300 400 500 600
A p p a r e n
t V i s c o s
i t y ( P a . s
)
Shear rate (s -1)
PCH 0%
PCH 0.25%
PCH 0.5%
PCH 0.75%
PCH 1%
PCH 1.5%
0
0.4
0.8
1.2
1.6
2
0 100 200 3
Shear r
Figure 5.9 Apparent viscosity curve of oil well cement slurry incorporating 5% of SCMs and differMK; (b) SF; (c) RHA; and (d) FA.
(a)
(c)
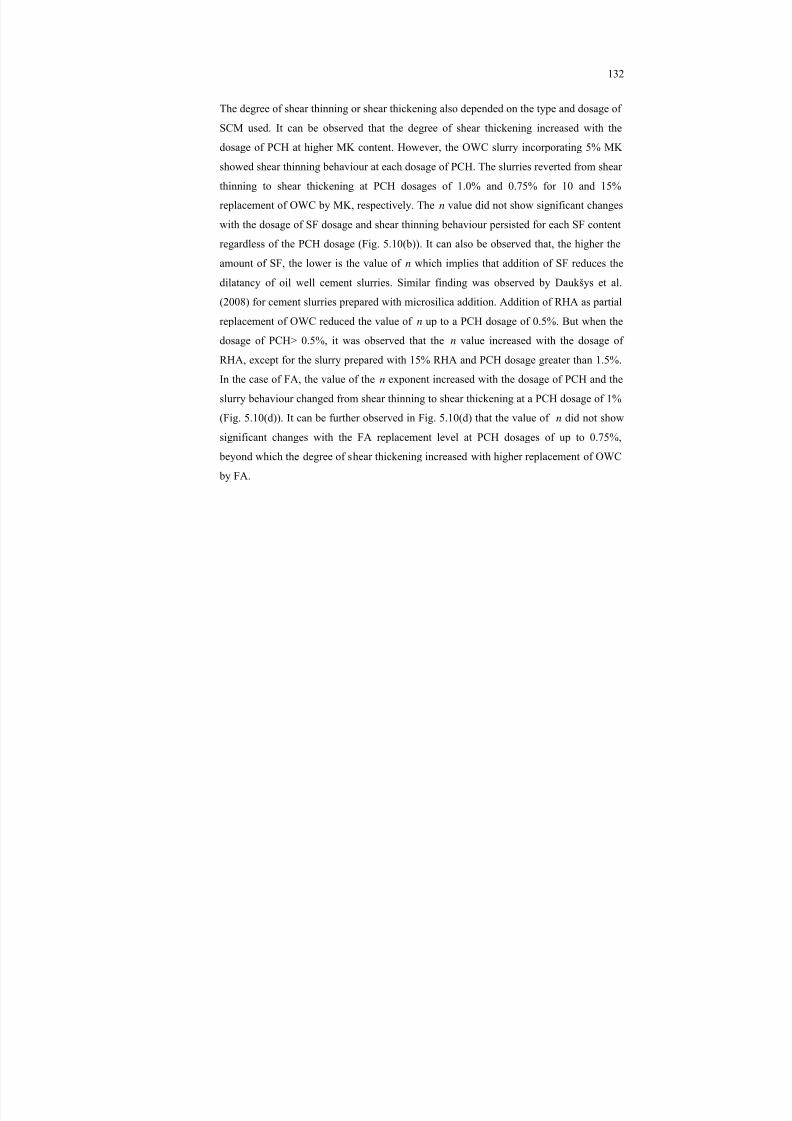
8/18/2019 Rheology of Oil Well Cement Slurries
http://slidepdf.com/reader/full/rheology-of-oil-well-cement-slurries 155/274
132
The degree of shear thinning or shear thickening also depended on the type and dosage ofSCM used. It can be observed that the degree of shear thickening increased with the
dosage of PCH at higher MK content. However, the OWC slurry incorporating 5% MKshowed shear thinning behaviour at each dosage of PCH. The slurries reverted from shearthinning to shear thickening at PCH dosages of 1.0% and 0.75% for 10 and 15%replacement of OWC by MK, respectively. Then value did not show significant changeswith the dosage of SF dosage and shear thinning behaviour persisted for each SF contentregardless of the PCH dosage (Fig. 5.10(b)). It can also be observed that, the higher theamount of SF, the lower is the value ofn which implies that addition of SF reduces thedilatancy of oil well cement slurries. Similar finding was observed by Daukšys et al.
(2008) for cement slurries prepared with microsilica addition. Addition of RHA as partialreplacement of OWC reduced the value ofn up to a PCH dosage of 0.5%. But when thedosage of PCH> 0.5%, it was observed that then value increased with the dosage ofRHA, except for the slurry prepared with 15% RHA and PCH dosage greater than 1.5%.In the case of FA, the value of then exponent increased with the dosage of PCH and theslurry behaviour changed from shear thinning to shear thickening at a PCH dosage of 1%(Fig. 5.10(d)). It can be further observed in Fig. 5.10(d) that the value ofn did not showsignificant changes with the FA replacement level at PCH dosages of up to 0.75%,
beyond which the degree of shear thickening increased with higher replacement of OWC by FA.
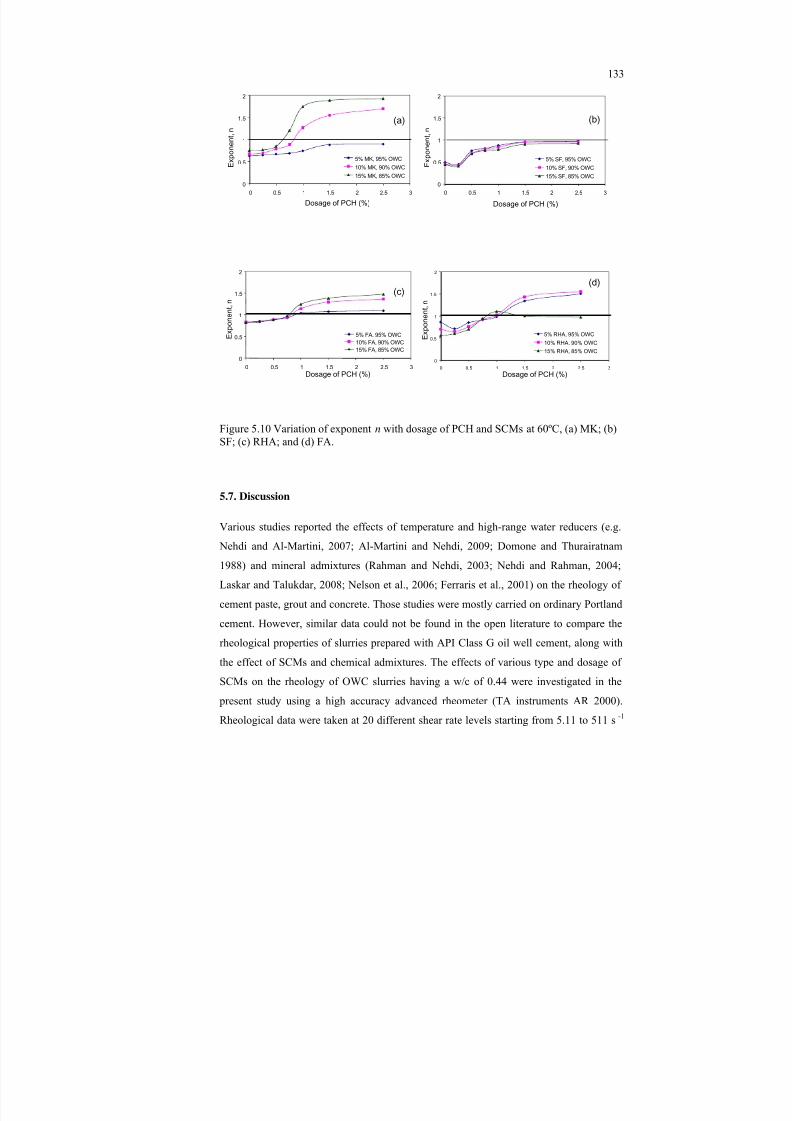
8/18/2019 Rheology of Oil Well Cement Slurries
http://slidepdf.com/reader/full/rheology-of-oil-well-cement-slurries 156/274
133
0
0.5
1
1.5
2
0 0.5 1 1.5 2 2.5 3
E x p o n e n
t , n
Dosage of PCH (%)
5% MK, 95% OWC10% MK, 90% OWC15% MK, 85% OWC
0
0.5
1
1.5
2
0 0.5 1 1.5 2 2.5 3
E x p o n e n
t , n
Dosage of PCH (%)
5% SF, 95% OWC10% SF, 90% OWC15% SF, 85% OWC
0
0.5
1
1.5
2
0 0.5 1 1.5 2 2.5 3
E x p o n e n
t , n
Dosage of PCH (%)
5% FA, 95% OWC10% FA, 90% OWC15% FA, 85% OWC
0
0.5
1
1.5
2
0 0.5 1 1.5 2 2.5 3
E x p o n e n
t , n
Dosage of PCH (%)
5% RHA, 95% OWC
10% RHA, 90% OWC15% RHA, 85% OWC
Figure 5.10 Variation of exponentn with dosage of PCH and SCMs at 60ºC, (a) MK; (b)SF; (c) RHA; and (d) FA.
5.7. Discussion
Various studies reported the effects of temperature and high-range water reducers (e.g. Nehdi and Al-Martini, 2007; Al-Martini and Nehdi, 2009; Domone and Thurairatnam1988) and mineral admixtures (Rahman and Nehdi, 2003; Nehdi and Rahman, 2004;Laskar and Talukdar, 2008; Nelson et al., 2006; Ferraris et al., 2001) on the rheology of
cement paste, grout and concrete. Those studies were mostly carried on ordinary Portlandcement. However, similar data could not be found in the open literature to compare therheological properties of slurries prepared with API Class G oil well cement, along withthe effect of SCMs and chemical admixtures. The effects of various type and dosage ofSCMs on the rheology of OWC slurries having a w/c of 0.44 were investigated in the present study using a high accuracy advanced rheometer (TA instruments AR 2000).Rheological data were taken at 20 different shear rate levels starting from 5.11 to 511 s-1
(a)
(c)
(b)
(d)
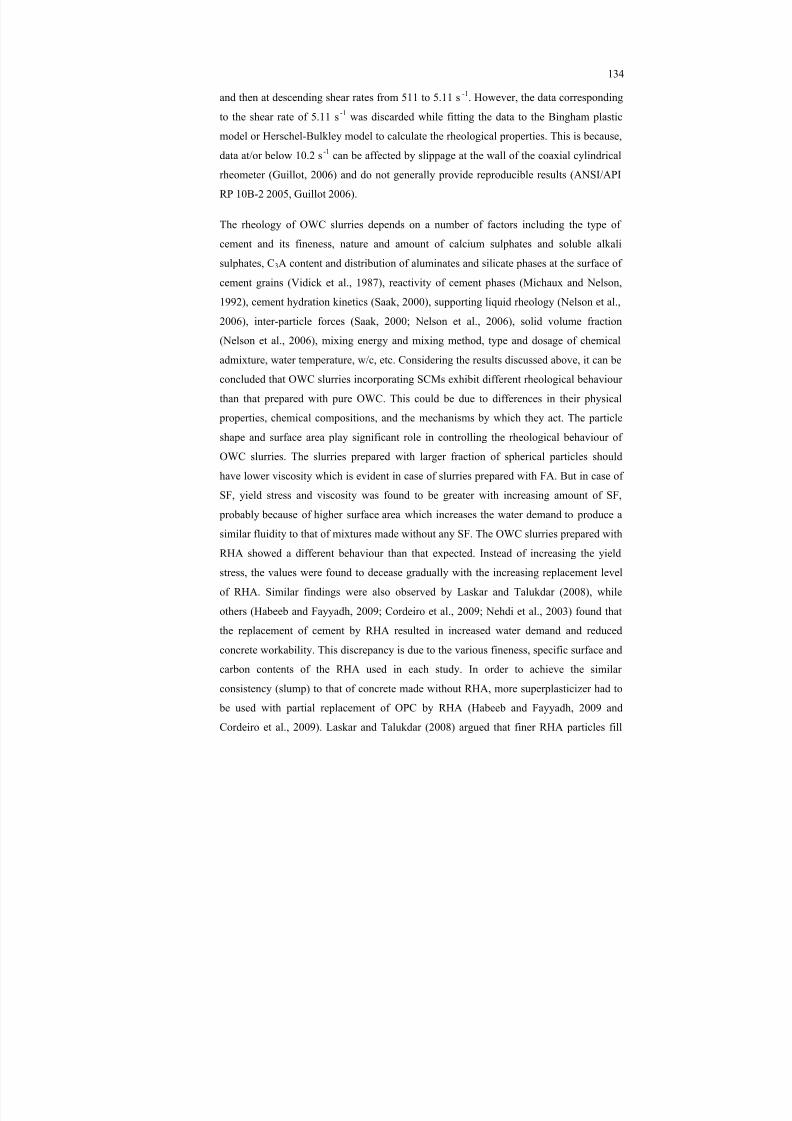
8/18/2019 Rheology of Oil Well Cement Slurries
http://slidepdf.com/reader/full/rheology-of-oil-well-cement-slurries 157/274
134
and then at descending shear rates from 511 to 5.11 s-1. However, the data correspondingto the shear rate of 5.11 s-1 was discarded while fitting the data to the Bingham plasticmodel or Herschel-Bulkley model to calculate the rheological properties. This is because,
data at/or below 10.2 s-1 can be affected by slippage at the wall of the coaxial cylindricalrheometer (Guillot, 2006) and do not generally provide reproducible results (ANSI/APIRP 10B-2 2005, Guillot 2006).
The rheology of OWC slurries depends on a number of factors including the type ofcement and its fineness, nature and amount of calcium sulphates and soluble alkalisulphates, C3A content and distribution of aluminates and silicate phases at the surface ofcement grains (Vidick et al., 1987), reactivity of cement phases (Michaux and Nelson,
1992), cement hydration kinetics (Saak, 2000), supporting liquid rheology (Nelson et al.,2006), inter-particle forces (Saak, 2000; Nelson et al., 2006), solid volume fraction(Nelson et al., 2006), mixing energy and mixing method, type and dosage of chemicaladmixture, water temperature, w/c, etc. Considering the results discussed above, it can beconcluded that OWC slurries incorporating SCMs exhibit different rheological behaviourthan that prepared with pure OWC. This could be due to differences in their physical properties, chemical compositions, and the mechanisms by which they act. The particleshape and surface area play significant role in controlling the rheological behaviour of
OWC slurries. The slurries prepared with larger fraction of spherical particles shouldhave lower viscosity which is evident in case of slurries prepared with FA. But in case ofSF, yield stress and viscosity was found to be greater with increasing amount of SF, probably because of higher surface area which increases the water demand to produce asimilar fluidity to that of mixtures made without any SF. The OWC slurries prepared withRHA showed a different behaviour than that expected. Instead of increasing the yieldstress, the values were found to decease gradually with the increasing replacement levelof RHA. Similar findings were also observed by Laskar and Talukdar (2008), while
others (Habeeb and Fayyadh, 2009; Cordeiro et al., 2009; Nehdi et al., 2003) found thatthe replacement of cement by RHA resulted in increased water demand and reducedconcrete workability. This discrepancy is due to the various fineness, specific surface andcarbon contents of the RHA used in each study. In order to achieve the similarconsistency (slump) to that of concrete made without RHA, more superplasticizer had to be used with partial replacement of OPC by RHA (Habeeb and Fayyadh, 2009 andCordeiro et al., 2009). Laskar and Talukdar (2008) argued that finer RHA particles fill
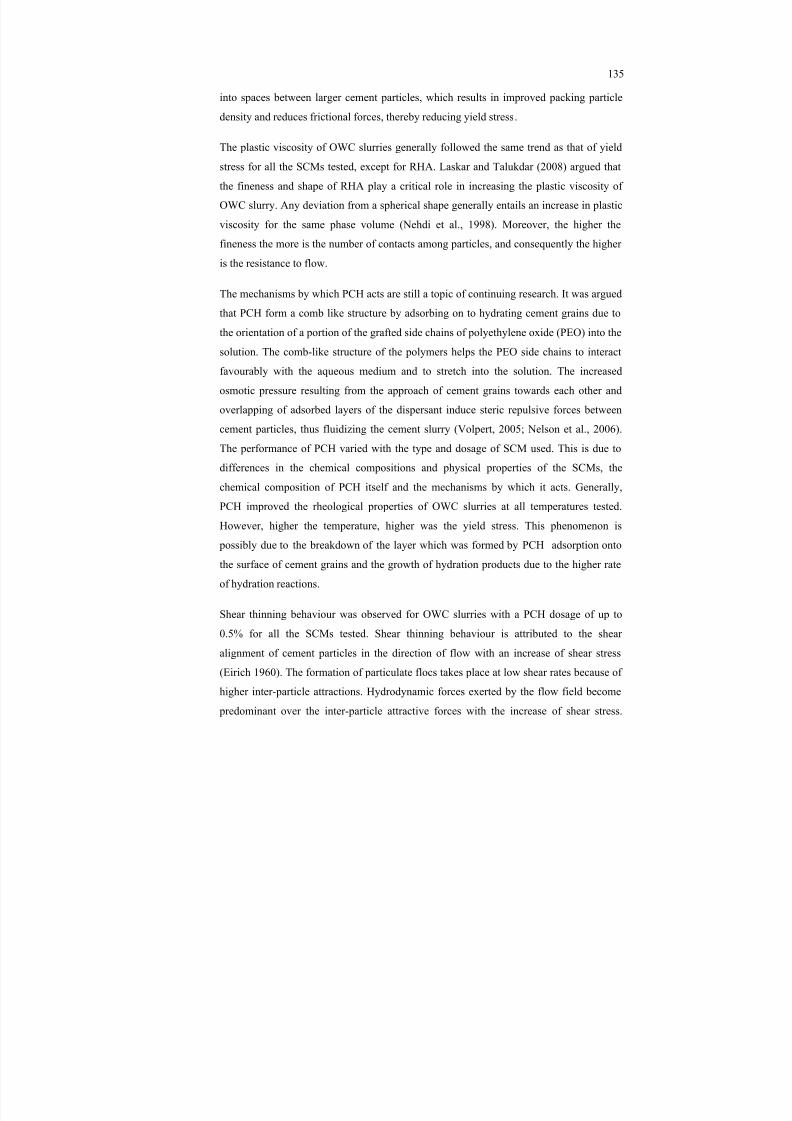
8/18/2019 Rheology of Oil Well Cement Slurries
http://slidepdf.com/reader/full/rheology-of-oil-well-cement-slurries 158/274
135
into spaces between larger cement particles, which results in improved packing particledensity and reduces frictional forces, thereby reducing yield stress.
The plastic viscosity of OWC slurries generally followed the same trend as that of yieldstress for all the SCMs tested, except for RHA. Laskar and Talukdar (2008) argued thatthe fineness and shape of RHA play a critical role in increasing the plastic viscosity ofOWC slurry. Any deviation from a spherical shape generally entails an increase in plasticviscosity for the same phase volume (Nehdi et al., 1998). Moreover, the higher thefineness the more is the number of contacts among particles, and consequently the higheris the resistance to flow.
The mechanisms by which PCH acts are still a topic of continuing research. It was arguedthat PCH form a comb like structure by adsorbing on to hydrating cement grains due tothe orientation of a portion of the grafted side chains of polyethylene oxide (PEO) into thesolution. The comb-like structure of the polymers helps the PEO side chains to interactfavourably with the aqueous medium and to stretch into the solution. The increasedosmotic pressure resulting from the approach of cement grains towards each other andoverlapping of adsorbed layers of the dispersant induce steric repulsive forces betweencement particles, thus fluidizing the cement slurry (Volpert, 2005; Nelson et al., 2006).The performance of PCH varied with the type and dosage of SCM used. This is due todifferences in the chemical compositions and physical properties of the SCMs, thechemical composition of PCH itself and the mechanisms by which it acts. Generally,PCH improved the rheological properties of OWC slurries at all temperatures tested.However, higher the temperature, higher was the yield stress. This phenomenon is possibly due to the breakdown of the layer which was formed by PCH adsorption ontothe surface of cement grains and the growth of hydration products due to the higher rateof hydration reactions.
Shear thinning behaviour was observed for OWC slurries with a PCH dosage of up to0.5% for all the SCMs tested. Shear thinning behaviour is attributed to the shearalignment of cement particles in the direction of flow with an increase of shear stress(Eirich 1960). The formation of particulate flocs takes place at low shear rates because ofhigher inter-particle attractions. Hydrodynamic forces exerted by the flow field become predominant over the inter-particle attractive forces with the increase of shear stress.
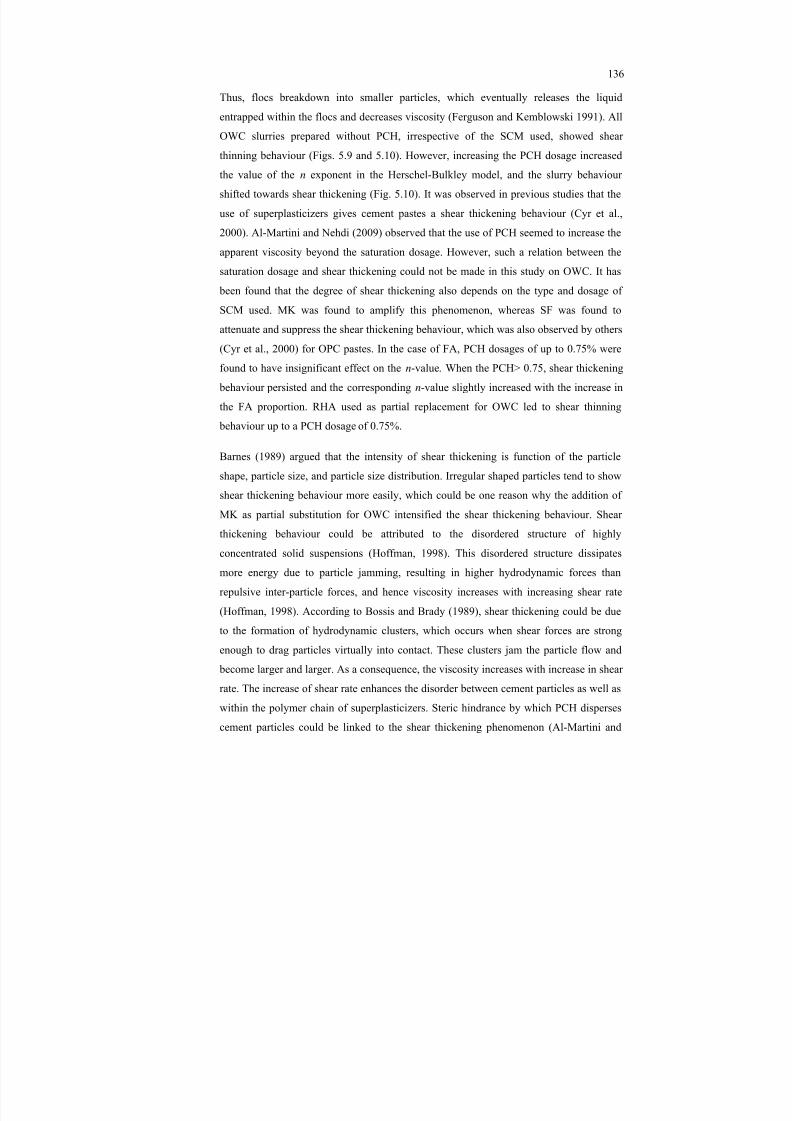
8/18/2019 Rheology of Oil Well Cement Slurries
http://slidepdf.com/reader/full/rheology-of-oil-well-cement-slurries 159/274
136
Thus, flocs breakdown into smaller particles, which eventually releases the liquidentrapped within the flocs and decreases viscosity (Ferguson and Kemblowski 1991). AllOWC slurries prepared without PCH, irrespective of the SCM used, showed shear
thinning behaviour (Figs. 5.9 and 5.10). However, increasing the PCH dosage increasedthe value of then exponent in the Herschel-Bulkley model, and the slurry behaviourshifted towards shear thickening (Fig. 5.10). It was observed in previous studies that theuse of superplasticizers gives cement pastes a shear thickening behaviour (Cyr et al.,2000). Al-Martini and Nehdi (2009) observed that the use of PCH seemed to increase theapparent viscosity beyond the saturation dosage. However, such a relation between thesaturation dosage and shear thickening could not be made in this study on OWC. It has been found that the degree of shear thickening also depends on the type and dosage ofSCM used. MK was found to amplify this phenomenon, whereas SF was found toattenuate and suppress the shear thickening behaviour, which was also observed by others(Cyr et al., 2000) for OPC pastes. In the case of FA, PCH dosages of up to 0.75% werefound to have insignificant effect on then-value. When the PCH> 0.75, shear thickening behaviour persisted and the correspondingn-value slightly increased with the increase inthe FA proportion. RHA used as partial replacement for OWC led to shear thinning behaviour up to a PCH dosage of 0.75%.
Barnes (1989) argued that the intensity of shear thickening is function of the particleshape, particle size, and particle size distribution. Irregular shaped particles tend to showshear thickening behaviour more easily, which could be one reason why the addition ofMK as partial substitution for OWC intensified the shear thickening behaviour. Shearthickening behaviour could be attributed to the disordered structure of highlyconcentrated solid suspensions (Hoffman, 1998). This disordered structure dissipatesmore energy due to particle jamming, resulting in higher hydrodynamic forces thanrepulsive inter-particle forces, and hence viscosity increases with increasing shear rate
(Hoffman, 1998). According to Bossis and Brady (1989), shear thickening could be dueto the formation of hydrodynamic clusters, which occurs when shear forces are strongenough to drag particles virtually into contact. These clusters jam the particle flow and become larger and larger. As a consequence, the viscosity increases with increase in shearrate. The increase of shear rate enhances the disorder between cement particles as well aswithin the polymer chain of superplasticizers. Steric hindrance by which PCH dispersescement particles could be linked to the shear thickening phenomenon (Al-Martini and
8/18/2019 Rheology of Oil Well Cement Slurries
http://slidepdf.com/reader/full/rheology-of-oil-well-cement-slurries 160/274
137
Nehdi, 2009). When polycarboxylate polymers adsorb on to the hydrating cement grains,repulsive interaction occurs as a consequence of elastic and mixing mechanism. Theelastic and mixing mechanisms are a function of the thickness and density of the polymer
adsorption layer, respectively (Yamada et al., 1998). In order to be dispersed, the distance between two cement particles should be equal to or higher than double the thickness ofthe polymer adsorption layer. When cement particles try to approach each other, theelastic component of the steric hindrance exhibits repulsive forces. On the other hand, themixing component of the steric hindrance produces resistance when two neighbouring polymers approach each other (Yamada et al., 1998). As a consequence, the resistance ofthe mixing component of the steric hindrance increases with the increase of PCH dosage.This is possibly the reason why the exponentn-value increased with the increase on PCHdosage and the slurry behaviour converged towards shear thickening.
5.8 Conclusions
The effects of various mineral admixtures with and without the presence of a newgeneration polycarboxylate-based high-range water reducing admixture (PCH) on therheological behaviour of API Class G oil well cement slurries were investigated at 23, 45,and 60°C. First, OWC slurries incorporating various SCMs were tested without the use ofPCH. Subsequently, PCH was used to prepare OWC slurries incorporating differentSCMs. Based on the experimental results, the following conclusions can be drawn:
The FA and RHA used in the present study reduced yield stress, which can have a positive influence on the pumpability of OWC slurries. However, MK and SFincreased yield stress when used as partial replacement for API Class G OWC.
The plastic viscosity of OWC slurries increased with the incorporation of MK, SFand RHA as partial replacement for OWC and decreased with the addition of FA.
Regardless of type and dosage of SCM, both yield stress and plastic viscosity ofOWC slurries were found to increase nonlinearly with the increase of temperature.
At a given dosage, yield stress values for OWC slurries incorporating SCMs andwithout any chemical admixtures followed the following order:SF>MK>RHA>FA at all test temperatures.
8/18/2019 Rheology of Oil Well Cement Slurries
http://slidepdf.com/reader/full/rheology-of-oil-well-cement-slurries 161/274
138
PCH, a new generation polycarboxylate-based high-range water reducingadmixture, effectively reduced the yield stress and plastic viscosity of OWCslurries prepared with or without SCM addition at all temperatures tested.
PCH was found to enhance the shear thickening behaviour of OWC slurries andthe intensity of this effect varied with the type and amount of SCM (amplifiedwith metakaolin, reduced by SF, unchanged with FA, and showed an irregular behaviour with RHA).
It should be noted that the findings reported in this study are valid for the cement,supplementary cementitious materials and chemical admixtures used herein. Othercement/admixture combinations can exhibit different characteristics. Even admixturesfrom the same category but from different source could behave differently, and thus needto be investigated separately.
5.9 References
Al-martini, S. (2008) Investigation on Rheology of Cement Paste and Concrete at HighTemperature. PhD Thesis, The University of Western Ontario, 376 p.
Al-Martini, S., and Nehdi, M. (2009) Coupled Effects of Time and High Temperature onRheological Properties of Cement Pastes Incorporating Various Superplasticizers.
Journal of Materials in Civil Engineering , ASCE, Vol. 21, No. 8, August 2009, pp. 392-401.
ANSI/API RP 10B-2. (2005). Recommended Practice for Testing Well Cements. FirstEdition, July 2005, 171 p.
Barnes, H.A. (1989). Shear-thickening (“Dilatancy”) in Suspensions of Nonaggregating
Solid Particles Dispersed in Newtonian liquids. Journal of Rheology , Vol. 33, No.2, pp. 329-366.
Bossis, G., and Brady, J.F. (1989). The Rheology of Brownian Suspensions. Journal of
Chemical Physics . Vol. 91, No. 3, 1989, pp. 1866-1874.
Caldarone, M. A., and Gruber, K. A. (1995). High Reactivity Metakaolin-A MineralAdmixture for High-Performance Concrete,” Proceedings of the International
8/18/2019 Rheology of Oil Well Cement Slurries
http://slidepdf.com/reader/full/rheology-of-oil-well-cement-slurries 162/274
139
Conference on Concrete under Severe Conditions: Environment and Loading,
CONSEC 1995 , Sapporo, Japan, K. Sakai, N. Banthia, and O. E. Gjorv, eds., Vol.2, E & FN Spon: Chapman & Hall, New York, pp. 1015-1024.
Caldarone, M. A., Gruber, K. A., and Burg, R. G. (1994). High-Reactivity Metakaolin: A New Generation Mineral Admixture.Concrete International , Vol. 16, No. 11, pp.37-40.
Chow, T. W., Mclntire, L. V., Kunze, K. R., and Cooke, C. E. (1988). The RheologicalProperties of Cement Slurries: Effect of Vibration, Hydration Conditions, andAdditives.SPE Prod. Eng. , Vol. 3, No. 4, pp. 543–550.
Cordeiro, G.C., Fairbairn, R.D.T.F., Rego, E.M. (2009). Use of Ultrafine Rice Husk Ashwith High-Carbon Content as Pozzolan in High Performance Concrete. Materials
and Structures , Vol. 42, No. 7, pp. 983-992.
Cyr, M., Legrandb, C., and Mouret, M. (2000). Study of the Shear Thickening Effect ofSuperplasticizers on the Rheological Behaviour of Cement Pastes Containing or Not Mineral Additives.Cement and Concrete Research , Vol. 30, No. 9, pp. 1477-1483.
Daukšys, M., Skripkiūnas, G., and Ivanauskas, E. (2008). Microsilica and PlasticizingAdmixtures Influence on Cement Slurry Dilatancy. Materials Science , Vol. 14, No. 2. pp. 143-150.
Ding, J.T., and Li, Z. (2002). Effects of Metakaolin and Silica Fume on Properties ofConcrete. ACI Materials Journal , Vol. 99, No. 4, pp. 393-398.
Domone, P.L. and Thurairatnam, H. (1988). The Effect of Water Cement Ratio,
Plasticizers and Temperature on the Rheology of Cement Grouts. Advances inCement Research , Vol. 1, No. 4, pp 195-206.
Eirich, R.F. 1960. Rheology Theory and Applications. Academic Press, New York andLondon, 1960, pp. 205-248.
Ferguson, J., and Kenblowski, Z. (1991). Applied Fluid Rheology. Elsevier Applied
Science , London and Newyork, pp. 209-210.
8/18/2019 Rheology of Oil Well Cement Slurries
http://slidepdf.com/reader/full/rheology-of-oil-well-cement-slurries 163/274
140
Ferraris, C.F., Obla, K.H., and Hill, R. (2001). The Influence of Mineral Admixtures onthe Rheology of Cement Paste and Concrete.Cement and Concrete Research ,Vol. 31, No. 2, pp. 245-255.
Golaszewski, J., Szwabowski, J., and Bisok, B. (2005). Interaction Between Cement andSuperplasticizer in Presence of Metakaolin.Proceedings of the International
Conference on Admixtures - Enhancing Concrete Performance , Dundee,Scotland, United kingdom, pp. 47-57.
Guillot, D. (2006). Rheology of Well Cement Slurries.Well Cementing , Edited by E.B. Nelson and Guillot, D. Schlumberger, Texas, pp. 93-142.
Habeeb, G.A., and Fayyadh, M.M. (2009). Rice Husk Ash Concrete: The Effect of RHAAverage Particle Size on Mechanical Properties and Drying Shrinkage. Australian
Journal of Basic and Applied Sciences , Vol. 3, No. 3, pp. 1616-1622.
Hoffman, R.L. (1998). Explanations for the Cause of Shear Thickening in ConcentratedColloidal Suspensions. Journal of Rheology , Vol. 42, No. 1, pp. 111-123.
Ivanov, Y.P., and Roshavelov, T.T. (1990). The Effect of Condensed Silica Fume on theRheological Behaviour of Cement Pastes. International Conference on Rheology
of Fresh Cement and Concrete , British Society of Rheology, Liverpool, March26-29, 1990, pp. 23-26.
Janotka, I., Puertas, F., Palacios, M., Kuliffayová, M., and Varga, C. (2010). MetakaolinSand Blended Cement-Pastes: Rheology, Hydration process and MechanicalProperties.Construction and Building Materials , Vol. 24, No. 5, pp. 791-802.
Lange, F., Mörtel, N., and Rudert, V. (1997).Dense packing of cement pastes and
resulting consequences on mortar properties.Cement and Concrete Research ,Vol. 27, No. 10, pp. 1481–1488.
Laskar, A.I., and Talukdar, S. (2008). Rheological Behaviour of High PerformanceConcrete with Mineral Admixtures and Their Blending.Construction and
Building Materials , Vol. 22, No. 12, 2008, pp. 2345–2354.
8/18/2019 Rheology of Oil Well Cement Slurries
http://slidepdf.com/reader/full/rheology-of-oil-well-cement-slurries 164/274
141
Michaux, M., and Nelson, E.B. (1992). Flash-Set Behaviour of Oil Well Cement SlurriesContaining Lignosulphonates.Proceedings of the 9 th International Congress on
The Chemistry of Cement , Vol. 4, 1992.
Nehdi, M., Mindess, S., and Aitcin, P.-C. (1998). Rheology of High-PerformanceConcrete: Effect of Ultrafine Particles.Cement and Concrete Research , Vol. 28, No. 5, pp. 687-697.
Nehdi, M. and Al-Martini, S. (2007). Effect of Chemical Admixtures on Rheology ofCement Pastes at High Temperature. Journal of ASTM International , Vol. 4, No.3, March 2007, 17 p.
Nehdi, M. and Rahman, M. A. (2004). Estimating Rheological Properties of CementPastes Using Various Rheological Models for Different Test Geometry, Gap andSurface Friction.Cement and Concrete Research , Vol. 34, n. 11, pp. 1993-2007.
Nehdi, M., Duquette, J., and El Damatty, A. (2003). Performance of Rice Husk AshProduced Using a New Technology as a Mineral Admixture in Concrete.Cement
and Concrete Research , Vol. 33, No. 8, pp. 1203-1210.
Nelson, E.B., Michaux, M., and Drocho, B. (2006). Cement Additives and Mechanism ofAction. In: E.B. Nelson and Guillot, D. (Eds.),Well Cementing , Schlumberger,Texas, 2006, pp. 49-91.
Orban, J., Parcevaux ,P., and Guillot, D. (1986). Influence of Shear History on theRheological Properties of Oil Well Cement Slurries.8th International Congress
on the Chemistry of Cement , Vol. 6, pp. 243− 247.
Park, C.K., Noh, M.H., and Park, T.H. (2005). Rheological Properties of Cementitious
Materials Containing Mineral Admixtures.Cement and Concrete Research , Vol.35, No. 5, pp. 842-849.
Polya, G., and Szego, G. (1951). Isoperimetric Inequality in Mathematical Physics,”Princeton University Press, Princeton, NJ, 279 p.
8/18/2019 Rheology of Oil Well Cement Slurries
http://slidepdf.com/reader/full/rheology-of-oil-well-cement-slurries 165/274
142
Rahman, M.A., and Nehdi, M. (2003). Effect of Geometry, Gap, and Surface Friction ofTest Accessory on Measured Rheological Properties of Cement Paste. ACI
Materials Journal , Vol. 100, No. 3, pp. 331-339.
Roy, D., and Asaga, K. (1979). Rheological Properties of Cement Mixes. III: The Effectsof Mixing Procedures on Viscometric Properties of Mixes ContainingSuperplasticizers.Cement and Concrete Research , Vol. 9, No. 6, pp. 731–739.
Saak, W. A. (2000). Characterization and Modeling of the Rheology of Cement Paste:With Application Toward Self-Flowing Materials.Ph.D. Thesis , University of Northwestern, 256 p.
Saak, W. A., Jennings, M. H., and Shah, P. S. (2001). The influence of wall slip on yieldstress and viscoelastic measurements of cement paste.Cement and Concrete
Research , Vol. 31, n. 2, pp. 205–212.
Saasen, A., and Log, P.A. (1996). Effect of Ilmenite Plant Dusts on RheologicalProperties of Class G Oil Well Cement Slurries.Cement and Concrete Research ,Vol. 26, No. 5, pp. 707-715.
Sabir, B.B., Wild, S., and Bai, J. (2001). Metakaolin and Calcined Clays as Pozzolans forConcrete: A review.Cement and Concrete Composites , Vol. 23, No. 6, pp. 441-454.
Sakai, E., Hoshimo, S., Ohba, Y., and Daimon, M. (1997). The Fluidity of Cement Pastewith Various Types of Inorganic Powders.Proceedings of the 10th International
Congress on the Chemistry of Cement , Sweden, Vol. 2, 8 p.
Skripkiūnas, G., Daukšys, M. (2004). Dilatancy of Cement Slurries With Chemical
Admixtures. Journal of Civil Engineering and Management , Vol. 10, No. 3, pp.227-233.
Soroka, I. (1993). Concrete in Hot Environments. E & FN Spon, London, 1993, 243 p.
Sybert, F, and Reick, P. (1990). Effect of Fly Ash on the Rheological Properties ofCement Paste. International Conference on Rheology of Fresh Cement and
Concrete , British Society of Rheology, Liverpool, March 26-29, pp. 13-22.
8/18/2019 Rheology of Oil Well Cement Slurries
http://slidepdf.com/reader/full/rheology-of-oil-well-cement-slurries 166/274
143
Vidick, B., Oberste-Padtberg, R., Rondelez, F. (1987). Selective Surface Determinationof the Silicate Phases in Portland Cement Powders Using Alkyltrichlorosilane.Cement and Concrete Research , Vol. 17, No. 4, 1987, pp. 624-632.
Vikan, H. and Justnes, H. (2003). Influence of Silica Fume on Rheology of Cement Paste.
3rd International Symposium on Self-Compacting Concrete , Editor Ólafur H.Wallevik, Indriði Níelsson, 17-20 August, 2003, Iceland, pp. 190-201.
Volpert, E. (2005). Cementing Compositions Including a Dispersant Agent for CementingOperation in Oil Wells. US Patent 6953091, 2005.
White, E.L., Lenkei, M., Roy, D.M., and Tamas, F.D. (1985). Effect of Fly Ash and
Superplasticizers on the Rheology of Cement Slurries. Materials Research Society
Symposia Proceedings , Vol. 43, p 95-106.
Williams, A. D., Saak, W. A., and Jennings, H. M. (1999). The Influence of Mixing onthe Rheology of Fresh Cement Paste.Cement and Concrete Research , Vol. 29, No. 9, 1999, pp. 1491–1496.
Yahia, A. and Khayat, K. H. (2001). Analytical Models for Estimating Yield Stress ofHigh Performance Pseudoplastic Grout.Cement and Concrete Research , Vol. 31, No. 5, 2001, pp. 731-738.
Yamada, K., Hanehara, S., and Honma, K. (1998). The Effect Of Naphthalene SulphonateType And Polycarboxylate Type Superplasticizers On The Fluidity Of Belite-RichCement Concrete.Proceedings Inter. Workshop on Self-Compacting Concrete ,Kochi University of Technology, Kochi, Japan, 1998, pp. 201-210.
Yijin, L., Shiqiong, Z., and Yingli, G. (2004). The Effect of Fly Ash on the Fluidity of
Cement Paste, Mortar, and Concrete.Proceedings of the International Workshopon Sustainable Development and Concrete Technology , Beijing, pp. 339–345.
Zhang, X., and Han, J. (2000). The Effect of Ultra-Fine Admixture on The RheologicalProperty Of Cement Paste.Cement and Concrete Research , Vol. 30, No. 5, pp.827-830.
8/18/2019 Rheology of Oil Well Cement Slurries
http://slidepdf.com/reader/full/rheology-of-oil-well-cement-slurries 167/274
144
C h a p t e r 6
MODELING RHEOLOGICAL PROPERTIES OF OIL WELLCEMENT SLURRIES USING MULTIPLE REGRESSION ANALYSIS
AND ARTIFICIAL NEURAL NETWORKS *
6.1 Introduction
The recent oil spill in the Gulf of Mexico and the associated environmental and economic
impact has put renewed emphasis on the importance of oil well cementing operations.
The rheological properties of oil well cement (OWC) slurries are important in assuring
that such slurries can be mixed at the surface and pumped into the well with minimum
pressure drop, thereby achieving effective well cementing operation. The rheological properties of OWC slurries depend on various factors including the water-cement ratio
(w/c), size and shape of cement grains, chemical composition of the cement and relative
distribution of its components at the surface of grains, presence and type of additives,
compatibility between cement and chemical admixtures, mixing and testing procedures,
time and temperature, etc. The interactions among the above mentioned factors play a
vital role in altering the rheological properties of OWC slurries. Moreover, a wide range
of bottom-hole pressure and temperature makes the characterization of the rheology of OWC
slurries more challenging than that of normal cement paste. Therefore, a clear understandingof this complex behaviour is important in order to successfully predict the rheological
properties of OWC slurries.
Much work has been conducted over the last few decades to investigate the rheological
behaviour of cementitious systems such as cement paste, mortar, grout, slurry and
concrete. A number of shear stress-strain rate relationships have been developed for
cement slurries. However, there exists no model that explains the interactions among the
materials used for preparing such slurries and test conditions such as temperature, shear
rate, etc. The power-law, Bingham, and Herschel-Bulkley models are the most commonly
used in the well cementing industry (Guillot, 2006). Such models are comprised of
empirical expressions derived from the analysis of limited experimental data and/or based
* A part of this chapter has been under review for publication in ASCE Journal of Materials in CivilEngineering, 2010. Another part has been submitted to Construction & Building Materials, 2011.
8/18/2019 Rheology of Oil Well Cement Slurries
http://slidepdf.com/reader/full/rheology-of-oil-well-cement-slurries 168/274
145
on simplifying assumptions (El-Chabib and Nehdi, 2005). Moreover, they do not have
true predictive capability outside the experimental domain and/or when different
materials are used (El-Chabib et al., 2003), and do not explain the interactions among test
parameters.
Artificial neural networks (ANNs) are powerful computational tool that allow overcoming the
difficulty of assessing the complex and highly nonlinear relationships among model
parameters through self-organization, pattern recognition, and functional approximation. ANN
simulates the structure and internal functions of the biological brain. Unlike conventional
models, ANN does not assume a model structure between input and output variables. It rather
generates the model based on the database provided for training the network. An ANN solves
problems by creating parallel networks and the learning of those networks, rather than by a
specific programming scheme based on well-defined rules or assumptions (Bruni et al., 2006).
On the other hand, multiple regression analysis (MRA) is a statistical method to learn about
the analytical relationship between several independent or predictor variables (input variables)
and a dependent or criterion variable (output variable) (Statsoft, 2010). The relations may be
linear or nonlinear, and independent variables may be quantitative or qualitative. MRA
explains the effects of a single input variable or multiple variables on the output variable with
or without considering the effects of other variables (Cohen et al., 2003).
Temperature has been found to have drastic effects on the rheological behaviour ofcement slurries. Its effect also depends on the type of cement and admixtures used. Thus,
it was argued that it would be difficult to find a general model that can represent the
temperature dependency of cement slurry rheology (Guillot, 2006). Ravi and Sutton
(1990) developed a correlation to calculate the equilibrium temperature for plastic
viscosity and yield stress of Class H cement slurries using a high-pressure, high-
temperature rheometer. It was found that both plastic viscosity and yield stress increased
with the increase in temperature. However, plastic viscosity reached a constant value
beyond the equilibrium temperature, whereas there was no evidence for yield stress to
attain a constant value beyond a certain temperature. Using the Bingham plastic model,
Ravi and Sutton (1990) developed equations to represent the variation of rheological
parameters with temperature where the yield stress and plastic viscosity values were
measured at 80°F (27°C) and limited to a maximum temperature, T max. Their equations
below were developed using cement systems containing specific additives, and are thus
dependent on the slurry composition.
8/18/2019 Rheology of Oil Well Cement Slurries
http://slidepdf.com/reader/full/rheology-of-oil-well-cement-slurries 169/274
146
)00325.0()()( 2T T baT p (6.1)
Where, p is in mPa.s and T is in °F; and pa 3054.10729.65 at 80°F; and
pb 00381.00734.1 at 80°F.
Currently, there is need to create a reliable method for predicting the rheological
performance of OWC slurries and relating its composition (admixture type, dosage, etc.)
and test conditions (e.g. shear rate, temperature) to the expected rheological properties. In
this framework, ANN and MRA have been used in the present study to develop models to
predict the shear stress of OWC slurries at a given shear rate, as a function of the
temperature and admixture dosage. The ability of the models thus developed to evaluate
the sensitivity of rheological properties to the variation of shear rate, admixture dosage,
and test temperature was investigated. Hence, a shear stress-shear rate curve for OWC
slurries can be predicted at different temperatures prior to fitting the data to conventional
rheological models. Consequently, the rheological properties of OWC slurries can be
predicted as a function of mixture composition and test conditions for the first time.
6.2 Experimental Program
6.2.1 Materials
OWC slurries used in this study were prepared using a high sulphate-resistant API ClassG OWC with a specific gravity of 3.14. Deionized distilled water was used for the
mixing, and its temperature was maintained at 23±1°C using an isothermal container.
Three different chemical admixtures including a new generation polycarboxylate-based
high-range water reducing admixture (PCH), polycarboxylate-based mid-range water
reducing admixture (PCM) and mid-range lignosulphonate based water reducing
admixture (LSM) were used to prepare the OWC slurries with a w/c = 0.44. Their
dosages are presented in Table 6.1.
6.2.2 Apparatus
The OWC slurries were prepared using a variable speed high-shear blender type mixer
with bottom drive blades as per the ANSI/API Recommended Practice 10B-2 (2005). A
high accuracy advanced rheometer (TA instruments AR 2000) (Fig. 4.1(a) (Chapter 4))
was used to measure the rheological properties of the slurries. The rheometer is capable
of continuous shear rate sweep and stress sweep. The coaxial concentric cylinder
8/18/2019 Rheology of Oil Well Cement Slurries
http://slidepdf.com/reader/full/rheology-of-oil-well-cement-slurries 170/274
147
geometry was considered suitable for this study because of the typically low viscosity of
OWC slurries. The geometry consists of a cylinder with a conical end that rotates inside a
cylinder with a central fixed hollow as shown in Fig. 4.1(b) (Chapter 4). The rheometer is
equipped with a rheological data analysis software, which can fit the shear stress-strain
rate data to several rheological models. The Bingham model was used throughout thisstudy to calculate the rheological properties of cement slurries, i.e. yield stress and plastic
viscosity.
Table 6.1 Chemical admixtures used for preparing oil well cement slurries
Type of admixture Abbreviation Dosages % BWOC*
New generation polycarboxylate- based high-range water reducingadmixture
Polycarboxylate-based mid-rangewater reducing admixture
Mid-range lignosulphonate basedwater reducing admixture
PCH
PCM
LSM
0.25, 0.50, 0.75, and 1.00
0.25, 0.50, 0.75, and 1.00
0.5, 1.0, 1.5 and 2.0
* BWOC: by weight of cement
6.3 Experimental Procedure
The cement slurries were prepared using a high-shear blender type mixer with bottom
driven blades as per the ANSI/API Recommended Practice 10B-2 ( ANSI/API RP 10B-2,
2005) at a controlled ambient room temperature of 23±1°C. The prepared slurry was then
placed into the bowl of a mixer for preconditioning over 20 minutes at the test
temperature (23°C, 45°C, or 60°C) at a speed of 150 rpm. The total time between the
beginning of mixing and the start of the rheological tests was kept constant to avoid the
effects of exogenous variables on the results. The rheometer set-up was also maintained
constant for all tested slurries. The concentric cylinder test geometry was maintained at
the test temperature so as to avoid sudden thermal shock of the slurry.
After mixing and preconditioning, the cement slurry sample was placed in the coaxial
cylinder of the rheometer. The temperature was adjusted to the required level and the
sample was then subjected to a stepped ramp or steady state flow where rheological
measurements were taken at 20 different shear rates starting from 5.11 s -1 up to 511 s -1
after a continuous rotation of 10 sec at each level. Subsequently, the data were measured
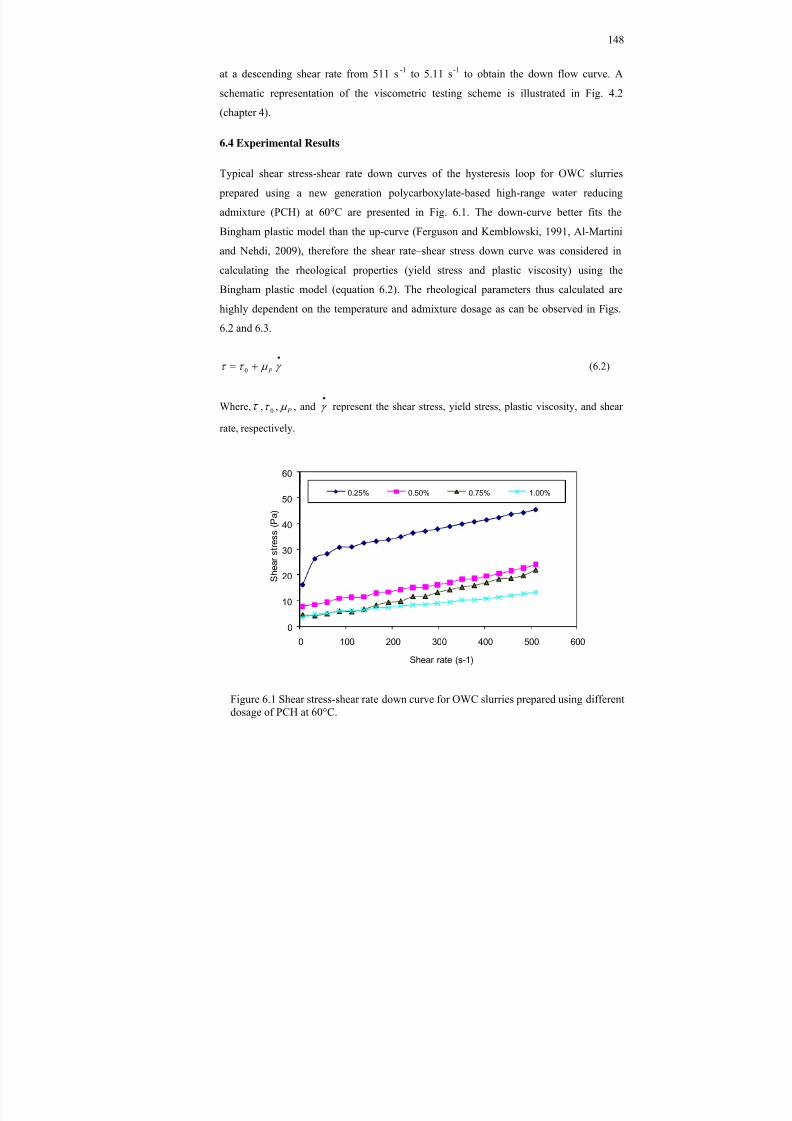
8/18/2019 Rheology of Oil Well Cement Slurries
http://slidepdf.com/reader/full/rheology-of-oil-well-cement-slurries 171/274
148
at a descending shear rate from 511 s -1 to 5.11 s -1 to obtain the down flow curve. A
schematic representation of the viscometric testing scheme is illustrated in Fig. 4.2
(chapter 4).
6.4 Experimental Results
Typical shear stress-shear rate down curves of the hysteresis loop for OWC slurries
prepared using a new generation polycarboxylate-based high-range water reducing
admixture (PCH) at 60°C are presented in Fig. 6.1. The down-curve better fits the
Bingham plastic model than the up-curve (Ferguson and Kemblowski, 1991, Al-Martini
and Nehdi, 2009), therefore the shear rate–shear stress down curve was considered in
calculating the rheological properties (yield stress and plastic viscosity) using the
Bingham plastic model (equation 6.2). The rheological parameters thus calculated are
highly dependent on the temperature and admixture dosage as can be observed in Figs.
6.2 and 6.3.
P 0 (6.2)
Where, , 0 , P , and represent the shear stress, yield stress, plastic viscosity, and shear
rate, respectively.
0
10
20
30
40
50
60
0 100 200 300 400 500 600
S h e a r s
t r e s s
( P a
)
Shear rate (s-1)
0.25% 0.50% 0.75% 1.00%
Figure 6.1 Shear stress-shear rate down curve for OWC slurries prepared using differentdosage of PCH at 60°C.
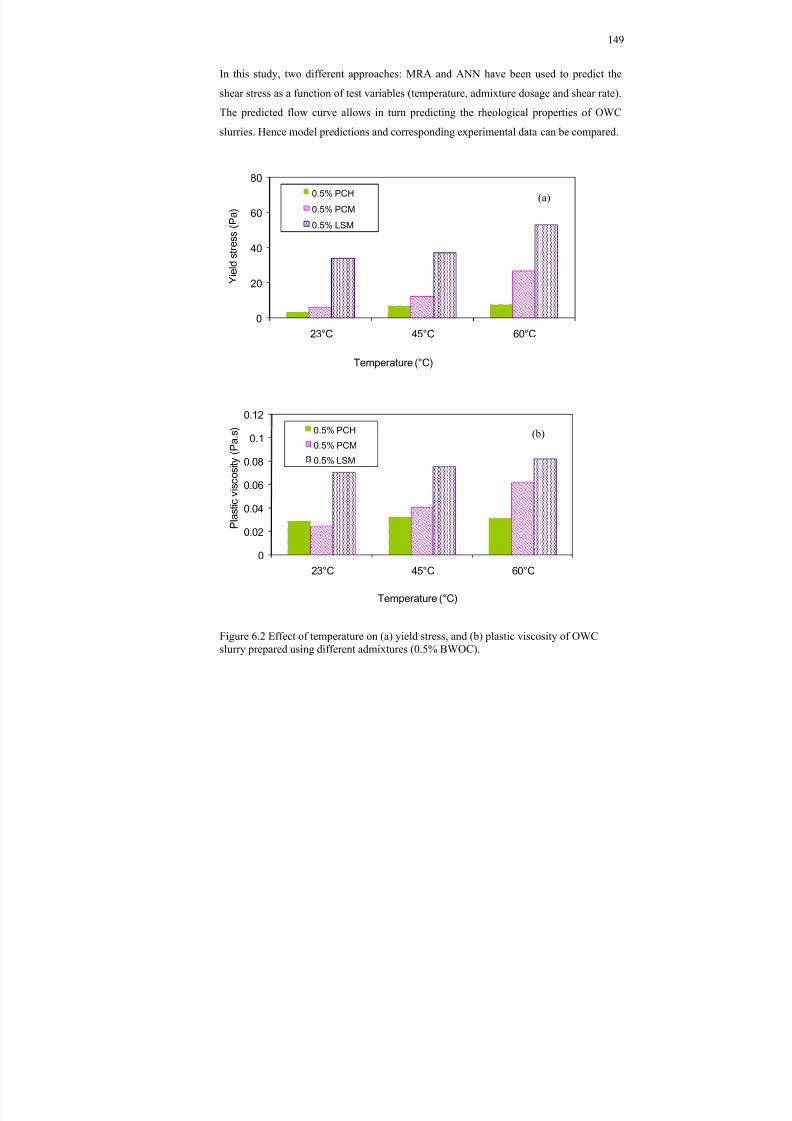
8/18/2019 Rheology of Oil Well Cement Slurries
http://slidepdf.com/reader/full/rheology-of-oil-well-cement-slurries 172/274
149
In this study, two different approaches: MRA and ANN have been used to predict the
shear stress as a function of test variables (temperature, admixture dosage and shear rate).
The predicted flow curve allows in turn predicting the rheological properties of OWC
slurries. Hence model predictions and corresponding experimental data can be compared.
Figure 6.2 Effect of temperature on (a) yield stress, and (b) plastic viscosity of OWCslurry prepared using different admixtures (0.5% BWOC).
0
20
40
60
80
23°C 45°C 60°C
Y i e l d s
t r e s s
( P a
)
Temperature (°C)
0.5% PCH
0.5% PCM
0.5% LSM
0
0.02
0.04
0.06
0.08
0.1
0.12
23°C 45°C 60°C
P l a s
t i c v
i s c o s
i t y ( P a . s
)
Temperature (°C)
0.5% PCH
0.5% PCM
0.5% LSM
(a)
(b)
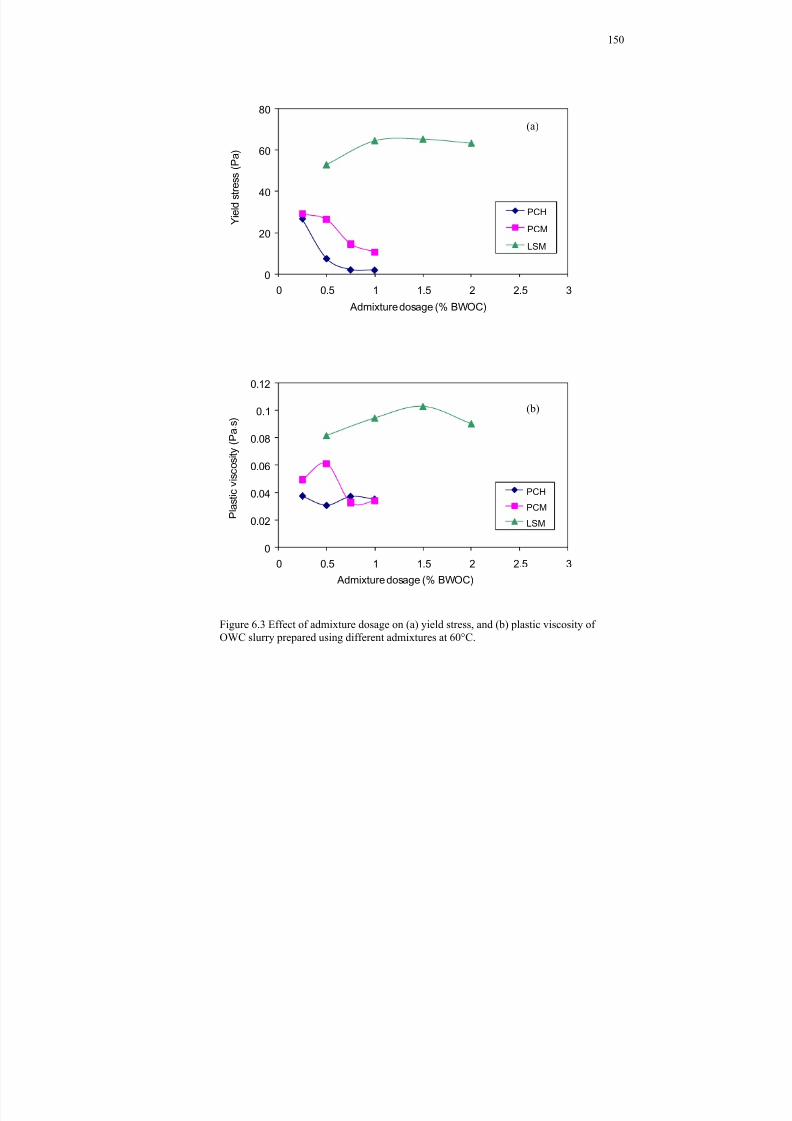
8/18/2019 Rheology of Oil Well Cement Slurries
http://slidepdf.com/reader/full/rheology-of-oil-well-cement-slurries 173/274
150
Figure 6.3 Effect of admixture dosage on (a) yield stress, and (b) plastic viscosity ofOWC slurry prepared using different admixtures at 60°C.
0
20
40
60
80
0 0.5 1 1.5 2 2.5 3
Y i e l d s
t r e s s
( P a )
Admixture dosage (% BWOC)
PCH
PCM
LSM
0
0.02
0.04
0.06
0.08
0.1
0.12
0 0.5 1 1.5 2 2.5 3
P l a s
t i c v
i s c o s i t y
( P a . s
)
Admixture dosage (% BWOC)
PCH
PCM
LSM
(a)
(b)
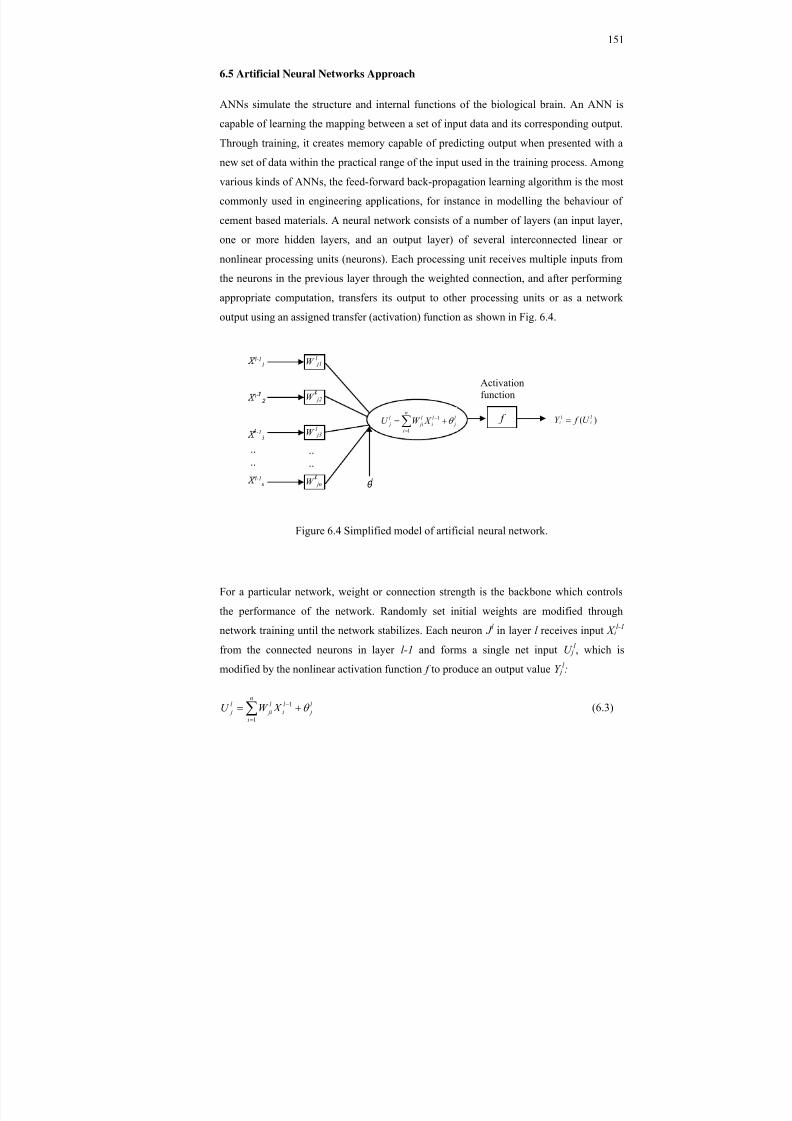
8/18/2019 Rheology of Oil Well Cement Slurries
http://slidepdf.com/reader/full/rheology-of-oil-well-cement-slurries 174/274
151
6.5 Artificial Neural Networks Approach
ANNs simulate the structure and internal functions of the biological brain. An ANN is
capable of learning the mapping between a set of input data and its corresponding output.
Through training, it creates memory capable of predicting output when presented with a
new set of data within the practical range of the input used in the training process. Among
various kinds of ANNs, the feed-forward back-propagation learning algorithm is the most
commonly used in engineering applications, for instance in modelling the behaviour of
cement based materials. A neural network consists of a number of layers (an input layer,
one or more hidden layers, and an output layer) of several interconnected linear or
nonlinear processing units (neurons). Each processing unit receives multiple inputs from
the neurons in the previous layer through the weighted connection, and after performing
appropriate computation, transfers its output to other processing units or as a networkoutput using an assigned transfer (activation) function as shown in Fig. 6.4.
Figure 6.4 Simplified model of artificial neural network.
For a particular network, weight or connection strength is the backbone which controls
the performance of the network. Randomly set initial weights are modified through
network training until the network stabilizes. Each neuron J l in layer l receives input X il-1
from the connected neurons in layer l-1 and forms a single net input U jl , which is
modified by the nonlinear activation function f to produce an output value Y jl :
n
i
l j
l i
l ji
l j X W U
1
1 (6.3)
f
Activationfunction
)( l l U f Y
........
W l j1
W j2
W l j3
W jn
l-11
l -2
-13
l-1n
n
i
l j
l i
l ji
l j X W U
1
1
θ
8/18/2019 Rheology of Oil Well Cement Slurries
http://slidepdf.com/reader/full/rheology-of-oil-well-cement-slurries 175/274
152
)( l j
l j U f Y (6.4)
where l jiW is the connection strength between neurons i and j in layers l and l-1,
respectively, n is the number of neurons in layer l-1, and θ l j is a threshold value assigned
to neuron j in layer l.
Because of the differentiability requirement needed in the back-propagation technique,
the nonlinear log-sigmoid function presented in equation (6.5) is the most commonly used
activation function. This function generates an output between 0 and 1 as the neuron’s net
input can have any value from negative to positive infinity (Demuth et al., 2008).
)(1
1l j
l jU
l j
e f
(6.5)
The generalized delta rule, developed by Rumelhart et al. (1986 ) is generally used as a
learning mechanism in back-propagation neural networks. In this approach, the
connection strength or weights are updated at a rate of k , known as the learning rate, in
the direction in which the total network error decreases rapidly (towards the solution
weights by correcting the errors). An iteration of this algorithm can be described as
follows:
ji
k
k k
jik
ji W E
W W 1 (6.6)
where, W k ji is a weight vector of current weights, k is the learning rate and E k is the k th
error term. The selection of the learning rate is case sensitive and usually ranges from 0.0
to 1.0. A very high rate of learning may lead to rapid training, but it may not converge to
a stable solution. A very low rate of learning, on the other hand, increases the training
time and the algorithm takes too long to converge (El-Chabib and Nehdi, 2005).
The momentum is used to stabilize the weight trajectory. In this process, the weight is
modified based on the current error correction to weights, plus some portion of the
previous weight change shown in equation (6.7):
11 k ji
k ji
k ji
k ji W W W W (6.7)
8/18/2019 Rheology of Oil Well Cement Slurries
http://slidepdf.com/reader/full/rheology-of-oil-well-cement-slurries 176/274
153
where, is the momentum term. The value of the momentum should always be less than
1.0. The network becomes completely insensitive to the local gradient and, therefore, fails
to learn properly when (Demuth et al., 2008).
Over-fitting leads to a precise prediction of the training patterns yet can also cause poor
generalization of new patterns. On the other hand, a premature training may cause
unsatisfactory performance because of not adequately learning the embedded
relationships between inputs and outputs. The training continues until it converges to a
desired minimum error between its predicted outputs and the desired targets provided in
the training process. The duration of training can be determined by (a) limiting the
number of iterations, called training epochs, (b) setting a desired minimum error, or (c)
monitoring the trend of error improvement so that training will be stopped when no or
little improvement in the training error is reported over a given number or epochs. In eachiteration, the error (as shown in equation 6.8) is compared with the convergence
tolerance; if it is not met, the iteration continues and the calculated system error is back
propagated to the network to adjust the weights and thresholds in a gradient search for the
desired minimum system error (El-Chabib and Nehdi, 2005).
P
p
K
k pk pk st ot
P E
1 1
2)(1
(6.8)
where, E st is the system error , p is a training pattern, P is the number of training patterns
assigned to one epoch, and t pk and o pk are the predicted output and provided target of
pattern p at output unit k , respectively.
The construction of a successful neural network requires considering three important
steps: selection of database, network architecture, and network training and testing.
6.5.1 Selection of Database
Although ANNs have been successfully used in predicting complex nonlinear
relationships and in modeling various aspects in cement and concrete research, their
efficiency depends on the quality of the database used for training (El-Chabib et al.,
2003). In order to account for the primary aspects that influence the input-output
relationship of rheological properties of OWC slurries and capture the practical range of
key input parameters (shear rate, admixture dosage and temperature), the network should
be trained using a large and comprehensive set of reliable experimental data. In order to
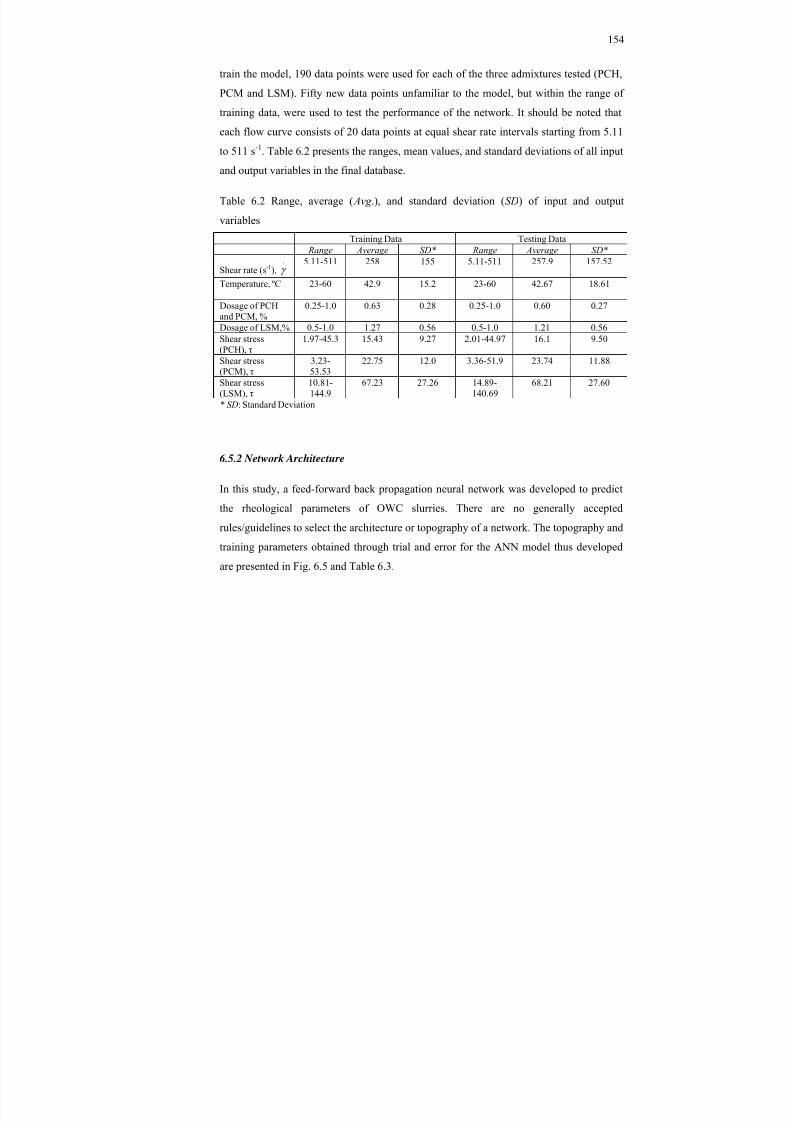
8/18/2019 Rheology of Oil Well Cement Slurries
http://slidepdf.com/reader/full/rheology-of-oil-well-cement-slurries 177/274
154
train the model, 190 data points were used for each of the three admixtures tested (PCH,
PCM and LSM). Fifty new data points unfamiliar to the model, but within the range of
training data, were used to test the performance of the network. It should be noted that
each flow curve consists of 20 data points at equal shear rate intervals starting from 5.11
to 511 s-1
. Table 6.2 presents the ranges, mean values, and standard deviations of all inputand output variables in the final database.
Table 6.2 Range, average ( Avg .), and standard deviation ( SD) of input and output
variables
Training Data Testing Data Range Average SD* Range Average SD*
Shear rate (s -1),.
5.11-511 258 155 5.11-511 257.9 157.52
Temperature, ºC 23-60 42.9 15.2 23-60 42.67 18.61
Dosage of PCHand PCM, %
0.25-1.0 0.63 0.28 0.25-1.0 0.60 0.27
Dosage of LSM,% 0.5-1.0 1.27 0.56 0.5-1.0 1.21 0.56Shear stress(PCH), τ
1.97-45.3 15.43 9.27 2.01-44.97 16.1 9.50
Shear stress(PCM), τ
3.23-53.53
22.75 12.0 3.36-51.9 23.74 11.88
Shear stress(LSM), τ
10.81-144.9
67.23 27.26 14.89-140.69
68.21 27.60
* SD: Standard Deviation
6.5.2 Network Architecture
In this study, a feed-forward back propagation neural network was developed to predict
the rheological parameters of OWC slurries. There are no generally accepted
rules/guidelines to select the architecture or topography of a network. The topography and
training parameters obtained through trial and error for the ANN model thus developed
are presented in Fig. 6.5 and Table 6.3.
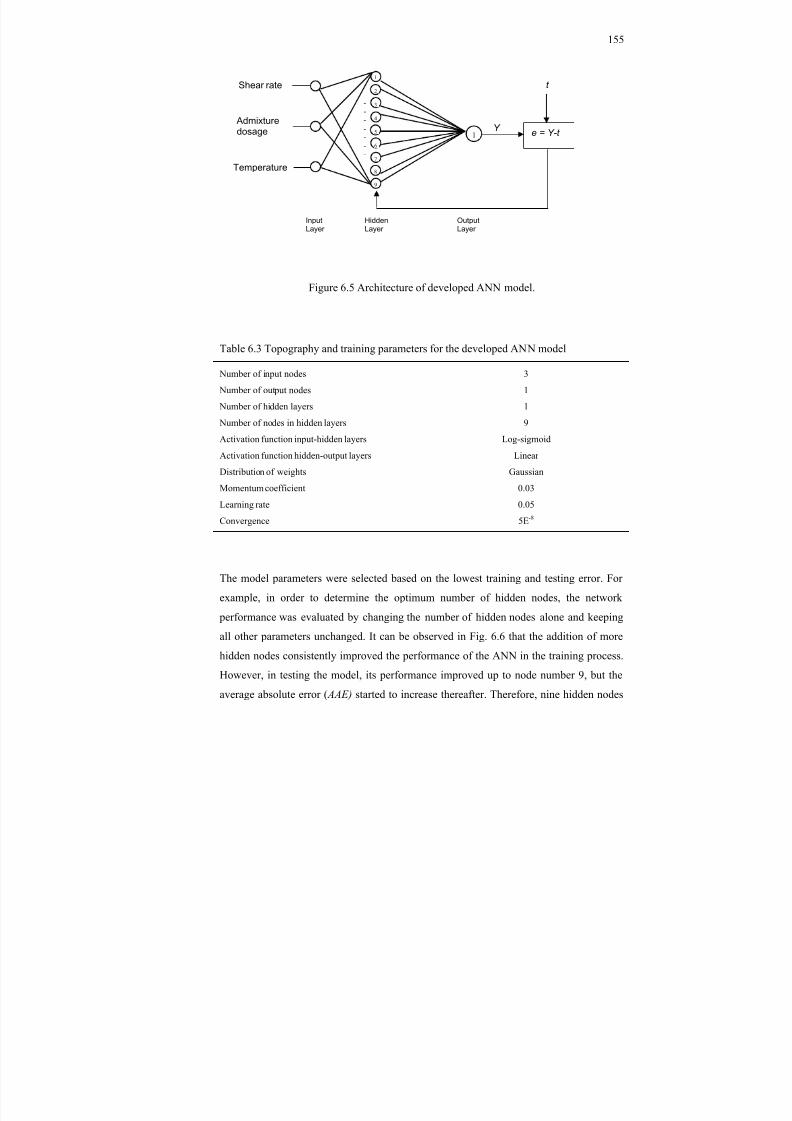
8/18/2019 Rheology of Oil Well Cement Slurries
http://slidepdf.com/reader/full/rheology-of-oil-well-cement-slurries 178/274
155
Figure 6.5 Architecture of developed ANN model.
Table 6.3 Topography and training parameters for the developed ANN model
Number of input nodes
Number of output nodes
Number of hidden layers
Number of nodes in hidden layers
Activation function input-hidden layers
Activation function hidden-output layersDistribution of weights
Momentum coefficient
Learning rate
Convergence
3
1
1
9
Log-sigmoid
LinearGaussian
0.03
0.05
5E -8
The model parameters were selected based on the lowest training and testing error. For
example, in order to determine the optimum number of hidden nodes, the network
performance was evaluated by changing the number of hidden nodes alone and keeping
all other parameters unchanged. It can be observed in Fig. 6.6 that the addition of more
hidden nodes consistently improved the performance of the ANN in the training process.
However, in testing the model, its performance improved up to node number 9, but the
average absolute error ( AAE) started to increase thereafter. Therefore, nine hidden nodes
Y
-------
1
1t
2
3
4
5
6
7
8
9
Shear rate
Admixturedosage
Temperature
e = Y-t
InputLayer
HiddenLayer
OutputLayer
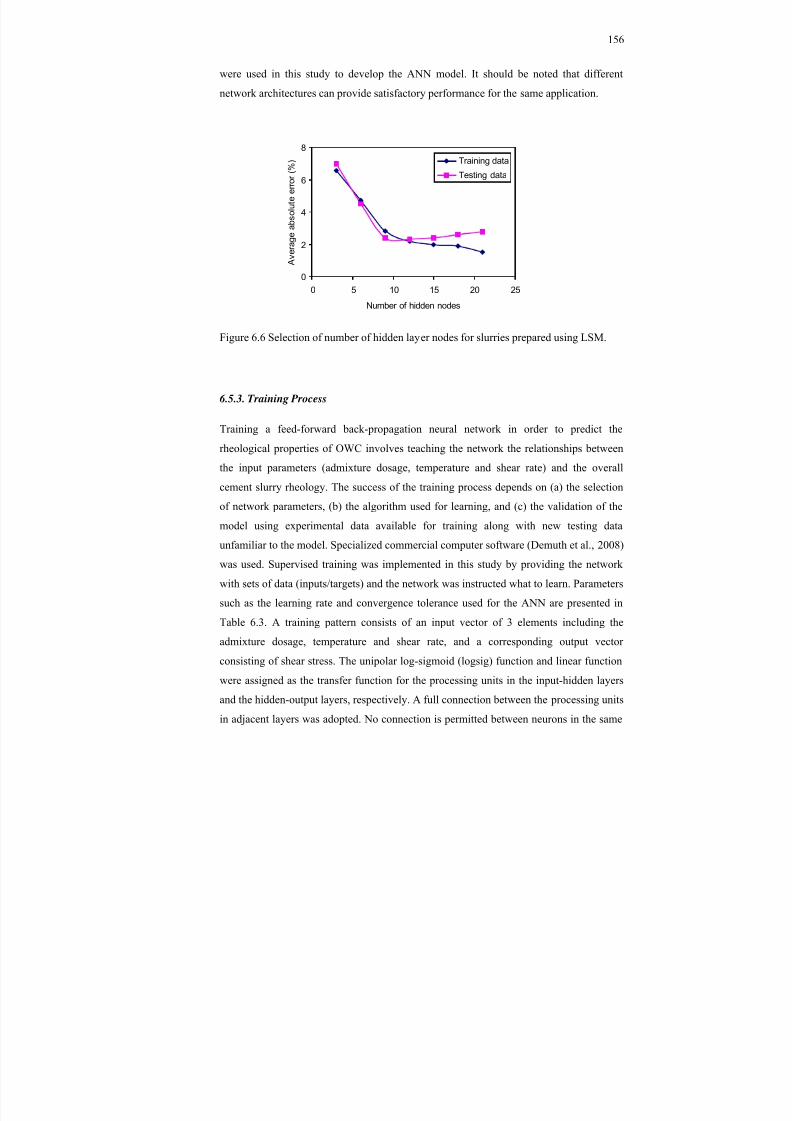
8/18/2019 Rheology of Oil Well Cement Slurries
http://slidepdf.com/reader/full/rheology-of-oil-well-cement-slurries 179/274
156
were used in this study to develop the ANN model. It should be noted that different
network architectures can provide satisfactory performance for the same application.
Figure 6.6 Selection of number of hidden layer nodes for slurries prepared using LSM.
6.5.3. Training Process
Training a feed-forward back-propagation neural network in order to predict the
rheological properties of OWC involves teaching the network the relationships between
the input parameters (admixture dosage, temperature and shear rate) and the overall
cement slurry rheology. The success of the training process depends on (a) the selection
of network parameters, (b) the algorithm used for learning, and (c) the validation of the
model using experimental data available for training along with new testing data
unfamiliar to the model. Specialized commercial computer software (Demuth et al., 2008)
was used. Supervised training was implemented in this study by providing the network
with sets of data (inputs/targets) and the network was instructed what to learn. Parameters
such as the learning rate and convergence tolerance used for the ANN are presented inTable 6.3. A training pattern consists of an input vector of 3 elements including the
admixture dosage, temperature and shear rate, and a corresponding output vector
consisting of shear stress. The unipolar log-sigmoid (logsig) function and linear function
were assigned as the transfer function for the processing units in the input-hidden layers
and the hidden-output layers, respectively. A full connection between the processing units
in adjacent layers was adopted. No connection is permitted between neurons in the same
0
2
4
6
8
0 5 10 15 20 25
Number of hidden nodes
A v e r a g e a
b s o
l u t e e r r o r
( % ) Training data
Testing data
8/18/2019 Rheology of Oil Well Cement Slurries
http://slidepdf.com/reader/full/rheology-of-oil-well-cement-slurries 180/274
157
layer. After completion of each learning process, the average sum-squared of all errors
was calculated and back-propagated through the Levenberg-Marquardt (Demuth et al.,
2008) algorithm to adjust the weights or connection strengths between the processing
units. The Levenberg-Marquardt algorithm makes the leaning process faster and is based
on the Jacobian matrix J that contains the first derivative of the network errors ofcorresponding weights. An iteration of the algorithm can be expressed as:
e J I J J W W T T k k 11 (6.9)
where W k is a vector of current weights, μ is a leaning rate, J is the Jacobian matrix, J T is
the transpose matrix of J , I is the identity matrix, and e is a vector of network errors. This
iterative process continues until the network converges and a set of weights that
minimizes the system error to the desired level or the maximum number of iterations(epochs) has been reached.
6.6 Multiple Regression Analysis
In the MRA-based approach, the dependent variables yield stress and plastic viscosity
were correlated to the independent variables; i.e. shear rate, admixture dosage, and test
temperature using first (linear) and then second (polynomial) order regression models. It
was found that no substantial improvement was achieved by the polynomial regression.
Therefore, the linear regression-based approach was used to observe the effect of
temperature, admixture dosages and shear rate on shear stress. As a consequence, the shear
stress values versus shear rate, admixture dosage and test temperature, were predicted
using the following relationship:
T DhT gDT f DedT cDba A A A A (6.10)
where, a, b, c, d, e, f, g, and h are regression coefficients, and , , D A and T are the shear
stress, shear rate, dosage of admixture and temperature, respectively.
In order to perform the regression analysis, a total of 240 data points from down curves of
the hysteresis loops were used for each of the three admixtures tested (PCH, PCM and
LSM). Each data point consists of 3 input variables including shear rate, dosage of
admixture and temperature, and one output parameter: shear stress. The least square
approach was followed to estimate the coefficients of the model parameters. The
8/18/2019 Rheology of Oil Well Cement Slurries
http://slidepdf.com/reader/full/rheology-of-oil-well-cement-slurries 181/274
158
interaction between the considered three input parameters and the output parameter were
also accounted for during the regression analyses and expressed in terms of t and
probability ( Prob. >|t |) values. The probability value indicates the probability that the
result obtained in a statistical test is due to chance rather than to a true relationship
between the parameters (Genentech, 2010; Montgomery, 2009). The effects of the input parameters on the output parameters are considered highly significant when t values are
high and probability values are low. The parameter is often considered nonzero and
significantly influences the response of the model when the probability values are less
than 5% (Sonebi, 2001; Health and Income Equity, 2010).
6.7 Model Performance
The developed models using the ANN and MRA techniques predicted the shear stress of
the OWC slurries and the acceptability/rejection of the model was evaluated using the
average absolute error ( AAE ) given by equation 4 and the correlation coefficient ( R2).
n
i measured
predicted measured
n AAE
1
1
(6.11)
where τ measured and τ predicted are the experimentally measured shear stress value of OWC
slurries and the corresponding data predicted by the model, respectively, and n is the total
number of data points.
6.7.1 Validation of ANN and MRA-Based Models
The artificial neural network model shown in Fig. 6.5 was trained using 190 training
(input/target) patterns for each of the admixtures investigated, and tested using 50
patterns of new data points unfamiliar to the network and not used in the training process.
Figures 6.7, 6.8 and 6.9 illustrate the performance of the ANN in predicting the shear
stress of OWC slurries incorporating PCN, PCM, and LSM, respectively. After successful
completion of the training process, the network performance in predicting the shear stress
of OWC slurries incorporating PCH was investigated and the results are presented in Fig.
6.7(a). It can be observed that all data points are located on or in the vicinity of the equity
line with an AAE of 3.43%. For cement slurries incorporating PCM, the relationship
between measured and predicted shear stress is presented in Fig. 6.8(a). The model was
successfully trained to predict the shear flow with an AAE of 3.17%. Similarly, Fig. 6.9(a)
8/18/2019 Rheology of Oil Well Cement Slurries
http://slidepdf.com/reader/full/rheology-of-oil-well-cement-slurries 182/274
159
represents the performance of the ANN model in predicting the shear stress of cement
slurries incorporating LSM. It can be observed that the model was able to predict the
shear stress of the cement slurries satisfactorily since the measured and corresponding
predicted data points are located along the equity line with an AAE of 2.82%.
The acceptance/rejection of the ANN model depends primarily on its performance in
predicting the shear stress of new sets of unfamiliar data within the range of input
variables of training patterns. In order to validate the developed model, the network was
presented with 50 new sets of data which were not used in training the network. In this
case, only input vectors of shear rate, dosage of admixture and temperature were
presented to the network and no information or knowledge about the corresponding shear
stress was provided. The response of the neural network is presented in Figs. 6.7(b),
6.8(b) and 6.9(b) for OWC mixtures made with PCH, PCM and LSM, respectively. Themodel predictions are accurate since the testing points are located slightly over or under
the equity line but within the cluster of training data with an AAE of 2.76, 2.77 and 2.81%
for slurries with PCH, PCM and LSM, respectively.
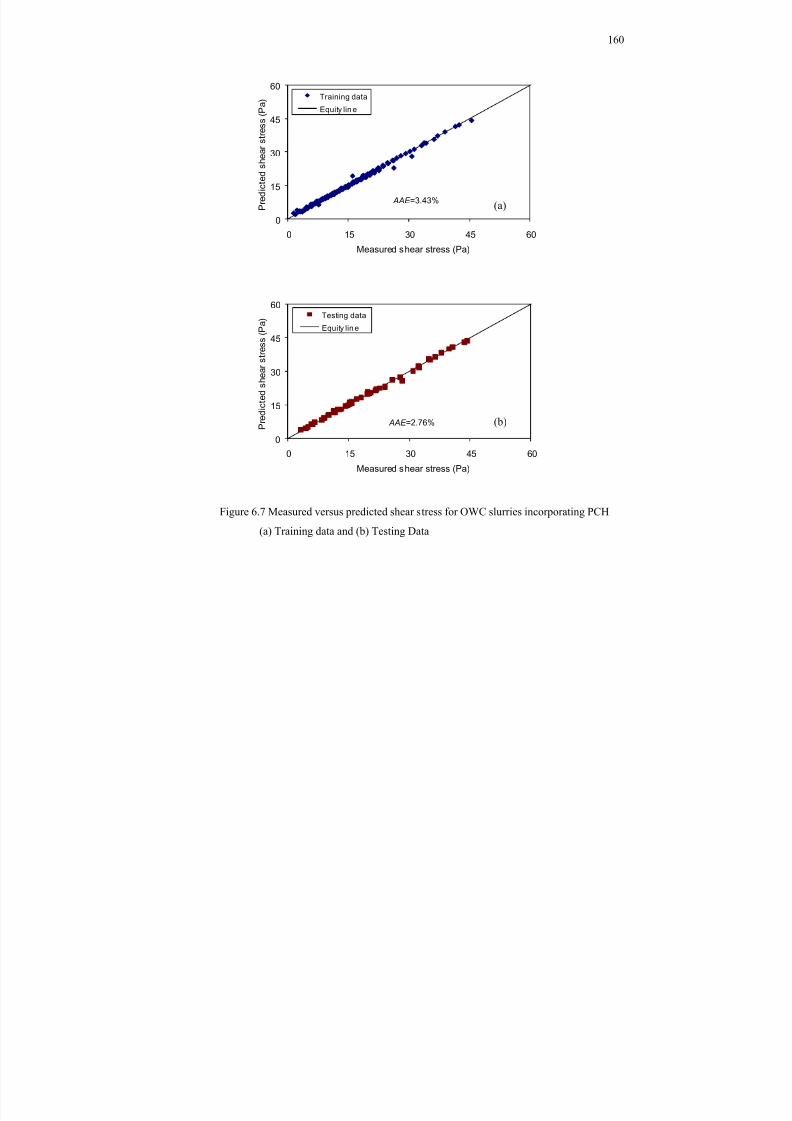
8/18/2019 Rheology of Oil Well Cement Slurries
http://slidepdf.com/reader/full/rheology-of-oil-well-cement-slurries 183/274
160
Figure 6.7 Measured versus predicted shear stress for OWC slurries incorporating PCH
(a) Training data and (b) Testing Data
0
15
30
45
60
0 15 30 45 60
P r e
d i c t e d s
h e a r s
t r e s s
( P a
)
Measured shear stress (Pa)
Training data
Equity lin e
0
15
30
45
60
0 15 30 45 60
P r e
d i c t e d s
h e a r s
t r e s s
( P a
)
Measured shear stress (Pa)
Testing data
Equity lin e
(b)
(a) AAE =3.43%
AAE =2.76%
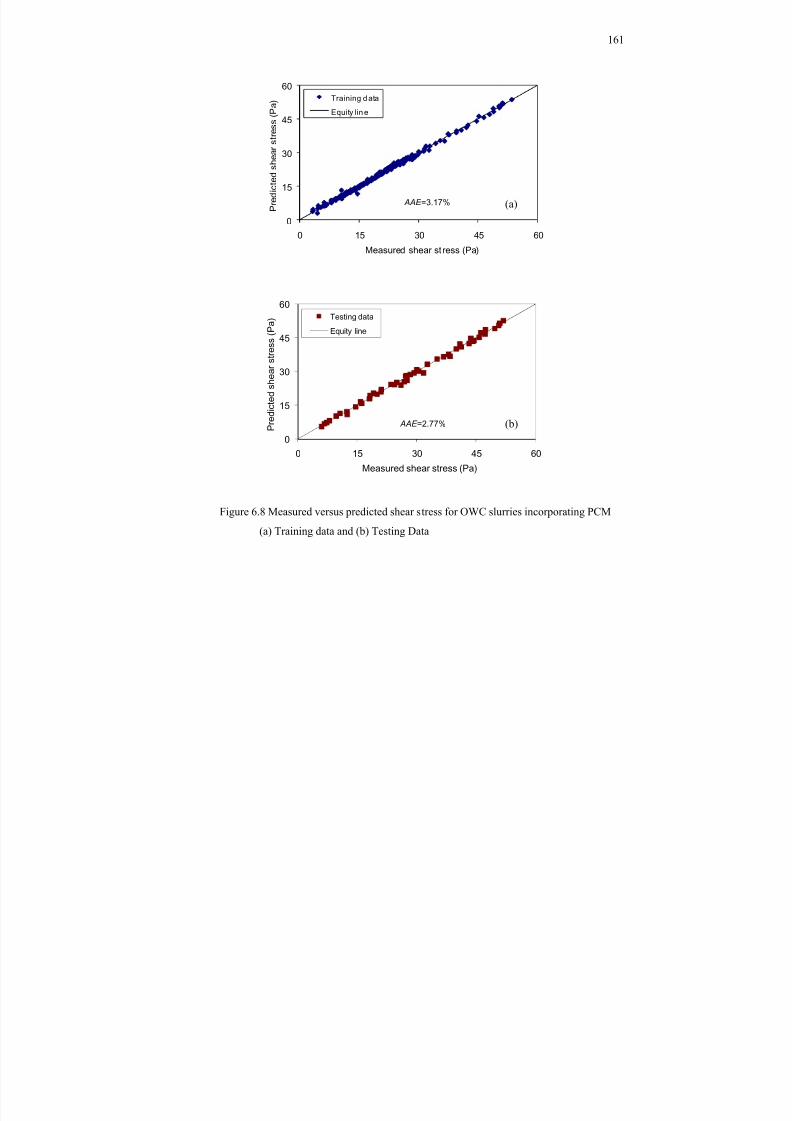
8/18/2019 Rheology of Oil Well Cement Slurries
http://slidepdf.com/reader/full/rheology-of-oil-well-cement-slurries 184/274
161
Figure 6.8 Measured versus predicted shear stress for OWC slurries incorporating PCM
(a) Training data and (b) Testing Data
0
15
30
45
60
0 15 30 45 60
P r e
d i c t e d s
h e a r s
t r e s s
( P a
)
Measured shear st ress (Pa)
Training d ata
Equity lin e
0
15
30
45
60
0 15 30 45 60
P r e
d i c t e d s
h e a r s
t r e s s
( P a
)
Measured shear stress (Pa)
Testing data
Equity line
(b)
(a) AAE =3.17%
AAE =2.77%
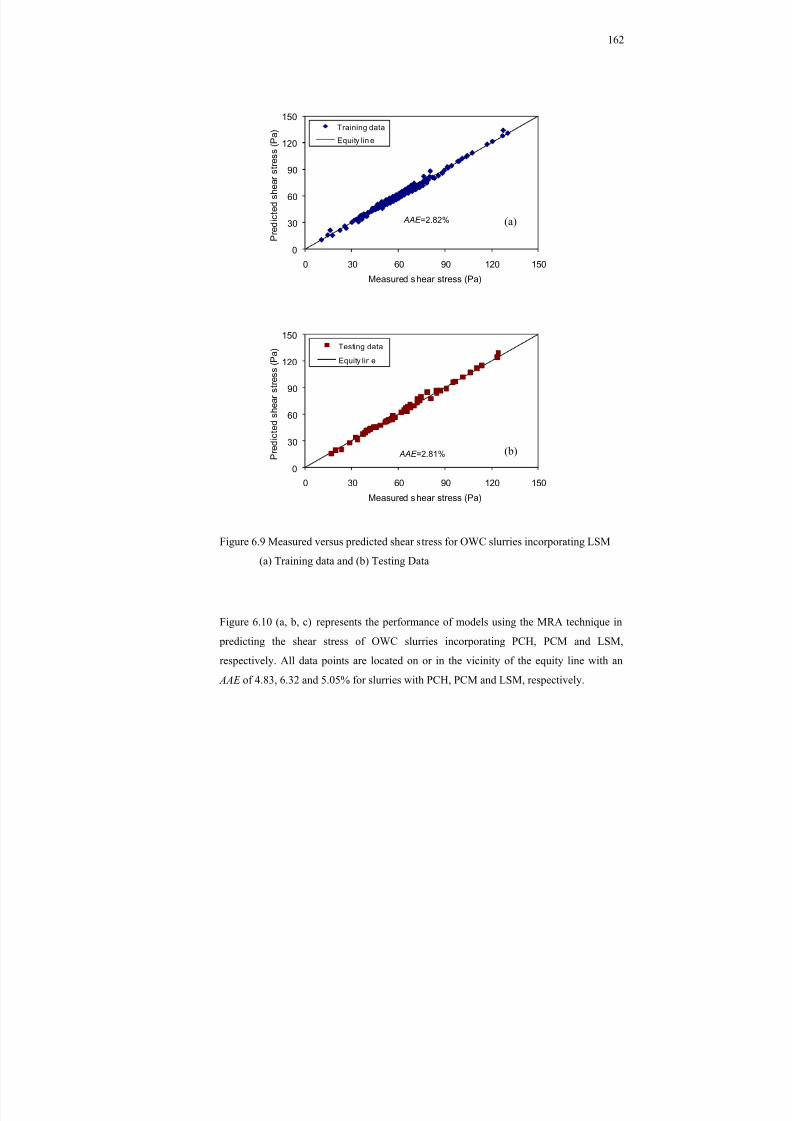
8/18/2019 Rheology of Oil Well Cement Slurries
http://slidepdf.com/reader/full/rheology-of-oil-well-cement-slurries 185/274
162
Figure 6.9 Measured versus predicted shear stress for OWC slurries incorporating LSM
(a) Training data and (b) Testing Data
Figure 6.10 (a, b, c) represents the performance of models using the MRA technique in
predicting the shear stress of OWC slurries incorporating PCH, PCM and LSM,
respectively. All data points are located on or in the vicinity of the equity line with an
AAE of 4.83, 6.32 and 5.05% for slurries with PCH, PCM and LSM, respectively.
0
30
60
90
120
150
0 30 60 90 120 150
P r e
d i c t e d s
h e a r s
t r e s s
( P a
)
Measured shear stress (Pa)
Training data
Equity lin e
0
30
60
90
120
150
0 30 60 90 120 150
P r e
d i c t e d s
h e a r s
t r e s s
( P a
)
Measured shear stress (Pa)
Testing data
Equity lin e
(b)
(a) AAE =2.82%
AAE =2.81%
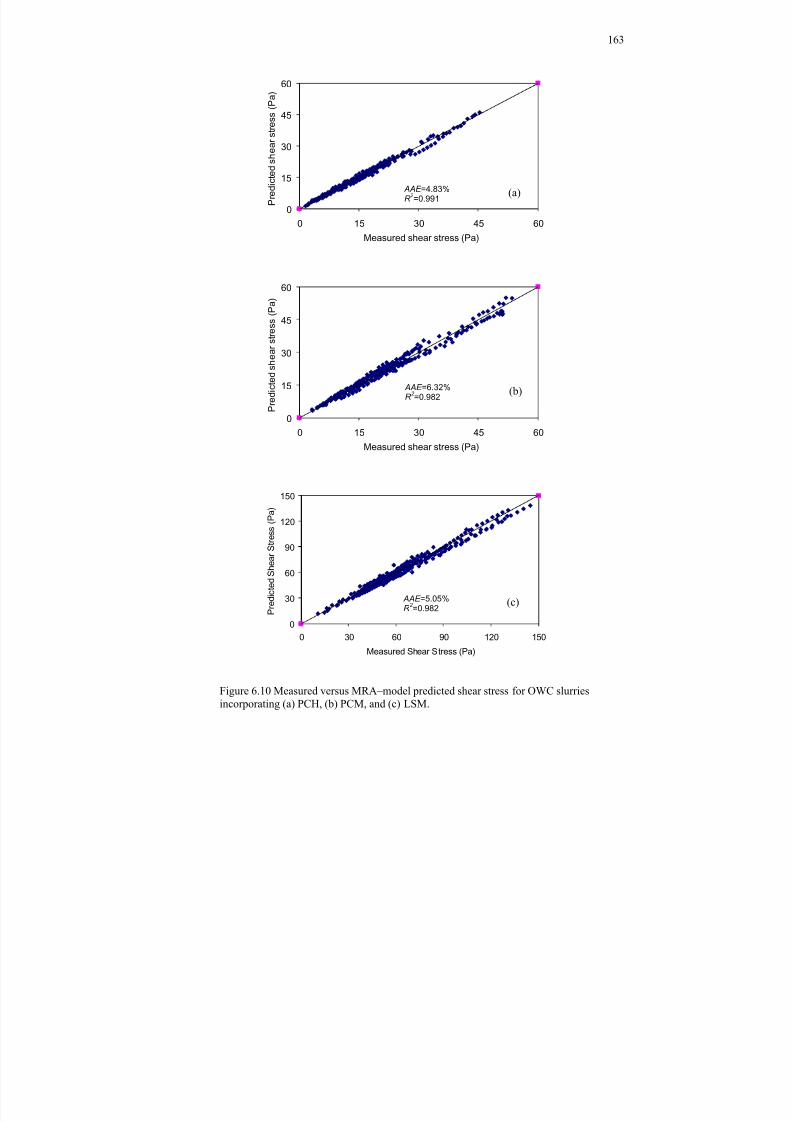
8/18/2019 Rheology of Oil Well Cement Slurries
http://slidepdf.com/reader/full/rheology-of-oil-well-cement-slurries 186/274
163
Figure 6.10 Measured versus MRA–model predicted shear stress for OWC slurriesincorporating (a) PCH, (b) PCM, and (c) LSM.
0
15
30
45
60
0 15 30 45 60
P r e
d i c t e d s
h e a r s
t r e s s
( P a
)
Measured shear stress (Pa)
0
15
30
45
60
0 15 30 45 60
P r e
d i c t e d s
h e a r s
t r e s s
( P a )
Measured shear stress (Pa)
0
30
60
90
120
150
0 30 60 90 120 150
P r e
d i c t e d S h e a r
S t r e s s
( P a
)
Measured Shear Stress (Pa)
(a) AAE =4.83%R 2
=0.991
(b) AAE =6.32%R 2
=0.982
(c) AAE =5.05%R 2 =0.982
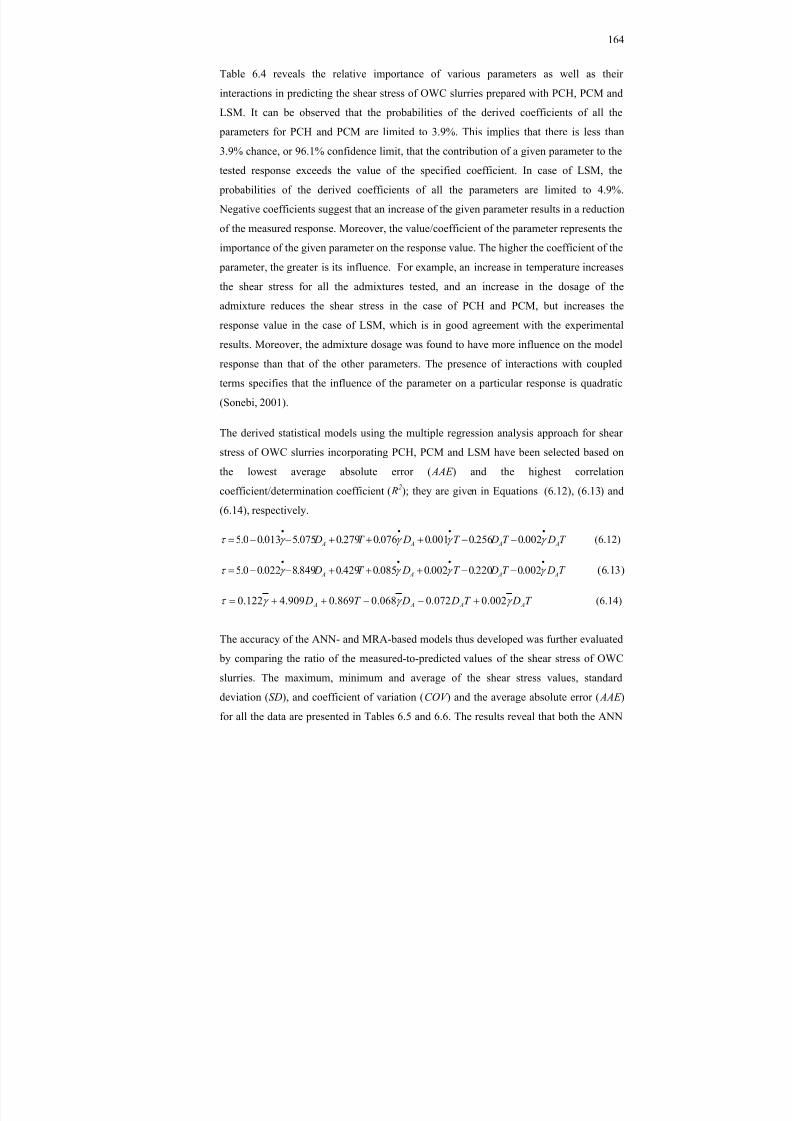
8/18/2019 Rheology of Oil Well Cement Slurries
http://slidepdf.com/reader/full/rheology-of-oil-well-cement-slurries 187/274
164
Table 6.4 reveals the relative importance of various parameters as well as their
interactions in predicting the shear stress of OWC slurries prepared with PCH, PCM and
LSM. It can be observed that the probabilities of the derived coefficients of all the
parameters for PCH and PCM are limited to 3.9%. This implies that there is less than
3.9% chance, or 96.1% confidence limit, that the contribution of a given parameter to thetested response exceeds the value of the specified coefficient. In case of LSM, the
probabilities of the derived coefficients of all the parameters are limited to 4.9%.
Negative coefficients suggest that an increase of the given parameter results in a reduction
of the measured response. Moreover, the value/coefficient of the parameter represents the
importance of the given parameter on the response value. The higher the coefficient of the
parameter, the greater is its influence. For example, an increase in temperature increases
the shear stress for all the admixtures tested, and an increase in the dosage of the
admixture reduces the shear stress in the case of PCH and PCM, but increases the
response value in the case of LSM, which is in good agreement with the experimental
results. Moreover, the admixture dosage was found to have more influence on the model
response than that of the other parameters. The presence of interactions with coupled
terms specifies that the influence of the parameter on a particular response is quadratic
(Sonebi, 2001).
The derived statistical models using the multiple regression analysis approach for shear
stress of OWC slurries incorporating PCH, PCM and LSM have been selected based onthe lowest average absolute error ( AAE ) and the highest correlation
coefficient/determination coefficient ( R2); they are given in Equations (6.12), (6.13) and
(6.14), respectively.
T DT DT DT D A A A A 002.0256.0001.0076.0279.0075.5013.00.5 (6.12)
T DT DT DT D A A A A 002.0220.0002.0085.0429.0849.8022.00.5 (6.13)
T DT D DT D A A A A 002.0072.0068.0869.0909.4122.0 (6.14)
The accuracy of the ANN- and MRA-based models thus developed was further evaluated
by comparing the ratio of the measured-to-predicted values of the shear stress of OWC
slurries. The maximum, minimum and average of the shear stress values, standard
deviation ( SD), and coefficient of variation ( COV ) and the average absolute error ( AAE )
for all the data are presented in Tables 6.5 and 6.6. The results reveal that both the ANN
8/18/2019 Rheology of Oil Well Cement Slurries
http://slidepdf.com/reader/full/rheology-of-oil-well-cement-slurries 188/274
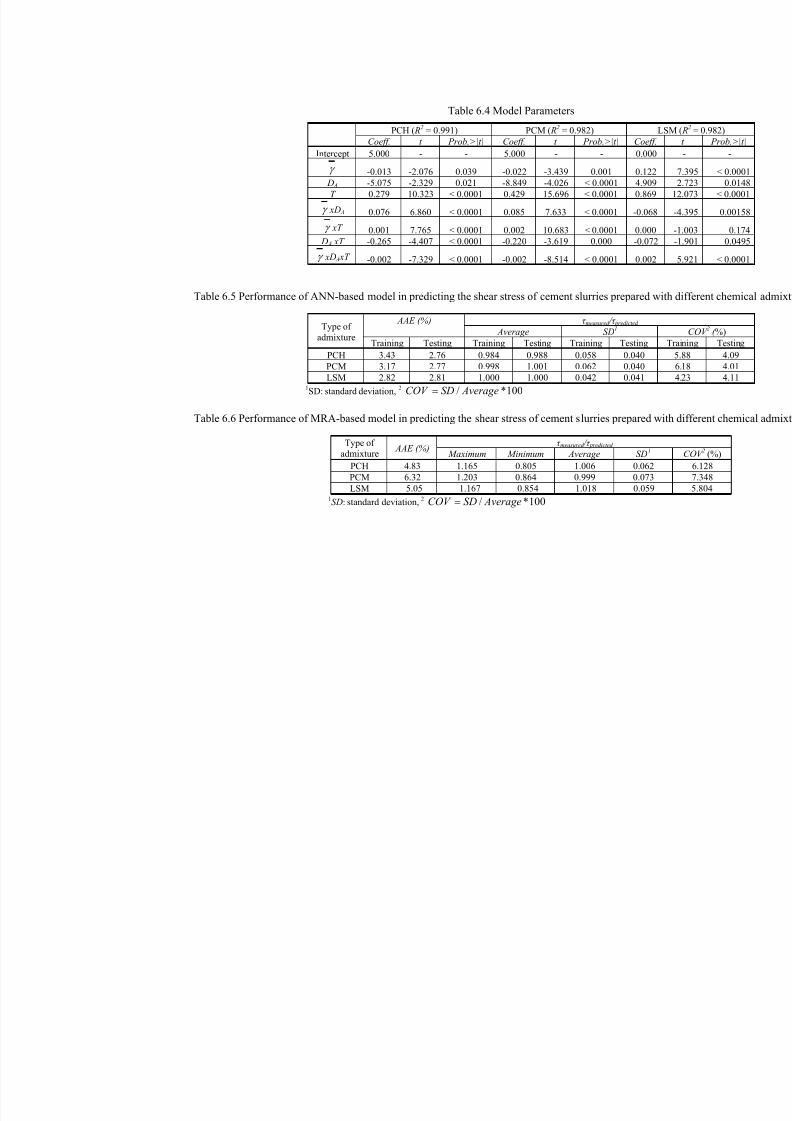
8/18/2019 Rheology of Oil Well Cement Slurries
http://slidepdf.com/reader/full/rheology-of-oil-well-cement-slurries 189/274
Table 6.4 Model Parameters
PCH ( R2 = 0.991) PCM ( R2 = 0.982) LSCoeff. t Prob.>|t| Coeff. t Prob.>|t| Coeff.
Intercept 5.000 - - 5.000 - - 0.000
-0.013 -2.076 0.039 -0.022 -3.439 0.001 0.122 D A -5.075 -2.329 0.021 -8.849 -4.026 < 0.0001 4.909 2
T 0.279 10.323 < 0.0001 0.429 15.696 < 0.0001 0.869 12
xD A 0.076 6.860 < 0.0001 0.085 7.633 < 0.0001 -0.068 -4
xT 0.001 7.765 < 0.0001 0.002 10.683 < 0.0001 0.000 -1 D A xT -0.265 -4.407 < 0.0001 -0.220 -3.619 0.000 -0.072 -1
xD A xT -0.002 -7.329 < 0.0001 -0.002 -8.514 < 0.0001 0.002 5
Table 6.5 Performance of ANN-based model in predicting the shear stress of cement slurries prepared with differen
Type ofadmixture
AAE (%) τ measured / τ predicted Average SD 1
Training Testing Training Testing Training Testing TrainPCH 3.43 2.76 0.984 0.988 0.058 0.040 5PCM 3.17 2.77 0.998 1.001 0.062 0.040 6LSM 2.82 2.81 1.000 1.000 0.042 0.041 4
1SD: standard deviation, 2 100*/ AverageSDCOV
Table 6.6 Performance of MRA-based model in predicting the shear stress of cement slurries prepared with differen
Type of
admixture AAE (%) τ measured / τ predicted
Maximum Minimum Average SD 1 PCH 4.83 1.165 0.805 1.006 0.062PCM 6.32 1.203 0.864 0.999 0.073 LSM 5.05 1.167 0.854 1.018 0.059
1SD: standard deviation, 2 100*/ AverageSDCOV

8/18/2019 Rheology of Oil Well Cement Slurries
http://slidepdf.com/reader/full/rheology-of-oil-well-cement-slurries 190/274
167
Figure 6.11 (a, b) represents the predicted yield stress and plastic viscosity values,
respectively for OWC slurries incorporating 0.5% of PCH, PCM, and LSM at different
temperatures, along with the corresponding experimentally measured values. Both the
yield stress and plastic viscosity values predicted by the ANN- and MRA-based models
followed a similar trend to that of the experimental data. In addition to test temperatures
(23°C, 45°C and 60°C), rheological parameters were also determined at 35°C and 52°C in
order to predict the model’s response within the range of the input data. It can be
observed that the yield stress for OWC slurries incorporating PCH was generally lower
than that for slurries made with PCM and LSM. This is in agreement with findings for
cement pastes (Al-Martini and Nehdi 2007, Al-Martini 2008). Both the yield stress and
plastic viscosity were found to be sensitive to the change in temperature; the higher the
temperature the higher was the yield stress, which is in good agreement with experimentalresults.
The effect of the admixture dosage at different temperatures on the predicted rheological
parameters of OWC slurries is illustrated in Fig. 6.12. Some admixture dosages not used
in experiments were also included in model predictions. Both experimental and predicted
values of yield stress decreased with PCH and PCM dosage. In the case of LSM, the
predicted yield stress values increased with the dosage up to 1.5% and then started to
decrease, which is in good conformity with experimental results. It can be observed that
the variation of yield stress with admixture dosage was reasonably estimated for all the
admixtures considered and its predicted values were comparable to the corresponding
measured data.
Moreover, the plastic viscosity of OWC slurries was found to be sensitive to the change
of temperature and admixture dosage (Fig. 12(b)). The plastic viscosity values predicted
by both the ANN- and MRA-based models showed irregular behaviour, which may be
associated with the error involved in fitting the curve to the Bingham model. It was
argued (Al-Martini and Nehdi, 2007) that plastic viscosity measured by fitting the down
flow curve of the hysteresis loop to the Bingham model does not always truly represent
the material properties because of the error associated with fitting the curve, which could
be sometimes high as observed by Saak (2000).
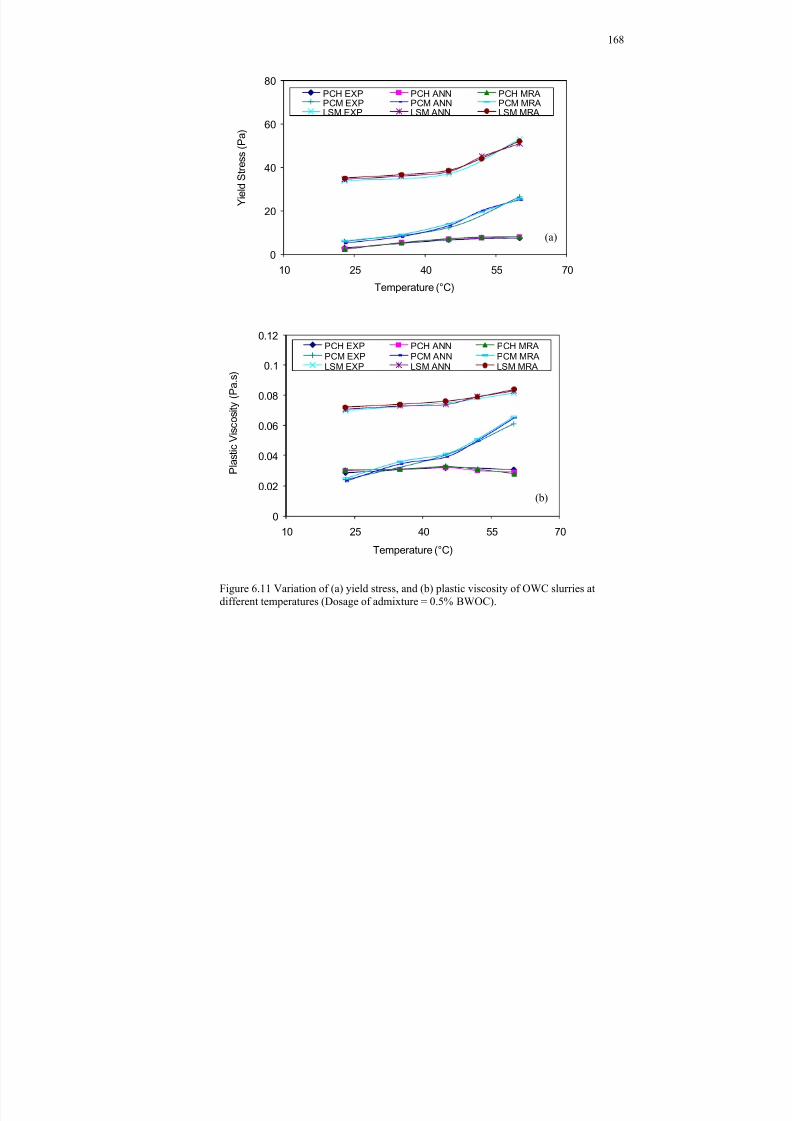
8/18/2019 Rheology of Oil Well Cement Slurries
http://slidepdf.com/reader/full/rheology-of-oil-well-cement-slurries 191/274
168
Figure 6.11 Variation of (a) yield stress, and (b) plastic viscosity of OWC slurries at
different temperatures (Dosage of admixture = 0.5% BWOC).
0
20
40
60
80
10 25 40 55 70
Y i e l d S t r e s s
( P a
)
Temperature (°C)
PCH EXP PCH ANN PCH MRAPCM EXP PCM ANN PCM MRALSM EXP LSM ANN LSM MRA
0
0.02
0.04
0.06
0.08
0.1
0.12
10 25 40 55 70
P l a s
t i c V i s c o s
i t y ( P a . s
)
Temperature (°C)
PCH EXP PCH ANN PCH MRAPCM EXP PCM ANN PCM MRALSM EXP LSM ANN LSM MRA
(b)
(a)
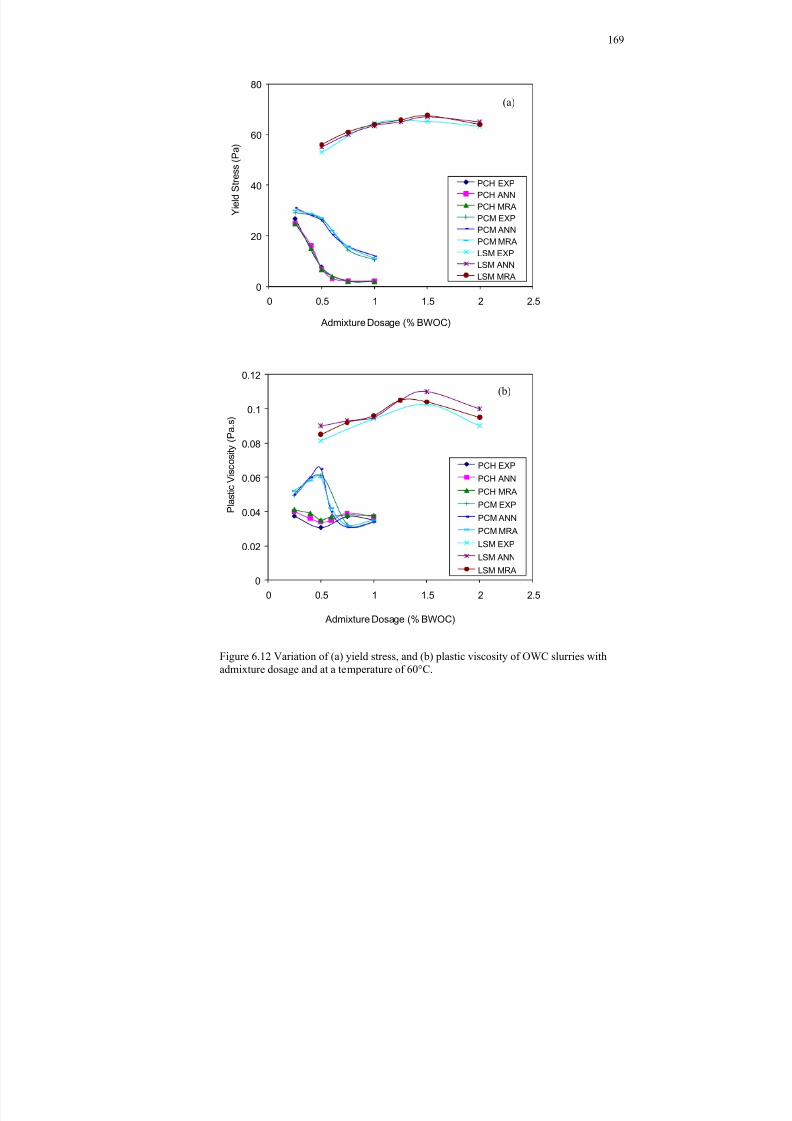
8/18/2019 Rheology of Oil Well Cement Slurries
http://slidepdf.com/reader/full/rheology-of-oil-well-cement-slurries 192/274
169
Figure 6.12 Variation of (a) yield stress, and (b) plastic viscosity of OWC slurries withadmixture dosage and at a temperature of 60°C.
0
20
40
60
80
0 0.5 1 1.5 2 2.5
Y i e l d S t r e s s
( P a
)
Admixture Dosage (% BWOC)
PCH EXPPCH ANNPCH MRAPCM EXPPCM ANNPCM MRALSM EXPLSM ANNLSM MRA
0
0.02
0.04
0.06
0.08
0.1
0.12
0 0.5 1 1.5 2 2.5
P l a s
t i c V i s c o s
i t y ( P a . s
)
Admixture Dosage (% BWOC)
PCH EXP
PCH ANN
PCH MRA
PCM EXP
PCM ANN
PCM MRA
LSM EXP
LSM ANN
LSM MRA
(a)
(b)
8/18/2019 Rheology of Oil Well Cement Slurries
http://slidepdf.com/reader/full/rheology-of-oil-well-cement-slurries 193/274
170
Figures 11 and 12 reveal that the models were able to recognize and evaluate the effects
of the admixture dosage and temperature on yield stress and plastic viscosity. The AAE of
the ANN model predictions was in the range of 1.4 to 15.6% and 0.7 to 11.8% for yield
stress and plastic viscosity, respectively, and that for the MRA model was in the range of
1.2 to 17.5% and to 1.3 to 14.5% for yield stress and plastic viscosity, respectively;depending on the admixture dosage and temperature tested. The higher values of AAE are
usually associated with the lower yield stress and plastic viscosity values since small
prediction errors may result in high AAE in such cases.
6.8 Conclusion
In this chapter, the relationships amongst the shear stress, shear rate, temperature,
admixture type and dosage for OWC slurries have been analyzed. The rheological
properties of OWC slurries were modeled using a feed-forward back-propagation
artificial neural network and multiple regression analysis. The models were then used to
develop flow curves, which were used to calculate the yield stress and plastic viscosity
values for OWC slurries with different admixtures and at different test temperatures.
Based on this study, the following conclusions can be drawn:
The ANN model developed in this study was able to learn the relationships between
different shear flow parameters for various OWC slurries and successfully predicted
their rheological properties of slurries used in the training process. It alsodemonstrated satisfactory performance when input parameters (shear rate,
temperature, and dosage of admixture) unfamiliar to the ANN were used. The results
prove that the ANN model is a powerful tool to quantitatively predict the rheological
properties of OWC slurries within the range of tested admixture dosages and test
temperatures.
The MRA-based models were able to predict the rheological properties of OWC
slurries with adequate accuracy.
The flow curves developed using the ANN- and MRA-based models allowed
predicting the Bingham parameters (yield stress and plastic viscosity) of OWC
slurries with an acceptable accuracy and were found to be in good agreement with
experimental results.
8/18/2019 Rheology of Oil Well Cement Slurries
http://slidepdf.com/reader/full/rheology-of-oil-well-cement-slurries 194/274
171
The models proposed by both approaches were found to be sensitive to the effects of
temperature increase and admixture dosage on the rheological properties of OWC
slurries.
The ANN-based model performed relatively better than the MRA-based model in
predicting the rheological properties of OWC slurries.
The proposed ANN- and MRA-based models can be extended and used to limit the
number of laboratory trial mixtures and develop OWC slurries with suitable
rheological properties, thus saving time and reducing the cost of OWC slurry design
for specific applications.
6.9 References
Al-Martini, S., and Nehdi, M. (2007). Effect of Chemical Admixtures on Rheology of
Cement Pastes at High Temperature. Journal of ASTM International , Vol. 4, No.
3, 17 p.
Al-Martini, S. (2008). Investigation on Rheology of Cement Paste and Concrete at High
Temperature. PhD Thesis , The University of Western Ontario, 353 p. .
Al Martini, S, and Nehdi, M. (2009). Coupled Effects of Time and High Temperature on
Rheological Properties of Cement Pastes Incorporating Various Superplasticizers. ASCE Journal of Materials in Civil Engineering , Vol. 21, No. 8, pp. 392-401.
ANSI/API RP 10B-2. 2005. Recommended Practice for Testing Well Cements. 1 st
Edition, July 2005, 171 p.
Bruni, C., Forcellese, A., Gabrielli, F., and Simoncini, M. (2006). Modelling of the
Rheological Behaviour of Aluminium Alloys in Multistep Hot Deformation Using
the Multiple Regression Analysis and Artificial Neural Network Techniques.
Journal of Material Processing Technology , Vol. 177, No. 1-3, pp. 323-326.
Cohen, J., Cohen, P., West, S. G., and Aiken, L. S. (2003). Applied Multiple
Regression/Correlation Analysis for the Behavioural Sciences. 3rd Ed. Mahwah,
NJ: Lawrence Erlbaum Associates, 2003, 736 p.
8/18/2019 Rheology of Oil Well Cement Slurries
http://slidepdf.com/reader/full/rheology-of-oil-well-cement-slurries 195/274
172
Demuth, H., Beale, M., and Hagan, M. (2008) Neural Network Tool Box TM 6 for Use
with MATLAB R2008a. The Math Works Inc., Natick , Massachusetts, pp. 5.2 to
5.72.
El-Chabib, H., and Nehdi, M. (2005) Neural Network Modelling of Properties of Cement-
Based Materials Demystified. Advances in Cement Research , Vol. 17, No. 3, pp.
91-102.
El-Chabib, H., Nehdi, M., and Sonebi, M. (2003) Artificial Intelligence Model for
Flowable Concrete Mixtures Used in Underwater Construction and Repair. ACI
Materials Journal , Vol. 100, No. 2, pp. 165-173.
Ferguson, J., and Kenblowski, Z. 1991. Applied Fluid Rheology. Elsevier Applied
Science , London and New York, pp. 209-210.
Genentech, 2010. BioOncology Glossary,” available online at http://www
.gene.com/gene/news/kits/biooncology/oncologyterminology.html, accessed on
July 13, 2010.
Guillot, D. 2006. Rheology of Well Cement Slurries. Well Cementing , Edited by E.B.
Nelson and Guillot, D. Schlumberger, Texas, pp. 93-142.
Health and Income Equity, Glossary. (2010), available online athttp://depts.washington.edu/eqhlth /pages/academic_resources/glossary.html#p,
accessed on July 13, 2010.
Montgomery, D. C. (2009). Design and Analysis of Experiments , 7th Ed., Wiley, New
York. .
Ravi, K.M., and Sutton, D.L. 1990. New Rheological Correlation for Cement Slurries as a
Function of Temperature. SPE 20499, The 65 th Annual Technical Conference and
Exhibition of the Society of Petroleum Engineers , New Orleans, LA, Sept. 23-26,
1990, pp. 455-462.
Saak, W. A., Jennings, M. H., and Shah, P. S. (2001). The influence of wall slip on yield
stress and viscoelastic measurements of cement paste. Cement and Concrete
Research , Vol. 31, n. 2, pp. 205–212.

8/18/2019 Rheology of Oil Well Cement Slurries
http://slidepdf.com/reader/full/rheology-of-oil-well-cement-slurries 196/274
8/18/2019 Rheology of Oil Well Cement Slurries
http://slidepdf.com/reader/full/rheology-of-oil-well-cement-slurries 197/274
174
C h a p t e r 7
ARTIFICIAL INTELLIGENCE MODEL FOR RHEOLOGICAL
PROPERTIES OF OIL WELL CEMENT SLURRIESINCORPORATING SCMs 1
7.1 Introduction
The world's production of portland cement is forecast to continue increasing throughout the
next 40 years, from the 2.8 billion tons of 2009 to around 3.8 billion tons by 2030, and 4.4
billion tons by 2050 (Cement Technology Roadmap, 2009). Cement production is not only
highly energy-intensive, but also causes global ecological problems by consuming substantialamounts of natural resources. Producing one ton of cement emits approximately one ton of
carbon dioxide (CO 2) mainly due to the calcination of raw materials and combustion of fuels.
Growing concerns for reducing CO 2 emissions and reduction /recycling of waste materials
have stimulated the usage of supplementary cementitious materials (SCMs). Such materials
include fly ash, silica fume, ground granulated blast furnace slag, natural pozzolans,
metakaolin, etc. Because of differences in their physical and chemical properties, not all
SCMs act similarly when used as partial replacement for cement. For instance, owing to its
spherical particle shape and relatively low specific surface, fly ash reduces the water demand
when used as partial replacement for portland cement. Conversely, silica fume tends to
increase the water demand due to its very high surface area.
OWC slurries are complex mixtures consisting of cement, water and a number of chemical
and mineral additives. In the petroleum industry, cement slurries are pumped to several
thousand meters into the ground to anchor and seal the casing to the borehole of oil or gas
wells. They have to achieve specific rheological properties under stringent temperature and
pressure conditions. Thus, an advanced characterization of the rheology of OWC slurries is
critical. In order to contend with extreme bottom-hole conditions, various chemical and
mineral additives are usually used in the slurry composition. Interactions amongst the
1 A version of this chapter has been accepted in Advances in Cement Research, 2011.
8/18/2019 Rheology of Oil Well Cement Slurries
http://slidepdf.com/reader/full/rheology-of-oil-well-cement-slurries 198/274
175
different ingredients used cause wide variation in the rheological properties, which depend
on the specific materials and proportions used.
Many studies have been performed over the last few decades to investigate the rheological
behaviour of cementitious systems such as, cement paste, mortar, grout, slurry and concrete.Determining the rheological properties of OWC slurries in-situ is not always practical.
Extensive rheological testing requires sophisticated equipment not suitable for on-site
operation, and is labour intensive and time consuming. Therefore, there is a need for models
that can predict the rheological properties of OWC slurries with adequate accuracy. A
number of shear stress-strain rate relationships have been developed for rheological
properties of cement based systems, among which the power-law, Bingham, and Herschel-
Bulkley models are the most commonly used in the well cementing industry (Guillot 2006).
However, there exists no model that can account for interactions among the materials used
for preparing such slurries and test conditions such as temperature. Such models are
comprised of empirical expressions derived from the analysis of limited experimental data
and/or based on simplifying assumptions (El-Chabib and Nehdi, 2005). Moreover, they do
not have true predictive capability outside the experimental domain and/or when different
materials are used (El-Chabib et al., 2003; 2005) and do not explain the interactions among
test parameters.
Artificial neural networks (ANNs) are a powerful computational tool capable of solving
complex and highly nonlinear functions through self-organization, pattern recognition, and
functional approximation. ANNs simulate the structure and internal functions of the
biological brain through computing. The use of ANNs in the field of civil engineering has
increased over the last decades because of its ability to map between a set of input data and a
corresponding output, and to perform global optimization for complex, nonlinear, and noisy
problems. In this study, an ANN model has been developed for predicting the rheological
properties of OWC slurries and relating the slurry composition (type and dosage of SCM,
dosage of chemical admixture, etc.) and test conditions (e.g. shear rate, temperature) to the
predicted rheological properties.
Four different mineral admixtures including metakaolin (MK), silica fume (SF), rice husk ash
(RHA) and class F fly ash (FA) were used as partial replacement for API class G OWC in
8/18/2019 Rheology of Oil Well Cement Slurries
http://slidepdf.com/reader/full/rheology-of-oil-well-cement-slurries 199/274
176
this study. An ANN based model has been developed to predict the shear stress at a given
shear rate as a function of the temperature, SCM type and dosage, and chemical admixture
dosage. The ability of the ANN model to evaluate the sensitivity of the rheological properties
to variations of the shear rate, admixture dosage, and test temperature was investigated. The
shear stress-shear rate curve for OWC slurries could be predicted at different temperatures
prior to fitting the data to conventional rheological models. Hence, for the first time, the
rheological properties of OWC slurries could be predicted as a function of the mixture
composition and test conditions. The ANN model would help designers selecting optimum
OWC-SCM combinations considering the predicted rheological performance. It can be
extended in future research to also account for mechanical strength and durability.
7.2 Materials and Apparatus
OWC slurries were prepared using a high sulphate-resistant API Class G OWC with a
specific gravity of 3.14, along with a new generation polycarboxylate-based high-range water
reducing admixture (PCH) and different dosages of various SCMs including MK, SF, RHA
and FA. The chemical and physical properties of the cement and SCMs are summarized in
Table 5.1 (Chapter 5). Details of the mixture compositions of the slurries tested are provided
in Table 5.2 (Chapter 5). Deionized distilled water was used for the mixing, and an
isothermal container was used to maintain its temperature at 23±1°C.
The cement slurries were prepared using a variable speed high-shear blender type mixer with
bottom drive blades as per the ANSI/API Recommended Practice 10B-2 (ANSI/API RP 10B-
2). A high accuracy advanced rheometer (TA instruments AR 2000) (Fig. 4.1), was used
throughout this study to measure the rheological properties of OWC slurries. The rheometer
is computer controlled and equipped with a rheological data analysis software, which can fit
the shear stress-strain rate data to several rheological models. The Bingham model was used
throughout this study to calculate the rheological properties. It is worth mentioning thatrheological data depend on the type of rheological model used for fitting the experimental
data (Nehdi and Rahman, 2004).
8/18/2019 Rheology of Oil Well Cement Slurries
http://slidepdf.com/reader/full/rheology-of-oil-well-cement-slurries 200/274
177
7.3 Experimental Procedure
The coupled effects of temperature, PCH dosage and type and amount of SCMs on the
rheological properties of OWC slurries were investigated. The mixing of slurries was
conducted at a controlled ambient room temperature of 23±1°C. The prepared slurry wasthen placed in a temperature controlled chamber for preconditioning at the specific test
temperature (23, 45, or 60°C) and continually agitated at 150 rpm over 20 minutes. The
rheometer set-up was maintained constant for all tested slurries. The concentric cylinder test
geometry was preconditioned at the test temperature so as to avoid sudden thermal shock of
the slurry. After mixing and preconditioning, the OWC slurry sample was placed in the
coaxial cylinder of the rheometer. Once the temperature has been adjusted to the required
level, the sample was sheared to a stepped ramp of steady state flow from 5.11 s -1 to 511 s -1
with 10 sec at each strain rate level. Subsequently, data were measured at a descending shear
rate from 511 s -1 to 5.11 s -1 to obtain the down flow curve. A schematic representation of the
viscometric testing scheme is illustrated in Fig. 5.1 (Chapter 5).
7.4 Experimental Results
Figure 7.1 illustrates typical shear stress-shear rate down curves for OWC slurries
incorporating 5% SCM and different dosages of PCH at 60ºC. The experimental results
reveal that the Bingham model (Eq. 1) fits the shear stress-shear rate down curve with a
correlation coefficient (R 2) > 0.95.
P 0 (7.1)
where, , 0 , P , and represent the shear stress, yield stress, plastic viscosity, and shear
rate, respectively. The down-curve better fits the Bingham plastic model than the up-curve
(Ferguson and Kemblowski, 1991; Al-Martini and Nehdi, 2009), therefore the shear rate–
shear stress down curve was considered in calculating the rheological properties (yield stress
and plastic viscosity).
The Bingham parameters (yield stress and plastic viscosity) are very much dependent on test
variables as observed in Figs. 7.2 to 7.4. In this study, artificial neural networks have been
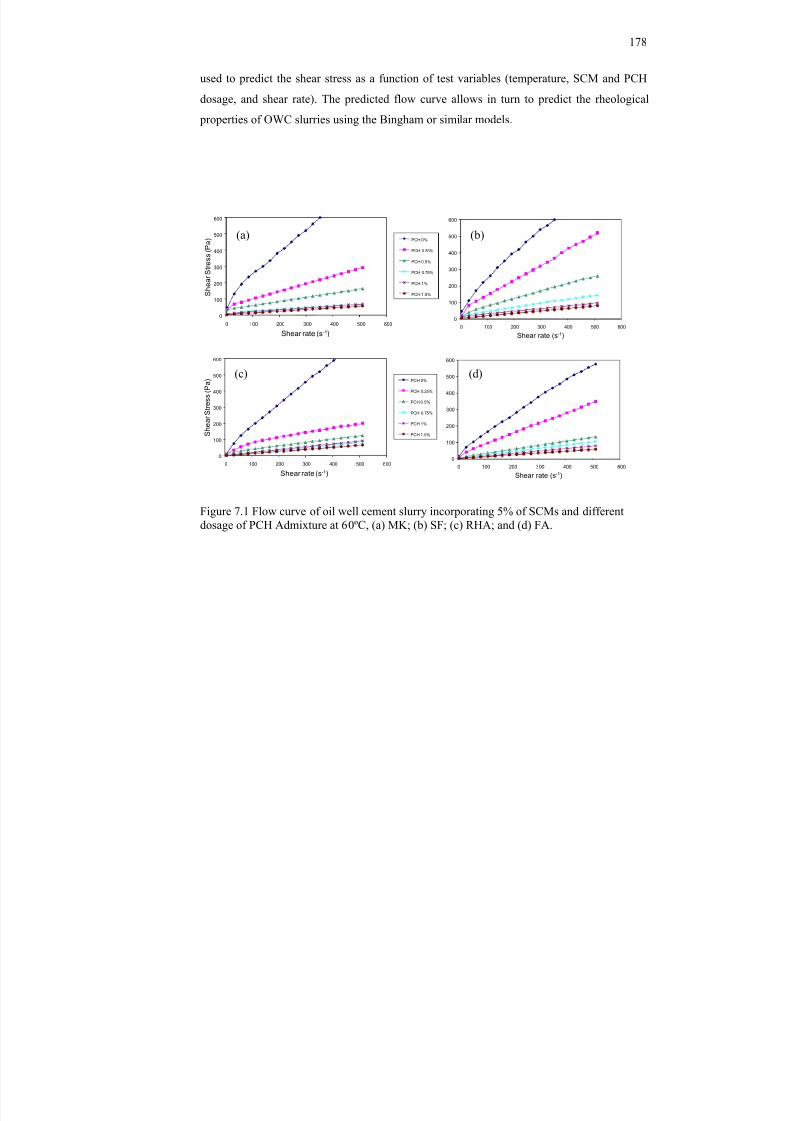
8/18/2019 Rheology of Oil Well Cement Slurries
http://slidepdf.com/reader/full/rheology-of-oil-well-cement-slurries 201/274
178
used to predict the shear stress as a function of test variables (temperature, SCM and PCH
dosage, and shear rate). The predicted flow curve allows in turn to predict the rheological
properties of OWC slurries using the Bingham or similar models.
0
100
200
300
400
500
600
0 100 200 300 400 500 600
S h e a r S
t r e s s
( P a
)
Shear rate (s -1)
PCH 0%
PCH 0.25%
PCH 0.5%
PCH 0.75%
PCH 1%
PCH 1.5%
0
100
200
300
400
500
600
0 100 200 300 400 500 600
Shear rate (s -1)
0
100
200
300
400
500
600
0 100 200 300 400 500 600
S h e a r
S t r e s s
( P a
)
Shear rate (s -1)
PCH 0%
PCH 0.25%
PCH 0.5%
PCH 0.75%
PCH 1%
PCH 1.5%
0
100
200
300
400
500
600
0 100 200 300 400 500 600
Shear rate (s -1)
Figure 7.1 Flow curve of oil well cement slurry incorporating 5% of SCMs and differentdosage of PCH Admixture at 60ºC, (a) MK; (b) SF; (c) RHA; and (d) FA.
(a) (b)
(c) (d)
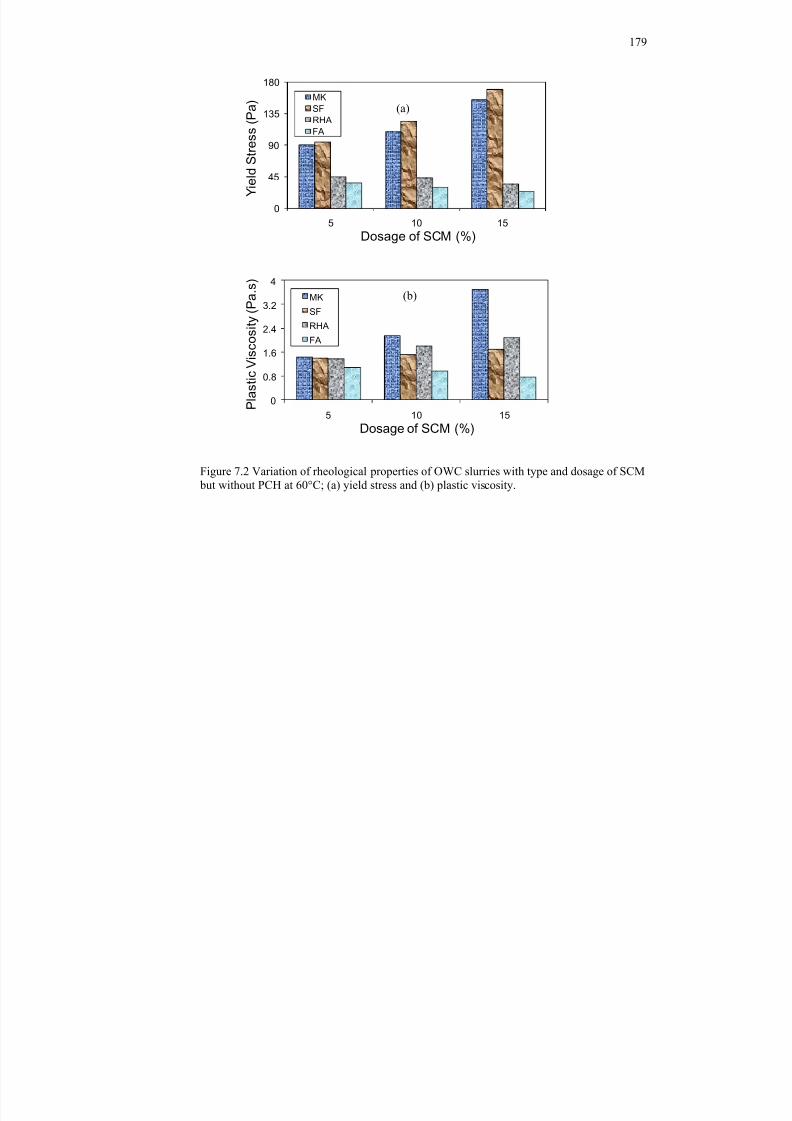
8/18/2019 Rheology of Oil Well Cement Slurries
http://slidepdf.com/reader/full/rheology-of-oil-well-cement-slurries 202/274
179
0
45
90
135
180
5 10 15
Y i e l d S t r e s s
( P a
)
Dosage of SCM (%)
MKSFRHAFA
0
0.8
1.6
2.4
3.2
4
5 10 15 P l a s
t i c V i s c o s
i t y ( P a . s
)
Dosage of SCM (%)
MK
SF
RHA
FA
Figure 7.2 Variation of rheological properties of OWC slurries with type and dosage of SCM but without PCH at 60°C; (a) yield stress and (b) plastic viscosity.
(b)
(a)
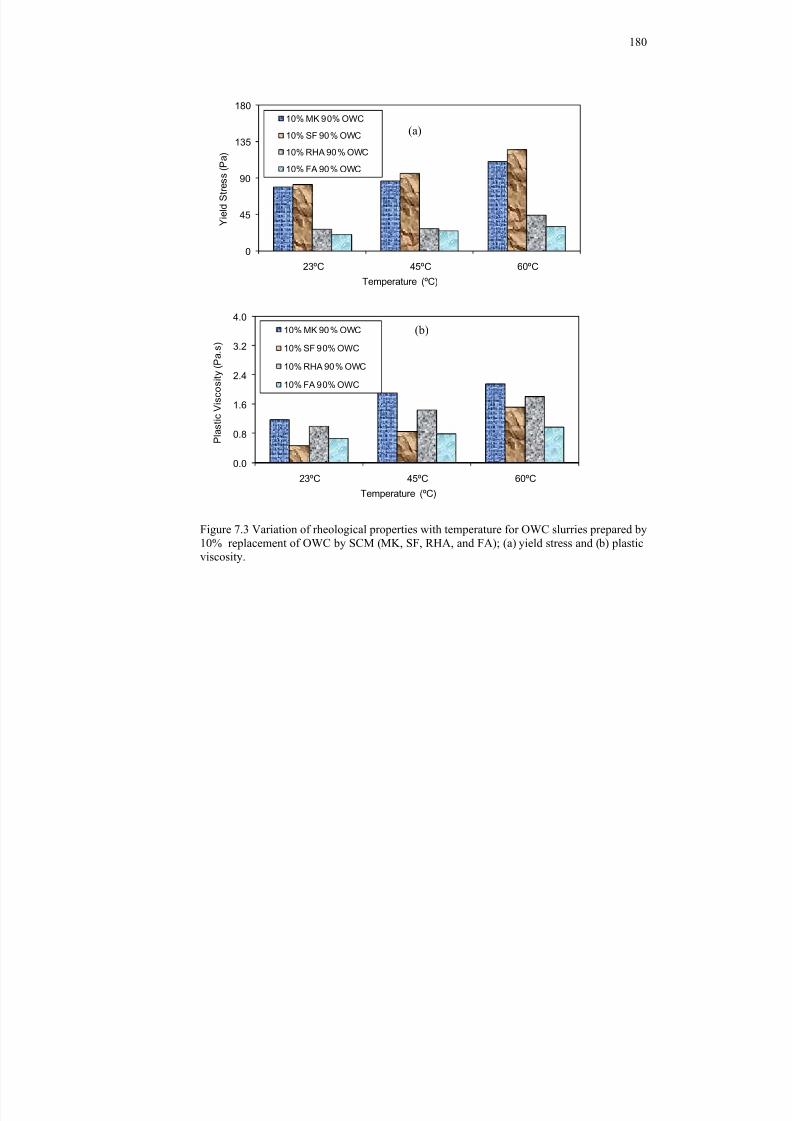
8/18/2019 Rheology of Oil Well Cement Slurries
http://slidepdf.com/reader/full/rheology-of-oil-well-cement-slurries 203/274
180
0
45
90
135
180
23ºC 45ºC 60ºC
Y i e l d S t r e s s
( P a )
Temperature (ºC)
10% MK 90% OWC
10% SF 90% OWC
10% RHA 90% OWC
10% FA 90% OWC
0.0
0.8
1.6
2.4
3.2
4.0
23ºC 45ºC 60ºC
P l a s
t i c V i s c o s
i t y ( P a . s
)
Temperature (ºC)
10% MK 90% OWC
10% SF 90% OWC
10% RHA 90% OWC
10% FA 90% OWC
Figure 7.3 Variation of rheological properties with temperature for OWC slurries prepared by10% replacement of OWC by SCM (MK, SF, RHA, and FA); (a) yield stress and (b) plasticviscosity.
(b)
(a)
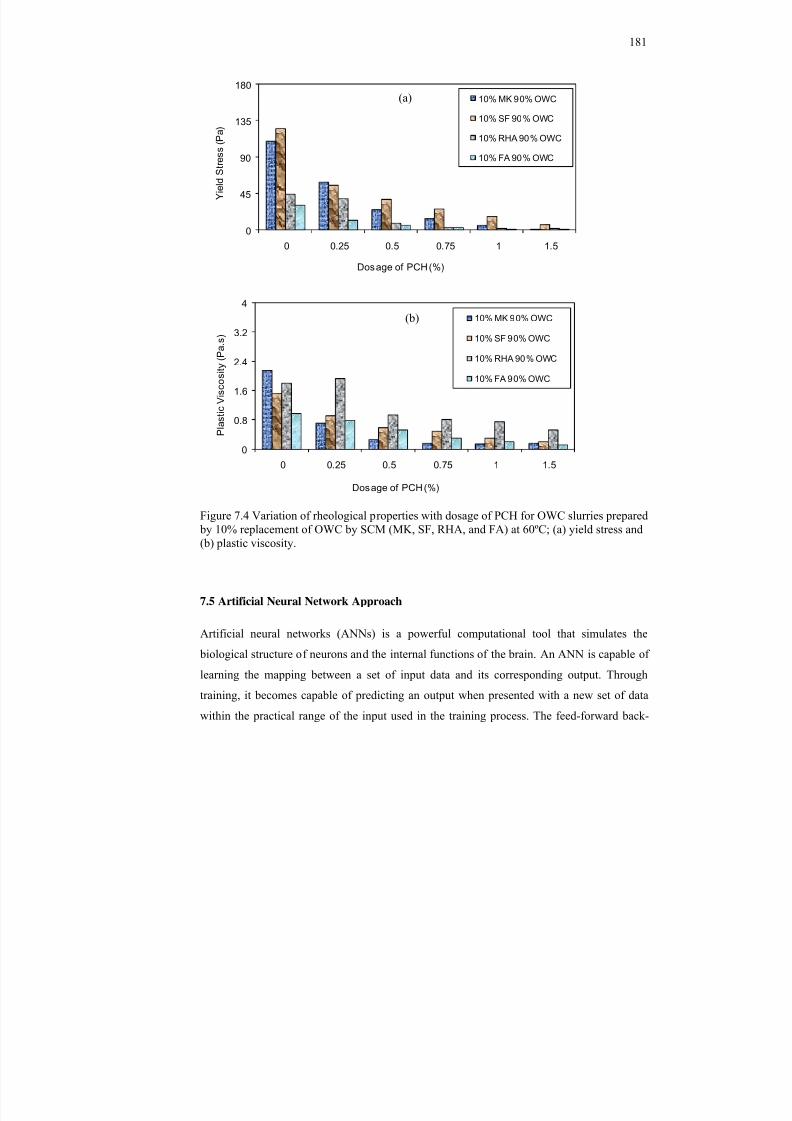
8/18/2019 Rheology of Oil Well Cement Slurries
http://slidepdf.com/reader/full/rheology-of-oil-well-cement-slurries 204/274
181
0
45
90
135
180
0 0.25 0.5 0.75 1 1.5
Y i e l d S t r e s s
( P a
)
Dosage of PCH (%)
10% MK 90% OWC
10% SF 90% OWC
10% RHA 90% OWC
10% FA 90% OWC
0
0.8
1.6
2.4
3.2
4
0 0.25 0.5 0.75 1 1.5
P l a s
t i c V i s c o s
i t y ( P a . s
)
Dosage of PCH (%)
10% MK 90% OWC
10% SF 90% OWC
10% RHA 90% OWC
10% FA 90% OWC
Figure 7.4 Variation of rheological properties with dosage of PCH for OWC slurries prepared by 10% replacement of OWC by SCM (MK, SF, RHA, and FA) at 60ºC; (a) yield stress and(b) plastic viscosity.
7.5 Artificial Neural Network Approach
Artificial neural networks (ANNs) is a powerful computational tool that simulates the
biological structure of neurons and the internal functions of the brain. An ANN is capable of
learning the mapping between a set of input data and its corresponding output. Through
training, it becomes capable of predicting an output when presented with a new set of data
within the practical range of the input used in the training process. The feed-forward back-
(b)
(a)
8/18/2019 Rheology of Oil Well Cement Slurries
http://slidepdf.com/reader/full/rheology-of-oil-well-cement-slurries 205/274
182
propagation learning algorithm is the most commonly used in engineering applications,
especially in modelling the behaviour of cement-based materials. ANNs are constructed of
several linear or nonlinear processing units (neurons) arranged in an input layer, one or more
hidden layers, and an output layer, and are often connected to neurons in other layers. Each
processing unit receives multiple inputs from the neurons in the previous layer through the
weighted connection, and after performing appropriate computation, transfers its output to
other processing units or as a network output using an assigned transfer (activation) function
as shown in Fig. 6.4 (Chapter 6).
There exists a number of network such as Hopfield network (Hopfield, 1982), Bolzmann
machines (Ackley et al., 1985), the Kohonen network (Kohonen, 1982), and the multilayer
feed-forward back-propagation neural network (Rumelhart et al., 1986). Among these the
feed-forward back-propagation learning algorithm is the most commonly used in engineering
applications, especially in modelling the behaviour of cement based materials.
Feed-Forward Back-Propagation Neural Network performs nonlinear transformation for
functional approximation problems, recognize logic functions, and subdivide the pattern
space for classification. It consists of a number of layers (input layer, hidden layer(s) and
output layers) and processing units (neurons) in each layer. The neurons in one layer are
fully connected between the processing units in adjacent layers with different weight but no backward connection is allowed and no connection exists between neurons in the same layer.
The selection of the optimum number of hidden layers and the processing units (neurons)
depends on the complexity of the problem. To date there are no well established rule to
determine the suitable number of hidden layers and neurons (El-Chabib and Nehdi, 2005;
Elbahy et al., 2010). These numbers are usually determined by trial and error. Fewer neurons
than the optimum number results in fewer connection in the network which eventually
reduces the ability of the network to implement nonlinear transformation for functional
approximation. A premature training may cause unsatisfactory performance because of not
adequately learning the embedded relationships between inputs and outputs. Over-fitting may
not only lead to a precise prediction of the training patterns, but can also cause poor
generalization of new patterns. The training continues until it converges to a desired
minimum error between its predicted outputs and the desired targets provided in the training
process. The duration of training can be determined by (a) limiting the number of iterations,
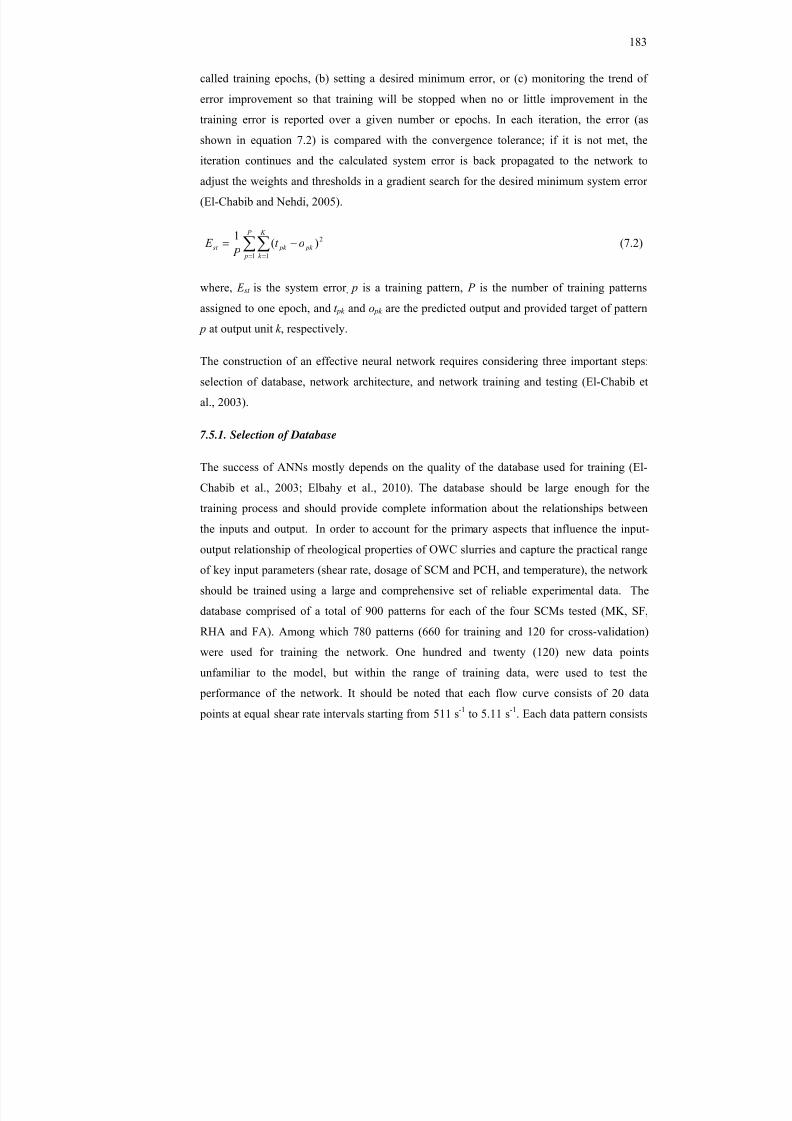
8/18/2019 Rheology of Oil Well Cement Slurries
http://slidepdf.com/reader/full/rheology-of-oil-well-cement-slurries 206/274
183
called training epochs, (b) setting a desired minimum error, or (c) monitoring the trend of
error improvement so that training will be stopped when no or little improvement in the
training error is reported over a given number or epochs. In each iteration, the error (as
shown in equation 7.2) is compared with the convergence tolerance; if it is not met, the
iteration continues and the calculated system error is back propagated to the network to
adjust the weights and thresholds in a gradient search for the desired minimum system error
(El-Chabib and Nehdi, 2005).
P
p
K
k pk pk st ot
P E
1 1
2)(1
(7.2)
where, E st is the system error , p is a training pattern, P is the number of training patterns
assigned to one epoch, and t pk and o pk are the predicted output and provided target of pattern
p at output unit k , respectively.
The construction of an effective neural network requires considering three important steps:
selection of database, network architecture, and network training and testing (El-Chabib et
al., 2003).
7.5.1. Selection of Database
The success of ANNs mostly depends on the quality of the database used for training (El-
Chabib et al., 2003; Elbahy et al., 2010). The database should be large enough for the
training process and should provide complete information about the relationships between
the inputs and output. In order to account for the primary aspects that influence the input-
output relationship of rheological properties of OWC slurries and capture the practical range
of key input parameters (shear rate, dosage of SCM and PCH, and temperature), the network
should be trained using a large and comprehensive set of reliable experimental data. The
database comprised of a total of 900 patterns for each of the four SCMs tested (MK, SF,
RHA and FA). Among which 780 patterns (660 for training and 120 for cross-validation)
were used for training the network. One hundred and twenty (120) new data points
unfamiliar to the model, but within the range of training data, were used to test the
performance of the network. It should be noted that each flow curve consists of 20 data
points at equal shear rate intervals starting from 511 s -1 to 5.11 s -1. Each data pattern consists
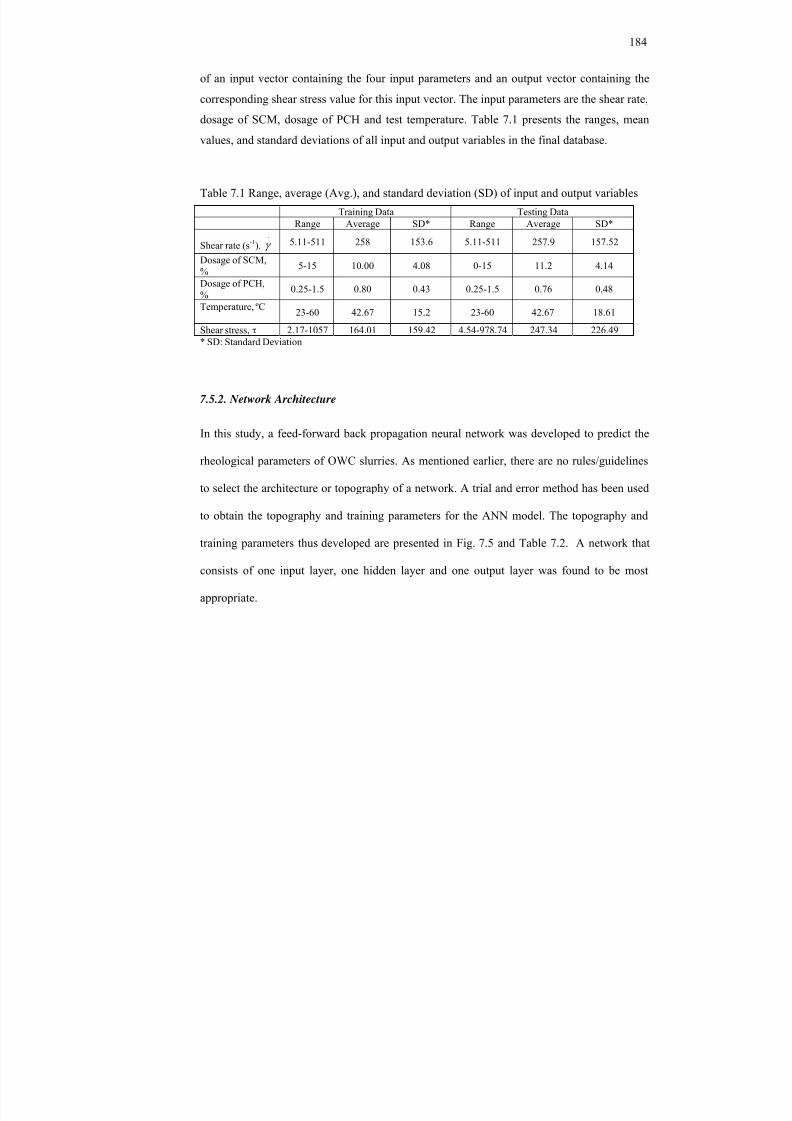
8/18/2019 Rheology of Oil Well Cement Slurries
http://slidepdf.com/reader/full/rheology-of-oil-well-cement-slurries 207/274
184
of an input vector containing the four input parameters and an output vector containing the
corresponding shear stress value for this input vector. The input parameters are the shear rate,
dosage of SCM, dosage of PCH and test temperature. Table 7.1 presents the ranges, mean
values, and standard deviations of all input and output variables in the final database.
Table 7.1 Range, average (Avg.), and standard deviation (SD) of input and output variables
Training Data Testing DataRange Average SD* Range Average SD*
Shear rate (s -1),.
5.11-511 258 153.6 5.11-511 257.9 157.52
Dosage of SCM,% 5-15 10.00 4.08 0-15 11.2 4.14
Dosage of PCH,% 0.25-1.5 0.80 0.43 0.25-1.5 0.76 0.48
Temperature, ºC 23-60 42.67 15.2 23-60 42.67 18.61
Shear stress, τ 2.17-1057 164.01 159.42 4.54-978.74 247.34 226.49* SD: Standard Deviation
7.5.2. Network Architecture
In this study, a feed-forward back propagation neural network was developed to predict the
rheological parameters of OWC slurries. As mentioned earlier, there are no rules/guidelines
to select the architecture or topography of a network. A trial and error method has been used
to obtain the topography and training parameters for the ANN model. The topography and
training parameters thus developed are presented in Fig. 7.5 and Table 7.2. A network that
consists of one input layer, one hidden layer and one output layer was found to be most
appropriate.
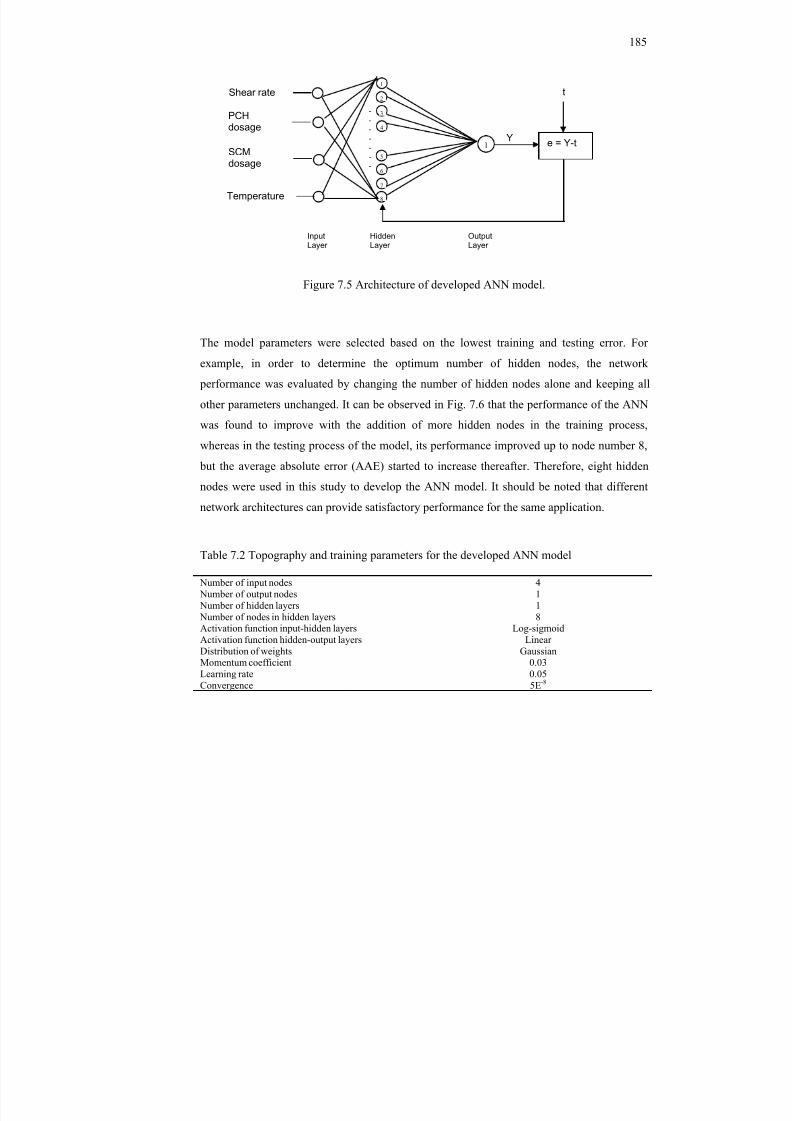
8/18/2019 Rheology of Oil Well Cement Slurries
http://slidepdf.com/reader/full/rheology-of-oil-well-cement-slurries 208/274
185
Figure 7.5 Architecture of developed ANN model.
The model parameters were selected based on the lowest training and testing error. For
example, in order to determine the optimum number of hidden nodes, the network
performance was evaluated by changing the number of hidden nodes alone and keeping all
other parameters unchanged. It can be observed in Fig. 7.6 that the performance of the ANN
was found to improve with the addition of more hidden nodes in the training process,
whereas in the testing process of the model, its performance improved up to node number 8,
but the average absolute error (AAE) started to increase thereafter. Therefore, eight hidden
nodes were used in this study to develop the ANN model. It should be noted that different
network architectures can provide satisfactory performance for the same application.
Table 7.2 Topography and training parameters for the developed ANN model
Number of input nodes Number of output nodes
Number of hidden layers Number of nodes in hidden layersActivation function input-hidden layersActivation function hidden-output layersDistribution of weightsMomentum coefficientLearning rateConvergence
41
18
Log-sigmoidLinear
Gaussian0.030.055E -8
Y1
t
e = Y-t
InputLayer
OutputLayer
----
---
1
2
3
4
5
6
7
8
HiddenLayer
Shear rate
PCHdosage
Temperature
SCMdosage
8/18/2019 Rheology of Oil Well Cement Slurries
http://slidepdf.com/reader/full/rheology-of-oil-well-cement-slurries 209/274
186
0
4
8
12
16
20
0 4 8 12 16 20 24 A v e r a g e a
b s o
l u t e e r r o r ,
A A E ( % )
Number of hidden nodes
Training data
Testing data
Figure 7.6 Selection of number of hidden layer nodes for OWC slurries prepared by partialreplacement of RHA.
7.5.3. Training Process
Training a feed-forward back-propagation neural network involves teaching the network the
relationships between the input parameters (shear rate, dosage of SCM, dosage of PCH,
temperature) and the overall cement slurry rheology, and is usually performed in two stages:
(i) feed-forward and (ii) back-propagation. The data flows from the input processing units to
predict the desired network output. The obtained output is then compared with the predefined
output and the difference is calculated. The error is then back propagated if the difference is
greater than the predefined tolerance.
The success of the training process depends on (a) the selection of network parameters, (b)
the algorithm used for learning, and (c) the validation of the model using experimental data
available for training along with new testing data unfamiliar to the model. Specialized
commercial computer software (Demuth et al., 2008) was used. Supervised training was
implemented in this study by providing the network with sets of data (inputs/targets) and the
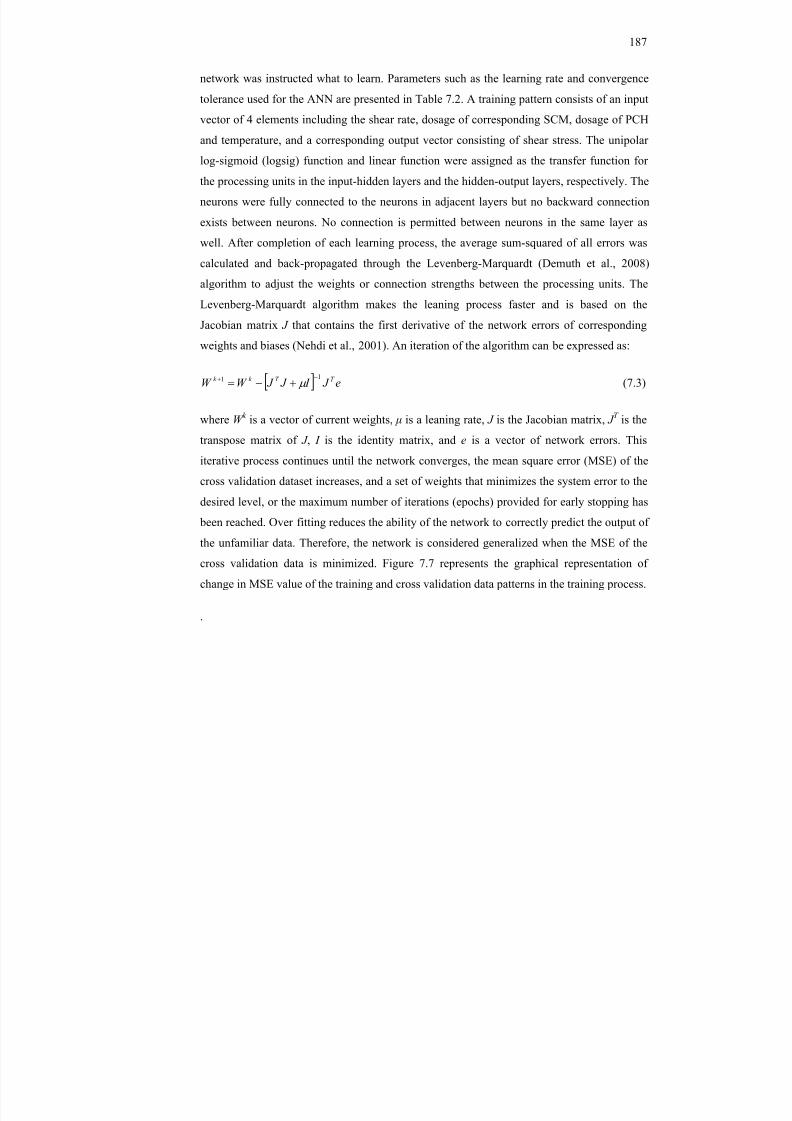
8/18/2019 Rheology of Oil Well Cement Slurries
http://slidepdf.com/reader/full/rheology-of-oil-well-cement-slurries 210/274
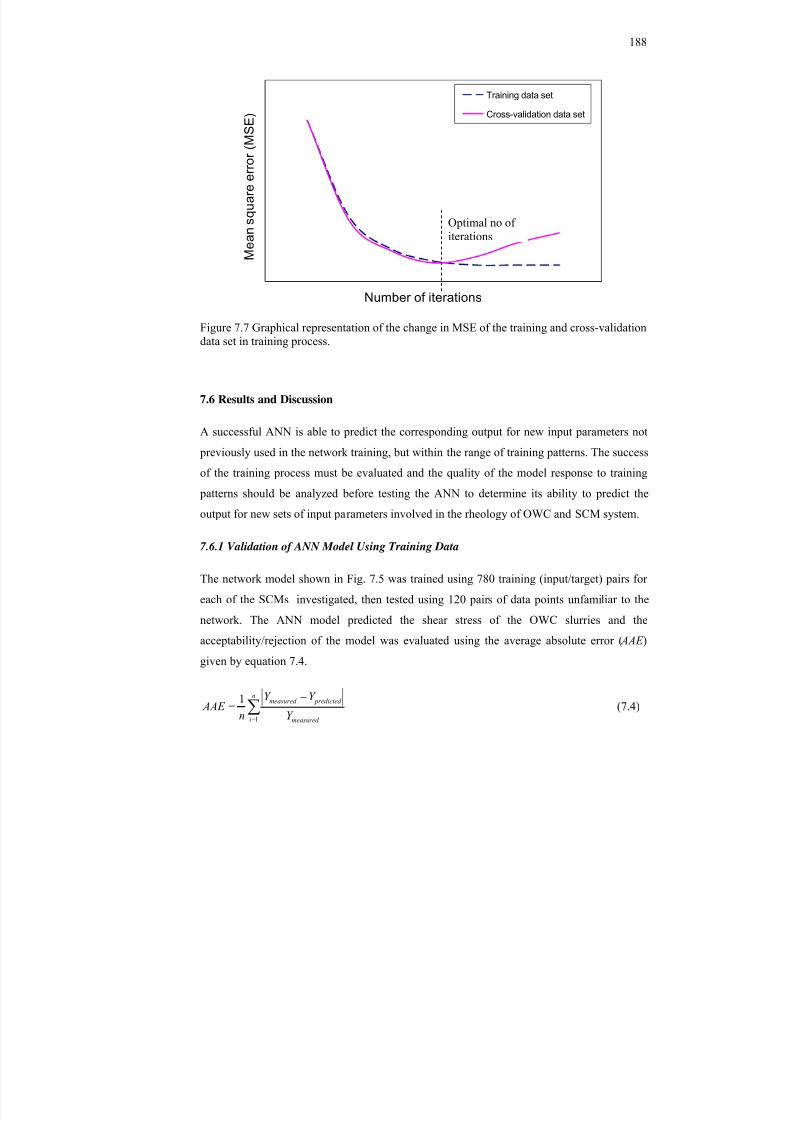
8/18/2019 Rheology of Oil Well Cement Slurries
http://slidepdf.com/reader/full/rheology-of-oil-well-cement-slurries 211/274
188
M e a n s q u a r e e r r o r
( M S E )
Number of iterations
Training data set
Cross-validation data set
Figure 7.7 Graphical representation of the change in MSE of the training and cross-validationdata set in training process.
7.6 Results and Discussion
A successful ANN is able to predict the corresponding output for new input parameters not
previously used in the network training, but within the range of training patterns. The successof the training process must be evaluated and the quality of the model response to training
patterns should be analyzed before testing the ANN to determine its ability to predict the
output for new sets of input parameters involved in the rheology of OWC and SCM system.
7.6.1 Validation of ANN Model Using Training Data
The network model shown in Fig. 7.5 was trained using 780 training (input/target) pairs for
each of the SCMs investigated, then tested using 120 pairs of data points unfamiliar to the
network. The ANN model predicted the shear stress of the OWC slurries and the
acceptability/rejection of the model was evaluated using the average absolute error ( AAE )
given by equation 7.4.
n
i measured
predicted measured
Y
Y Y
n AAE
1
1 (7.4)
Optimal no ofiterations
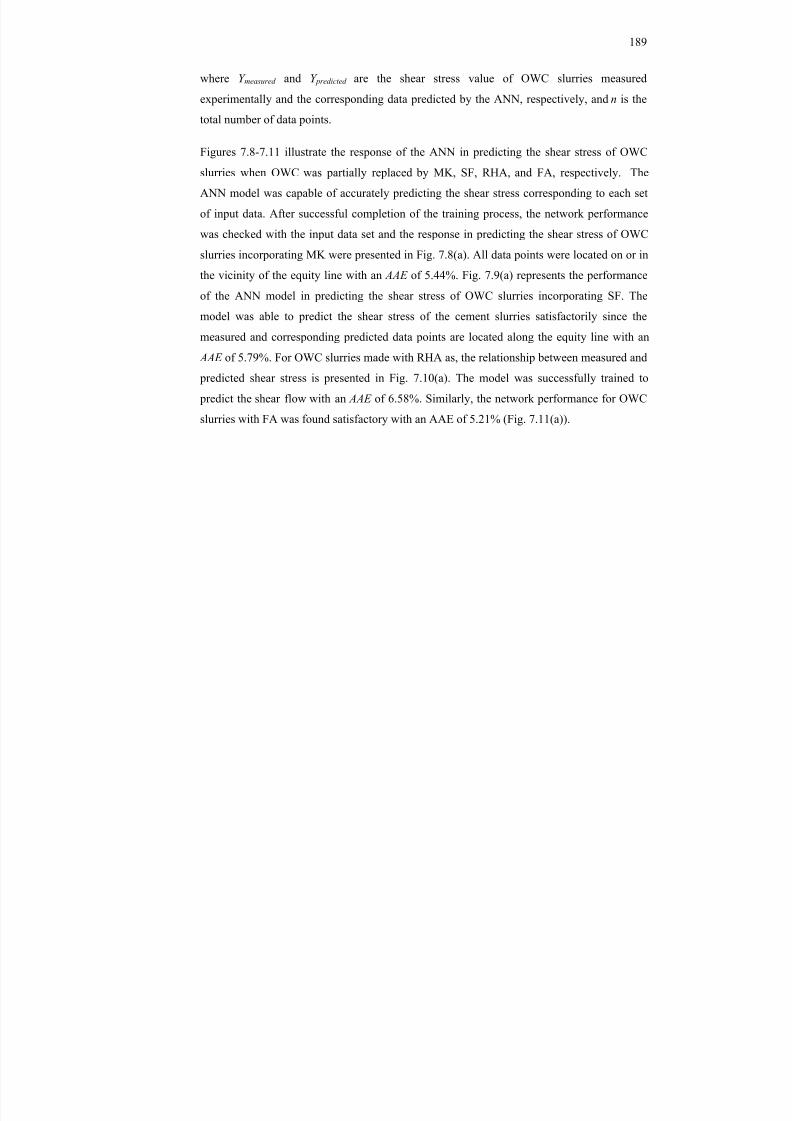
8/18/2019 Rheology of Oil Well Cement Slurries
http://slidepdf.com/reader/full/rheology-of-oil-well-cement-slurries 212/274
189
where Y measured and Y predicted are the shear stress value of OWC slurries measured
experimentally and the corresponding data predicted by the ANN, respectively, and n is the
total number of data points.
Figures 7.8-7.11 illustrate the response of the ANN in predicting the shear stress of OWCslurries when OWC was partially replaced by MK, SF, RHA, and FA, respectively. The
ANN model was capable of accurately predicting the shear stress corresponding to each set
of input data. After successful completion of the training process, the network performance
was checked with the input data set and the response in predicting the shear stress of OWC
slurries incorporating MK were presented in Fig. 7.8(a). All data points were located on or in
the vicinity of the equity line with an AAE of 5.44%. Fig. 7.9(a) represents the performance
of the ANN model in predicting the shear stress of OWC slurries incorporating SF. The
model was able to predict the shear stress of the cement slurries satisfactorily since the
measured and corresponding predicted data points are located along the equity line with an
AAE of 5.79%. For OWC slurries made with RHA as, the relationship between measured and
predicted shear stress is presented in Fig. 7.10(a). The model was successfully trained to
predict the shear flow with an AAE of 6.58%. Similarly, the network performance for OWC
slurries with FA was found satisfactory with an AAE of 5.21% (Fig. 7.11(a)).

8/18/2019 Rheology of Oil Well Cement Slurries
http://slidepdf.com/reader/full/rheology-of-oil-well-cement-slurries 213/274
190
0
200
400
600
800
1000
1200
0 200 400 600 800 1000 1200
P r e
d i c t e d s
h e a r s
t r e s s
( P a
)
Measured shear stress (Pa)
Training data
Equity line
0
200
400
600
800
1000
1200
0 200 400 600 800 1000 1200
P r e
d i c t e d s
h e a
r s
t r e s s
( P a
)
Measured shear stress (Pa)
Testing data
Equity line
Figure 7.8 Measured versus predicted shear stress for OWC slurries at different temperatureand dosage of PCH when MK was used as SCM to prepare slurries (a) Training data and (b)Testing Data.
0
200
400
600
800
1000
1200
0 200 400 600 800 1000 1200
P r e
d i c t e d s
h e a r s
t r e s s
( P a
)
Measured shear stress (Pa)
Training data
Equity line
0
200
400
600
800
1000
1200
0 200 400 600 800 1000 1200
P r e
d i c t e d s h e a r s t r e s s
( P a
)
Measured shear stress (Pa)
Testing dataEquity line
Figure 7.9 Measured versus predicted shear stress for OWC slurries at different temperatureand dosage of PCH when SF was used as SCM to prepare slurries (a) Training data and (b)Testing Data.
(a) (b) AAE=5.44% AAE=3.87%
(a) (b) AAE=5.79% AAE=3.29%
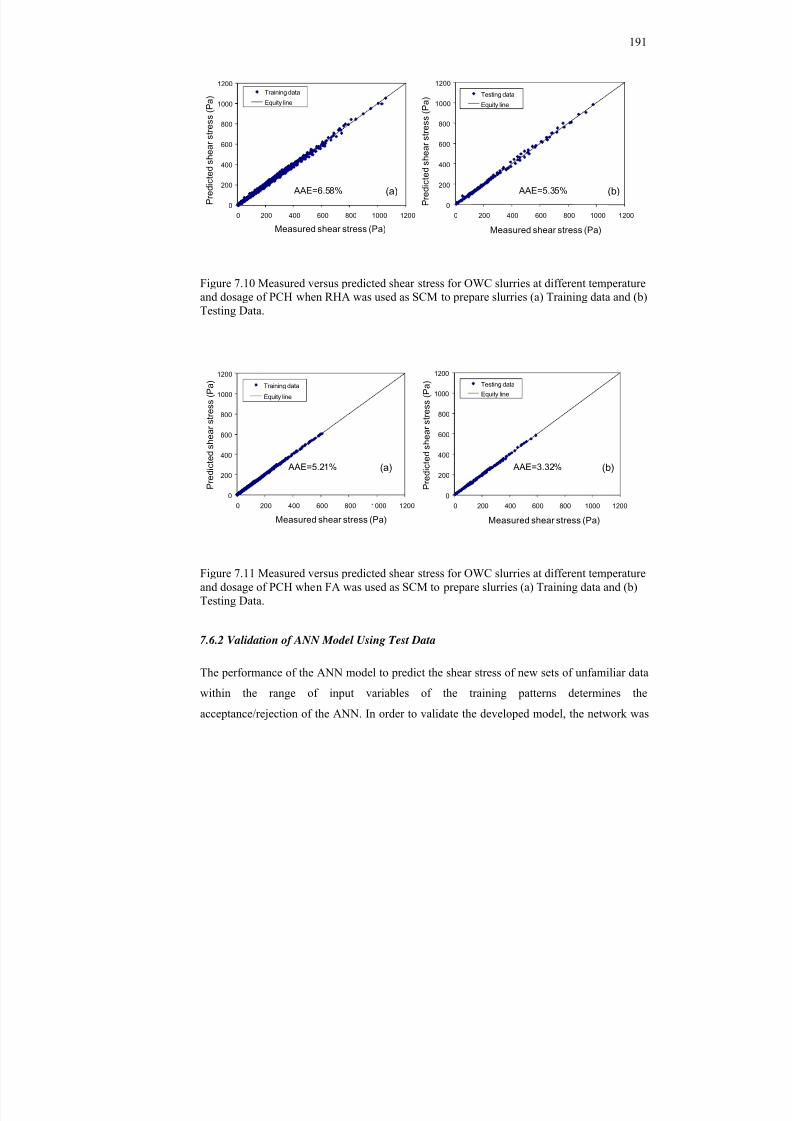
8/18/2019 Rheology of Oil Well Cement Slurries
http://slidepdf.com/reader/full/rheology-of-oil-well-cement-slurries 214/274
191
0
200
400
600
800
1000
1200
0 200 400 600 800 1000 1200
P r e
d i c t e d s h e a r s t r e s s
( P a
)
Measured shear stress (Pa)
Training data
Equity line
0
200
400
600
800
1000
1200
0 200 400 600 800 1000 1200
P r e
d i c t e d s h e a r s t r e s s
( P a
)
Measured shear stress (Pa)
Testing data
Equity line
Figure 7.10 Measured versus predicted shear stress for OWC slurries at different temperature
and dosage of PCH when RHA was used as SCM to prepare slurries (a) Training data and (b)Testing Data.
0
200
400
600
800
1000
1200
0 200 400 600 800 1000 1200
P r e
d i c t e d
s h e a r s t r e s s
( P a
)
Measured shear stress (Pa)
Training data
Equity line
0
200
400
600
800
1000
1200
0 200 400 600 800 1000 1200
P r e
d i c t e d
s h e a r s
t r e s s
( P a
)
Measured shear stress (Pa)
Testing dataEquity line
Figure 7.11 Measured versus predicted shear stress for OWC slurries at different temperatureand dosage of PCH when FA was used as SCM to prepare slurries (a) Training data and (b)
Testing Data.
7.6.2 Validation of ANN Model Using Test Data
The performance of the ANN model to predict the shear stress of new sets of unfamiliar data
within the range of input variables of the training patterns determines the
acceptance/rejection of the ANN. In order to validate the developed model, the network was
(a) (b) AAE=6.58% AAE=5.35%
(a) (b) AAE=5.21% AAE=3.32%
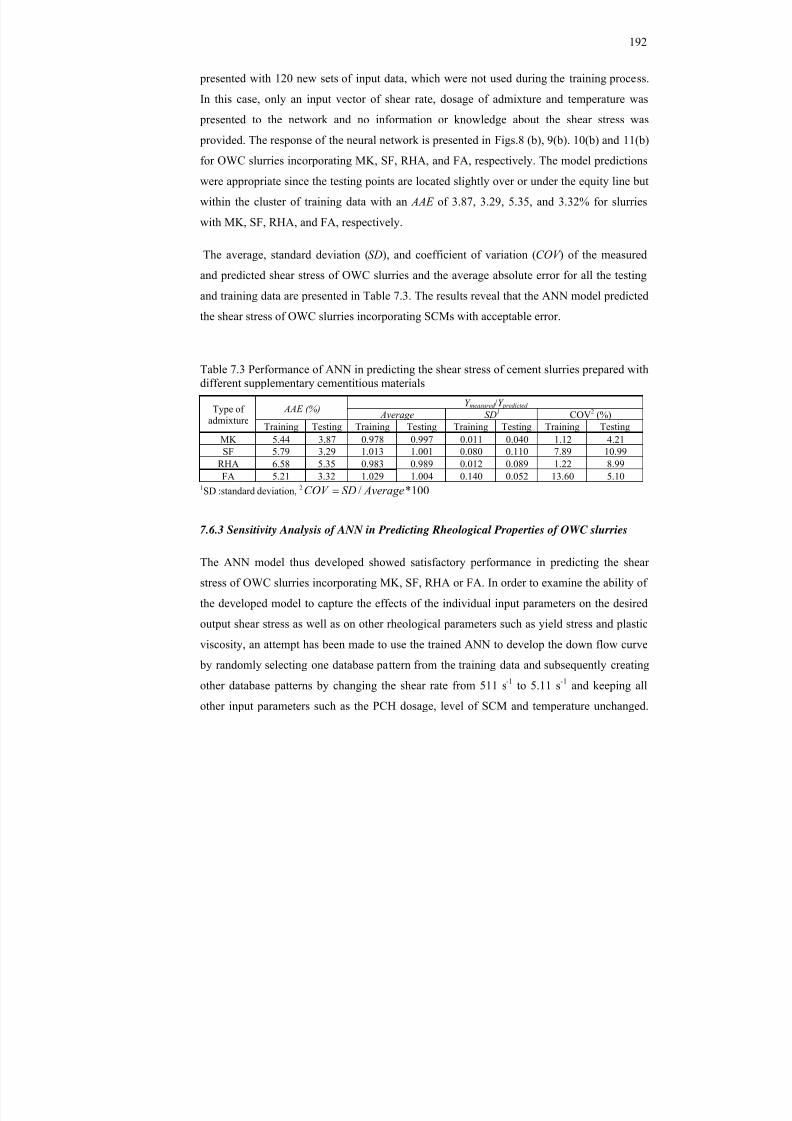
8/18/2019 Rheology of Oil Well Cement Slurries
http://slidepdf.com/reader/full/rheology-of-oil-well-cement-slurries 215/274
192
presented with 120 new sets of input data, which were not used during the training process.
In this case, only an input vector of shear rate, dosage of admixture and temperature was
presented to the network and no information or knowledge about the shear stress was
provided. The response of the neural network is presented in Figs.8 (b), 9(b). 10(b) and 11(b)
for OWC slurries incorporating MK, SF, RHA, and FA, respectively. The model predictions
were appropriate since the testing points are located slightly over or under the equity line but
within the cluster of training data with an AAE of 3.87, 3.29, 5.35, and 3.32% for slurries
with MK, SF, RHA, and FA, respectively.
The average, standard deviation ( SD), and coefficient of variation ( COV ) of the measured
and predicted shear stress of OWC slurries and the average absolute error for all the testing
and training data are presented in Table 7.3. The results reveal that the ANN model predicted
the shear stress of OWC slurries incorporating SCMs with acceptable error.
Table 7.3 Performance of ANN in predicting the shear stress of cement slurries prepared withdifferent supplementary cementitious materials
Type ofadmixture
AAE (%)Y measured /Y predicted
Average SD 1 COV 2 (%)Training Testing Training Testing Training Testing Training Testing
MK 5.44 3.87 0.978 0.997 0.011 0.040 1.12 4.21
SF 5.79 3.29 1.013 1.001 0.080 0.110 7.89 10.99RHA 6.58 5.35 0.983 0.989 0.012 0.089 1.22 8.99FA 5.21 3.32 1.029 1.004 0.140 0.052 13.60 5.10
1SD :standard deviation, 2 100*/ AverageSDCOV
7.6.3 Sensitivity Analysis of ANN in Predicting Rheological Properties of OWC slurries
The ANN model thus developed showed satisfactory performance in predicting the shear
stress of OWC slurries incorporating MK, SF, RHA or FA. In order to examine the ability of
the developed model to capture the effects of the individual input parameters on the desiredoutput shear stress as well as on other rheological parameters such as yield stress and plastic
viscosity, an attempt has been made to use the trained ANN to develop the down flow curve
by randomly selecting one database pattern from the training data and subsequently creating
other database patterns by changing the shear rate from 511 s -1 to 5.11 s -1 and keeping all
other input parameters such as the PCH dosage, level of SCM and temperature unchanged.
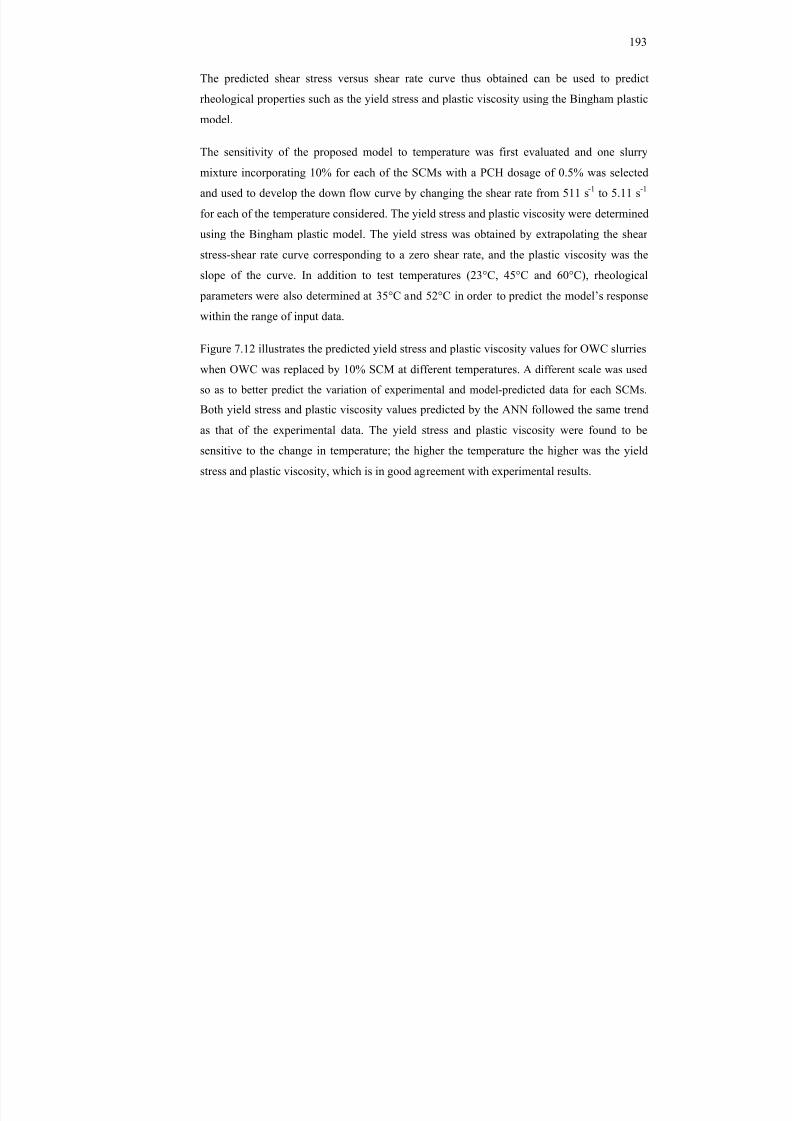
8/18/2019 Rheology of Oil Well Cement Slurries
http://slidepdf.com/reader/full/rheology-of-oil-well-cement-slurries 216/274
193
The predicted shear stress versus shear rate curve thus obtained can be used to predict
rheological properties such as the yield stress and plastic viscosity using the Bingham plastic
model.
The sensitivity of the proposed model to temperature was first evaluated and one slurrymixture incorporating 10% for each of the SCMs with a PCH dosage of 0.5% was selected
and used to develop the down flow curve by changing the shear rate from 511 s -1 to 5.11 s -1
for each of the temperature considered. The yield stress and plastic viscosity were determined
using the Bingham plastic model. The yield stress was obtained by extrapolating the shear
stress-shear rate curve corresponding to a zero shear rate, and the plastic viscosity was the
slope of the curve. In addition to test temperatures (23°C, 45°C and 60°C), rheological
parameters were also determined at 35°C and 52°C in order to predict the model’s response
within the range of input data.
Figure 7.12 illustrates the predicted yield stress and plastic viscosity values for OWC slurries
when OWC was replaced by 10% SCM at different temperatures. A different scale was used
so as to better predict the variation of experimental and model-predicted data for each SCMs.
Both yield stress and plastic viscosity values predicted by the ANN followed the same trend
as that of the experimental data. The yield stress and plastic viscosity were found to be
sensitive to the change in temperature; the higher the temperature the higher was the yieldstress and plastic viscosity, which is in good agreement with experimental results.
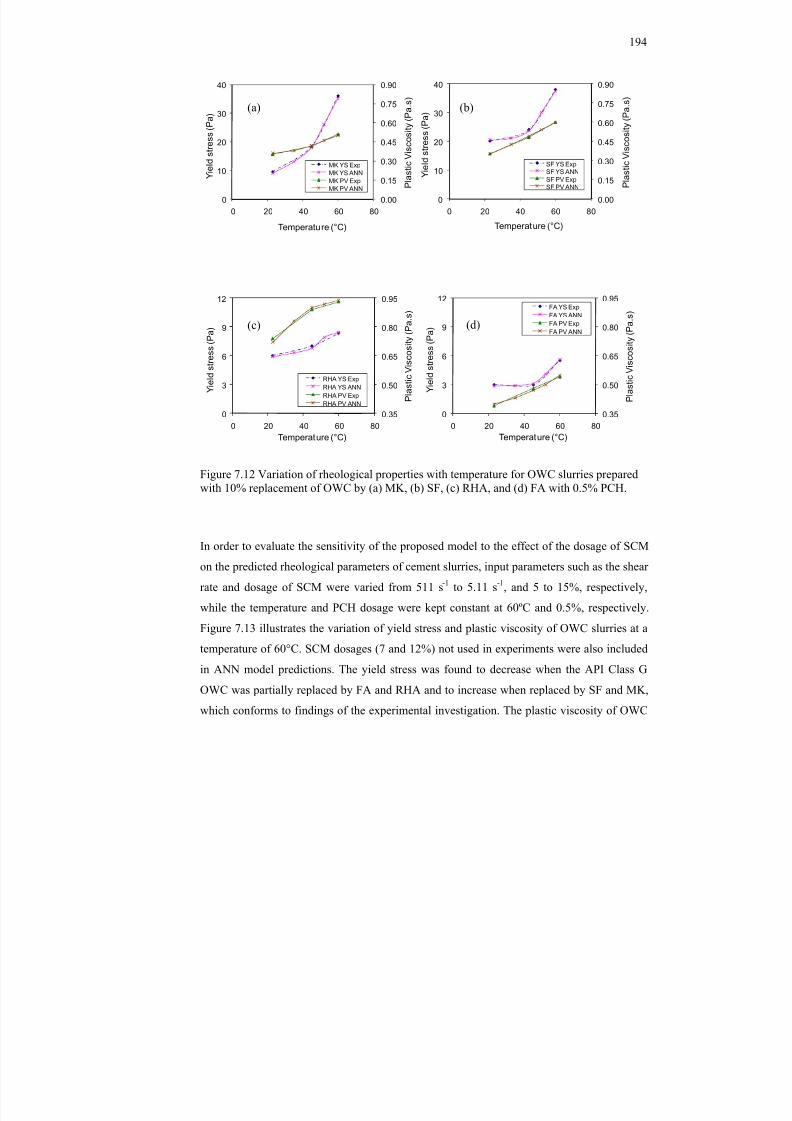
8/18/2019 Rheology of Oil Well Cement Slurries
http://slidepdf.com/reader/full/rheology-of-oil-well-cement-slurries 217/274
194
0.00
0.15
0.30
0.45
0.60
0.75
0.90
0
10
20
30
40
0 20 40 60 80
P l a s
t i c V i s c o s
i t y ( P a . s
)
Y i e l d s t r e s s
( P a
)
Temperature (°C)
MK YS ExpMK YS ANNMK PV ExpMK PV ANN
0.00
0.15
0.30
0.45
0.60
0.75
0.90
0
10
20
30
40
0 20 40 60 80
P l a s
t i c V i s c o s
i t y ( P a . s
)
Y i e l d s
t r e s s
( P a
)
Temperature (°C)
SF YS ExpSF YS ANNSF PV ExpSF PV ANN
0.35
0.50
0.65
0.80
0.95
0
3
6
9
12
0 20 40 60 80
P l a s
t i c V i s c o s
i t y ( P a . s
)
Y i e l d s
t r e s s
( P a
)
Temperature (°C)
RHA YS ExpRHA YS ANNRHA PV ExpRHA PV ANN
0.35
0.50
0.65
0.80
0.95
0
3
6
9
12
0 20 40 60 80
P l a s
t i c V i s c o s
i t y ( P a . s
)
Y i e l d s
t r e s s
( P a
)
Temperature (°C)
FA YS ExpFA YS ANNFA PV ExpFA PV ANN
Figure 7.12 Variation of rheological properties with temperature for OWC slurries preparedwith 10% replacement of OWC by (a) MK, (b) SF, (c) RHA, and (d) FA with 0.5% PCH.
In order to evaluate the sensitivity of the proposed model to the effect of the dosage of SCM
on the predicted rheological parameters of cement slurries, input parameters such as the shear
rate and dosage of SCM were varied from 511 s -1 to 5.11 s -1, and 5 to 15%, respectively,
while the temperature and PCH dosage were kept constant at 60ºC and 0.5%, respectively.Figure 7.13 illustrates the variation of yield stress and plastic viscosity of OWC slurries at a
temperature of 60°C. SCM dosages (7 and 12%) not used in experiments were also included
in ANN model predictions. The yield stress was found to decrease when the API Class G
OWC was partially replaced by FA and RHA and to increase when replaced by SF and MK,
which conforms to findings of the experimental investigation. The plastic viscosity of OWC
(d)
(a)
(c)
(b)
8/18/2019 Rheology of Oil Well Cement Slurries
http://slidepdf.com/reader/full/rheology-of-oil-well-cement-slurries 218/274
195
slurries was found to increase with the incorporation of MK, SF and RHA as partial
replacement for OWC and to decrease with the use of FA, which is in accordance with the
experimental results.
0.00
0.15
0.30
0.45
0.60
0.75
0.90
20
30
40
50
60
0 5 10 15 20
P l a s
t i c V i s c o s
i t y ( P a . s
)
Y i e l d s
t r e s s
( P a
)
Dosage of MK (%)
MK YS ExpMK YS ANNMK PV ExpMK PV ANN
0.00
0.15
0.30
0.45
0.60
0.75
0.90
20
40
60
80
100
0 5 10 15 20
P l a s
t i c V i s c o s
i t y ( P a . s
)
Y i e l d s
t r e s s
( P a
)
Dosage of SF (%)
SF YS ExpSF YS ANNSF PV ExpSF PV ANN
0.50
0.70
0.90
1.10
1.30
1.50
0
10
20
30
40
0 5 10 15 20
P l a s
t i c V i s c o s
i t y ( P a . s
)
Y i e l d s
t r e s s
( P a
)
Dosage of RHA (%)
RHA YS ExpRHA YS ANNRHA PV ExpRHA PV ANN
0.00
0.15
0.30
0.45
0.60
0.75
0.90
0
10
20
30
40
0 5 10 15 20
P l a s
t i c V i s c o s
i t y ( P a . s
)
Y i e l d s
t r e s s
( P a
)
Dosage of FA (%)
FA YS ExpFA YS ANNFA PV ExpFA PV ANN
Figure 7.13 Variation of rheological properties with dosage of SCM for OWC slurries prepared by partial replacement of (a) MK, (b) SF, (c) RHA, and (d) FA at 60ºC and with0.5% PCH.
Figure 7.14 reveals the sensitivity of the ANN model to the PCH dosage for OWC slurries
incorporating 10% SCM at 60ºC. Predicted values of yield stress decreased with higher PCH
dosage, which is in good conformity with experimental results. It can be observed that the
variation of yield stress with admixture dosage was reasonably estimated for all PCH dosages
considered and the predicted values were comparable to the corresponding measured data.
Moreover, the plastic viscosity of OWC slurries was found to be sensitive to the PCH
dosage. Plastic viscosity was found to decrease with higher PCH dosage for all the SCM
(d)
(a)
(c)
(b)
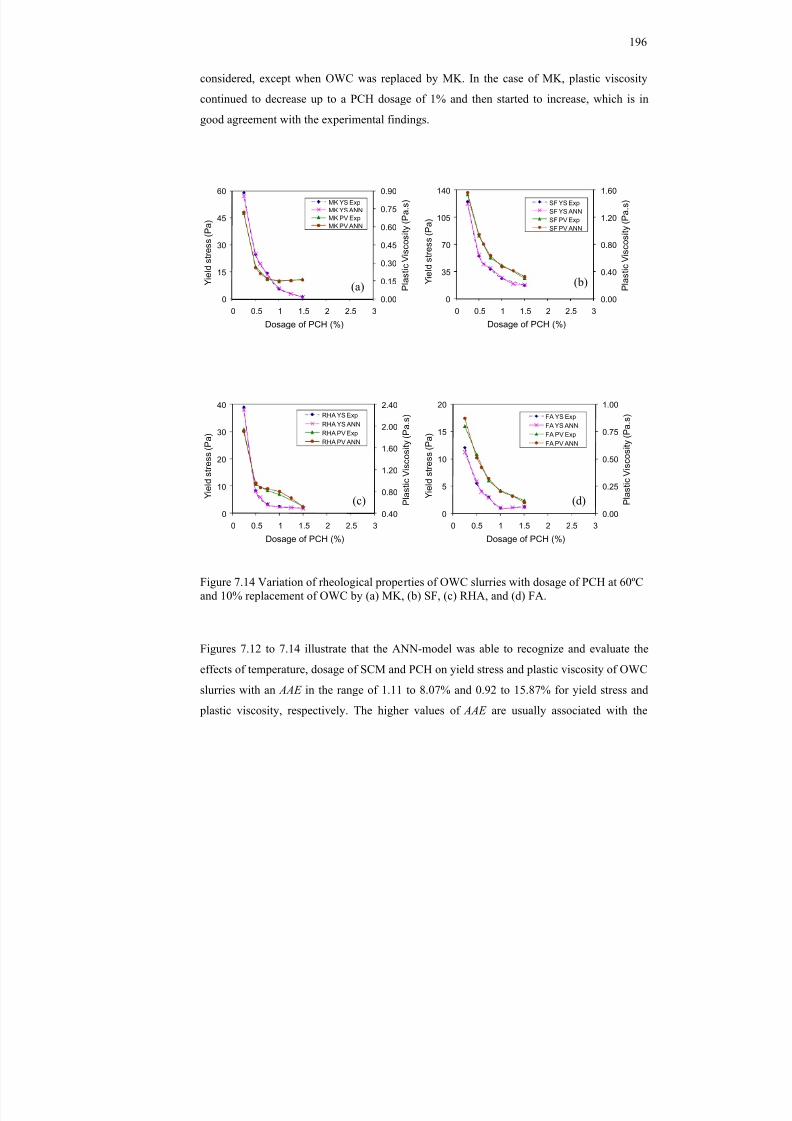
8/18/2019 Rheology of Oil Well Cement Slurries
http://slidepdf.com/reader/full/rheology-of-oil-well-cement-slurries 219/274
196
considered, except when OWC was replaced by MK. In the case of MK, plastic viscosity
continued to decrease up to a PCH dosage of 1% and then started to increase, which is in
good agreement with the experimental findings.
0.00
0.15
0.30
0.45
0.60
0.75
0.90
0
15
30
45
60
0 0.5 1 1.5 2 2.5 3
P l a s
t i c V i s c o s
i t y ( P a . s
)
Y i e l d s
t r e s s
( P a
)
Dosage of PCH (%)
MK YS ExpMK YS ANNMK PV ExpMK PV ANN
0.00
0.40
0.80
1.20
1.60
0
35
70
105
140
0 0.5 1 1.5 2 2.5 3
P l a s
t i c V i s c o s
i t y ( P a . s
)
Y i e l d s
t r e s s
( P a
)
Dosage of PCH (%)
SF YS ExpSF YS ANNSF PV ExpSF PV ANN
0.40
0.80
1.20
1.60
2.00
2.40
0
10
20
30
40
0 0.5 1 1.5 2 2.5 3
P l a s
t i c V i s c o s
i t y ( P a . s
)
Y i e l d s
t r e s s
( P a
)
Dosage of PCH (%)
RHA YS ExpRHA YS ANNRHA PV ExpRHA PV ANN
0.00
0.25
0.50
0.75
1.00
0
5
10
15
20
0 0.5 1 1.5 2 2.5 3
P l a s
t i c V i s c o s
i t y ( P a . s
)
Y i e l d s
t r e s s
( P a
)
Dosage of PCH (%)
FA YS ExpFA YS ANNFA PV ExpFA PV ANN
Figure 7.14 Variation of rheological properties of OWC slurries with dosage of PCH at 60ºCand 10% replacement of OWC by (a) MK, (b) SF, (c) RHA, and (d) FA.
Figures 7.12 to 7.14 illustrate that the ANN-model was able to recognize and evaluate the
effects of temperature, dosage of SCM and PCH on yield stress and plastic viscosity of OWC
slurries with an AAE in the range of 1.11 to 8.07% and 0.92 to 15.87% for yield stress and
plastic viscosity, respectively. The higher values of AAE are usually associated with the
(d)
(a)
(c)
(b)
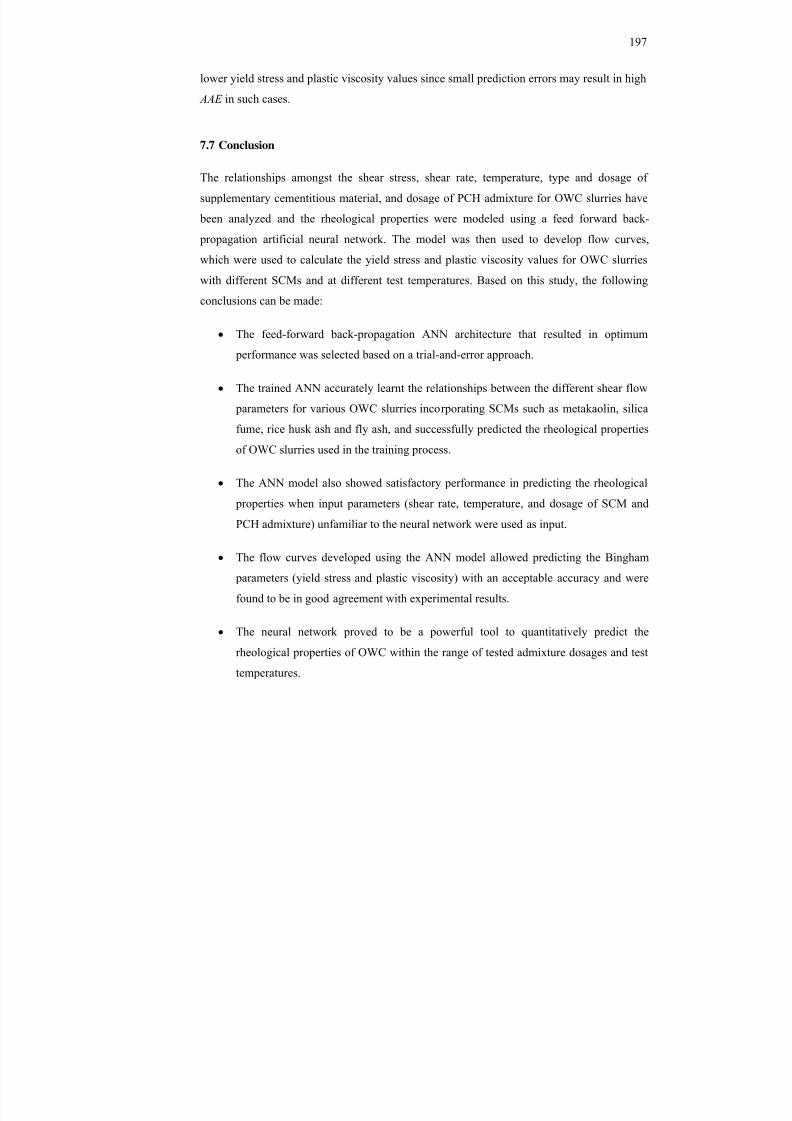
8/18/2019 Rheology of Oil Well Cement Slurries
http://slidepdf.com/reader/full/rheology-of-oil-well-cement-slurries 220/274
197
lower yield stress and plastic viscosity values since small prediction errors may result in high
AAE in such cases.
7.7 Conclusion
The relationships amongst the shear stress, shear rate, temperature, type and dosage of
supplementary cementitious material, and dosage of PCH admixture for OWC slurries have
been analyzed and the rheological properties were modeled using a feed forward back-
propagation artificial neural network. The model was then used to develop flow curves,
which were used to calculate the yield stress and plastic viscosity values for OWC slurries
with different SCMs and at different test temperatures. Based on this study, the following
conclusions can be made:
The feed-forward back-propagation ANN architecture that resulted in optimum
performance was selected based on a trial-and-error approach.
The trained ANN accurately learnt the relationships between the different shear flow
parameters for various OWC slurries incorporating SCMs such as metakaolin, silica
fume, rice husk ash and fly ash, and successfully predicted the rheological properties
of OWC slurries used in the training process.
The ANN model also showed satisfactory performance in predicting the rheological
properties when input parameters (shear rate, temperature, and dosage of SCM and
PCH admixture) unfamiliar to the neural network were used as input.
The flow curves developed using the ANN model allowed predicting the Bingham
parameters (yield stress and plastic viscosity) with an acceptable accuracy and were
found to be in good agreement with experimental results.
The neural network proved to be a powerful tool to quantitatively predict the
rheological properties of OWC within the range of tested admixture dosages and test
temperatures.
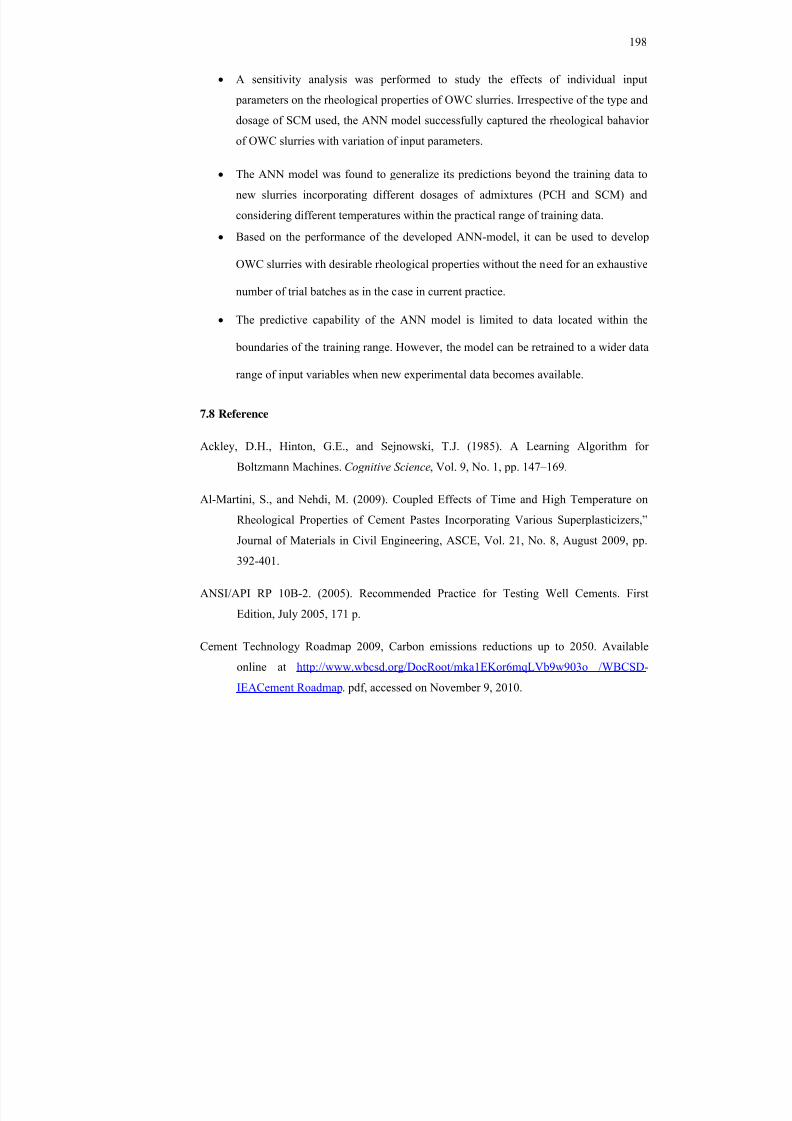
8/18/2019 Rheology of Oil Well Cement Slurries
http://slidepdf.com/reader/full/rheology-of-oil-well-cement-slurries 221/274
198
A sensitivity analysis was performed to study the effects of individual input
parameters on the rheological properties of OWC slurries. Irrespective of the type and
dosage of SCM used, the ANN model successfully captured the rheological bahavior
of OWC slurries with variation of input parameters.
The ANN model was found to generalize its predictions beyond the training data to
new slurries incorporating different dosages of admixtures (PCH and SCM) and
considering different temperatures within the practical range of training data.
Based on the performance of the developed ANN-model, it can be used to develop
OWC slurries with desirable rheological properties without the need for an exhaustive
number of trial batches as in the case in current practice.
The predictive capability of the ANN model is limited to data located within the
boundaries of the training range. However, the model can be retrained to a wider data
range of input variables when new experimental data becomes available.
7.8 Reference
Ackley, D.H., Hinton, G.E., and Sejnowski, T.J. (1985). A Learning Algorithm for
Boltzmann Machines. Cognitive Science , Vol. 9, No. 1, pp. 147–169.
Al-Martini, S., and Nehdi, M. (2009). Coupled Effects of Time and High Temperature on
Rheological Properties of Cement Pastes Incorporating Various Superplasticizers,”
Journal of Materials in Civil Engineering, ASCE, Vol. 21, No. 8, August 2009, pp.
392-401.
ANSI/API RP 10B-2. (2005). Recommended Practice for Testing Well Cements. First
Edition, July 2005, 171 p.
Cement Technology Roadmap 2009, Carbon emissions reductions up to 2050. Available
online at http://www.wbcsd.org/DocRoot/mka1EKor6mqLVb9w903o /WBCSD-
IEACement Roadmap . pdf, accessed on November 9, 2010.
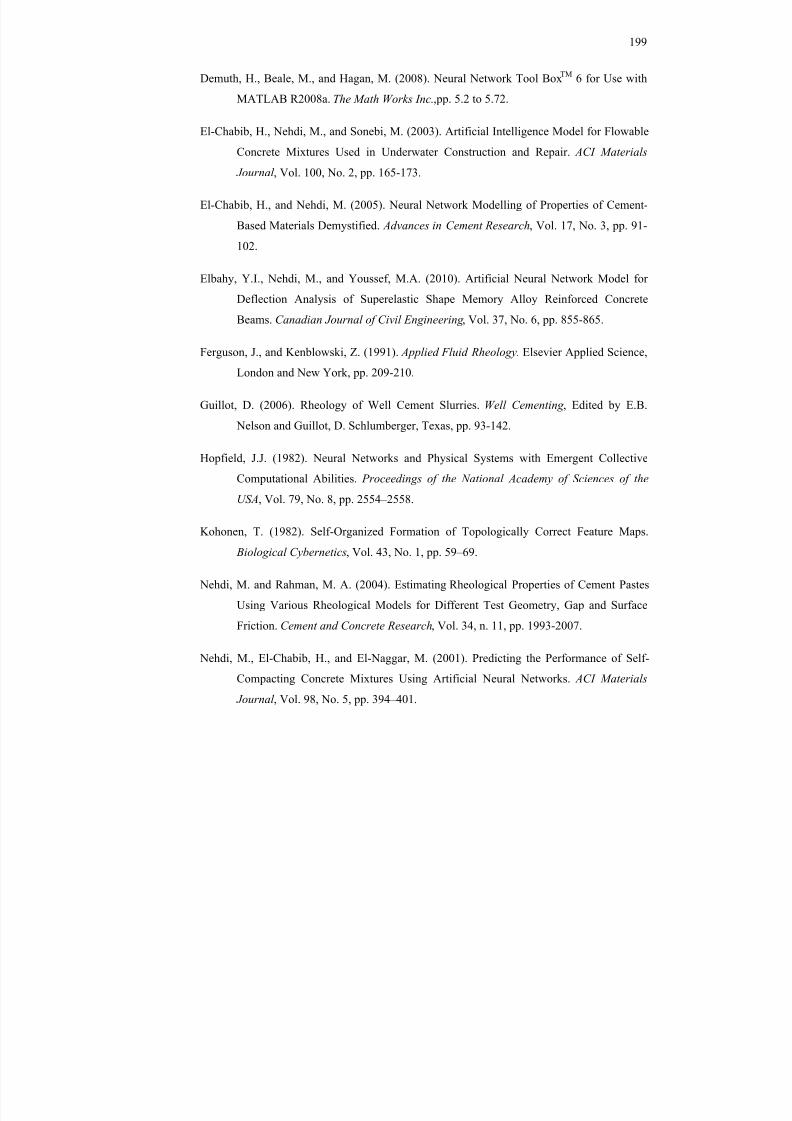
8/18/2019 Rheology of Oil Well Cement Slurries
http://slidepdf.com/reader/full/rheology-of-oil-well-cement-slurries 222/274
199
Demuth, H., Beale, M., and Hagan, M. (2008). Neural Network Tool Box TM 6 for Use with
MATLAB R2008a. The Math Works Inc. ,pp. 5.2 to 5.72.
El-Chabib, H., Nehdi, M., and Sonebi, M. (2003). Artificial Intelligence Model for Flowable
Concrete Mixtures Used in Underwater Construction and Repair. ACI Materials Journal , Vol. 100, No. 2, pp. 165-173.
El-Chabib, H., and Nehdi, M. (2005). Neural Network Modelling of Properties of Cement-
Based Materials Demystified. Advances in Cement Research , Vol. 17, No. 3, pp. 91-
102.
Elbahy, Y.I., Nehdi, M., and Youssef, M.A. (2010). Artificial Neural Network Model for
Deflection Analysis of Superelastic Shape Memory Alloy Reinforced ConcreteBeams. Canadian Journal of Civil Engineering , Vol. 37, No. 6, pp. 855-865.
Ferguson, J., and Kenblowski, Z. (1991). Applied Fluid Rheology. Elsevier Applied Science,
London and New York, pp. 209-210.
Guillot, D. (2006). Rheology of Well Cement Slurries. Well Cementing , Edited by E.B.
Nelson and Guillot, D. Schlumberger, Texas, pp. 93-142.
Hopfield, J.J. (1982). Neural Networks and Physical Systems with Emergent Collective
Computational Abilities. Proceedings of the National Academy of Sciences of the
USA, Vol. 79, No. 8, pp. 2554–2558.
Kohonen, T. (1982). Self-Organized Formation of Topologically Correct Feature Maps.
Biological Cybernetics , Vol. 43, No. 1, pp. 59–69.
Nehdi, M. and Rahman, M. A. (2004). Estimating Rheological Properties of Cement Pastes
Using Various Rheological Models for Different Test Geometry, Gap and SurfaceFriction. Cement and Concrete Research , Vol. 34, n. 11, pp. 1993-2007.
Nehdi, M., El-Chabib, H., and El-Naggar, M. (2001). Predicting the Performance of Self-
Compacting Concrete Mixtures Using Artificial Neural Networks. ACI Materials
Journal , Vol. 98, No. 5, pp. 394–401.

8/18/2019 Rheology of Oil Well Cement Slurries
http://slidepdf.com/reader/full/rheology-of-oil-well-cement-slurries 223/274
200
Rumelhart, D.E., Hinton, G.E., and Williams, R.J. (1986). Learning Internal Representation
by Error Propagation. Parallel Distributed Processing , Vol. 1: Foundation, MIT
Press, 1986, pp. 318-362.
8/18/2019 Rheology of Oil Well Cement Slurries
http://slidepdf.com/reader/full/rheology-of-oil-well-cement-slurries 224/274
201
C h a p t e r 8
OPTIMIZATION OF RHEOLOGICAL PROPERTIES OF OIL WELL
CEMENT SLURRIES USING EXPERIMENTAL DESIGN
8.1 Introduction
The rheology of oil well cement (OWC) slurries affects the primary oil well cementing job.
Thus, a fundamental knowledge of the rheology of OWC slurry is necessary to evaluate the
mix-ability and pump-ability of the slurry, optimize mud removal and slurry placement, and
to predict the effect of wellbore temperature on slurry placement (Guillot, 2006). The
rheology of cement slurries is complex since it is a manifestation of various interactions
between the cement particles, water and other constituents, time and temperature. Cement
slurries are visco-elastic materials that exhibit properties characteristic of both elastic solids
and viscous fluids.
To characterize the rheology of a cement slurry, rheological parameters such as the yield
stress, apparent viscosity, plastic viscosity, shear thinning, or shear thickening behaviour
need to be studied. The Bingham plastic model and the Power law are widely used to
describe the rheological properties of cement slurries (Guillot 2006). The Bingham plastic
model includes both yield stress, y and a limiting viscosity, P at finite shear rates. The
yield stress indicates the minimum effort needed for a material to start moving and is the
intercept of the flow curve (shear stress vs. shear rate) with the shear stress axis. Below the
yield stress, a material behaves like a solid. Yield stress is the contribution of the skeleton, i.e.
it is a manifestation of friction among solid particles (Ferraris and Larrard, 1998). Plastic
viscosity governs the flow after it is initiated and is the contribution of suspending liquids
resulting from viscous dissipation due to the movement of water in the sheared material
(Ferraris and Larrard, 1998, Laskar and Talukdar 2008). Plastic viscosity is the slope of the
fitted straight line of the flow curve. The plastic viscosity of a cement slurry is usually
evaluated using the linear portion of the down curve of the hysteresis loop.
Supplementary cementitious materials (SCMs) are increasingly being used considering their
significant sustainability and economic benefits. Moreover, chemical admixtures play an
8/18/2019 Rheology of Oil Well Cement Slurries
http://slidepdf.com/reader/full/rheology-of-oil-well-cement-slurries 225/274
202
important role in controlling the early-age and hardened properties of cement based systems.
However, because of their different physical and chemical properties, not all SCMs act in a
similar manner with respect to rheological properties. For example, owing to its spherical
particle shape, fly ash (FA) reduces the water demand when used as a partial replacement for
cement. Conversely, silica fume (SF) increases the water demand by adsorbing water due to
its very high surface area. Indeed, rheological parameters can exhibit an increase or decrease
depending on the type of cement, time and temperature, admixture used, particle shape and
size distribution, type, replacement level, and loss on ignition of the SCM used.
A number of researches have been performed over the last few decades to characterize the
properties of cement based materials incorporating SCMs. Nonetheless, information
regarding the influence of SCMs on the rheological properties of OWC slurries is less
abundant. For instance, the current knowledge on metakaolin (MK) is generally centered on
its pozzolanic behaviour and effect on cement hydration and concrete properties. It was
reported that MK had adverse effects on the workability of concrete (Sabir et al. 2001).
Golaszewski et al. (2005) performed Two-Point Workability tests on modified mortar and
found that the addition of MK had lower influence on yield stress than on plastic viscosity.
The degree of such an influence depends on the type of cement, properties of the
superplasticizer, and the metakaolin content. The effects of other SCMs, such as SF and FA,
on the rheological properties were also investigated. It was found that MK had less influence
on rheological properties than SF and FA.
It was argued that there exists a threshold value of SF partial replacement for cement, beyond
which both yield stress and plastic viscosity of concrete increase with increasing SF content
(Tattersall, 1991). Faroug et al. (1991) observed that yield stress increased up to a 20% SF
replacement level and then started to decrease. Plastic viscosity was found to decrease up to
10% SF and then it started to increase at higher levels of SF (Faroug et al., 1991). Park et al.
(2005) found that both yield stress and plastic viscosity exhibited steep increases with the
increase in condensed SF up to 15% replacement level. Nehdi et al. (1998) found that SF,
when used as partial replacement for cement, increased the amount of superplasticizer needed
to maintain a constant workability. Similar finding was also observed by Ferraris et al. (2001)
who reported that the replacement of cement by SF significantly increases the high range
water reducing (HRWR) admixture dosage at a given yield stress and plastic viscosity.
8/18/2019 Rheology of Oil Well Cement Slurries
http://slidepdf.com/reader/full/rheology-of-oil-well-cement-slurries 226/274
203
Laskar and Talukdar (2008) studied the effect of RHA on the rheological properties of
Ordinary Portland Cement (OPC) concrete and found that yield stress decreased and plastic
viscosity increased when RHA was used as partial replacement for OPC. Nehdi et al. (2003)
found that the replacement of cement by RHA resulted in increased water demand and
reduced concrete workability. However the water requirement for all RHA samples tested
was lower than that of SF mixtures despite that some RHAs had higher surface area than that
of SF.
The flow behaviour of pure FA paste is similar to that of cement paste (Sybert and Reick
1990). Sybert and Reick (1990) found that rheological properties vary linearly when cement
is partially replaced by FA. A small change in the FA ash properties can cause large changes
in the flow properties. Bunn et al. (1990) investigated the effect of temperature on FA ash
slurry rheology and found that the apparent viscosity decreased with increasing temperature.
Ferraris et al. (2001) found that partial replacement of cement by FA led to a decrease in the
HRWR admixture dosage at a given yield stress and plastic viscosity. Tattersall (1991) found
that yield stress decreased moderately, while the plastic viscosity decreased slightly when FA
was used as partial replacement for cement. Banfill (1994) found that both yield stress and
plastic viscosity decreased with the increase in FA content. Laskar and Talukdar (2008)
report that the addition of increasing levels of up to 30% FA led to a decrease in the yield
stress of concrete, then yield stress slightly increased up to a 50% FA level. The plastic
viscosity was found to exhibit an irregular behviour. It increased up to 10% FA and then
decreased gradually up to 30% FA. Beyond this level, change in plastic viscosity was not
significant (Laskar and Talukdar, 2008).
A number of researches (e.g. Menezes et al., 2010; Yahia and Khayat, 2002; Sonebi, 2001,
2002, 2010; Nehdi et al., 1997, Khayat et al., 1999) used statistical approaches to select
mixture proportioning for cementitious systems. For example, Al-Darbi et al. (2006) used
factorial design of experiments to evaluate the effects of human hair fibers on the reduction
of shrinkage cracking of mortar considering the cement/sand ratio, water/cement ratio, and
human hair fibers content as design parameters. These statistical methods provide greater
efficiency and confidence in the results obtained, and could optimize the tested systems with
a minimum number of experiments. Using this approach in the oil well cementing and
petroleum industry is fairly new. For instance, Cestari et al. (2009) used 2 3 full-factorial
8/18/2019 Rheology of Oil Well Cement Slurries
http://slidepdf.com/reader/full/rheology-of-oil-well-cement-slurries 227/274
204
design to study the effects of temperature and HCL concentration on the adsorption of HCL
onto API class A cement slurries.
The present study aims at evaluating the effects of temperature, superplasticizer dosage, and
the type and level of SCM partial replacement for cement on the rheological properties ofOWC slurries using a statistical approach and design of experiments. The statistical model
thus developed could be used to evaluate the effects of experimental parameters and their
interactions on the rheological properties of OWC slurries. It can also be used for tailoring
OWC slurry mixtures to meet specific rheological requirements.
The optimization of OWC slurries often requires a number of trial batches to achieve
adequate rheological properties. This is usually labor intensive and time consuming. A
factorial experimental design approach was used in this study to determine the influence of
temperature and key mixture design parameters such as the superplasticizer dosage and type
and level of SCM used as partial replacement for cement, along with interactions between
these parameters on the rheological properties of OWC slurries. A predictive model has been
developed, which can simplify the test protocol required to achieve an optimum balance
among various parameters for achieving a specific rheological performance of OWC slurries.
8.2 Materials
The OWC slurries tested in this study for developing a predictive statistical model were
prepared using a high sulphate-resistant API Class G OWC with a specific gravity of 3.14.
De-ionized distilled water was used for the mixing, and its temperature was maintained at
23±1°C using an isothermal container. The incorporated SCMs included MK, SF, RHA, and
low calcium FA with an OWC partial replacement level ranging from 5 to 15%. The
chemical and physical properties of the cement and SCMs are summarized in Table 5.1
(Chapter 5). A new generation polycarboxylate-based high-range water reducing admixture
(PCH) was used as the chemical admixtures to prepare the OWC slurries at a water-to-
cement mass ratio (w/c) of 0.44.
8/18/2019 Rheology of Oil Well Cement Slurries
http://slidepdf.com/reader/full/rheology-of-oil-well-cement-slurries 228/274
205
8.3 Test Procedure
The OWC slurries were prepared using a variable speed high-shear blender type mixer with
bottom drive blades as per the ANSI/API Recommended Practice 10B-2 (2005) at a
controlled ambient room temperature of 23±1°C. The prepared slurry was then placed intothe bowl of a mixer for preconditioning (at 150 rpm) over 20 minutes at the specific test
temperature (23°C, 45°C, or 60°C). The total time between the beginning of mixing and the
start of the rheological tests was kept constant for all slurries to avoid the effects of
exogenous variables on the results.
A high accuracy advanced rheometer (TA instruments AR 2000) (Fig. 4.1 (Chapter 4)),
capable of continuous shear rate sweep, stress sweep and strain sweep was used throughout
this study to measure the rheological properties of cement slurries. The rheometer set-up was
also maintained constant for all tested slurries. The concentric cylinder test geometry was
maintained at the test temperature so as to avoid sudden thermal shock of the slurry. The
cement slurry sample was placed in the coaxial cylinder of the rheometer after mixing and
preconditioning. The sample was subjected to a stepped ramp or steady state flow once the
temperature of the rheometer was adjusted to the required level, and rheological
measurements were taken at 20 different shear rates starting from 5.11 s -1 up to 511 s -1 after a
continuous rotation of 10 sec at each level. The data were also measured at a descendingshear rate from 511 s -1 to 5.11 s -1 to obtain the down flow curve. The schematic
representation of the viscometric testing scheme illustrated in Fig. 5.1 (Chapter 5) has been
used in this study.
8.4 Experimental Results
The Bingham plastic model (equation 8.1) was used in this study to calculate the yield stress
and plastic viscosity from the shear rate-shear stress down-curve. The down-curve was
chosen since it better fits to the Bingham plastic model than the up-curve (Ferguson and
Kenblowski 1991).
.
P y (8.1)
8/18/2019 Rheology of Oil Well Cement Slurries
http://slidepdf.com/reader/full/rheology-of-oil-well-cement-slurries 229/274
206
Where, , y , P , and represent the shear stress, yield stress, plastic viscosity, and shear
rate, respectively.
The effect of the type and dosage of SCM on the yield stress and plastic viscosity of OWC
slurries at different test temperatures, namely 23, and 60°C are presented in Figs. 8.1 and 8.2,
respectively. It is revealed that the Bingham parameters (yield stress and plastic viscosity) are
very much dependent on test variables such as the temperature, type and level of SCM and
PCH dosage. For instance, the yield stress was found to increase with the addition of MK or
SF and to decrease with the incorporation of RHA or FA. Incorporating FA caused the plastic
viscosity of OWC slurries to decrease, while this value increased with the addition of other
SCMs. Due to such variations, individual statistical models have been developed for each of
these SCMs.
Figure 5.6 (Chapter 5) illustrates the variation of yield stress of OWC slurries incorporating
varying dosages of SCMs and PCH at a w/b ratio of 0.44. Different scales have been used to
represent results for FA and RHA due to their much lower yield stress values compared to
those for MK and SF. It can be observed that for all SCMs used, yield stress generally
decreased with PCH addition and this decrease was generally gradual until reaching a
saturation dosage. However, for each SCM, the saturation dosage depended on the SCM
dosage and temperature. It can be further observed from Fig. 5.6 that regardless of the dosage
of SCM and PCH, the higher the temperature, the higher was the yield stress, which is due to
the higher rate of hydration reactions at higher temperature. Yield stress decreased with PCH
addition for all SCMs, yet the dosages required were higher in the case of SF and MK.
Plastic viscosity values of the OWC slurries were measured as the slope of the down flow
curve of the hysteresis loop and plotted in Fig. 5.7 (Chapter 5). In general, plastic viscosity
was found to increase with the increase of test temperature and to decrease with the increase
of PCH dosage.
8/18/2019 Rheology of Oil Well Cement Slurries
http://slidepdf.com/reader/full/rheology-of-oil-well-cement-slurries 230/274
207
8.5 Factorial Design Approach
A second order 2 k central composite response surface model was used in this study to
evaluate the influence of two different levels for each variable on the rheological properties
of OWC slurries. The three experimental parameters for the rheological model are the PCHdosage, type and level of SCM, and temperature. Considering the nonlinear interactions
between the variables, a second order central composite design (CCD) was selected to
quantify the predicted responses (yield stress and plastic viscosity) for each SCM used using
the following relationships:
ji
jiiji
iiii
ii x xa xa xaa3
1
23
100 (8.2)
ji
jiiji
iiii
ii p x xb xb xbb3
1
23
10 (8.3)
where , 0a , ia , iia , ija , 0b , ib , iib , and ijb are regression coefficients, and 0 , p , ε , x1 , x2
and x3 are yield stress, plastic viscosity, noise or error observed in the responses, temperature,
level of SCM, and dosage of PCH, respectively.
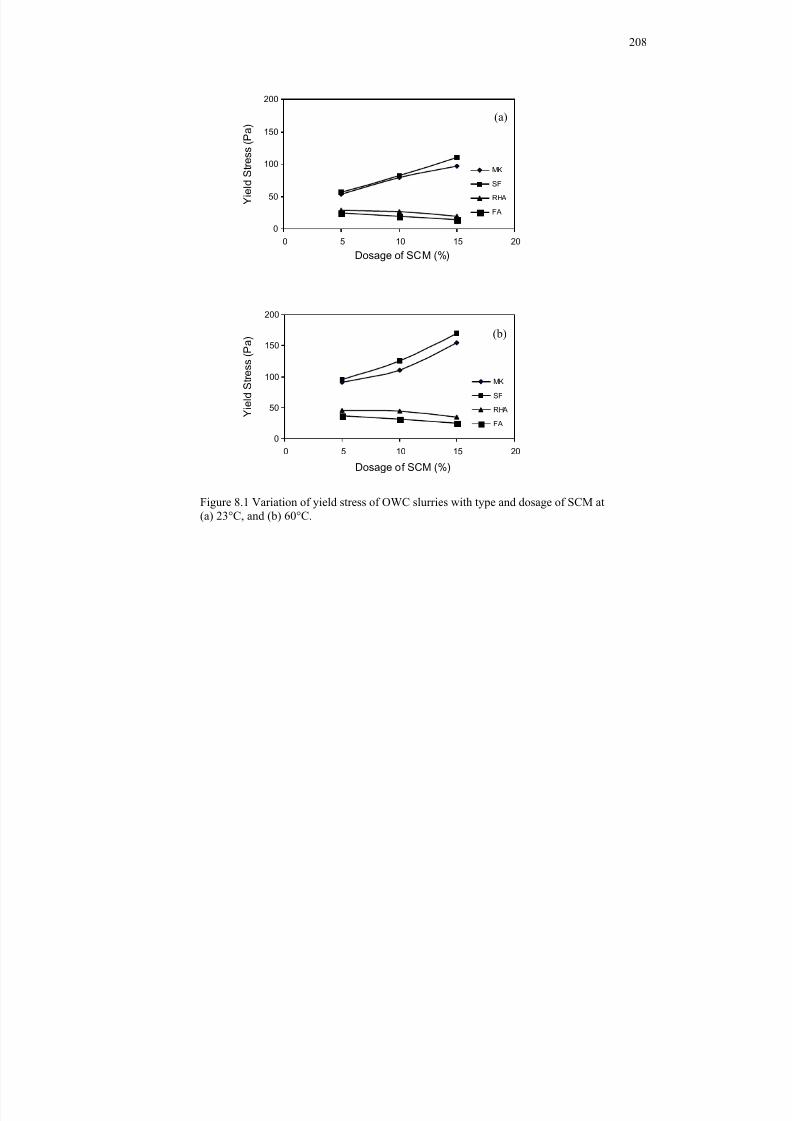
8/18/2019 Rheology of Oil Well Cement Slurries
http://slidepdf.com/reader/full/rheology-of-oil-well-cement-slurries 231/274
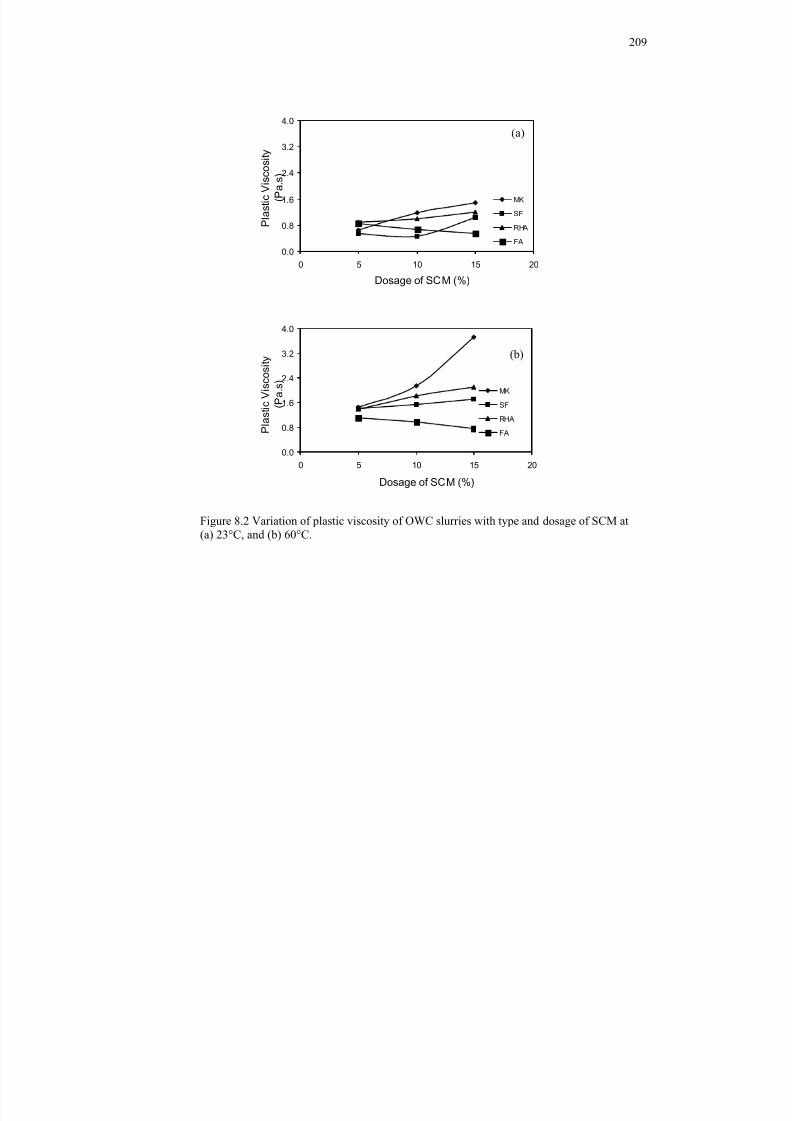
8/18/2019 Rheology of Oil Well Cement Slurries
http://slidepdf.com/reader/full/rheology-of-oil-well-cement-slurries 232/274
209
Figure 8.2 Variation of plastic viscosity of OWC slurries with type and dosage of SCM at(a) 23°C, and (b) 60°C.
0.0
0.8
1.6
2.4
3.2
4.0
0 5 10 15 20
Dosage of SCM (%)
P l a s
t i c V i s c o s
i t y
( P a . s
)
MK
SF
RHA
FA
(a)
0.0
0.8
1.6
2.4
3.2
4.0
0 5 10 15 20
Dosage of SCM (%)
P l a s
t i c V i s c o s
i t y
( P a . s
)
MK
SF
RHA
FA
(b)
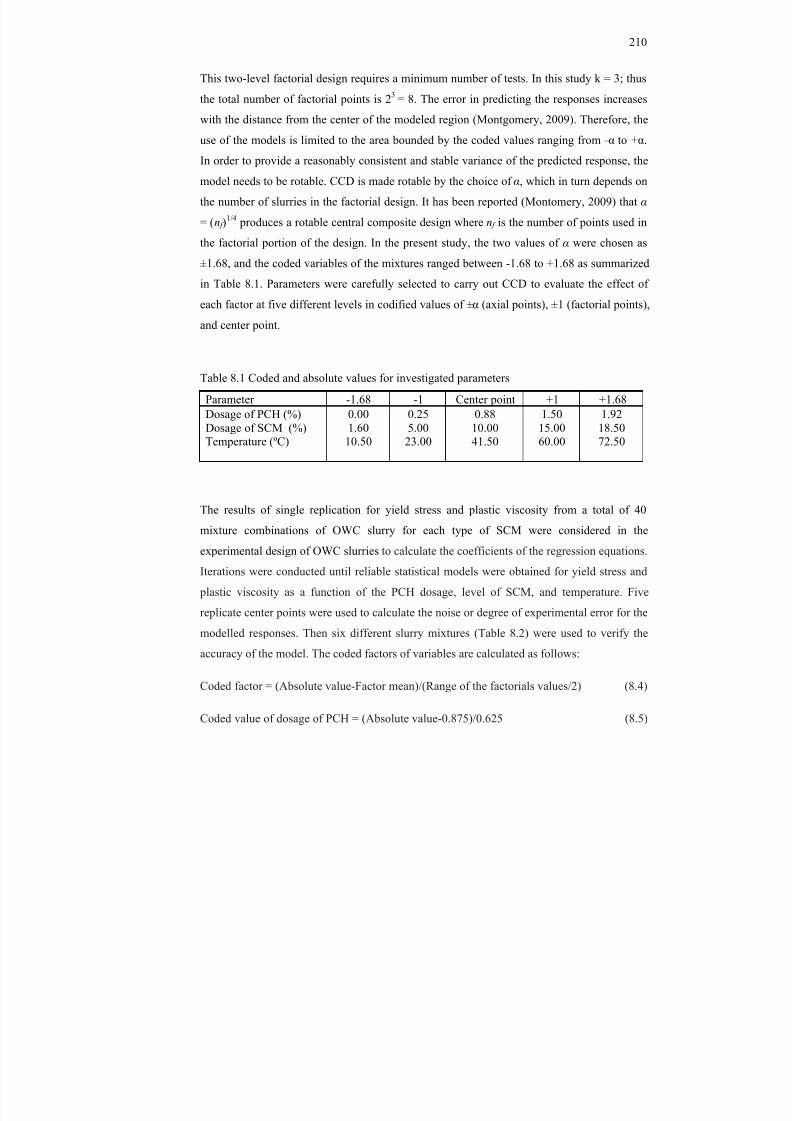
8/18/2019 Rheology of Oil Well Cement Slurries
http://slidepdf.com/reader/full/rheology-of-oil-well-cement-slurries 233/274
210
This two-level factorial design requires a minimum number of tests. In this study k = 3; thus
the total number of factorial points is 2 3 = 8. The error in predicting the responses increases
with the distance from the center of the modeled region (Montgomery, 2009). Therefore, the
use of the models is limited to the area bounded by the coded values ranging from – α to + α .
In order to provide a reasonably consistent and stable variance of the predicted response, the
model needs to be rotable. CCD is made rotable by the choice of α , which in turn depends on
the number of slurries in the factorial design. It has been reported (Montomery, 2009) that α
= ( n f )1/4 produces a rotable central composite design where n f is the number of points used in
the factorial portion of the design. In the present study, the two values of α were chosen as
±1.68, and the coded variables of the mixtures ranged between -1.68 to +1.68 as summarized
in Table 8.1. Parameters were carefully selected to carry out CCD to evaluate the effect of
each factor at five different levels in codified values of ± α (axial points), ±1 (factorial points),and center point.
Table 8.1 Coded and absolute values for investigated parameters
Parameter -1.68 -1 Center point +1 +1.68Dosage of PCH (%)Dosage of SCM (%)Temperature (ºC)
0.001.60
10.50
0.255.00
23.00
0.8810.0041.50
1.5015.0060.00
1.9218.5072.50
The results of single replication for yield stress and plastic viscosity from a total of 40
mixture combinations of OWC slurry for each type of SCM were considered in the
experimental design of OWC slurries to calculate the coefficients of the regression equations.
Iterations were conducted until reliable statistical models were obtained for yield stress and
plastic viscosity as a function of the PCH dosage, level of SCM, and temperature. Five
replicate center points were used to calculate the noise or degree of experimental error for the
modelled responses. Then six different slurry mixtures (Table 8.2) were used to verify the
accuracy of the model. The coded factors of variables are calculated as follows:
Coded factor = (Absolute value-Factor mean)/(Range of the factorials values/2) (8.4)
Coded value of dosage of PCH = (Absolute value-0.875)/0.625 (8.5)
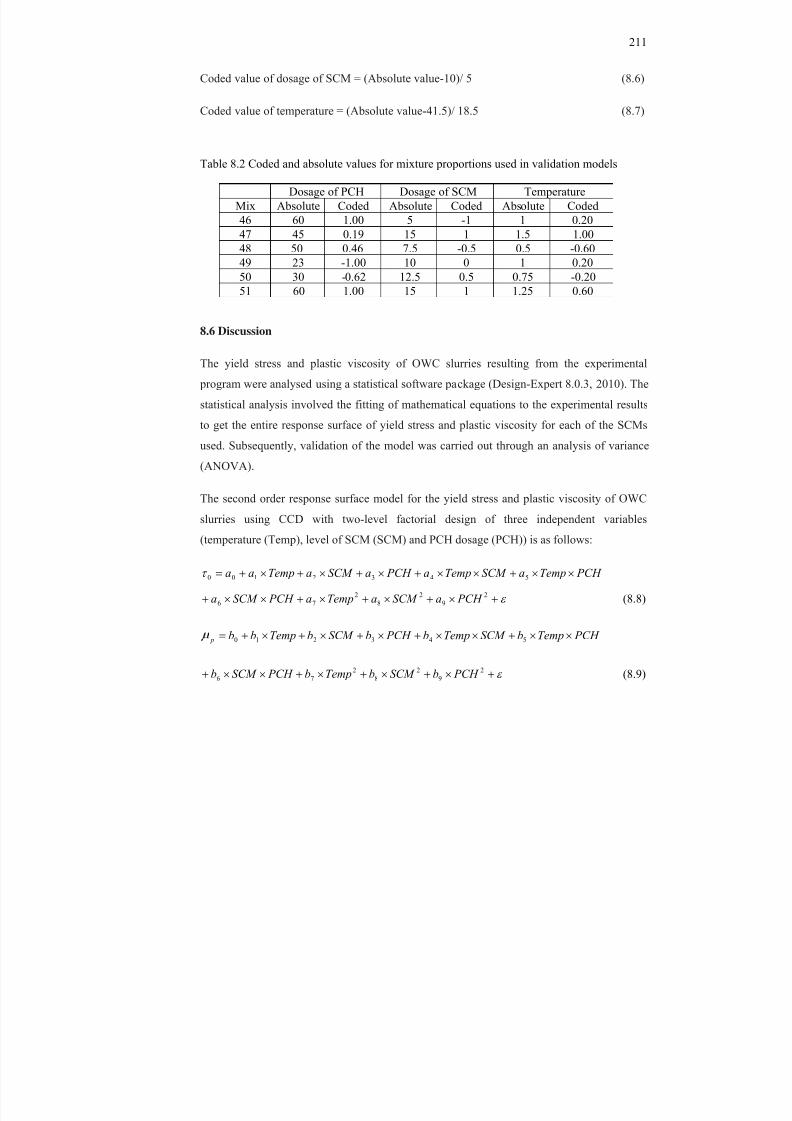
8/18/2019 Rheology of Oil Well Cement Slurries
http://slidepdf.com/reader/full/rheology-of-oil-well-cement-slurries 234/274
211
Coded value of dosage of SCM = (Absolute value-10)/ 5 (8.6)
Coded value of temperature = (Absolute value-41.5)/ 18.5 (8.7)
Table 8.2 Coded and absolute values for mixture proportions used in validation models
Dosage of PCH Dosage of SCM TemperatureMix Absolute Coded Absolute Coded Absolute Coded46 60 1.00 5 -1 1 0.2047 45 0.19 15 1 1.5 1.0048 50 0.46 7.5 -0.5 0.5 -0.6049 23 -1.00 10 0 1 0.2050 30 -0.62 12.5 0.5 0.75 -0.2051 60 1.00 15 1 1.25 0.60
8.6 Discussion
The yield stress and plastic viscosity of OWC slurries resulting from the experimental
program were analysed using a statistical software package (Design-Expert 8.0.3, 2010). The
statistical analysis involved the fitting of mathematical equations to the experimental results
to get the entire response surface of yield stress and plastic viscosity for each of the SCMs
used. Subsequently, validation of the model was carried out through an analysis of variance
(ANOVA).
The second order response surface model for the yield stress and plastic viscosity of OWC
slurries using CCD with two-level factorial design of three independent variables
(temperature (Temp), level of SCM (SCM) and PCH dosage (PCH)) is as follows:
PCH TempaSCM Tempa PCH aSCM aTempaa 5432100
2
9
2
8
2
76 PCH aSCM aTempa PCH SCM a (8.8)
PCH TempbSCM Tempb PCH bSCM bTempbb p 543210
2
92
82
76 PCH bSCM bTempb PCH SCM b (8.9)
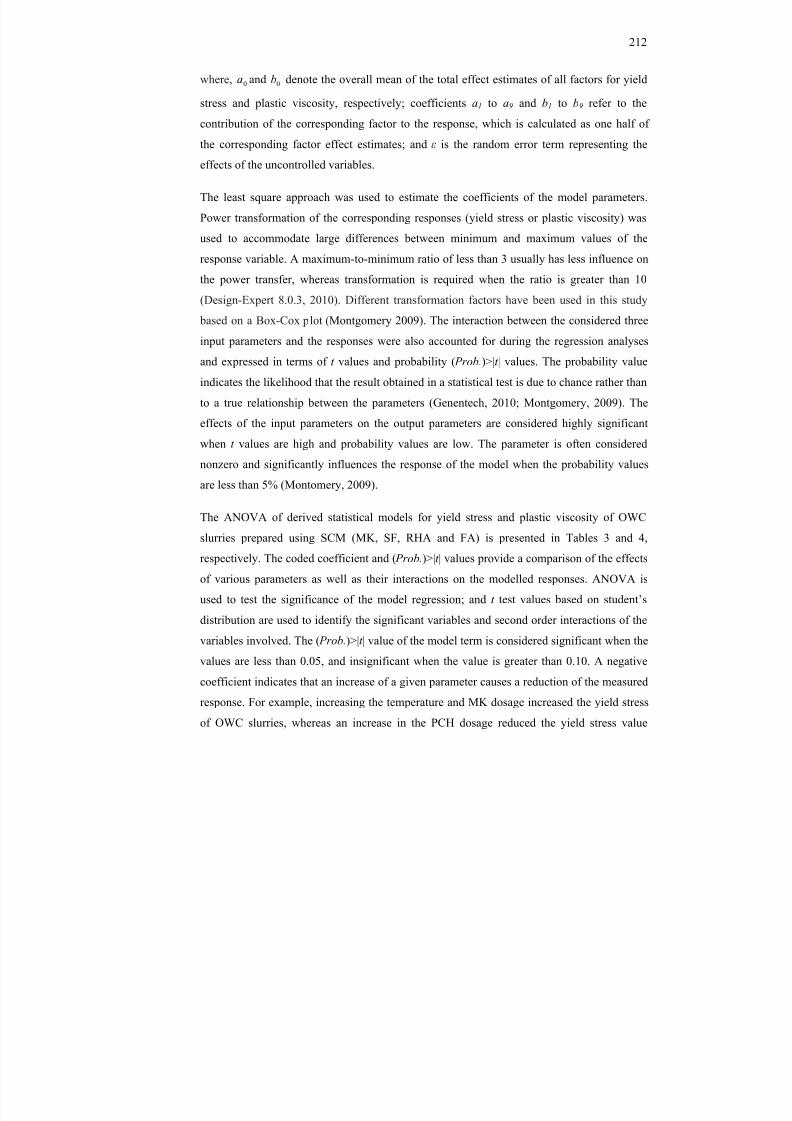
8/18/2019 Rheology of Oil Well Cement Slurries
http://slidepdf.com/reader/full/rheology-of-oil-well-cement-slurries 235/274
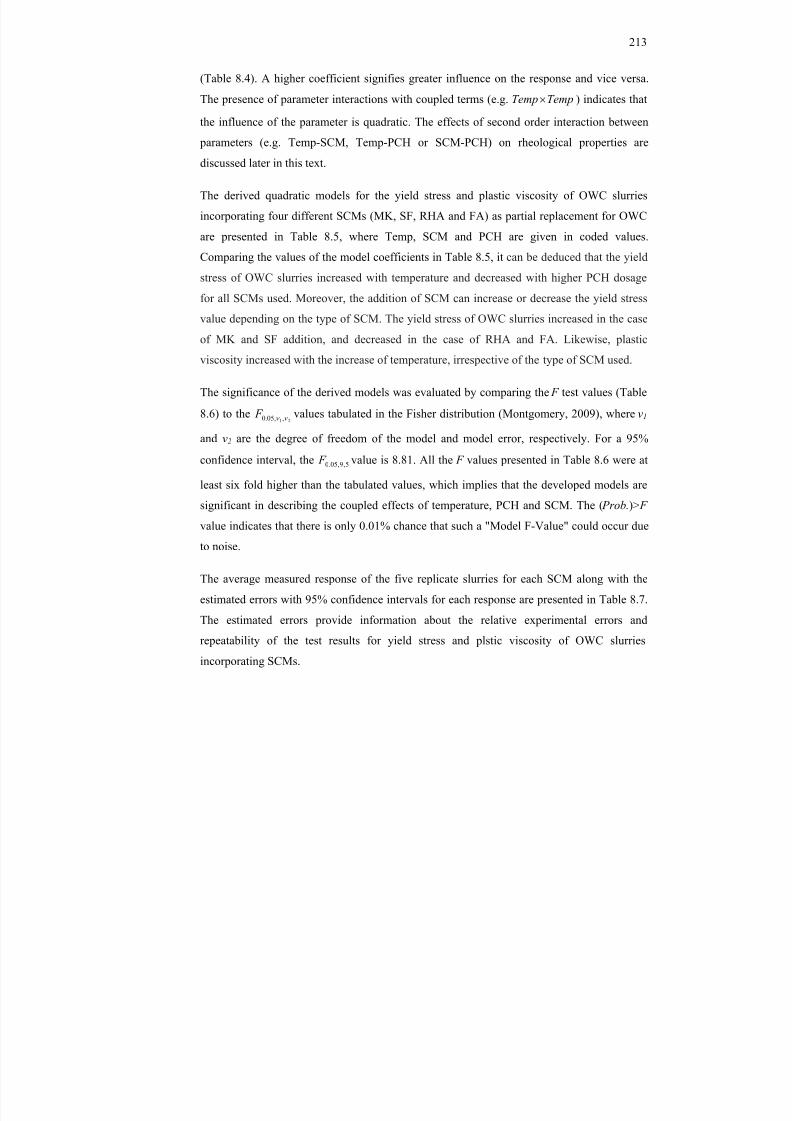
8/18/2019 Rheology of Oil Well Cement Slurries
http://slidepdf.com/reader/full/rheology-of-oil-well-cement-slurries 236/274
213
(Table 8.4). A higher coefficient signifies greater influence on the response and vice versa.
The presence of parameter interactions with coupled terms (e.g. TempTemp ) indicates that
the influence of the parameter is quadratic. The effects of second order interaction between
parameters (e.g. Temp-SCM, Temp-PCH or SCM-PCH) on rheological properties are
discussed later in this text.
The derived quadratic models for the yield stress and plastic viscosity of OWC slurries
incorporating four different SCMs (MK, SF, RHA and FA) as partial replacement for OWC
are presented in Table 8.5, where Temp, SCM and PCH are given in coded values.
Comparing the values of the model coefficients in Table 8.5, it can be deduced that the yield
stress of OWC slurries increased with temperature and decreased with higher PCH dosage
for all SCMs used. Moreover, the addition of SCM can increase or decrease the yield stressvalue depending on the type of SCM. The yield stress of OWC slurries increased in the case
of MK and SF addition, and decreased in the case of RHA and FA. Likewise, plastic
viscosity increased with the increase of temperature, irrespective of the type of SCM used.
The significance of the derived models was evaluated by comparing the F test values (Table
8.6) to the21 ,,05.0 F values tabulated in the Fisher distribution (Montgomery, 2009), where ν 1
and ν 2 are the degree of freedom of the model and model error, respectively. For a 95%
confidence interval, the 5,9,05.0 F value is 8.81. All the F values presented in Table 8.6 were at
least six fold higher than the tabulated values, which implies that the developed models are
significant in describing the coupled effects of temperature, PCH and SCM. The ( Prob. )> F
value indicates that there is only 0.01% chance that such a "Model F-Value" could occur due
to noise.
The average measured response of the five replicate slurries for each SCM along with the
estimated errors with 95% confidence intervals for each response are presented in Table 8.7.
The estimated errors provide information about the relative experimental errors and
repeatability of the test results for yield stress and plstic viscosity of OWC slurries
incorporating SCMs.
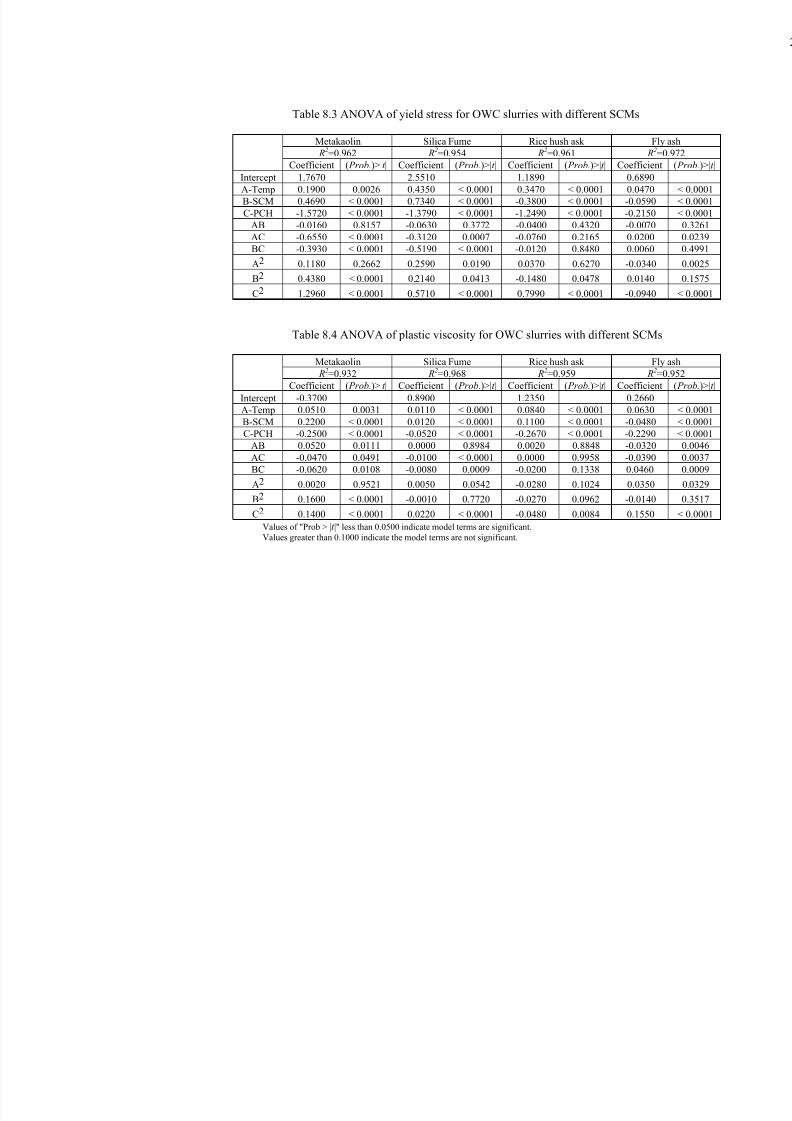
8/18/2019 Rheology of Oil Well Cement Slurries
http://slidepdf.com/reader/full/rheology-of-oil-well-cement-slurries 237/274
Table 8.3 ANOVA of yield stress for OWC slurries with different SCMs
Metakaolin Silica Fume Rice hush ask Fly ash R2=0.962 R2=0.954 R2=0.961 R2=
Coefficient ( Prob. )>| t | Coefficient ( Prob. )>| t | Coefficient ( Prob. )>| t | Coefficient Intercept 1.7670 2.5510 1.1890 0.6890A-Temp 0.1900 0.0026 0.4350 < 0.0001 0.3470 < 0.0001 0.0470 < 0B-SCM 0.4690 < 0.0001 0.7340 < 0.0001 -0.3800 < 0.0001 -0.0590 < 0C-PCH -1.5720 < 0.0001 -1.3790 < 0.0001 -1.2490 < 0.0001 -0.2150 < 0
AB -0.0160 0.8157 -0.0630 0.3772 -0.0400 0.4320 -0.0070 0AC -0.6550 < 0.0001 -0.3120 0.0007 -0.0760 0.2165 0.0200 0BC -0.3930 < 0.0001 -0.5190 < 0.0001 -0.0120 0.8480 0.0060 0
A2 0.1180 0.2662 0.2590 0.0190 0.0370 0.6270 -0.0340
B2 0.4380 < 0.0001 0.2140 0.0413 -0.1480 0.0478 0.0140
C2 1.2960 < 0.0001 0.5710 < 0.0001 0.7990 < 0.0001 -0.0940 <
Table 8.4 ANOVA of plastic viscosity for OWC slurries with different SCMs
Metakaolin Silica Fume Rice hush ask Fly ash R2=0.932 R2=0.968 R2=0.959 R2=
Coefficient ( Prob. )>| t | Coefficient ( Prob. )>| t | Coefficient ( Prob. )>| t | Coefficient Intercept -0.3700 0.8900 1.2350 0.2660A-Temp 0.0510 0.0031 0.0110 < 0.0001 0.0840 < 0.0001 0.0630 < 0B-SCM 0.2200 < 0.0001 0.0120 < 0.0001 0.1100 < 0.0001 -0.0480 < 0C-PCH -0.2500 < 0.0001 -0.0520 < 0.0001 -0.2670 < 0.0001 -0.2290 < 0
AB 0.0520 0.0111 0.0000 0.8984 0.0020 0.8848 -0.0320 0AC -0.0470 0.0491 -0.0100 < 0.0001 0.0000 0.9958 -0.0390 0BC -0.0620 0.0108 -0.0080 0.0009 -0.0200 0.1338 0.0460 0
A2 0.0020 0.9521 0.0050 0.0542 -0.0280 0.1024 0.0350
B2 0.1600 < 0.0001 -0.0010 0.7720 -0.0270 0.0962 -0.0140 0
C2 0.1400 < 0.0001 0.0220 < 0.0001 -0.0480 0.0084 0.1550 <Values of "Prob > |t |" less than 0.0500 indicate model terms are significant.Values greater than 0.1000 indicate the model terms are not significant.
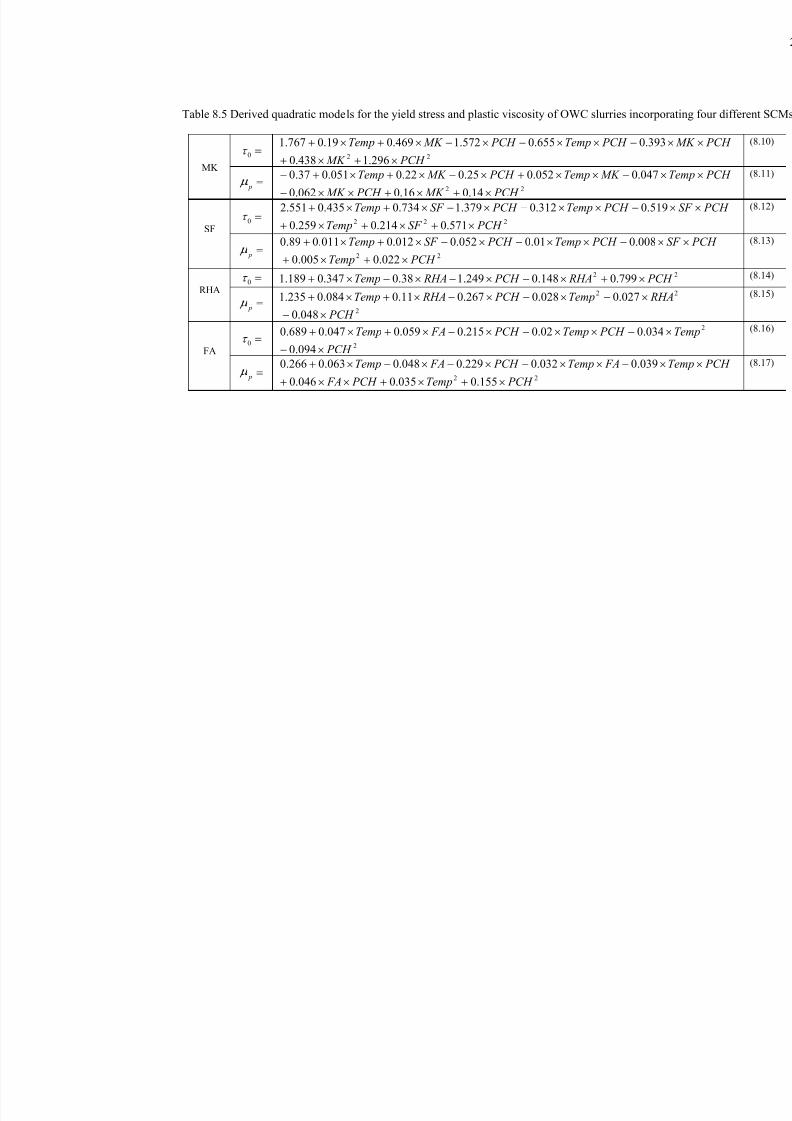
8/18/2019 Rheology of Oil Well Cement Slurries
http://slidepdf.com/reader/full/rheology-of-oil-well-cement-slurries 238/274
Table 8.5 Derived quadratic models for the yield stress and plastic viscosity of OWC slurries incorporating fou
MK0
PCH Temp PCH MK Temp 393.0655.0572.1469.019.0767.122 296.1438.0 PCH MK
p MK Temp PCH MK Temp 047.0052.025.022.0051.037.0
22 14.016.0062.0 PCH MK PCH MK
SF0
PCH Temp PCH SF Temp 519.0312.0379.1734.0435.0551.2222 571.0214.0259.0 PCH SF Temp
p PCH Temp PCH SF Temp 008.001.0052.0012.0011.089.0
22 022.0005.0 PCH Temp
RHA0 2 799.0148.0249.138.0347.0189.1 PCH RHA PCH RHATemp
p 2
027.0028.0267.011.0084.0235.1 RHTemp PCH RHATemp
2048.0 PCH
FA0
034.002.0215.0059.0047.0689.0 PCH Temp PCH FATemp 2094.0 PCH
p FATemp PCH FATemp 039.0032.0229.0048.0063.0266.0
22 155.0035.0046.0 PCH Temp PCH FA
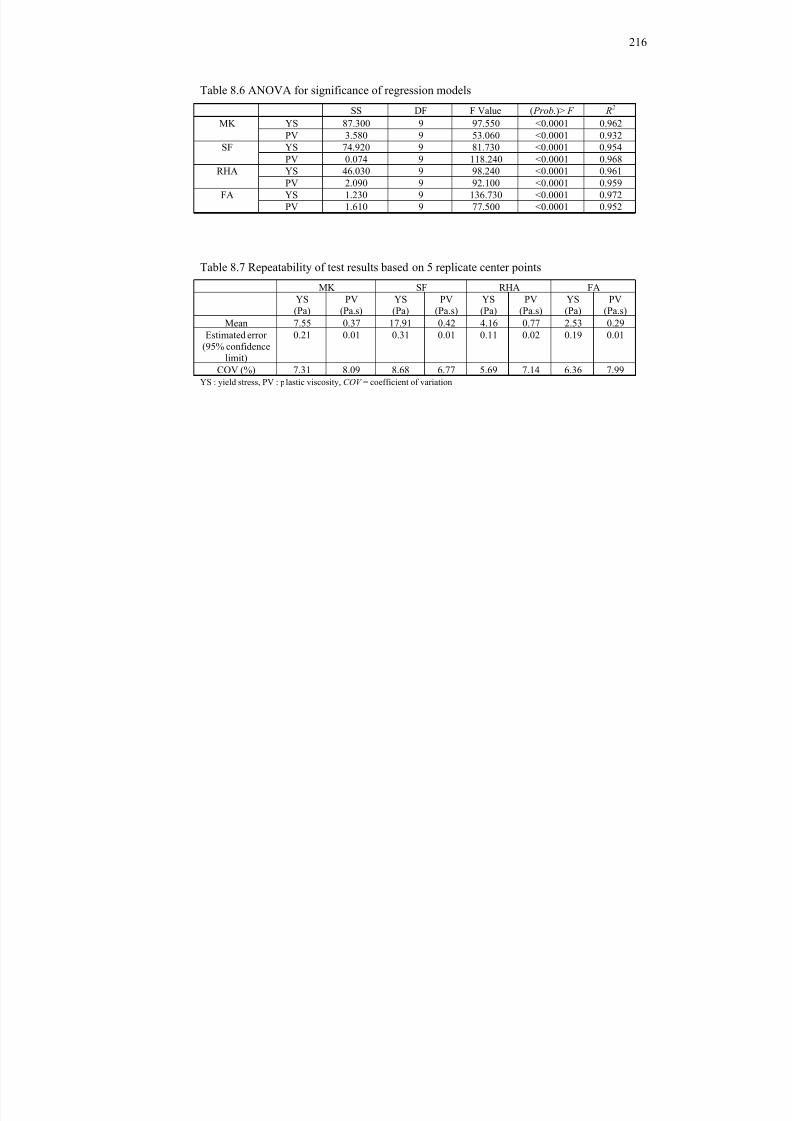
8/18/2019 Rheology of Oil Well Cement Slurries
http://slidepdf.com/reader/full/rheology-of-oil-well-cement-slurries 239/274
216
Table 8.6 ANOVA for significance of regression models
SS DF F Value ( Prob. )> F R2 MK YS 87.300 9 97.550 <0.0001 0.962
PV 3.580 9 53.060 <0.0001 0.932
SF YS 74.920 9 81.730 <0.0001 0.954PV 0.074 9 118.240 <0.0001 0.968RHA YS 46.030 9 98.240 <0.0001 0.961
PV 2.090 9 92.100 <0.0001 0.959FA YS 1.230 9 136.730 <0.0001 0.972
PV 1.610 9 77.500 <0.0001 0.952
Table 8.7 Repeatability of test results based on 5 replicate center points
MK SF RHA FA
YS(Pa) PV(Pa.s) YS(Pa) PV(Pa.s) YS(Pa) PV(Pa.s) YS(Pa) PV(Pa.s)Mean 7.55 0.37 17.91 0.42 4.16 0.77 2.53 0.29
Estimated error(95% confidence
limit)
0.21 0.01 0.31 0.01 0.11 0.02 0.19 0.01
COV (%) 7.31 8.09 8.68 6.77 5.69 7.14 6.36 7.99YS : yield stress, PV : plastic viscosity, COV = coefficient of variation
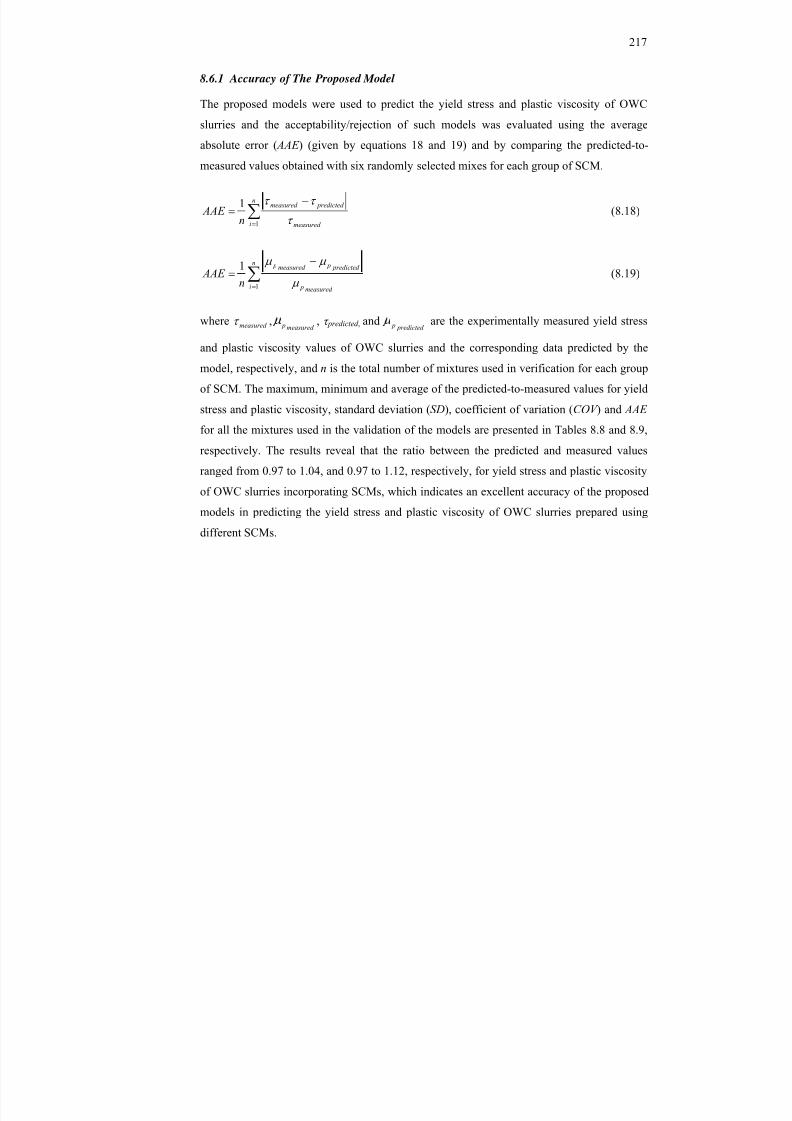
8/18/2019 Rheology of Oil Well Cement Slurries
http://slidepdf.com/reader/full/rheology-of-oil-well-cement-slurries 240/274
217
8.6.1 Accuracy of The Proposed Model
The proposed models were used to predict the yield stress and plastic viscosity of OWC
slurries and the acceptability/rejection of such models was evaluated using the average
absolute error ( AAE ) (given by equations 18 and 19) and by comparing the predicted-to-
measured values obtained with six randomly selected mixes for each group of SCM.
n
i measured
predicted measured
n AAE
1
1
(8.18)
n
i measured p
predicted pmeasured p
n AAE
1
1
(8.19)
where measured ,measured p , τ predicted , and predicted p are the experimentally measured yield stress
and plastic viscosity values of OWC slurries and the corresponding data predicted by the
model, respectively, and n is the total number of mixtures used in verification for each group
of SCM. The maximum, minimum and average of the predicted-to-measured values for yield
stress and plastic viscosity, standard deviation ( SD), coefficient of variation ( COV ) and AAE
for all the mixtures used in the validation of the models are presented in Tables 8.8 and 8.9,
respectively. The results reveal that the ratio between the predicted and measured valuesranged from 0.97 to 1.04, and 0.97 to 1.12, respectively, for yield stress and plastic viscosity
of OWC slurries incorporating SCMs, which indicates an excellent accuracy of the proposed
models in predicting the yield stress and plastic viscosity of OWC slurries prepared using
different SCMs.
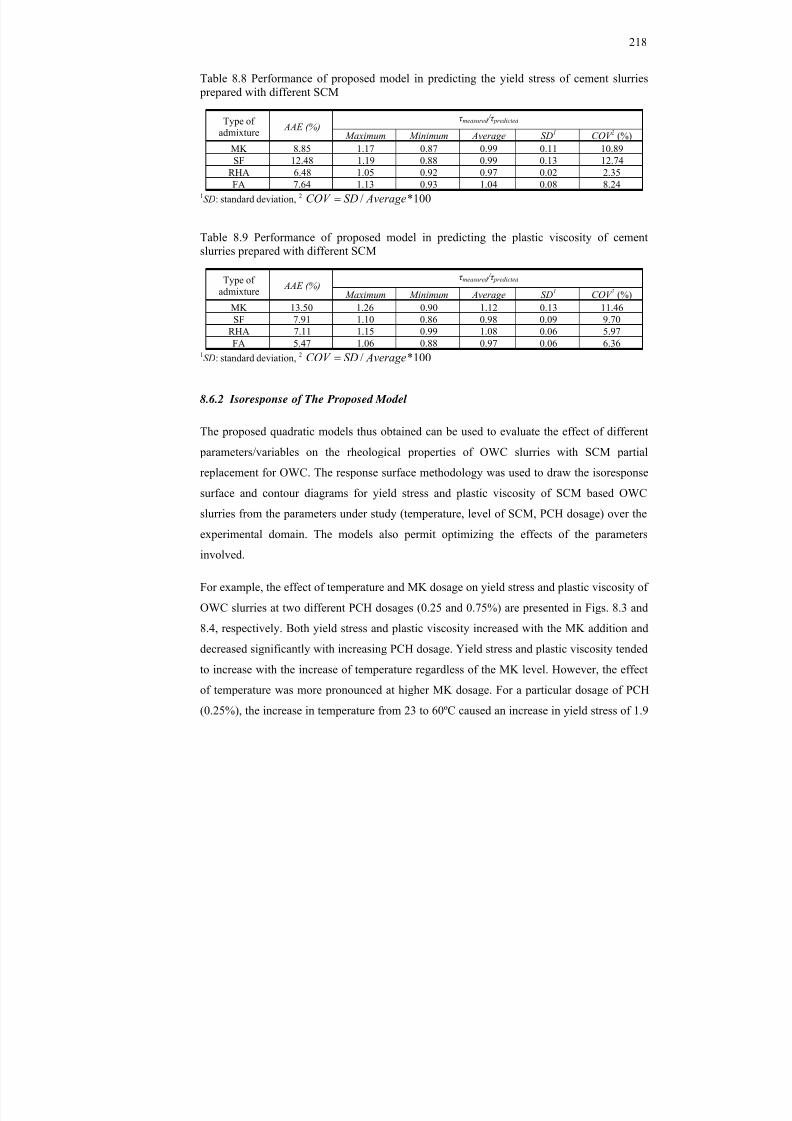
8/18/2019 Rheology of Oil Well Cement Slurries
http://slidepdf.com/reader/full/rheology-of-oil-well-cement-slurries 241/274
218
Table 8.8 Performance of proposed model in predicting the yield stress of cement slurries prepared with different SCM
Type ofadmixture AAE (%)
τ measured / τ predicted
Maximum Minimum Average SD 1 COV 2 (%)
MK 8.85 1.17 0.87 0.99 0.11 10.89SF 12.48 1.19 0.88 0.99 0.13 12.74RHA 6.48 1.05 0.92 0.97 0.02 2.35FA 7.64 1.13 0.93 1.04 0.08 8.24
1SD: standard deviation, 2 100*/ AverageSDCOV
Table 8.9 Performance of proposed model in predicting the plastic viscosity of cementslurries prepared with different SCM
Type ofadmixture AAE (%)
τ measured / τ predicted
Maximum Minimum Average SD 1 COV 2 (%)MK 13.50 1.26 0.90 1.12 0.13 11.46SF 7.91 1.10 0.86 0.98 0.09 9.70
RHA 7.11 1.15 0.99 1.08 0.06 5.97FA 5.47 1.06 0.88 0.97 0.06 6.36
1SD: standard deviation, 2 100*/ AverageSDCOV
8.6.2 Isoresponse of The Proposed Model
The proposed quadratic models thus obtained can be used to evaluate the effect of different
parameters/variables on the rheological properties of OWC slurries with SCM partialreplacement for OWC. The response surface methodology was used to draw the isoresponse
surface and contour diagrams for yield stress and plastic viscosity of SCM based OWC
slurries from the parameters under study (temperature, level of SCM, PCH dosage) over the
experimental domain. The models also permit optimizing the effects of the parameters
involved.
For example, the effect of temperature and MK dosage on yield stress and plastic viscosity of
OWC slurries at two different PCH dosages (0.25 and 0.75%) are presented in Figs. 8.3 and8.4, respectively. Both yield stress and plastic viscosity increased with the MK addition and
decreased significantly with increasing PCH dosage. Yield stress and plastic viscosity tended
to increase with the increase of temperature regardless of the MK level. However, the effect
of temperature was more pronounced at higher MK dosage. For a particular dosage of PCH
(0.25%), the increase in temperature from 23 to 60ºC caused an increase in yield stress of 1.9
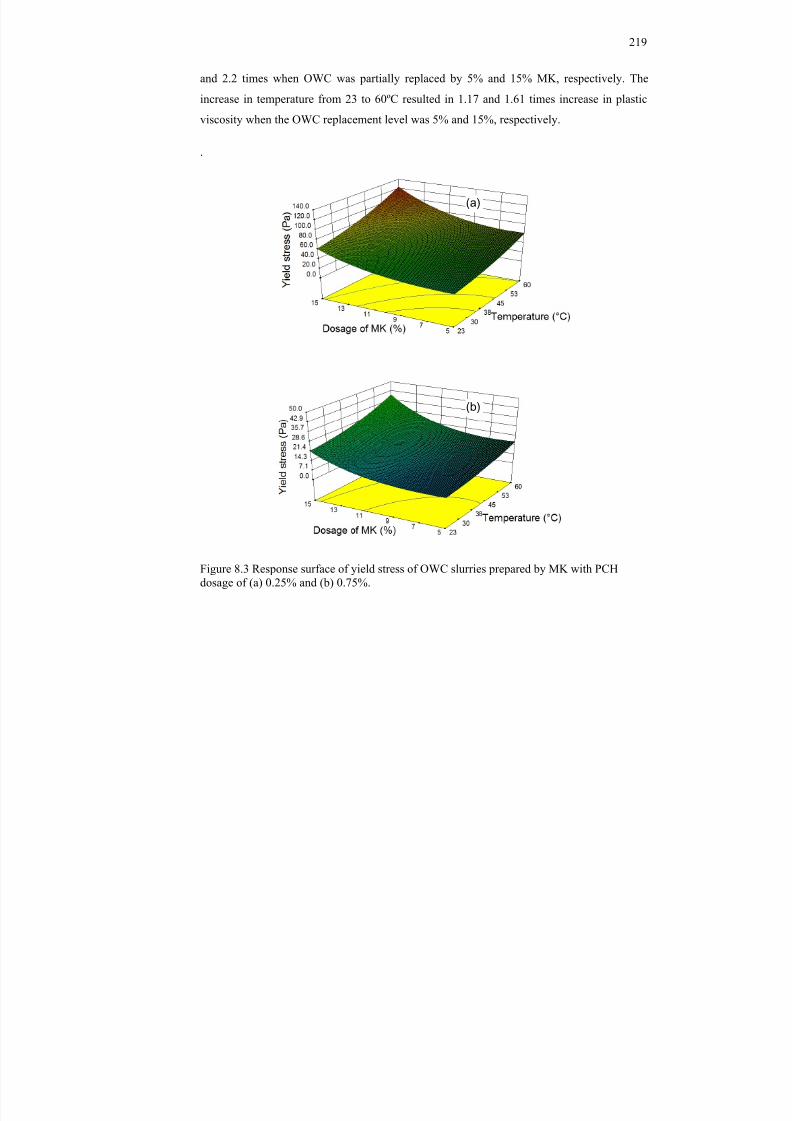
8/18/2019 Rheology of Oil Well Cement Slurries
http://slidepdf.com/reader/full/rheology-of-oil-well-cement-slurries 242/274
219
and 2.2 times when OWC was partially replaced by 5% and 15% MK, respectively. The
increase in temperature from 23 to 60ºC resulted in 1.17 and 1.61 times increase in plastic
viscosity when the OWC replacement level was 5% and 15%, respectively.
.
Figure 8.3 Response surface of yield stress of OWC slurries prepared by MK with PCHdosage of (a) 0.25% and (b) 0.75%.
(b)
(a)
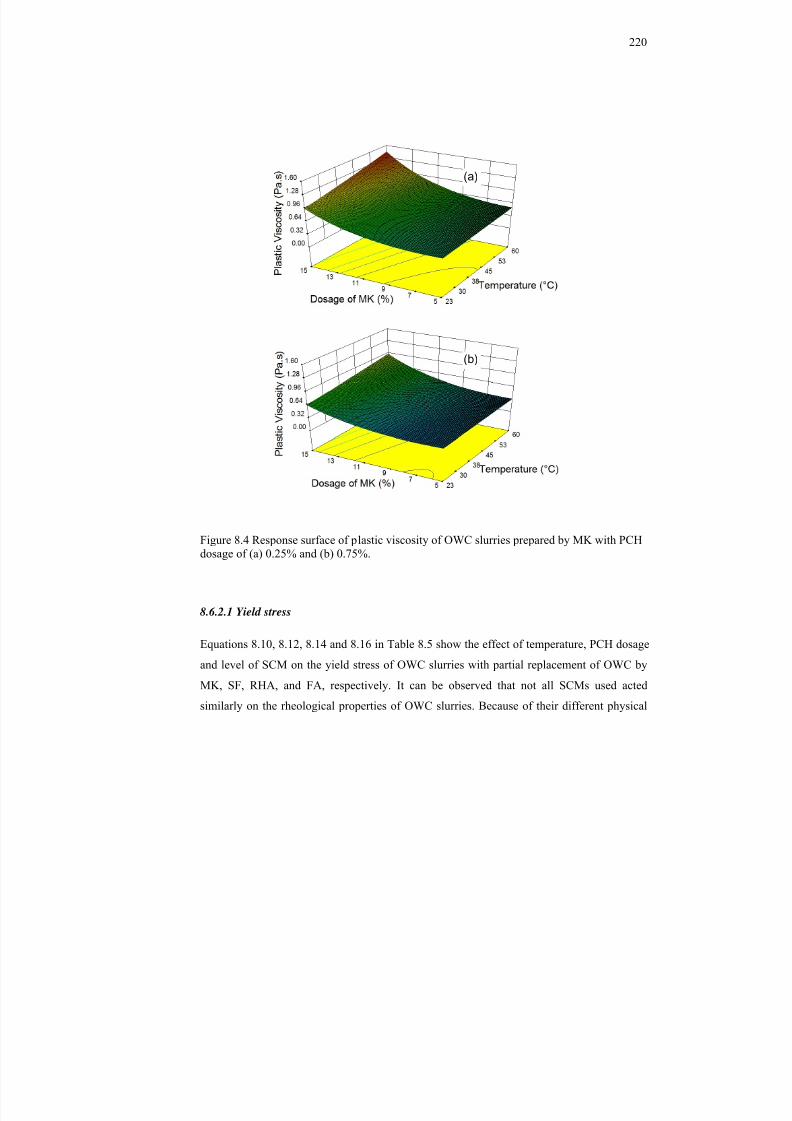
8/18/2019 Rheology of Oil Well Cement Slurries
http://slidepdf.com/reader/full/rheology-of-oil-well-cement-slurries 243/274
220
Figure 8.4 Response surface of plastic viscosity of OWC slurries prepared by MK with PCHdosage of (a) 0.25% and (b) 0.75%.
8.6.2.1 Yield stress
Equations 8.10, 8.12, 8.14 and 8.16 in Table 8.5 show the effect of temperature, PCH dosage
and level of SCM on the yield stress of OWC slurries with partial replacement of OWC by
MK, SF, RHA, and FA, respectively. It can be observed that not all SCMs used acted
similarly on the rheological properties of OWC slurries. Because of their different physical
(a)
(b)
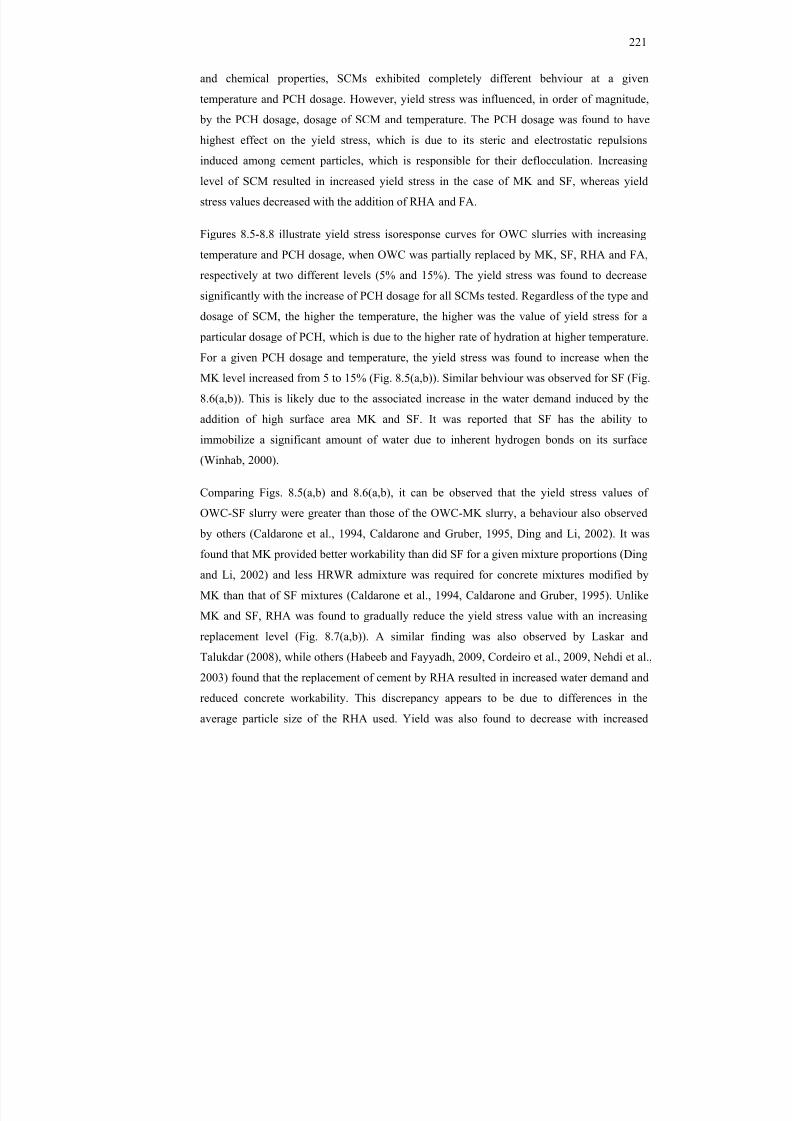
8/18/2019 Rheology of Oil Well Cement Slurries
http://slidepdf.com/reader/full/rheology-of-oil-well-cement-slurries 244/274
221
and chemical properties, SCMs exhibited completely different behviour at a given
temperature and PCH dosage. However, yield stress was influenced, in order of magnitude,
by the PCH dosage, dosage of SCM and temperature. The PCH dosage was found to have
highest effect on the yield stress, which is due to its steric and electrostatic repulsions
induced among cement particles, which is responsible for their deflocculation. Increasing
level of SCM resulted in increased yield stress in the case of MK and SF, whereas yield
stress values decreased with the addition of RHA and FA.
Figures 8.5-8.8 illustrate yield stress isoresponse curves for OWC slurries with increasing
temperature and PCH dosage, when OWC was partially replaced by MK, SF, RHA and FA,
respectively at two different levels (5% and 15%). The yield stress was found to decrease
significantly with the increase of PCH dosage for all SCMs tested. Regardless of the type and
dosage of SCM, the higher the temperature, the higher was the value of yield stress for a
particular dosage of PCH, which is due to the higher rate of hydration at higher temperature.
For a given PCH dosage and temperature, the yield stress was found to increase when the
MK level increased from 5 to 15% (Fig. 8.5(a,b)). Similar behviour was observed for SF (Fig.
8.6(a,b)). This is likely due to the associated increase in the water demand induced by the
addition of high surface area MK and SF. It was reported that SF has the ability to
immobilize a significant amount of water due to inherent hydrogen bonds on its surface
(Winhab, 2000).
Comparing Figs. 8.5(a,b) and 8.6(a,b), it can be observed that the yield stress values of
OWC-SF slurry were greater than those of the OWC-MK slurry, a behaviour also observed
by others (Caldarone et al., 1994, Caldarone and Gruber, 1995, Ding and Li, 2002). It was
found that MK provided better workability than did SF for a given mixture proportions (Ding
and Li, 2002) and less HRWR admixture was required for concrete mixtures modified by
MK than that of SF mixtures (Caldarone et al., 1994, Caldarone and Gruber, 1995). Unlike
MK and SF, RHA was found to gradually reduce the yield stress value with an increasing
replacement level (Fig. 8.7(a,b)). A similar finding was also observed by Laskar and
Talukdar (2008), while others (Habeeb and Fayyadh, 2009, Cordeiro et al., 2009, Nehdi et al.,
2003) found that the replacement of cement by RHA resulted in increased water demand and
reduced concrete workability. This discrepancy appears to be due to differences in the
average particle size of the RHA used. Yield was also found to decrease with increased
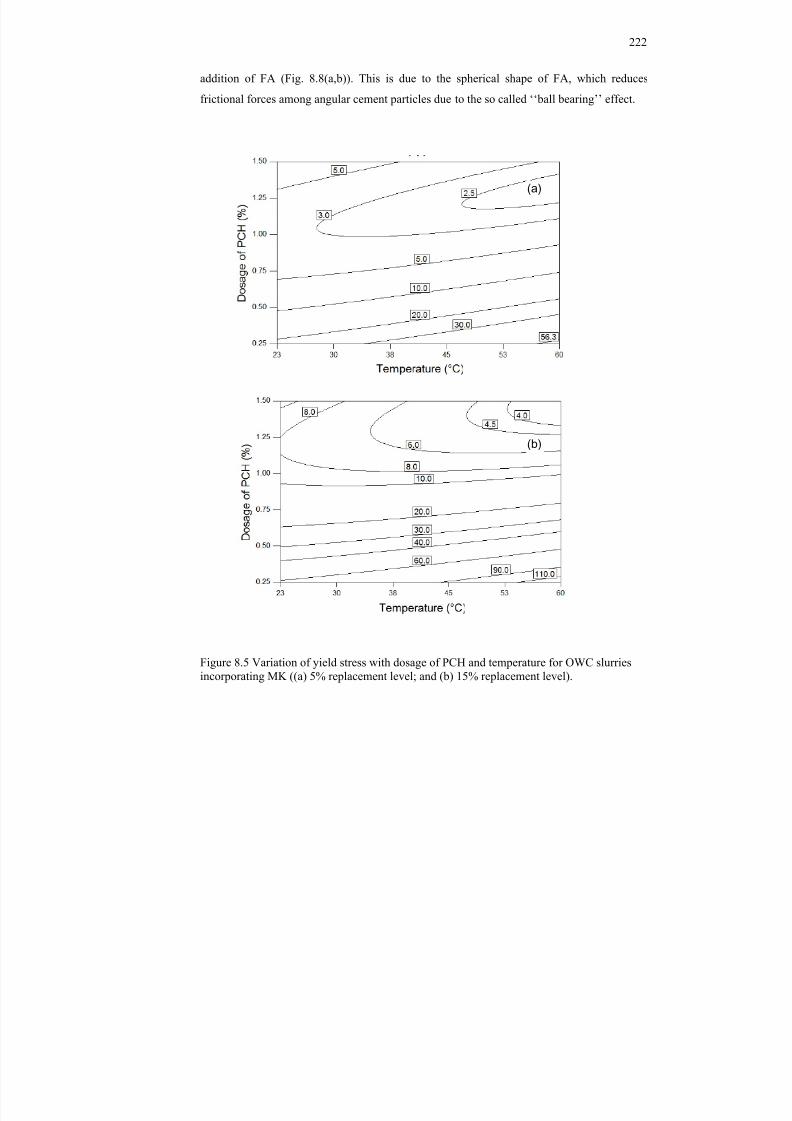
8/18/2019 Rheology of Oil Well Cement Slurries
http://slidepdf.com/reader/full/rheology-of-oil-well-cement-slurries 245/274
222
addition of FA (Fig. 8.8(a,b)). This is due to the spherical shape of FA, which reduces
frictional forces among angular cement particles due to the so called ‘‘ball bearing’’ effect.
Figure 8.5 Variation of yield stress with dosage of PCH and temperature for OWC slurriesincorporating MK ((a) 5% replacement level; and (b) 15% replacement level).
(a)
(b)
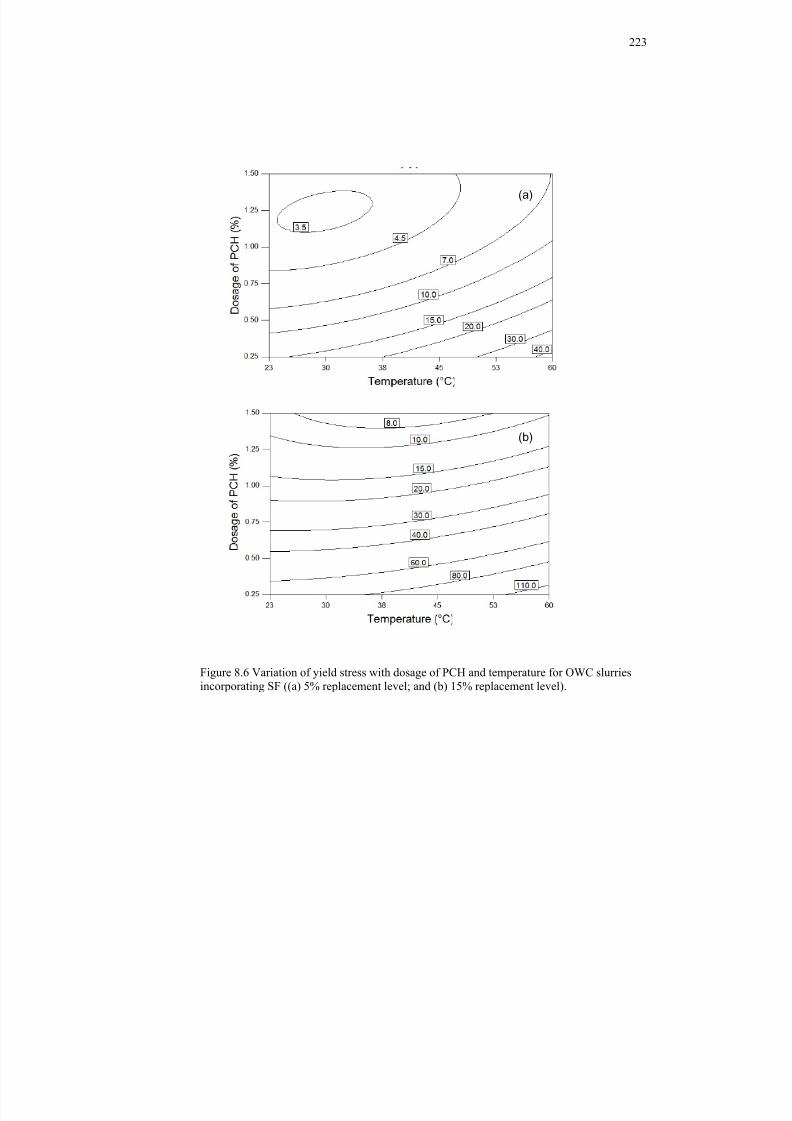
8/18/2019 Rheology of Oil Well Cement Slurries
http://slidepdf.com/reader/full/rheology-of-oil-well-cement-slurries 246/274
223
Figure 8.6 Variation of yield stress with dosage of PCH and temperature for OWC slurriesincorporating SF ((a) 5% replacement level; and (b) 15% replacement level).
(a)
(b)
8/18/2019 Rheology of Oil Well Cement Slurries
http://slidepdf.com/reader/full/rheology-of-oil-well-cement-slurries 247/274
224
Figure 8.7 Variation of yield stress with dosage of PCH and temperature for OWC slurriesincorporating RHA ((a) 5% replacement level; and (b) 15% replacement level).
(a)
(b)
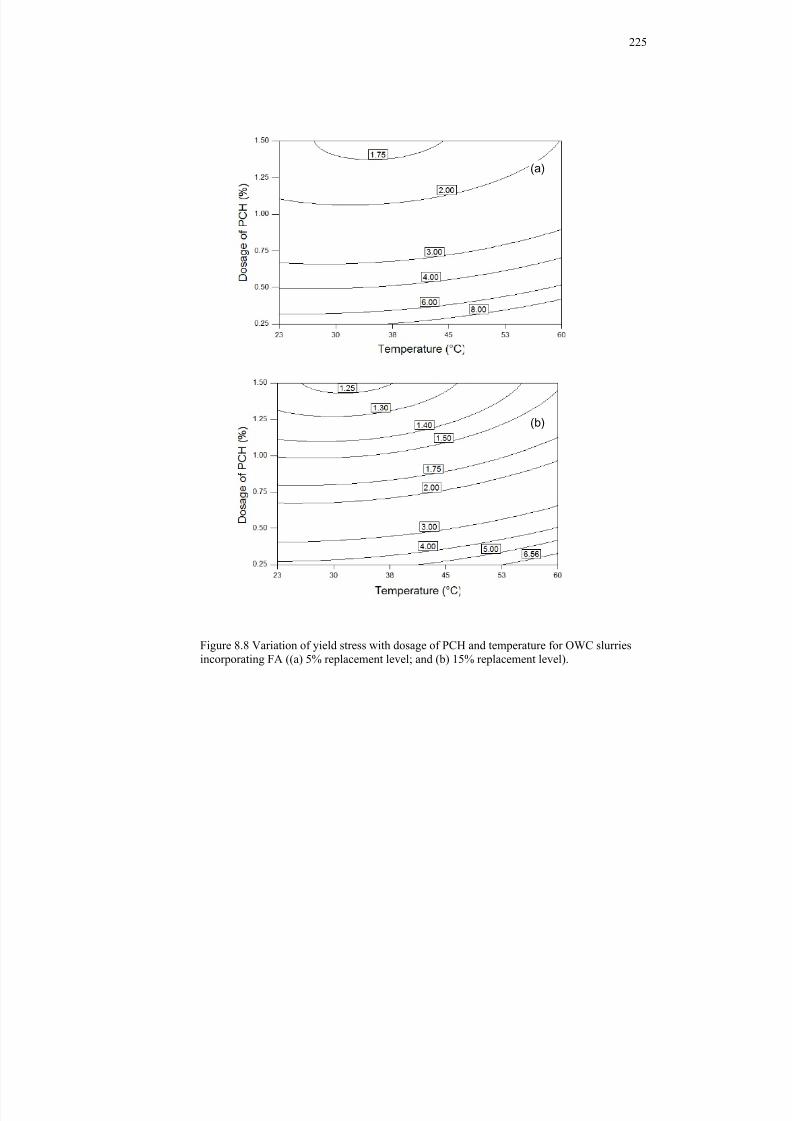
8/18/2019 Rheology of Oil Well Cement Slurries
http://slidepdf.com/reader/full/rheology-of-oil-well-cement-slurries 248/274
225
Figure 8.8 Variation of yield stress with dosage of PCH and temperature for OWC slurriesincorporating FA ((a) 5% replacement level; and (b) 15% replacement level).
(a)
(b)
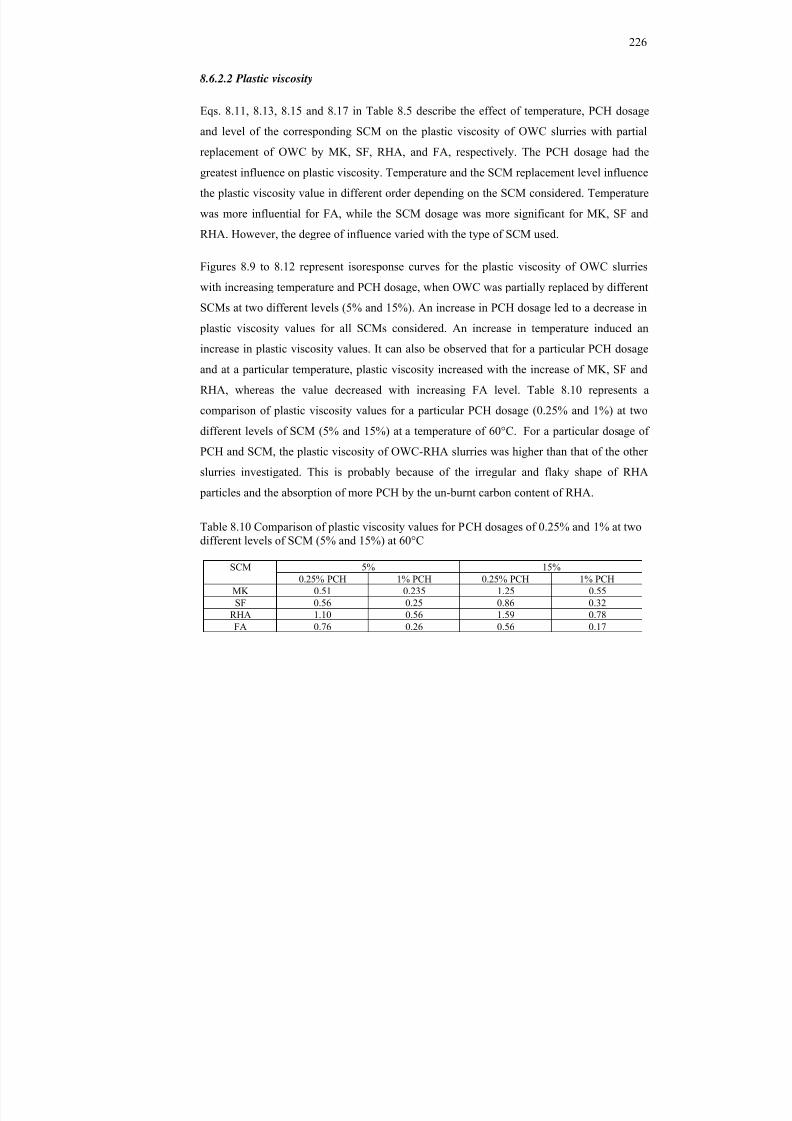
8/18/2019 Rheology of Oil Well Cement Slurries
http://slidepdf.com/reader/full/rheology-of-oil-well-cement-slurries 249/274
226
8.6.2.2 Plastic viscosity
Eqs. 8.11, 8.13, 8.15 and 8.17 in Table 8.5 describe the effect of temperature, PCH dosage
and level of the corresponding SCM on the plastic viscosity of OWC slurries with partial
replacement of OWC by MK, SF, RHA, and FA, respectively. The PCH dosage had thegreatest influence on plastic viscosity. Temperature and the SCM replacement level influence
the plastic viscosity value in different order depending on the SCM considered. Temperature
was more influential for FA, while the SCM dosage was more significant for MK, SF and
RHA. However, the degree of influence varied with the type of SCM used.
Figures 8.9 to 8.12 represent isoresponse curves for the plastic viscosity of OWC slurries
with increasing temperature and PCH dosage, when OWC was partially replaced by different
SCMs at two different levels (5% and 15%). An increase in PCH dosage led to a decrease in
plastic viscosity values for all SCMs considered. An increase in temperature induced an
increase in plastic viscosity values. It can also be observed that for a particular PCH dosage
and at a particular temperature, plastic viscosity increased with the increase of MK, SF and
RHA, whereas the value decreased with increasing FA level. Table 8.10 represents a
comparison of plastic viscosity values for a particular PCH dosage (0.25% and 1%) at two
different levels of SCM (5% and 15%) at a temperature of 60°C. For a particular dosage of
PCH and SCM, the plastic viscosity of OWC-RHA slurries was higher than that of the otherslurries investigated. This is probably because of the irregular and flaky shape of RHA
particles and the absorption of more PCH by the un-burnt carbon content of RHA.
Table 8.10 Comparison of plastic viscosity values for PCH dosages of 0.25% and 1% at twodifferent levels of SCM (5% and 15%) at 60°C
SCM 5% 15%0.25% PCH 1% PCH 0.25% PCH 1% PCH
MK 0.51 0.235 1.25 0.55
SF 0.56 0.25 0.86 0.32RHA 1.10 0.56 1.59 0.78FA 0.76 0.26 0.56 0.17
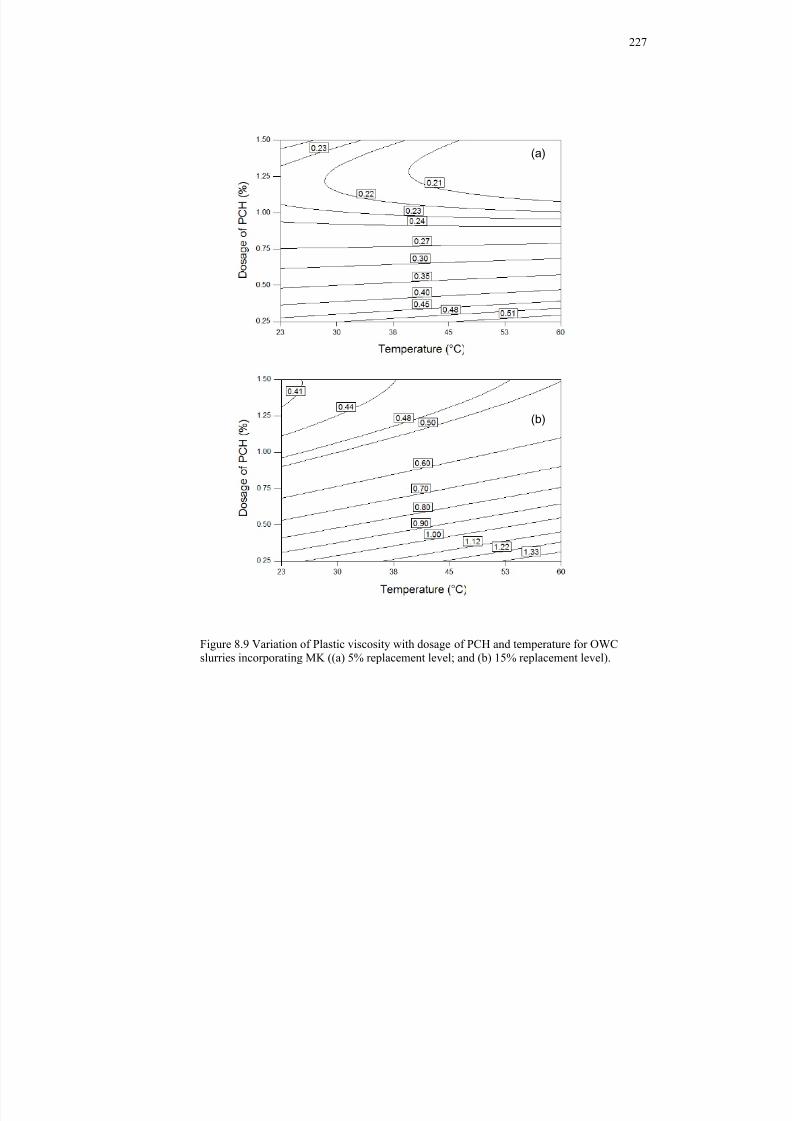
8/18/2019 Rheology of Oil Well Cement Slurries
http://slidepdf.com/reader/full/rheology-of-oil-well-cement-slurries 250/274
227
Figure 8.9 Variation of Plastic viscosity with dosage of PCH and temperature for OWCslurries incorporating MK ((a) 5% replacement level; and (b) 15% replacement level).
(a)
(b)
8/18/2019 Rheology of Oil Well Cement Slurries
http://slidepdf.com/reader/full/rheology-of-oil-well-cement-slurries 251/274
228
Figure 8.10 Variation of plastic viscosity stress with dosage of PCH and temperature forOWC slurries incorporating SF ((a) 5% replacement level; and (b) 15% replacement level).
(a)
(b)
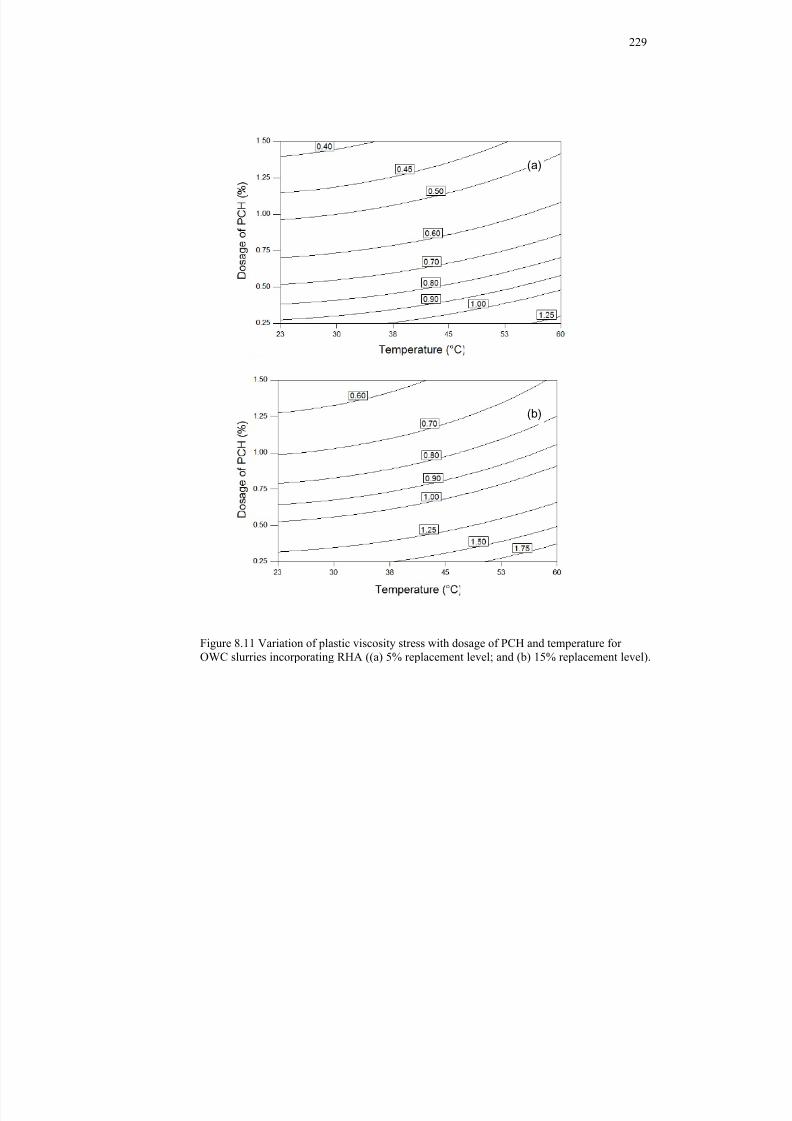
8/18/2019 Rheology of Oil Well Cement Slurries
http://slidepdf.com/reader/full/rheology-of-oil-well-cement-slurries 252/274
229
Figure 8.11 Variation of plastic viscosity stress with dosage of PCH and temperature forOWC slurries incorporating RHA ((a) 5% replacement level; and (b) 15% replacement level).
(a)
(b)
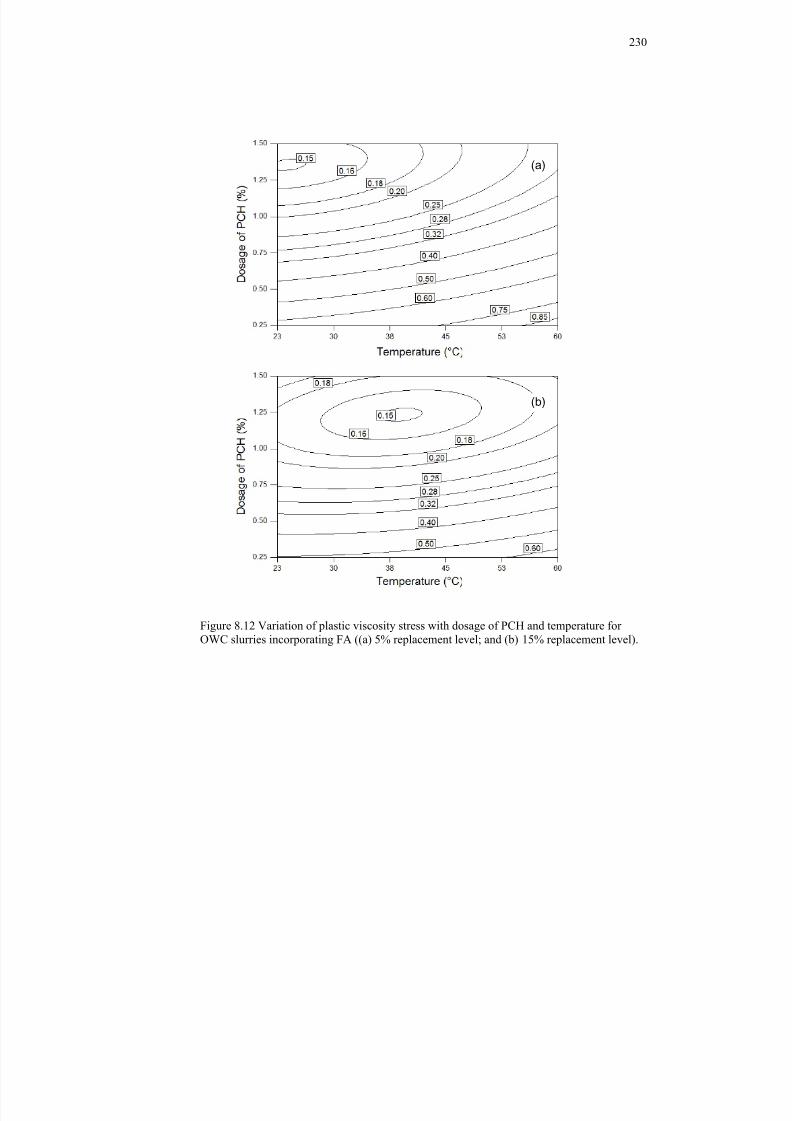
8/18/2019 Rheology of Oil Well Cement Slurries
http://slidepdf.com/reader/full/rheology-of-oil-well-cement-slurries 253/274
230
Figure 8.12 Variation of plastic viscosity stress with dosage of PCH and temperature forOWC slurries incorporating FA ((a) 5% replacement level; and (b) 15% replacement level).
(a)
(b)
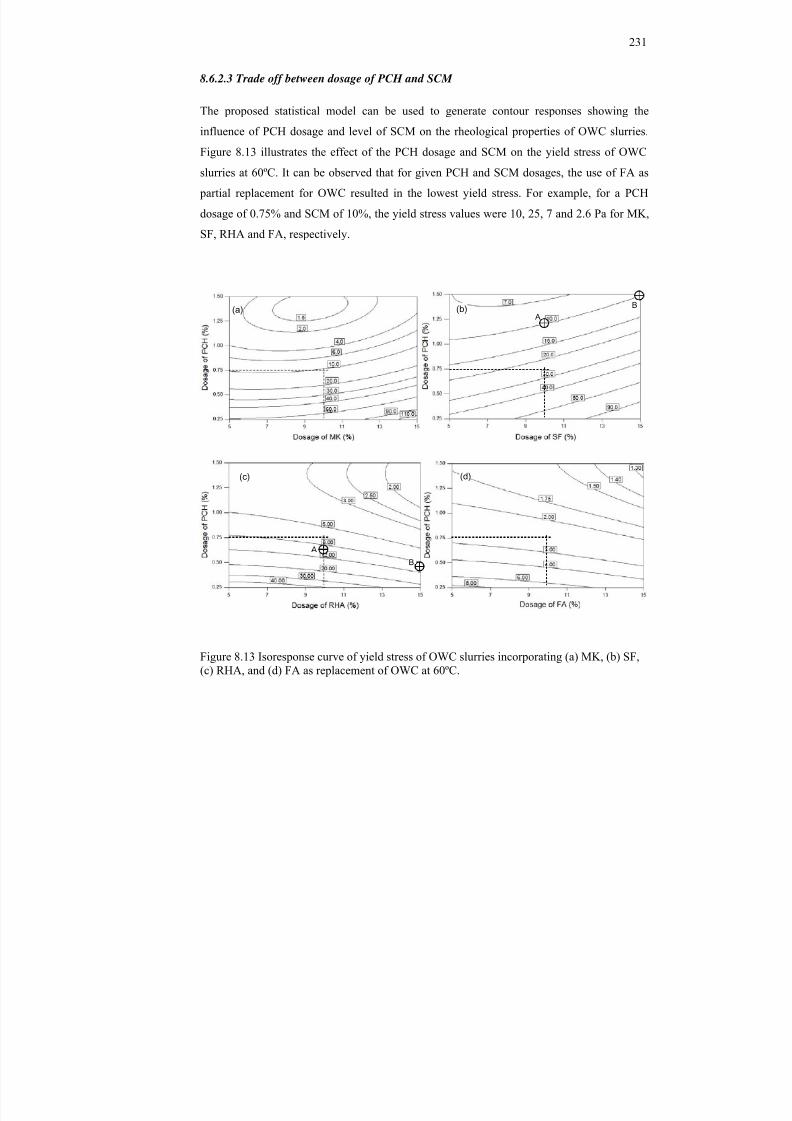
8/18/2019 Rheology of Oil Well Cement Slurries
http://slidepdf.com/reader/full/rheology-of-oil-well-cement-slurries 254/274
231
8.6.2.3 Trade off between dosage of PCH and SCM
The proposed statistical model can be used to generate contour responses showing the
influence of PCH dosage and level of SCM on the rheological properties of OWC slurries.
Figure 8.13 illustrates the effect of the PCH dosage and SCM on the yield stress of OWCslurries at 60ºC. It can be observed that for given PCH and SCM dosages, the use of FA as
partial replacement for OWC resulted in the lowest yield stress. For example, for a PCH
dosage of 0.75% and SCM of 10%, the yield stress values were 10, 25, 7 and 2.6 Pa for MK,
SF, RHA and FA, respectively.
Figure 8.13 Isoresponse curve of yield stress of OWC slurries incorporating (a) MK, (b) SF,(c) RHA, and (d) FA as replacement of OWC at 60ºC.
(a) (b)
(c) (d)
B
B A
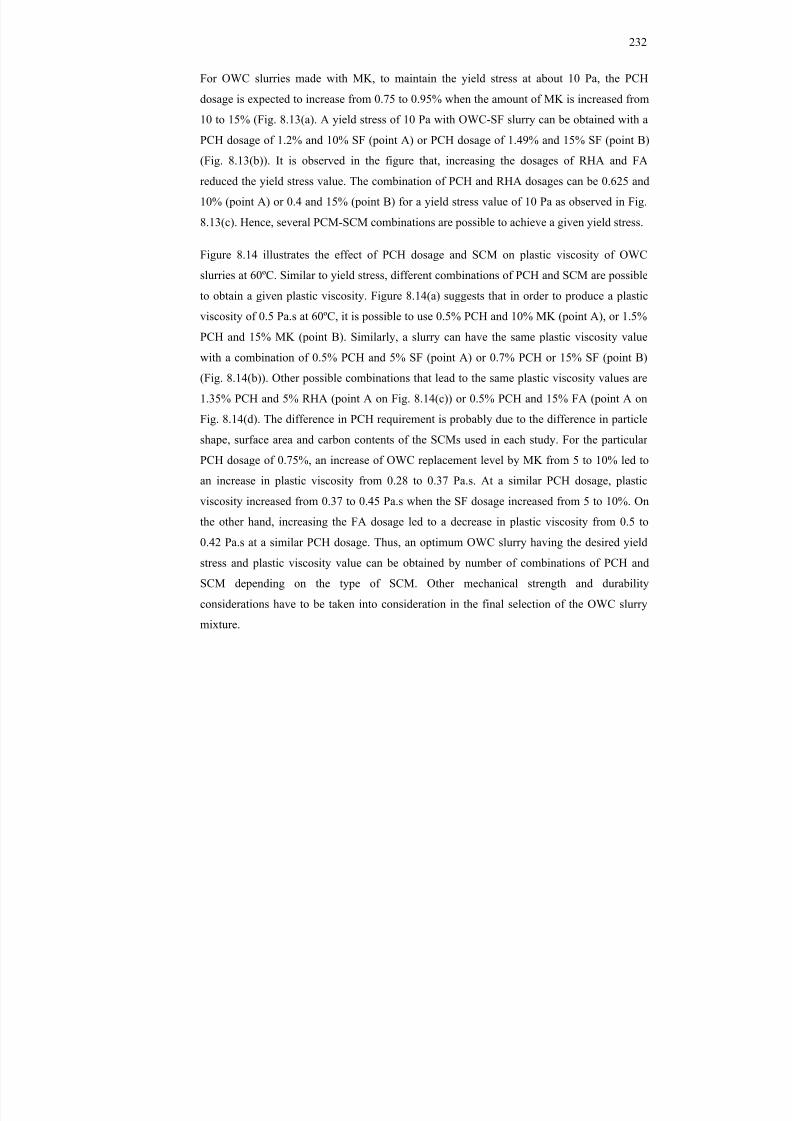
8/18/2019 Rheology of Oil Well Cement Slurries
http://slidepdf.com/reader/full/rheology-of-oil-well-cement-slurries 255/274
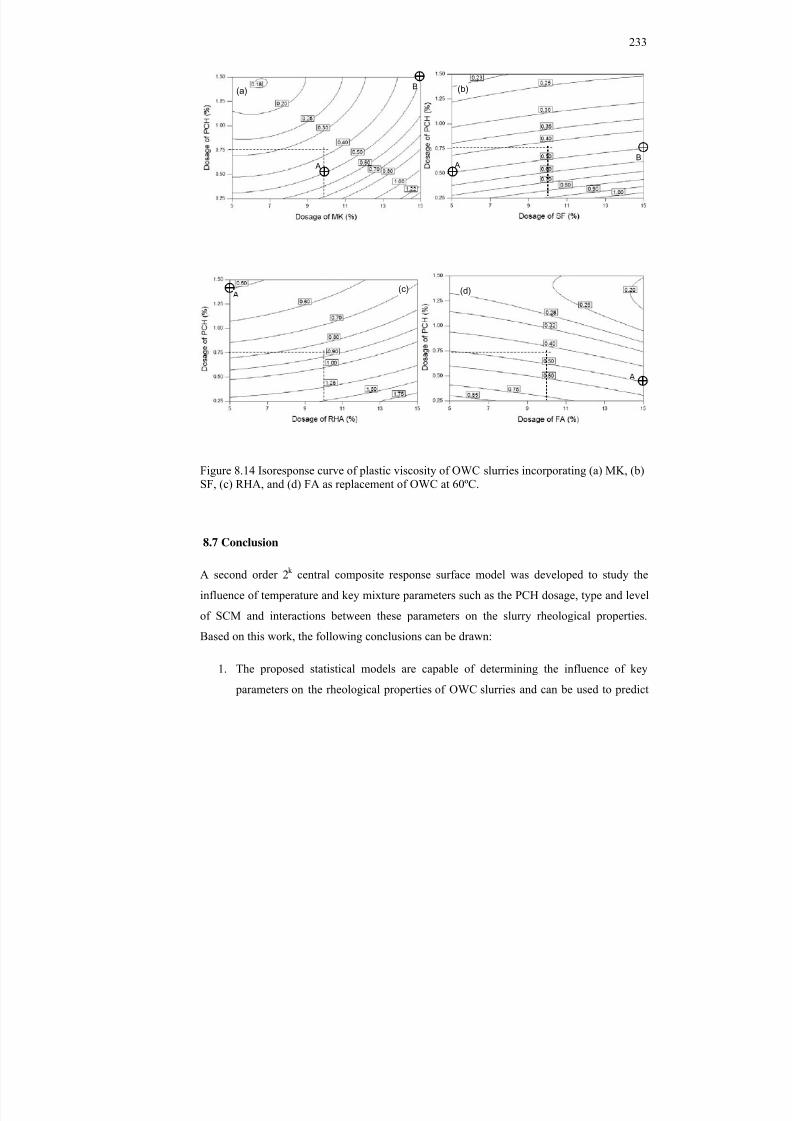
8/18/2019 Rheology of Oil Well Cement Slurries
http://slidepdf.com/reader/full/rheology-of-oil-well-cement-slurries 256/274
233
Figure 8.14 Isoresponse curve of plastic viscosity of OWC slurries incorporating (a) MK, (b)SF, (c) RHA, and (d) FA as replacement of OWC at 60ºC.
8.7 Conclusion
A second order 2 k central composite response surface model was developed to study the
influence of temperature and key mixture parameters such as the PCH dosage, type and level
of SCM and interactions between these parameters on the slurry rheological properties.
Based on this work, the following conclusions can be drawn:
1. The proposed statistical models are capable of determining the influence of key
parameters on the rheological properties of OWC slurries and can be used to predict
(a) (b)
(c) (d)
B
A AB
8/18/2019 Rheology of Oil Well Cement Slurries
http://slidepdf.com/reader/full/rheology-of-oil-well-cement-slurries 257/274
234
the influence of the various parameters on yield stress and plastic viscosity of OWC
slurries.
2. The derived models reveal that the measured yield stress and plastic viscosity of
OWC slurries are influenced by the PCH dosage, replacement of OWC by differenttypes and dosages of SCMs, temperature and several coupled effects of these
parameters.
3. The PCH dosage had the greatest influence on the yield stress and plastic viscosity of
OWC slurries. An increase in the PCH dosage led to significant reduction in yield
stress and plastic viscosity values.
4. Yield stress and plastic viscosity values are also affected by the type and dosage ofSCM used as partial replacement for OWC. The yield stress increased with increasing
dosage of MK and SF and decreased with increasing dosage of RHA and FA.
5. Plastic viscosity increased with the addition of MK, SF and RHA and decreased with
increasing amount of FA.
6. At a given SCM dosage, the yield stress of OWC slurries without any chemical
admixture follows the order: SF>MK>RHA>FA at all test temperatures.
7. Temperature had a significant influence on the rheological properties of OWC
slurries. Both yield stress and plastic viscosity increased with increasing temperature.
However, the degree of influence varied with the type and dosage of SCM used.
8. The response contours provide an effective means for selecting optimum
combinations of PCH and SCM at different temperatures to produce a given yield
stress and plastic viscosity. Several mixture proportions of OWC slurries with similar
rheological properties are possible by varying the type and level of SCM and dosage
of PCH.
9. The proposed statistical model can reduce the number of trial mixtures needed to
optimize OWC slurries with tailor-made rheological properties using different SCMs,
and thus can simplify the test protocol and saves time and cost.
8/18/2019 Rheology of Oil Well Cement Slurries
http://slidepdf.com/reader/full/rheology-of-oil-well-cement-slurries 258/274
235
10. The proposed model for OWC slurries is valid for OWC partial replacement levels by
SCMs ranging from 5 to 15% by MK, SF, RHA or FA and PCH dosages ranging
from 0.25 to 1.5% at different temperatures ranging from 23 to 60ºC.
11. Although the model is based on a given set of materials and focused only on theBingham properties of OWC slurries, it is possible to study other properties such as
the thickening time, fluid loss, compressive strength, etc. The model can easily be
extended to include such properties, along with other materials such as ground
granulated blast furnace slag, limestone powder, diatomaceous earth, and different
types of additives such as accelerators or retarders, fluid loss control additives,
viscosity modifying admixtures, etc.
8.8 References
Al-Darbi, M.M., Saeed, N.O., Ajijolaiya, L.O., Islam, M.R. (2006). A Novel Oil Well
Cementing Technology Using Natural Fibers. Petroleum Science and Technology ,
Vol. 24, No. 11, 2006, pp. 1267 – 1282.
ANSI/API RP 10B-2. (2005). Recommended Practice for Testing Well Cements. First
Edition, July 2005, 171 p.
Banfill, P.F.G. (1994). Rheological Methods For Assessing The Flow Properties Of Mortars
And Related Materials. Construction and Building Materials , Vol. 89, No. 1, pp. 43–
50.
Bunn, T., Chambers, A.J., and Goh, C.M. (1990) Rheology of Some fly ash Slurries. Coal
Handling and Utilization Conference 1990 , June 19-21, 1990, pp. 7-14.
Caldarone, M. A., Gruber, K. A., and Burg, R. G. (1994). High-Reactivity Metakaolin: A
New Generation Mineral Admixture. Concrete International, Vol. 16, No. 11, pp. 37-
40.
Caldarone, M. A., and Gruber, K. A. (1995). High Reactivity Metakaolin-A Mineral
Admixture for High-Performance Concrete,” Proceedings of the International
8/18/2019 Rheology of Oil Well Cement Slurries
http://slidepdf.com/reader/full/rheology-of-oil-well-cement-slurries 259/274
236
Conference on Concrete under Severe Conditions: Environment and Loading.
CONSEC 1995 , Sapporo, Japan, K. Sakai, N. Banthia, and O. E. Gjorv, eds., Vol. 2,
E & FN Spon: Chapman & Hall, New York, 1995, pp. 1015-1024.
Cestari , A.R., Vieira. E.F.S., Tavares, A.M.G., and Andrade M.A.S. Jr. (2009). An Oil WellCement Slurry Additivated with Bisphenol Diglycidil Ether/Isophoronediamine—
Kinetic Analysis and Multivariate Modeling at Slurry/HCl Interfaces. Journal of
Hazardous Materials , Vol. 170, No. 1, 2009, pp. 374-381.
Cordeiro, G.C., Fairbairn, R.D.T.F., Rego, E.M. (2009) Use of Ultrafine Rice Husk Ash with
High-Carbon Content as Pozzolan in High Performance Concrete. Materials and
Structures , Vol. 42, No. 7, 2009, pp. 983-992.
Design-Expert 8.0.3, Software for Design of Experiments, Stat-Ease Inc., Minneapolis , MN,
2010
Ding, J.T., and Li, Z. (2002) Effects of Metakaolin and Silica Fume on Properties of
Concrete. ACI Materials Journal, Vol. 99, No. 4, pp. 393-398.
Faroug, F., Szwabowski, J., and Wild, S. (1999). Influence of Superplasticizers on
Workability of Concrete. Journal of Materials in Civil Engineering , Vol. 11, No. 2,
pp. 151-157.
Ferguson, J., and Kenblowski, Z. (1991). Applied Fluid Rheology . Elsevier Applied Science,
London and Newyork, pp. 209-210.
Ferraris C.F., and de Larrard F. (1998). Testing and Modelling Fresh Concrete Rheology.
NISTIR 6094, Cleveland, 1998.
Ferraris, C.F., Obla, K.H., and Hill, R. (2001). The Influence of Mineral Admixtures on theRheology of Cement Paste and Concrete. Cement and Concrete Research , Vol. 31,
No. 2, pp. 245-255.
Genentech, BioOncology Glossary. available online at http://www.gene.com
/gene/news/kits/ biooncology/oncologyterminology.html, accessed on July 13, 2010.
8/18/2019 Rheology of Oil Well Cement Slurries
http://slidepdf.com/reader/full/rheology-of-oil-well-cement-slurries 260/274
237
Golaszewski, J., Szwabowski, J., and Bisok, B. (2005). Interaction Between Cement and
Superplasticizer in Presence of Metakaolin. Proceedings of the International
Conference on Admixtures - Enhancing Concrete Performance, Dundee, Scotland,
United kingdom, pp. 47-57.
Guillot, D. (2006). Rheology of Well Cement Slurries. in Well Cementing, (E.B. Nelson and
Guillot, D. (ed.)). Schlumberger, Texas, pp. 93-142.
Habeeb, G.A., and Fayyadh, M.M. (2009). Rice Husk Ash Concrete: The Effect of RHA
Average Particle Size on Mechanical Properties and Drying Shrinkage. Australian
Journal of Basic and Applied Sciences , Vol. 3, No. 3, pp. 1616-1622.
Khayat, K.H., Ghezal, A., and Hadriche, M.S. (1999). Factorial Design Models ForProportioning Self-Consolidating Concrete. Materials and Structures , Vol. 32, No. 9,
pp. 679–686.
Laskar, A.I., and Talukdar, S. (2008). Rheological Behviour of High Performance Concrete
with Mineral Admixtures and Their Blending. Construction and Building Materials ,
Vol. 22, No. 12, pp. 2345–2354.
Menezes, R.R., Marques, L.N., Campos, L.A., Ferreira, H.S., Santana, L.N.L., and Neves,
G.A. (2010). Use of Statistical Design to Study the Influence of CMC on Rheological
Properties of Bentonite Dispersions for Water-Based Drilling Fluids. Ap.. Cl. Sc.,
Vol. 49, No. 1-2, pp. 13–20.
Montgomery, D.C. (2009). Design and analysis of experiments , 7th Ed., Wiley, New York.
Nehdi, M., Mindess, S., and Aïtcin, P.-C. (1997). Statistical Modelling Of The Microfiller
Effect on the Rheology of Composite Cement Pastes. Adv. Cem. Research, Vol. 9, No.
33, pp. 37–46.
Nedhi M., Mindess, S, and Aitcin, P.C. (1998). Rheology Of High Performance Concrete:
Effect of Ultra-Fine Particles. Cement and Concrete Research , Vol. 28, No. 5, pp.
687–697.
8/18/2019 Rheology of Oil Well Cement Slurries
http://slidepdf.com/reader/full/rheology-of-oil-well-cement-slurries 261/274
238
Nehdi, M., Duquette, J., and El Damatty, A. (2003). Performance of Rice Husk Ash
Produced Using a New Technology as a Mineral Admixture in Concrete. Cement and
Concrete Research , Vol. 33, No. 8, pp. 1203-1210.
Park, C.K, Noh, M.H, Park, T.H. (2005). Rheological Properties of Cementitious MaterialsContaining Mineral Admixtures. Cement and Concrete Research , Vol 35, No. 5, pp,
842-849.
Sabir, B.B., Wild, S., and Bai, J. (2001). Metakaolin and Calcined Clays as Pozzolans for
Concrete: A review. Cement and Concrete Composites , Vol. 23, No. 6, pp. 441-454.
Sonebi, M. (2001). Factorial Design Modelling of Mix Proportion Parameters of Underwater
Composite Cement Grouts. Cement and Concrete Research, Vol. 31, No. 11, pp.1553-1560.
Sonebi, M. (2002). Experimental Design to Optimize High-Volume of Fly Ash Grout in the
Presence of Welan Gum and Superplasticizer. Materials and Structures , Vol. 35, No.
250, pp. 373-380.
Sonebi, M. (2010). Optimization of Cement Grouts Containing Silica Fume and Viscosity
Modifying Admixture. Journal of Materials in Civil Engineering , Vol. 22, No. 4, pp.
332-342.
Sybert, F, and Reick, P. (1990). Effect of Fly Ash on the Rheological Properties of Cement
Paste. International Conference on Rheology of Fresh Cement and Concrete , British
Society of Rheology, Liverpool, March 26-29, pp. 13-22.
Tattersall G.H. (1991). Workability & Quality Control of Concrete. London: E& FN Spon;
1991.
Winhab, E.J. (2000). Fluid Immobilization—A Structure-Related Key Mechanism for The
Viscous Flow Behaviour of Concentrated Suspension System. Applied Rheology , Vol.
10, No. 3, pp. 134–144.

8/18/2019 Rheology of Oil Well Cement Slurries
http://slidepdf.com/reader/full/rheology-of-oil-well-cement-slurries 262/274
239
Yahia, A. and Khayat, K.H. (2001). Experiment Design to Evaluate Interaction of High-
Range Water-Reducer and Antiwashout Admixture in High Performance Cement
Grout. Cement and Concrete Research , Vol. 31, No. 5, pp. 749-757.
8/18/2019 Rheology of Oil Well Cement Slurries
http://slidepdf.com/reader/full/rheology-of-oil-well-cement-slurries 263/274
240
C h a p t e r 9
SUMMARY AND CONCLUSIONS
9.1 Summary
Oil wells are drilled up to depths of thousands of meters. The productivity of oil wells is
affected by the well cementing quality. The rheology, stability, and durability of the cement
slurry used are major requirements for successful oil well cementing. In particular, the
rheological behaviour of OWC slurries must be optimized to achieve an effective well
cementing operation. The rheological properties of an OWC slurry determine the quality of
the final product and help predicting its end use performance and physical properties duringand after processing.
Rheological tests can determine the flow properties of the cement slurry such as its plastic
viscosity, yield point, gel strength, thixotropic behaviour, etc. The rheology of cement
slurries is a manifestation of the interactions between cement particles, water and other
constituents, which makes its characterization difficult. Cement slurries are visco-elastic
materials; they exhibit properties characteristic of both elastic solids and viscous fluids. To
characterize the rheology of a cement slurry, rheological parameters such as the yield stress,apparent viscosity, plastic viscosity, shear thinning, or shear thickening behaviour have been
studied. The Bingham plastic model and the Power law are widely used to describe the
rheological properties of cement slurries (Guillot, 2006). The Bingham plastic model
includes both yield stress, 0 and a plastic viscosuty, P at finite shear rates. The yield stress
indicates the minimum effort needed for a material to start moving and is the intercept of the
flow curve (shear stress vs. shear rate) with the shear stress axis. Below the yield stress, a
material behaves like a solid. Yield stress is the contribution of the skeleton, i.e. it ismanifestation of friction among solid particles (Ferraris and Larrard, 1998). The plastic
viscosity governs the flow after it is initiated and is the contribution of suspending liquids
resulting from viscous dissipation due to the movement of water in the sheared material
(Ferraris and Larrard, 1998; Laskar and Talukdar, 2008).
8/18/2019 Rheology of Oil Well Cement Slurries
http://slidepdf.com/reader/full/rheology-of-oil-well-cement-slurries 264/274
241
Oil well cement slurries are usually subjected to high levels of pressure and temperature
depending on the height and density of the column of material above, which makes the
characterization of their rheological properties even more complicated than that of normal
cement pastes or grouts. A number of admixtures have thus been developed to alter the
chemical and physical properties of OWC slurries as required for flowability, stability of the
slurry, and long-term performance of wells. The conventional admixtures which have been
developed in areas with moderate temperatures for cementing work above ground, may lead
to disappointing results when exposed to high temperature during oil well cementing. Uses of
supplementary cementing materials are also being encouraged in the petroleum industry as a
sustainable solution. Mineral and chemical admixtures play an important role in controlling
the physical and chemical properties of both fresh cement slurries and hardened cementitious
systems. However, very scant information can be found on the rheological properties of oilwell cement slurries when SCMs are used as partial replacement for cement. Moreover, the
coupled effects of temperature, chemical admixtures and mineral admixtures on the
rheological properties of oil well cement slurries remain largely unexplored.
The current study aimed at formulating recommendations for the effective use of chemical
and mineral admixtures in oil well cements at high temperature, which should enhance the
rheological properties of cement slurries in oil well cementing operations. Chapters two and
three summarize the basic concepts involved in oil well cementing, the chemical and physical
properties of oil well cements and the effects of related additives and chemical admixtures on
oil well cement slurry rheology. Chapter four investigated the effects of various chemical
admixtures on the rheological properties of cement slurries at high temperature using an
advanced shear-stress/shear-strain controlled rheometer. The combined influence of the
chemical admixtures and supplementary cementitious materials on the rheological properties
of OWC slurries was investigated in Chapter five. An artificial neural network model was
developed to simulate the influence of various types and dosages of chemical admixtures onthe flow behaviour of OWC slurries in Chapter six. Empirical equations for predicting the
shear flow curve of OWC slurry mixtures incorporating various superplasticizers at various
temperatures were developed using multiple regression analysis and presented in Chapter six.
These flow curves were used to calculate the Bingham yield stress and plastic viscosity
values for the various OWC slurries investigated. The coupled effects of chemical
8/18/2019 Rheology of Oil Well Cement Slurries
http://slidepdf.com/reader/full/rheology-of-oil-well-cement-slurries 265/274
242
admixtures and supplementary cementitious materials were also modeled using artificial
intelligence in Chapter seven. A parametric study was performed to evaluate the effects of
temperature, and dosage of chemical admixtures and supplementary cementitious materials
on the calculated yield stress and plastic viscosity values. Chapter Eight was devoted to
developing empirical equations and response surface models using a statistical design
approach and design of experiments to evaluate the effects of the dosage of chemical
admixture, dosage and type of supplementary materials on the rheological properties of
OWC slurries at different temperatures.
9.2 Conclusions
The experimental results in chapter four demonstrated that the rheological properties of
OWC slurries are highly dependent on temperature; both yield stress and plastic viscosity
increased nonlinearly with temperature. The rheological properties of OWC slurries also
depended on the type of admixture used. The new generation polycarboxylate-based high-
range water reducing admixture (PCH), polycarboxlate-based mid-range water reducing
admixture (PCM) and hydroxylated carboxylic acid-based retarding admixture (HCR)
improved fluidity at all test temperatures and for all dosages used, while slurries
incorporating a lignosulphonate-based mid-range water reducing admixture (LSM) required
more energy to initiate slurry flow since the yield stress increased at all dosages tested. Theadmixture dosage had a significant effect on the slurry rheology. At lower dosages, the
phosphonate-based set retarding admixture (SRA), HCR and rheoplastic solid admixture (RA)
acted as accelerators, thus enhancing the thixotropic behaviour of OWC slurries. This was
more pronounced at higher temperature. At lower dosage, the adsorbed layer of admixture
might not be sufficiently effective to act as a barrier to prevent the contact of water and
cement grains, which promotes the acceleration of hydration reactions. This could be the
reason why relatively higher yield stress and viscosity values were observed at low dosages
of LSM, SRA and RA. Beyond certain threshold dosages, such admixtures became effective
dispersants and reduced the extent of cement slurry thixotropy. However, PCH was found to
be more effective at improving the rheological properties of OWC slurries at all test
temperatures, even at relatively lower dosages, compared to the other admixtures tested.
8/18/2019 Rheology of Oil Well Cement Slurries
http://slidepdf.com/reader/full/rheology-of-oil-well-cement-slurries 266/274
243
Thixotropy measurements of OWC slurries showed that at lower dosage of admixtures
(except for LSM), the higher the temperature the higher was the degree of thixotropy. The
explanation of the phenomenon is that, at lower dosages, the admixtures are not effective to
disperse the structures formed as a result of the acceleration of the cement hydration
reactions at higher temperature. Thixotropy values were observed to decrease with increasing
admixture dosage, indicating that higher dosages reduced the degree of stiffening. The results
of chapter four indicated that the conventional admixtures, which have been developed in
countries with moderate temperature for cementing jobs above ground, may lead to
disappointing results when exposed to high temperature and need to be validated before
formulating recommendations specific to oil well cementing.
Chapter five substantiated that rheological properties of OWC slurry are largely dependent
on the type and dosage of supplementary cementitious materials (SCM) used. However,
regardless of the type and dosage of SCM, both yield stress and plastic viscosity of OWC
slurries were found to increase nonlinearly with the increase of temperature. The fly ash (FA)
and rice husk ash (RHA) used in the present study reduced yield stress, which can have a
positive influence on the pump-ability of OWC slurries. However, metakaolin (MK) and
silica fume (SF) increased yield stress when used as partial replacement for API Class G
OWC. At a given dosage, yield stress values for OWC slurries incorporating SCMs and
without any chemical admixtures followed the following order: SF>MK>RHA>FA at all test
temperatures. The slurries prepared with a larger fraction of spherical particles should have
lower viscosity, which is evident in the case of slurries prepared with FA. But in the case of
SF, yield stress and viscosity were found to be greater with increasing SF amount, likely
because of higher surface area ,which increases the water demand to produce a similar
fluidity to that of mixtures made without SF. The OWC slurries prepared with RHA showed
a different behaviour than that expected. Instead of increasing yield stress, the values were
found to decease gradually with the increasing replacement level of RHA.
PCH was found to enhance the shear thickening behaviour of OWC slurries and the intensity
of this effect varied with the type and amount of SCM (amplified with metakaolin, reduced
by SF, unchanged with FA, and showed an irregular behaviour with RHA). The explanation
of this phenomenon is linked to the primary mechanism, i.e. steric hindrance by which PCH
disperses cement particles. When polycarboxylate polymers adsorb on to the hydrating
8/18/2019 Rheology of Oil Well Cement Slurries
http://slidepdf.com/reader/full/rheology-of-oil-well-cement-slurries 267/274
244
cement grains, repulsive interactions occur as a consequence of the elastic and mixing
mechanisms. The elastic and mixing mechanisms are a function of the thickness and density
of the polymer adsorption layer, respectively (Yamada et al. 1998). In order to be dispersed,
the distance between two cement particles should be equal to or higher than double the
thickness of the polymer adsorption layer. When cement particles try to approach each other,
the elastic component of the steric hindrance exhibits repulsive forces. On the other hand, the
mixing component of the steric hindrance produces resistance when two neighbouring
polymers approach each other (Yamada et al. 1998). As a consequence, the resistance of the
mixing component of the steric hindrance increases with the increase of PCH dosage. This is
possibly the reason why the exponent n-value increased with the increase on PCH dosage and
the slurry behaviour converged towards shear thickening.
The measured plastic viscosity does not always truly represent the material properly and
sometimes could be misleading because of the high error involved in fitting the flow curve to
the Bingham model (Saak, 2000). However, plastic viscosity was measured and presented in
this thesis because it is very difficult to create mechanical models for the deformation
behaviour of cement paste using the apparent viscosity at each shear rate point (Nehdi and
Rahman, 2004). It was reported that plastic viscosity of cement slurries generally decreases
with an increase in temperature (Ravi et al ., 1990 and Ramachandran et al. , 1997). But such
a conclusion cannot be supported based on the current study and data reported in chapter four.
In order to evaluate the reproducibility of test results, some selected tests were performed
several times and the results were reproducible within a variability of 5%. At 23°C, plastic
viscosity decreased with increased admixture dosage up to a certain level and then started to
increase in the case of PCH, PCM, and RA at associated dosages of 0.50%, 0.50% and 4.0%,
respectively. Plastic viscosity gradually increased with increased dosage in the case of LSM,
whereas it decreased with increased SRA dosage. In the case of HCR, plastic viscosity
generally decreased with increased dosage. At 45°C, admixtures showed almost similar behaviour in terms of plastic viscosity, except for LSM. At 60°C, slurries incorporating PCH
did not exhibit a regular behaviour and plastic viscosity increased with increased admixture
dosage. In the case of PCM, SRA and HCR, plastic viscosity increased up to a certain limit
and then started to decrease at associated critical dosages of 0.50%, 0.75% and 0.50%,
respectively. However, it was not possible to provide a simple correlation of the effect of
8/18/2019 Rheology of Oil Well Cement Slurries
http://slidepdf.com/reader/full/rheology-of-oil-well-cement-slurries 268/274
245
chemical admixtures and temperatures on the plastic viscosity based on the present study,
which was also noted previously for ordinary cement pastes (Nehdi and Al-Martini, 2007,
Al-Martini, 2008). In chapter five, regardless of the type and dosage of SCM, plastic
viscosity values for OWC slurries were found to increase nonlinearly with the increase of
temperature. The plastic viscosity of OWC slurries increased with the incorporation of MK,
SF and RHA as partial replacement for OWC and decreased with the addition of FA.
Chapter six was devoted to developing a predictive model to simulate the influence of
various types and dosages of chemical admixtures and SCMs on the flow behaviour of OWC
slurries using Artificial Neural Networks. The ANN model developed in this study was able
to learn the relationships between different shear flow parameters for various OWC slurries
and successfully predicted the rheological properties of slurries used in the training process.
It also demonstrated satisfactory performance when input parameters (shear rate, temperature,
and dosage of admixture) unfamiliar to the ANN were used. The results prove that the ANN
model is a powerful tool to quantitatively predict the rheological properties of OWC slurries
within the range of tested admixture dosages and test temperatures.
Empirical equations for predicting the shear flow curves of OWC slurry mixtures
incorporating various superplasticizers at various temperatures were also developed using
multiple regression analysis and presented in Chapter six. The flow curves developed usingthe ANN- and MRA-based models allowed predicting the Bingham parameters (yield stress
and plastic viscosity) of OWC slurries with an acceptable accuracy and were found to be in
good agreement with experimental results. However, the ANN-based model performed
relatively better than the MRA-based model in predicting the rheological properties of OWC
slurries. The ANN-based model also captured the coupled effects of chemical admixture and
supplementary cementitious materials in chapter seven. A sensitivity analysis was performed
to study the effects of individual input parameters on the rheological properties of OWC
slurries. Irrespective of the type and dosage of SCM used, the ANN model successfully
captured the rheological behaviour of OWC slurries with the variation of input parameters.
The model was also found to generalize its predictions beyond the training data to new
slurries incorporating different dosages of admixtures and SCMs and considering different
temperatures within the practical range of the training data.
8/18/2019 Rheology of Oil Well Cement Slurries
http://slidepdf.com/reader/full/rheology-of-oil-well-cement-slurries 269/274
246
A statistical design approach based on a second order central composite response surface
model was developed in chapter eight to predict the rheological properties of OWC slurries
with addition of SCMs such as: metakaolin silica fume, rice husk ask or fly ash. Optimization
of OWC slurry often requires a number of trial batches to achieve adequate rheological
properties, which is labour intensive, time consuming and thus costly. A factorial design
approach was used in this study to determine the influence of temperature and key mixture
parameters such as the dosage of superplasticizer, type and amount of SCMs and their
interactions on the relevant rheological properties. The proposed model can simplify the test
protocol and reduce the number of required tests to achieve an optimum balance among the
various parameters involved and to gain a better understanding of trade-offs between key
mixture parameters such as the dosage of superplasticizer and amount of supplementary
cementitious materials.
9.3 Recommendations For Future Research
It should be noted that the findings reported in this study are valid for the oil well cement,
supplementary cementitious materials and chemical admixtures used herein. Other
cement/SCM/admixture combinations can exhibit different characteristics. Even admixtures
from the same category, but from different source, could behave differently, and thus need to
be investigated separately.
The prediction capability of the developed ANN model are valid for the types of materials
tested and within the range of parameters investigated in this study. However, the model can
be retrained to a wider data range of input variables when new expanded data becomes
available.
The multiple regression analysis and design of experiments based models are also valid for
the types of materials tested and within the range of parameters investigated in this study.
Therefore, further experimental research is needed to extend the proposed predictive
equations beyond the limits of the material types and proportions, and ranges of test
parameters used in the present study.
Further research is also needed to investigate the effects of possible hybrid blends of various
chemical admixtures and mineral admixtures (supplementary cementitious materials) at high
8/18/2019 Rheology of Oil Well Cement Slurries
http://slidepdf.com/reader/full/rheology-of-oil-well-cement-slurries 270/274
247
temperature versus time and to assess the compatibility between various admixtures and a
wide scope of cementitious blends to optimize binder-admixture formulations for effective
and sustainable use in oil well cementing applications.
Pressure also plays an important role, though of usually less importance than that oftemperature, on the rheology of oil well cements. It is recommended that the present work be
extended and validated using advanced rheological testing that captures both the effects of
temperature and pressure variations.
The mechanical properties and durability of hardened cementitious materials are critical for
its end use in the field. The rheological properties of cement-based materials determine the
quality of the hardened cementitious matrix and help predicting its end use performance and
its physical properties during and after processing. The effects of temperature, chemical
admixture, type and dosage of supplementary cementitious materials on the rheological
properties of oil well cement slurries have been investigated in this thesis. Thus, a logical
next step would be to study the mechanical properties and long-term durability properties of
hardened oil well cementitious matrices incorporating conventional chemical admixtures and
supplementary cementitious materials and subjected to high temperature and pressure to
make final recommendations for oil well cementing.
9.4 Reference
Al-Martini, S. (2008) Investigation on Rheology of Cement Paste and Concrete at High
Temperature. PhD Thesis , The University of Western Ontario, 353 p.
Laskar, A.I., and Talukdar, S., “Rheological Behavior of High Performance Concrete with
Mineral Admixtures and Their Blending,” Construction and Building Materials , Vol.
22, No. 12, 2008, pp. 2345–2354.
Nehdi, M. and Al-Martini, S. (2007). Effect of Chemical Admixtures on Rheology of Cement
Pastes at High Temperature. Journal of ASTM International , 4, No. 3, 17 p.
Ramachandran, V.S., Malhotra, V.M., Jolicoeur, C., and Spiratos, N. (1997). Superplasticizers:
Properties and Applications in Concrete . Materials Technology Laboratory, CANMET,
Natural Resources Canada. Ottawa, Ontario, pp. 43-150.
8/18/2019 Rheology of Oil Well Cement Slurries
http://slidepdf.com/reader/full/rheology-of-oil-well-cement-slurries 271/274
248
Ravi, K.M. and Sutton, D.L. (1990). New Rheological Correlation for Cement Slurries as a
Function of Temperature. SPE 20499, Proceedings of 65 th Annual Technical Conference
and Exhibition of Society of Petroleum Engineers , New Orleans, LA, September 23-26,
1990, pp. 455-462.
Saak, W.A. (2000). Characterization and Modeling of the Rheology of Cement Paste: With
Application Toward Self-Flowing Materials. Ph.D. Thesis , University of Northwestern,
Evanston, Illinois, USA, 283p.
Yamada, K., Hanehara, S., and Honma, K. (1998). The Effect of Naphthalene Sulphonate
Type and Polycarboxylate Type Superplasticizers on the Fluidity tf Belite-Rich
Cement Concrete. Proceedings Inter. Workshop on Self-Compacting Concrete , Kochi
University of Technology, Kochi, Japan, 1998, pp. 201-210.
8/18/2019 Rheology of Oil Well Cement Slurries
http://slidepdf.com/reader/full/rheology-of-oil-well-cement-slurries 272/274
8/18/2019 Rheology of Oil Well Cement Slurries
http://slidepdf.com/reader/full/rheology-of-oil-well-cement-slurries 273/274
250
Publications:
Refereed journals:
1. Shahriar, A., and Nehdi, M. (2010) Effect of chemical admixture on rheology of oil wellcement slurries. Accepted in Construction Materials, ICE, Jul 2010, 40 p, (ID: COMA-D-10-00023R1).
2. Shahriar, A., and Nehdi, M. (2011) Artificial intelligence model for rheological properties of oil well cement slurries incorporating supplementary cementitious materials.Accepted in Advances in Cement Research.
3. Shahriar, A., and Nehdi, M. (2010) Artificial intelligence model for rheological properties of oil well cement slurries. Submitted to ASCE Journal of Materials in CivilEngineering.
4. Shahriar, A., and Rahman, M.M. (2010) Optimal water resources management planningin Arsenic affected area using system approach. Submitted to the Journal of Water
Resources Management, Springer, 2010, 17 p, (ID: WARM1478).5. Shahriar, A., and Nehdi, M. (2011) Modeling rheological properties of oil well cement
slurries using artificial neural networks and multiple regression analysis. Submitted toConstruction & Building Materials.
6. Shahriar, A., and Nehdi, M. (2011) Optimization of Rheological Properties of Oil WellCement Slurries Using Experimental Design. Submitted to Cement and Concreteresearch.
Publication in Preparation
7. Shahriar, A., and Nehdi, M. (2011) Effect of supplementary cementitious materials onrheology of oil well cement slurries. Expected submission: April 2011.
8. Shahriar, A., and Nehdi, M. (2011) State of the art of oil well cement slurry. Expectedsubmission: May 2011.
Other refereed contributions:
International Conferences
9. Shahriar, A., and Nehdi, M. (2008) Effect of supplementary cementitious materials onrheology of oil well cement slurries. Proc. of Annual Conference - Canadian Society forCivil Engineering, Vol. 3, 10-13 Jun, 1494-1502 (Ph.D. Work).
10. Shahriar, A. , and Nehdi, M. (2006) A state-of-the art of bridge management systems forexisting bridges. Proc. of Int. Conference on Bridge Management Systems-MonitoringAssessment and Rehabilitation, BMSHBRC, Cairo Egypt, 21-23 Mar, 11 p., ID:BMS03401 (Ph.D. course work).
11. Shahriar, A ., Amin, A.F.M.S., Ahmad, S., and Hossain, M.Z. (2005) Some thoughts onACI method of concrete mix design. ICRAMME 05, Proc. of the Int. Conference onRecent Advances in Mechanical & Materials Engineering, 30-31 May, Kuala Lumpur,
8/18/2019 Rheology of Oil Well Cement Slurries
http://slidepdf.com/reader/full/rheology-of-oil-well-cement-slurries 274/274
251
Malaysia, Paper No. 162. [ISBN 983-41728-2-6] (B.Sc. thesis work).
12. Shahriar, A ., and Bosunia, S.Z. (2004) Numerical investigation of RC beamsrehabilitated with ferrocement”, Proc. of the 2 nd Int. Conference on Protection of