rhode island’s parcc results for students in … a g e | 1 rhode island’s parcc results for...
TRANSCRIPT
P a g e | 1
Rhode Island’s PARCC Results for Students in Grades 3 through 8 and High School 2015 to 2016: A Look at Our Progress
Dr. Ken Wagner, Commissioner Rhode Island Department of Education 255 Westminster Street Providence, RI 02903 (401) 222-4600
08.25.2016
2016 Rhode Island PARCC Results P a g e | 1
TABLE OF CONTENTS
Executive Summary .................................................................................................... 2
Introduction ................................................................................................................ 6
Section 1: Statewide Results………………………………………………………………………………… 7
English Language Arts (ELA)/Literacy Results ................................................................................ 8 Mathematics Results ................................................................................................................... 11 State Sector and School Type Results ......................................................................................... 16 Student Group Results ................................................................................................................ 17
Section 2: Connections to Teaching and Learning……………………………………………… 21
English Language Arts/Literacy ................................................................................................... 22 Mathematics ............................................................................................................................... 24
Section 3: District Results
Percent of Students at each performance level for ELA/Literacy ............................................... 26 Percent of Students at each performance level for Mathematics .............................................. 30
Section 4: School Results
Percent of Students at each performance level for ELA/Literacy ............................................... 34 Percent of Students at each performance level for Mathematics .............................................. 42
Appendices……………………………………………………………………………………………………….… 50
Appendix A. Clarifying Information ............................................................................................ 51 Appendix B. PARCC Performance Level Descriptors .................................................................. 53 Appendix C. Split-Level Schools ................................................................................................. 55 Appendix D. Calculating Standard Error (SE) to Determine Statistical Significance ................... 56 Appendix E. 2016 PARCC ELA/Literacy Testing Mode by District and School ............................ 57 Appendix F. 2016 PARCC Mathematics Testing Mode by District and School ........................... 65 Appendix G. 2016 PARCC State-Level Results by Content, Testing Mode, and Grade/Test ....... 74
2016 Rhode Island PARCC Results P a g e | 2
EXECUTIVE SUMMARY
This report provides information about Rhode Island’s 2016 administration of the PARCC (Partnership for Assessment of Readiness for College and Careers) state assessment along with comparisons to our 2015 PARCC administration. Statewide assessments have been part of Rhode Island’s fabric for many years. This year marks the second administration of the PARCC assessment, which measures student progress on challenging learning standards designed to prepare students for their future opportunities in the next grade, post-secondary education, or their careers.
Rhode Island worked collaboratively with other states to design an assessment that measures student progress in reading, writing, and mathematics. As a member of a multi-state consortium, we worked in partnership with other educators across the country to develop high-quality assessments to inform teaching and learning, identify struggling schools, guide professional development, and provide families and students with information on student strengths and challenges.
The PARCC assessments summarize student performance through one of five performance levels. They include: Exceeded Expectations, Met Expectations, Approached Expectations, Partially Met Expectations, or Did Not Yet Meet Expectations. The knowledge and skills students need to demonstrate at each of the performance levels were based on the recommendations of educator panels representing each of the participating states in the Consortium. Rhode Island teachers were strong participants on these panels. All states in the Consortium have adopted these same performance standards.
This year’s results offer Rhode Island a second year of data on our students’ progress on state standards and challenging learning expectations. This new information provides valuable insight into the benchmarks set last year and will help us monitor our continuing progress toward meeting our shared commitment to providing all students with an opportunity to leave our schools ready to pursue their goals and dreams.
To be clear, academic readiness in these areas does not provide a complete picture about our students. School communities must develop students’ academic knowledge and skills in reading and mathematics but also in the arts and sciences. In addition, a comprehensive program develops students’ abilities to persist through challenging assignments, work collaboratively, innovate, and problem solve. This is the work our school communities actively engage in every day to help Rhode Island students grow.
Assessments serve only one purpose – to give us the information necessary to continuously improve teaching, and this year’s results remind us that there is still much work ahead of us. As we stated last year, this year’s results are not an evaluation of the collective efforts of teachers and leaders, nor do they signal everything that our students are capable of accomplishing academically. Rhode Island and states across the country are working
A Rhode Island graduate is one who is well-prepared for postsecondary education, work, and life. He or she
can think critically and collaboratively and can act as a
creative, self-motivated, culturally competent learner and citizen.
2020 Vision for Education: Rhode Island’s Strategic Plan
2016 Rhode Island PARCC Results P a g e | 3
together to transition to advanced learning expectations. These expectations align with the demands of a global economy and respond to the feedback received from businesses and colleges about what students need to know in reading, writing, and mathematics. Today we offer a check on Rhode Island’s efforts to ensure that all students have the opportunity to learn. We are proud of the foundational work that has been accomplished and invite you to stay committed to our ongoing progress.
Overall Achievement
Results of the spring 2016 PARCC assessments revealed that, overall, Rhode Island students’ scores improved and participation rates increased. With large changes in student participation in some schools and districts it is important to review student performance data along with participation data.
STATE-LEVEL RESULTS
At the state level, approximately 38% of students across grades 3 through 10 met or exceeded expectations in English Language Arts/Literacy, representing a 2 percentage point increase in ELA compared to last year. Students improved in 5 grade levels and scores were unchanged in 3 grade levels. In mathematics, statewide achievement improved by 5 percentage points since 2015, with 30% of all students meeting or exceeding the learning expectations for their grade level. Students improved on every mathematics assessment (grades 3 through 8, Algebra I, and Geometry).
As a result of statewide conversations in all communities and increased engagement with families, the statewide participation rates in both PARCC subjects reached 96% (up from 88% in English Language Arts/Literacy and up from 90% in Mathematics). Both of these participation rates are above the U.S. Department of Education requirement of 95% or better participation in state assessments.
SCHOOL TYPE RESULTS
Comparing schools by level of urbanicity1 (urban, urban ring, and suburban) and type (charter and state school), results were as follows: PARCC English Language Arts/Literacy achievement levels rose this year for students enrolled in Urban (up 2 percentage points), Suburban (up 2 points), Charters (up 6 points), and State schools (up 11 points) compared to last year. For PARCC Mathematics, achievement levels rose for students enrolled in Urban (up 4 percentage points), Urban Ring (up 4 points), Suburban (up 6 points), and Charters (up 4 points) compared to last year.
1 Urban Schools: Providence, Central Falls, Pawtucket, and Woonsocket; Urban Ring Schools: East Providence, Cranston, West Warwick, Newport, Johnston, Warwick, and
North Providence; Suburban Schools: All others except for Charter Schools and State Schools (Davies Tech, DCYF; MET School, and RI School for the Deaf).
2016 Rhode Island PARCC Results P a g e | 4
STUDENT GROUP RESULTS
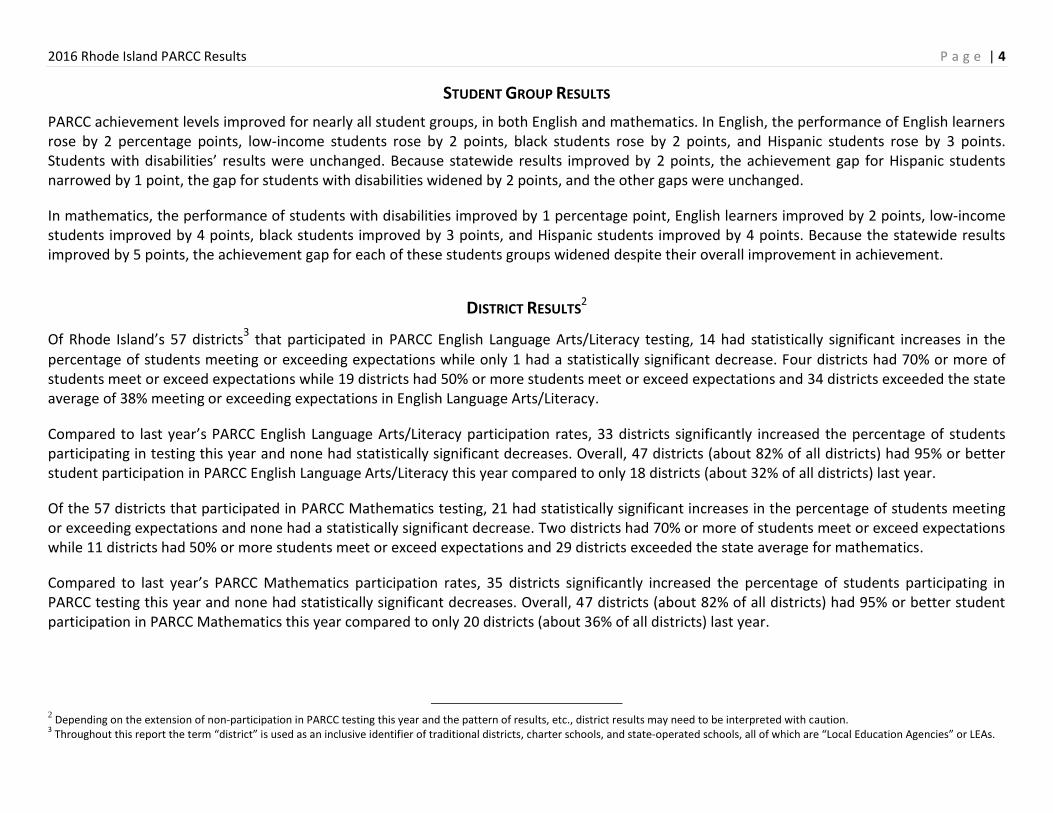
PARCC achievement levels improved for nearly all student groups, in both English and mathematics. In English, the performance of English learners rose by 2 percentage points, low-income students rose by 2 points, black students rose by 2 points, and Hispanic students rose by 3 points. Students with disabilities’ results were unchanged. Because statewide results improved by 2 points, the achievement gap for Hispanic students narrowed by 1 point, the gap for students with disabilities widened by 2 points, and the other gaps were unchanged.
In mathematics, the performance of students with disabilities improved by 1 percentage point, English learners improved by 2 points, low-income students improved by 4 points, black students improved by 3 points, and Hispanic students improved by 4 points. Because the statewide results improved by 5 points, the achievement gap for each of these students groups widened despite their overall improvement in achievement.
DISTRICT RESULTS2
Of Rhode Island’s 57 districts3 that participated in PARCC English Language Arts/Literacy testing, 14 had statistically significant increases in the
percentage of students meeting or exceeding expectations while only 1 had a statistically significant decrease. Four districts had 70% or more of students meet or exceed expectations while 19 districts had 50% or more students meet or exceed expectations and 34 districts exceeded the state average of 38% meeting or exceeding expectations in English Language Arts/Literacy.
Compared to last year’s PARCC English Language Arts/Literacy participation rates, 33 districts significantly increased the percentage of students participating in testing this year and none had statistically significant decreases. Overall, 47 districts (about 82% of all districts) had 95% or better student participation in PARCC English Language Arts/Literacy this year compared to only 18 districts (about 32% of all districts) last year.
Of the 57 districts that participated in PARCC Mathematics testing, 21 had statistically significant increases in the percentage of students meeting or exceeding expectations and none had a statistically significant decrease. Two districts had 70% or more of students meet or exceed expectations while 11 districts had 50% or more students meet or exceed expectations and 29 districts exceeded the state average for mathematics.
Compared to last year’s PARCC Mathematics participation rates, 35 districts significantly increased the percentage of students participating in PARCC testing this year and none had statistically significant decreases. Overall, 47 districts (about 82% of all districts) had 95% or better student participation in PARCC Mathematics this year compared to only 20 districts (about 36% of all districts) last year.
2 Depending on the extension of non-participation in PARCC testing this year and the pattern of results, etc., district results may need to be interpreted with caution.
3 Throughout this report the term “district” is used as an inclusive identifier of traditional districts, charter schools, and state-operated schools, all of which are “Local Education Agencies” or LEAs.
2016 Rhode Island PARCC Results P a g e | 5
SCHOOL4 RESULTS
5
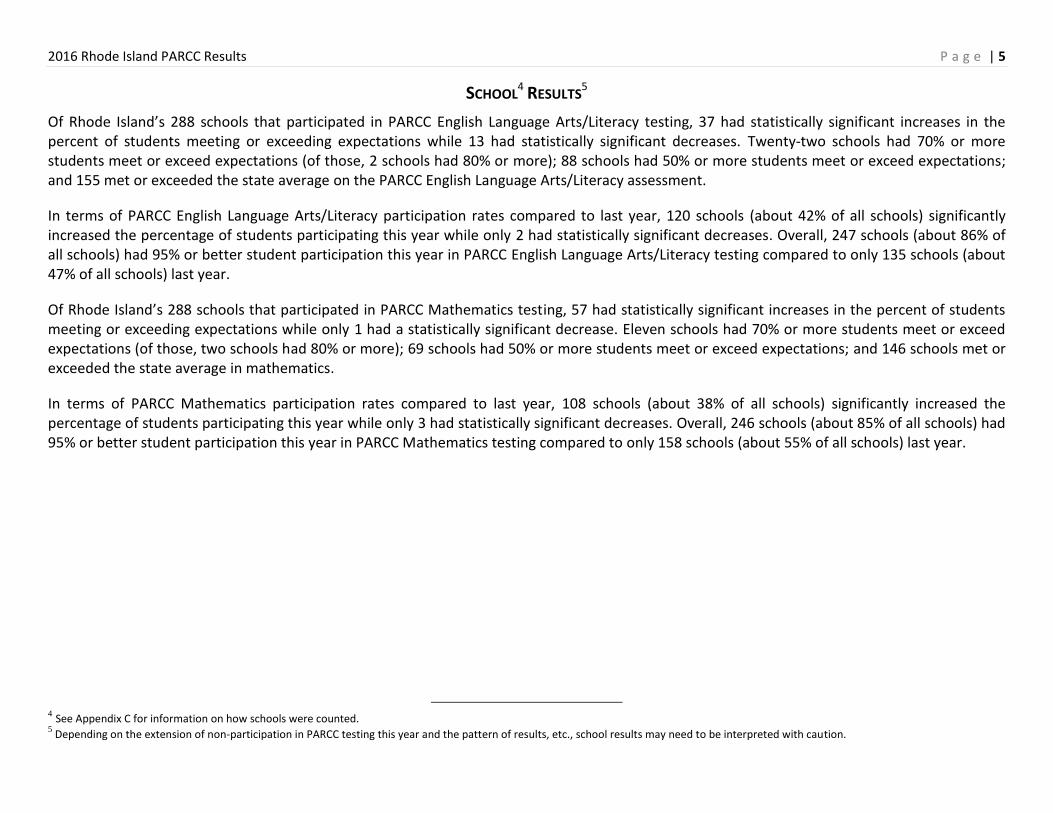
Of Rhode Island’s 288 schools that participated in PARCC English Language Arts/Literacy testing, 37 had statistically significant increases in the percent of students meeting or exceeding expectations while 13 had statistically significant decreases. Twenty-two schools had 70% or more students meet or exceed expectations (of those, 2 schools had 80% or more); 88 schools had 50% or more students meet or exceed expectations; and 155 met or exceeded the state average on the PARCC English Language Arts/Literacy assessment.
In terms of PARCC English Language Arts/Literacy participation rates compared to last year, 120 schools (about 42% of all schools) significantly increased the percentage of students participating this year while only 2 had statistically significant decreases. Overall, 247 schools (about 86% of all schools) had 95% or better student participation this year in PARCC English Language Arts/Literacy testing compared to only 135 schools (about 47% of all schools) last year.
Of Rhode Island’s 288 schools that participated in PARCC Mathematics testing, 57 had statistically significant increases in the percent of students meeting or exceeding expectations while only 1 had a statistically significant decrease. Eleven schools had 70% or more students meet or exceed expectations (of those, two schools had 80% or more); 69 schools had 50% or more students meet or exceed expectations; and 146 schools met or exceeded the state average in mathematics.
In terms of PARCC Mathematics participation rates compared to last year, 108 schools (about 38% of all schools) significantly increased the percentage of students participating this year while only 3 had statistically significant decreases. Overall, 246 schools (about 85% of all schools) had 95% or better student participation this year in PARCC Mathematics testing compared to only 158 schools (about 55% of all schools) last year.
4 See Appendix C for information on how schools were counted.
5 Depending on the extension of non-participation in PARCC testing this year and the pattern of results, etc., school results may need to be interpreted with caution.
2016 Rhode Island PARCC Results P a g e | 6
INTRODUCTION
The Common Core State Standards (CCSS) in English Language Arts/Literacy and Mathematics were adopted by the Rhode Island Board of Regents in July 2010. These learning standards provide a roadmap of what knowledge and skills students need to learn at each grade level. The adoption of these standards marked the beginning of a statewide curriculum and instruction transition across our schools and districts. During that same period, Rhode Island decided to be part of a multi-state consortium called the Partnership for the Assessment of Readiness for College and Careers (PARCC)6 to build assessments that measure the CCSS. The assessments designed under this partnership form the foundation of Rhode Island’s state assessment program that is both state and federally required.
State assessments in English Language Arts/Literacy and Mathematics provide information that helps us understand how Rhode Island students are progressing on agreed-upon learning standards as expressed by the Common Core State Standards (CCSS). The results are one indicator among many that give us information about the health and vibrancy of our schools and their progress toward ensuring that all students are learning important skills and knowledge that will prepare them to be productive citizens, successful post-secondary learners, and employees in fulfilling personal careers.
This year’s testing marks the second administration of the PARCC assessments and sheds light on our progress toward our state’s learning standards. The information does not define a district, school, or, most importantly, a student. Rather, the information offers an objective check on student learning and should be considered within a set of other information that is known about his or her academic progress. PARCC assessments provide important information to families and to educators about student achievement and student progress in relation to their peers. Teachers and family members7 will use these results to identify student strengths and learning needs and to improve instruction. Schools and districts will review this year’s data against the work that has been done to align curriculum and instructional practices to the CCSS. Decisions about curriculum adjustments, professional development, and learning opportunities will be informed, in part, by these data.
With student scores and participation rates on the rise, the spring 2016 PARCC results show we are on the right path toward preparing students for success in school and in their careers. Test results are only one measure of student achievement, but if we stay focused and continue working together, hold high standards and expectations for all students, provide challenging coursework opportunities in every school, and re-imagine schooling for the 21st century, we will meet our goal of preparing all graduates for success in postsecondary education and in challenging careers.
6 More information on PARCC assessments is available online at www.ride.ri.gov/PARCC and at http://www.parcconline.org/
7 More information on PARCC score reports for students is available online at www.UnderstandTheScore.org
While not easy, the transition marks a necessary reset that will give families a genuine
measure of student development.
2016 Rhode Island PARCC Results P a g e | 7
PARCC STATEWIDE RESULTS
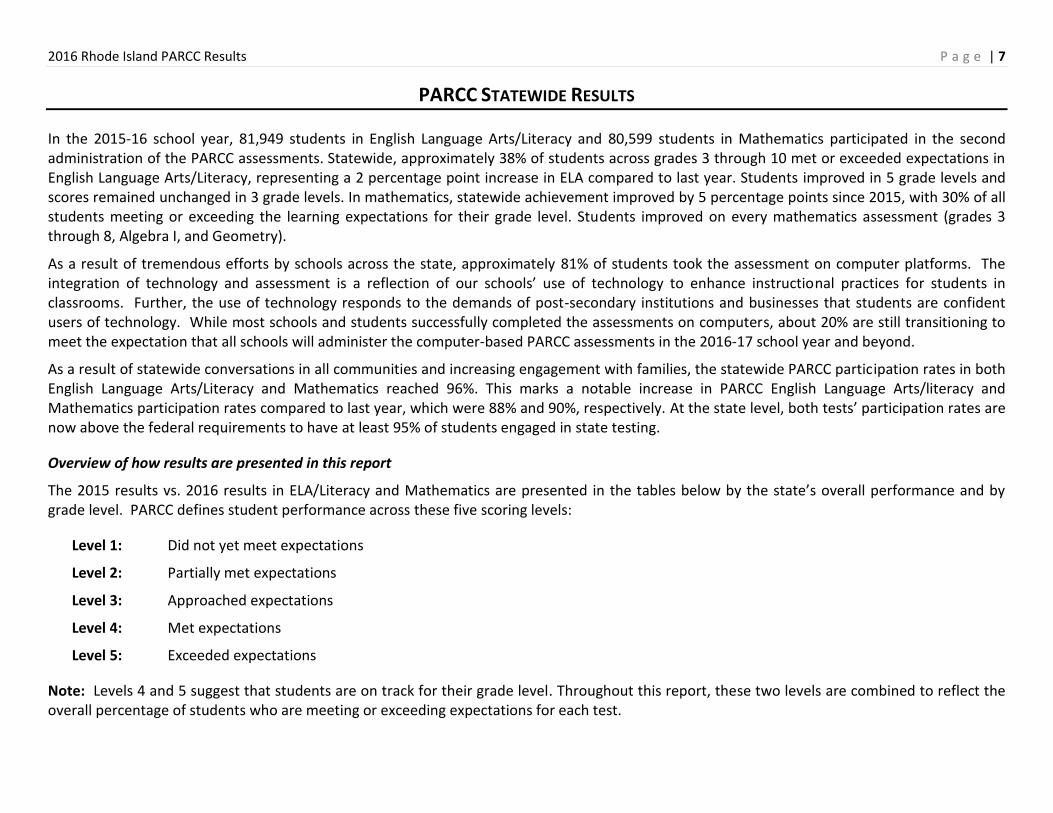
In the 2015-16 school year, 81,949 students in English Language Arts/Literacy and 80,599 students in Mathematics participated in the second administration of the PARCC assessments. Statewide, approximately 38% of students across grades 3 through 10 met or exceeded expectations in English Language Arts/Literacy, representing a 2 percentage point increase in ELA compared to last year. Students improved in 5 grade levels and scores remained unchanged in 3 grade levels. In mathematics, statewide achievement improved by 5 percentage points since 2015, with 30% of all students meeting or exceeding the learning expectations for their grade level. Students improved on every mathematics assessment (grades 3 through 8, Algebra I, and Geometry).
As a result of tremendous efforts by schools across the state, approximately 81% of students took the assessment on computer platforms. The integration of technology and assessment is a reflection of our schools’ use of technology to enhance instructional practices for students in classrooms. Further, the use of technology responds to the demands of post-secondary institutions and businesses that students are confident users of technology. While most schools and students successfully completed the assessments on computers, about 20% are still transitioning to meet the expectation that all schools will administer the computer-based PARCC assessments in the 2016-17 school year and beyond.
As a result of statewide conversations in all communities and increasing engagement with families, the statewide PARCC participation rates in both English Language Arts/Literacy and Mathematics reached 96%. This marks a notable increase in PARCC English Language Arts/literacy and Mathematics participation rates compared to last year, which were 88% and 90%, respectively. At the state level, both tests’ participation rates are now above the federal requirements to have at least 95% of students engaged in state testing.
Overview of how results are presented in this report
The 2015 results vs. 2016 results in ELA/Literacy and Mathematics are presented in the tables below by the state’s overall performance and by grade level. PARCC defines student performance across these five scoring levels:
Level 1: Did not yet meet expectations
Level 2: Partially met expectations
Level 3: Approached expectations
Level 4: Met expectations
Level 5: Exceeded expectations
Note: Levels 4 and 5 suggest that students are on track for their grade level. Throughout this report, these two levels are combined to reflect the overall percentage of students who are meeting or exceeding expectations for each test.
2016 Rhode Island PARCC Results P a g e | 8
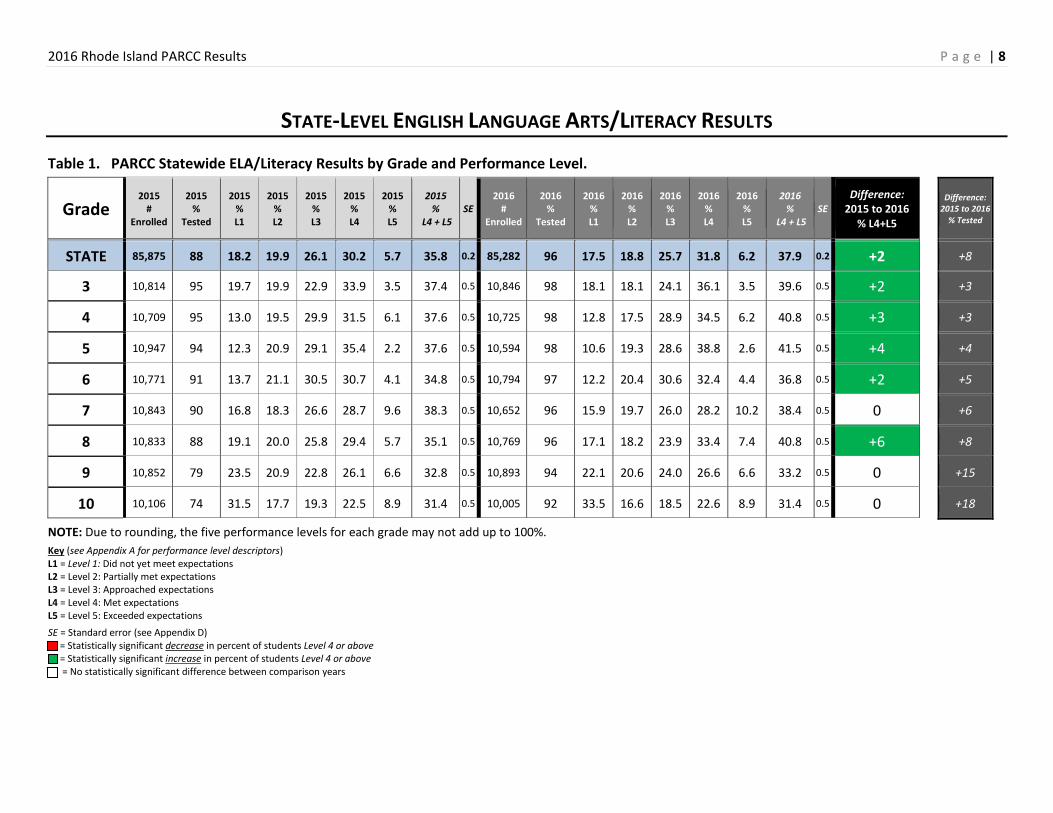
STATE-LEVEL ENGLISH LANGUAGE ARTS/LITERACY RESULTS
Table 1. PARCC Statewide ELA/Literacy Results by Grade and Performance Level.
Grade 2015
# Enrolled
2015 %
Tested
2015 % L1
2015 % L2
2015 % L3
2015 % L4
2015 % L5
2015 %
L4 + L5 SE
2016 #
Enrolled
2016 %
Tested
2016 % L1
2016 % L2
2016 % L3
2016 % L4
2016 % L5
2016 %
L4 + L5 SE
Difference: 2015 to 2016
% L4+L5
Difference: 2015 to 2016
% Tested
STATE 85,875 88 18.2 19.9 26.1 30.2 5.7 35.8 0.2 85,282 96 17.5 18.8 25.7 31.8 6.2 37.9 0.2 +2 +8
3 10,814 95 19.7 19.9 22.9 33.9 3.5 37.4 0.5 10,846 98 18.1 18.1 24.1 36.1 3.5 39.6 0.5 +2 +3
4 10,709 95 13.0 19.5 29.9 31.5 6.1 37.6 0.5 10,725 98 12.8 17.5 28.9 34.5 6.2 40.8 0.5 +3 +3
5 10,947 94 12.3 20.9 29.1 35.4 2.2 37.6 0.5 10,594 98 10.6 19.3 28.6 38.8 2.6 41.5 0.5 +4 +4
6 10,771 91 13.7 21.1 30.5 30.7 4.1 34.8 0.5 10,794 97 12.2 20.4 30.6 32.4 4.4 36.8 0.5 +2 +5
7 10,843 90 16.8 18.3 26.6 28.7 9.6 38.3 0.5 10,652 96 15.9 19.7 26.0 28.2 10.2 38.4 0.5 0 +6
8 10,833 88 19.1 20.0 25.8 29.4 5.7 35.1 0.5 10,769 96 17.1 18.2 23.9 33.4 7.4 40.8 0.5 +6 +8
9 10,852 79 23.5 20.9 22.8 26.1 6.6 32.8 0.5 10,893 94 22.1 20.6 24.0 26.6 6.6 33.2 0.5 0 +15
10 10,106 74 31.5 17.7 19.3 22.5 8.9 31.4 0.5 10,005 92 33.5 16.6 18.5 22.6 8.9 31.4 0.5 0 +18
NOTE: Due to rounding, the five performance levels for each grade may not add up to 100%.
Key (see Appendix A for performance level descriptors) L1 = Level 1: Did not yet meet expectations L2 = Level 2: Partially met expectations L3 = Level 3: Approached expectations L4 = Level 4: Met expectations L5 = Level 5: Exceeded expectations
SE = Standard error (see Appendix D) = Statistically significant decrease in percent of students Level 4 or above = Statistically significant increase in percent of students Level 4 or above = No statistically significant difference between comparison years
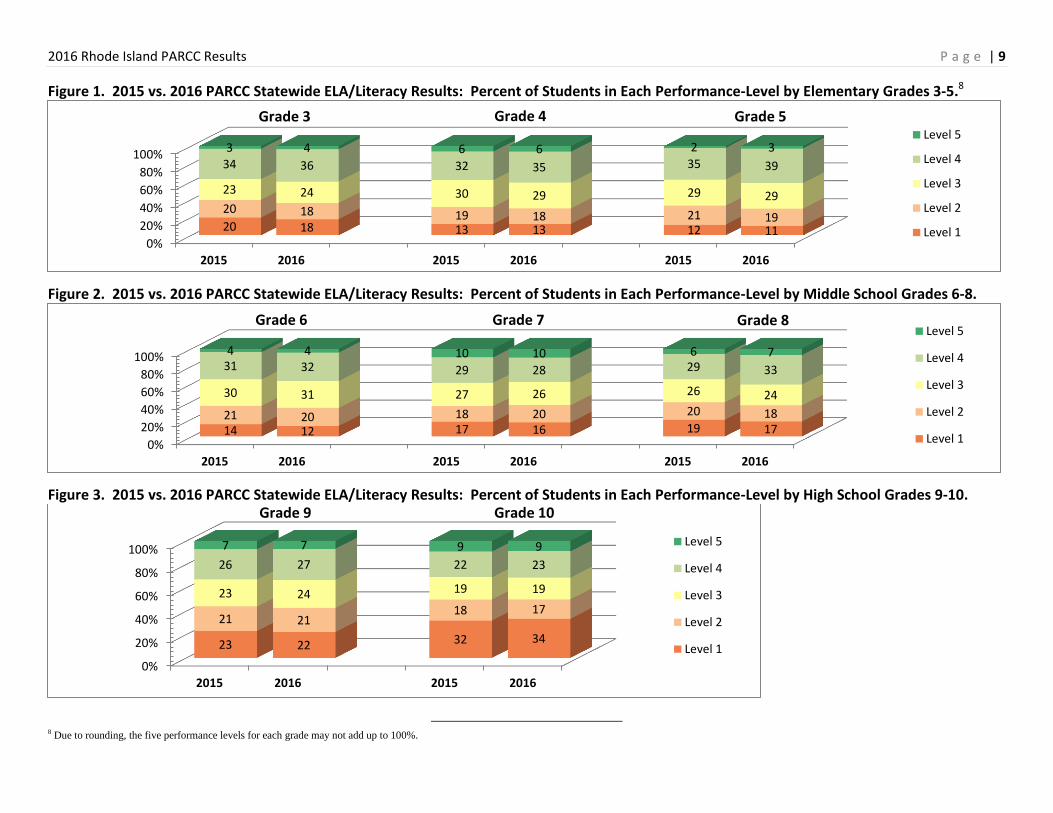
2016 Rhode Island PARCC Results P a g e | 9
Figure 1. 2015 vs. 2016 PARCC Statewide ELA/Literacy Results: Percent of Students in Each Performance-Level by Elementary Grades 3-5.8
Figure 2. 2015 vs. 2016 PARCC Statewide ELA/Literacy Results: Percent of Students in Each Performance-Level by Middle School Grades 6-8.
Figure 3. 2015 vs. 2016 PARCC Statewide ELA/Literacy Results: Percent of Students in Each Performance-Level by High School Grades 9-10.
8 Due to rounding, the five performance levels for each grade may not add up to 100%.
0%
20%
40%
60%
80%
100%
2015 2016 2015 2016 2015 2016
20 18 13 13 12 11
20 18 19 18 21 19
23 24 30 29 29 29
34 36 32 35 35 39
3 4 6 6 2 3 Level 5
Level 4
Level 3
Level 2
Level 1
Grade 3 Grade 4 Grade 5
0%
20%
40%
60%
80%
100%
2015 2016 2015 2016 2015 2016
14 12 17 16 19 17 21 20 18 20 20 18
30 31 27 26 26 24
31 32 29 28 29 33
4 4 10 10 6 7
Level 5
Level 4
Level 3
Level 2
Level 1
Grade 6 Grade 7 Grade 8
0%
20%
40%
60%
80%
100%
2015 2016 2015 2016
23 22 32 34
21 21 18 17
23 24 19 19
26 27 22 23
7 7 9 9 Level 5
Level 4
Level 3
Level 2
Level 1
Grade 9 Grade 10
2016 Rhode Island PARCC Results P a g e | 10
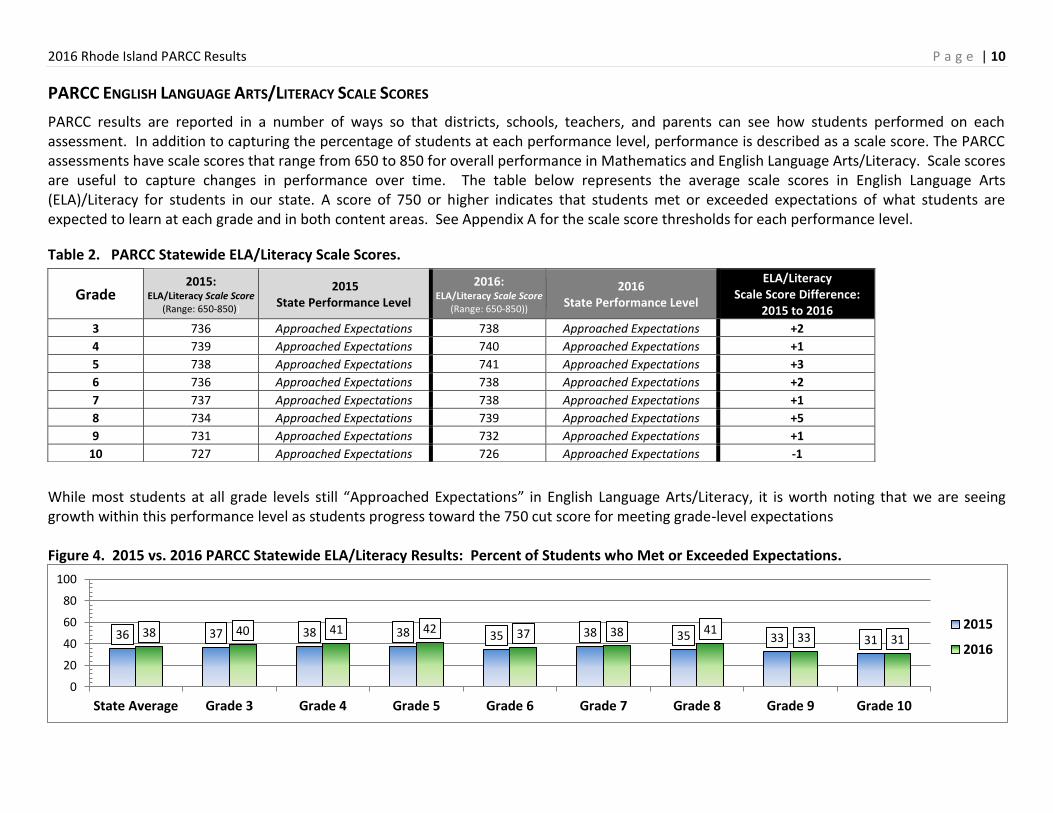
PARCC ENGLISH LANGUAGE ARTS/LITERACY SCALE SCORES
PARCC results are reported in a number of ways so that districts, schools, teachers, and parents can see how students performed on each assessment. In addition to capturing the percentage of students at each performance level, performance is described as a scale score. The PARCC assessments have scale scores that range from 650 to 850 for overall performance in Mathematics and English Language Arts/Literacy. Scale scores are useful to capture changes in performance over time. The table below represents the average scale scores in English Language Arts (ELA)/Literacy for students in our state. A score of 750 or higher indicates that students met or exceeded expectations of what students are expected to learn at each grade and in both content areas. See Appendix A for the scale score thresholds for each performance level.
Table 2. PARCC Statewide ELA/Literacy Scale Scores.
While most students at all grade levels still “Approached Expectations” in English Language Arts/Literacy, it is worth noting that we are seeing growth within this performance level as students progress toward the 750 cut score for meeting grade-level expectations Figure 4. 2015 vs. 2016 PARCC Statewide ELA/Literacy Results: Percent of Students who Met or Exceeded Expectations.
36 37 38 38 35 38 35 33 31 38 40 41 42 37 38 41
33 31
0
20
40
60
80
100
State Average Grade 3 Grade 4 Grade 5 Grade 6 Grade 7 Grade 8 Grade 9 Grade 10
2015
2016
Grade 2015:
ELA/Literacy Scale Score (Range: 650-850))
2015 State Performance Level
2016: ELA/Literacy Scale Score
(Range: 650-850))
2016 State Performance Level
ELA/Literacy Scale Score Difference:
2015 to 2016
3 736 Approached Expectations 738 Approached Expectations +2
4 739 Approached Expectations 740 Approached Expectations +1
5 738 Approached Expectations 741 Approached Expectations +3
6 736 Approached Expectations 738 Approached Expectations +2
7 737 Approached Expectations 738 Approached Expectations +1
8 734 Approached Expectations 739 Approached Expectations +5
9 731 Approached Expectations 732 Approached Expectations +1
10 727 Approached Expectations 726 Approached Expectations -1
2016 Rhode Island PARCC Results P a g e | 11
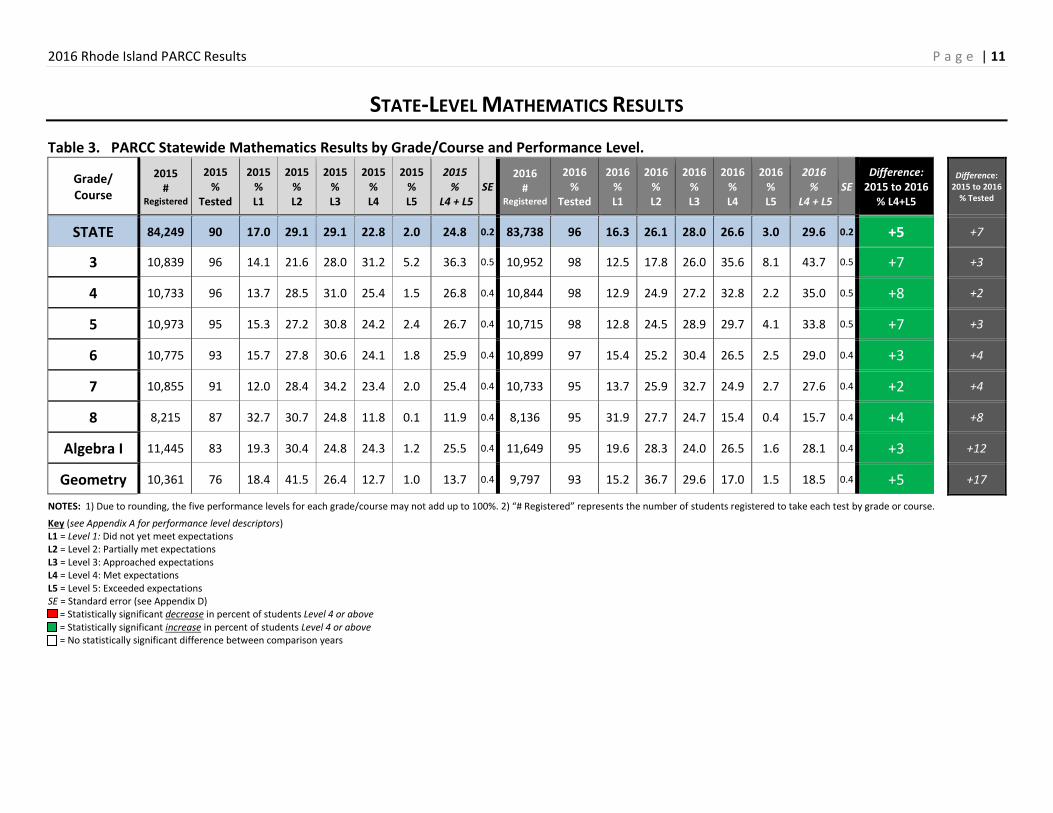
STATE-LEVEL MATHEMATICS RESULTS
Table 3. PARCC Statewide Mathematics Results by Grade/Course and Performance Level.
Grade/ Course
2015 #
Registered
2015 %
Tested
2015 % L1
2015 % L2
2015 % L3
2015 % L4
2015 % L5
2015 %
L4 + L5 SE
2016 #
Registered
2016 %
Tested
2016 % L1
2016 % L2
2016 % L3
2016 % L4
2016 % L5
2016 %
L4 + L5 SE
Difference: 2015 to 2016
% L4+L5
Difference:
2015 to 2016 % Tested
STATE 84,249 90 17.0 29.1 29.1 22.8 2.0 24.8 0.2 83,738 96 16.3 26.1 28.0 26.6 3.0 29.6 0.2 +5
+7
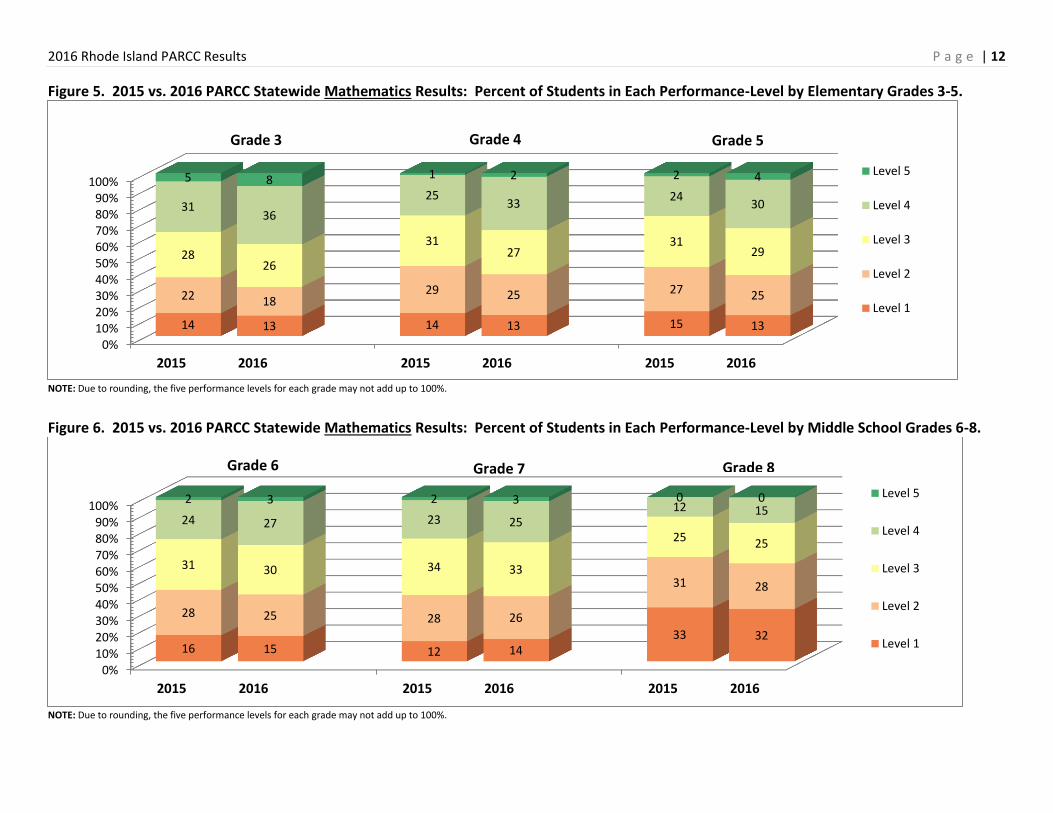
3 10,839 96 14.1 21.6 28.0 31.2 5.2 36.3 0.5 10,952 98 12.5 17.8 26.0 35.6 8.1 43.7 0.5 +7
+3
4 10,733 96 13.7 28.5 31.0 25.4 1.5 26.8 0.4 10,844 98 12.9 24.9 27.2 32.8 2.2 35.0 0.5 +8
+2
5 10,973 95 15.3 27.2 30.8 24.2 2.4 26.7 0.4 10,715 98 12.8 24.5 28.9 29.7 4.1 33.8 0.5 +7
+3
6 10,775 93 15.7 27.8 30.6 24.1 1.8 25.9 0.4 10,899 97 15.4 25.2 30.4 26.5 2.5 29.0 0.4 +3
+4
7 10,855 91 12.0 28.4 34.2 23.4 2.0 25.4 0.4 10,733 95 13.7 25.9 32.7 24.9 2.7 27.6 0.4 +2
+4
8 8,215 87 32.7 30.7 24.8 11.8 0.1 11.9 0.4 8,136 95 31.9 27.7 24.7 15.4 0.4 15.7 0.4 +4
+8
Algebra I 11,445 83 19.3 30.4 24.8 24.3 1.2 25.5 0.4 11,649 95 19.6 28.3 24.0 26.5 1.6 28.1 0.4 +3
+12
Geometry 10,361 76 18.4 41.5 26.4 12.7 1.0 13.7 0.4 9,797 93 15.2 36.7 29.6 17.0 1.5 18.5 0.4 +5
+17
NOTES: 1) Due to rounding, the five performance levels for each grade/course may not add up to 100%. 2) “# Registered” represents the number of students registered to take each test by grade or course.
Key (see Appendix A for performance level descriptors) L1 = Level 1: Did not yet meet expectations L2 = Level 2: Partially met expectations L3 = Level 3: Approached expectations L4 = Level 4: Met expectations L5 = Level 5: Exceeded expectations SE = Standard error (see Appendix D) = Statistically significant decrease in percent of students Level 4 or above = Statistically significant increase in percent of students Level 4 or above = No statistically significant difference between comparison years
2016 Rhode Island PARCC Results P a g e | 12
Figure 5. 2015 vs. 2016 PARCC Statewide Mathematics Results: Percent of Students in Each Performance-Level by Elementary Grades 3-5.
NOTE: Due to rounding, the five performance levels for each grade may not add up to 100%.
Figure 6. 2015 vs. 2016 PARCC Statewide Mathematics Results: Percent of Students in Each Performance-Level by Middle School Grades 6-8.
NOTE: Due to rounding, the five performance levels for each grade may not add up to 100%.
0%10%20%30%40%50%60%70%80%90%
100%
2015 2016 2015 2016 2015 2016
14 13 14 13 15 13
22 18 29 25 27 25
28 26
31 27
31 29
31 36
25 33
24 30
5 8 1 2 2 4
Grade 3
Level 5
Level 4
Level 3
Level 2
Level 1
Grade 4 Grade 5
0%10%20%30%40%50%60%70%80%90%
100%
2015 2016 2015 2016 2015 2016
16 15 12 14 33 32
28 25 28 26
31 28
31 30 34 33
25 25
24 27 23 25 12 15
2 3 2 3 0 0
Grade 6
Level 5
Level 4
Level 3
Level 2
Level 1
Grade 7 Grade 8
2016 Rhode Island PARCC Results P a g e | 13
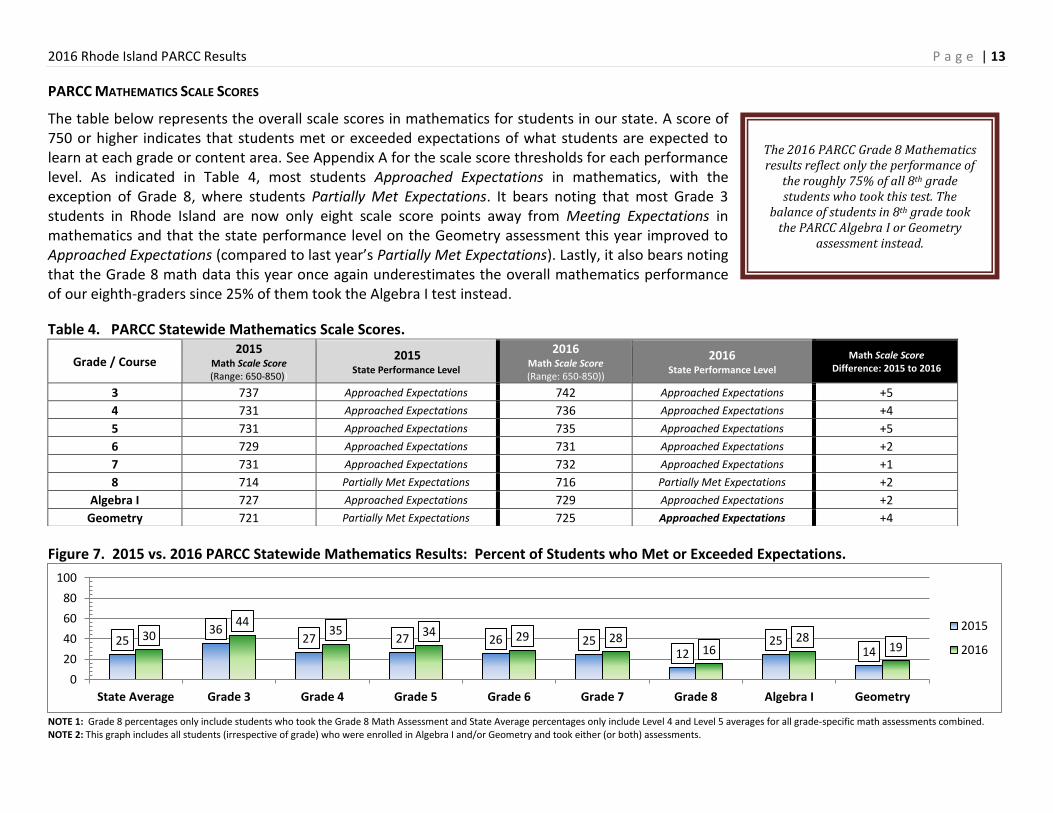
PARCC MATHEMATICS SCALE SCORES
The table below represents the overall scale scores in mathematics for students in our state. A score of 750 or higher indicates that students met or exceeded expectations of what students are expected to learn at each grade or content area. See Appendix A for the scale score thresholds for each performance level. As indicated in Table 4, most students Approached Expectations in mathematics, with the exception of Grade 8, where students Partially Met Expectations. It bears noting that most Grade 3 students in Rhode Island are now only eight scale score points away from Meeting Expectations in mathematics and that the state performance level on the Geometry assessment this year improved to Approached Expectations (compared to last year’s Partially Met Expectations). Lastly, it also bears noting that the Grade 8 math data this year once again underestimates the overall mathematics performance of our eighth-graders since 25% of them took the Algebra I test instead.
Table 4. PARCC Statewide Mathematics Scale Scores.
Figure 7. 2015 vs. 2016 PARCC Statewide Mathematics Results: Percent of Students who Met or Exceeded Expectations.
NOTE 1: Grade 8 percentages only include students who took the Grade 8 Math Assessment and State Average percentages only include Level 4 and Level 5 averages for all grade-specific math assessments combined. NOTE 2: This graph includes all students (irrespective of grade) who were enrolled in Algebra I and/or Geometry and took either (or both) assessments.
25 36
27 27 26 25 12
25 14
30 44
35 34 29 28 16
28 19
0
20
40
60
80
100
State Average Grade 3 Grade 4 Grade 5 Grade 6 Grade 7 Grade 8 Algebra I Geometry
2015
2016
Grade / Course 2015
Math Scale Score (Range: 650-850))
2015 State Performance Level
2016
Math Scale Score (Range: 650-850))
2016 State Performance Level
Math Scale Score Difference: 2015 to 2016
3 737 Approached Expectations 742 Approached Expectations +5
4 731 Approached Expectations 736 Approached Expectations +4
5 731 Approached Expectations 735 Approached Expectations +5
6 729 Approached Expectations 731 Approached Expectations +2
7 731 Approached Expectations 732 Approached Expectations +1
8 714 Partially Met Expectations 716 Partially Met Expectations +2
Algebra I 727 Approached Expectations 729 Approached Expectations +2
Geometry 721 Partially Met Expectations 725 Approached Expectations +4
The 2016 PARCC Grade 8 Mathematics results reflect only the performance of
the roughly 75% of all 8th grade students who took this test. The
balance of students in 8th grade took the PARCC Algebra I or Geometry
assessment instead.
2016 Rhode Island PARCC Results P a g e | 14
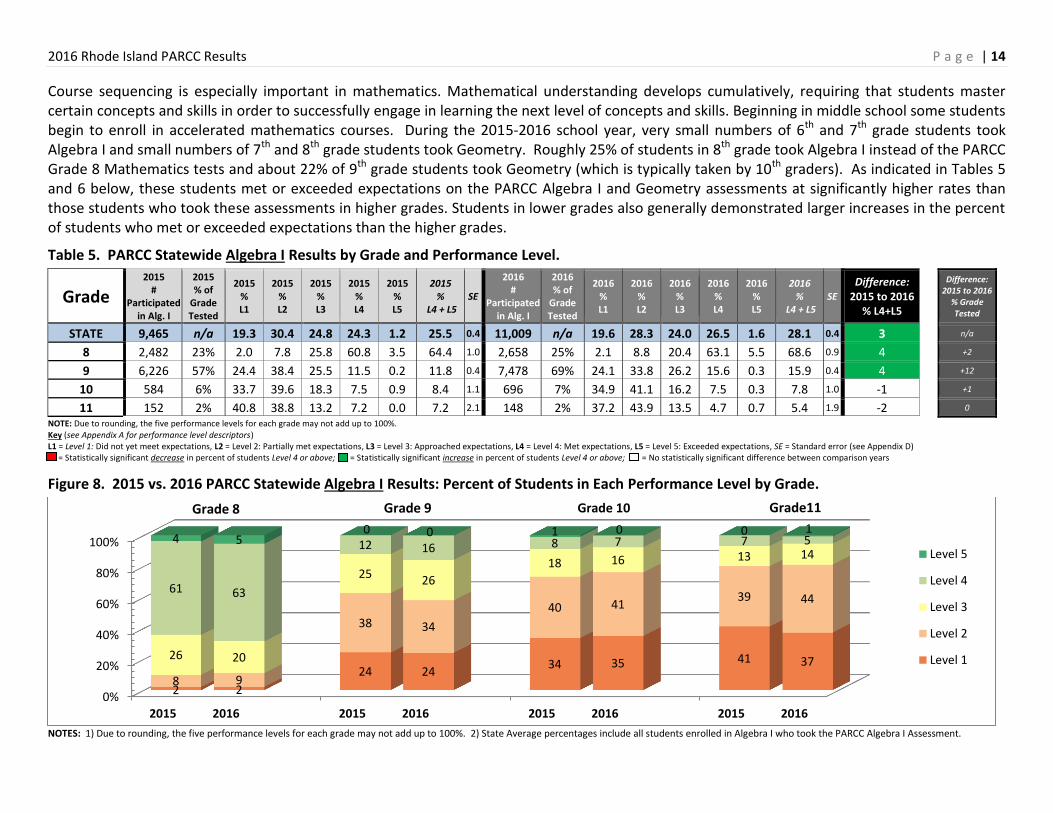
Course sequencing is especially important in mathematics. Mathematical understanding develops cumulatively, requiring that students master certain concepts and skills in order to successfully engage in learning the next level of concepts and skills. Beginning in middle school some students begin to enroll in accelerated mathematics courses. During the 2015-2016 school year, very small numbers of 6th and 7th grade students took Algebra I and small numbers of 7th and 8th grade students took Geometry. Roughly 25% of students in 8th grade took Algebra I instead of the PARCC Grade 8 Mathematics tests and about 22% of 9th grade students took Geometry (which is typically taken by 10th graders). As indicated in Tables 5 and 6 below, these students met or exceeded expectations on the PARCC Algebra I and Geometry assessments at significantly higher rates than those students who took these assessments in higher grades. Students in lower grades also generally demonstrated larger increases in the percent of students who met or exceeded expectations than the higher grades.
Table 5. PARCC Statewide Algebra I Results by Grade and Performance Level.
Grade 2015
# Participated
in Alg. I
2015 % of
Grade Tested
2015 % L1
2015 % L2
2015 % L3
2015 % L4
2015 % L5
2015 %
L4 + L5 SE
2016 #
Participated in Alg. I
2016 % of
Grade Tested
2016 % L1
2016 % L2
2016 % L3
2016 % L4
2016 % L5
2016 %
L4 + L5 SE
Difference: 2015 to 2016
% L4+L5
Difference: 2015 to 2016
% Grade Tested
STATE 9,465 n/a 19.3 30.4 24.8 24.3 1.2 25.5 0.4 11,009 n/a 19.6 28.3 24.0 26.5 1.6 28.1 0.4 3 n/a
8 2,482 23% 2.0 7.8 25.8 60.8 3.5 64.4 1.0 2,658 25% 2.1 8.8 20.4 63.1 5.5 68.6 0.9 4 +2
9 6,226 57% 24.4 38.4 25.5 11.5 0.2 11.8 0.4 7,478 69% 24.1 33.8 26.2 15.6 0.3 15.9 0.4 4 +12
10 584 6% 33.7 39.6 18.3 7.5 0.9 8.4 1.1 696 7% 34.9 41.1 16.2 7.5 0.3 7.8 1.0 -1 +1
11 152 2% 40.8 38.8 13.2 7.2 0.0 7.2 2.1 148 2% 37.2 43.9 13.5 4.7 0.7 5.4 1.9 -2 0
NOTE: Due to rounding, the five performance levels for each grade may not add up to 100%. Key (see Appendix A for performance level descriptors) L1 = Level 1: Did not yet meet expectations, L2 = Level 2: Partially met expectations, L3 = Level 3: Approached expectations, L4 = Level 4: Met expectations, L5 = Level 5: Exceeded expectations, SE = Standard error (see Appendix D) = Statistically significant decrease in percent of students Level 4 or above; = Statistically significant increase in percent of students Level 4 or above; = No statistically significant difference between comparison years
Figure 8. 2015 vs. 2016 PARCC Statewide Algebra I Results: Percent of Students in Each Performance Level by Grade.
NOTES: 1) Due to rounding, the five performance levels for each grade may not add up to 100%. 2) State Average percentages include all students enrolled in Algebra I who took the PARCC Algebra I Assessment.
0%
20%
40%
60%
80%
100%
2015 2016 2015 2016 2015 2016 2015 2016
2 2
24 24 34 35 41 37
8 9
38 34
40 41 39 44
26 20
25 26
18 16 13 14
61 63
12 16 8 7 7 5 4 5 0 0 1 0 0 1
Grade 8
Level 5
Level 4
Level 3
Level 2
Level 1
Grade 9 Grade 10 Grade11
2016 Rhode Island PARCC Results P a g e | 15
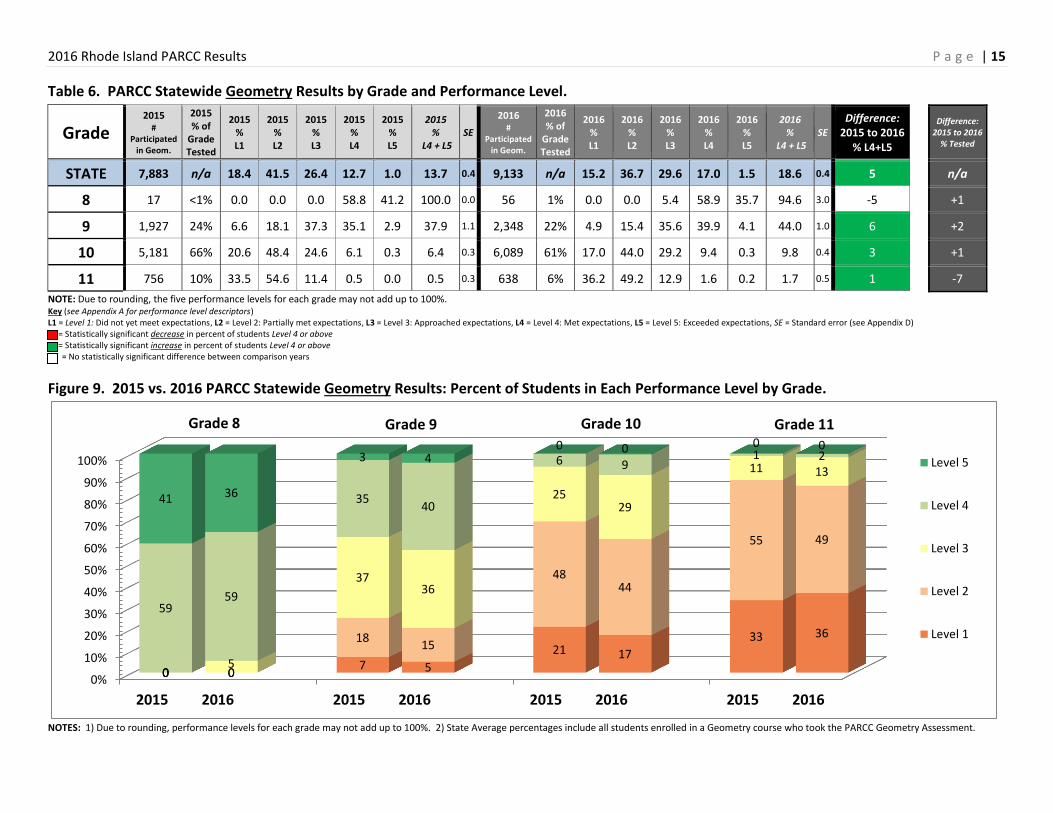
Table 6. PARCC Statewide Geometry Results by Grade and Performance Level.
Grade 2015
# Participated
in Geom.
2015 % of
Grade Tested
2015 % L1
2015 % L2
2015 % L3
2015 % L4
2015 % L5
2015 %
L4 + L5 SE
2016 #
Participated in Geom.
2016 % of
Grade Tested
2016 % L1
2016 % L2
2016 % L3
2016 % L4
2016 % L5
2016 %
L4 + L5 SE
Difference: 2015 to 2016
% L4+L5
Difference:
2015 to 2016 % Tested
STATE 7,883 n/a 18.4 41.5 26.4 12.7 1.0 13.7 0.4 9,133 n/a 15.2 36.7 29.6 17.0 1.5 18.6 0.4 5 n/a
8 17 <1% 0.0 0.0 0.0 58.8 41.2 100.0 0.0 56 1% 0.0 0.0 5.4 58.9 35.7 94.6 3.0 -5 +1
9 1,927 24% 6.6 18.1 37.3 35.1 2.9 37.9 1.1 2,348 22% 4.9 15.4 35.6 39.9 4.1 44.0 1.0 6 +2
10 5,181 66% 20.6 48.4 24.6 6.1 0.3 6.4 0.3 6,089 61% 17.0 44.0 29.2 9.4 0.3 9.8 0.4 3 +1
11 756 10% 33.5 54.6 11.4 0.5 0.0 0.5 0.3 638 6% 36.2 49.2 12.9 1.6 0.2 1.7 0.5 1 -7
NOTE: Due to rounding, the five performance levels for each grade may not add up to 100%. Key (see Appendix A for performance level descriptors) L1 = Level 1: Did not yet meet expectations, L2 = Level 2: Partially met expectations, L3 = Level 3: Approached expectations, L4 = Level 4: Met expectations, L5 = Level 5: Exceeded expectations, SE = Standard error (see Appendix D) = Statistically significant decrease in percent of students Level 4 or above = Statistically significant increase in percent of students Level 4 or above = No statistically significant difference between comparison years
Figure 9. 2015 vs. 2016 PARCC Statewide Geometry Results: Percent of Students in Each Performance Level by Grade.
NOTES: 1) Due to rounding, performance levels for each grade may not add up to 100%. 2) State Average percentages include all students enrolled in a Geometry course who took the PARCC Geometry Assessment.
0%
10%
20%
30%
40%
50%
60%
70%
80%
90%
100%
2015 2016 2015 2016 2015 2016 2015 2016
0 0 7 5
21 17
33 36
0 0
18 15
48 44
55 49
0 5
37 36
25 29
11 13
59 59
35 40
6 9 1 2
41 36
3 4 0 0 0 0
Grade 8
Level 5
Level 4
Level 3
Level 2
Level 1
Grade 9 Grade 10 Grade 11
2016 Rhode Island PARCC Results P a g e | 16
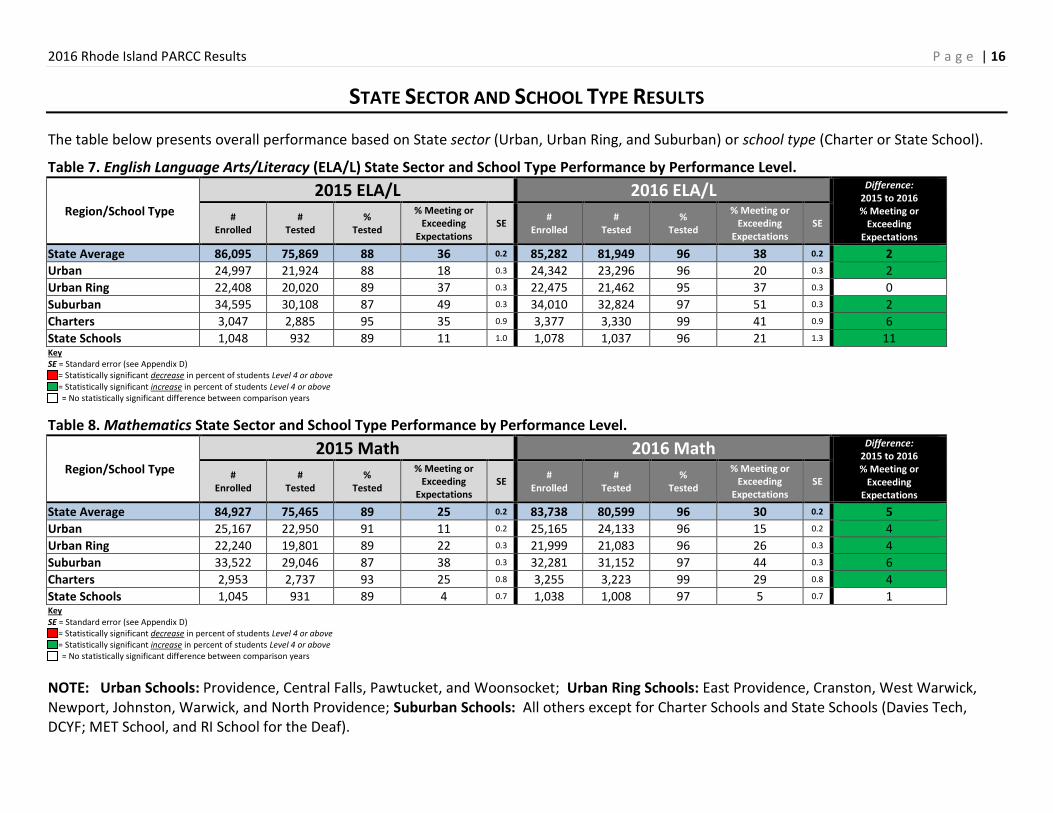
STATE SECTOR AND SCHOOL TYPE RESULTS
The table below presents overall performance based on State sector (Urban, Urban Ring, and Suburban) or school type (Charter or State School).
Table 7. English Language Arts/Literacy (ELA/L) State Sector and School Type Performance by Performance Level.
Region/School Type
2015 ELA/L 2016 ELA/L Difference: 2015 to 2016 % Meeting or
Exceeding Expectations
# Enrolled
# Tested
% Tested
% Meeting or Exceeding
Expectations SE
# Enrolled
# Tested
% Tested
% Meeting or Exceeding
Expectations SE
State Average 86,095 75,869 88 36 0.2 85,282 81,949 96 38 0.2 2
Urban 24,997 21,924 88 18 0.3 24,342 23,296 96 20 0.3 2
Urban Ring 22,408 20,020 89 37 0.3 22,475 21,462 95 37 0.3 0
Suburban 34,595 30,108 87 49 0.3 34,010 32,824 97 51 0.3 2
Charters 3,047 2,885 95 35 0.9 3,377 3,330 99 41 0.9 6
State Schools 1,048 932 89 11 1.0 1,078 1,037 96 21 1.3 11 Key SE = Standard error (see Appendix D) = Statistically significant decrease in percent of students Level 4 or above = Statistically significant increase in percent of students Level 4 or above = No statistically significant difference between comparison years
Table 8. Mathematics State Sector and School Type Performance by Performance Level.
Region/School Type
2015 Math 2016 Math Difference: 2015 to 2016 % Meeting or
Exceeding Expectations
# Enrolled
# Tested
% Tested
% Meeting or Exceeding
Expectations SE
# Enrolled
# Tested
% Tested
% Meeting or Exceeding
Expectations SE
State Average 84,927 75,465 89 25 0.2 83,738 80,599 96 30 0.2 5
Urban 25,167 22,950 91 11 0.2 25,165 24,133 96 15 0.2 4
Urban Ring 22,240 19,801 89 22 0.3 21,999 21,083 96 26 0.3 4
Suburban 33,522 29,046 87 38 0.3 32,281 31,152 97 44 0.3 6
Charters 2,953 2,737 93 25 0.8 3,255 3,223 99 29 0.8 4
State Schools 1,045 931 89 4 0.7 1,038 1,008 97 5 0.7 1 Key SE = Standard error (see Appendix D) = Statistically significant decrease in percent of students Level 4 or above = Statistically significant increase in percent of students Level 4 or above = No statistically significant difference between comparison years
NOTE: Urban Schools: Providence, Central Falls, Pawtucket, and Woonsocket; Urban Ring Schools: East Providence, Cranston, West Warwick, Newport, Johnston, Warwick, and North Providence; Suburban Schools: All others except for Charter Schools and State Schools (Davies Tech, DCYF; MET School, and RI School for the Deaf).
2016 Rhode Island PARCC Results P a g e | 17
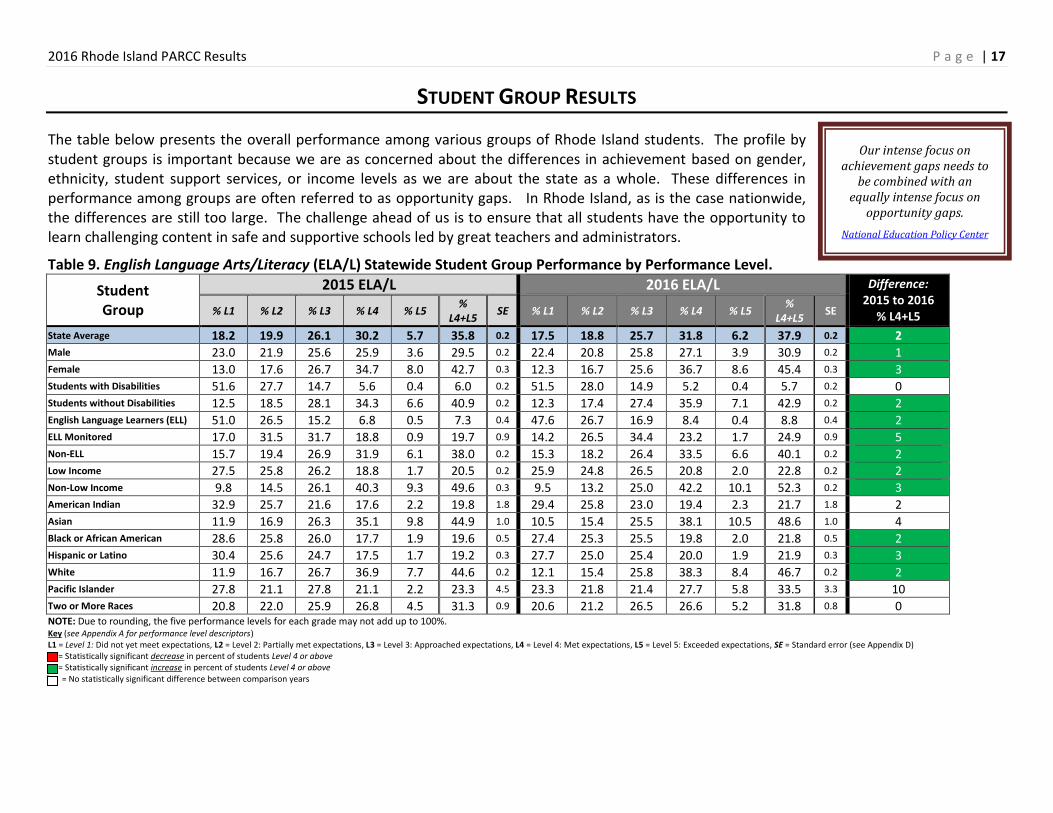
STUDENT GROUP RESULTS
The table below presents the overall performance among various groups of Rhode Island students. The profile by student groups is important because we are as concerned about the differences in achievement based on gender, ethnicity, student support services, or income levels as we are about the state as a whole. These differences in performance among groups are often referred to as opportunity gaps. In Rhode Island, as is the case nationwide, the differences are still too large. The challenge ahead of us is to ensure that all students have the opportunity to learn challenging content in safe and supportive schools led by great teachers and administrators.
Table 9. English Language Arts/Literacy (ELA/L) Statewide Student Group Performance by Performance Level.
Student Group
2015 ELA/L 2016 ELA/L Difference: 2015 to 2016
% L4+L5 % L1 % L2 % L3 % L4 % L5 %
L4+L5 SE % L1 % L2 % L3 % L4 % L5
% L4+L5
SE
State Average 18.2 19.9 26.1 30.2 5.7 35.8 0.2 17.5 18.8 25.7 31.8 6.2 37.9 0.2 2 Male 23.0 21.9 25.6 25.9 3.6 29.5 0.2 22.4 20.8 25.8 27.1 3.9 30.9 0.2 1 Female 13.0 17.6 26.7 34.7 8.0 42.7 0.3 12.3 16.7 25.6 36.7 8.6 45.4 0.3 3 Students with Disabilities 51.6 27.7 14.7 5.6 0.4 6.0 0.2 51.5 28.0 14.9 5.2 0.4 5.7 0.2 0 Students without Disabilities 12.5 18.5 28.1 34.3 6.6 40.9 0.2 12.3 17.4 27.4 35.9 7.1 42.9 0.2 2 English Language Learners (ELL) 51.0 26.5 15.2 6.8 0.5 7.3 0.4 47.6 26.7 16.9 8.4 0.4 8.8 0.4 2 ELL Monitored 17.0 31.5 31.7 18.8 0.9 19.7 0.9 14.2 26.5 34.4 23.2 1.7 24.9 0.9 5 Non-ELL 15.7 19.4 26.9 31.9 6.1 38.0 0.2 15.3 18.2 26.4 33.5 6.6 40.1 0.2 2 Low Income 27.5 25.8 26.2 18.8 1.7 20.5 0.2 25.9 24.8 26.5 20.8 2.0 22.8 0.2 2 Non-Low Income 9.8 14.5 26.1 40.3 9.3 49.6 0.3 9.5 13.2 25.0 42.2 10.1 52.3 0.2 3 American Indian 32.9 25.7 21.6 17.6 2.2 19.8 1.8 29.4 25.8 23.0 19.4 2.3 21.7 1.8 2 Asian 11.9 16.9 26.3 35.1 9.8 44.9 1.0 10.5 15.4 25.5 38.1 10.5 48.6 1.0 4 Black or African American 28.6 25.8 26.0 17.7 1.9 19.6 0.5 27.4 25.3 25.5 19.8 2.0 21.8 0.5 2 Hispanic or Latino 30.4 25.6 24.7 17.5 1.7 19.2 0.3 27.7 25.0 25.4 20.0 1.9 21.9 0.3 3 White 11.9 16.7 26.7 36.9 7.7 44.6 0.2 12.1 15.4 25.8 38.3 8.4 46.7 0.2 2 Pacific Islander 27.8 21.1 27.8 21.1 2.2 23.3 4.5 23.3 21.8 21.4 27.7 5.8 33.5 3.3 10 Two or More Races 20.8 22.0 25.9 26.8 4.5 31.3 0.9 20.6 21.2 26.5 26.6 5.2 31.8 0.8 0 NOTE: Due to rounding, the five performance levels for each grade may not add up to 100%. Key (see Appendix A for performance level descriptors) L1 = Level 1: Did not yet meet expectations, L2 = Level 2: Partially met expectations, L3 = Level 3: Approached expectations, L4 = Level 4: Met expectations, L5 = Level 5: Exceeded expectations, SE = Standard error (see Appendix D) = Statistically significant decrease in percent of students Level 4 or above = Statistically significant increase in percent of students Level 4 or above = No statistically significant difference between comparison years
Our intense focus on achievement gaps needs to
be combined with an equally intense focus on
opportunity gaps.
National Education Policy Center
2016 Rhode Island PARCC Results P a g e | 18
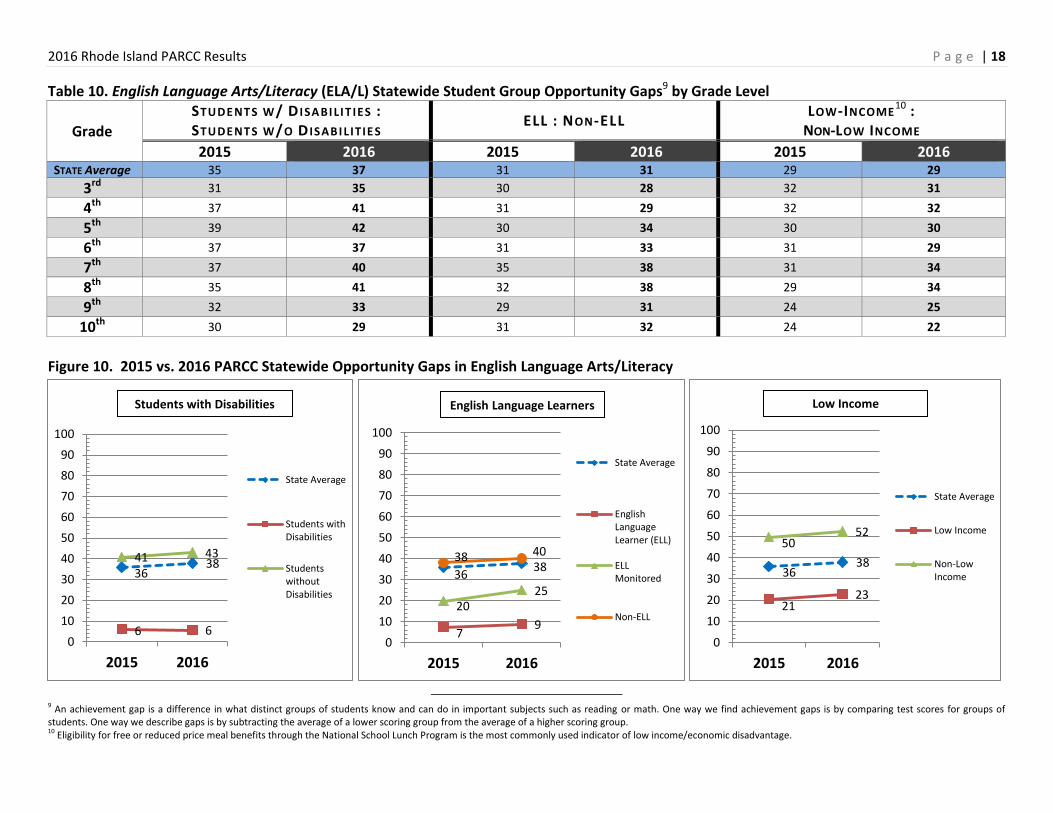
Table 10. English Language Arts/Literacy (ELA/L) Statewide Student Group Opportunity Gaps9 by Grade Level
Grade
STUDE NTS W/ D I SA BILIT IES : STUDE NTS W/O D ISABIL ITIE S
ELL : NON-ELL LOW-INCOME
10 :
NON-LOW INCOME
2015 2016 2015 2016 2015 2016 STATE Average 35 37 31 31 29 29
3rd 31 35 30 28 32 31
4th 37 41 31 29 32 32
5th 39 42 30 34 30 30
6th 37 37 31 33 31 29
7th 37 40 35 38 31 34
8th 35 41 32 38 29 34
9th 32 33 29 31 24 25
10th 30 29 31 32 24 22
Figure 10. 2015 vs. 2016 PARCC Statewide Opportunity Gaps in English Language Arts/Literacy
9 An achievement gap is a difference in what distinct groups of students know and can do in important subjects such as reading or math. One way we find achievement gaps is by comparing test scores for groups of students. One way we describe gaps is by subtracting the average of a lower scoring group from the average of a higher scoring group. 10 Eligibility for free or reduced price meal benefits through the National School Lunch Program is the most commonly used indicator of low income/economic disadvantage.
36 38
6 6
41 43
0
10
20
30
40
50
60
70
80
90
100
2015 2016
State Average
Students withDisabilities
StudentswithoutDisabilities
36 38
7 9
20 25
38 40
0
10
20
30
40
50
60
70
80
90
100
2015 2016
State Average
EnglishLanguageLearner (ELL)
ELLMonitored
Non-ELL
English Language Learners
36 38
21 23
50 52
0
10
20
30
40
50
60
70
80
90
100
2015 2016
State Average
Low Income
Non-LowIncome
Low Income Students with Disabilities
2016 Rhode Island PARCC Results P a g e | 19
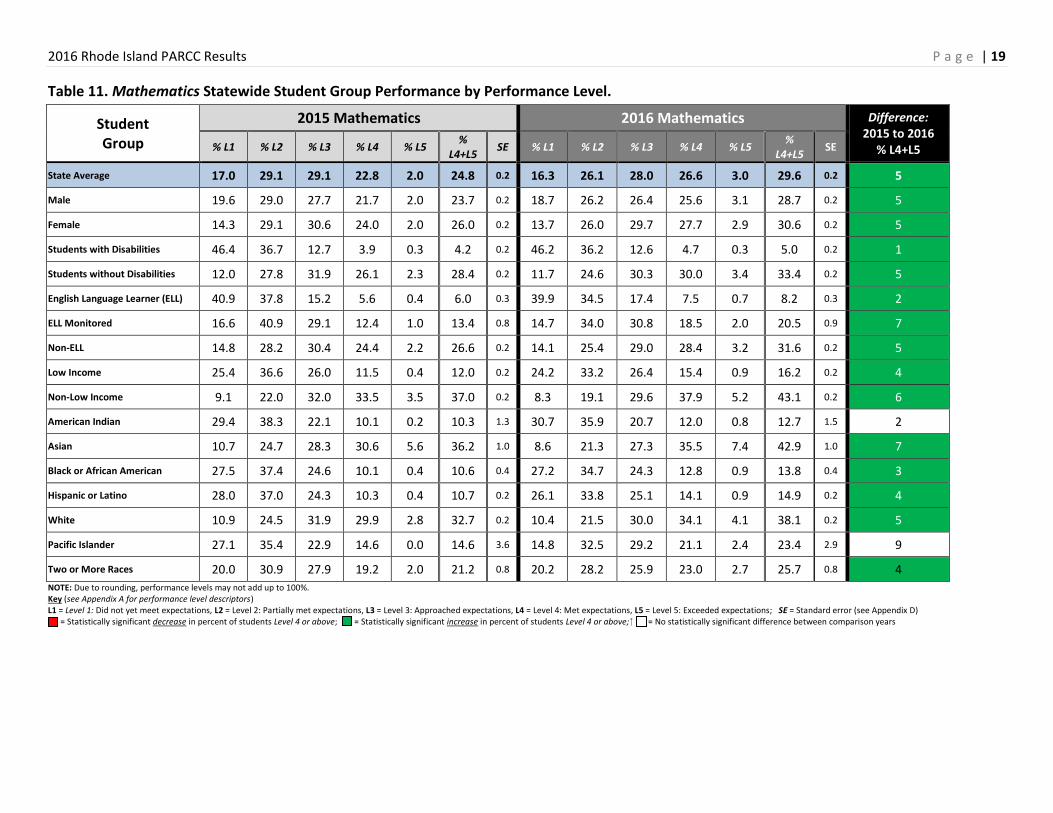
Table 11. Mathematics Statewide Student Group Performance by Performance Level.
Student Group
2015 Mathematics 2016 Mathematics Difference: 2015 to 2016
% L4+L5 % L1 % L2 % L3 % L4 % L5 %
L4+L5 SE % L1 % L2 % L3 % L4 % L5
% L4+L5
SE
State Average 17.0 29.1 29.1 22.8 2.0 24.8 0.2 16.3 26.1 28.0 26.6 3.0 29.6 0.2 5
Male 19.6 29.0 27.7 21.7 2.0 23.7 0.2 18.7 26.2 26.4 25.6 3.1 28.7 0.2 5
Female 14.3 29.1 30.6 24.0 2.0 26.0 0.2 13.7 26.0 29.7 27.7 2.9 30.6 0.2 5
Students with Disabilities 46.4 36.7 12.7 3.9 0.3 4.2 0.2 46.2 36.2 12.6 4.7 0.3 5.0 0.2 1
Students without Disabilities 12.0 27.8 31.9 26.1 2.3 28.4 0.2 11.7 24.6 30.3 30.0 3.4 33.4 0.2 5
English Language Learner (ELL) 40.9 37.8 15.2 5.6 0.4 6.0 0.3 39.9 34.5 17.4 7.5 0.7 8.2 0.3 2
ELL Monitored 16.6 40.9 29.1 12.4 1.0 13.4 0.8 14.7 34.0 30.8 18.5 2.0 20.5 0.9 7
Non-ELL 14.8 28.2 30.4 24.4 2.2 26.6 0.2 14.1 25.4 29.0 28.4 3.2 31.6 0.2 5
Low Income 25.4 36.6 26.0 11.5 0.4 12.0 0.2 24.2 33.2 26.4 15.4 0.9 16.2 0.2 4
Non-Low Income 9.1 22.0 32.0 33.5 3.5 37.0 0.2 8.3 19.1 29.6 37.9 5.2 43.1 0.2 6
American Indian 29.4 38.3 22.1 10.1 0.2 10.3 1.3 30.7 35.9 20.7 12.0 0.8 12.7 1.5 2
Asian 10.7 24.7 28.3 30.6 5.6 36.2 1.0 8.6 21.3 27.3 35.5 7.4 42.9 1.0 7
Black or African American 27.5 37.4 24.6 10.1 0.4 10.6 0.4 27.2 34.7 24.3 12.8 0.9 13.8 0.4 3
Hispanic or Latino 28.0 37.0 24.3 10.3 0.4 10.7 0.2 26.1 33.8 25.1 14.1 0.9 14.9 0.2 4
White 10.9 24.5 31.9 29.9 2.8 32.7 0.2 10.4 21.5 30.0 34.1 4.1 38.1 0.2 5
Pacific Islander 27.1 35.4 22.9 14.6 0.0 14.6 3.6 14.8 32.5 29.2 21.1 2.4 23.4 2.9 9
Two or More Races 20.0 30.9 27.9 19.2 2.0 21.2 0.8 20.2 28.2 25.9 23.0 2.7 25.7 0.8 4
NOTE: Due to rounding, performance levels may not add up to 100%. Key (see Appendix A for performance level descriptors) L1 = Level 1: Did not yet meet expectations, L2 = Level 2: Partially met expectations, L3 = Level 3: Approached expectations, L4 = Level 4: Met expectations, L5 = Level 5: Exceeded expectations; SE = Standard error (see Appendix D) = Statistically significant decrease in percent of students Level 4 or above; = Statistically significant increase in percent of students Level 4 or above; = No statistically significant difference between comparison years
2016 Rhode Island PARCC Results P a g e | 20
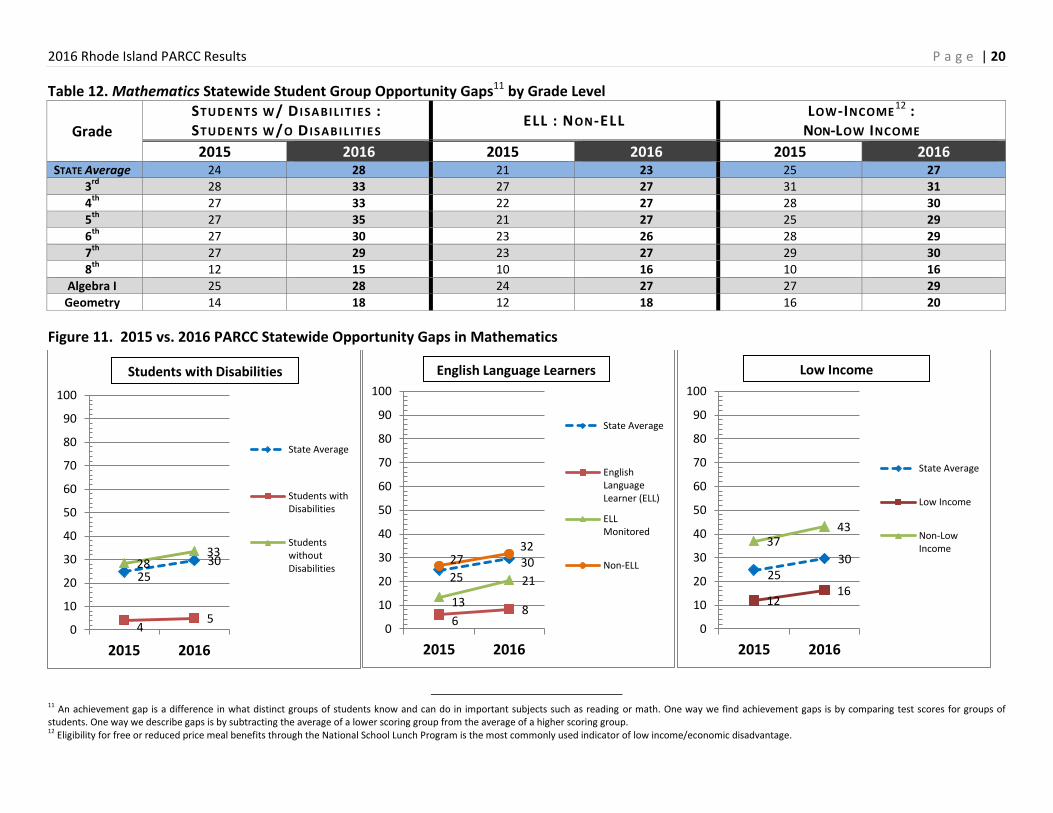
Table 12. Mathematics Statewide Student Group Opportunity Gaps11 by Grade Level
Grade
STUDE NTS W/ D I SA BILIT IES : STUDE NTS W/O D ISABIL ITIE S
ELL : NON-ELL LOW-INCOME
12 :
NON-LOW INCOME
2015 2016 2015 2016 2015 2016 STATE Average 24 28 21 23 25 27
3rd
28 33 27 27 31 31
4th
27 33 22 27 28 30
5th
27 35 21 27 25 29
6th
27 30 23 26 28 29
7th
27 29 23 27 29 30 8
th 12 15 10 16 10 16
Algebra I 25 28 24 27 27 29
Geometry 14 18 12 18 16 20
Figure 11. 2015 vs. 2016 PARCC Statewide Opportunity Gaps in Mathematics
11 An achievement gap is a difference in what distinct groups of students know and can do in important subjects such as reading or math. One way we find achievement gaps is by comparing test scores for groups of students. One way we describe gaps is by subtracting the average of a lower scoring group from the average of a higher scoring group. 12 Eligibility for free or reduced price meal benefits through the National School Lunch Program is the most commonly used indicator of low income/economic disadvantage.
25 30
4 5
28 33
0
10
20
30
40
50
60
70
80
90
100
2015 2016
State Average
Students withDisabilities
StudentswithoutDisabilities
Students with Disabilities
25 30
6 8
13
21
27 32
0
10
20
30
40
50
60
70
80
90
100
2015 2016
State Average
EnglishLanguageLearner (ELL)
ELLMonitored
Non-ELL
English Language Learners
25 30
12 16
37 43
0
10
20
30
40
50
60
70
80
90
100
2015 2016
State Average
Low Income
Non-LowIncome
Low Income
2016 Rhode Island PARCC Results P a g e | 21
CONNECTIONS TO TEACHING AND LEARNING
State assessments are part of a larger system of teaching and learning. In isolation, assessment results cannot improve student achievement. Their power is realized when the results are reviewed against a school’s curriculum, instructional practices, student work, grading practices, along with other local data and then action on this analysis is taken. Last year established Rhode Island’s baseline for the percentage of students meeting expectations of the standards. This year, we are able to see where we are in relation to this baseline and whether we are heading in the right direction or need to make further adjustments. The work ahead of us is to use this information as one tool for the State, districts, schools, as well as parents and other stakeholders to work together to advocate for and support improved student learning.
Families can use the results to engage their child in conversations about school and his or her progress.13 Families can work with their child’s teacher(s) to understand the report within the context of many other indicators of student learning. Finally, collectively, families can work within their school community to help shape the school’s goals and planning.
Teachers can use this year’s results to reflect on the instructional shifts they have made in comparison to their students’ performance on the assessment. Student performance overall, on subclaims and on specific assessment questions may help them evaluate materials, supports, and curriculum they have used. The process of reviewing is best done in partnership with teachers working at the same grade level or instructing the same course. The collective analysis along with feedback through the evaluation process should shape ongoing professional learning.
Schools can use this information to look at patterns across grade levels and between student groups to make informed curriculum decisions, ensure that all students have the opportunity to learn, engage parents, and to make decisions that guarantee that all students are placed with teachers who can meet their needs.
Districts can use the results to review each school’s performance to identify which supports and resources best meet the needs of their students. Districts can review patterns of performance between schools to identify those that need additional support. The results of these analyses can be used to engage the community on plans to move the district and its schools forward.
13
More information on PARCC score reports for students is available online at www.UnderstandTheScore.org
Assessments should be used in service of teaching and learning. They are the starting
point for our work- not the conclusion.
2016 Rhode Island PARCC Results P a g e | 22
ENGLISH LANGUAGE ARTS/LITERACY
The College and Career Standards or Anchor Standards for English Language Arts & Literacy in History/Social Studies, Science, and Technical Subjects (ELA/Literacy) articulate what students should know and be able to do upon completion of high school. The anchor standards in conjunction with the grade level expectations “are necessary complements – the former providing broad standards, the latter providing additional specificity – that together define the skills and understandings that all students must demonstrate.”14 In order for our high school students to demonstrate mastery of the College and Career Readiness Standards in ELA/Literacy, we must begin in Kindergarten to build student understanding as they progress through the grades.
Continuing to delve into the CCSS for ELA/Literacy it becomes evident that these standards are explicitly and deliberately organized. The standards explicitly identify Reading, Writing, Speaking and Listening, and Foundational Reading expectations for all students (K-12). By this very nature, how students demonstrate understanding of these expectations should not be in isolation but rather interconnected across reading, writing and speaking and listening.
When exploring the Common Core State Standards for ELA/Literacy one likely encounters familiar content from their own school experience and/or perhaps the experience of their child. Within the Common Core State Standards (CCSS), reading informational text and literary text are present; while students are asked among other things to identify main ideas, summarize their reading, analyze characters or settings, and investigate themes. This very content is present within questions that our students encounter on the PARCC ELA/Literacy Assessment. The texts students encounter vary in their rigor and expectation of students; but their outcome is an opportunity for students to demonstrate their understanding.
Let’s look closely at Grade 5 which is often considered a pivotal year as it is the conclusion of a student’s elementary school career in many districts in Rhode Island. We often refer to Grade 5 as the “year of the multiples.” For example, 5th graders are not only expected to identify and describe characters but the students need to compare and contrast two or more characters, events, settings (RL.5.3) within a literary text. Fifth graders need to determine not just one main idea but two or more main ideas within an informational text. Additionally, within the trajectory of the standards, 5th grade students are really starting to think about the author’s craft by explaining “how” the author supports two or more main ideas (RI.5.2). This is more than just identifying key details that support the main ideas; but rather, asks students to delve deeper into how the author supports his/her ideas with the key details.
When faced with the challenge of instructing students at this grade level, readily accessible texts such as Esperanza Rising by Pam Muñoz Ryan provide students two settings to explore within the text. The following lesson from engageny (https://www.engageny.org/resource/grade-5-ela-
14
For more information, go to http://www.corestandards.org/ELA-Literacy/CCRA/R/
CCSS for ELA/Literacy explicitly identify Reading, Writing, Speaking
and Listening, and Foundational Reading expectations for all
students (K-12).
Common Core State Standards for ELA/Literacy
2016 Rhode Island PARCC Results P a g e | 23
module-1-unit-2-lesson-6) has students comparing and contrasting California to Mexico. Many literary texts within a typical 5th grade curriculum include multiple characters, multiple events, and/or multiple settings. The key to instruction at this grade level is not only identifying the main character’s motivations, traits, thoughts, words, and actions but comparing/contrasting these with another robust character within the text. Graphic organizers such as a Venn diagram, Three Column Charts, etc. serve to organize a student’s thinking as they work through their analysis of the characters.
The following lesson from LearnZillion, https://learnzillion.com/lesson_plans/8338 uses a Venn diagram to assist students in organizing thoughts as character are compared and contrasted. This lesson demonstrates how to identify character traits by looking at how the characters interact with each other and the events. Then the lesson walks students through how to identify the similarities and differences in these traits. This is followed by the development of a statement about the characters that is supported by details from the text. Similar graphic organizers may be used as students are asked to identify multiple events or multiple settings to compare and contrast within other texts. When using excerpts or short stories, educators must use their expertise to select texts that include “multiples” for instruction and practice with this standard in Grade 5.
Many robust informational texts in the 5th grade curriculum contain two or more main ideas. The key to selecting text for instruction and practice for standard RI.5.2 is providing texts that contain multiple main ideas that are clearly distinct from one another. Key details should also be present that can be identified as belonging a specific main idea. Students should be able to clearly identify key details that belong to each main idea. However, instruction and practice cannot end there. 5th graders are expected to explain how those key details support the main idea. Key details could be comparing ideas/events, describing the idea in greater depth, listing examples, explaining the cause/effect relationship, sequencing the steps that created the problem, quoting experts, etc.
Another standard in Grade 5 which requires students to think critically about how a text is put together is RI.5.8. This standard asks students to explain how an author uses reasons and evidence to support particular points in a text, identifying which reasons and evidence support which point(s). Again, the key words within this standard are “how an author uses...”. Students need to be able to explain how the reasons/evidence support the idea/point within a text and clearly delineate which reason/evidence supports which point the author is making. The following lesson from LearnZillion, https://learnzillion.com/lesson_plans/7693, utilizes a newspaper article that articulates the benefits of playing outside in the dirt to show students how to explain the point an author wants to convey by identifying the reasons and evidence that support that point.
When studying and analyzing the standards in depth, the PARCC released items and PARCC practice tests can assist students, teachers, and families in understanding how their students are expected to demonstrate their understanding of the standards on the PARCC assessment. As we continue the study of students expectations, some resources that are helpful to bridge the PARCC resources with everyday implementation include but are not limited to, engageny and LearnZillion mentioned previously, as well as, Reading Lessons, the Think and Write Activities, and Annotated Student Work at http://achievethecore.org , along with Novel Units and Passages at www.readworks.org. Lastly, it is important to remember, that the PARCC assessment is but one assessment within the broader picture of a student’s education and should be confirming what we already know about our students. It is one data point to help further our study of student expectations and inform how best to instruct our students.
2016 Rhode Island PARCC Results P a g e | 24
MATHEMATICS
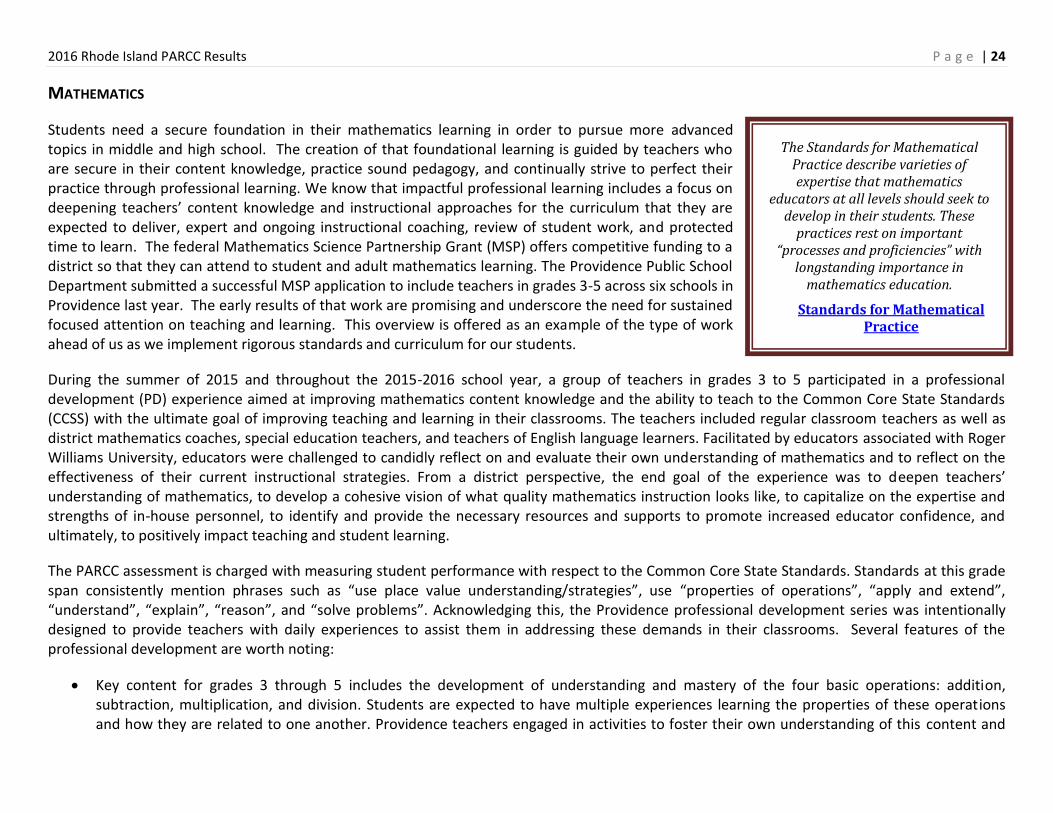
Students need a secure foundation in their mathematics learning in order to pursue more advanced topics in middle and high school. The creation of that foundational learning is guided by teachers who are secure in their content knowledge, practice sound pedagogy, and continually strive to perfect their practice through professional learning. We know that impactful professional learning includes a focus on deepening teachers’ content knowledge and instructional approaches for the curriculum that they are expected to deliver, expert and ongoing instructional coaching, review of student work, and protected time to learn. The federal Mathematics Science Partnership Grant (MSP) offers competitive funding to a district so that they can attend to student and adult mathematics learning. The Providence Public School Department submitted a successful MSP application to include teachers in grades 3-5 across six schools in Providence last year. The early results of that work are promising and underscore the need for sustained focused attention on teaching and learning. This overview is offered as an example of the type of work ahead of us as we implement rigorous standards and curriculum for our students.
During the summer of 2015 and throughout the 2015-2016 school year, a group of teachers in grades 3 to 5 participated in a professional development (PD) experience aimed at improving mathematics content knowledge and the ability to teach to the Common Core State Standards (CCSS) with the ultimate goal of improving teaching and learning in their classrooms. The teachers included regular classroom teachers as well as district mathematics coaches, special education teachers, and teachers of English language learners. Facilitated by educators associated with Roger Williams University, educators were challenged to candidly reflect on and evaluate their own understanding of mathematics and to reflect on the effectiveness of their current instructional strategies. From a district perspective, the end goal of the experience was to deepen teachers’ understanding of mathematics, to develop a cohesive vision of what quality mathematics instruction looks like, to capitalize on the expertise and strengths of in-house personnel, to identify and provide the necessary resources and supports to promote increased educator confidence, and ultimately, to positively impact teaching and student learning.
The PARCC assessment is charged with measuring student performance with respect to the Common Core State Standards. Standards at this grade span consistently mention phrases such as “use place value understanding/strategies”, use “properties of operations”, “apply and extend”, “understand”, “explain”, “reason”, and “solve problems”. Acknowledging this, the Providence professional development series was intentionally designed to provide teachers with daily experiences to assist them in addressing these demands in their classrooms. Several features of the professional development are worth noting:
Key content for grades 3 through 5 includes the development of understanding and mastery of the four basic operations: addition, subtraction, multiplication, and division. Students are expected to have multiple experiences learning the properties of these operations and how they are related to one another. Providence teachers engaged in activities to foster their own understanding of this content and
The Standards for Mathematical Practice describe varieties of expertise that mathematics
educators at all levels should seek to develop in their students. These
practices rest on important “processes and proficiencies” with
longstanding importance in mathematics education.
Standards for Mathematical Practice
2016 Rhode Island PARCC Results P a g e | 25
worked with strategies to help enhance their students’ learning. Tables 1 and 2 from the glossary of the CCSS served as the basis for some of these investigations. Participants were asked to use the tables to classify a sampling of operational problems. The activity increased teachers’ awareness of problem types, the level of the problem’s complexity, and the importance of providing varied experiences with the formatting of equations thus promoting a greater student understanding of the meaning of the equal sign (e.g. 3 + ? = 5, ? + 3 = 5, and 5 = 3 + ?). The power of the tape diagram as a tool for solving one type of problem, comparison problems, was illustrated and embraced by teachers. This is an effective model that surfaces again in the middle grades and is very useful in solving ratio and proportion problems.. Engage NY has resources which provide an introduction to tape diagrams and examples of problems using tape diagrams. Additionally, it has strong links to the number line which is a prevalent model in the CCSS.
The understanding of mathematics is of paramount importance in the CCSS and as measured by PARCC. While fluency with the algorithms for the four basic operations is the ultimate goal, student understanding of how the operations work is the foundation for success with those operations and is enhanced by the investigation of alternative algorithms. LearnZillion provides a lesson plan on the use of partial sums to solve addition problems. For example, Providence teachers learned the value of decomposing numbers to allow students to work with numbers in a way that makes sense to them in order to promote this operational understanding. Another Engage NY resource is a video of a class lesson on composing and decomposing numbers. Knowing that students are not responsible for mastery of the standard algorithms for addition and subtraction with multi-digit whole numbers until the end of grade 4 allows teachers and students the time to engage in “number play” laying the groundwork for fully understanding why an algorithm works and why it is deemed more efficient.
Part of the professional development journey involved collaborative design of model lessons. Same-grade level teachers met together to design, execute, and critique classroom lessons. During the process teachers considered the implications of the standards that would be addressed in the upcoming lesson – what pre-knowledge should be in place, what is the rigor requirement of the standard, what misconceptions might students have with respect to the content. Activities were planned with an eye on differentiation, student engagement, incorporation of the relevant Standards for Mathematical Practice, formative assessment, and opportunities for students to reason, explain, and solve meaningful problems. As one teacher and/or coach delivered the lesson, peers used a structured tool to comment on the mathematics of the lesson. A debrief involving self-reflection and data collected from the observational tool then occurred. Providence developed a protocol for educators to follow through this process.
As a result of this professional development experience, Providence leadership believes that the participating schools have undergone a culture shift regarding instruction in mathematics. Teachers acknowledge the power of deeply understanding the content they teach. They are excited about providing engaging lessons that promote student voice, reasoning, and conceptual understanding. They embrace the use of non-routine problems for students to explore the mathematics and present multiple strategies and models to solve those problems. They are eager to continue collaborating with their peers and district coaches and to think of their instruction as being standards-driven instead of textbook driven. They believe if they continue the journey they began in the summer of 2015 it will translate into improved student understanding and achievement.
2016 Rhode Island PARCC Results P a g e | 26
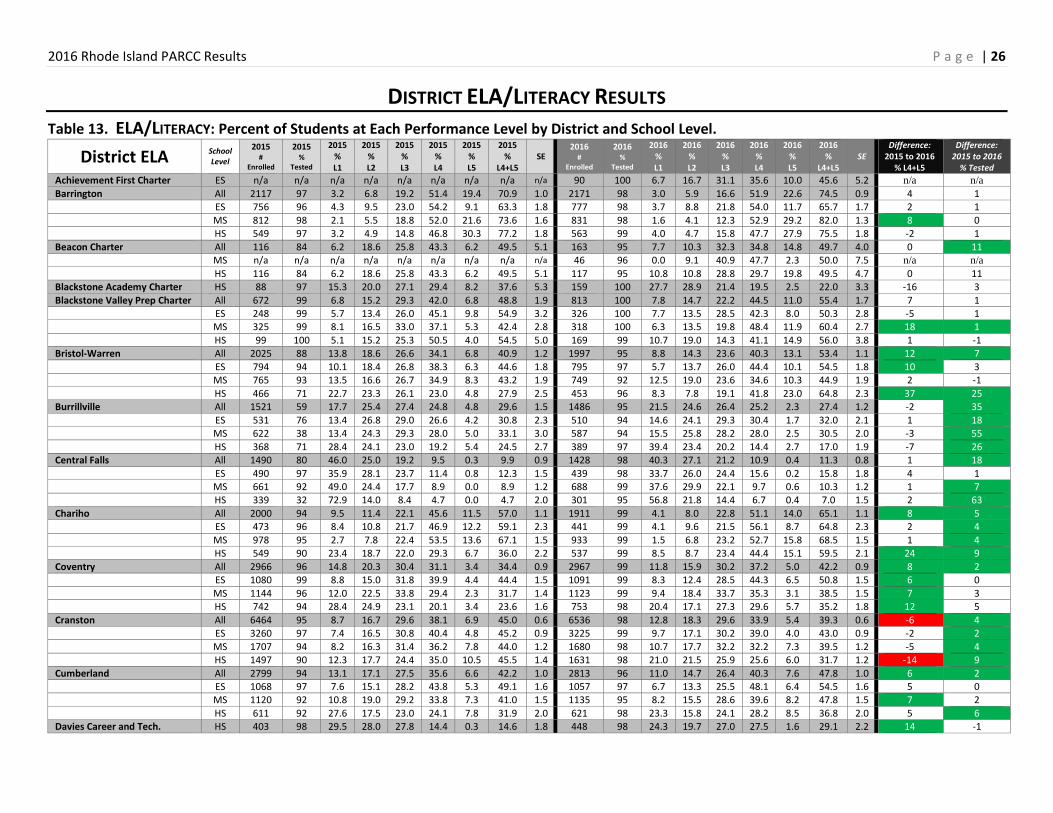
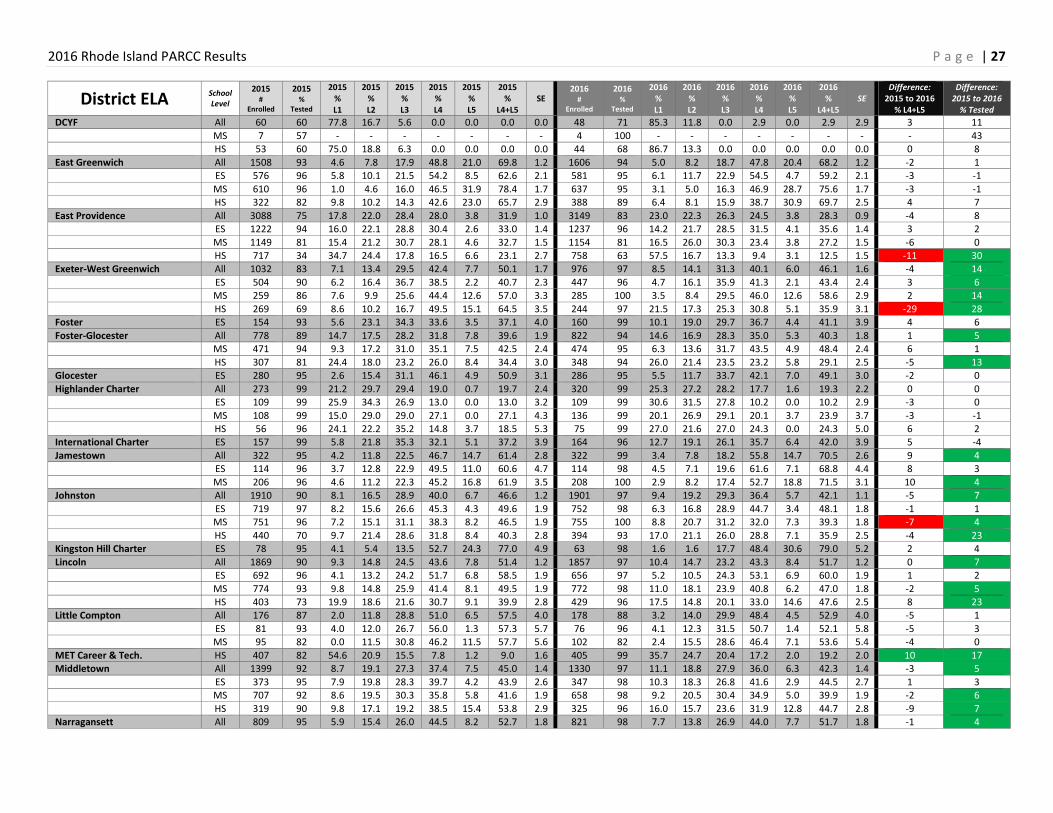
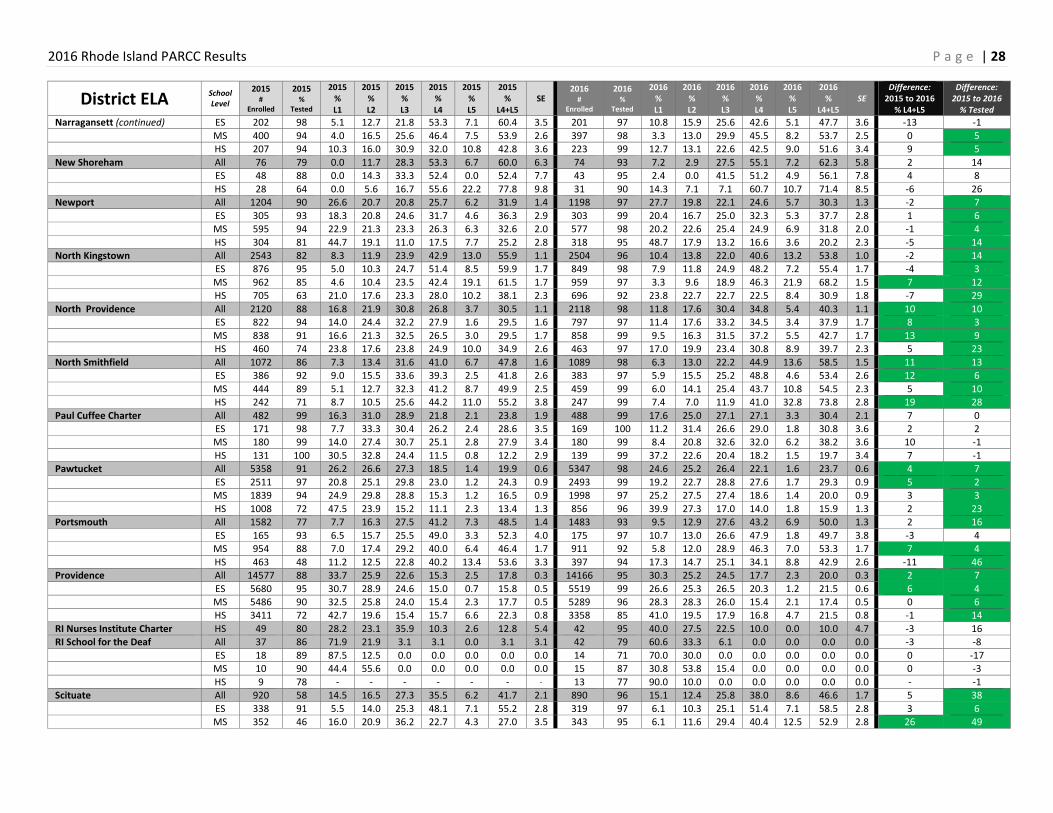
DISTRICT ELA/LITERACY RESULTS
Table 13. ELA/LITERACY: Percent of Students at Each Performance Level by District and School Level.
District ELA School Level
2015 #
Enrolled
2015 %
Tested
2015 % L1
2015 % L2
2015 % L3
2015 % L4
2015 % L5
2015 %
L4+L5 SE
2016 #
Enrolled
2016 %
Tested
2016 % L1
2016 % L2
2016 % L3
2016 % L4
2016 % L5
2016 %
L4+L5 SE
Difference: 2015 to 2016
% L4+L5
Difference: 2015 to 2016
% Tested
Achievement First Charter ES n/a n/a n/a n/a n/a n/a n/a n/a n/a 90 100 6.7 16.7 31.1 35.6 10.0 45.6 5.2 n/a n/a
Barrington All 2117 97 3.2 6.8 19.2 51.4 19.4 70.9 1.0 2171 98 3.0 5.9 16.6 51.9 22.6 74.5 0.9 4 1 ES 756 96 4.3 9.5 23.0 54.2 9.1 63.3 1.8 777 98 3.7 8.8 21.8 54.0 11.7 65.7 1.7 2 1
MS 812 98 2.1 5.5 18.8 52.0 21.6 73.6 1.6 831 98 1.6 4.1 12.3 52.9 29.2 82.0 1.3 8 0 HS 549 97 3.2 4.9 14.8 46.8 30.3 77.2 1.8 563 99 4.0 4.7 15.8 47.7 27.9 75.5 1.8 -2 1
Beacon Charter All 116 84 6.2 18.6 25.8 43.3 6.2 49.5 5.1 163 95 7.7 10.3 32.3 34.8 14.8 49.7 4.0 0 11 MS n/a n/a n/a n/a n/a n/a n/a n/a n/a 46 96 0.0 9.1 40.9 47.7 2.3 50.0 7.5 n/a n/a
HS 116 84 6.2 18.6 25.8 43.3 6.2 49.5 5.1 117 95 10.8 10.8 28.8 29.7 19.8 49.5 4.7 0 11 Blackstone Academy Charter HS 88 97 15.3 20.0 27.1 29.4 8.2 37.6 5.3 159 100 27.7 28.9 21.4 19.5 2.5 22.0 3.3 -16 3
Blackstone Valley Prep Charter All 672 99 6.8 15.2 29.3 42.0 6.8 48.8 1.9 813 100 7.8 14.7 22.2 44.5 11.0 55.4 1.7 7 1 ES 248 99 5.7 13.4 26.0 45.1 9.8 54.9 3.2 326 100 7.7 13.5 28.5 42.3 8.0 50.3 2.8 -5 1 MS 325 99 8.1 16.5 33.0 37.1 5.3 42.4 2.8 318 100 6.3 13.5 19.8 48.4 11.9 60.4 2.7 18 1
HS 99 100 5.1 15.2 25.3 50.5 4.0 54.5 5.0 169 99 10.7 19.0 14.3 41.1 14.9 56.0 3.8 1 -1 Bristol-Warren All 2025 88 13.8 18.6 26.6 34.1 6.8 40.9 1.2 1997 95 8.8 14.3 23.6 40.3 13.1 53.4 1.1 12 7
ES 794 94 10.1 18.4 26.8 38.3 6.3 44.6 1.8 795 97 5.7 13.7 26.0 44.4 10.1 54.5 1.8 10 3 MS 765 93 13.5 16.6 26.7 34.9 8.3 43.2 1.9 749 92 12.5 19.0 23.6 34.6 10.3 44.9 1.9 2 -1
HS 466 71 22.7 23.3 26.1 23.0 4.8 27.9 2.5 453 96 8.3 7.8 19.1 41.8 23.0 64.8 2.3 37 25 Burrillville All 1521 59 17.7 25.4 27.4 24.8 4.8 29.6 1.5 1486 95 21.5 24.6 26.4 25.2 2.3 27.4 1.2 -2 35
ES 531 76 13.4 26.8 29.0 26.6 4.2 30.8 2.3 510 94 14.6 24.1 29.3 30.4 1.7 32.0 2.1 1 18 MS 622 38 13.4 24.3 29.3 28.0 5.0 33.1 3.0 587 94 15.5 25.8 28.2 28.0 2.5 30.5 2.0 -3 55
HS 368 71 28.4 24.1 23.0 19.2 5.4 24.5 2.7 389 97 39.4 23.4 20.2 14.4 2.7 17.0 1.9 -7 26 Central Falls All 1490 80 46.0 25.0 19.2 9.5 0.3 9.9 0.9 1428 98 40.3 27.1 21.2 10.9 0.4 11.3 0.8 1 18
ES 490 97 35.9 28.1 23.7 11.4 0.8 12.3 1.5 439 98 33.7 26.0 24.4 15.6 0.2 15.8 1.8 4 1 MS 661 92 49.0 24.4 17.7 8.9 0.0 8.9 1.2 688 99 37.6 29.9 22.1 9.7 0.6 10.3 1.2 1 7 HS 339 32 72.9 14.0 8.4 4.7 0.0 4.7 2.0 301 95 56.8 21.8 14.4 6.7 0.4 7.0 1.5 2 63
Chariho All 2000 94 9.5 11.4 22.1 45.6 11.5 57.0 1.1 1911 99 4.1 8.0 22.8 51.1 14.0 65.1 1.1 8 5 ES 473 96 8.4 10.8 21.7 46.9 12.2 59.1 2.3 441 99 4.1 9.6 21.5 56.1 8.7 64.8 2.3 2 4
MS 978 95 2.7 7.8 22.4 53.5 13.6 67.1 1.5 933 99 1.5 6.8 23.2 52.7 15.8 68.5 1.5 1 4 HS 549 90 23.4 18.7 22.0 29.3 6.7 36.0 2.2 537 99 8.5 8.7 23.4 44.4 15.1 59.5 2.1 24 9
Coventry All 2966 96 14.8 20.3 30.4 31.1 3.4 34.4 0.9 2967 99 11.8 15.9 30.2 37.2 5.0 42.2 0.9 8 2 ES 1080 99 8.8 15.0 31.8 39.9 4.4 44.4 1.5 1091 99 8.3 12.4 28.5 44.3 6.5 50.8 1.5 6 0
MS 1144 96 12.0 22.5 33.8 29.4 2.3 31.7 1.4 1123 99 9.4 18.4 33.7 35.3 3.1 38.5 1.5 7 3 HS 742 94 28.4 24.9 23.1 20.1 3.4 23.6 1.6 753 98 20.4 17.1 27.3 29.6 5.7 35.2 1.8 12 5
Cranston All 6464 95 8.7 16.7 29.6 38.1 6.9 45.0 0.6 6536 98 12.8 18.3 29.6 33.9 5.4 39.3 0.6 -6 4 ES 3260 97 7.4 16.5 30.8 40.4 4.8 45.2 0.9 3225 99 9.7 17.1 30.2 39.0 4.0 43.0 0.9 -2 2
MS 1707 94 8.2 16.3 31.4 36.2 7.8 44.0 1.2 1680 98 10.7 17.7 32.2 32.2 7.3 39.5 1.2 -5 4 HS 1497 90 12.3 17.7 24.4 35.0 10.5 45.5 1.4 1631 98 21.0 21.5 25.9 25.6 6.0 31.7 1.2 -14 9
Cumberland All 2799 94 13.1 17.1 27.5 35.6 6.6 42.2 1.0 2813 96 11.0 14.7 26.4 40.3 7.6 47.8 1.0 6 2 ES 1068 97 7.6 15.1 28.2 43.8 5.3 49.1 1.6 1057 97 6.7 13.3 25.5 48.1 6.4 54.5 1.6 5 0 MS 1120 92 10.8 19.0 29.2 33.8 7.3 41.0 1.5 1135 95 8.2 15.5 28.6 39.6 8.2 47.8 1.5 7 2
HS 611 92 27.6 17.5 23.0 24.1 7.8 31.9 2.0 621 98 23.3 15.8 24.1 28.2 8.5 36.8 2.0 5 6 Davies Career and Tech. HS 403 98 29.5 28.0 27.8 14.4 0.3 14.6 1.8 448 98 24.3 19.7 27.0 27.5 1.6 29.1 2.2 14 -1
2016 Rhode Island PARCC Results P a g e | 27
District ELA School Level
2015 #
Enrolled
2015 %
Tested
2015 % L1
2015 % L2
2015 % L3
2015 % L4
2015 % L5
2015 %
L4+L5 SE
2016 #
Enrolled
2016 %
Tested
2016 % L1
2016 % L2
2016 % L3
2016 % L4
2016 % L5
2016 %
L4+L5 SE
Difference: 2015 to 2016
% L4+L5
Difference: 2015 to 2016
% Tested
DCYF All 60 60 77.8 16.7 5.6 0.0 0.0 0.0 0.0 48 71 85.3 11.8 0.0 2.9 0.0 2.9 2.9 3 11
MS 7 57 - - - - - - - 4 100 - - - - - - - - 43 HS 53 60 75.0 18.8 6.3 0.0 0.0 0.0 0.0 44 68 86.7 13.3 0.0 0.0 0.0 0.0 0.0 0 8
East Greenwich All 1508 93 4.6 7.8 17.9 48.8 21.0 69.8 1.2 1606 94 5.0 8.2 18.7 47.8 20.4 68.2 1.2 -2 1 ES 576 96 5.8 10.1 21.5 54.2 8.5 62.6 2.1 581 95 6.1 11.7 22.9 54.5 4.7 59.2 2.1 -3 -1
MS 610 96 1.0 4.6 16.0 46.5 31.9 78.4 1.7 637 95 3.1 5.0 16.3 46.9 28.7 75.6 1.7 -3 -1 HS 322 82 9.8 10.2 14.3 42.6 23.0 65.7 2.9 388 89 6.4 8.1 15.9 38.7 30.9 69.7 2.5 4 7
East Providence All 3088 75 17.8 22.0 28.4 28.0 3.8 31.9 1.0 3149 83 23.0 22.3 26.3 24.5 3.8 28.3 0.9 -4 8 ES 1222 94 16.0 22.1 28.8 30.4 2.6 33.0 1.4 1237 96 14.2 21.7 28.5 31.5 4.1 35.6 1.4 3 2
MS 1149 81 15.4 21.2 30.7 28.1 4.6 32.7 1.5 1154 81 16.5 26.0 30.3 23.4 3.8 27.2 1.5 -6 0 HS 717 34 34.7 24.4 17.8 16.5 6.6 23.1 2.7 758 63 57.5 16.7 13.3 9.4 3.1 12.5 1.5 -11 30 Exeter-West Greenwich All 1032 83 7.1 13.4 29.5 42.4 7.7 50.1 1.7 976 97 8.5 14.1 31.3 40.1 6.0 46.1 1.6 -4 14
ES 504 90 6.2 16.4 36.7 38.5 2.2 40.7 2.3 447 96 4.7 16.1 35.9 41.3 2.1 43.4 2.4 3 6 MS 259 86 7.6 9.9 25.6 44.4 12.6 57.0 3.3 285 100 3.5 8.4 29.5 46.0 12.6 58.6 2.9 2 14
HS 269 69 8.6 10.2 16.7 49.5 15.1 64.5 3.5 244 97 21.5 17.3 25.3 30.8 5.1 35.9 3.1 -29 28 Foster ES 154 93 5.6 23.1 34.3 33.6 3.5 37.1 4.0 160 99 10.1 19.0 29.7 36.7 4.4 41.1 3.9 4 6
Foster-Glocester All 778 89 14.7 17.5 28.2 31.8 7.8 39.6 1.9 822 94 14.6 16.9 28.3 35.0 5.3 40.3 1.8 1 5 MS 471 94 9.3 17.2 31.0 35.1 7.5 42.5 2.4 474 95 6.3 13.6 31.7 43.5 4.9 48.4 2.4 6 1
HS 307 81 24.4 18.0 23.2 26.0 8.4 34.4 3.0 348 94 26.0 21.4 23.5 23.2 5.8 29.1 2.5 -5 13 Glocester ES 280 95 2.6 15.4 31.1 46.1 4.9 50.9 3.1 286 95 5.5 11.7 33.7 42.1 7.0 49.1 3.0 -2 0
Highlander Charter All 273 99 21.2 29.7 29.4 19.0 0.7 19.7 2.4 320 99 25.3 27.2 28.2 17.7 1.6 19.3 2.2 0 0 ES 109 99 25.9 34.3 26.9 13.0 0.0 13.0 3.2 109 99 30.6 31.5 27.8 10.2 0.0 10.2 2.9 -3 0
MS 108 99 15.0 29.0 29.0 27.1 0.0 27.1 4.3 136 99 20.1 26.9 29.1 20.1 3.7 23.9 3.7 -3 -1 HS 56 96 24.1 22.2 35.2 14.8 3.7 18.5 5.3 75 99 27.0 21.6 27.0 24.3 0.0 24.3 5.0 6 2 International Charter ES 157 99 5.8 21.8 35.3 32.1 5.1 37.2 3.9 164 96 12.7 19.1 26.1 35.7 6.4 42.0 3.9 5 -4
Jamestown All 322 95 4.2 11.8 22.5 46.7 14.7 61.4 2.8 322 99 3.4 7.8 18.2 55.8 14.7 70.5 2.6 9 4 ES 114 96 3.7 12.8 22.9 49.5 11.0 60.6 4.7 114 98 4.5 7.1 19.6 61.6 7.1 68.8 4.4 8 3
MS 206 96 4.6 11.2 22.3 45.2 16.8 61.9 3.5 208 100 2.9 8.2 17.4 52.7 18.8 71.5 3.1 10 4 Johnston All 1910 90 8.1 16.5 28.9 40.0 6.7 46.6 1.2 1901 97 9.4 19.2 29.3 36.4 5.7 42.1 1.1 -5 7
ES 719 97 8.2 15.6 26.6 45.3 4.3 49.6 1.9 752 98 6.3 16.8 28.9 44.7 3.4 48.1 1.8 -1 1 MS 751 96 7.2 15.1 31.1 38.3 8.2 46.5 1.9 755 100 8.8 20.7 31.2 32.0 7.3 39.3 1.8 -7 4
HS 440 70 9.7 21.4 28.6 31.8 8.4 40.3 2.8 394 93 17.0 21.1 26.0 28.8 7.1 35.9 2.5 -4 23 Kingston Hill Charter ES 78 95 4.1 5.4 13.5 52.7 24.3 77.0 4.9 63 98 1.6 1.6 17.7 48.4 30.6 79.0 5.2 2 4
Lincoln All 1869 90 9.3 14.8 24.5 43.6 7.8 51.4 1.2 1857 97 10.4 14.7 23.2 43.3 8.4 51.7 1.2 0 7 ES 692 96 4.1 13.2 24.2 51.7 6.8 58.5 1.9 656 97 5.2 10.5 24.3 53.1 6.9 60.0 1.9 1 2
MS 774 93 9.8 14.8 25.9 41.4 8.1 49.5 1.9 772 98 11.0 18.1 23.9 40.8 6.2 47.0 1.8 -2 5 HS 403 73 19.9 18.6 21.6 30.7 9.1 39.9 2.8 429 96 17.5 14.8 20.1 33.0 14.6 47.6 2.5 8 23 Little Compton All 176 87 2.0 11.8 28.8 51.0 6.5 57.5 4.0 178 88 3.2 14.0 29.9 48.4 4.5 52.9 4.0 -5 1
ES 81 93 4.0 12.0 26.7 56.0 1.3 57.3 5.7 76 96 4.1 12.3 31.5 50.7 1.4 52.1 5.8 -5 3 MS 95 82 0.0 11.5 30.8 46.2 11.5 57.7 5.6 102 82 2.4 15.5 28.6 46.4 7.1 53.6 5.4 -4 0
MET Career & Tech. HS 407 82 54.6 20.9 15.5 7.8 1.2 9.0 1.6 405 99 35.7 24.7 20.4 17.2 2.0 19.2 2.0 10 17 Middletown All 1399 92 8.7 19.1 27.3 37.4 7.5 45.0 1.4 1330 97 11.1 18.8 27.9 36.0 6.3 42.3 1.4 -3 5
ES 373 95 7.9 19.8 28.3 39.7 4.2 43.9 2.6 347 98 10.3 18.3 26.8 41.6 2.9 44.5 2.7 1 3 MS 707 92 8.6 19.5 30.3 35.8 5.8 41.6 1.9 658 98 9.2 20.5 30.4 34.9 5.0 39.9 1.9 -2 6
HS 319 90 9.8 17.1 19.2 38.5 15.4 53.8 2.9 325 96 16.0 15.7 23.6 31.9 12.8 44.7 2.8 -9 7 Narragansett All 809 95 5.9 15.4 26.0 44.5 8.2 52.7 1.8 821 98 7.7 13.8 26.9 44.0 7.7 51.7 1.8 -1 4
2016 Rhode Island PARCC Results P a g e | 28
District ELA School Level
2015 #
Enrolled
2015 %
Tested
2015 % L1
2015 % L2
2015 % L3
2015 % L4
2015 % L5
2015 %
L4+L5 SE
2016 #
Enrolled
2016 %
Tested
2016 % L1
2016 % L2
2016 % L3
2016 % L4
2016 % L5
2016 %
L4+L5 SE
Difference: 2015 to 2016
% L4+L5
Difference: 2015 to 2016
% Tested
Narragansett (continued) ES 202 98 5.1 12.7 21.8 53.3 7.1 60.4 3.5 201 97 10.8 15.9 25.6 42.6 5.1 47.7 3.6 -13 -1
MS 400 94 4.0 16.5 25.6 46.4 7.5 53.9 2.6 397 98 3.3 13.0 29.9 45.5 8.2 53.7 2.5 0 5 HS 207 94 10.3 16.0 30.9 32.0 10.8 42.8 3.6 223 99 12.7 13.1 22.6 42.5 9.0 51.6 3.4 9 5
New Shoreham All 76 79 0.0 11.7 28.3 53.3 6.7 60.0 6.3 74 93 7.2 2.9 27.5 55.1 7.2 62.3 5.8 2 14 ES 48 88 0.0 14.3 33.3 52.4 0.0 52.4 7.7 43 95 2.4 0.0 41.5 51.2 4.9 56.1 7.8 4 8
HS 28 64 0.0 5.6 16.7 55.6 22.2 77.8 9.8 31 90 14.3 7.1 7.1 60.7 10.7 71.4 8.5 -6 26 Newport All 1204 90 26.6 20.7 20.8 25.7 6.2 31.9 1.4 1198 97 27.7 19.8 22.1 24.6 5.7 30.3 1.3 -2 7
ES 305 93 18.3 20.8 24.6 31.7 4.6 36.3 2.9 303 99 20.4 16.7 25.0 32.3 5.3 37.7 2.8 1 6 MS 595 94 22.9 21.3 23.3 26.3 6.3 32.6 2.0 577 98 20.2 22.6 25.4 24.9 6.9 31.8 2.0 -1 4
HS 304 81 44.7 19.1 11.0 17.5 7.7 25.2 2.8 318 95 48.7 17.9 13.2 16.6 3.6 20.2 2.3 -5 14 North Kingstown All 2543 82 8.3 11.9 23.9 42.9 13.0 55.9 1.1 2504 96 10.4 13.8 22.0 40.6 13.2 53.8 1.0 -2 14 ES 876 95 5.0 10.3 24.7 51.4 8.5 59.9 1.7 849 98 7.9 11.8 24.9 48.2 7.2 55.4 1.7 -4 3
MS 962 85 4.6 10.4 23.5 42.4 19.1 61.5 1.7 959 97 3.3 9.6 18.9 46.3 21.9 68.2 1.5 7 12 HS 705 63 21.0 17.6 23.3 28.0 10.2 38.1 2.3 696 92 23.8 22.7 22.7 22.5 8.4 30.9 1.8 -7 29
North Providence All 2120 88 16.8 21.9 30.8 26.8 3.7 30.5 1.1 2118 98 11.8 17.6 30.4 34.8 5.4 40.3 1.1 10 10 ES 822 94 14.0 24.4 32.2 27.9 1.6 29.5 1.6 797 97 11.4 17.6 33.2 34.5 3.4 37.9 1.7 8 3
MS 838 91 16.6 21.3 32.5 26.5 3.0 29.5 1.7 858 99 9.5 16.3 31.5 37.2 5.5 42.7 1.7 13 9 HS 460 74 23.8 17.6 23.8 24.9 10.0 34.9 2.6 463 97 17.0 19.9 23.4 30.8 8.9 39.7 2.3 5 23
North Smithfield All 1072 86 7.3 13.4 31.6 41.0 6.7 47.8 1.6 1089 98 6.3 13.0 22.2 44.9 13.6 58.5 1.5 11 13 ES 386 92 9.0 15.5 33.6 39.3 2.5 41.8 2.6 383 97 5.9 15.5 25.2 48.8 4.6 53.4 2.6 12 6
MS 444 89 5.1 12.7 32.3 41.2 8.7 49.9 2.5 459 99 6.0 14.1 25.4 43.7 10.8 54.5 2.3 5 10 HS 242 71 8.7 10.5 25.6 44.2 11.0 55.2 3.8 247 99 7.4 7.0 11.9 41.0 32.8 73.8 2.8 19 28
Paul Cuffee Charter All 482 99 16.3 31.0 28.9 21.8 2.1 23.8 1.9 488 99 17.6 25.0 27.1 27.1 3.3 30.4 2.1 7 0 ES 171 98 7.7 33.3 30.4 26.2 2.4 28.6 3.5 169 100 11.2 31.4 26.6 29.0 1.8 30.8 3.6 2 2 MS 180 99 14.0 27.4 30.7 25.1 2.8 27.9 3.4 180 99 8.4 20.8 32.6 32.0 6.2 38.2 3.6 10 -1
HS 131 100 30.5 32.8 24.4 11.5 0.8 12.2 2.9 139 99 37.2 22.6 20.4 18.2 1.5 19.7 3.4 7 -1 Pawtucket All 5358 91 26.2 26.6 27.3 18.5 1.4 19.9 0.6 5347 98 24.6 25.2 26.4 22.1 1.6 23.7 0.6 4 7
ES 2511 97 20.8 25.1 29.8 23.0 1.2 24.3 0.9 2493 99 19.2 22.7 28.8 27.6 1.7 29.3 0.9 5 2 MS 1839 94 24.9 29.8 28.8 15.3 1.2 16.5 0.9 1998 97 25.2 27.5 27.4 18.6 1.4 20.0 0.9 3 3
HS 1008 72 47.5 23.9 15.2 11.1 2.3 13.4 1.3 856 96 39.9 27.3 17.0 14.0 1.8 15.9 1.3 2 23 Portsmouth All 1582 77 7.7 16.3 27.5 41.2 7.3 48.5 1.4 1483 93 9.5 12.9 27.6 43.2 6.9 50.0 1.3 2 16
ES 165 93 6.5 15.7 25.5 49.0 3.3 52.3 4.0 175 97 10.7 13.0 26.6 47.9 1.8 49.7 3.8 -3 4 MS 954 88 7.0 17.4 29.2 40.0 6.4 46.4 1.7 911 92 5.8 12.0 28.9 46.3 7.0 53.3 1.7 7 4
HS 463 48 11.2 12.5 22.8 40.2 13.4 53.6 3.3 397 94 17.3 14.7 25.1 34.1 8.8 42.9 2.6 -11 46 Providence All 14577 88 33.7 25.9 22.6 15.3 2.5 17.8 0.3 14166 95 30.3 25.2 24.5 17.7 2.3 20.0 0.3 2 7
ES 5680 95 30.7 28.9 24.6 15.0 0.7 15.8 0.5 5519 99 26.6 25.3 26.5 20.3 1.2 21.5 0.6 6 4 MS 5486 90 32.5 25.8 24.0 15.4 2.3 17.7 0.5 5289 96 28.3 28.3 26.0 15.4 2.1 17.4 0.5 0 6 HS 3411 72 42.7 19.6 15.4 15.7 6.6 22.3 0.8 3358 85 41.0 19.5 17.9 16.8 4.7 21.5 0.8 -1 14
RI Nurses Institute Charter HS 49 80 28.2 23.1 35.9 10.3 2.6 12.8 5.4 42 95 40.0 27.5 22.5 10.0 0.0 10.0 4.7 -3 16 RI School for the Deaf All 37 86 71.9 21.9 3.1 3.1 0.0 3.1 3.1 42 79 60.6 33.3 6.1 0.0 0.0 0.0 0.0 -3 -8
ES 18 89 87.5 12.5 0.0 0.0 0.0 0.0 0.0 14 71 70.0 30.0 0.0 0.0 0.0 0.0 0.0 0 -17 MS 10 90 44.4 55.6 0.0 0.0 0.0 0.0 0.0 15 87 30.8 53.8 15.4 0.0 0.0 0.0 0.0 0 -3
HS 9 78 - - - - - - - 13 77 90.0 10.0 0.0 0.0 0.0 0.0 0.0 - -1 Scituate All 920 58 14.5 16.5 27.3 35.5 6.2 41.7 2.1 890 96 15.1 12.4 25.8 38.0 8.6 46.6 1.7 5 38
ES 338 91 5.5 14.0 25.3 48.1 7.1 55.2 2.8 319 97 6.1 10.3 25.1 51.4 7.1 58.5 2.8 3 6 MS 352 46 16.0 20.9 36.2 22.7 4.3 27.0 3.5 343 95 6.1 11.6 29.4 40.4 12.5 52.9 2.8 26 49
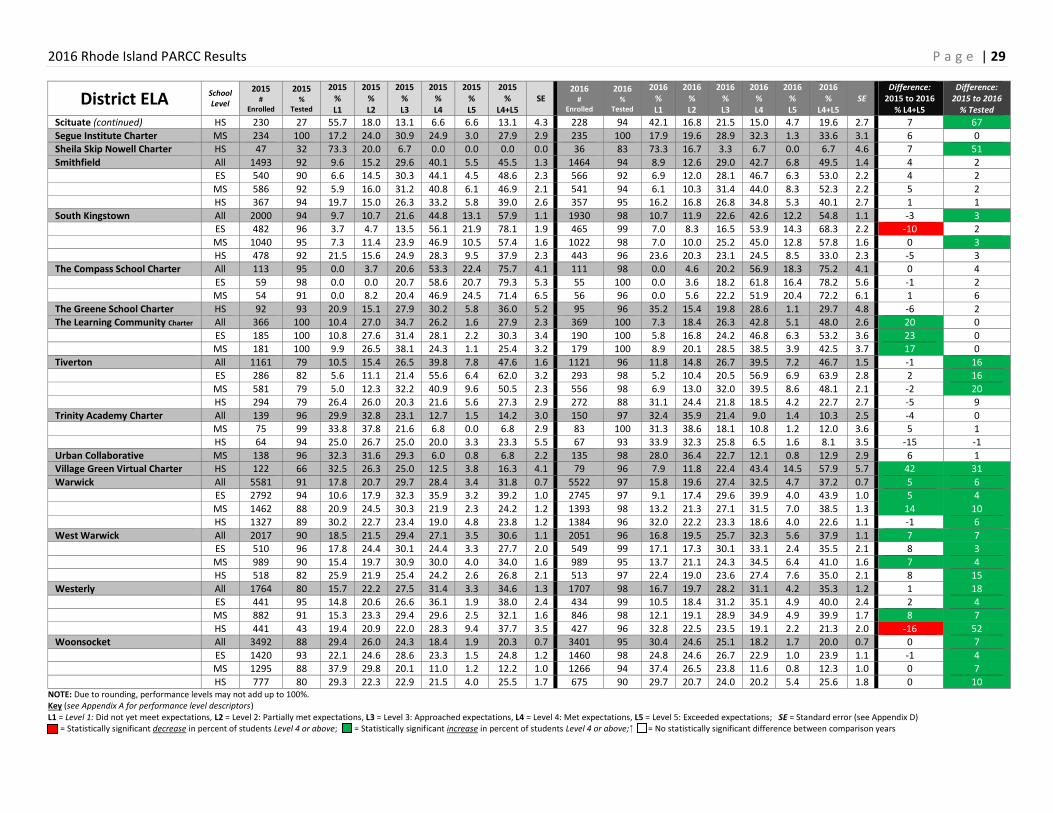
2016 Rhode Island PARCC Results P a g e | 29
District ELA School Level
2015 #
Enrolled
2015 %
Tested
2015 % L1
2015 % L2
2015 % L3
2015 % L4
2015 % L5
2015 %
L4+L5 SE
2016 #
Enrolled
2016 %
Tested
2016 % L1
2016 % L2
2016 % L3
2016 % L4
2016 % L5
2016 %
L4+L5 SE
Difference: 2015 to 2016
% L4+L5
Difference: 2015 to 2016
% Tested
Scituate (continued) HS 230 27 55.7 18.0 13.1 6.6 6.6 13.1 4.3 228 94 42.1 16.8 21.5 15.0 4.7 19.6 2.7 7 67
Segue Institute Charter MS 234 100 17.2 24.0 30.9 24.9 3.0 27.9 2.9 235 100 17.9 19.6 28.9 32.3 1.3 33.6 3.1 6 0 Sheila Skip Nowell Charter HS 47 32 73.3 20.0 6.7 0.0 0.0 0.0 0.0 36 83 73.3 16.7 3.3 6.7 0.0 6.7 4.6 7 51
Smithfield All 1493 92 9.6 15.2 29.6 40.1 5.5 45.5 1.3 1464 94 8.9 12.6 29.0 42.7 6.8 49.5 1.4 4 2 ES 540 90 6.6 14.5 30.3 44.1 4.5 48.6 2.3 566 92 6.9 12.0 28.1 46.7 6.3 53.0 2.2 4 2
MS 586 92 5.9 16.0 31.2 40.8 6.1 46.9 2.1 541 94 6.1 10.3 31.4 44.0 8.3 52.3 2.2 5 2 HS 367 94 19.7 15.0 26.3 33.2 5.8 39.0 2.6 357 95 16.2 16.8 26.8 34.8 5.3 40.1 2.7 1 1
South Kingstown All 2000 94 9.7 10.7 21.6 44.8 13.1 57.9 1.1 1930 98 10.7 11.9 22.6 42.6 12.2 54.8 1.1 -3 3 ES 482 96 3.7 4.7 13.5 56.1 21.9 78.1 1.9 465 99 7.0 8.3 16.5 53.9 14.3 68.3 2.2 -10 2
MS 1040 95 7.3 11.4 23.9 46.9 10.5 57.4 1.6 1022 98 7.0 10.0 25.2 45.0 12.8 57.8 1.6 0 3 HS 478 92 21.5 15.6 24.9 28.3 9.5 37.9 2.3 443 96 23.6 20.3 23.1 24.5 8.5 33.0 2.3 -5 3 The Compass School Charter All 113 95 0.0 3.7 20.6 53.3 22.4 75.7 4.1 111 98 0.0 4.6 20.2 56.9 18.3 75.2 4.1 0 4
ES 59 98 0.0 0.0 20.7 58.6 20.7 79.3 5.3 55 100 0.0 3.6 18.2 61.8 16.4 78.2 5.6 -1 2 MS 54 91 0.0 8.2 20.4 46.9 24.5 71.4 6.5 56 96 0.0 5.6 22.2 51.9 20.4 72.2 6.1 1 6
The Greene School Charter HS 92 93 20.9 15.1 27.9 30.2 5.8 36.0 5.2 95 96 35.2 15.4 19.8 28.6 1.1 29.7 4.8 -6 2 The Learning Community Charter All 366 100 10.4 27.0 34.7 26.2 1.6 27.9 2.3 369 100 7.3 18.4 26.3 42.8 5.1 48.0 2.6 20 0
ES 185 100 10.8 27.6 31.4 28.1 2.2 30.3 3.4 190 100 5.8 16.8 24.2 46.8 6.3 53.2 3.6 23 0 MS 181 100 9.9 26.5 38.1 24.3 1.1 25.4 3.2 179 100 8.9 20.1 28.5 38.5 3.9 42.5 3.7 17 0
Tiverton All 1161 79 10.5 15.4 26.5 39.8 7.8 47.6 1.6 1121 96 11.8 14.8 26.7 39.5 7.2 46.7 1.5 -1 16 ES 286 82 5.6 11.1 21.4 55.6 6.4 62.0 3.2 293 98 5.2 10.4 20.5 56.9 6.9 63.9 2.8 2 16
MS 581 79 5.0 12.3 32.2 40.9 9.6 50.5 2.3 556 98 6.9 13.0 32.0 39.5 8.6 48.1 2.1 -2 20 HS 294 79 26.4 26.0 20.3 21.6 5.6 27.3 2.9 272 88 31.1 24.4 21.8 18.5 4.2 22.7 2.7 -5 9
Trinity Academy Charter All 139 96 29.9 32.8 23.1 12.7 1.5 14.2 3.0 150 97 32.4 35.9 21.4 9.0 1.4 10.3 2.5 -4 0 MS 75 99 33.8 37.8 21.6 6.8 0.0 6.8 2.9 83 100 31.3 38.6 18.1 10.8 1.2 12.0 3.6 5 1 HS 64 94 25.0 26.7 25.0 20.0 3.3 23.3 5.5 67 93 33.9 32.3 25.8 6.5 1.6 8.1 3.5 -15 -1
Urban Collaborative MS 138 96 32.3 31.6 29.3 6.0 0.8 6.8 2.2 135 98 28.0 36.4 22.7 12.1 0.8 12.9 2.9 6 1 Village Green Virtual Charter HS 122 66 32.5 26.3 25.0 12.5 3.8 16.3 4.1 79 96 7.9 11.8 22.4 43.4 14.5 57.9 5.7 42 31
Warwick All 5581 91 17.8 20.7 29.7 28.4 3.4 31.8 0.7 5522 97 15.8 19.6 27.4 32.5 4.7 37.2 0.7 5 6 ES 2792 94 10.6 17.9 32.3 35.9 3.2 39.2 1.0 2745 97 9.1 17.4 29.6 39.9 4.0 43.9 1.0 5 4
MS 1462 88 20.9 24.5 30.3 21.9 2.3 24.2 1.2 1393 98 13.2 21.3 27.1 31.5 7.0 38.5 1.3 14 10 HS 1327 89 30.2 22.7 23.4 19.0 4.8 23.8 1.2 1384 96 32.0 22.2 23.3 18.6 4.0 22.6 1.1 -1 6
West Warwick All 2017 90 18.5 21.5 29.4 27.1 3.5 30.6 1.1 2051 96 16.8 19.5 25.7 32.3 5.6 37.9 1.1 7 7 ES 510 96 17.8 24.4 30.1 24.4 3.3 27.7 2.0 549 99 17.1 17.3 30.1 33.1 2.4 35.5 2.1 8 3
MS 989 90 15.4 19.7 30.9 30.0 4.0 34.0 1.6 989 95 13.7 21.1 24.3 34.5 6.4 41.0 1.6 7 4 HS 518 82 25.9 21.9 25.4 24.2 2.6 26.8 2.1 513 97 22.4 19.0 23.6 27.4 7.6 35.0 2.1 8 15
Westerly All 1764 80 15.7 22.2 27.5 31.4 3.3 34.6 1.3 1707 98 16.7 19.7 28.2 31.1 4.2 35.3 1.2 1 18 ES 441 95 14.8 20.6 26.6 36.1 1.9 38.0 2.4 434 99 10.5 18.4 31.2 35.1 4.9 40.0 2.4 2 4 MS 882 91 15.3 23.3 29.4 29.6 2.5 32.1 1.6 846 98 12.1 19.1 28.9 34.9 4.9 39.9 1.7 8 7
HS 441 43 19.4 20.9 22.0 28.3 9.4 37.7 3.5 427 96 32.8 22.5 23.5 19.1 2.2 21.3 2.0 -16 52 Woonsocket All 3492 88 29.4 26.0 24.3 18.4 1.9 20.3 0.7 3401 95 30.4 24.6 25.1 18.2 1.7 20.0 0.7 0 7
ES 1420 93 22.1 24.6 28.6 23.3 1.5 24.8 1.2 1460 98 24.8 24.6 26.7 22.9 1.0 23.9 1.1 -1 4 MS 1295 88 37.9 29.8 20.1 11.0 1.2 12.2 1.0 1266 94 37.4 26.5 23.8 11.6 0.8 12.3 1.0 0 7
HS 777 80 29.3 22.3 22.9 21.5 4.0 25.5 1.7 675 90 29.7 20.7 24.0 20.2 5.4 25.6 1.8 0 10 NOTE: Due to rounding, performance levels may not add up to 100%. Key (see Appendix A for performance level descriptors) L1 = Level 1: Did not yet meet expectations, L2 = Level 2: Partially met expectations, L3 = Level 3: Approached expectations, L4 = Level 4: Met expectations, L5 = Level 5: Exceeded expectations; SE = Standard error (see Appendix D) = Statistically significant decrease in percent of students Level 4 or above; = Statistically significant increase in percent of students Level 4 or above; = No statistically significant difference between comparison years
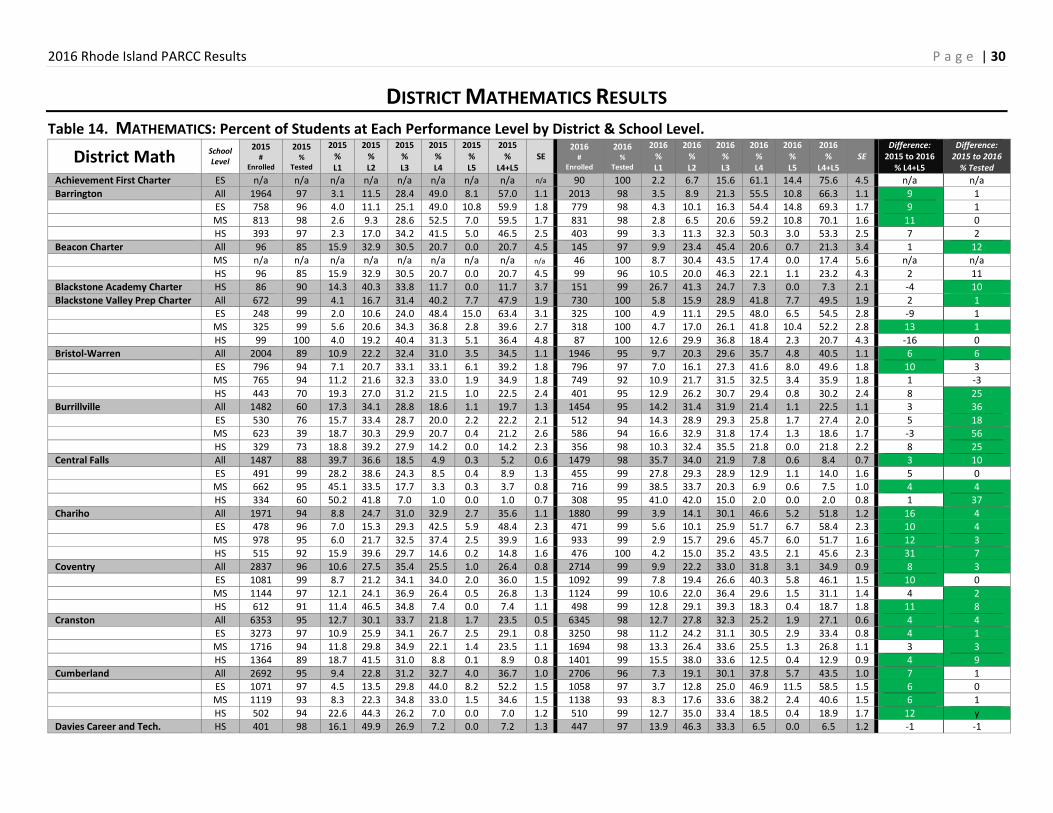
2016 Rhode Island PARCC Results P a g e | 30
DISTRICT MATHEMATICS RESULTS
Table 14. MATHEMATICS: Percent of Students at Each Performance Level by District & School Level.
District Math School Level
2015 #
Enrolled
2015 %
Tested
2015 % L1
2015 % L2
2015 % L3
2015 % L4
2015 % L5
2015 %
L4+L5 SE
2016 #
Enrolled
2016 %
Tested
2016 % L1
2016 % L2
2016 % L3
2016 % L4
2016 % L5
2016 %
L4+L5 SE
Difference: 2015 to 2016
% L4+L5
Difference: 2015 to 2016
% Tested
Achievement First Charter ES n/a n/a n/a n/a n/a n/a n/a n/a n/a 90 100 2.2 6.7 15.6 61.1 14.4 75.6 4.5 n/a n/a Barrington All 1964 97 3.1 11.5 28.4 49.0 8.1 57.0 1.1 2013 98 3.5 8.9 21.3 55.5 10.8 66.3 1.1 9 1 ES 758 96 4.0 11.1 25.1 49.0 10.8 59.9 1.8 779 98 4.3 10.1 16.3 54.4 14.8 69.3 1.7 9 1
MS 813 98 2.6 9.3 28.6 52.5 7.0 59.5 1.7 831 98 2.8 6.5 20.6 59.2 10.8 70.1 1.6 11 0 HS 393 97 2.3 17.0 34.2 41.5 5.0 46.5 2.5 403 99 3.3 11.3 32.3 50.3 3.0 53.3 2.5 7 2
Beacon Charter All 96 85 15.9 32.9 30.5 20.7 0.0 20.7 4.5 145 97 9.9 23.4 45.4 20.6 0.7 21.3 3.4 1 12 MS n/a n/a n/a n/a n/a n/a n/a n/a n/a 46 100 8.7 30.4 43.5 17.4 0.0 17.4 5.6 n/a n/a HS 96 85 15.9 32.9 30.5 20.7 0.0 20.7 4.5 99 96 10.5 20.0 46.3 22.1 1.1 23.2 4.3 2 11 Blackstone Academy Charter HS 86 90 14.3 40.3 33.8 11.7 0.0 11.7 3.7 151 99 26.7 41.3 24.7 7.3 0.0 7.3 2.1 -4 10
Blackstone Valley Prep Charter All 672 99 4.1 16.7 31.4 40.2 7.7 47.9 1.9 730 100 5.8 15.9 28.9 41.8 7.7 49.5 1.9 2 1 ES 248 99 2.0 10.6 24.0 48.4 15.0 63.4 3.1 325 100 4.9 11.1 29.5 48.0 6.5 54.5 2.8 -9 1 MS 325 99 5.6 20.6 34.3 36.8 2.8 39.6 2.7 318 100 4.7 17.0 26.1 41.8 10.4 52.2 2.8 13 1
HS 99 100 4.0 19.2 40.4 31.3 5.1 36.4 4.8 87 100 12.6 29.9 36.8 18.4 2.3 20.7 4.3 -16 0 Bristol-Warren All 2004 89 10.9 22.2 32.4 31.0 3.5 34.5 1.1 1946 95 9.7 20.3 29.6 35.7 4.8 40.5 1.1 6 6
ES 796 94 7.1 20.7 33.1 33.1 6.1 39.2 1.8 796 97 7.0 16.1 27.3 41.6 8.0 49.6 1.8 10 3 MS 765 94 11.2 21.6 32.3 33.0 1.9 34.9 1.8 749 92 10.9 21.7 31.5 32.5 3.4 35.9 1.8 1 -3
HS 443 70 19.3 27.0 31.2 21.5 1.0 22.5 2.4 401 95 12.9 26.2 30.7 29.4 0.8 30.2 2.4 8 25 Burrillville All 1482 60 17.3 34.1 28.8 18.6 1.1 19.7 1.3 1454 95 14.2 31.4 31.9 21.4 1.1 22.5 1.1 3 36
ES 530 76 15.7 33.4 28.7 20.0 2.2 22.2 2.1 512 94 14.3 28.9 29.3 25.8 1.7 27.4 2.0 5 18 MS 623 39 18.7 30.3 29.9 20.7 0.4 21.2 2.6 586 94 16.6 32.9 31.8 17.4 1.3 18.6 1.7 -3 56
HS 329 73 18.8 39.2 27.9 14.2 0.0 14.2 2.3 356 98 10.3 32.4 35.5 21.8 0.0 21.8 2.2 8 25 Central Falls All 1487 88 39.7 36.6 18.5 4.9 0.3 5.2 0.6 1479 98 35.7 34.0 21.9 7.8 0.6 8.4 0.7 3 10
ES 491 99 28.2 38.6 24.3 8.5 0.4 8.9 1.3 455 99 27.8 29.3 28.9 12.9 1.1 14.0 1.6 5 0 MS 662 95 45.1 33.5 17.7 3.3 0.3 3.7 0.8 716 99 38.5 33.7 20.3 6.9 0.6 7.5 1.0 4 4 HS 334 60 50.2 41.8 7.0 1.0 0.0 1.0 0.7 308 95 41.0 42.0 15.0 2.0 0.0 2.0 0.8 1 37
Chariho All 1971 94 8.8 24.7 31.0 32.9 2.7 35.6 1.1 1880 99 3.9 14.1 30.1 46.6 5.2 51.8 1.2 16 4 ES 478 96 7.0 15.3 29.3 42.5 5.9 48.4 2.3 471 99 5.6 10.1 25.9 51.7 6.7 58.4 2.3 10 4
MS 978 95 6.0 21.7 32.5 37.4 2.5 39.9 1.6 933 99 2.9 15.7 29.6 45.7 6.0 51.7 1.6 12 3 HS 515 92 15.9 39.6 29.7 14.6 0.2 14.8 1.6 476 100 4.2 15.0 35.2 43.5 2.1 45.6 2.3 31 7
Coventry All 2837 96 10.6 27.5 35.4 25.5 1.0 26.4 0.8 2714 99 9.9 22.2 33.0 31.8 3.1 34.9 0.9 8 3 ES 1081 99 8.7 21.2 34.1 34.0 2.0 36.0 1.5 1092 99 7.8 19.4 26.6 40.3 5.8 46.1 1.5 10 0
MS 1144 97 12.1 24.1 36.9 26.4 0.5 26.8 1.3 1124 99 10.6 22.0 36.4 29.6 1.5 31.1 1.4 4 2 HS 612 91 11.4 46.5 34.8 7.4 0.0 7.4 1.1 498 99 12.8 29.1 39.3 18.3 0.4 18.7 1.8 11 8
Cranston All 6353 95 12.7 30.1 33.7 21.8 1.7 23.5 0.5 6345 98 12.7 27.8 32.3 25.2 1.9 27.1 0.6 4 4 ES 3273 97 10.9 25.9 34.1 26.7 2.5 29.1 0.8 3250 98 11.2 24.2 31.1 30.5 2.9 33.4 0.8 4 1
MS 1716 94 11.8 29.8 34.9 22.1 1.4 23.5 1.1 1694 98 13.3 26.4 33.6 25.5 1.3 26.8 1.1 3 3 HS 1364 89 18.7 41.5 31.0 8.8 0.1 8.9 0.8 1401 99 15.5 38.0 33.6 12.5 0.4 12.9 0.9 4 9
Cumberland All 2692 95 9.4 22.8 31.2 32.7 4.0 36.7 1.0 2706 96 7.3 19.1 30.1 37.8 5.7 43.5 1.0 7 1 ES 1071 97 4.5 13.5 29.8 44.0 8.2 52.2 1.5 1058 97 3.7 12.8 25.0 46.9 11.5 58.5 1.5 6 0 MS 1119 93 8.3 22.3 34.8 33.0 1.5 34.6 1.5 1138 93 8.3 17.6 33.6 38.2 2.4 40.6 1.5 6 1
HS 502 94 22.6 44.3 26.2 7.0 0.0 7.0 1.2 510 99 12.7 35.0 33.4 18.5 0.4 18.9 1.7 12 y Davies Career and Tech. HS 401 98 16.1 49.9 26.9 7.2 0.0 7.2 1.3 447 97 13.9 46.3 33.3 6.5 0.0 6.5 1.2 -1 -1
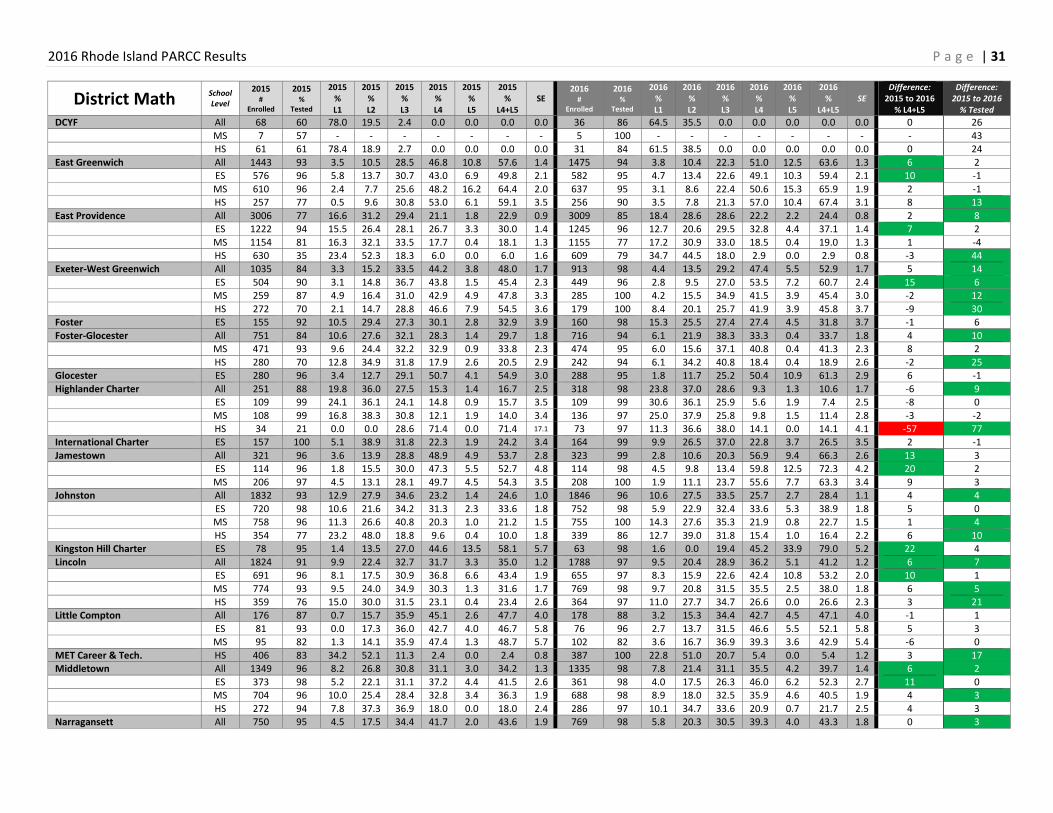
2016 Rhode Island PARCC Results P a g e | 31
District Math School Level
2015 #
Enrolled
2015 %
Tested
2015 % L1
2015 % L2
2015 % L3
2015 % L4
2015 % L5
2015 %
L4+L5 SE
2016 #
Enrolled
2016 %
Tested
2016 % L1
2016 % L2
2016 % L3
2016 % L4
2016 % L5
2016 %
L4+L5 SE
Difference: 2015 to 2016
% L4+L5
Difference: 2015 to 2016
% Tested
DCYF All 68 60 78.0 19.5 2.4 0.0 0.0 0.0 0.0 36 86 64.5 35.5 0.0 0.0 0.0 0.0 0.0 0 26
MS 7 57 - - - - - - - 5 100 - - - - - - - - 43 HS 61 61 78.4 18.9 2.7 0.0 0.0 0.0 0.0 31 84 61.5 38.5 0.0 0.0 0.0 0.0 0.0 0 24
East Greenwich All 1443 93 3.5 10.5 28.5 46.8 10.8 57.6 1.4 1475 94 3.8 10.4 22.3 51.0 12.5 63.6 1.3 6 2 ES 576 96 5.8 13.7 30.7 43.0 6.9 49.8 2.1 582 95 4.7 13.4 22.6 49.1 10.3 59.4 2.1 10 -1
MS 610 96 2.4 7.7 25.6 48.2 16.2 64.4 2.0 637 95 3.1 8.6 22.4 50.6 15.3 65.9 1.9 2 -1 HS 257 77 0.5 9.6 30.8 53.0 6.1 59.1 3.5 256 90 3.5 7.8 21.3 57.0 10.4 67.4 3.1 8 13
East Providence All 3006 77 16.6 31.2 29.4 21.1 1.8 22.9 0.9 3009 85 18.4 28.6 28.6 22.2 2.2 24.4 0.8 2 8 ES 1222 94 15.5 26.4 28.1 26.7 3.3 30.0 1.4 1245 96 12.7 20.6 29.5 32.8 4.4 37.1 1.4 7 2
MS 1154 81 16.3 32.1 33.5 17.7 0.4 18.1 1.3 1155 77 17.2 30.9 33.0 18.5 0.4 19.0 1.3 1 -4 HS 630 35 23.4 52.3 18.3 6.0 0.0 6.0 1.6 609 79 34.7 44.5 18.0 2.9 0.0 2.9 0.8 -3 44 Exeter-West Greenwich All 1035 84 3.3 15.2 33.5 44.2 3.8 48.0 1.7 913 98 4.4 13.5 29.2 47.4 5.5 52.9 1.7 5 14
ES 504 90 3.1 14.8 36.7 43.8 1.5 45.4 2.3 449 96 2.8 9.5 27.0 53.5 7.2 60.7 2.4 15 6 MS 259 87 4.9 16.4 31.0 42.9 4.9 47.8 3.3 285 100 4.2 15.5 34.9 41.5 3.9 45.4 3.0 -2 12
HS 272 70 2.1 14.7 28.8 46.6 7.9 54.5 3.6 179 100 8.4 20.1 25.7 41.9 3.9 45.8 3.7 -9 30 Foster ES 155 92 10.5 29.4 27.3 30.1 2.8 32.9 3.9 160 98 15.3 25.5 27.4 27.4 4.5 31.8 3.7 -1 6
Foster-Glocester All 751 84 10.6 27.6 32.1 28.3 1.4 29.7 1.8 716 94 6.1 21.9 38.3 33.3 0.4 33.7 1.8 4 10 MS 471 93 9.6 24.4 32.2 32.9 0.9 33.8 2.3 474 95 6.0 15.6 37.1 40.8 0.4 41.3 2.3 8 2
HS 280 70 12.8 34.9 31.8 17.9 2.6 20.5 2.9 242 94 6.1 34.2 40.8 18.4 0.4 18.9 2.6 -2 25 Glocester ES 280 96 3.4 12.7 29.1 50.7 4.1 54.9 3.0 288 95 1.8 11.7 25.2 50.4 10.9 61.3 2.9 6 -1
Highlander Charter All 251 88 19.8 36.0 27.5 15.3 1.4 16.7 2.5 318 98 23.8 37.0 28.6 9.3 1.3 10.6 1.7 -6 9 ES 109 99 24.1 36.1 24.1 14.8 0.9 15.7 3.5 109 99 30.6 36.1 25.9 5.6 1.9 7.4 2.5 -8 0
MS 108 99 16.8 38.3 30.8 12.1 1.9 14.0 3.4 136 97 25.0 37.9 25.8 9.8 1.5 11.4 2.8 -3 -2 HS 34 21 0.0 0.0 28.6 71.4 0.0 71.4 17.1 73 97 11.3 36.6 38.0 14.1 0.0 14.1 4.1 -57 77 International Charter ES 157 100 5.1 38.9 31.8 22.3 1.9 24.2 3.4 164 99 9.9 26.5 37.0 22.8 3.7 26.5 3.5 2 -1
Jamestown All 321 96 3.6 13.9 28.8 48.9 4.9 53.7 2.8 323 99 2.8 10.6 20.3 56.9 9.4 66.3 2.6 13 3 ES 114 96 1.8 15.5 30.0 47.3 5.5 52.7 4.8 114 98 4.5 9.8 13.4 59.8 12.5 72.3 4.2 20 2
MS 206 97 4.5 13.1 28.1 49.7 4.5 54.3 3.5 208 100 1.9 11.1 23.7 55.6 7.7 63.3 3.4 9 3 Johnston All 1832 93 12.9 27.9 34.6 23.2 1.4 24.6 1.0 1846 96 10.6 27.5 33.5 25.7 2.7 28.4 1.1 4 4
ES 720 98 10.6 21.6 34.2 31.3 2.3 33.6 1.8 752 98 5.9 22.9 32.4 33.6 5.3 38.9 1.8 5 0 MS 758 96 11.3 26.6 40.8 20.3 1.0 21.2 1.5 755 100 14.3 27.6 35.3 21.9 0.8 22.7 1.5 1 4
HS 354 77 23.2 48.0 18.8 9.6 0.4 10.0 1.8 339 86 12.7 39.0 31.8 15.4 1.0 16.4 2.2 6 10 Kingston Hill Charter ES 78 95 1.4 13.5 27.0 44.6 13.5 58.1 5.7 63 98 1.6 0.0 19.4 45.2 33.9 79.0 5.2 22 4
Lincoln All 1824 91 9.9 22.4 32.7 31.7 3.3 35.0 1.2 1788 97 9.5 20.4 28.9 36.2 5.1 41.2 1.2 6 7 ES 691 96 8.1 17.5 30.9 36.8 6.6 43.4 1.9 655 97 8.3 15.9 22.6 42.4 10.8 53.2 2.0 10 1
MS 774 93 9.5 24.0 34.9 30.3 1.3 31.6 1.7 769 98 9.7 20.8 31.5 35.5 2.5 38.0 1.8 6 5 HS 359 76 15.0 30.0 31.5 23.1 0.4 23.4 2.6 364 97 11.0 27.7 34.7 26.6 0.0 26.6 2.3 3 21 Little Compton All 176 87 0.7 15.7 35.9 45.1 2.6 47.7 4.0 178 88 3.2 15.3 34.4 42.7 4.5 47.1 4.0 -1 1
ES 81 93 0.0 17.3 36.0 42.7 4.0 46.7 5.8 76 96 2.7 13.7 31.5 46.6 5.5 52.1 5.8 5 3 MS 95 82 1.3 14.1 35.9 47.4 1.3 48.7 5.7 102 82 3.6 16.7 36.9 39.3 3.6 42.9 5.4 -6 0
MET Career & Tech. HS 406 83 34.2 52.1 11.3 2.4 0.0 2.4 0.8 387 100 22.8 51.0 20.7 5.4 0.0 5.4 1.2 3 17 Middletown All 1349 96 8.2 26.8 30.8 31.1 3.0 34.2 1.3 1335 98 7.8 21.4 31.1 35.5 4.2 39.7 1.4 6 2
ES 373 98 5.2 22.1 31.1 37.2 4.4 41.5 2.6 361 98 4.0 17.5 26.3 46.0 6.2 52.3 2.7 11 0 MS 704 96 10.0 25.4 28.4 32.8 3.4 36.3 1.9 688 98 8.9 18.0 32.5 35.9 4.6 40.5 1.9 4 3
HS 272 94 7.8 37.3 36.9 18.0 0.0 18.0 2.4 286 97 10.1 34.7 33.6 20.9 0.7 21.7 2.5 4 3 Narragansett All 750 95 4.5 17.5 34.4 41.7 2.0 43.6 1.9 769 98 5.8 20.3 30.5 39.3 4.0 43.3 1.8 0 3
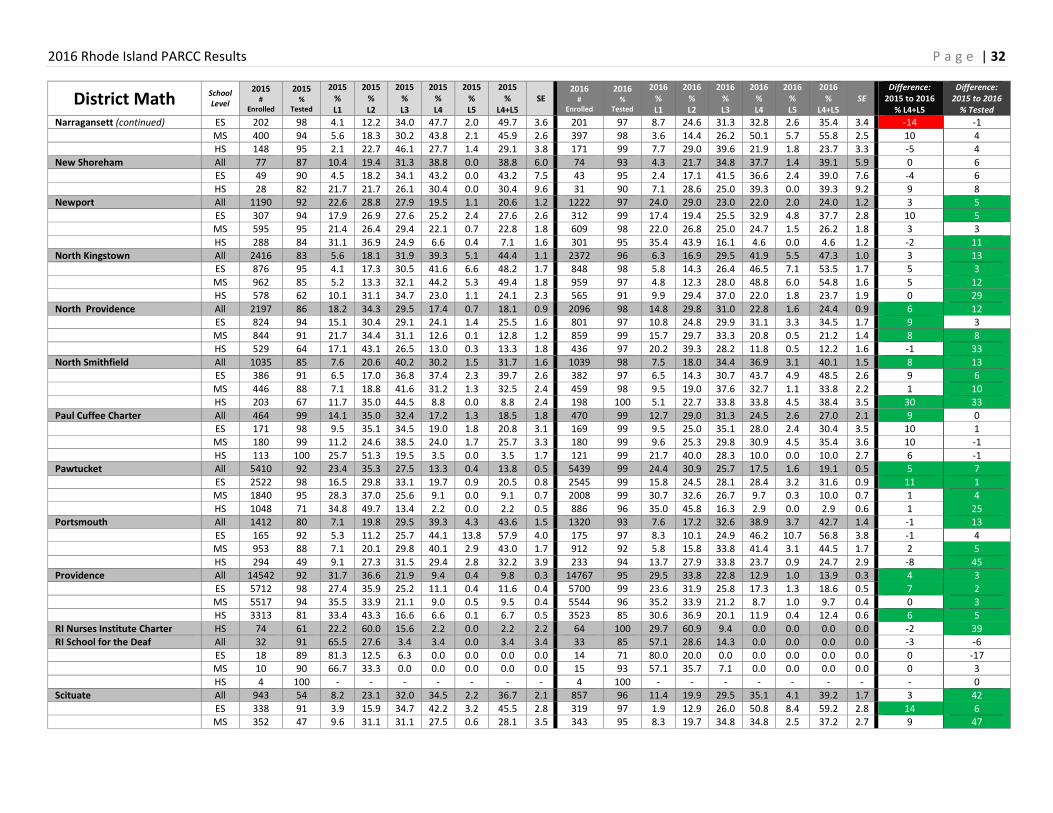
2016 Rhode Island PARCC Results P a g e | 32
District Math School Level
2015 #
Enrolled
2015 %
Tested
2015 % L1
2015 % L2
2015 % L3
2015 % L4
2015 % L5
2015 %
L4+L5 SE
2016 #
Enrolled
2016 %
Tested
2016 % L1
2016 % L2
2016 % L3
2016 % L4
2016 % L5
2016 %
L4+L5 SE
Difference: 2015 to 2016
% L4+L5
Difference: 2015 to 2016
% Tested
Narragansett (continued) ES 202 98 4.1 12.2 34.0 47.7 2.0 49.7 3.6 201 97 8.7 24.6 31.3 32.8 2.6 35.4 3.4 -14 -1
MS 400 94 5.6 18.3 30.2 43.8 2.1 45.9 2.6 397 98 3.6 14.4 26.2 50.1 5.7 55.8 2.5 10 4 HS 148 95 2.1 22.7 46.1 27.7 1.4 29.1 3.8 171 99 7.7 29.0 39.6 21.9 1.8 23.7 3.3 -5 4
New Shoreham All 77 87 10.4 19.4 31.3 38.8 0.0 38.8 6.0 74 93 4.3 21.7 34.8 37.7 1.4 39.1 5.9 0 6 ES 49 90 4.5 18.2 34.1 43.2 0.0 43.2 7.5 43 95 2.4 17.1 41.5 36.6 2.4 39.0 7.6 -4 6
HS 28 82 21.7 21.7 26.1 30.4 0.0 30.4 9.6 31 90 7.1 28.6 25.0 39.3 0.0 39.3 9.2 9 8 Newport All 1190 92 22.6 28.8 27.9 19.5 1.1 20.6 1.2 1222 97 24.0 29.0 23.0 22.0 2.0 24.0 1.2 3 5
ES 307 94 17.9 26.9 27.6 25.2 2.4 27.6 2.6 312 99 17.4 19.4 25.5 32.9 4.8 37.7 2.8 10 5 MS 595 95 21.4 26.4 29.4 22.1 0.7 22.8 1.8 609 98 22.0 26.8 25.0 24.7 1.5 26.2 1.8 3 3
HS 288 84 31.1 36.9 24.9 6.6 0.4 7.1 1.6 301 95 35.4 43.9 16.1 4.6 0.0 4.6 1.2 -2 11 North Kingstown All 2416 83 5.6 18.1 31.9 39.3 5.1 44.4 1.1 2372 96 6.3 16.9 29.5 41.9 5.5 47.3 1.0 3 13 ES 876 95 4.1 17.3 30.5 41.6 6.6 48.2 1.7 848 98 5.8 14.3 26.4 46.5 7.1 53.5 1.7 5 3
MS 962 85 5.2 13.3 32.1 44.2 5.3 49.4 1.8 959 97 4.8 12.3 28.0 48.8 6.0 54.8 1.6 5 12 HS 578 62 10.1 31.1 34.7 23.0 1.1 24.1 2.3 565 91 9.9 29.4 37.0 22.0 1.8 23.7 1.9 0 29
North Providence All 2197 86 18.2 34.3 29.5 17.4 0.7 18.1 0.9 2096 98 14.8 29.8 31.0 22.8 1.6 24.4 0.9 6 12 ES 824 94 15.1 30.4 29.1 24.1 1.4 25.5 1.6 801 97 10.8 24.8 29.9 31.1 3.3 34.5 1.7 9 3
MS 844 91 21.7 34.4 31.1 12.6 0.1 12.8 1.2 859 99 15.7 29.7 33.3 20.8 0.5 21.2 1.4 8 8 HS 529 64 17.1 43.1 26.5 13.0 0.3 13.3 1.8 436 97 20.2 39.3 28.2 11.8 0.5 12.2 1.6 -1 33
North Smithfield All 1035 85 7.6 20.6 40.2 30.2 1.5 31.7 1.6 1039 98 7.5 18.0 34.4 36.9 3.1 40.1 1.5 8 13 ES 386 91 6.5 17.0 36.8 37.4 2.3 39.7 2.6 382 97 6.5 14.3 30.7 43.7 4.9 48.5 2.6 9 6
MS 446 88 7.1 18.8 41.6 31.2 1.3 32.5 2.4 459 98 9.5 19.0 37.6 32.7 1.1 33.8 2.2 1 10 HS 203 67 11.7 35.0 44.5 8.8 0.0 8.8 2.4 198 100 5.1 22.7 33.8 33.8 4.5 38.4 3.5 30 33
Paul Cuffee Charter All 464 99 14.1 35.0 32.4 17.2 1.3 18.5 1.8 470 99 12.7 29.0 31.3 24.5 2.6 27.0 2.1 9 0 ES 171 98 9.5 35.1 34.5 19.0 1.8 20.8 3.1 169 99 9.5 25.0 35.1 28.0 2.4 30.4 3.5 10 1 MS 180 99 11.2 24.6 38.5 24.0 1.7 25.7 3.3 180 99 9.6 25.3 29.8 30.9 4.5 35.4 3.6 10 -1
HS 113 100 25.7 51.3 19.5 3.5 0.0 3.5 1.7 121 99 21.7 40.0 28.3 10.0 0.0 10.0 2.7 6 -1 Pawtucket All 5410 92 23.4 35.3 27.5 13.3 0.4 13.8 0.5 5439 99 24.4 30.9 25.7 17.5 1.6 19.1 0.5 5 7
ES 2522 98 16.5 29.8 33.1 19.7 0.9 20.5 0.8 2545 99 15.8 24.5 28.1 28.4 3.2 31.6 0.9 11 1 MS 1840 95 28.3 37.0 25.6 9.1 0.0 9.1 0.7 2008 99 30.7 32.6 26.7 9.7 0.3 10.0 0.7 1 4
HS 1048 71 34.8 49.7 13.4 2.2 0.0 2.2 0.5 886 96 35.0 45.8 16.3 2.9 0.0 2.9 0.6 1 25 Portsmouth All 1412 80 7.1 19.8 29.5 39.3 4.3 43.6 1.5 1320 93 7.6 17.2 32.6 38.9 3.7 42.7 1.4 -1 13
ES 165 92 5.3 11.2 25.7 44.1 13.8 57.9 4.0 175 97 8.3 10.1 24.9 46.2 10.7 56.8 3.8 -1 4 MS 953 88 7.1 20.1 29.8 40.1 2.9 43.0 1.7 912 92 5.8 15.8 33.8 41.4 3.1 44.5 1.7 2 5
HS 294 49 9.1 27.3 31.5 29.4 2.8 32.2 3.9 233 94 13.7 27.9 33.8 23.7 0.9 24.7 2.9 -8 45 Providence All 14542 92 31.7 36.6 21.9 9.4 0.4 9.8 0.3 14767 95 29.5 33.8 22.8 12.9 1.0 13.9 0.3 4 3
ES 5712 98 27.4 35.9 25.2 11.1 0.4 11.6 0.4 5700 99 23.6 31.9 25.8 17.3 1.3 18.6 0.5 7 2 MS 5517 94 35.5 33.9 21.1 9.0 0.5 9.5 0.4 5544 96 35.2 33.9 21.2 8.7 1.0 9.7 0.4 0 3 HS 3313 81 33.4 43.3 16.6 6.6 0.1 6.7 0.5 3523 85 30.6 36.9 20.1 11.9 0.4 12.4 0.6 6 5
RI Nurses Institute Charter HS 74 61 22.2 60.0 15.6 2.2 0.0 2.2 2.2 64 100 29.7 60.9 9.4 0.0 0.0 0.0 0.0 -2 39 RI School for the Deaf All 32 91 65.5 27.6 3.4 3.4 0.0 3.4 3.4 33 85 57.1 28.6 14.3 0.0 0.0 0.0 0.0 -3 -6
ES 18 89 81.3 12.5 6.3 0.0 0.0 0.0 0.0 14 71 80.0 20.0 0.0 0.0 0.0 0.0 0.0 0 -17 MS 10 90 66.7 33.3 0.0 0.0 0.0 0.0 0.0 15 93 57.1 35.7 7.1 0.0 0.0 0.0 0.0 0 3
HS 4 100 - - - - - - - 4 100 - - - - - - - - 0 Scituate All 943 54 8.2 23.1 32.0 34.5 2.2 36.7 2.1 857 96 11.4 19.9 29.5 35.1 4.1 39.2 1.7 3 42
ES 338 91 3.9 15.9 34.7 42.2 3.2 45.5 2.8 319 97 1.9 12.9 26.0 50.8 8.4 59.2 2.8 14 6 MS 352 47 9.6 31.1 31.1 27.5 0.6 28.1 3.5 343 95 8.3 19.7 34.8 34.8 2.5 37.2 2.7 9 47
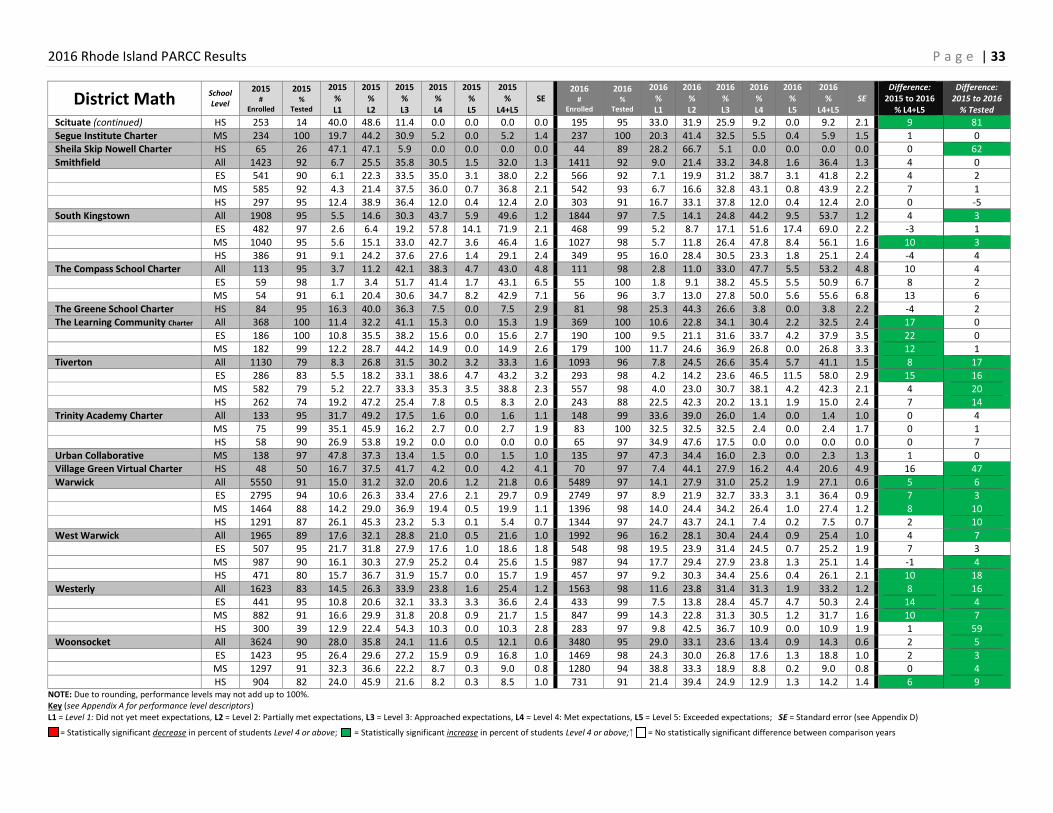
2016 Rhode Island PARCC Results P a g e | 33
District Math School Level
2015 #
Enrolled
2015 %
Tested
2015 % L1
2015 % L2
2015 % L3
2015 % L4
2015 % L5
2015 %
L4+L5 SE
2016 #
Enrolled
2016 %
Tested
2016 % L1
2016 % L2
2016 % L3
2016 % L4
2016 % L5
2016 %
L4+L5 SE
Difference: 2015 to 2016
% L4+L5
Difference: 2015 to 2016
% Tested
Scituate (continued) HS 253 14 40.0 48.6 11.4 0.0 0.0 0.0 0.0 195 95 33.0 31.9 25.9 9.2 0.0 9.2 2.1 9 81
Segue Institute Charter MS 234 100 19.7 44.2 30.9 5.2 0.0 5.2 1.4 237 100 20.3 41.4 32.5 5.5 0.4 5.9 1.5 1 0 Sheila Skip Nowell Charter HS 65 26 47.1 47.1 5.9 0.0 0.0 0.0 0.0 44 89 28.2 66.7 5.1 0.0 0.0 0.0 0.0 0 62
Smithfield All 1423 92 6.7 25.5 35.8 30.5 1.5 32.0 1.3 1411 92 9.0 21.4 33.2 34.8 1.6 36.4 1.3 4 0 ES 541 90 6.1 22.3 33.5 35.0 3.1 38.0 2.2 566 92 7.1 19.9 31.2 38.7 3.1 41.8 2.2 4 2
MS 585 92 4.3 21.4 37.5 36.0 0.7 36.8 2.1 542 93 6.7 16.6 32.8 43.1 0.8 43.9 2.2 7 1 HS 297 95 12.4 38.9 36.4 12.0 0.4 12.4 2.0 303 91 16.7 33.1 37.8 12.0 0.4 12.4 2.0 0 -5
South Kingstown All 1908 95 5.5 14.6 30.3 43.7 5.9 49.6 1.2 1844 97 7.5 14.1 24.8 44.2 9.5 53.7 1.2 4 3 ES 482 97 2.6 6.4 19.2 57.8 14.1 71.9 2.1 468 99 5.2 8.7 17.1 51.6 17.4 69.0 2.2 -3 1
MS 1040 95 5.6 15.1 33.0 42.7 3.6 46.4 1.6 1027 98 5.7 11.8 26.4 47.8 8.4 56.1 1.6 10 3 HS 386 91 9.1 24.2 37.6 27.6 1.4 29.1 2.4 349 95 16.0 28.4 30.5 23.3 1.8 25.1 2.4 -4 4 The Compass School Charter All 113 95 3.7 11.2 42.1 38.3 4.7 43.0 4.8 111 98 2.8 11.0 33.0 47.7 5.5 53.2 4.8 10 4
ES 59 98 1.7 3.4 51.7 41.4 1.7 43.1 6.5 55 100 1.8 9.1 38.2 45.5 5.5 50.9 6.7 8 2 MS 54 91 6.1 20.4 30.6 34.7 8.2 42.9 7.1 56 96 3.7 13.0 27.8 50.0 5.6 55.6 6.8 13 6
The Greene School Charter HS 84 95 16.3 40.0 36.3 7.5 0.0 7.5 2.9 81 98 25.3 44.3 26.6 3.8 0.0 3.8 2.2 -4 2 The Learning Community Charter All 368 100 11.4 32.2 41.1 15.3 0.0 15.3 1.9 369 100 10.6 22.8 34.1 30.4 2.2 32.5 2.4 17 0
ES 186 100 10.8 35.5 38.2 15.6 0.0 15.6 2.7 190 100 9.5 21.1 31.6 33.7 4.2 37.9 3.5 22 0 MS 182 99 12.2 28.7 44.2 14.9 0.0 14.9 2.6 179 100 11.7 24.6 36.9 26.8 0.0 26.8 3.3 12 1
Tiverton All 1130 79 8.3 26.8 31.5 30.2 3.2 33.3 1.6 1093 96 7.8 24.5 26.6 35.4 5.7 41.1 1.5 8 17 ES 286 83 5.5 18.2 33.1 38.6 4.7 43.2 3.2 293 98 4.2 14.2 23.6 46.5 11.5 58.0 2.9 15 16
MS 582 79 5.2 22.7 33.3 35.3 3.5 38.8 2.3 557 98 4.0 23.0 30.7 38.1 4.2 42.3 2.1 4 20 HS 262 74 19.2 47.2 25.4 7.8 0.5 8.3 2.0 243 88 22.5 42.3 20.2 13.1 1.9 15.0 2.4 7 14
Trinity Academy Charter All 133 95 31.7 49.2 17.5 1.6 0.0 1.6 1.1 148 99 33.6 39.0 26.0 1.4 0.0 1.4 1.0 0 4 MS 75 99 35.1 45.9 16.2 2.7 0.0 2.7 1.9 83 100 32.5 32.5 32.5 2.4 0.0 2.4 1.7 0 1 HS 58 90 26.9 53.8 19.2 0.0 0.0 0.0 0.0 65 97 34.9 47.6 17.5 0.0 0.0 0.0 0.0 0 7
Urban Collaborative MS 138 97 47.8 37.3 13.4 1.5 0.0 1.5 1.0 135 97 47.3 34.4 16.0 2.3 0.0 2.3 1.3 1 0 Village Green Virtual Charter HS 48 50 16.7 37.5 41.7 4.2 0.0 4.2 4.1 70 97 7.4 44.1 27.9 16.2 4.4 20.6 4.9 16 47
Warwick All 5550 91 15.0 31.2 32.0 20.6 1.2 21.8 0.6 5489 97 14.1 27.9 31.0 25.2 1.9 27.1 0.6 5 6 ES 2795 94 10.6 26.3 33.4 27.6 2.1 29.7 0.9 2749 97 8.9 21.9 32.7 33.3 3.1 36.4 0.9 7 3
MS 1464 88 14.2 29.0 36.9 19.4 0.5 19.9 1.1 1396 98 14.0 24.4 34.2 26.4 1.0 27.4 1.2 8 10 HS 1291 87 26.1 45.3 23.2 5.3 0.1 5.4 0.7 1344 97 24.7 43.7 24.1 7.4 0.2 7.5 0.7 2 10
West Warwick All 1965 89 17.6 32.1 28.8 21.0 0.5 21.6 1.0 1992 96 16.2 28.1 30.4 24.4 0.9 25.4 1.0 4 7 ES 507 95 21.7 31.8 27.9 17.6 1.0 18.6 1.8 548 98 19.5 23.9 31.4 24.5 0.7 25.2 1.9 7 3
MS 987 90 16.1 30.3 27.9 25.2 0.4 25.6 1.5 987 94 17.7 29.4 27.9 23.8 1.3 25.1 1.4 -1 4 HS 471 80 15.7 36.7 31.9 15.7 0.0 15.7 1.9 457 97 9.2 30.3 34.4 25.6 0.4 26.1 2.1 10 18
Westerly All 1623 83 14.5 26.3 33.9 23.8 1.6 25.4 1.2 1563 98 11.6 23.8 31.4 31.3 1.9 33.2 1.2 8 16 ES 441 95 10.8 20.6 32.1 33.3 3.3 36.6 2.4 433 99 7.5 13.8 28.4 45.7 4.7 50.3 2.4 14 4 MS 882 91 16.6 29.9 31.8 20.8 0.9 21.7 1.5 847 99 14.3 22.8 31.3 30.5 1.2 31.7 1.6 10 7
HS 300 39 12.9 22.4 54.3 10.3 0.0 10.3 2.8 283 97 9.8 42.5 36.7 10.9 0.0 10.9 1.9 1 59 Woonsocket All 3624 90 28.0 35.8 24.1 11.6 0.5 12.1 0.6 3480 95 29.0 33.1 23.6 13.4 0.9 14.3 0.6 2 5
ES 1423 95 26.4 29.6 27.2 15.9 0.9 16.8 1.0 1469 98 24.3 30.0 26.8 17.6 1.3 18.8 1.0 2 3 MS 1297 91 32.3 36.6 22.2 8.7 0.3 9.0 0.8 1280 94 38.8 33.3 18.9 8.8 0.2 9.0 0.8 0 4
HS 904 82 24.0 45.9 21.6 8.2 0.3 8.5 1.0 731 91 21.4 39.4 24.9 12.9 1.3 14.2 1.4 6 9 NOTE: Due to rounding, performance levels may not add up to 100%. Key (see Appendix A for performance level descriptors) L1 = Level 1: Did not yet meet expectations, L2 = Level 2: Partially met expectations, L3 = Level 3: Approached expectations, L4 = Level 4: Met expectations, L5 = Level 5: Exceeded expectations; SE = Standard error (see Appendix D)
= Statistically significant decrease in percent of students Level 4 or above; = Statistically significant increase in percent of students Level 4 or above; = No statistically significant difference between comparison years
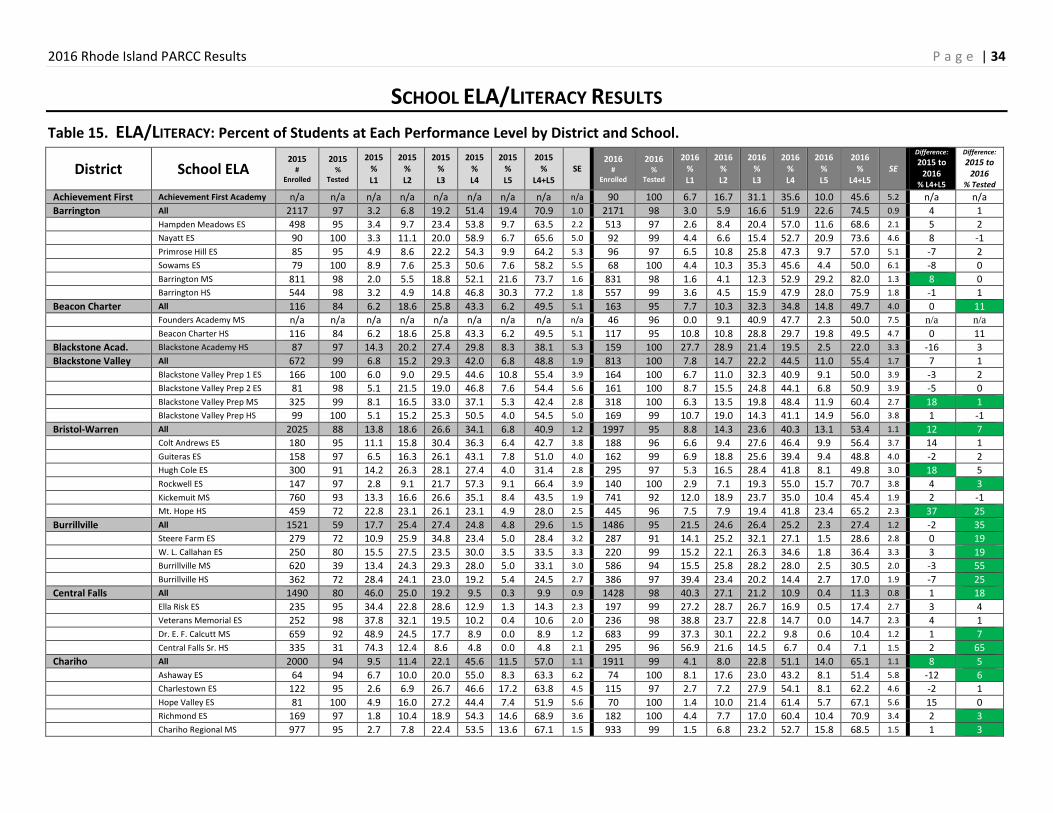
2016 Rhode Island PARCC Results P a g e | 34
SCHOOL ELA/LITERACY RESULTS
Table 15. ELA/LITERACY: Percent of Students at Each Performance Level by District and School.
District School ELA 2015
# Enrolled
2015 %
Tested
2015 % L1
2015 % L2
2015 % L3
2015 % L4
2015 % L5
2015 %
L4+L5 SE
2016 #
Enrolled
2016 %
Tested
2016 % L1
2016 % L2
2016 % L3
2016 % L4
2016 % L5
2016 %
L4+L5 SE
Difference:
2015 to 2016
% L4+L5
Difference:
2015 to 2016
% Tested
Achievement First Achievement First Academy n/a n/a n/a n/a n/a n/a n/a n/a n/a 90 100 6.7 16.7 31.1 35.6 10.0 45.6 5.2 n/a n/a
Barrington All 2117 97 3.2 6.8 19.2 51.4 19.4 70.9 1.0 2171 98 3.0 5.9 16.6 51.9 22.6 74.5 0.9 4 1
Hampden Meadows ES 498 95 3.4 9.7 23.4 53.8 9.7 63.5 2.2 513 97 2.6 8.4 20.4 57.0 11.6 68.6 2.1 5 2
Nayatt ES 90 100 3.3 11.1 20.0 58.9 6.7 65.6 5.0 92 99 4.4 6.6 15.4 52.7 20.9 73.6 4.6 8 -1
Primrose Hill ES 85 95 4.9 8.6 22.2 54.3 9.9 64.2 5.3 96 97 6.5 10.8 25.8 47.3 9.7 57.0 5.1 -7 2
Sowams ES 79 100 8.9 7.6 25.3 50.6 7.6 58.2 5.5 68 100 4.4 10.3 35.3 45.6 4.4 50.0 6.1 -8 0
Barrington MS 811 98 2.0 5.5 18.8 52.1 21.6 73.7 1.6 831 98 1.6 4.1 12.3 52.9 29.2 82.0 1.3 8 0
Barrington HS 544 98 3.2 4.9 14.8 46.8 30.3 77.2 1.8 557 99 3.6 4.5 15.9 47.9 28.0 75.9 1.8 -1 1
Beacon Charter All 116 84 6.2 18.6 25.8 43.3 6.2 49.5 5.1 163 95 7.7 10.3 32.3 34.8 14.8 49.7 4.0 0 11
Founders Academy MS n/a n/a n/a n/a n/a n/a n/a n/a n/a 46 96 0.0 9.1 40.9 47.7 2.3 50.0 7.5 n/a n/a
Beacon Charter HS 116 84 6.2 18.6 25.8 43.3 6.2 49.5 5.1 117 95 10.8 10.8 28.8 29.7 19.8 49.5 4.7 0 11
Blackstone Acad. Blackstone Academy HS 87 97 14.3 20.2 27.4 29.8 8.3 38.1 5.3 159 100 27.7 28.9 21.4 19.5 2.5 22.0 3.3 -16 3
Blackstone Valley All 672 99 6.8 15.2 29.3 42.0 6.8 48.8 1.9 813 100 7.8 14.7 22.2 44.5 11.0 55.4 1.7 7 1
Blackstone Valley Prep 1 ES 166 100 6.0 9.0 29.5 44.6 10.8 55.4 3.9 164 100 6.7 11.0 32.3 40.9 9.1 50.0 3.9 -3 2
Blackstone Valley Prep 2 ES 81 98 5.1 21.5 19.0 46.8 7.6 54.4 5.6 161 100 8.7 15.5 24.8 44.1 6.8 50.9 3.9 -5 0
Blackstone Valley Prep MS 325 99 8.1 16.5 33.0 37.1 5.3 42.4 2.8 318 100 6.3 13.5 19.8 48.4 11.9 60.4 2.7 18 1
Blackstone Valley Prep HS 99 100 5.1 15.2 25.3 50.5 4.0 54.5 5.0 169 99 10.7 19.0 14.3 41.1 14.9 56.0 3.8 1 -1
Bristol-Warren All 2025 88 13.8 18.6 26.6 34.1 6.8 40.9 1.2 1997 95 8.8 14.3 23.6 40.3 13.1 53.4 1.1 12 7
Colt Andrews ES 180 95 11.1 15.8 30.4 36.3 6.4 42.7 3.8 188 96 6.6 9.4 27.6 46.4 9.9 56.4 3.7 14 1
Guiteras ES 158 97 6.5 16.3 26.1 43.1 7.8 51.0 4.0 162 99 6.9 18.8 25.6 39.4 9.4 48.8 4.0 -2 2
Hugh Cole ES 300 91 14.2 26.3 28.1 27.4 4.0 31.4 2.8 295 97 5.3 16.5 28.4 41.8 8.1 49.8 3.0 18 5
Rockwell ES 147 97 2.8 9.1 21.7 57.3 9.1 66.4 3.9 140 100 2.9 7.1 19.3 55.0 15.7 70.7 3.8 4 3
Kickemuit MS 760 93 13.3 16.6 26.6 35.1 8.4 43.5 1.9 741 92 12.0 18.9 23.7 35.0 10.4 45.4 1.9 2 -1
Mt. Hope HS 459 72 22.8 23.1 26.1 23.1 4.9 28.0 2.5 445 96 7.5 7.9 19.4 41.8 23.4 65.2 2.3 37 25
Burrillville All 1521 59 17.7 25.4 27.4 24.8 4.8 29.6 1.5 1486 95 21.5 24.6 26.4 25.2 2.3 27.4 1.2 -2 35
Steere Farm ES 279 72 10.9 25.9 34.8 23.4 5.0 28.4 3.2 287 91 14.1 25.2 32.1 27.1 1.5 28.6 2.8 0 19
W. L. Callahan ES 250 80 15.5 27.5 23.5 30.0 3.5 33.5 3.3 220 99 15.2 22.1 26.3 34.6 1.8 36.4 3.3 3 19
Burrillville MS 620 39 13.4 24.3 29.3 28.0 5.0 33.1 3.0 586 94 15.5 25.8 28.2 28.0 2.5 30.5 2.0 -3 55
Burrillville HS 362 72 28.4 24.1 23.0 19.2 5.4 24.5 2.7 386 97 39.4 23.4 20.2 14.4 2.7 17.0 1.9 -7 25
Central Falls All 1490 80 46.0 25.0 19.2 9.5 0.3 9.9 0.9 1428 98 40.3 27.1 21.2 10.9 0.4 11.3 0.8 1 18
Ella Risk ES 235 95 34.4 22.8 28.6 12.9 1.3 14.3 2.3 197 99 27.2 28.7 26.7 16.9 0.5 17.4 2.7 3 4
Veterans Memorial ES 252 98 37.8 32.1 19.5 10.2 0.4 10.6 2.0 236 98 38.8 23.7 22.8 14.7 0.0 14.7 2.3 4 1
Dr. E. F. Calcutt MS 659 92 48.9 24.5 17.7 8.9 0.0 8.9 1.2 683 99 37.3 30.1 22.2 9.8 0.6 10.4 1.2 1 7
Central Falls Sr. HS 335 31 74.3 12.4 8.6 4.8 0.0 4.8 2.1 295 96 56.9 21.6 14.5 6.7 0.4 7.1 1.5 2 65
Chariho All 2000 94 9.5 11.4 22.1 45.6 11.5 57.0 1.1 1911 99 4.1 8.0 22.8 51.1 14.0 65.1 1.1 8 5
Ashaway ES 64 94 6.7 10.0 20.0 55.0 8.3 63.3 6.2 74 100 8.1 17.6 23.0 43.2 8.1 51.4 5.8 -12 6
Charlestown ES 122 95 2.6 6.9 26.7 46.6 17.2 63.8 4.5 115 97 2.7 7.2 27.9 54.1 8.1 62.2 4.6 -2 1
Hope Valley ES 81 100 4.9 16.0 27.2 44.4 7.4 51.9 5.6 70 100 1.4 10.0 21.4 61.4 5.7 67.1 5.6 15 0
Richmond ES 169 97 1.8 10.4 18.9 54.3 14.6 68.9 3.6 182 100 4.4 7.7 17.0 60.4 10.4 70.9 3.4 2 3
Chariho Regional MS 977 95 2.7 7.8 22.4 53.5 13.6 67.1 1.5 933 99 1.5 6.8 23.2 52.7 15.8 68.5 1.5 1 3
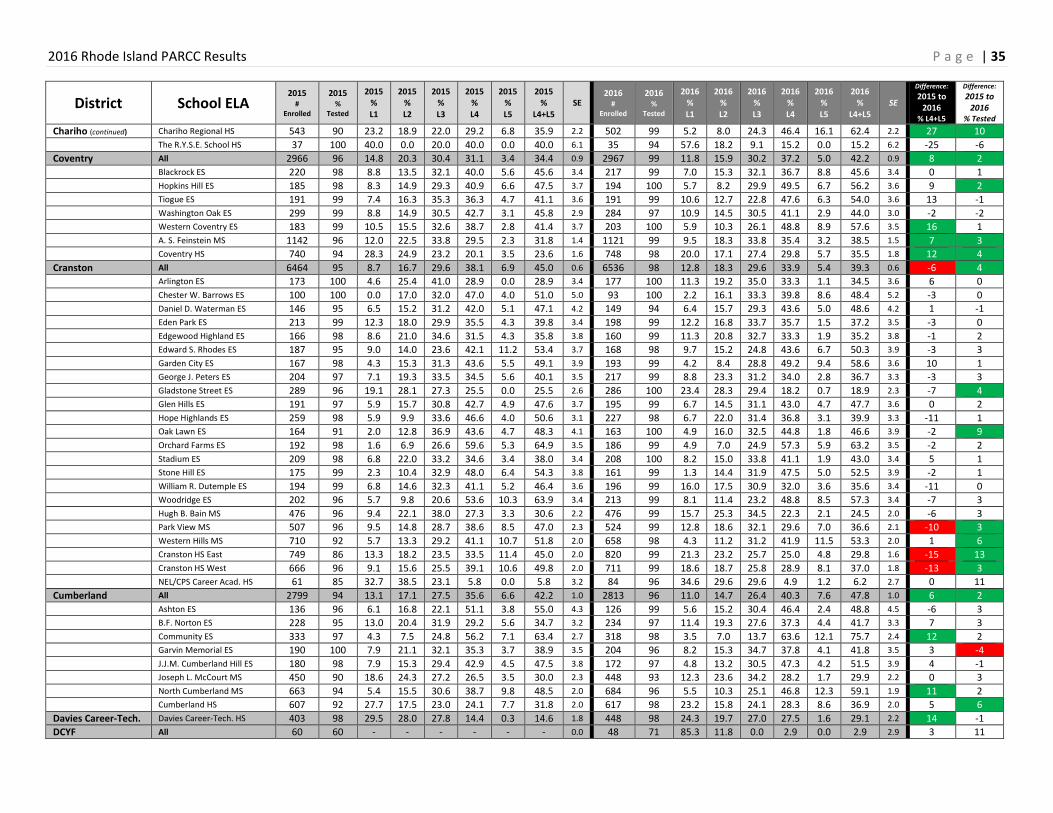
2016 Rhode Island PARCC Results P a g e | 35
District School ELA 2015
# Enrolled
2015 %
Tested
2015 % L1
2015 % L2
2015 % L3
2015 % L4
2015 % L5
2015 %
L4+L5 SE
2016 #
Enrolled
2016 %
Tested
2016 % L1
2016 % L2
2016 % L3
2016 % L4
2016 % L5
2016 %
L4+L5 SE
Difference:
2015 to 2016
% L4+L5
Difference:
2015 to 2016
% Tested
Chariho (continued) Chariho Regional HS 543 90 23.2 18.9 22.0 29.2 6.8 35.9 2.2 502 99 5.2 8.0 24.3 46.4 16.1 62.4 2.2 27 10
The R.Y.S.E. School HS 37 100 40.0 0.0 20.0 40.0 0.0 40.0 6.1 35 94 57.6 18.2 9.1 15.2 0.0 15.2 6.2 -25 -6
Coventry All 2966 96 14.8 20.3 30.4 31.1 3.4 34.4 0.9 2967 99 11.8 15.9 30.2 37.2 5.0 42.2 0.9 8 2
Blackrock ES 220 98 8.8 13.5 32.1 40.0 5.6 45.6 3.4 217 99 7.0 15.3 32.1 36.7 8.8 45.6 3.4 0 1
Hopkins Hill ES 185 98 8.3 14.9 29.3 40.9 6.6 47.5 3.7 194 100 5.7 8.2 29.9 49.5 6.7 56.2 3.6 9 2
Tiogue ES 191 99 7.4 16.3 35.3 36.3 4.7 41.1 3.6 191 99 10.6 12.7 22.8 47.6 6.3 54.0 3.6 13 -1
Washington Oak ES 299 99 8.8 14.9 30.5 42.7 3.1 45.8 2.9 284 97 10.9 14.5 30.5 41.1 2.9 44.0 3.0 -2 -2
Western Coventry ES 183 99 10.5 15.5 32.6 38.7 2.8 41.4 3.7 203 100 5.9 10.3 26.1 48.8 8.9 57.6 3.5 16 1
A. S. Feinstein MS 1142 96 12.0 22.5 33.8 29.5 2.3 31.8 1.4 1121 99 9.5 18.3 33.8 35.4 3.2 38.5 1.5 7 3
Coventry HS 740 94 28.3 24.9 23.2 20.1 3.5 23.6 1.6 748 98 20.0 17.1 27.4 29.8 5.7 35.5 1.8 12 4
Cranston All 6464 95 8.7 16.7 29.6 38.1 6.9 45.0 0.6 6536 98 12.8 18.3 29.6 33.9 5.4 39.3 0.6 -6 4
Arlington ES 173 100 4.6 25.4 41.0 28.9 0.0 28.9 3.4 177 100 11.3 19.2 35.0 33.3 1.1 34.5 3.6 6 0
Chester W. Barrows ES 100 100 0.0 17.0 32.0 47.0 4.0 51.0 5.0 93 100 2.2 16.1 33.3 39.8 8.6 48.4 5.2 -3 0
Daniel D. Waterman ES 146 95 6.5 15.2 31.2 42.0 5.1 47.1 4.2 149 94 6.4 15.7 29.3 43.6 5.0 48.6 4.2 1 -1
Eden Park ES 213 99 12.3 18.0 29.9 35.5 4.3 39.8 3.4 198 99 12.2 16.8 33.7 35.7 1.5 37.2 3.5 -3 0
Edgewood Highland ES 166 98 8.6 21.0 34.6 31.5 4.3 35.8 3.8 160 99 11.3 20.8 32.7 33.3 1.9 35.2 3.8 -1 2
Edward S. Rhodes ES 187 95 9.0 14.0 23.6 42.1 11.2 53.4 3.7 168 98 9.7 15.2 24.8 43.6 6.7 50.3 3.9 -3 3
Garden City ES 167 98 4.3 15.3 31.3 43.6 5.5 49.1 3.9 193 99 4.2 8.4 28.8 49.2 9.4 58.6 3.6 10 1
George J. Peters ES 204 97 7.1 19.3 33.5 34.5 5.6 40.1 3.5 217 99 8.8 23.3 31.2 34.0 2.8 36.7 3.3 -3 3
Gladstone Street ES 289 96 19.1 28.1 27.3 25.5 0.0 25.5 2.6 286 100 23.4 28.3 29.4 18.2 0.7 18.9 2.3 -7 4
Glen Hills ES 191 97 5.9 15.7 30.8 42.7 4.9 47.6 3.7 195 99 6.7 14.5 31.1 43.0 4.7 47.7 3.6 0 2
Hope Highlands ES 259 98 5.9 9.9 33.6 46.6 4.0 50.6 3.1 227 98 6.7 22.0 31.4 36.8 3.1 39.9 3.3 -11 1
Oak Lawn ES 164 91 2.0 12.8 36.9 43.6 4.7 48.3 4.1 163 100 4.9 16.0 32.5 44.8 1.8 46.6 3.9 -2 9
Orchard Farms ES 192 98 1.6 6.9 26.6 59.6 5.3 64.9 3.5 186 99 4.9 7.0 24.9 57.3 5.9 63.2 3.5 -2 2
Stadium ES 209 98 6.8 22.0 33.2 34.6 3.4 38.0 3.4 208 100 8.2 15.0 33.8 41.1 1.9 43.0 3.4 5 1
Stone Hill ES 175 99 2.3 10.4 32.9 48.0 6.4 54.3 3.8 161 99 1.3 14.4 31.9 47.5 5.0 52.5 3.9 -2 1
William R. Dutemple ES 194 99 6.8 14.6 32.3 41.1 5.2 46.4 3.6 196 99 16.0 17.5 30.9 32.0 3.6 35.6 3.4 -11 0
Woodridge ES 202 96 5.7 9.8 20.6 53.6 10.3 63.9 3.4 213 99 8.1 11.4 23.2 48.8 8.5 57.3 3.4 -7 3
Hugh B. Bain MS 476 96 9.4 22.1 38.0 27.3 3.3 30.6 2.2 476 99 15.7 25.3 34.5 22.3 2.1 24.5 2.0 -6 3
Park View MS 507 96 9.5 14.8 28.7 38.6 8.5 47.0 2.3 524 99 12.8 18.6 32.1 29.6 7.0 36.6 2.1 -10 3
Western Hills MS 710 92 5.7 13.3 29.2 41.1 10.7 51.8 2.0 658 98 4.3 11.2 31.2 41.9 11.5 53.3 2.0 1 6
Cranston HS East 749 86 13.3 18.2 23.5 33.5 11.4 45.0 2.0 820 99 21.3 23.2 25.7 25.0 4.8 29.8 1.6 -15 13
Cranston HS West 666 96 9.1 15.6 25.5 39.1 10.6 49.8 2.0 711 99 18.6 18.7 25.8 28.9 8.1 37.0 1.8 -13 3
NEL/CPS Career Acad. HS 61 85 32.7 38.5 23.1 5.8 0.0 5.8 3.2 84 96 34.6 29.6 29.6 4.9 1.2 6.2 2.7 0 11
Cumberland All 2799 94 13.1 17.1 27.5 35.6 6.6 42.2 1.0 2813 96 11.0 14.7 26.4 40.3 7.6 47.8 1.0 6 2
Ashton ES 136 96 6.1 16.8 22.1 51.1 3.8 55.0 4.3 126 99 5.6 15.2 30.4 46.4 2.4 48.8 4.5 -6 3
B.F. Norton ES 228 95 13.0 20.4 31.9 29.2 5.6 34.7 3.2 234 97 11.4 19.3 27.6 37.3 4.4 41.7 3.3 7 3
Community ES 333 97 4.3 7.5 24.8 56.2 7.1 63.4 2.7 318 98 3.5 7.0 13.7 63.6 12.1 75.7 2.4 12 2
Garvin Memorial ES 190 100 7.9 21.1 32.1 35.3 3.7 38.9 3.5 204 96 8.2 15.3 34.7 37.8 4.1 41.8 3.5 3 -4
J.J.M. Cumberland Hill ES 180 98 7.9 15.3 29.4 42.9 4.5 47.5 3.8 172 97 4.8 13.2 30.5 47.3 4.2 51.5 3.9 4 -1
Joseph L. McCourt MS 450 90 18.6 24.3 27.2 26.5 3.5 30.0 2.3 448 93 12.3 23.6 34.2 28.2 1.7 29.9 2.2 0 3
North Cumberland MS 663 94 5.4 15.5 30.6 38.7 9.8 48.5 2.0 684 96 5.5 10.3 25.1 46.8 12.3 59.1 1.9 11 2
Cumberland HS 607 92 27.7 17.5 23.0 24.1 7.7 31.8 2.0 617 98 23.2 15.8 24.1 28.3 8.6 36.9 2.0 5 6
Davies Career-Tech. Davies Career-Tech. HS 403 98 29.5 28.0 27.8 14.4 0.3 14.6 1.8 448 98 24.3 19.7 27.0 27.5 1.6 29.1 2.2 14 -1
DCYF All 60 60 - - - - - - 0.0 48 71 85.3 11.8 0.0 2.9 0.0 2.9 2.9 3 11
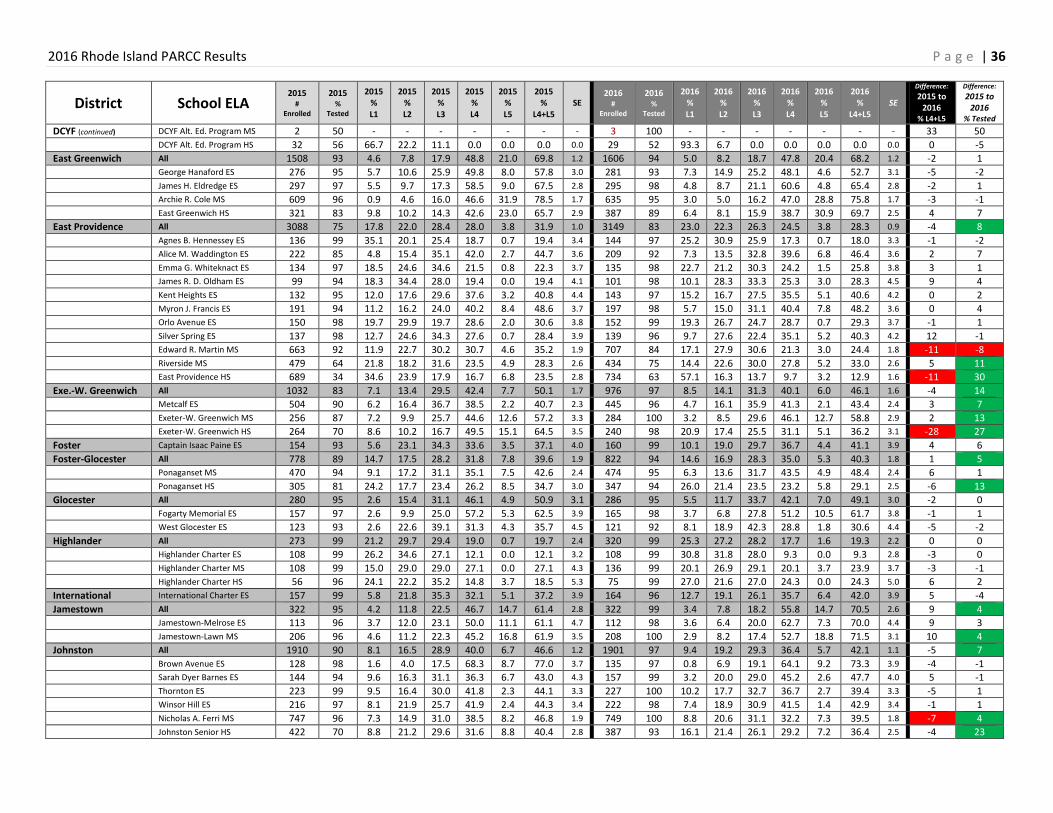
2016 Rhode Island PARCC Results P a g e | 36
District School ELA 2015
# Enrolled
2015 %
Tested
2015 % L1
2015 % L2
2015 % L3
2015 % L4
2015 % L5
2015 %
L4+L5 SE
2016 #
Enrolled
2016 %
Tested
2016 % L1
2016 % L2
2016 % L3
2016 % L4
2016 % L5
2016 %
L4+L5 SE
Difference:
2015 to 2016
% L4+L5
Difference:
2015 to 2016
% Tested
DCYF (continued) DCYF Alt. Ed. Program MS 2 50 - - - - - - - 3 100 - - - - - - - 33 50
DCYF Alt. Ed. Program HS 32 56 66.7 22.2 11.1 0.0 0.0 0.0 0.0 29 52 93.3 6.7 0.0 0.0 0.0 0.0 0.0 0 -5
East Greenwich All 1508 93 4.6 7.8 17.9 48.8 21.0 69.8 1.2 1606 94 5.0 8.2 18.7 47.8 20.4 68.2 1.2 -2 1
George Hanaford ES 276 95 5.7 10.6 25.9 49.8 8.0 57.8 3.0 281 93 7.3 14.9 25.2 48.1 4.6 52.7 3.1 -5 -2
James H. Eldredge ES 297 97 5.5 9.7 17.3 58.5 9.0 67.5 2.8 295 98 4.8 8.7 21.1 60.6 4.8 65.4 2.8 -2 1
Archie R. Cole MS 609 96 0.9 4.6 16.0 46.6 31.9 78.5 1.7 635 95 3.0 5.0 16.2 47.0 28.8 75.8 1.7 -3 -1
East Greenwich HS 321 83 9.8 10.2 14.3 42.6 23.0 65.7 2.9 387 89 6.4 8.1 15.9 38.7 30.9 69.7 2.5 4 7
East Providence All 3088 75 17.8 22.0 28.4 28.0 3.8 31.9 1.0 3149 83 23.0 22.3 26.3 24.5 3.8 28.3 0.9 -4 8
Agnes B. Hennessey ES 136 99 35.1 20.1 25.4 18.7 0.7 19.4 3.4 144 97 25.2 30.9 25.9 17.3 0.7 18.0 3.3 -1 -2
Alice M. Waddington ES 222 85 4.8 15.4 35.1 42.0 2.7 44.7 3.6 209 92 7.3 13.5 32.8 39.6 6.8 46.4 3.6 2 7
Emma G. Whiteknact ES 134 97 18.5 24.6 34.6 21.5 0.8 22.3 3.7 135 98 22.7 21.2 30.3 24.2 1.5 25.8 3.8 3 1
James R. D. Oldham ES 99 94 18.3 34.4 28.0 19.4 0.0 19.4 4.1 101 98 10.1 28.3 33.3 25.3 3.0 28.3 4.5 9 4
Kent Heights ES 132 95 12.0 17.6 29.6 37.6 3.2 40.8 4.4 143 97 15.2 16.7 27.5 35.5 5.1 40.6 4.2 0 2
Myron J. Francis ES 191 94 11.2 16.2 24.0 40.2 8.4 48.6 3.7 197 98 5.7 15.0 31.1 40.4 7.8 48.2 3.6 0 4
Orlo Avenue ES 150 98 19.7 29.9 19.7 28.6 2.0 30.6 3.8 152 99 19.3 26.7 24.7 28.7 0.7 29.3 3.7 -1 1
Silver Spring ES 137 98 12.7 24.6 34.3 27.6 0.7 28.4 3.9 139 96 9.7 27.6 22.4 35.1 5.2 40.3 4.2 12 -1
Edward R. Martin MS 663 92 11.9 22.7 30.2 30.7 4.6 35.2 1.9 707 84 17.1 27.9 30.6 21.3 3.0 24.4 1.8 -11 -8
Riverside MS 479 64 21.8 18.2 31.6 23.5 4.9 28.3 2.6 434 75 14.4 22.6 30.0 27.8 5.2 33.0 2.6 5 11
East Providence HS 689 34 34.6 23.9 17.9 16.7 6.8 23.5 2.8 734 63 57.1 16.3 13.7 9.7 3.2 12.9 1.6 -11 30
Exe.-W. Greenwich All 1032 83 7.1 13.4 29.5 42.4 7.7 50.1 1.7 976 97 8.5 14.1 31.3 40.1 6.0 46.1 1.6 -4 14
Metcalf ES 504 90 6.2 16.4 36.7 38.5 2.2 40.7 2.3 445 96 4.7 16.1 35.9 41.3 2.1 43.4 2.4 3 7
Exeter-W. Greenwich MS 256 87 7.2 9.9 25.7 44.6 12.6 57.2 3.3 284 100 3.2 8.5 29.6 46.1 12.7 58.8 2.9 2 13
Exeter-W. Greenwich HS 264 70 8.6 10.2 16.7 49.5 15.1 64.5 3.5 240 98 20.9 17.4 25.5 31.1 5.1 36.2 3.1 -28 27
Foster Captain Isaac Paine ES 154 93 5.6 23.1 34.3 33.6 3.5 37.1 4.0 160 99 10.1 19.0 29.7 36.7 4.4 41.1 3.9 4 6
Foster-Glocester All 778 89 14.7 17.5 28.2 31.8 7.8 39.6 1.9 822 94 14.6 16.9 28.3 35.0 5.3 40.3 1.8 1 5
Ponaganset MS 470 94 9.1 17.2 31.1 35.1 7.5 42.6 2.4 474 95 6.3 13.6 31.7 43.5 4.9 48.4 2.4 6 1
Ponaganset HS 305 81 24.2 17.7 23.4 26.2 8.5 34.7 3.0 347 94 26.0 21.4 23.5 23.2 5.8 29.1 2.5 -6 13
Glocester All 280 95 2.6 15.4 31.1 46.1 4.9 50.9 3.1 286 95 5.5 11.7 33.7 42.1 7.0 49.1 3.0 -2 0
Fogarty Memorial ES 157 97 2.6 9.9 25.0 57.2 5.3 62.5 3.9 165 98 3.7 6.8 27.8 51.2 10.5 61.7 3.8 -1 1
West Glocester ES 123 93 2.6 22.6 39.1 31.3 4.3 35.7 4.5 121 92 8.1 18.9 42.3 28.8 1.8 30.6 4.4 -5 -2
Highlander All 273 99 21.2 29.7 29.4 19.0 0.7 19.7 2.4 320 99 25.3 27.2 28.2 17.7 1.6 19.3 2.2 0 0
Highlander Charter ES 108 99 26.2 34.6 27.1 12.1 0.0 12.1 3.2 108 99 30.8 31.8 28.0 9.3 0.0 9.3 2.8 -3 0
Highlander Charter MS 108 99 15.0 29.0 29.0 27.1 0.0 27.1 4.3 136 99 20.1 26.9 29.1 20.1 3.7 23.9 3.7 -3 -1
Highlander Charter HS 56 96 24.1 22.2 35.2 14.8 3.7 18.5 5.3 75 99 27.0 21.6 27.0 24.3 0.0 24.3 5.0 6 2
International International Charter ES 157 99 5.8 21.8 35.3 32.1 5.1 37.2 3.9 164 96 12.7 19.1 26.1 35.7 6.4 42.0 3.9 5 -4
Jamestown All 322 95 4.2 11.8 22.5 46.7 14.7 61.4 2.8 322 99 3.4 7.8 18.2 55.8 14.7 70.5 2.6 9 4
Jamestown-Melrose ES 113 96 3.7 12.0 23.1 50.0 11.1 61.1 4.7 112 98 3.6 6.4 20.0 62.7 7.3 70.0 4.4 9 3
Jamestown-Lawn MS 206 96 4.6 11.2 22.3 45.2 16.8 61.9 3.5 208 100 2.9 8.2 17.4 52.7 18.8 71.5 3.1 10 4
Johnston All 1910 90 8.1 16.5 28.9 40.0 6.7 46.6 1.2 1901 97 9.4 19.2 29.3 36.4 5.7 42.1 1.1 -5 7
Brown Avenue ES 128 98 1.6 4.0 17.5 68.3 8.7 77.0 3.7 135 97 0.8 6.9 19.1 64.1 9.2 73.3 3.9 -4 -1
Sarah Dyer Barnes ES 144 94 9.6 16.3 31.1 36.3 6.7 43.0 4.3 157 99 3.2 20.0 29.0 45.2 2.6 47.7 4.0 5 -1
Thornton ES 223 99 9.5 16.4 30.0 41.8 2.3 44.1 3.3 227 100 10.2 17.7 32.7 36.7 2.7 39.4 3.3 -5 1
Winsor Hill ES 216 97 8.1 21.9 25.7 41.9 2.4 44.3 3.4 222 98 7.4 18.9 30.9 41.5 1.4 42.9 3.4 -1 1
Nicholas A. Ferri MS 747 96 7.3 14.9 31.0 38.5 8.2 46.8 1.9 749 100 8.8 20.6 31.1 32.2 7.3 39.5 1.8 -7 4
Johnston Senior HS 422 70 8.8 21.2 29.6 31.6 8.8 40.4 2.8 387 93 16.1 21.4 26.1 29.2 7.2 36.4 2.5 -4 23
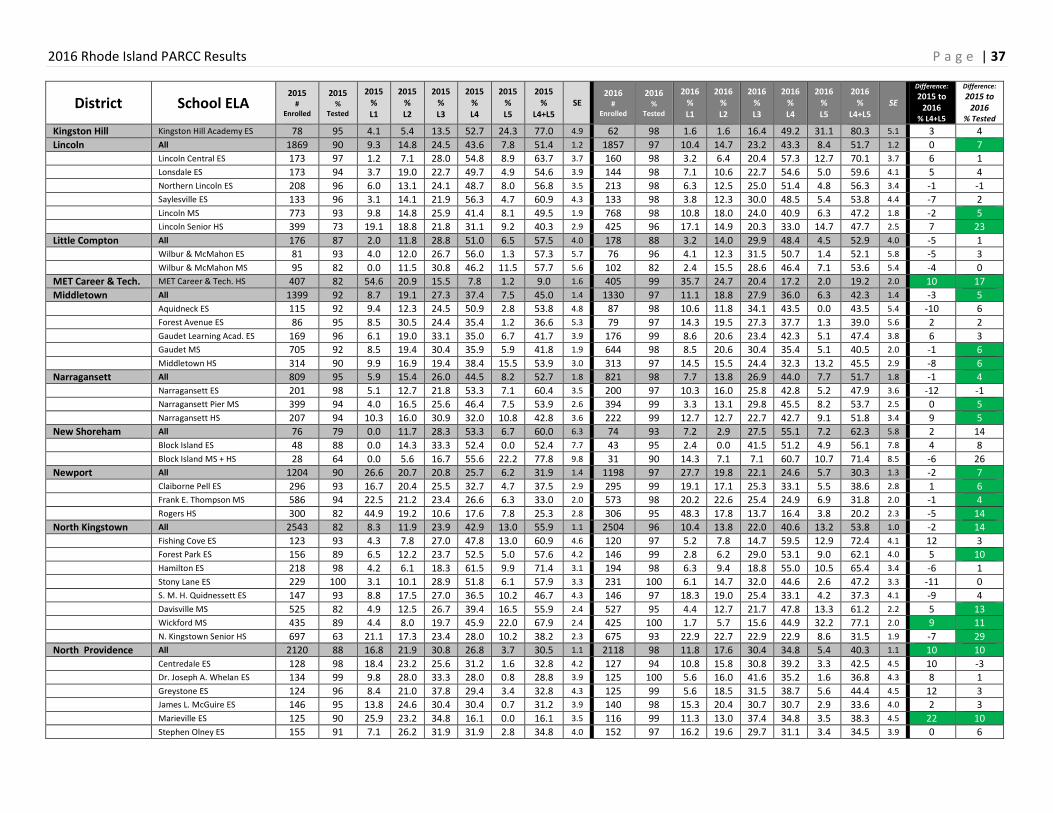
2016 Rhode Island PARCC Results P a g e | 37
District School ELA 2015
# Enrolled
2015 %
Tested
2015 % L1
2015 % L2
2015 % L3
2015 % L4
2015 % L5
2015 %
L4+L5 SE
2016 #
Enrolled
2016 %
Tested
2016 % L1
2016 % L2
2016 % L3
2016 % L4
2016 % L5
2016 %
L4+L5 SE
Difference:
2015 to 2016
% L4+L5
Difference:
2015 to 2016
% Tested
Kingston Hill Kingston Hill Academy ES 78 95 4.1 5.4 13.5 52.7 24.3 77.0 4.9 62 98 1.6 1.6 16.4 49.2 31.1 80.3 5.1 3 4
Lincoln All 1869 90 9.3 14.8 24.5 43.6 7.8 51.4 1.2 1857 97 10.4 14.7 23.2 43.3 8.4 51.7 1.2 0 7
Lincoln Central ES 173 97 1.2 7.1 28.0 54.8 8.9 63.7 3.7 160 98 3.2 6.4 20.4 57.3 12.7 70.1 3.7 6 1
Lonsdale ES 173 94 3.7 19.0 22.7 49.7 4.9 54.6 3.9 144 98 7.1 10.6 22.7 54.6 5.0 59.6 4.1 5 4
Northern Lincoln ES 208 96 6.0 13.1 24.1 48.7 8.0 56.8 3.5 213 98 6.3 12.5 25.0 51.4 4.8 56.3 3.4 -1 -1
Saylesville ES 133 96 3.1 14.1 21.9 56.3 4.7 60.9 4.3 133 98 3.8 12.3 30.0 48.5 5.4 53.8 4.4 -7 2
Lincoln MS 773 93 9.8 14.8 25.9 41.4 8.1 49.5 1.9 768 98 10.8 18.0 24.0 40.9 6.3 47.2 1.8 -2 5
Lincoln Senior HS 399 73 19.1 18.8 21.8 31.1 9.2 40.3 2.9 425 96 17.1 14.9 20.3 33.0 14.7 47.7 2.5 7 23
Little Compton All 176 87 2.0 11.8 28.8 51.0 6.5 57.5 4.0 178 88 3.2 14.0 29.9 48.4 4.5 52.9 4.0 -5 1
Wilbur & McMahon ES 81 93 4.0 12.0 26.7 56.0 1.3 57.3 5.7 76 96 4.1 12.3 31.5 50.7 1.4 52.1 5.8 -5 3
Wilbur & McMahon MS 95 82 0.0 11.5 30.8 46.2 11.5 57.7 5.6 102 82 2.4 15.5 28.6 46.4 7.1 53.6 5.4 -4 0
MET Career & Tech. MET Career & Tech. HS 407 82 54.6 20.9 15.5 7.8 1.2 9.0 1.6 405 99 35.7 24.7 20.4 17.2 2.0 19.2 2.0 10 17
Middletown All 1399 92 8.7 19.1 27.3 37.4 7.5 45.0 1.4 1330 97 11.1 18.8 27.9 36.0 6.3 42.3 1.4 -3 5
Aquidneck ES 115 92 9.4 12.3 24.5 50.9 2.8 53.8 4.8 87 98 10.6 11.8 34.1 43.5 0.0 43.5 5.4 -10 6
Forest Avenue ES 86 95 8.5 30.5 24.4 35.4 1.2 36.6 5.3 79 97 14.3 19.5 27.3 37.7 1.3 39.0 5.6 2 2
Gaudet Learning Acad. ES 169 96 6.1 19.0 33.1 35.0 6.7 41.7 3.9 176 99 8.6 20.6 23.4 42.3 5.1 47.4 3.8 6 3
Gaudet MS 705 92 8.5 19.4 30.4 35.9 5.9 41.8 1.9 644 98 8.5 20.6 30.4 35.4 5.1 40.5 2.0 -1 6
Middletown HS 314 90 9.9 16.9 19.4 38.4 15.5 53.9 3.0 313 97 14.5 15.5 24.4 32.3 13.2 45.5 2.9 -8 6
Narragansett All 809 95 5.9 15.4 26.0 44.5 8.2 52.7 1.8 821 98 7.7 13.8 26.9 44.0 7.7 51.7 1.8 -1 4
Narragansett ES 201 98 5.1 12.7 21.8 53.3 7.1 60.4 3.5 200 97 10.3 16.0 25.8 42.8 5.2 47.9 3.6 -12 -1
Narragansett Pier MS 399 94 4.0 16.5 25.6 46.4 7.5 53.9 2.6 394 99 3.3 13.1 29.8 45.5 8.2 53.7 2.5 0 5
Narragansett HS 207 94 10.3 16.0 30.9 32.0 10.8 42.8 3.6 222 99 12.7 12.7 22.7 42.7 9.1 51.8 3.4 9 5
New Shoreham All 76 79 0.0 11.7 28.3 53.3 6.7 60.0 6.3 74 93 7.2 2.9 27.5 55.1 7.2 62.3 5.8 2 14
Block Island ES 48 88 0.0 14.3 33.3 52.4 0.0 52.4 7.7 43 95 2.4 0.0 41.5 51.2 4.9 56.1 7.8 4 8
Block Island MS + HS 28 64 0.0 5.6 16.7 55.6 22.2 77.8 9.8 31 90 14.3 7.1 7.1 60.7 10.7 71.4 8.5 -6 26
Newport All 1204 90 26.6 20.7 20.8 25.7 6.2 31.9 1.4 1198 97 27.7 19.8 22.1 24.6 5.7 30.3 1.3 -2 7
Claiborne Pell ES 296 93 16.7 20.4 25.5 32.7 4.7 37.5 2.9 295 99 19.1 17.1 25.3 33.1 5.5 38.6 2.8 1 6
Frank E. Thompson MS 586 94 22.5 21.2 23.4 26.6 6.3 33.0 2.0 573 98 20.2 22.6 25.4 24.9 6.9 31.8 2.0 -1 4
Rogers HS 300 82 44.9 19.2 10.6 17.6 7.8 25.3 2.8 306 95 48.3 17.8 13.7 16.4 3.8 20.2 2.3 -5 14
North Kingstown All 2543 82 8.3 11.9 23.9 42.9 13.0 55.9 1.1 2504 96 10.4 13.8 22.0 40.6 13.2 53.8 1.0 -2 14
Fishing Cove ES 123 93 4.3 7.8 27.0 47.8 13.0 60.9 4.6 120 97 5.2 7.8 14.7 59.5 12.9 72.4 4.1 12 3
Forest Park ES 156 89 6.5 12.2 23.7 52.5 5.0 57.6 4.2 146 99 2.8 6.2 29.0 53.1 9.0 62.1 4.0 5 10
Hamilton ES 218 98 4.2 6.1 18.3 61.5 9.9 71.4 3.1 194 98 6.3 9.4 18.8 55.0 10.5 65.4 3.4 -6 1
Stony Lane ES 229 100 3.1 10.1 28.9 51.8 6.1 57.9 3.3 231 100 6.1 14.7 32.0 44.6 2.6 47.2 3.3 -11 0
S. M. H. Quidnessett ES 147 93 8.8 17.5 27.0 36.5 10.2 46.7 4.3 146 97 18.3 19.0 25.4 33.1 4.2 37.3 4.1 -9 4
Davisville MS 525 82 4.9 12.5 26.7 39.4 16.5 55.9 2.4 527 95 4.4 12.7 21.7 47.8 13.3 61.2 2.2 5 13
Wickford MS 435 89 4.4 8.0 19.7 45.9 22.0 67.9 2.4 425 100 1.7 5.7 15.6 44.9 32.2 77.1 2.0 9 11
N. Kingstown Senior HS 697 63 21.1 17.3 23.4 28.0 10.2 38.2 2.3 675 93 22.9 22.7 22.9 22.9 8.6 31.5 1.9 -7 29
North Providence All 2120 88 16.8 21.9 30.8 26.8 3.7 30.5 1.1 2118 98 11.8 17.6 30.4 34.8 5.4 40.3 1.1 10 10
Centredale ES 128 98 18.4 23.2 25.6 31.2 1.6 32.8 4.2 127 94 10.8 15.8 30.8 39.2 3.3 42.5 4.5 10 -3
Dr. Joseph A. Whelan ES 134 99 9.8 28.0 33.3 28.0 0.8 28.8 3.9 125 100 5.6 16.0 41.6 35.2 1.6 36.8 4.3 8 1
Greystone ES 124 96 8.4 21.0 37.8 29.4 3.4 32.8 4.3 125 99 5.6 18.5 31.5 38.7 5.6 44.4 4.5 12 3
James L. McGuire ES 146 95 13.8 24.6 30.4 30.4 0.7 31.2 3.9 140 98 15.3 20.4 30.7 30.7 2.9 33.6 4.0 2 3
Marieville ES 125 90 25.9 23.2 34.8 16.1 0.0 16.1 3.5 116 99 11.3 13.0 37.4 34.8 3.5 38.3 4.5 22 10
Stephen Olney ES 155 91 7.1 26.2 31.9 31.9 2.8 34.8 4.0 152 97 16.2 19.6 29.7 31.1 3.4 34.5 3.9 0 6
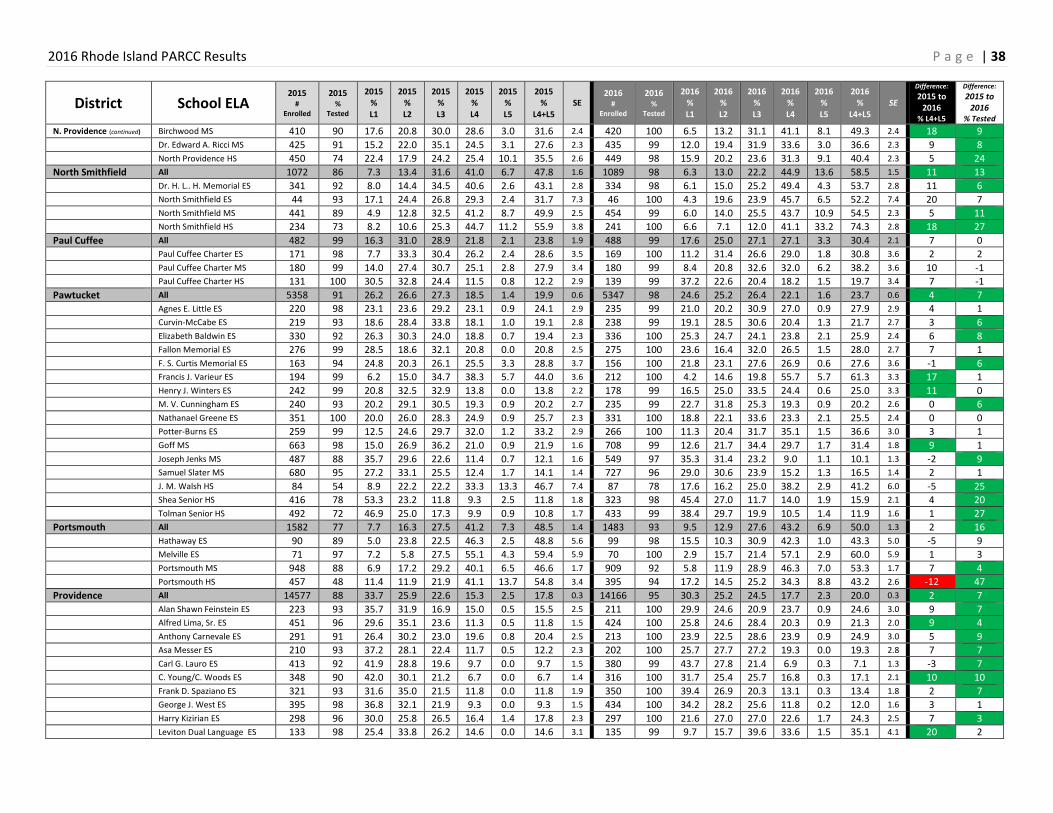
2016 Rhode Island PARCC Results P a g e | 38
District School ELA 2015
# Enrolled
2015 %
Tested
2015 % L1
2015 % L2
2015 % L3
2015 % L4
2015 % L5
2015 %
L4+L5 SE
2016 #
Enrolled
2016 %
Tested
2016 % L1
2016 % L2
2016 % L3
2016 % L4
2016 % L5
2016 %
L4+L5 SE
Difference:
2015 to 2016
% L4+L5
Difference:
2015 to 2016
% Tested
N. Providence (continued) Birchwood MS 410 90 17.6 20.8 30.0 28.6 3.0 31.6 2.4 420 100 6.5 13.2 31.1 41.1 8.1 49.3 2.4 18 9
Dr. Edward A. Ricci MS 425 91 15.2 22.0 35.1 24.5 3.1 27.6 2.3 435 99 12.0 19.4 31.9 33.6 3.0 36.6 2.3 9 8
North Providence HS 450 74 22.4 17.9 24.2 25.4 10.1 35.5 2.6 449 98 15.9 20.2 23.6 31.3 9.1 40.4 2.3 5 24
North Smithfield All 1072 86 7.3 13.4 31.6 41.0 6.7 47.8 1.6 1089 98 6.3 13.0 22.2 44.9 13.6 58.5 1.5 11 13
Dr. H. L.. H. Memorial ES 341 92 8.0 14.4 34.5 40.6 2.6 43.1 2.8 334 98 6.1 15.0 25.2 49.4 4.3 53.7 2.8 11 6
North Smithfield ES 44 93 17.1 24.4 26.8 29.3 2.4 31.7 7.3 46 100 4.3 19.6 23.9 45.7 6.5 52.2 7.4 20 7
North Smithfield MS 441 89 4.9 12.8 32.5 41.2 8.7 49.9 2.5 454 99 6.0 14.0 25.5 43.7 10.9 54.5 2.3 5 11
North Smithfield HS 234 73 8.2 10.6 25.3 44.7 11.2 55.9 3.8 241 100 6.6 7.1 12.0 41.1 33.2 74.3 2.8 18 27
Paul Cuffee All 482 99 16.3 31.0 28.9 21.8 2.1 23.8 1.9 488 99 17.6 25.0 27.1 27.1 3.3 30.4 2.1 7 0
Paul Cuffee Charter ES 171 98 7.7 33.3 30.4 26.2 2.4 28.6 3.5 169 100 11.2 31.4 26.6 29.0 1.8 30.8 3.6 2 2
Paul Cuffee Charter MS 180 99 14.0 27.4 30.7 25.1 2.8 27.9 3.4 180 99 8.4 20.8 32.6 32.0 6.2 38.2 3.6 10 -1
Paul Cuffee Charter HS 131 100 30.5 32.8 24.4 11.5 0.8 12.2 2.9 139 99 37.2 22.6 20.4 18.2 1.5 19.7 3.4 7 -1
Pawtucket All 5358 91 26.2 26.6 27.3 18.5 1.4 19.9 0.6 5347 98 24.6 25.2 26.4 22.1 1.6 23.7 0.6 4 7
Agnes E. Little ES 220 98 23.1 23.6 29.2 23.1 0.9 24.1 2.9 235 99 21.0 20.2 30.9 27.0 0.9 27.9 2.9 4 1
Curvin-McCabe ES 219 93 18.6 28.4 33.8 18.1 1.0 19.1 2.8 238 99 19.1 28.5 30.6 20.4 1.3 21.7 2.7 3 6
Elizabeth Baldwin ES 330 92 26.3 30.3 24.0 18.8 0.7 19.4 2.3 336 100 25.3 24.7 24.1 23.8 2.1 25.9 2.4 6 8
Fallon Memorial ES 276 99 28.5 18.6 32.1 20.8 0.0 20.8 2.5 275 100 23.6 16.4 32.0 26.5 1.5 28.0 2.7 7 1
F. S. Curtis Memorial ES 163 94 24.8 20.3 26.1 25.5 3.3 28.8 3.7 156 100 21.8 23.1 27.6 26.9 0.6 27.6 3.6 -1 6
Francis J. Varieur ES 194 99 6.2 15.0 34.7 38.3 5.7 44.0 3.6 212 100 4.2 14.6 19.8 55.7 5.7 61.3 3.3 17 1
Henry J. Winters ES 242 99 20.8 32.5 32.9 13.8 0.0 13.8 2.2 178 99 16.5 25.0 33.5 24.4 0.6 25.0 3.3 11 0
M. V. Cunningham ES 240 93 20.2 29.1 30.5 19.3 0.9 20.2 2.7 235 99 22.7 31.8 25.3 19.3 0.9 20.2 2.6 0 6
Nathanael Greene ES 351 100 20.0 26.0 28.3 24.9 0.9 25.7 2.3 331 100 18.8 22.1 33.6 23.3 2.1 25.5 2.4 0 0
Potter-Burns ES 259 99 12.5 24.6 29.7 32.0 1.2 33.2 2.9 266 100 11.3 20.4 31.7 35.1 1.5 36.6 3.0 3 1
Goff MS 663 98 15.0 26.9 36.2 21.0 0.9 21.9 1.6 708 99 12.6 21.7 34.4 29.7 1.7 31.4 1.8 9 1
Joseph Jenks MS 487 88 35.7 29.6 22.6 11.4 0.7 12.1 1.6 549 97 35.3 31.4 23.2 9.0 1.1 10.1 1.3 -2 9
Samuel Slater MS 680 95 27.2 33.1 25.5 12.4 1.7 14.1 1.4 727 96 29.0 30.6 23.9 15.2 1.3 16.5 1.4 2 1
J. M. Walsh HS 84 54 8.9 22.2 22.2 33.3 13.3 46.7 7.4 87 78 17.6 16.2 25.0 38.2 2.9 41.2 6.0 -5 25
Shea Senior HS 416 78 53.3 23.2 11.8 9.3 2.5 11.8 1.8 323 98 45.4 27.0 11.7 14.0 1.9 15.9 2.1 4 20
Tolman Senior HS 492 72 46.9 25.0 17.3 9.9 0.9 10.8 1.7 433 99 38.4 29.7 19.9 10.5 1.4 11.9 1.6 1 27
Portsmouth All 1582 77 7.7 16.3 27.5 41.2 7.3 48.5 1.4 1483 93 9.5 12.9 27.6 43.2 6.9 50.0 1.3 2 16
Hathaway ES 90 89 5.0 23.8 22.5 46.3 2.5 48.8 5.6 99 98 15.5 10.3 30.9 42.3 1.0 43.3 5.0 -5 9
Melville ES 71 97 7.2 5.8 27.5 55.1 4.3 59.4 5.9 70 100 2.9 15.7 21.4 57.1 2.9 60.0 5.9 1 3
Portsmouth MS 948 88 6.9 17.2 29.2 40.1 6.5 46.6 1.7 909 92 5.8 11.9 28.9 46.3 7.0 53.3 1.7 7 4
Portsmouth HS 457 48 11.4 11.9 21.9 41.1 13.7 54.8 3.4 395 94 17.2 14.5 25.2 34.3 8.8 43.2 2.6 -12 47
Providence All 14577 88 33.7 25.9 22.6 15.3 2.5 17.8 0.3 14166 95 30.3 25.2 24.5 17.7 2.3 20.0 0.3 2 7
Alan Shawn Feinstein ES 223 93 35.7 31.9 16.9 15.0 0.5 15.5 2.5 211 100 29.9 24.6 20.9 23.7 0.9 24.6 3.0 9 7
Alfred Lima, Sr. ES 451 96 29.6 35.1 23.6 11.3 0.5 11.8 1.5 424 100 25.8 24.6 28.4 20.3 0.9 21.3 2.0 9 4
Anthony Carnevale ES 291 91 26.4 30.2 23.0 19.6 0.8 20.4 2.5 213 100 23.9 22.5 28.6 23.9 0.9 24.9 3.0 5 9
Asa Messer ES 210 93 37.2 28.1 22.4 11.7 0.5 12.2 2.3 202 100 25.7 27.7 27.2 19.3 0.0 19.3 2.8 7 7
Carl G. Lauro ES 413 92 41.9 28.8 19.6 9.7 0.0 9.7 1.5 380 99 43.7 27.8 21.4 6.9 0.3 7.1 1.3 -3 7
C. Young/C. Woods ES 348 90 42.0 30.1 21.2 6.7 0.0 6.7 1.4 316 100 31.7 25.4 25.7 16.8 0.3 17.1 2.1 10 10
Frank D. Spaziano ES 321 93 31.6 35.0 21.5 11.8 0.0 11.8 1.9 350 100 39.4 26.9 20.3 13.1 0.3 13.4 1.8 2 7
George J. West ES 395 98 36.8 32.1 21.9 9.3 0.0 9.3 1.5 434 100 34.2 28.2 25.6 11.8 0.2 12.0 1.6 3 1
Harry Kizirian ES 298 96 30.0 25.8 26.5 16.4 1.4 17.8 2.3 297 100 21.6 27.0 27.0 22.6 1.7 24.3 2.5 7 3
Leviton Dual Language ES 133 98 25.4 33.8 26.2 14.6 0.0 14.6 3.1 135 99 9.7 15.7 39.6 33.6 1.5 35.1 4.1 20 2
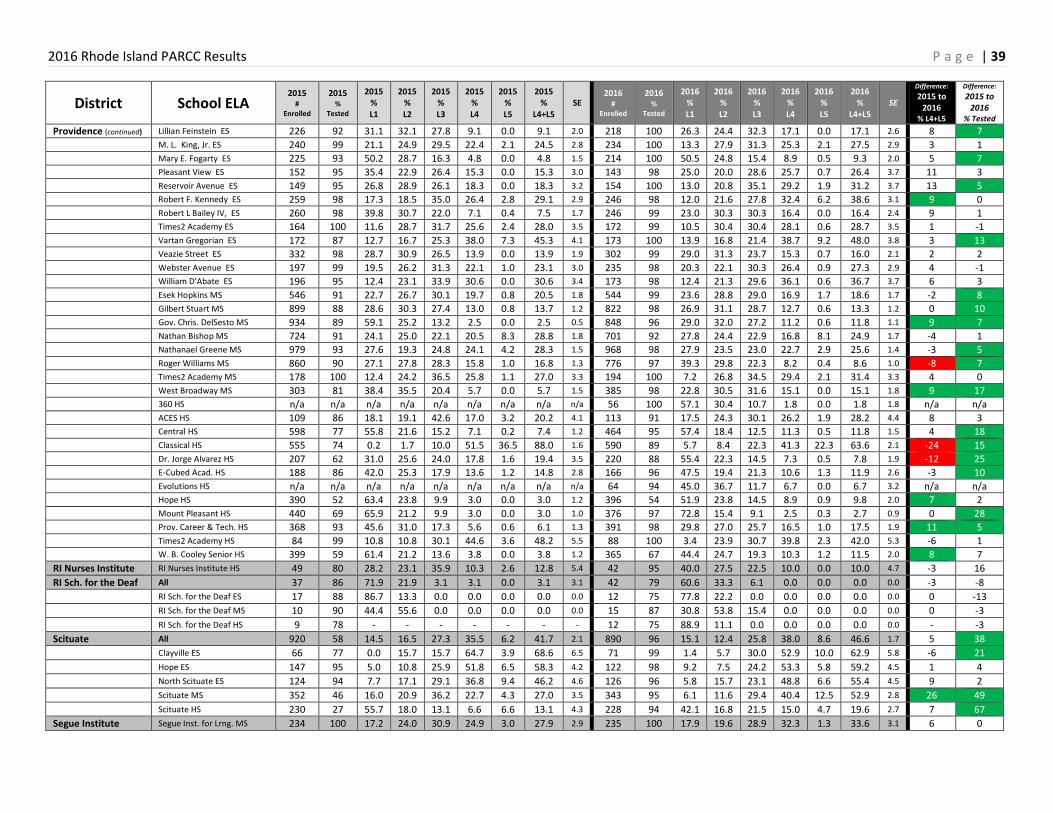
2016 Rhode Island PARCC Results P a g e | 39
District School ELA 2015
# Enrolled
2015 %
Tested
2015 % L1
2015 % L2
2015 % L3
2015 % L4
2015 % L5
2015 %
L4+L5 SE
2016 #
Enrolled
2016 %
Tested
2016 % L1
2016 % L2
2016 % L3
2016 % L4
2016 % L5
2016 %
L4+L5 SE
Difference:
2015 to 2016
% L4+L5
Difference:
2015 to 2016
% Tested
Providence (continued) Lillian Feinstein ES 226 92 31.1 32.1 27.8 9.1 0.0 9.1 2.0 218 100 26.3 24.4 32.3 17.1 0.0 17.1 2.6 8 7
M. L. King, Jr. ES 240 99 21.1 24.9 29.5 22.4 2.1 24.5 2.8 234 100 13.3 27.9 31.3 25.3 2.1 27.5 2.9 3 1
Mary E. Fogarty ES 225 93 50.2 28.7 16.3 4.8 0.0 4.8 1.5 214 100 50.5 24.8 15.4 8.9 0.5 9.3 2.0 5 7
Pleasant View ES 152 95 35.4 22.9 26.4 15.3 0.0 15.3 3.0 143 98 25.0 20.0 28.6 25.7 0.7 26.4 3.7 11 3
Reservoir Avenue ES 149 95 26.8 28.9 26.1 18.3 0.0 18.3 3.2 154 100 13.0 20.8 35.1 29.2 1.9 31.2 3.7 13 5
Robert F. Kennedy ES 259 98 17.3 18.5 35.0 26.4 2.8 29.1 2.9 246 98 12.0 21.6 27.8 32.4 6.2 38.6 3.1 9 0
Robert L Bailey IV, ES 260 98 39.8 30.7 22.0 7.1 0.4 7.5 1.7 246 99 23.0 30.3 30.3 16.4 0.0 16.4 2.4 9 1
Times2 Academy ES 164 100 11.6 28.7 31.7 25.6 2.4 28.0 3.5 172 99 10.5 30.4 30.4 28.1 0.6 28.7 3.5 1 -1
Vartan Gregorian ES 172 87 12.7 16.7 25.3 38.0 7.3 45.3 4.1 173 100 13.9 16.8 21.4 38.7 9.2 48.0 3.8 3 13
Veazie Street ES 332 98 28.7 30.9 26.5 13.9 0.0 13.9 1.9 302 99 29.0 31.3 23.7 15.3 0.7 16.0 2.1 2 2
Webster Avenue ES 197 99 19.5 26.2 31.3 22.1 1.0 23.1 3.0 235 98 20.3 22.1 30.3 26.4 0.9 27.3 2.9 4 -1
William D'Abate ES 196 95 12.4 23.1 33.9 30.6 0.0 30.6 3.4 173 98 12.4 21.3 29.6 36.1 0.6 36.7 3.7 6 3
Esek Hopkins MS 546 91 22.7 26.7 30.1 19.7 0.8 20.5 1.8 544 99 23.6 28.8 29.0 16.9 1.7 18.6 1.7 -2 8
Gilbert Stuart MS 899 88 28.6 30.3 27.4 13.0 0.8 13.7 1.2 822 98 26.9 31.1 28.7 12.7 0.6 13.3 1.2 0 10
Gov. Chris. DelSesto MS 934 89 59.1 25.2 13.2 2.5 0.0 2.5 0.5 848 96 29.0 32.0 27.2 11.2 0.6 11.8 1.1 9 7
Nathan Bishop MS 724 91 24.1 25.0 22.1 20.5 8.3 28.8 1.8 701 92 27.8 24.4 22.9 16.8 8.1 24.9 1.7 -4 1
Nathanael Greene MS 979 93 27.6 19.3 24.8 24.1 4.2 28.3 1.5 968 98 27.9 23.5 23.0 22.7 2.9 25.6 1.4 -3 5
Roger Williams MS 860 90 27.1 27.8 28.3 15.8 1.0 16.8 1.3 776 97 39.3 29.8 22.3 8.2 0.4 8.6 1.0 -8 7
Times2 Academy MS 178 100 12.4 24.2 36.5 25.8 1.1 27.0 3.3 194 100 7.2 26.8 34.5 29.4 2.1 31.4 3.3 4 0
West Broadway MS 303 81 38.4 35.5 20.4 5.7 0.0 5.7 1.5 385 98 22.8 30.5 31.6 15.1 0.0 15.1 1.8 9 17
360 HS n/a n/a n/a n/a n/a n/a n/a n/a n/a 56 100 57.1 30.4 10.7 1.8 0.0 1.8 1.8 n/a n/a
ACES HS 109 86 18.1 19.1 42.6 17.0 3.2 20.2 4.1 113 91 17.5 24.3 30.1 26.2 1.9 28.2 4.4 8 3
Central HS 598 77 55.8 21.6 15.2 7.1 0.2 7.4 1.2 464 95 57.4 18.4 12.5 11.3 0.5 11.8 1.5 4 18
Classical HS 555 74 0.2 1.7 10.0 51.5 36.5 88.0 1.6 590 89 5.7 8.4 22.3 41.3 22.3 63.6 2.1 -24 15
Dr. Jorge Alvarez HS 207 62 31.0 25.6 24.0 17.8 1.6 19.4 3.5 220 88 55.4 22.3 14.5 7.3 0.5 7.8 1.9 -12 25
E-Cubed Acad. HS 188 86 42.0 25.3 17.9 13.6 1.2 14.8 2.8 166 96 47.5 19.4 21.3 10.6 1.3 11.9 2.6 -3 10
Evolutions HS n/a n/a n/a n/a n/a n/a n/a n/a n/a 64 94 45.0 36.7 11.7 6.7 0.0 6.7 3.2 n/a n/a
Hope HS 390 52 63.4 23.8 9.9 3.0 0.0 3.0 1.2 396 54 51.9 23.8 14.5 8.9 0.9 9.8 2.0 7 2
Mount Pleasant HS 440 69 65.9 21.2 9.9 3.0 0.0 3.0 1.0 376 97 72.8 15.4 9.1 2.5 0.3 2.7 0.9 0 28
Prov. Career & Tech. HS 368 93 45.6 31.0 17.3 5.6 0.6 6.1 1.3 391 98 29.8 27.0 25.7 16.5 1.0 17.5 1.9 11 5
Times2 Academy HS 84 99 10.8 10.8 30.1 44.6 3.6 48.2 5.5 88 100 3.4 23.9 30.7 39.8 2.3 42.0 5.3 -6 1
W. B. Cooley Senior HS 399 59 61.4 21.2 13.6 3.8 0.0 3.8 1.2 365 67 44.4 24.7 19.3 10.3 1.2 11.5 2.0 8 7
RI Nurses Institute RI Nurses Institute HS 49 80 28.2 23.1 35.9 10.3 2.6 12.8 5.4 42 95 40.0 27.5 22.5 10.0 0.0 10.0 4.7 -3 16
RI Sch. for the Deaf All 37 86 71.9 21.9 3.1 3.1 0.0 3.1 3.1 42 79 60.6 33.3 6.1 0.0 0.0 0.0 0.0 -3 -8
RI Sch. for the Deaf ES 17 88 86.7 13.3 0.0 0.0 0.0 0.0 0.0 12 75 77.8 22.2 0.0 0.0 0.0 0.0 0.0 0 -13
RI Sch. for the Deaf MS 10 90 44.4 55.6 0.0 0.0 0.0 0.0 0.0 15 87 30.8 53.8 15.4 0.0 0.0 0.0 0.0 0 -3
RI Sch. for the Deaf HS 9 78 - - - - - - - 12 75 88.9 11.1 0.0 0.0 0.0 0.0 0.0 - -3
Scituate All 920 58 14.5 16.5 27.3 35.5 6.2 41.7 2.1 890 96 15.1 12.4 25.8 38.0 8.6 46.6 1.7 5 38
Clayville ES 66 77 0.0 15.7 15.7 64.7 3.9 68.6 6.5 71 99 1.4 5.7 30.0 52.9 10.0 62.9 5.8 -6 21
Hope ES 147 95 5.0 10.8 25.9 51.8 6.5 58.3 4.2 122 98 9.2 7.5 24.2 53.3 5.8 59.2 4.5 1 4
North Scituate ES 124 94 7.7 17.1 29.1 36.8 9.4 46.2 4.6 126 96 5.8 15.7 23.1 48.8 6.6 55.4 4.5 9 2
Scituate MS 352 46 16.0 20.9 36.2 22.7 4.3 27.0 3.5 343 95 6.1 11.6 29.4 40.4 12.5 52.9 2.8 26 49
Scituate HS 230 27 55.7 18.0 13.1 6.6 6.6 13.1 4.3 228 94 42.1 16.8 21.5 15.0 4.7 19.6 2.7 7 67
Segue Institute Segue Inst. for Lrng. MS 234 100 17.2 24.0 30.9 24.9 3.0 27.9 2.9 235 100 17.9 19.6 28.9 32.3 1.3 33.6 3.1 6 0
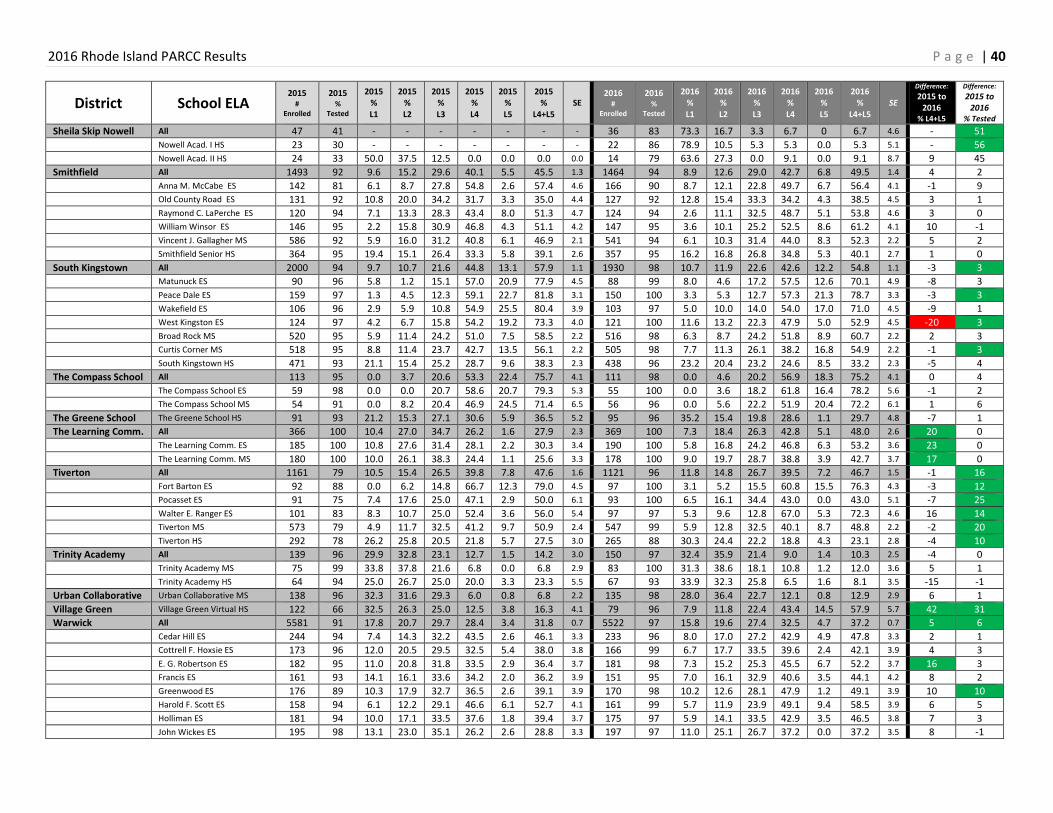
2016 Rhode Island PARCC Results P a g e | 40
District School ELA 2015
# Enrolled
2015 %
Tested
2015 % L1
2015 % L2
2015 % L3
2015 % L4
2015 % L5
2015 %
L4+L5 SE
2016 #
Enrolled
2016 %
Tested
2016 % L1
2016 % L2
2016 % L3
2016 % L4
2016 % L5
2016 %
L4+L5 SE
Difference:
2015 to 2016
% L4+L5
Difference:
2015 to 2016
% Tested
Sheila Skip Nowell All 47 41 - - - - - - - 36 83 73.3 16.7 3.3 6.7 0 6.7 4.6 - 51
Nowell Acad. I HS 23 30 - - - - - - - 22 86 78.9 10.5 5.3 5.3 0.0 5.3 5.1 - 56
Nowell Acad. II HS 24 33 50.0 37.5 12.5 0.0 0.0 0.0 0.0 14 79 63.6 27.3 0.0 9.1 0.0 9.1 8.7 9 45
Smithfield All 1493 92 9.6 15.2 29.6 40.1 5.5 45.5 1.3 1464 94 8.9 12.6 29.0 42.7 6.8 49.5 1.4 4 2
Anna M. McCabe ES 142 81 6.1 8.7 27.8 54.8 2.6 57.4 4.6 166 90 8.7 12.1 22.8 49.7 6.7 56.4 4.1 -1 9
Old County Road ES 131 92 10.8 20.0 34.2 31.7 3.3 35.0 4.4 127 92 12.8 15.4 33.3 34.2 4.3 38.5 4.5 3 1
Raymond C. LaPerche ES 120 94 7.1 13.3 28.3 43.4 8.0 51.3 4.7 124 94 2.6 11.1 32.5 48.7 5.1 53.8 4.6 3 0
William Winsor ES 146 95 2.2 15.8 30.9 46.8 4.3 51.1 4.2 147 95 3.6 10.1 25.2 52.5 8.6 61.2 4.1 10 -1
Vincent J. Gallagher MS 586 92 5.9 16.0 31.2 40.8 6.1 46.9 2.1 541 94 6.1 10.3 31.4 44.0 8.3 52.3 2.2 5 2
Smithfield Senior HS 364 95 19.4 15.1 26.4 33.3 5.8 39.1 2.6 357 95 16.2 16.8 26.8 34.8 5.3 40.1 2.7 1 0
South Kingstown All 2000 94 9.7 10.7 21.6 44.8 13.1 57.9 1.1 1930 98 10.7 11.9 22.6 42.6 12.2 54.8 1.1 -3 3
Matunuck ES 90 96 5.8 1.2 15.1 57.0 20.9 77.9 4.5 88 99 8.0 4.6 17.2 57.5 12.6 70.1 4.9 -8 3
Peace Dale ES 159 97 1.3 4.5 12.3 59.1 22.7 81.8 3.1 150 100 3.3 5.3 12.7 57.3 21.3 78.7 3.3 -3 3
Wakefield ES 106 96 2.9 5.9 10.8 54.9 25.5 80.4 3.9 103 97 5.0 10.0 14.0 54.0 17.0 71.0 4.5 -9 1
West Kingston ES 124 97 4.2 6.7 15.8 54.2 19.2 73.3 4.0 121 100 11.6 13.2 22.3 47.9 5.0 52.9 4.5 -20 3
Broad Rock MS 520 95 5.9 11.4 24.2 51.0 7.5 58.5 2.2 516 98 6.3 8.7 24.2 51.8 8.9 60.7 2.2 2 3
Curtis Corner MS 518 95 8.8 11.4 23.7 42.7 13.5 56.1 2.2 505 98 7.7 11.3 26.1 38.2 16.8 54.9 2.2 -1 3
South Kingstown HS 471 93 21.1 15.4 25.2 28.7 9.6 38.3 2.3 438 96 23.2 20.4 23.2 24.6 8.5 33.2 2.3 -5 4
The Compass School All 113 95 0.0 3.7 20.6 53.3 22.4 75.7 4.1 111 98 0.0 4.6 20.2 56.9 18.3 75.2 4.1 0 4
The Compass School ES 59 98 0.0 0.0 20.7 58.6 20.7 79.3 5.3 55 100 0.0 3.6 18.2 61.8 16.4 78.2 5.6 -1 2
The Compass School MS 54 91 0.0 8.2 20.4 46.9 24.5 71.4 6.5 56 96 0.0 5.6 22.2 51.9 20.4 72.2 6.1 1 6
The Greene School The Greene School HS 91 93 21.2 15.3 27.1 30.6 5.9 36.5 5.2 95 96 35.2 15.4 19.8 28.6 1.1 29.7 4.8 -7 1
The Learning Comm. All 366 100 10.4 27.0 34.7 26.2 1.6 27.9 2.3 369 100 7.3 18.4 26.3 42.8 5.1 48.0 2.6 20 0
The Learning Comm. ES 185 100 10.8 27.6 31.4 28.1 2.2 30.3 3.4 190 100 5.8 16.8 24.2 46.8 6.3 53.2 3.6 23 0
The Learning Comm. MS 180 100 10.0 26.1 38.3 24.4 1.1 25.6 3.3 178 100 9.0 19.7 28.7 38.8 3.9 42.7 3.7 17 0
Tiverton All 1161 79 10.5 15.4 26.5 39.8 7.8 47.6 1.6 1121 96 11.8 14.8 26.7 39.5 7.2 46.7 1.5 -1 16
Fort Barton ES 92 88 0.0 6.2 14.8 66.7 12.3 79.0 4.5 97 100 3.1 5.2 15.5 60.8 15.5 76.3 4.3 -3 12
Pocasset ES 91 75 7.4 17.6 25.0 47.1 2.9 50.0 6.1 93 100 6.5 16.1 34.4 43.0 0.0 43.0 5.1 -7 25
Walter E. Ranger ES 101 83 8.3 10.7 25.0 52.4 3.6 56.0 5.4 97 97 5.3 9.6 12.8 67.0 5.3 72.3 4.6 16 14
Tiverton MS 573 79 4.9 11.7 32.5 41.2 9.7 50.9 2.4 547 99 5.9 12.8 32.5 40.1 8.7 48.8 2.2 -2 20
Tiverton HS 292 78 26.2 25.8 20.5 21.8 5.7 27.5 3.0 265 88 30.3 24.4 22.2 18.8 4.3 23.1 2.8 -4 10
Trinity Academy All 139 96 29.9 32.8 23.1 12.7 1.5 14.2 3.0 150 97 32.4 35.9 21.4 9.0 1.4 10.3 2.5 -4 0
Trinity Academy MS 75 99 33.8 37.8 21.6 6.8 0.0 6.8 2.9 83 100 31.3 38.6 18.1 10.8 1.2 12.0 3.6 5 1
Trinity Academy HS 64 94 25.0 26.7 25.0 20.0 3.3 23.3 5.5 67 93 33.9 32.3 25.8 6.5 1.6 8.1 3.5 -15 -1
Urban Collaborative Urban Collaborative MS 138 96 32.3 31.6 29.3 6.0 0.8 6.8 2.2 135 98 28.0 36.4 22.7 12.1 0.8 12.9 2.9 6 1
Village Green Village Green Virtual HS 122 66 32.5 26.3 25.0 12.5 3.8 16.3 4.1 79 96 7.9 11.8 22.4 43.4 14.5 57.9 5.7 42 31
Warwick All 5581 91 17.8 20.7 29.7 28.4 3.4 31.8 0.7 5522 97 15.8 19.6 27.4 32.5 4.7 37.2 0.7 5 6
Cedar Hill ES 244 94 7.4 14.3 32.2 43.5 2.6 46.1 3.3 233 96 8.0 17.0 27.2 42.9 4.9 47.8 3.3 2 1
Cottrell F. Hoxsie ES 173 96 12.0 20.5 29.5 32.5 5.4 38.0 3.8 166 99 6.7 17.7 33.5 39.6 2.4 42.1 3.9 4 3
E. G. Robertson ES 182 95 11.0 20.8 31.8 33.5 2.9 36.4 3.7 181 98 7.3 15.2 25.3 45.5 6.7 52.2 3.7 16 3
Francis ES 161 93 14.1 16.1 33.6 34.2 2.0 36.2 3.9 151 95 7.0 16.1 32.9 40.6 3.5 44.1 4.2 8 2
Greenwood ES 176 89 10.3 17.9 32.7 36.5 2.6 39.1 3.9 170 98 10.2 12.6 28.1 47.9 1.2 49.1 3.9 10 10
Harold F. Scott ES 158 94 6.1 12.2 29.1 46.6 6.1 52.7 4.1 161 99 5.7 11.9 23.9 49.1 9.4 58.5 3.9 6 5
Holliman ES 181 94 10.0 17.1 33.5 37.6 1.8 39.4 3.7 175 97 5.9 14.1 33.5 42.9 3.5 46.5 3.8 7 3
John Wickes ES 195 98 13.1 23.0 35.1 26.2 2.6 28.8 3.3 197 97 11.0 25.1 26.7 37.2 0.0 37.2 3.5 8 -1

2016 Rhode Island PARCC Results P a g e | 41
District School ELA 2015
# Enrolled
2015 %
Tested
2015 % L1
2015 % L2
2015 % L3
2015 % L4
2015 % L5
2015 %
L4+L5 SE
2016 #
Enrolled
2016 %
Tested
2016 % L1
2016 % L2
2016 % L3
2016 % L4
2016 % L5
2016 %
L4+L5 SE
Difference:
2015 to 2016
% L4+L5
Difference:
2015 to 2016
% Tested
Warwick (continued) Lippitt ES 120 92 10.0 21.8 28.2 37.3 2.7 40.0 4.7 137 97 10.5 33.1 24.8 28.6 3.0 31.6 4.0 -8 5
Norwood ES 132 92 12.3 17.2 31.1 36.1 3.3 39.3 4.4 137 92 11.9 15.1 38.1 33.3 1.6 34.9 4.2 -4 -1
Oakland Beach ES 197 91 17.9 25.7 36.3 19.0 1.1 20.1 3.0 180 98 19.2 26.6 31.6 22.0 0.6 22.6 3.1 2 7
Park ES 145 86 16.8 16.8 34.4 28.8 3.2 32.0 4.2 144 98 11.3 17.7 25.5 39.7 5.7 45.4 4.2 13 12
Randall Holden ES 130 98 4.7 14.2 44.9 34.6 1.6 36.2 4.3 133 98 6.1 19.1 38.2 35.9 0.8 36.6 4.2 0 1
Sherman ES 224 99 7.2 15.8 29.9 43.9 3.2 47.1 3.4 219 100 5.0 14.2 27.1 44.0 9.6 53.7 3.4 7 1
Warwick Neck ES 184 98 5.6 18.3 30.0 40.6 5.6 46.1 3.7 176 98 7.0 9.9 30.8 48.3 4.1 52.3 3.8 6 0
Wyman ES 180 91 9.8 14.6 27.4 42.7 5.5 48.2 3.9 169 100 10.7 16.0 32.0 37.3 4.1 41.4 3.8 -7 9
Aldrich MS 512 93 18.4 26.6 30.4 23.6 1.1 24.7 2.0 496 99 10.0 19.8 26.9 34.6 8.8 43.4 2.2 19 6
Gorton MS 418 80 27.5 26.3 29.3 15.3 1.5 16.8 2.0 406 97 16.0 22.6 27.7 27.2 6.6 33.8 2.4 17 17
Winman MS 520 92 18.5 21.2 31.1 25.0 4.2 29.2 2.1 477 99 13.3 21.8 27.1 32.2 5.5 37.7 2.2 9 7
Pilgrim HS 464 91 29.0 24.5 24.0 17.9 4.5 22.4 2.0 484 99 31.0 21.7 21.7 21.0 4.6 25.6 2.0 3 9
Toll Gate HS 455 96 30.6 21.6 21.6 20.2 6.0 26.2 2.1 473 96 31.1 23.0 20.8 19.2 6.0 25.2 2.0 -1 0
Warwick Vets Mem. HS 376 83 29.6 21.5 25.7 19.3 3.9 23.2 2.4 387 97 31.7 22.4 29.3 15.5 1.1 16.5 1.9 -7 14
West Warwick All 2017 90 18.5 21.5 29.4 27.1 3.5 30.6 1.1 2051 96 16.8 19.5 25.7 32.3 5.6 37.9 1.1 7 7
Greenbush ES 177 99 10.3 18.9 37.1 30.3 3.4 33.7 3.6 175 99 10.4 18.5 29.5 37.6 4.0 41.6 3.7 8 0
John F. Horgan ES 184 98 20.6 32.2 26.1 18.3 2.8 21.1 3.0 192 99 20.4 16.8 29.8 30.4 2.6 33.0 3.4 12 2
Wakefield Hills ES 148 89 23.5 21.2 26.5 25.0 3.8 28.8 3.9 178 99 18.6 16.9 31.6 32.2 0.6 32.8 3.5 4 10
John F. Deering MS 987 90 15.4 19.6 30.9 30.0 4.0 34.1 1.6 988 95 13.7 21.1 24.3 34.5 6.4 41.0 1.6 7 4
West Warwick Sr. HS 507 83 25.3 22.0 25.5 24.6 2.6 27.2 2.2 503 98 21.6 19.1 23.6 27.9 7.7 35.6 2.2 8 15
Westerly All 1764 80 15.7 22.2 27.5 31.4 3.3 34.6 1.3 1707 98 16.7 19.7 28.2 31.1 4.2 35.3 1.2 1 18
Bradford ES 40 93 13.5 21.6 24.3 37.8 2.7 40.5 8.1 25 100 20.0 24.0 28.0 28.0 0.0 28.0 9.0 -13 0
Dunn's Corners ES 122 96 7.7 23.9 27.4 37.6 3.4 41.0 4.5 121 100 7.4 17.4 21.5 41.3 12.4 53.7 4.5 13 4
Springbrook ES 141 96 23.5 19.9 25.7 30.9 0.0 30.9 4.0 147 99 12.3 19.2 39.7 26.0 2.7 28.8 3.7 -2 3
State Street ES 127 94 8.3 17.5 29.2 42.5 2.5 45.0 4.5 131 100 6.1 17.6 32.8 42.0 1.5 43.5 4.3 -1 6
Westerly MS 879 91 15.2 23.3 29.3 29.7 2.5 32.2 1.6 840 99 11.8 19.2 29.0 35.1 4.9 40.0 1.7 8 8
Westerly HS 426 44 18.3 21.0 22.6 28.5 9.7 38.2 3.6 417 98 32.7 22.6 23.6 18.9 2.2 21.1 2.0 -17 54
Woonsocket All 3492 88 29.4 26.0 24.3 18.4 1.9 20.3 0.7 3401 95 30.4 24.6 25.1 18.2 1.7 20.0 0.7 0 7
Bernon Heights ES 227 98 15.3 21.6 26.6 35.1 1.4 36.5 3.2 252 98 19.0 18.6 24.7 34.8 2.8 37.7 3.1 1 0
Citizens Memorial ES 382 92 29.6 25.6 26.5 17.7 0.6 18.2 2.1 385 98 32.4 26.3 23.6 17.2 0.5 17.8 2.0 0 6
Globe Park ES 232 88 17.2 26.0 34.8 20.1 2.0 22.1 2.9 226 98 18.1 24.4 34.4 22.6 0.5 23.1 2.8 1 10
Harris ES 204 98 21.0 30.0 32.0 15.5 1.5 17.0 2.7 207 97 24.9 27.9 25.9 20.4 1.0 21.4 2.9 4 -1
Kevin K. Coleman ES 156 90 29.1 21.3 23.4 25.5 0.7 26.2 3.7 127 98 28.2 25.0 27.4 19.4 0.0 19.4 3.5 -7 7
Leo A. Savoie ES 191 98 13.8 19.1 30.9 32.4 3.7 36.2 3.5 230 99 17.6 24.7 30.0 26.9 0.9 27.8 3.0 -8 0
Woonsocket MS 1262 88 37.7 29.8 20.1 11.1 1.3 12.3 1.0 1230 95 36.8 26.6 24.1 11.8 0.8 12.6 1.0 0 7
Woonsocket HS 752 81 28.1 22.7 23.4 21.7 4.1 25.8 1.8 652 92 28.4 21.1 24.4 20.6 5.5 26.1 1.8 0 10 NOTE: Due to rounding, performance levels may not add up to 100%. Key (see Appendix A for performance level descriptors) L1 = Level 1: Did not yet meet expectations, L2 = Level 2: Partially met expectations, L3 = Level 3: Approached expectations, L4 = Level 4: Met expectations, L5 = Level 5: Exceeded expectations, SE = Standard error (see Appendix D) = Statistically significant decrease in percent of students Level 4 or above; = Statistically significant increase in percent of students Level 4 or above; = No statistically significant difference between comparison years
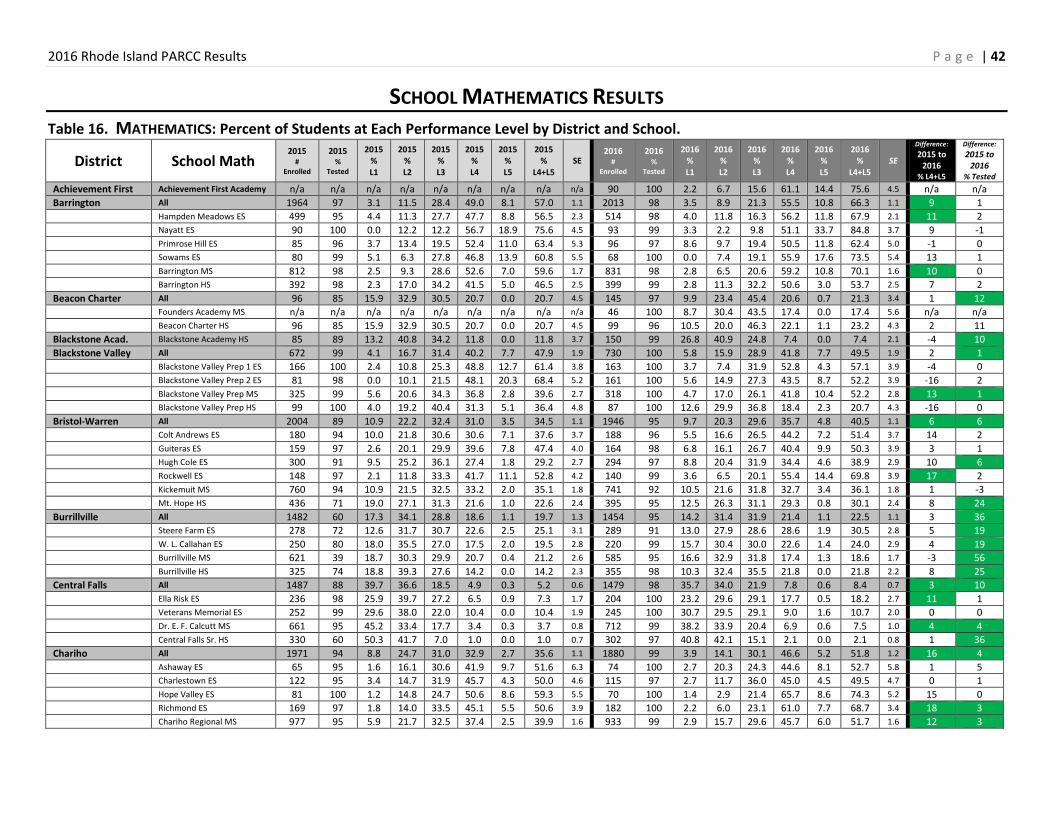
2016 Rhode Island PARCC Results P a g e | 42
SCHOOL MATHEMATICS RESULTS
Table 16. MATHEMATICS: Percent of Students at Each Performance Level by District and School.
District School Math 2015
# Enrolled
2015 %
Tested
2015 % L1
2015 % L2
2015 % L3
2015 % L4
2015 % L5
2015 %
L4+L5 SE
2016 #
Enrolled
2016 %
Tested
2016 % L1
2016 % L2
2016 % L3
2016 % L4
2016 % L5
2016 %
L4+L5 SE
Difference:
2015 to 2016
% L4+L5
Difference:
2015 to 2016
% Tested
Achievement First Achievement First Academy n/a n/a n/a n/a n/a n/a n/a n/a n/a 90 100 2.2 6.7 15.6 61.1 14.4 75.6 4.5 n/a n/a
Barrington All 1964 97 3.1 11.5 28.4 49.0 8.1 57.0 1.1 2013 98 3.5 8.9 21.3 55.5 10.8 66.3 1.1 9 1
Hampden Meadows ES 499 95 4.4 11.3 27.7 47.7 8.8 56.5 2.3 514 98 4.0 11.8 16.3 56.2 11.8 67.9 2.1 11 2
Nayatt ES 90 100 0.0 12.2 12.2 56.7 18.9 75.6 4.5 93 99 3.3 2.2 9.8 51.1 33.7 84.8 3.7 9 -1
Primrose Hill ES 85 96 3.7 13.4 19.5 52.4 11.0 63.4 5.3 96 97 8.6 9.7 19.4 50.5 11.8 62.4 5.0 -1 0
Sowams ES 80 99 5.1 6.3 27.8 46.8 13.9 60.8 5.5 68 100 0.0 7.4 19.1 55.9 17.6 73.5 5.4 13 1
Barrington MS 812 98 2.5 9.3 28.6 52.6 7.0 59.6 1.7 831 98 2.8 6.5 20.6 59.2 10.8 70.1 1.6 10 0
Barrington HS 392 98 2.3 17.0 34.2 41.5 5.0 46.5 2.5 399 99 2.8 11.3 32.2 50.6 3.0 53.7 2.5 7 2
Beacon Charter All 96 85 15.9 32.9 30.5 20.7 0.0 20.7 4.5 145 97 9.9 23.4 45.4 20.6 0.7 21.3 3.4 1 12
Founders Academy MS n/a n/a n/a n/a n/a n/a n/a n/a n/a 46 100 8.7 30.4 43.5 17.4 0.0 17.4 5.6 n/a n/a
Beacon Charter HS 96 85 15.9 32.9 30.5 20.7 0.0 20.7 4.5 99 96 10.5 20.0 46.3 22.1 1.1 23.2 4.3 2 11
Blackstone Acad. Blackstone Academy HS 85 89 13.2 40.8 34.2 11.8 0.0 11.8 3.7 150 99 26.8 40.9 24.8 7.4 0.0 7.4 2.1 -4 10
Blackstone Valley All 672 99 4.1 16.7 31.4 40.2 7.7 47.9 1.9 730 100 5.8 15.9 28.9 41.8 7.7 49.5 1.9 2 1
Blackstone Valley Prep 1 ES 166 100 2.4 10.8 25.3 48.8 12.7 61.4 3.8 163 100 3.7 7.4 31.9 52.8 4.3 57.1 3.9 -4 0
Blackstone Valley Prep 2 ES 81 98 0.0 10.1 21.5 48.1 20.3 68.4 5.2 161 100 5.6 14.9 27.3 43.5 8.7 52.2 3.9 -16 2
Blackstone Valley Prep MS 325 99 5.6 20.6 34.3 36.8 2.8 39.6 2.7 318 100 4.7 17.0 26.1 41.8 10.4 52.2 2.8 13 1
Blackstone Valley Prep HS 99 100 4.0 19.2 40.4 31.3 5.1 36.4 4.8 87 100 12.6 29.9 36.8 18.4 2.3 20.7 4.3 -16 0
Bristol-Warren All 2004 89 10.9 22.2 32.4 31.0 3.5 34.5 1.1 1946 95 9.7 20.3 29.6 35.7 4.8 40.5 1.1 6 6
Colt Andrews ES 180 94 10.0 21.8 30.6 30.6 7.1 37.6 3.7 188 96 5.5 16.6 26.5 44.2 7.2 51.4 3.7 14 2
Guiteras ES 159 97 2.6 20.1 29.9 39.6 7.8 47.4 4.0 164 98 6.8 16.1 26.7 40.4 9.9 50.3 3.9 3 1
Hugh Cole ES 300 91 9.5 25.2 36.1 27.4 1.8 29.2 2.7 294 97 8.8 20.4 31.9 34.4 4.6 38.9 2.9 10 6
Rockwell ES 148 97 2.1 11.8 33.3 41.7 11.1 52.8 4.2 140 99 3.6 6.5 20.1 55.4 14.4 69.8 3.9 17 2
Kickemuit MS 760 94 10.9 21.5 32.5 33.2 2.0 35.1 1.8 741 92 10.5 21.6 31.8 32.7 3.4 36.1 1.8 1 -3
Mt. Hope HS 436 71 19.0 27.1 31.3 21.6 1.0 22.6 2.4 395 95 12.5 26.3 31.1 29.3 0.8 30.1 2.4 8 24
Burrillville All 1482 60 17.3 34.1 28.8 18.6 1.1 19.7 1.3 1454 95 14.2 31.4 31.9 21.4 1.1 22.5 1.1 3 36
Steere Farm ES 278 72 12.6 31.7 30.7 22.6 2.5 25.1 3.1 289 91 13.0 27.9 28.6 28.6 1.9 30.5 2.8 5 19
W. L. Callahan ES 250 80 18.0 35.5 27.0 17.5 2.0 19.5 2.8 220 99 15.7 30.4 30.0 22.6 1.4 24.0 2.9 4 19
Burrillville MS 621 39 18.7 30.3 29.9 20.7 0.4 21.2 2.6 585 95 16.6 32.9 31.8 17.4 1.3 18.6 1.7 -3 56
Burrillville HS 325 74 18.8 39.3 27.6 14.2 0.0 14.2 2.3 355 98 10.3 32.4 35.5 21.8 0.0 21.8 2.2 8 25
Central Falls All 1487 88 39.7 36.6 18.5 4.9 0.3 5.2 0.6 1479 98 35.7 34.0 21.9 7.8 0.6 8.4 0.7 3 10
Ella Risk ES 236 98 25.9 39.7 27.2 6.5 0.9 7.3 1.7 204 100 23.2 29.6 29.1 17.7 0.5 18.2 2.7 11 1
Veterans Memorial ES 252 99 29.6 38.0 22.0 10.4 0.0 10.4 1.9 245 100 30.7 29.5 29.1 9.0 1.6 10.7 2.0 0 0
Dr. E. F. Calcutt MS 661 95 45.2 33.4 17.7 3.4 0.3 3.7 0.8 712 99 38.2 33.9 20.4 6.9 0.6 7.5 1.0 4 4
Central Falls Sr. HS 330 60 50.3 41.7 7.0 1.0 0.0 1.0 0.7 302 97 40.8 42.1 15.1 2.1 0.0 2.1 0.8 1 36
Chariho All 1971 94 8.8 24.7 31.0 32.9 2.7 35.6 1.1 1880 99 3.9 14.1 30.1 46.6 5.2 51.8 1.2 16 4
Ashaway ES 65 95 1.6 16.1 30.6 41.9 9.7 51.6 6.3 74 100 2.7 20.3 24.3 44.6 8.1 52.7 5.8 1 5
Charlestown ES 122 95 3.4 14.7 31.9 45.7 4.3 50.0 4.6 115 97 2.7 11.7 36.0 45.0 4.5 49.5 4.7 0 1
Hope Valley ES 81 100 1.2 14.8 24.7 50.6 8.6 59.3 5.5 70 100 1.4 2.9 21.4 65.7 8.6 74.3 5.2 15 0
Richmond ES 169 97 1.8 14.0 33.5 45.1 5.5 50.6 3.9 182 100 2.2 6.0 23.1 61.0 7.7 68.7 3.4 18 3
Chariho Regional MS 977 95 5.9 21.7 32.5 37.4 2.5 39.9 1.6 933 99 2.9 15.7 29.6 45.7 6.0 51.7 1.6 12 3
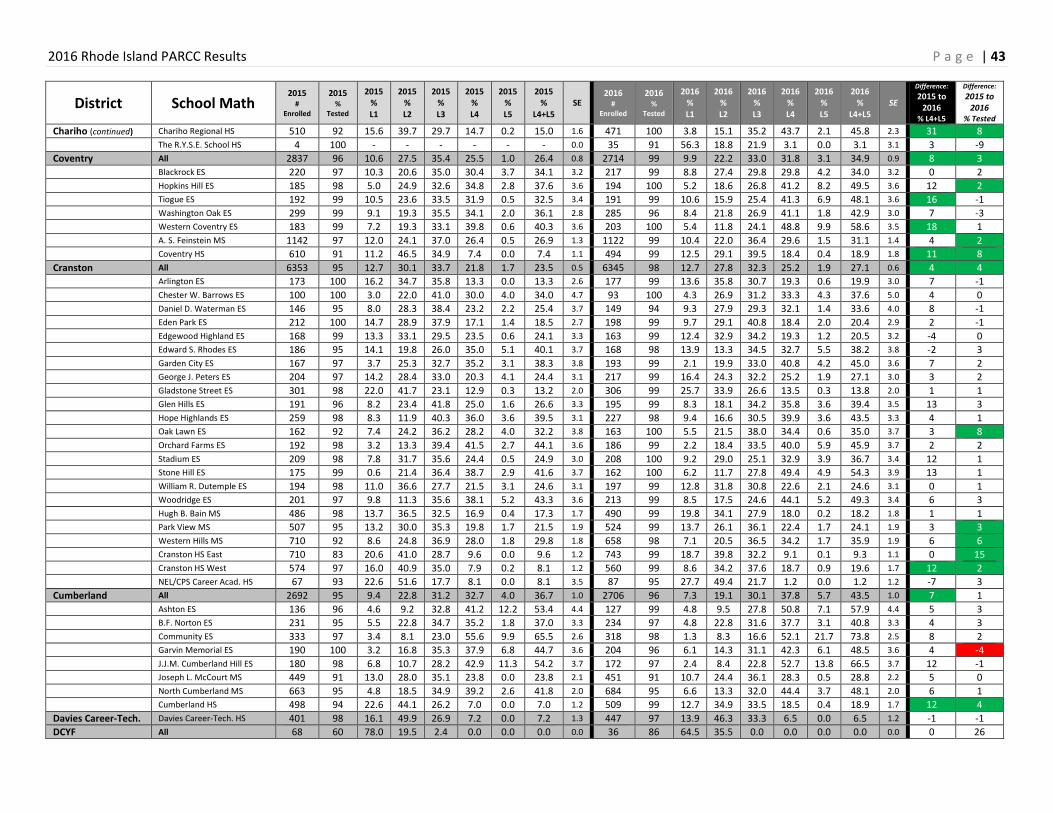
2016 Rhode Island PARCC Results P a g e | 43
District School Math 2015
# Enrolled
2015 %
Tested
2015 % L1
2015 % L2
2015 % L3
2015 % L4
2015 % L5
2015 %
L4+L5 SE
2016 #
Enrolled
2016 %
Tested
2016 % L1
2016 % L2
2016 % L3
2016 % L4
2016 % L5
2016 %
L4+L5 SE
Difference:
2015 to 2016
% L4+L5
Difference:
2015 to 2016
% Tested
Chariho (continued) Chariho Regional HS 510 92 15.6 39.7 29.7 14.7 0.2 15.0 1.6 471 100 3.8 15.1 35.2 43.7 2.1 45.8 2.3 31 8
The R.Y.S.E. School HS 4 100 - - - - - - 0.0 35 91 56.3 18.8 21.9 3.1 0.0 3.1 3.1 3 -9
Coventry All 2837 96 10.6 27.5 35.4 25.5 1.0 26.4 0.8 2714 99 9.9 22.2 33.0 31.8 3.1 34.9 0.9 8 3
Blackrock ES 220 97 10.3 20.6 35.0 30.4 3.7 34.1 3.2 217 99 8.8 27.4 29.8 29.8 4.2 34.0 3.2 0 2
Hopkins Hill ES 185 98 5.0 24.9 32.6 34.8 2.8 37.6 3.6 194 100 5.2 18.6 26.8 41.2 8.2 49.5 3.6 12 2
Tiogue ES 192 99 10.5 23.6 33.5 31.9 0.5 32.5 3.4 191 99 10.6 15.9 25.4 41.3 6.9 48.1 3.6 16 -1
Washington Oak ES 299 99 9.1 19.3 35.5 34.1 2.0 36.1 2.8 285 96 8.4 21.8 26.9 41.1 1.8 42.9 3.0 7 -3
Western Coventry ES 183 99 7.2 19.3 33.1 39.8 0.6 40.3 3.6 203 100 5.4 11.8 24.1 48.8 9.9 58.6 3.5 18 1
A. S. Feinstein MS 1142 97 12.0 24.1 37.0 26.4 0.5 26.9 1.3 1122 99 10.4 22.0 36.4 29.6 1.5 31.1 1.4 4 2
Coventry HS 610 91 11.2 46.5 34.9 7.4 0.0 7.4 1.1 494 99 12.5 29.1 39.5 18.4 0.4 18.9 1.8 11 8
Cranston All 6353 95 12.7 30.1 33.7 21.8 1.7 23.5 0.5 6345 98 12.7 27.8 32.3 25.2 1.9 27.1 0.6 4 4
Arlington ES 173 100 16.2 34.7 35.8 13.3 0.0 13.3 2.6 177 99 13.6 35.8 30.7 19.3 0.6 19.9 3.0 7 -1
Chester W. Barrows ES 100 100 3.0 22.0 41.0 30.0 4.0 34.0 4.7 93 100 4.3 26.9 31.2 33.3 4.3 37.6 5.0 4 0
Daniel D. Waterman ES 146 95 8.0 28.3 38.4 23.2 2.2 25.4 3.7 149 94 9.3 27.9 29.3 32.1 1.4 33.6 4.0 8 -1
Eden Park ES 212 100 14.7 28.9 37.9 17.1 1.4 18.5 2.7 198 99 9.7 29.1 40.8 18.4 2.0 20.4 2.9 2 -1
Edgewood Highland ES 168 99 13.3 33.1 29.5 23.5 0.6 24.1 3.3 163 99 12.4 32.9 34.2 19.3 1.2 20.5 3.2 -4 0
Edward S. Rhodes ES 186 95 14.1 19.8 26.0 35.0 5.1 40.1 3.7 168 98 13.9 13.3 34.5 32.7 5.5 38.2 3.8 -2 3
Garden City ES 167 97 3.7 25.3 32.7 35.2 3.1 38.3 3.8 193 99 2.1 19.9 33.0 40.8 4.2 45.0 3.6 7 2
George J. Peters ES 204 97 14.2 28.4 33.0 20.3 4.1 24.4 3.1 217 99 16.4 24.3 32.2 25.2 1.9 27.1 3.0 3 2
Gladstone Street ES 301 98 22.0 41.7 23.1 12.9 0.3 13.2 2.0 306 99 25.7 33.9 26.6 13.5 0.3 13.8 2.0 1 1
Glen Hills ES 191 96 8.2 23.4 41.8 25.0 1.6 26.6 3.3 195 99 8.3 18.1 34.2 35.8 3.6 39.4 3.5 13 3
Hope Highlands ES 259 98 8.3 11.9 40.3 36.0 3.6 39.5 3.1 227 98 9.4 16.6 30.5 39.9 3.6 43.5 3.3 4 1
Oak Lawn ES 162 92 7.4 24.2 36.2 28.2 4.0 32.2 3.8 163 100 5.5 21.5 38.0 34.4 0.6 35.0 3.7 3 8
Orchard Farms ES 192 98 3.2 13.3 39.4 41.5 2.7 44.1 3.6 186 99 2.2 18.4 33.5 40.0 5.9 45.9 3.7 2 2
Stadium ES 209 98 7.8 31.7 35.6 24.4 0.5 24.9 3.0 208 100 9.2 29.0 25.1 32.9 3.9 36.7 3.4 12 1
Stone Hill ES 175 99 0.6 21.4 36.4 38.7 2.9 41.6 3.7 162 100 6.2 11.7 27.8 49.4 4.9 54.3 3.9 13 1
William R. Dutemple ES 194 98 11.0 36.6 27.7 21.5 3.1 24.6 3.1 197 99 12.8 31.8 30.8 22.6 2.1 24.6 3.1 0 1
Woodridge ES 201 97 9.8 11.3 35.6 38.1 5.2 43.3 3.6 213 99 8.5 17.5 24.6 44.1 5.2 49.3 3.4 6 3
Hugh B. Bain MS 486 98 13.7 36.5 32.5 16.9 0.4 17.3 1.7 490 99 19.8 34.1 27.9 18.0 0.2 18.2 1.8 1 1
Park View MS 507 95 13.2 30.0 35.3 19.8 1.7 21.5 1.9 524 99 13.7 26.1 36.1 22.4 1.7 24.1 1.9 3 3
Western Hills MS 710 92 8.6 24.8 36.9 28.0 1.8 29.8 1.8 658 98 7.1 20.5 36.5 34.2 1.7 35.9 1.9 6 6
Cranston HS East 710 83 20.6 41.0 28.7 9.6 0.0 9.6 1.2 743 99 18.7 39.8 32.2 9.1 0.1 9.3 1.1 0 15
Cranston HS West 574 97 16.0 40.9 35.0 7.9 0.2 8.1 1.2 560 99 8.6 34.2 37.6 18.7 0.9 19.6 1.7 12 2
NEL/CPS Career Acad. HS 67 93 22.6 51.6 17.7 8.1 0.0 8.1 3.5 87 95 27.7 49.4 21.7 1.2 0.0 1.2 1.2 -7 3
Cumberland All 2692 95 9.4 22.8 31.2 32.7 4.0 36.7 1.0 2706 96 7.3 19.1 30.1 37.8 5.7 43.5 1.0 7 1
Ashton ES 136 96 4.6 9.2 32.8 41.2 12.2 53.4 4.4 127 99 4.8 9.5 27.8 50.8 7.1 57.9 4.4 5 3
B.F. Norton ES 231 95 5.5 22.8 34.7 35.2 1.8 37.0 3.3 234 97 4.8 22.8 31.6 37.7 3.1 40.8 3.3 4 3
Community ES 333 97 3.4 8.1 23.0 55.6 9.9 65.5 2.6 318 98 1.3 8.3 16.6 52.1 21.7 73.8 2.5 8 2
Garvin Memorial ES 190 100 3.2 16.8 35.3 37.9 6.8 44.7 3.6 204 96 6.1 14.3 31.1 42.3 6.1 48.5 3.6 4 -4
J.J.M. Cumberland Hill ES 180 98 6.8 10.7 28.2 42.9 11.3 54.2 3.7 172 97 2.4 8.4 22.8 52.7 13.8 66.5 3.7 12 -1
Joseph L. McCourt MS 449 91 13.0 28.0 35.1 23.8 0.0 23.8 2.1 451 91 10.7 24.4 36.1 28.3 0.5 28.8 2.2 5 0
North Cumberland MS 663 95 4.8 18.5 34.9 39.2 2.6 41.8 2.0 684 95 6.6 13.3 32.0 44.4 3.7 48.1 2.0 6 1
Cumberland HS 498 94 22.6 44.1 26.2 7.0 0.0 7.0 1.2 509 99 12.7 34.9 33.5 18.5 0.4 18.9 1.7 12 4
Davies Career-Tech. Davies Career-Tech. HS 401 98 16.1 49.9 26.9 7.2 0.0 7.2 1.3 447 97 13.9 46.3 33.3 6.5 0.0 6.5 1.2 -1 -1
DCYF All 68 60 78.0 19.5 2.4 0.0 0.0 0.0 0.0 36 86 64.5 35.5 0.0 0.0 0.0 0.0 0.0 0 26
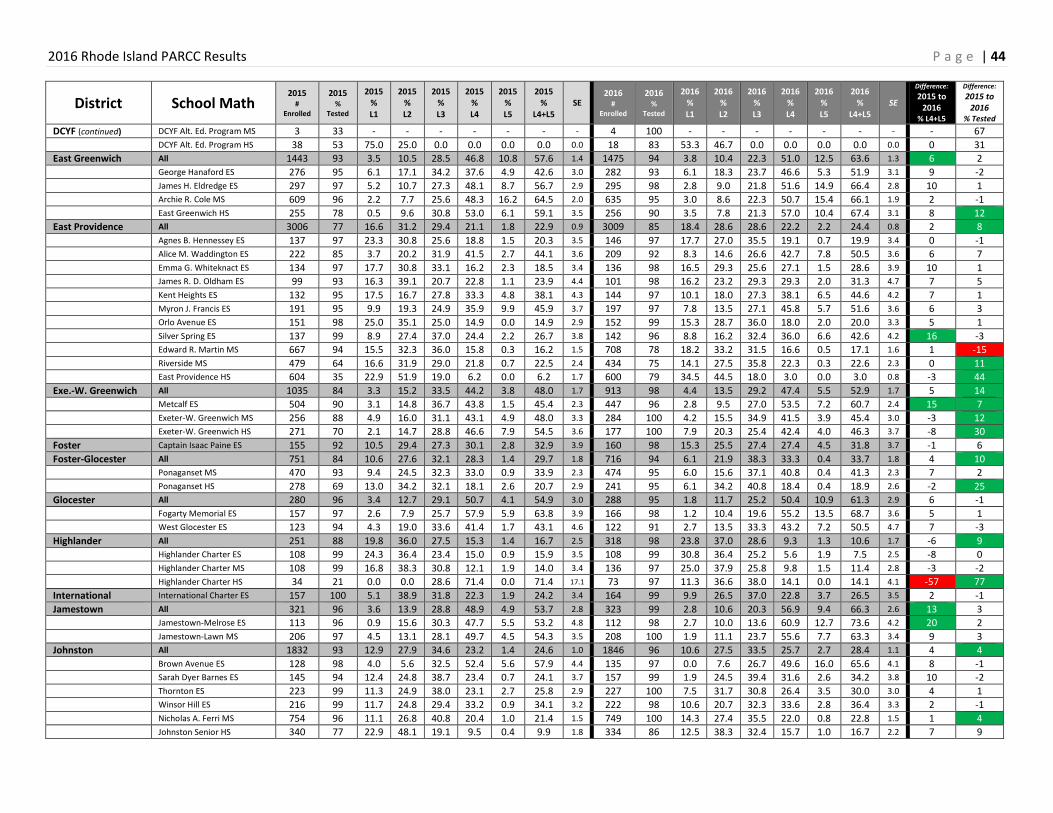
2016 Rhode Island PARCC Results P a g e | 44
District School Math 2015
# Enrolled
2015 %
Tested
2015 % L1
2015 % L2
2015 % L3
2015 % L4
2015 % L5
2015 %
L4+L5 SE
2016 #
Enrolled
2016 %
Tested
2016 % L1
2016 % L2
2016 % L3
2016 % L4
2016 % L5
2016 %
L4+L5 SE
Difference:
2015 to 2016
% L4+L5
Difference:
2015 to 2016
% Tested
DCYF (continued) DCYF Alt. Ed. Program MS 3 33 - - - - - - - 4 100 - - - - - - - - 67
DCYF Alt. Ed. Program HS 38 53 75.0 25.0 0.0 0.0 0.0 0.0 0.0 18 83 53.3 46.7 0.0 0.0 0.0 0.0 0.0 0 31
East Greenwich All 1443 93 3.5 10.5 28.5 46.8 10.8 57.6 1.4 1475 94 3.8 10.4 22.3 51.0 12.5 63.6 1.3 6 2
George Hanaford ES 276 95 6.1 17.1 34.2 37.6 4.9 42.6 3.0 282 93 6.1 18.3 23.7 46.6 5.3 51.9 3.1 9 -2
James H. Eldredge ES 297 97 5.2 10.7 27.3 48.1 8.7 56.7 2.9 295 98 2.8 9.0 21.8 51.6 14.9 66.4 2.8 10 1
Archie R. Cole MS 609 96 2.2 7.7 25.6 48.3 16.2 64.5 2.0 635 95 3.0 8.6 22.3 50.7 15.4 66.1 1.9 2 -1
East Greenwich HS 255 78 0.5 9.6 30.8 53.0 6.1 59.1 3.5 256 90 3.5 7.8 21.3 57.0 10.4 67.4 3.1 8 12
East Providence All 3006 77 16.6 31.2 29.4 21.1 1.8 22.9 0.9 3009 85 18.4 28.6 28.6 22.2 2.2 24.4 0.8 2 8
Agnes B. Hennessey ES 137 97 23.3 30.8 25.6 18.8 1.5 20.3 3.5 146 97 17.7 27.0 35.5 19.1 0.7 19.9 3.4 0 -1
Alice M. Waddington ES 222 85 3.7 20.2 31.9 41.5 2.7 44.1 3.6 209 92 8.3 14.6 26.6 42.7 7.8 50.5 3.6 6 7
Emma G. Whiteknact ES 134 97 17.7 30.8 33.1 16.2 2.3 18.5 3.4 136 98 16.5 29.3 25.6 27.1 1.5 28.6 3.9 10 1
James R. D. Oldham ES 99 93 16.3 39.1 20.7 22.8 1.1 23.9 4.4 101 98 16.2 23.2 29.3 29.3 2.0 31.3 4.7 7 5
Kent Heights ES 132 95 17.5 16.7 27.8 33.3 4.8 38.1 4.3 144 97 10.1 18.0 27.3 38.1 6.5 44.6 4.2 7 1
Myron J. Francis ES 191 95 9.9 19.3 24.9 35.9 9.9 45.9 3.7 197 97 7.8 13.5 27.1 45.8 5.7 51.6 3.6 6 3
Orlo Avenue ES 151 98 25.0 35.1 25.0 14.9 0.0 14.9 2.9 152 99 15.3 28.7 36.0 18.0 2.0 20.0 3.3 5 1
Silver Spring ES 137 99 8.9 27.4 37.0 24.4 2.2 26.7 3.8 142 96 8.8 16.2 32.4 36.0 6.6 42.6 4.2 16 -3
Edward R. Martin MS 667 94 15.5 32.3 36.0 15.8 0.3 16.2 1.5 708 78 18.2 33.2 31.5 16.6 0.5 17.1 1.6 1 -15
Riverside MS 479 64 16.6 31.9 29.0 21.8 0.7 22.5 2.4 434 75 14.1 27.5 35.8 22.3 0.3 22.6 2.3 0 11
East Providence HS 604 35 22.9 51.9 19.0 6.2 0.0 6.2 1.7 600 79 34.5 44.5 18.0 3.0 0.0 3.0 0.8 -3 44
Exe.-W. Greenwich All 1035 84 3.3 15.2 33.5 44.2 3.8 48.0 1.7 913 98 4.4 13.5 29.2 47.4 5.5 52.9 1.7 5 14
Metcalf ES 504 90 3.1 14.8 36.7 43.8 1.5 45.4 2.3 447 96 2.8 9.5 27.0 53.5 7.2 60.7 2.4 15 7
Exeter-W. Greenwich MS 256 88 4.9 16.0 31.1 43.1 4.9 48.0 3.3 284 100 4.2 15.5 34.9 41.5 3.9 45.4 3.0 -3 12
Exeter-W. Greenwich HS 271 70 2.1 14.7 28.8 46.6 7.9 54.5 3.6 177 100 7.9 20.3 25.4 42.4 4.0 46.3 3.7 -8 30
Foster Captain Isaac Paine ES 155 92 10.5 29.4 27.3 30.1 2.8 32.9 3.9 160 98 15.3 25.5 27.4 27.4 4.5 31.8 3.7 -1 6
Foster-Glocester All 751 84 10.6 27.6 32.1 28.3 1.4 29.7 1.8 716 94 6.1 21.9 38.3 33.3 0.4 33.7 1.8 4 10
Ponaganset MS 470 93 9.4 24.5 32.3 33.0 0.9 33.9 2.3 474 95 6.0 15.6 37.1 40.8 0.4 41.3 2.3 7 2
Ponaganset HS 278 69 13.0 34.2 32.1 18.1 2.6 20.7 2.9 241 95 6.1 34.2 40.8 18.4 0.4 18.9 2.6 -2 25
Glocester All 280 96 3.4 12.7 29.1 50.7 4.1 54.9 3.0 288 95 1.8 11.7 25.2 50.4 10.9 61.3 2.9 6 -1
Fogarty Memorial ES 157 97 2.6 7.9 25.7 57.9 5.9 63.8 3.9 166 98 1.2 10.4 19.6 55.2 13.5 68.7 3.6 5 1
West Glocester ES 123 94 4.3 19.0 33.6 41.4 1.7 43.1 4.6 122 91 2.7 13.5 33.3 43.2 7.2 50.5 4.7 7 -3
Highlander All 251 88 19.8 36.0 27.5 15.3 1.4 16.7 2.5 318 98 23.8 37.0 28.6 9.3 1.3 10.6 1.7 -6 9
Highlander Charter ES 108 99 24.3 36.4 23.4 15.0 0.9 15.9 3.5 108 99 30.8 36.4 25.2 5.6 1.9 7.5 2.5 -8 0
Highlander Charter MS 108 99 16.8 38.3 30.8 12.1 1.9 14.0 3.4 136 97 25.0 37.9 25.8 9.8 1.5 11.4 2.8 -3 -2
Highlander Charter HS 34 21 0.0 0.0 28.6 71.4 0.0 71.4 17.1 73 97 11.3 36.6 38.0 14.1 0.0 14.1 4.1 -57 77
International International Charter ES 157 100 5.1 38.9 31.8 22.3 1.9 24.2 3.4 164 99 9.9 26.5 37.0 22.8 3.7 26.5 3.5 2 -1
Jamestown All 321 96 3.6 13.9 28.8 48.9 4.9 53.7 2.8 323 99 2.8 10.6 20.3 56.9 9.4 66.3 2.6 13 3
Jamestown-Melrose ES 113 96 0.9 15.6 30.3 47.7 5.5 53.2 4.8 112 98 2.7 10.0 13.6 60.9 12.7 73.6 4.2 20 2
Jamestown-Lawn MS 206 97 4.5 13.1 28.1 49.7 4.5 54.3 3.5 208 100 1.9 11.1 23.7 55.6 7.7 63.3 3.4 9 3
Johnston All 1832 93 12.9 27.9 34.6 23.2 1.4 24.6 1.0 1846 96 10.6 27.5 33.5 25.7 2.7 28.4 1.1 4 4
Brown Avenue ES 128 98 4.0 5.6 32.5 52.4 5.6 57.9 4.4 135 97 0.0 7.6 26.7 49.6 16.0 65.6 4.1 8 -1
Sarah Dyer Barnes ES 145 94 12.4 24.8 38.7 23.4 0.7 24.1 3.7 157 99 1.9 24.5 39.4 31.6 2.6 34.2 3.8 10 -2
Thornton ES 223 99 11.3 24.9 38.0 23.1 2.7 25.8 2.9 227 100 7.5 31.7 30.8 26.4 3.5 30.0 3.0 4 1
Winsor Hill ES 216 99 11.7 24.8 29.4 33.2 0.9 34.1 3.2 222 98 10.6 20.7 32.3 33.6 2.8 36.4 3.3 2 -1
Nicholas A. Ferri MS 754 96 11.1 26.8 40.8 20.4 1.0 21.4 1.5 749 100 14.3 27.4 35.5 22.0 0.8 22.8 1.5 1 4
Johnston Senior HS 340 77 22.9 48.1 19.1 9.5 0.4 9.9 1.8 334 86 12.5 38.3 32.4 15.7 1.0 16.7 2.2 7 9
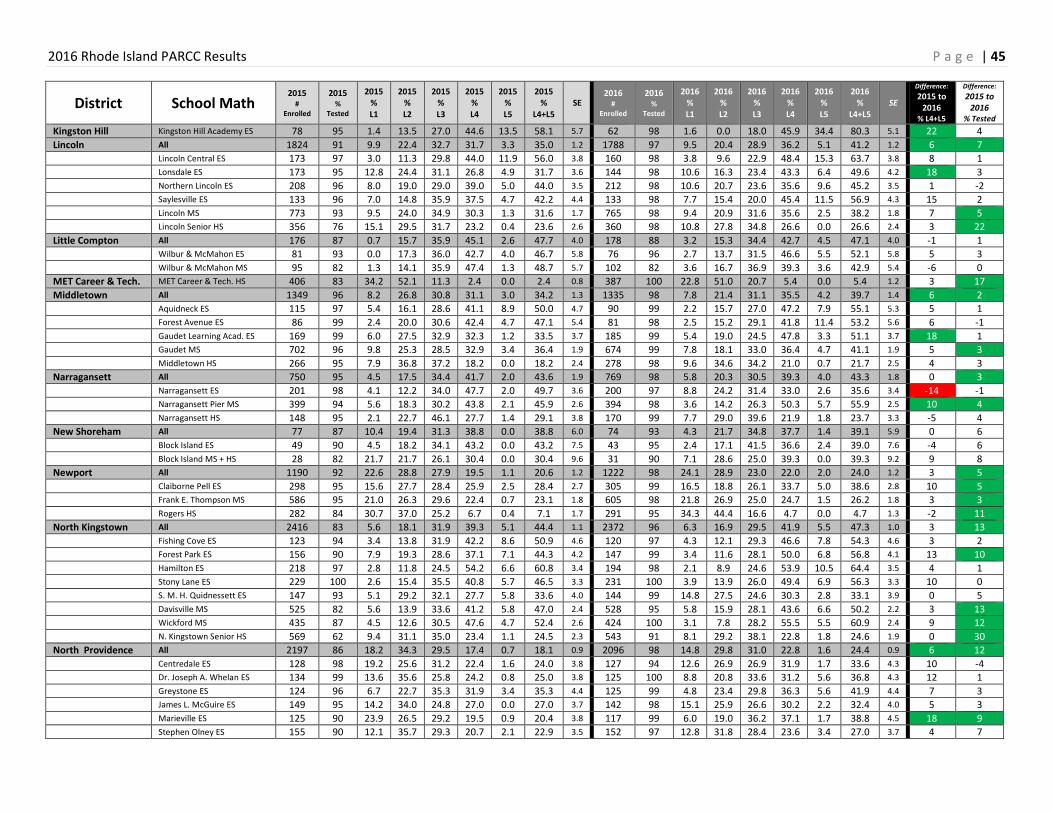
2016 Rhode Island PARCC Results P a g e | 45
District School Math 2015
# Enrolled
2015 %
Tested
2015 % L1
2015 % L2
2015 % L3
2015 % L4
2015 % L5
2015 %
L4+L5 SE
2016 #
Enrolled
2016 %
Tested
2016 % L1
2016 % L2
2016 % L3
2016 % L4
2016 % L5
2016 %
L4+L5 SE
Difference:
2015 to 2016
% L4+L5
Difference:
2015 to 2016
% Tested
Kingston Hill Kingston Hill Academy ES 78 95 1.4 13.5 27.0 44.6 13.5 58.1 5.7 62 98 1.6 0.0 18.0 45.9 34.4 80.3 5.1 22 4
Lincoln All 1824 91 9.9 22.4 32.7 31.7 3.3 35.0 1.2 1788 97 9.5 20.4 28.9 36.2 5.1 41.2 1.2 6 7
Lincoln Central ES 173 97 3.0 11.3 29.8 44.0 11.9 56.0 3.8 160 98 3.8 9.6 22.9 48.4 15.3 63.7 3.8 8 1
Lonsdale ES 173 95 12.8 24.4 31.1 26.8 4.9 31.7 3.6 144 98 10.6 16.3 23.4 43.3 6.4 49.6 4.2 18 3
Northern Lincoln ES 208 96 8.0 19.0 29.0 39.0 5.0 44.0 3.5 212 98 10.6 20.7 23.6 35.6 9.6 45.2 3.5 1 -2
Saylesville ES 133 96 7.0 14.8 35.9 37.5 4.7 42.2 4.4 133 98 7.7 15.4 20.0 45.4 11.5 56.9 4.3 15 2
Lincoln MS 773 93 9.5 24.0 34.9 30.3 1.3 31.6 1.7 765 98 9.4 20.9 31.6 35.6 2.5 38.2 1.8 7 5
Lincoln Senior HS 356 76 15.1 29.5 31.7 23.2 0.4 23.6 2.6 360 98 10.8 27.8 34.8 26.6 0.0 26.6 2.4 3 22
Little Compton All 176 87 0.7 15.7 35.9 45.1 2.6 47.7 4.0 178 88 3.2 15.3 34.4 42.7 4.5 47.1 4.0 -1 1
Wilbur & McMahon ES 81 93 0.0 17.3 36.0 42.7 4.0 46.7 5.8 76 96 2.7 13.7 31.5 46.6 5.5 52.1 5.8 5 3
Wilbur & McMahon MS 95 82 1.3 14.1 35.9 47.4 1.3 48.7 5.7 102 82 3.6 16.7 36.9 39.3 3.6 42.9 5.4 -6 0
MET Career & Tech. MET Career & Tech. HS 406 83 34.2 52.1 11.3 2.4 0.0 2.4 0.8 387 100 22.8 51.0 20.7 5.4 0.0 5.4 1.2 3 17
Middletown All 1349 96 8.2 26.8 30.8 31.1 3.0 34.2 1.3 1335 98 7.8 21.4 31.1 35.5 4.2 39.7 1.4 6 2
Aquidneck ES 115 97 5.4 16.1 28.6 41.1 8.9 50.0 4.7 90 99 2.2 15.7 27.0 47.2 7.9 55.1 5.3 5 1
Forest Avenue ES 86 99 2.4 20.0 30.6 42.4 4.7 47.1 5.4 81 98 2.5 15.2 29.1 41.8 11.4 53.2 5.6 6 -1
Gaudet Learning Acad. ES 169 99 6.0 27.5 32.9 32.3 1.2 33.5 3.7 185 99 5.4 19.0 24.5 47.8 3.3 51.1 3.7 18 1
Gaudet MS 702 96 9.8 25.3 28.5 32.9 3.4 36.4 1.9 674 99 7.8 18.1 33.0 36.4 4.7 41.1 1.9 5 3
Middletown HS 266 95 7.9 36.8 37.2 18.2 0.0 18.2 2.4 278 98 9.6 34.6 34.2 21.0 0.7 21.7 2.5 4 3
Narragansett All 750 95 4.5 17.5 34.4 41.7 2.0 43.6 1.9 769 98 5.8 20.3 30.5 39.3 4.0 43.3 1.8 0 3
Narragansett ES 201 98 4.1 12.2 34.0 47.7 2.0 49.7 3.6 200 97 8.8 24.2 31.4 33.0 2.6 35.6 3.4 -14 -1
Narragansett Pier MS 399 94 5.6 18.3 30.2 43.8 2.1 45.9 2.6 394 98 3.6 14.2 26.3 50.3 5.7 55.9 2.5 10 4
Narragansett HS 148 95 2.1 22.7 46.1 27.7 1.4 29.1 3.8 170 99 7.7 29.0 39.6 21.9 1.8 23.7 3.3 -5 4
New Shoreham All 77 87 10.4 19.4 31.3 38.8 0.0 38.8 6.0 74 93 4.3 21.7 34.8 37.7 1.4 39.1 5.9 0 6
Block Island ES 49 90 4.5 18.2 34.1 43.2 0.0 43.2 7.5 43 95 2.4 17.1 41.5 36.6 2.4 39.0 7.6 -4 6
Block Island MS + HS 28 82 21.7 21.7 26.1 30.4 0.0 30.4 9.6 31 90 7.1 28.6 25.0 39.3 0.0 39.3 9.2 9 8
Newport All 1190 92 22.6 28.8 27.9 19.5 1.1 20.6 1.2 1222 98 24.1 28.9 23.0 22.0 2.0 24.0 1.2 3 5
Claiborne Pell ES 298 95 15.6 27.7 28.4 25.9 2.5 28.4 2.7 305 99 16.5 18.8 26.1 33.7 5.0 38.6 2.8 10 5
Frank E. Thompson MS 586 95 21.0 26.3 29.6 22.4 0.7 23.1 1.8 605 98 21.8 26.9 25.0 24.7 1.5 26.2 1.8 3 3
Rogers HS 282 84 30.7 37.0 25.2 6.7 0.4 7.1 1.7 291 95 34.3 44.4 16.6 4.7 0.0 4.7 1.3 -2 11
North Kingstown All 2416 83 5.6 18.1 31.9 39.3 5.1 44.4 1.1 2372 96 6.3 16.9 29.5 41.9 5.5 47.3 1.0 3 13
Fishing Cove ES 123 94 3.4 13.8 31.9 42.2 8.6 50.9 4.6 120 97 4.3 12.1 29.3 46.6 7.8 54.3 4.6 3 2
Forest Park ES 156 90 7.9 19.3 28.6 37.1 7.1 44.3 4.2 147 99 3.4 11.6 28.1 50.0 6.8 56.8 4.1 13 10
Hamilton ES 218 97 2.8 11.8 24.5 54.2 6.6 60.8 3.4 194 98 2.1 8.9 24.6 53.9 10.5 64.4 3.5 4 1
Stony Lane ES 229 100 2.6 15.4 35.5 40.8 5.7 46.5 3.3 231 100 3.9 13.9 26.0 49.4 6.9 56.3 3.3 10 0
S. M. H. Quidnessett ES 147 93 5.1 29.2 32.1 27.7 5.8 33.6 4.0 144 99 14.8 27.5 24.6 30.3 2.8 33.1 3.9 0 5
Davisville MS 525 82 5.6 13.9 33.6 41.2 5.8 47.0 2.4 528 95 5.8 15.9 28.1 43.6 6.6 50.2 2.2 3 13
Wickford MS 435 87 4.5 12.6 30.5 47.6 4.7 52.4 2.6 424 100 3.1 7.8 28.2 55.5 5.5 60.9 2.4 9 12
N. Kingstown Senior HS 569 62 9.4 31.1 35.0 23.4 1.1 24.5 2.3 543 91 8.1 29.2 38.1 22.8 1.8 24.6 1.9 0 30
North Providence All 2197 86 18.2 34.3 29.5 17.4 0.7 18.1 0.9 2096 98 14.8 29.8 31.0 22.8 1.6 24.4 0.9 6 12
Centredale ES 128 98 19.2 25.6 31.2 22.4 1.6 24.0 3.8 127 94 12.6 26.9 26.9 31.9 1.7 33.6 4.3 10 -4
Dr. Joseph A. Whelan ES 134 99 13.6 35.6 25.8 24.2 0.8 25.0 3.8 125 100 8.8 20.8 33.6 31.2 5.6 36.8 4.3 12 1
Greystone ES 124 96 6.7 22.7 35.3 31.9 3.4 35.3 4.4 125 99 4.8 23.4 29.8 36.3 5.6 41.9 4.4 7 3
James L. McGuire ES 149 95 14.2 34.0 24.8 27.0 0.0 27.0 3.7 142 98 15.1 25.9 26.6 30.2 2.2 32.4 4.0 5 3
Marieville ES 125 90 23.9 26.5 29.2 19.5 0.9 20.4 3.8 117 99 6.0 19.0 36.2 37.1 1.7 38.8 4.5 18 9
Stephen Olney ES 155 90 12.1 35.7 29.3 20.7 2.1 22.9 3.5 152 97 12.8 31.8 28.4 23.6 3.4 27.0 3.7 4 7
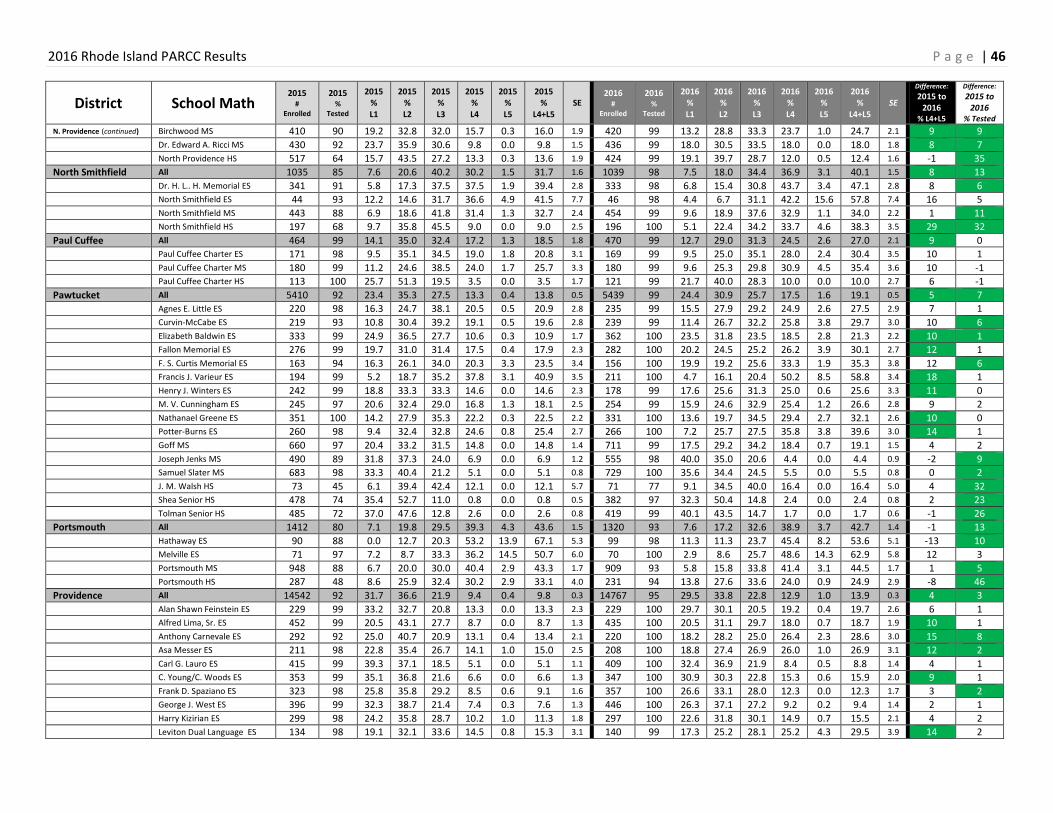
2016 Rhode Island PARCC Results P a g e | 46
District School Math 2015
# Enrolled
2015 %
Tested
2015 % L1
2015 % L2
2015 % L3
2015 % L4
2015 % L5
2015 %
L4+L5 SE
2016 #
Enrolled
2016 %
Tested
2016 % L1
2016 % L2
2016 % L3
2016 % L4
2016 % L5
2016 %
L4+L5 SE
Difference:
2015 to 2016
% L4+L5
Difference:
2015 to 2016
% Tested
N. Providence (continued) Birchwood MS 410 90 19.2 32.8 32.0 15.7 0.3 16.0 1.9 420 99 13.2 28.8 33.3 23.7 1.0 24.7 2.1 9 9
Dr. Edward A. Ricci MS 430 92 23.7 35.9 30.6 9.8 0.0 9.8 1.5 436 99 18.0 30.5 33.5 18.0 0.0 18.0 1.8 8 7
North Providence HS 517 64 15.7 43.5 27.2 13.3 0.3 13.6 1.9 424 99 19.1 39.7 28.7 12.0 0.5 12.4 1.6 -1 35
North Smithfield All 1035 85 7.6 20.6 40.2 30.2 1.5 31.7 1.6 1039 98 7.5 18.0 34.4 36.9 3.1 40.1 1.5 8 13
Dr. H. L.. H. Memorial ES 341 91 5.8 17.3 37.5 37.5 1.9 39.4 2.8 333 98 6.8 15.4 30.8 43.7 3.4 47.1 2.8 8 6
North Smithfield ES 44 93 12.2 14.6 31.7 36.6 4.9 41.5 7.7 46 98 4.4 6.7 31.1 42.2 15.6 57.8 7.4 16 5
North Smithfield MS 443 88 6.9 18.6 41.8 31.4 1.3 32.7 2.4 454 99 9.6 18.9 37.6 32.9 1.1 34.0 2.2 1 11
North Smithfield HS 197 68 9.7 35.8 45.5 9.0 0.0 9.0 2.5 196 100 5.1 22.4 34.2 33.7 4.6 38.3 3.5 29 32
Paul Cuffee All 464 99 14.1 35.0 32.4 17.2 1.3 18.5 1.8 470 99 12.7 29.0 31.3 24.5 2.6 27.0 2.1 9 0
Paul Cuffee Charter ES 171 98 9.5 35.1 34.5 19.0 1.8 20.8 3.1 169 99 9.5 25.0 35.1 28.0 2.4 30.4 3.5 10 1
Paul Cuffee Charter MS 180 99 11.2 24.6 38.5 24.0 1.7 25.7 3.3 180 99 9.6 25.3 29.8 30.9 4.5 35.4 3.6 10 -1
Paul Cuffee Charter HS 113 100 25.7 51.3 19.5 3.5 0.0 3.5 1.7 121 99 21.7 40.0 28.3 10.0 0.0 10.0 2.7 6 -1
Pawtucket All 5410 92 23.4 35.3 27.5 13.3 0.4 13.8 0.5 5439 99 24.4 30.9 25.7 17.5 1.6 19.1 0.5 5 7
Agnes E. Little ES 220 98 16.3 24.7 38.1 20.5 0.5 20.9 2.8 235 99 15.5 27.9 29.2 24.9 2.6 27.5 2.9 7 1
Curvin-McCabe ES 219 93 10.8 30.4 39.2 19.1 0.5 19.6 2.8 239 99 11.4 26.7 32.2 25.8 3.8 29.7 3.0 10 6
Elizabeth Baldwin ES 333 99 24.9 36.5 27.7 10.6 0.3 10.9 1.7 362 100 23.5 31.8 23.5 18.5 2.8 21.3 2.2 10 1
Fallon Memorial ES 276 99 19.7 31.0 31.4 17.5 0.4 17.9 2.3 282 100 20.2 24.5 25.2 26.2 3.9 30.1 2.7 12 1
F. S. Curtis Memorial ES 163 94 16.3 26.1 34.0 20.3 3.3 23.5 3.4 156 100 19.9 19.2 25.6 33.3 1.9 35.3 3.8 12 6
Francis J. Varieur ES 194 99 5.2 18.7 35.2 37.8 3.1 40.9 3.5 211 100 4.7 16.1 20.4 50.2 8.5 58.8 3.4 18 1
Henry J. Winters ES 242 99 18.8 33.3 33.3 14.6 0.0 14.6 2.3 178 99 17.6 25.6 31.3 25.0 0.6 25.6 3.3 11 0
M. V. Cunningham ES 245 97 20.6 32.4 29.0 16.8 1.3 18.1 2.5 254 99 15.9 24.6 32.9 25.4 1.2 26.6 2.8 9 2
Nathanael Greene ES 351 100 14.2 27.9 35.3 22.2 0.3 22.5 2.2 331 100 13.6 19.7 34.5 29.4 2.7 32.1 2.6 10 0
Potter-Burns ES 260 98 9.4 32.4 32.8 24.6 0.8 25.4 2.7 266 100 7.2 25.7 27.5 35.8 3.8 39.6 3.0 14 1
Goff MS 660 97 20.4 33.2 31.5 14.8 0.0 14.8 1.4 711 99 17.5 29.2 34.2 18.4 0.7 19.1 1.5 4 2
Joseph Jenks MS 490 89 31.8 37.3 24.0 6.9 0.0 6.9 1.2 555 98 40.0 35.0 20.6 4.4 0.0 4.4 0.9 -2 9
Samuel Slater MS 683 98 33.3 40.4 21.2 5.1 0.0 5.1 0.8 729 100 35.6 34.4 24.5 5.5 0.0 5.5 0.8 0 2
J. M. Walsh HS 73 45 6.1 39.4 42.4 12.1 0.0 12.1 5.7 71 77 9.1 34.5 40.0 16.4 0.0 16.4 5.0 4 32
Shea Senior HS 478 74 35.4 52.7 11.0 0.8 0.0 0.8 0.5 382 97 32.3 50.4 14.8 2.4 0.0 2.4 0.8 2 23
Tolman Senior HS 485 72 37.0 47.6 12.8 2.6 0.0 2.6 0.8 419 99 40.1 43.5 14.7 1.7 0.0 1.7 0.6 -1 26
Portsmouth All 1412 80 7.1 19.8 29.5 39.3 4.3 43.6 1.5 1320 93 7.6 17.2 32.6 38.9 3.7 42.7 1.4 -1 13
Hathaway ES 90 88 0.0 12.7 20.3 53.2 13.9 67.1 5.3 99 98 11.3 11.3 23.7 45.4 8.2 53.6 5.1 -13 10
Melville ES 71 97 7.2 8.7 33.3 36.2 14.5 50.7 6.0 70 100 2.9 8.6 25.7 48.6 14.3 62.9 5.8 12 3
Portsmouth MS 948 88 6.7 20.0 30.0 40.4 2.9 43.3 1.7 909 93 5.8 15.8 33.8 41.4 3.1 44.5 1.7 1 5
Portsmouth HS 287 48 8.6 25.9 32.4 30.2 2.9 33.1 4.0 231 94 13.8 27.6 33.6 24.0 0.9 24.9 2.9 -8 46
Providence All 14542 92 31.7 36.6 21.9 9.4 0.4 9.8 0.3 14767 95 29.5 33.8 22.8 12.9 1.0 13.9 0.3 4 3
Alan Shawn Feinstein ES 229 99 33.2 32.7 20.8 13.3 0.0 13.3 2.3 229 100 29.7 30.1 20.5 19.2 0.4 19.7 2.6 6 1
Alfred Lima, Sr. ES 452 99 20.5 43.1 27.7 8.7 0.0 8.7 1.3 435 100 20.5 31.1 29.7 18.0 0.7 18.7 1.9 10 1
Anthony Carnevale ES 292 92 25.0 40.7 20.9 13.1 0.4 13.4 2.1 220 100 18.2 28.2 25.0 26.4 2.3 28.6 3.0 15 8
Asa Messer ES 211 98 22.8 35.4 26.7 14.1 1.0 15.0 2.5 208 100 18.8 27.4 26.9 26.0 1.0 26.9 3.1 12 2
Carl G. Lauro ES 415 99 39.3 37.1 18.5 5.1 0.0 5.1 1.1 409 100 32.4 36.9 21.9 8.4 0.5 8.8 1.4 4 1
C. Young/C. Woods ES 353 99 35.1 36.8 21.6 6.6 0.0 6.6 1.3 347 100 30.9 30.3 22.8 15.3 0.6 15.9 2.0 9 1
Frank D. Spaziano ES 323 98 25.8 35.8 29.2 8.5 0.6 9.1 1.6 357 100 26.6 33.1 28.0 12.3 0.0 12.3 1.7 3 2
George J. West ES 396 99 32.3 38.7 21.4 7.4 0.3 7.6 1.3 446 100 26.3 37.1 27.2 9.2 0.2 9.4 1.4 2 1
Harry Kizirian ES 299 98 24.2 35.8 28.7 10.2 1.0 11.3 1.8 297 100 22.6 31.8 30.1 14.9 0.7 15.5 2.1 4 2
Leviton Dual Language ES 134 98 19.1 32.1 33.6 14.5 0.8 15.3 3.1 140 99 17.3 25.2 28.1 25.2 4.3 29.5 3.9 14 2
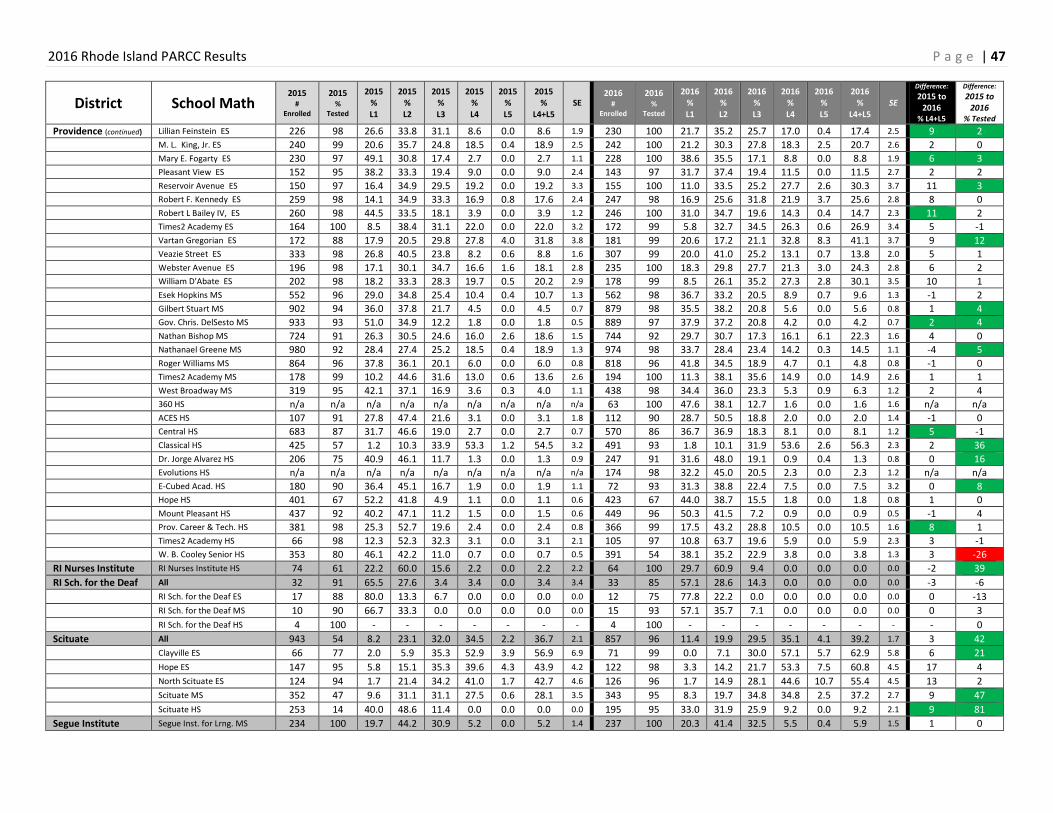
2016 Rhode Island PARCC Results P a g e | 47
District School Math 2015
# Enrolled
2015 %
Tested
2015 % L1
2015 % L2
2015 % L3
2015 % L4
2015 % L5
2015 %
L4+L5 SE
2016 #
Enrolled
2016 %
Tested
2016 % L1
2016 % L2
2016 % L3
2016 % L4
2016 % L5
2016 %
L4+L5 SE
Difference:
2015 to 2016
% L4+L5
Difference:
2015 to 2016
% Tested
Providence (continued) Lillian Feinstein ES 226 98 26.6 33.8 31.1 8.6 0.0 8.6 1.9 230 100 21.7 35.2 25.7 17.0 0.4 17.4 2.5 9 2
M. L. King, Jr. ES 240 99 20.6 35.7 24.8 18.5 0.4 18.9 2.5 242 100 21.2 30.3 27.8 18.3 2.5 20.7 2.6 2 0
Mary E. Fogarty ES 230 97 49.1 30.8 17.4 2.7 0.0 2.7 1.1 228 100 38.6 35.5 17.1 8.8 0.0 8.8 1.9 6 3
Pleasant View ES 152 95 38.2 33.3 19.4 9.0 0.0 9.0 2.4 143 97 31.7 37.4 19.4 11.5 0.0 11.5 2.7 2 2
Reservoir Avenue ES 150 97 16.4 34.9 29.5 19.2 0.0 19.2 3.3 155 100 11.0 33.5 25.2 27.7 2.6 30.3 3.7 11 3
Robert F. Kennedy ES 259 98 14.1 34.9 33.3 16.9 0.8 17.6 2.4 247 98 16.9 25.6 31.8 21.9 3.7 25.6 2.8 8 0
Robert L Bailey IV, ES 260 98 44.5 33.5 18.1 3.9 0.0 3.9 1.2 246 100 31.0 34.7 19.6 14.3 0.4 14.7 2.3 11 2
Times2 Academy ES 164 100 8.5 38.4 31.1 22.0 0.0 22.0 3.2 172 99 5.8 32.7 34.5 26.3 0.6 26.9 3.4 5 -1
Vartan Gregorian ES 172 88 17.9 20.5 29.8 27.8 4.0 31.8 3.8 181 99 20.6 17.2 21.1 32.8 8.3 41.1 3.7 9 12
Veazie Street ES 333 98 26.8 40.5 23.8 8.2 0.6 8.8 1.6 307 99 20.0 41.0 25.2 13.1 0.7 13.8 2.0 5 1
Webster Avenue ES 196 98 17.1 30.1 34.7 16.6 1.6 18.1 2.8 235 100 18.3 29.8 27.7 21.3 3.0 24.3 2.8 6 2
William D'Abate ES 202 98 18.2 33.3 28.3 19.7 0.5 20.2 2.9 178 99 8.5 26.1 35.2 27.3 2.8 30.1 3.5 10 1
Esek Hopkins MS 552 96 29.0 34.8 25.4 10.4 0.4 10.7 1.3 562 98 36.7 33.2 20.5 8.9 0.7 9.6 1.3 -1 2
Gilbert Stuart MS 902 94 36.0 37.8 21.7 4.5 0.0 4.5 0.7 879 98 35.5 38.2 20.8 5.6 0.0 5.6 0.8 1 4
Gov. Chris. DelSesto MS 933 93 51.0 34.9 12.2 1.8 0.0 1.8 0.5 889 97 37.9 37.2 20.8 4.2 0.0 4.2 0.7 2 4
Nathan Bishop MS 724 91 26.3 30.5 24.6 16.0 2.6 18.6 1.5 744 92 29.7 30.7 17.3 16.1 6.1 22.3 1.6 4 0
Nathanael Greene MS 980 92 28.4 27.4 25.2 18.5 0.4 18.9 1.3 974 98 33.7 28.4 23.4 14.2 0.3 14.5 1.1 -4 5
Roger Williams MS 864 96 37.8 36.1 20.1 6.0 0.0 6.0 0.8 818 96 41.8 34.5 18.9 4.7 0.1 4.8 0.8 -1 0
Times2 Academy MS 178 99 10.2 44.6 31.6 13.0 0.6 13.6 2.6 194 100 11.3 38.1 35.6 14.9 0.0 14.9 2.6 1 1
West Broadway MS 319 95 42.1 37.1 16.9 3.6 0.3 4.0 1.1 438 98 34.4 36.0 23.3 5.3 0.9 6.3 1.2 2 4
360 HS n/a n/a n/a n/a n/a n/a n/a n/a n/a 63 100 47.6 38.1 12.7 1.6 0.0 1.6 1.6 n/a n/a
ACES HS 107 91 27.8 47.4 21.6 3.1 0.0 3.1 1.8 112 90 28.7 50.5 18.8 2.0 0.0 2.0 1.4 -1 0
Central HS 683 87 31.7 46.6 19.0 2.7 0.0 2.7 0.7 570 86 36.7 36.9 18.3 8.1 0.0 8.1 1.2 5 -1
Classical HS 425 57 1.2 10.3 33.9 53.3 1.2 54.5 3.2 491 93 1.8 10.1 31.9 53.6 2.6 56.3 2.3 2 36
Dr. Jorge Alvarez HS 206 75 40.9 46.1 11.7 1.3 0.0 1.3 0.9 247 91 31.6 48.0 19.1 0.9 0.4 1.3 0.8 0 16
Evolutions HS n/a n/a n/a n/a n/a n/a n/a n/a n/a 174 98 32.2 45.0 20.5 2.3 0.0 2.3 1.2 n/a n/a
E-Cubed Acad. HS 180 90 36.4 45.1 16.7 1.9 0.0 1.9 1.1 72 93 31.3 38.8 22.4 7.5 0.0 7.5 3.2 0 8
Hope HS 401 67 52.2 41.8 4.9 1.1 0.0 1.1 0.6 423 67 44.0 38.7 15.5 1.8 0.0 1.8 0.8 1 0
Mount Pleasant HS 437 92 40.2 47.1 11.2 1.5 0.0 1.5 0.6 449 96 50.3 41.5 7.2 0.9 0.0 0.9 0.5 -1 4
Prov. Career & Tech. HS 381 98 25.3 52.7 19.6 2.4 0.0 2.4 0.8 366 99 17.5 43.2 28.8 10.5 0.0 10.5 1.6 8 1
Times2 Academy HS 66 98 12.3 52.3 32.3 3.1 0.0 3.1 2.1 105 97 10.8 63.7 19.6 5.9 0.0 5.9 2.3 3 -1
W. B. Cooley Senior HS 353 80 46.1 42.2 11.0 0.7 0.0 0.7 0.5 391 54 38.1 35.2 22.9 3.8 0.0 3.8 1.3 3 -26
RI Nurses Institute RI Nurses Institute HS 74 61 22.2 60.0 15.6 2.2 0.0 2.2 2.2 64 100 29.7 60.9 9.4 0.0 0.0 0.0 0.0 -2 39
RI Sch. for the Deaf All 32 91 65.5 27.6 3.4 3.4 0.0 3.4 3.4 33 85 57.1 28.6 14.3 0.0 0.0 0.0 0.0 -3 -6
RI Sch. for the Deaf ES 17 88 80.0 13.3 6.7 0.0 0.0 0.0 0.0 12 75 77.8 22.2 0.0 0.0 0.0 0.0 0.0 0 -13
RI Sch. for the Deaf MS 10 90 66.7 33.3 0.0 0.0 0.0 0.0 0.0 15 93 57.1 35.7 7.1 0.0 0.0 0.0 0.0 0 3
RI Sch. for the Deaf HS 4 100 - - - - - - - 4 100 - - - - - - - - 0
Scituate All 943 54 8.2 23.1 32.0 34.5 2.2 36.7 2.1 857 96 11.4 19.9 29.5 35.1 4.1 39.2 1.7 3 42
Clayville ES 66 77 2.0 5.9 35.3 52.9 3.9 56.9 6.9 71 99 0.0 7.1 30.0 57.1 5.7 62.9 5.8 6 21
Hope ES 147 95 5.8 15.1 35.3 39.6 4.3 43.9 4.2 122 98 3.3 14.2 21.7 53.3 7.5 60.8 4.5 17 4
North Scituate ES 124 94 1.7 21.4 34.2 41.0 1.7 42.7 4.6 126 96 1.7 14.9 28.1 44.6 10.7 55.4 4.5 13 2
Scituate MS 352 47 9.6 31.1 31.1 27.5 0.6 28.1 3.5 343 95 8.3 19.7 34.8 34.8 2.5 37.2 2.7 9 47
Scituate HS 253 14 40.0 48.6 11.4 0.0 0.0 0.0 0.0 195 95 33.0 31.9 25.9 9.2 0.0 9.2 2.1 9 81
Segue Institute Segue Inst. for Lrng. MS 234 100 19.7 44.2 30.9 5.2 0.0 5.2 1.4 237 100 20.3 41.4 32.5 5.5 0.4 5.9 1.5 1 0
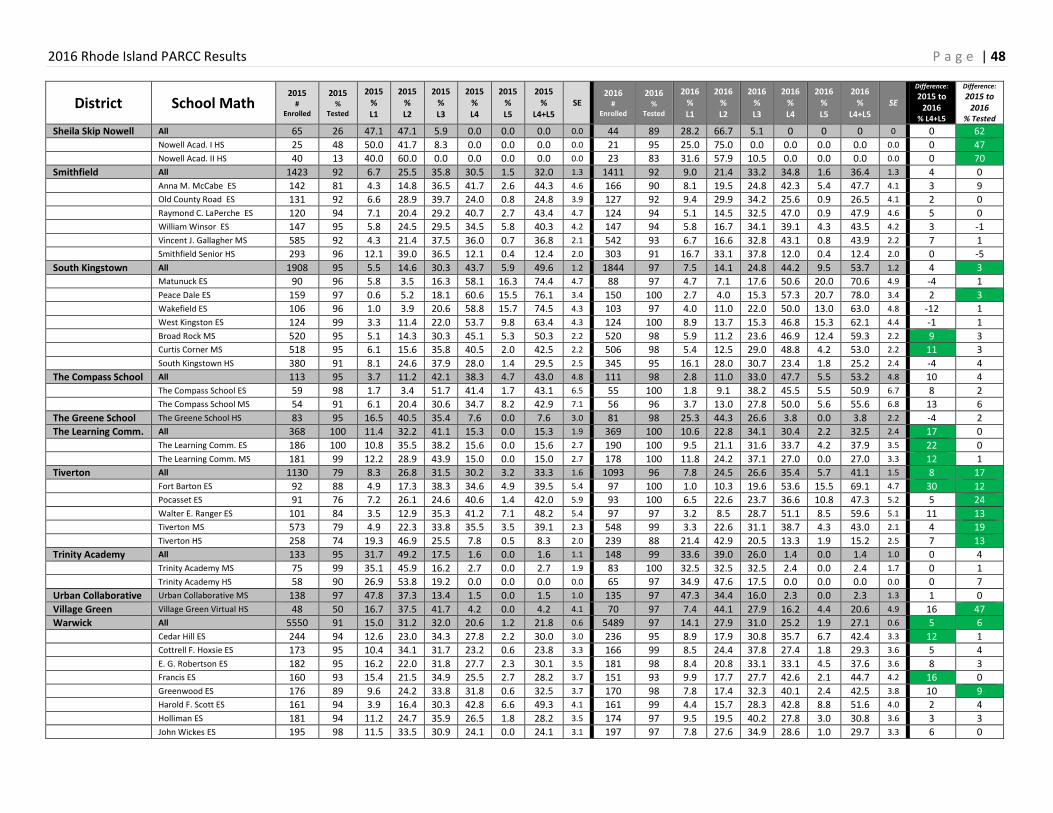
2016 Rhode Island PARCC Results P a g e | 48
District School Math 2015
# Enrolled
2015 %
Tested
2015 % L1
2015 % L2
2015 % L3
2015 % L4
2015 % L5
2015 %
L4+L5 SE
2016 #
Enrolled
2016 %
Tested
2016 % L1
2016 % L2
2016 % L3
2016 % L4
2016 % L5
2016 %
L4+L5 SE
Difference:
2015 to 2016
% L4+L5
Difference:
2015 to 2016
% Tested
Sheila Skip Nowell All 65 26 47.1 47.1 5.9 0.0 0.0 0.0 0.0 44 89 28.2 66.7 5.1 0 0 0 0 0 62
Nowell Acad. I HS 25 48 50.0 41.7 8.3 0.0 0.0 0.0 0.0 21 95 25.0 75.0 0.0 0.0 0.0 0.0 0.0 0 47
Nowell Acad. II HS 40 13 40.0 60.0 0.0 0.0 0.0 0.0 0.0 23 83 31.6 57.9 10.5 0.0 0.0 0.0 0.0 0 70
Smithfield All 1423 92 6.7 25.5 35.8 30.5 1.5 32.0 1.3 1411 92 9.0 21.4 33.2 34.8 1.6 36.4 1.3 4 0
Anna M. McCabe ES 142 81 4.3 14.8 36.5 41.7 2.6 44.3 4.6 166 90 8.1 19.5 24.8 42.3 5.4 47.7 4.1 3 9
Old County Road ES 131 92 6.6 28.9 39.7 24.0 0.8 24.8 3.9 127 92 9.4 29.9 34.2 25.6 0.9 26.5 4.1 2 0
Raymond C. LaPerche ES 120 94 7.1 20.4 29.2 40.7 2.7 43.4 4.7 124 94 5.1 14.5 32.5 47.0 0.9 47.9 4.6 5 0
William Winsor ES 147 95 5.8 24.5 29.5 34.5 5.8 40.3 4.2 147 94 5.8 16.7 34.1 39.1 4.3 43.5 4.2 3 -1
Vincent J. Gallagher MS 585 92 4.3 21.4 37.5 36.0 0.7 36.8 2.1 542 93 6.7 16.6 32.8 43.1 0.8 43.9 2.2 7 1
Smithfield Senior HS 293 96 12.1 39.0 36.5 12.1 0.4 12.4 2.0 303 91 16.7 33.1 37.8 12.0 0.4 12.4 2.0 0 -5
South Kingstown All 1908 95 5.5 14.6 30.3 43.7 5.9 49.6 1.2 1844 97 7.5 14.1 24.8 44.2 9.5 53.7 1.2 4 3
Matunuck ES 90 96 5.8 3.5 16.3 58.1 16.3 74.4 4.7 88 97 4.7 7.1 17.6 50.6 20.0 70.6 4.9 -4 1
Peace Dale ES 159 97 0.6 5.2 18.1 60.6 15.5 76.1 3.4 150 100 2.7 4.0 15.3 57.3 20.7 78.0 3.4 2 3
Wakefield ES 106 96 1.0 3.9 20.6 58.8 15.7 74.5 4.3 103 97 4.0 11.0 22.0 50.0 13.0 63.0 4.8 -12 1
West Kingston ES 124 99 3.3 11.4 22.0 53.7 9.8 63.4 4.3 124 100 8.9 13.7 15.3 46.8 15.3 62.1 4.4 -1 1
Broad Rock MS 520 95 5.1 14.3 30.3 45.1 5.3 50.3 2.2 520 98 5.9 11.2 23.6 46.9 12.4 59.3 2.2 9 3
Curtis Corner MS 518 95 6.1 15.6 35.8 40.5 2.0 42.5 2.2 506 98 5.4 12.5 29.0 48.8 4.2 53.0 2.2 11 3
South Kingstown HS 380 91 8.1 24.6 37.9 28.0 1.4 29.5 2.5 345 95 16.1 28.0 30.7 23.4 1.8 25.2 2.4 -4 4
The Compass School All 113 95 3.7 11.2 42.1 38.3 4.7 43.0 4.8 111 98 2.8 11.0 33.0 47.7 5.5 53.2 4.8 10 4
The Compass School ES 59 98 1.7 3.4 51.7 41.4 1.7 43.1 6.5 55 100 1.8 9.1 38.2 45.5 5.5 50.9 6.7 8 2
The Compass School MS 54 91 6.1 20.4 30.6 34.7 8.2 42.9 7.1 56 96 3.7 13.0 27.8 50.0 5.6 55.6 6.8 13 6
The Greene School The Greene School HS 83 95 16.5 40.5 35.4 7.6 0.0 7.6 3.0 81 98 25.3 44.3 26.6 3.8 0.0 3.8 2.2 -4 2
The Learning Comm. All 368 100 11.4 32.2 41.1 15.3 0.0 15.3 1.9 369 100 10.6 22.8 34.1 30.4 2.2 32.5 2.4 17 0
The Learning Comm. ES 186 100 10.8 35.5 38.2 15.6 0.0 15.6 2.7 190 100 9.5 21.1 31.6 33.7 4.2 37.9 3.5 22 0
The Learning Comm. MS 181 99 12.2 28.9 43.9 15.0 0.0 15.0 2.7 178 100 11.8 24.2 37.1 27.0 0.0 27.0 3.3 12 1
Tiverton All 1130 79 8.3 26.8 31.5 30.2 3.2 33.3 1.6 1093 96 7.8 24.5 26.6 35.4 5.7 41.1 1.5 8 17
Fort Barton ES 92 88 4.9 17.3 38.3 34.6 4.9 39.5 5.4 97 100 1.0 10.3 19.6 53.6 15.5 69.1 4.7 30 12
Pocasset ES 91 76 7.2 26.1 24.6 40.6 1.4 42.0 5.9 93 100 6.5 22.6 23.7 36.6 10.8 47.3 5.2 5 24
Walter E. Ranger ES 101 84 3.5 12.9 35.3 41.2 7.1 48.2 5.4 97 97 3.2 8.5 28.7 51.1 8.5 59.6 5.1 11 13
Tiverton MS 573 79 4.9 22.3 33.8 35.5 3.5 39.1 2.3 548 99 3.3 22.6 31.1 38.7 4.3 43.0 2.1 4 19
Tiverton HS 258 74 19.3 46.9 25.5 7.8 0.5 8.3 2.0 239 88 21.4 42.9 20.5 13.3 1.9 15.2 2.5 7 13
Trinity Academy All 133 95 31.7 49.2 17.5 1.6 0.0 1.6 1.1 148 99 33.6 39.0 26.0 1.4 0.0 1.4 1.0 0 4
Trinity Academy MS 75 99 35.1 45.9 16.2 2.7 0.0 2.7 1.9 83 100 32.5 32.5 32.5 2.4 0.0 2.4 1.7 0 1
Trinity Academy HS 58 90 26.9 53.8 19.2 0.0 0.0 0.0 0.0 65 97 34.9 47.6 17.5 0.0 0.0 0.0 0.0 0 7
Urban Collaborative Urban Collaborative MS 138 97 47.8 37.3 13.4 1.5 0.0 1.5 1.0 135 97 47.3 34.4 16.0 2.3 0.0 2.3 1.3 1 0
Village Green Village Green Virtual HS 48 50 16.7 37.5 41.7 4.2 0.0 4.2 4.1 70 97 7.4 44.1 27.9 16.2 4.4 20.6 4.9 16 47
Warwick All 5550 91 15.0 31.2 32.0 20.6 1.2 21.8 0.6 5489 97 14.1 27.9 31.0 25.2 1.9 27.1 0.6 5 6
Cedar Hill ES 244 94 12.6 23.0 34.3 27.8 2.2 30.0 3.0 236 95 8.9 17.9 30.8 35.7 6.7 42.4 3.3 12 1
Cottrell F. Hoxsie ES 173 95 10.4 34.1 31.7 23.2 0.6 23.8 3.3 166 99 8.5 24.4 37.8 27.4 1.8 29.3 3.6 5 4
E. G. Robertson ES 182 95 16.2 22.0 31.8 27.7 2.3 30.1 3.5 181 98 8.4 20.8 33.1 33.1 4.5 37.6 3.6 8 3
Francis ES 160 93 15.4 21.5 34.9 25.5 2.7 28.2 3.7 151 93 9.9 17.7 27.7 42.6 2.1 44.7 4.2 16 0
Greenwood ES 176 89 9.6 24.2 33.8 31.8 0.6 32.5 3.7 170 98 7.8 17.4 32.3 40.1 2.4 42.5 3.8 10 9
Harold F. Scott ES 161 94 3.9 16.4 30.3 42.8 6.6 49.3 4.1 161 99 4.4 15.7 28.3 42.8 8.8 51.6 4.0 2 4
Holliman ES 181 94 11.2 24.7 35.9 26.5 1.8 28.2 3.5 174 97 9.5 19.5 40.2 27.8 3.0 30.8 3.6 3 3
John Wickes ES 195 98 11.5 33.5 30.9 24.1 0.0 24.1 3.1 197 97 7.8 27.6 34.9 28.6 1.0 29.7 3.3 6 0
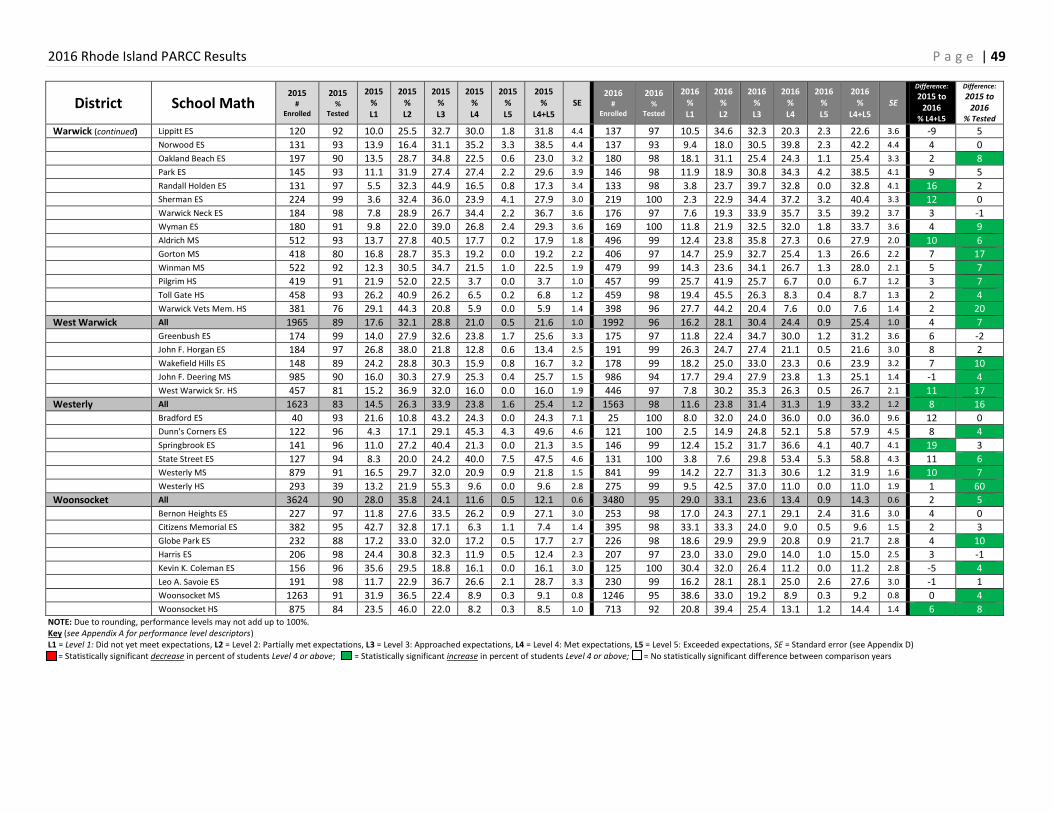
2016 Rhode Island PARCC Results P a g e | 49
District School Math 2015
# Enrolled
2015 %
Tested
2015 % L1
2015 % L2
2015 % L3
2015 % L4
2015 % L5
2015 %
L4+L5 SE
2016 #
Enrolled
2016 %
Tested
2016 % L1
2016 % L2
2016 % L3
2016 % L4
2016 % L5
2016 %
L4+L5 SE
Difference:
2015 to 2016
% L4+L5
Difference:
2015 to 2016
% Tested
Warwick (continued) Lippitt ES 120 92 10.0 25.5 32.7 30.0 1.8 31.8 4.4 137 97 10.5 34.6 32.3 20.3 2.3 22.6 3.6 -9 5
Norwood ES 131 93 13.9 16.4 31.1 35.2 3.3 38.5 4.4 137 93 9.4 18.0 30.5 39.8 2.3 42.2 4.4 4 0
Oakland Beach ES 197 90 13.5 28.7 34.8 22.5 0.6 23.0 3.2 180 98 18.1 31.1 25.4 24.3 1.1 25.4 3.3 2 8
Park ES 145 93 11.1 31.9 27.4 27.4 2.2 29.6 3.9 146 98 11.9 18.9 30.8 34.3 4.2 38.5 4.1 9 5
Randall Holden ES 131 97 5.5 32.3 44.9 16.5 0.8 17.3 3.4 133 98 3.8 23.7 39.7 32.8 0.0 32.8 4.1 16 2
Sherman ES 224 99 3.6 32.4 36.0 23.9 4.1 27.9 3.0 219 100 2.3 22.9 34.4 37.2 3.2 40.4 3.3 12 0
Warwick Neck ES 184 98 7.8 28.9 26.7 34.4 2.2 36.7 3.6 176 97 7.6 19.3 33.9 35.7 3.5 39.2 3.7 3 -1
Wyman ES 180 91 9.8 22.0 39.0 26.8 2.4 29.3 3.6 169 100 11.8 21.9 32.5 32.0 1.8 33.7 3.6 4 9
Aldrich MS 512 93 13.7 27.8 40.5 17.7 0.2 17.9 1.8 496 99 12.4 23.8 35.8 27.3 0.6 27.9 2.0 10 6
Gorton MS 418 80 16.8 28.7 35.3 19.2 0.0 19.2 2.2 406 97 14.7 25.9 32.7 25.4 1.3 26.6 2.2 7 17
Winman MS 522 92 12.3 30.5 34.7 21.5 1.0 22.5 1.9 479 99 14.3 23.6 34.1 26.7 1.3 28.0 2.1 5 7
Pilgrim HS 419 91 21.9 52.0 22.5 3.7 0.0 3.7 1.0 457 99 25.7 41.9 25.7 6.7 0.0 6.7 1.2 3 7
Toll Gate HS 458 93 26.2 40.9 26.2 6.5 0.2 6.8 1.2 459 98 19.4 45.5 26.3 8.3 0.4 8.7 1.3 2 4
Warwick Vets Mem. HS 381 76 29.1 44.3 20.8 5.9 0.0 5.9 1.4 398 96 27.7 44.2 20.4 7.6 0.0 7.6 1.4 2 20
West Warwick All 1965 89 17.6 32.1 28.8 21.0 0.5 21.6 1.0 1992 96 16.2 28.1 30.4 24.4 0.9 25.4 1.0 4 7
Greenbush ES 174 99 14.0 27.9 32.6 23.8 1.7 25.6 3.3 175 97 11.8 22.4 34.7 30.0 1.2 31.2 3.6 6 -2
John F. Horgan ES 184 97 26.8 38.0 21.8 12.8 0.6 13.4 2.5 191 99 26.3 24.7 27.4 21.1 0.5 21.6 3.0 8 2
Wakefield Hills ES 148 89 24.2 28.8 30.3 15.9 0.8 16.7 3.2 178 99 18.2 25.0 33.0 23.3 0.6 23.9 3.2 7 10
John F. Deering MS 985 90 16.0 30.3 27.9 25.3 0.4 25.7 1.5 986 94 17.7 29.4 27.9 23.8 1.3 25.1 1.4 -1 4
West Warwick Sr. HS 457 81 15.2 36.9 32.0 16.0 0.0 16.0 1.9 446 97 7.8 30.2 35.3 26.3 0.5 26.7 2.1 11 17
Westerly All 1623 83 14.5 26.3 33.9 23.8 1.6 25.4 1.2 1563 98 11.6 23.8 31.4 31.3 1.9 33.2 1.2 8 16
Bradford ES 40 93 21.6 10.8 43.2 24.3 0.0 24.3 7.1 25 100 8.0 32.0 24.0 36.0 0.0 36.0 9.6 12 0
Dunn's Corners ES 122 96 4.3 17.1 29.1 45.3 4.3 49.6 4.6 121 100 2.5 14.9 24.8 52.1 5.8 57.9 4.5 8 4
Springbrook ES 141 96 11.0 27.2 40.4 21.3 0.0 21.3 3.5 146 99 12.4 15.2 31.7 36.6 4.1 40.7 4.1 19 3
State Street ES 127 94 8.3 20.0 24.2 40.0 7.5 47.5 4.6 131 100 3.8 7.6 29.8 53.4 5.3 58.8 4.3 11 6
Westerly MS 879 91 16.5 29.7 32.0 20.9 0.9 21.8 1.5 841 99 14.2 22.7 31.3 30.6 1.2 31.9 1.6 10 7
Westerly HS 293 39 13.2 21.9 55.3 9.6 0.0 9.6 2.8 275 99 9.5 42.5 37.0 11.0 0.0 11.0 1.9 1 60
Woonsocket All 3624 90 28.0 35.8 24.1 11.6 0.5 12.1 0.6 3480 95 29.0 33.1 23.6 13.4 0.9 14.3 0.6 2 5
Bernon Heights ES 227 97 11.8 27.6 33.5 26.2 0.9 27.1 3.0 253 98 17.0 24.3 27.1 29.1 2.4 31.6 3.0 4 0
Citizens Memorial ES 382 95 42.7 32.8 17.1 6.3 1.1 7.4 1.4 395 98 33.1 33.3 24.0 9.0 0.5 9.6 1.5 2 3
Globe Park ES 232 88 17.2 33.0 32.0 17.2 0.5 17.7 2.7 226 98 18.6 29.9 29.9 20.8 0.9 21.7 2.8 4 10
Harris ES 206 98 24.4 30.8 32.3 11.9 0.5 12.4 2.3 207 97 23.0 33.0 29.0 14.0 1.0 15.0 2.5 3 -1
Kevin K. Coleman ES 156 96 35.6 29.5 18.8 16.1 0.0 16.1 3.0 125 100 30.4 32.0 26.4 11.2 0.0 11.2 2.8 -5 4
Leo A. Savoie ES 191 98 11.7 22.9 36.7 26.6 2.1 28.7 3.3 230 99 16.2 28.1 28.1 25.0 2.6 27.6 3.0 -1 1
Woonsocket MS 1263 91 31.9 36.5 22.4 8.9 0.3 9.1 0.8 1246 95 38.6 33.0 19.2 8.9 0.3 9.2 0.8 0 4
Woonsocket HS 875 84 23.5 46.0 22.0 8.2 0.3 8.5 1.0 713 92 20.8 39.4 25.4 13.1 1.2 14.4 1.4 6 8 NOTE: Due to rounding, performance levels may not add up to 100%. Key (see Appendix A for performance level descriptors) L1 = Level 1: Did not yet meet expectations, L2 = Level 2: Partially met expectations, L3 = Level 3: Approached expectations, L4 = Level 4: Met expectations, L5 = Level 5: Exceeded expectations, SE = Standard error (see Appendix D) = Statistically significant decrease in percent of students Level 4 or above; = Statistically significant increase in percent of students Level 4 or above; = No statistically significant difference between comparison years
P a g e | 50
APPENDICES
Page
Appendix A: Glossary of Terms 51
Appendix B: Performance Level Descriptors 53
Appendix C: Split-Level Schools
55
Appendix D: Calculating Standard Error (SE) to Determine Statistical Significance of Differences 56
Appendix E: 2016 PARCC English Language Arts/Literacy Testing Mode by District and School 57
Appendix F: 2016 PARCC Mathematics Testing Mode by District and School 65
Appendix G: 2016 PARCC State-Level Results by Content, Testing Mode, and Grade/Test 74
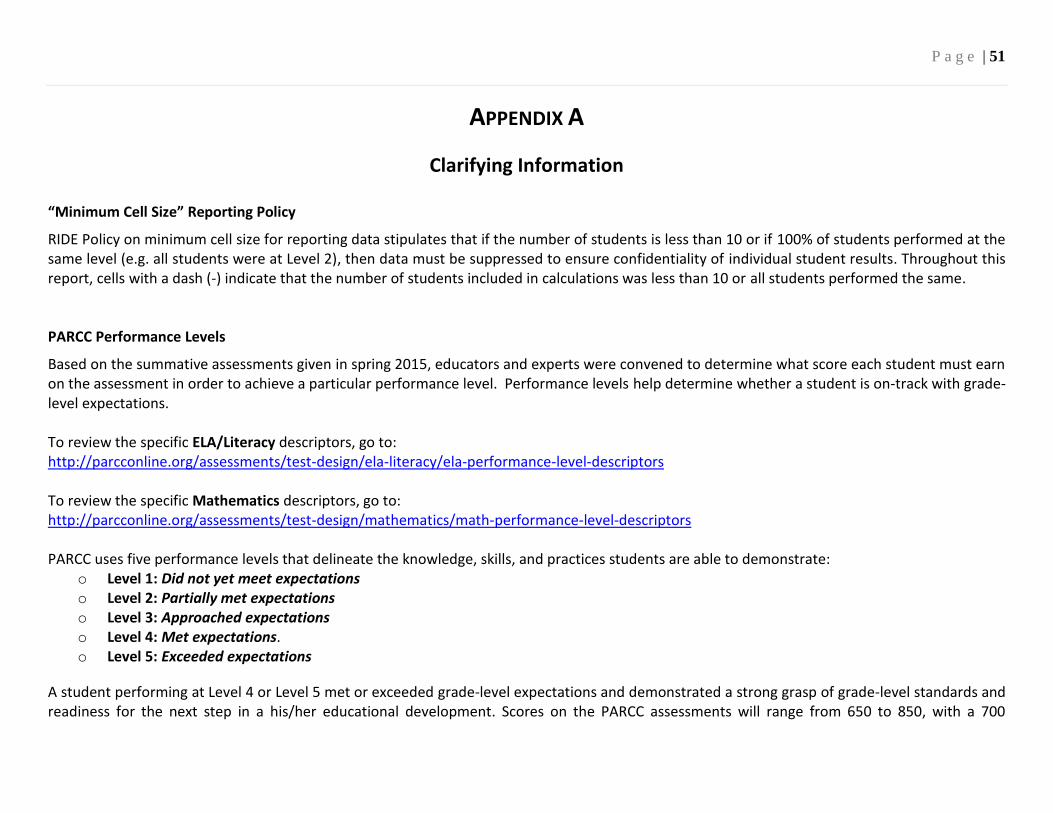
P a g e | 51
APPENDIX A
Clarifying Information
“Minimum Cell Size” Reporting Policy
RIDE Policy on minimum cell size for reporting data stipulates that if the number of students is less than 10 or if 100% of students performed at the same level (e.g. all students were at Level 2), then data must be suppressed to ensure confidentiality of individual student results. Throughout this report, cells with a dash (-) indicate that the number of students included in calculations was less than 10 or all students performed the same. PARCC Performance Levels
Based on the summative assessments given in spring 2015, educators and experts were convened to determine what score each student must earn on the assessment in order to achieve a particular performance level. Performance levels help determine whether a student is on-track with grade-level expectations. To review the specific ELA/Literacy descriptors, go to: http://parcconline.org/assessments/test-design/ela-literacy/ela-performance-level-descriptors To review the specific Mathematics descriptors, go to: http://parcconline.org/assessments/test-design/mathematics/math-performance-level-descriptors PARCC uses five performance levels that delineate the knowledge, skills, and practices students are able to demonstrate:
o Level 1: Did not yet meet expectations o Level 2: Partially met expectations o Level 3: Approached expectations o Level 4: Met expectations. o Level 5: Exceeded expectations
A student performing at Level 4 or Level 5 met or exceeded grade-level expectations and demonstrated a strong grasp of grade-level standards and readiness for the next step in a his/her educational development. Scores on the PARCC assessments will range from 650 to 850, with a 700
P a g e | 52
representing the threshold of Level 2, 725 representing the threshold of Level 3, and 750 representing the threshold of Level 4. The threshold score for Level 5 will vary slightly by assessment and will be approximately 800. A variety of stakeholders, nominated by the states, participated in panels to review the assessments. To determine what range of scores best matches each performance level, panelists used performance level Descriptors for English language arts/literacy and mathematics that indicate what a typical student at each level should know based on his/her command of grade-level standards. They used the performance level descriptors and actual assessment results and compared them to empirical studies to make their judgments. Each group went through at least three rounds of review per assessment to develop the "threshold scores," also known as "cut scores," for each performance level. Two research studies helped determine the percentage of students likely to be college-and career-ready and the percentage of students likely to be on track for the next academic level at earlier grades: a postsecondary faculty judgment study; and a benchmark study of the SAT, ACT, NAEP, TIMSS, and PISA assessments. State education chiefs from PARCC member states met back in late August/early September to adopt common, performance-level threshold scores based on these recommendations. Download additional information about the PARCC Performance levels: Setting Performance Levels for the PARCC Assessment
P a g e | 53
APPENDIX B
PARCC Performance Level Descriptors (PLDs)
PARCC Performance Level Descriptors
Performance level descriptors (PLDs) outline the knowledge, skills, and practices that students performing at any given level should be able to demonstrate in each content area at each grade level to signal that they are academically prepared to engage successfully in further studies in each content area, the next grade's material and, later, at the high school-level for students to demonstrate that they are college and career ready. English Language Arts/Literacy (ELA/Literacy) PLDs: Grades 3-10
Performance-level descriptors (PLDs) describe what student performance looks like at four levels: partial command of the content; moderate command; strong command; and distinguished command. In English language arts/literacy, the performance levels at each grade level are written for the two assessment claims of reading and writing. Reading Claim
For the reading claim, the performance levels at each grade level are differentiated by three factors:
1. Text complexity
2. The range of accuracy in expressing reading comprehension demonstrated in student responses; and
3. The quality of evidence cited from sources read
This is an innovative departure from how ELA/literacy performance level descriptors have been written in the past, but reflective of the Common Core's emphasis on a student's ability to find text-based evidence for generalizations, conclusions, or inferences drawn. Writing Claim
For the writing claim, PLDs are written for the two sub-claims:
1. Written expression
2. Knowledge of language and conventions.
P a g e | 54
Factors differentiating the performance levels for writing include how consistently and fully students develop ideas, including when drawing evidence from one or more sources, how well they organize their writing, and their command of grammar and language usage. Below are links to each grade level descriptor:
PARCC Grade 3 Performance Level Descriptors
PARCC Grade 4 Performance Level Descriptors
PARCC Grade 5 Performance Level Descriptors
PARCC Grade 6 Performance Level Descriptors
PARCC Grade 7 Performance Level Descriptors
PARCC Grade 8 Performance Level Descriptors
PARCC Grade 9 Performance Level Descriptors
PARCC Grade 10 Performance Level Descriptors
Mathematics PLDs: Grades 3-10
Performance-level descriptors (PLDs) describe what student performance looks like at four levels: partial command of the content; adequate command; strong command; and distinguished command.
In mathematics, the performance levels at each grade level are written for each of four assessment sub-claims:
1. Major content
2. Additional and supporting content
3. Reasoning
4. Modeling
The performance levels within each claim area are differentiated by a number of factors consistent with the Common Core’s inclusion of standards for both mathematical content and mathematical practices.
Performance-Level Descriptors by Grade Band:
PARCC Mathematics Performance Level Descriptors: Grades 3-5
PARCC Mathematics Performance Level Descriptors: Grades 6-8
PARCC Mathematics Performance Level Descriptors: High School
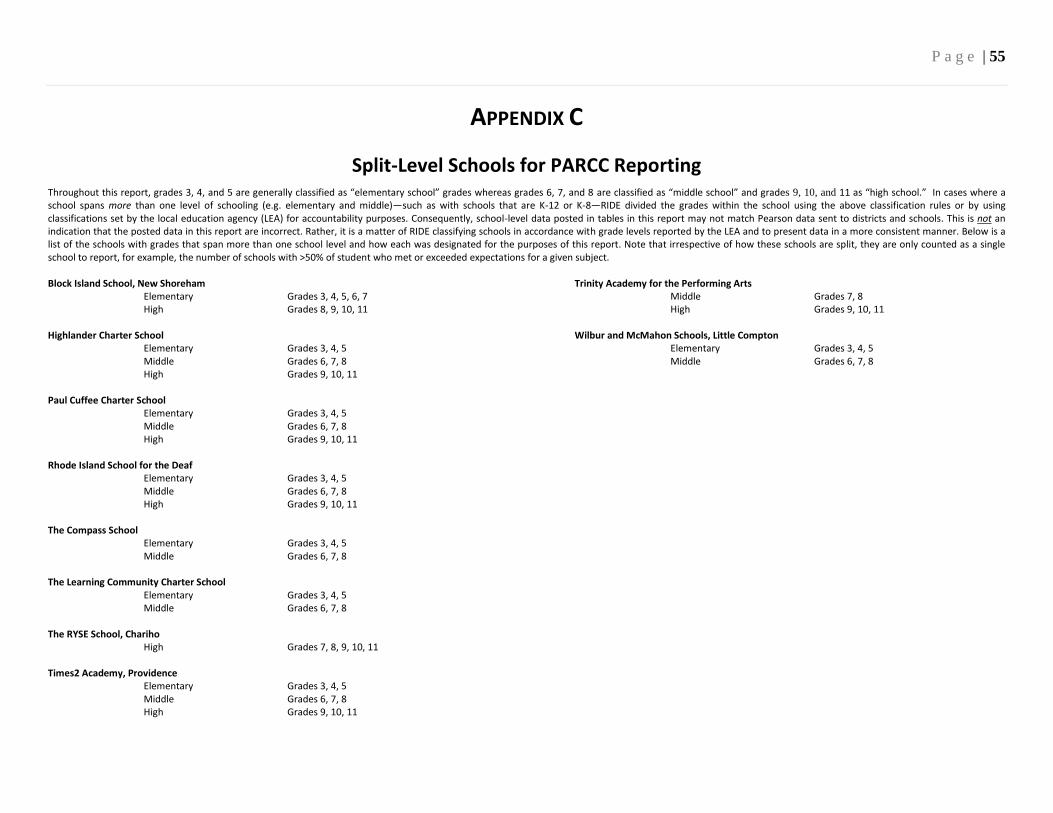
P a g e | 55
APPENDIX C
Split-Level Schools for PARCC Reporting Throughout this report, grades 3, 4, and 5 are generally classified as “elementary school” grades whereas grades 6, 7, and 8 are classified as “middle school” and grades 9, 10, and 11 as “high school.” In cases where a school spans more than one level of schooling (e.g. elementary and middle)—such as with schools that are K-12 or K-8—RIDE divided the grades within the school using the above classification rules or by using classifications set by the local education agency (LEA) for accountability purposes. Consequently, school-level data posted in tables in this report may not match Pearson data sent to districts and schools. This is not an indication that the posted data in this report are incorrect. Rather, it is a matter of RIDE classifying schools in accordance with grade levels reported by the LEA and to present data in a more consistent manner. Below is a list of the schools with grades that span more than one school level and how each was designated for the purposes of this report. Note that irrespective of how these schools are split, they are only counted as a single school to report, for example, the number of schools with >50% of student who met or exceeded expectations for a given subject. Block Island School, New Shoreham Trinity Academy for the Performing Arts Elementary Grades 3, 4, 5, 6, 7 Middle Grades 7, 8 High Grades 8, 9, 10, 11 High Grades 9, 10, 11 Highlander Charter School Wilbur and McMahon Schools, Little Compton Elementary Grades 3, 4, 5 Elementary Grades 3, 4, 5 Middle Grades 6, 7, 8 Middle Grades 6, 7, 8 High Grades 9, 10, 11 Paul Cuffee Charter School Elementary Grades 3, 4, 5 Middle Grades 6, 7, 8 High Grades 9, 10, 11 Rhode Island School for the Deaf Elementary Grades 3, 4, 5 Middle Grades 6, 7, 8 High Grades 9, 10, 11 The Compass School
Elementary Grades 3, 4, 5 Middle Grades 6, 7, 8 The Learning Community Charter School
Elementary Grades 3, 4, 5 Middle Grades 6, 7, 8 The RYSE School, Chariho High Grades 7, 8, 9, 10, 11 Times2 Academy, Providence Elementary Grades 3, 4, 5 Middle Grades 6, 7, 8 High Grades 9, 10, 11
P a g e | 56
APPENDIX D
Calculating Standard Error (SE) to Determine Statistical Significance of Differences For the purposes of this report, Standard Error (SE) is defined as a measurement of the standard error of a percentage (e.g., % Level 4 + Level 5, used throughout this report). Mathematically, SE’s were calculated as follows:
(SE) = √(𝑝𝑞
𝑁), where p is the percent of students who are Level 4 or above, q= (100-p) and N is the population or group size.
It is important to note that the derived SE is based on the size of the group being examined and its respective performance (read: % Level 4 or above) on the PARCC tests. Standard errors can be used to create a confidence interval around the derived percentage so that you can see the range in which the “true” (e.g., measured without error) value is located. To do so, you can take the SE and multiply it by 1.96 (for a 95% confidence interval). The resultant product is then added and subtracted from the percent Level 4 or above, p, for example, to create a range of values in which you can be 95% confident that the “true” value is located. For example, viewing the percent Level 4 or above (p) as the center point, if one adds the value of SE(1.96) to p and also subtracts this value from p, then the full confidence interval is created with both an upper and lower boundary. So, if p equals 70% and the SE equals .5, then the product of SE and 1.96 equals .5(1.96) or .965 Adding and subtracting this number from 70% creates the confidence interval, which ranges from 69.04% to 70.97%. This is the range in which one can be 95% confident that the “true” value exists. When comparing the performance of any two years or groups, we say that the difference in performance between the groups is statistically significant if the difference in performance between the two groups is larger than the sum of the SE’s of the two groups. In other words, if the sum of the two SE’s—each multiplied by 1.96 to get the 95% confidence interval—is larger than the value of the difference in performance between the two groups, then we say the difference is too small to be significant or meaningful because the difference doesn’t fall outside of the range of plausible “true” values. To illustrate this point, let’s say that 60% of 4th grade students at School X were Level 4 or above in math in 2015 and the following year in 2016, 66% of 4th grade students were Level 4 or above, thus resulting in an increase of +6 percentage points. If the sum of the 2015 SE(1.96) and the 2016 SE(1.96) is 6.5, then the change from 2015 to 2016 in 4th grade math performance of +6 percentage points at School X is not large enough to be considered statistically significant. On the other hand, if 67% of 4th graders in 2015 were Level 4 or above, then the +7 percentage point increase in performance would be larger than the standard error of 6.5 and this difference would be statistically significant.
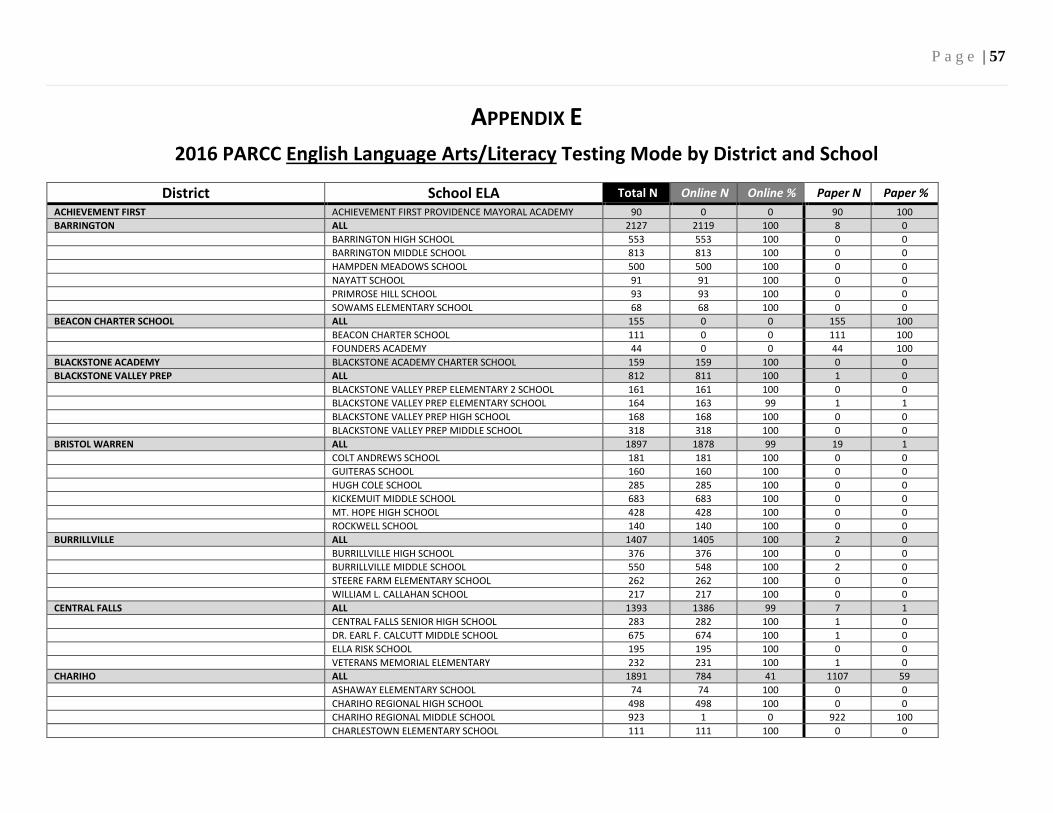
P a g e | 57
APPENDIX E
2016 PARCC English Language Arts/Literacy Testing Mode by District and School
District School ELA Total N Online N Online % Paper N Paper %
ACHIEVEMENT FIRST ACHIEVEMENT FIRST PROVIDENCE MAYORAL ACADEMY 90 0 0 90 100
BARRINGTON ALL 2127 2119 100 8 0
BARRINGTON HIGH SCHOOL 553 553 100 0 0
BARRINGTON MIDDLE SCHOOL 813 813 100 0 0
HAMPDEN MEADOWS SCHOOL 500 500 100 0 0
NAYATT SCHOOL 91 91 100 0 0
PRIMROSE HILL SCHOOL 93 93 100 0 0
SOWAMS ELEMENTARY SCHOOL 68 68 100 0 0
BEACON CHARTER SCHOOL ALL 155 0 0 155 100
BEACON CHARTER SCHOOL 111 0 0 111 100
FOUNDERS ACADEMY 44 0 0 44 100
BLACKSTONE ACADEMY BLACKSTONE ACADEMY CHARTER SCHOOL 159 159 100 0 0
BLACKSTONE VALLEY PREP ALL 812 811 100 1 0
BLACKSTONE VALLEY PREP ELEMENTARY 2 SCHOOL 161 161 100 0 0
BLACKSTONE VALLEY PREP ELEMENTARY SCHOOL 164 163 99 1 1
BLACKSTONE VALLEY PREP HIGH SCHOOL 168 168 100 0 0
BLACKSTONE VALLEY PREP MIDDLE SCHOOL 318 318 100 0 0
BRISTOL WARREN ALL 1897 1878 99 19 1
COLT ANDREWS SCHOOL 181 181 100 0 0
GUITERAS SCHOOL 160 160 100 0 0
HUGH COLE SCHOOL 285 285 100 0 0
KICKEMUIT MIDDLE SCHOOL 683 683 100 0 0
MT. HOPE HIGH SCHOOL 428 428 100 0 0
ROCKWELL SCHOOL 140 140 100 0 0
BURRILLVILLE ALL 1407 1405 100 2 0
BURRILLVILLE HIGH SCHOOL 376 376 100 0 0
BURRILLVILLE MIDDLE SCHOOL 550 548 100 2 0
STEERE FARM ELEMENTARY SCHOOL 262 262 100 0 0
WILLIAM L. CALLAHAN SCHOOL 217 217 100 0 0
CENTRAL FALLS ALL 1393 1386 99 7 1
CENTRAL FALLS SENIOR HIGH SCHOOL 283 282 100 1 0
DR. EARL F. CALCUTT MIDDLE SCHOOL 675 674 100 1 0
ELLA RISK SCHOOL 195 195 100 0 0
VETERANS MEMORIAL ELEMENTARY 232 231 100 1 0
CHARIHO ALL 1891 784 41 1107 59
ASHAWAY ELEMENTARY SCHOOL 74 74 100 0 0
CHARIHO REGIONAL HIGH SCHOOL 498 498 100 0 0
CHARIHO REGIONAL MIDDLE SCHOOL 923 1 0 922 100
CHARLESTOWN ELEMENTARY SCHOOL 111 111 100 0 0

P a g e | 58
District School ELA Total N Online N Online % Paper N Paper %
Chariho (continued) HOPE VALLEY ELEMENTARY SCHOOL 70 70 100 0 0
RICHMOND ELEMENTARY SCHOOL 182 0 0 182 100
THE R.Y.S.E. SCHOOL 33 30 91 3 9
COVENTRY ALL 2931 2927 100 4 0
ALAN SHAWN FEINSTEIN MIDDLE SCHOOL OF COVENTRY 1111 1111 100 0 0
BLACKROCK SCHOOL 215 215 100 0 0
COVENTRY HIGH SCHOOL 736 734 100 2 0
HOPKINS HILL SCHOOL 194 194 100 0 0
TIOGUE SCHOOL 189 189 100 0 0
WASHINGTON OAK SCHOOL 275 275 100 0 0
WESTERN COVENTRY SCHOOL 203 203 100 0 0
CRANSTON ALL 6429 6414 100 15 0
ARLINGTON SCHOOL 177 177 100 0 0
CHESTER W. BARROWS SCHOOL 93 93 100 0 0
CRANSTON HIGH SCHOOL EAST 812 811 100 1 0
CRANSTON HIGH SCHOOL WEST 706 706 100 0 0
DANIEL D. WATERMAN SCHOOL 140 140 100 0 0
EDEN PARK SCHOOL 196 196 100 0 0
EDGEWOOD HIGHLAND SCHOOL 159 159 100 0 0
EDWARD S. RHODES SCHOOL 165 165 100 0 0
GARDEN CITY SCHOOL 191 191 100 0 0
GEORGE J. PETERS SCHOOL 215 215 100 0 0
GLADSTONE STREET SCHOOL 286 286 100 0 0
GLEN HILLS SCHOOL 193 193 100 0 0
HOPE HIGHLANDS ELEMENTARY SCHOOL 223 223 100 0 0
HUGH B. BAIN MIDDLE SCHOOL 470 469 100 1 0
NEL/CPS CONSTRUCTION CAREER ACADEMY 81 81 100 0 0
OAK LAWN SCHOOL 163 163 100 0 0
ORCHARD FARMS ELEMENTARY SCHOOL 185 185 100 0 0
PARK VIEW MIDDLE SCHOOL 517 515 100 2 0
STADIUM SCHOOL 207 207 100 0 0
STONE HILL SCHOOL 160 160 100 0 0
WESTERN HILLS MIDDLE SCHOOL 645 645 100 0 0
WILLIAM R. DUTEMPLE SCHOOL 194 194 100 0 0
WOODRIDGE SCHOOL 211 211 100 0 0
CUMBERLAND ALL 2713 2709 100 4 0
ASHTON SCHOOL 125 125 100 0 0
B.F. NORTON ELEMENTARY SCHOOL 228 228 100 0 0
COMMUNITY SCHOOL 313 313 100 0 0
CUMBERLAND HIGH SCHOOL 607 607 100 0 0
GARVIN MEMORIAL SCHOOL 196 196 100 0 0
JOHN J. MCLAUGHLIN CUMBERLAND HILL SCHOOL 167 167 100 0 0
JOSEPH L. MCCOURT MIDDLE SCHOOL 415 415 100 0 0
NORTH CUMBERLAND MIDDLE SCHOOL 658 658 100 0 0
DAVIES CAREER & TECH. WM. M. DAVIES JR. CAREER-TECHNICAL HIGH SCHOOL 437 437 100 0 0
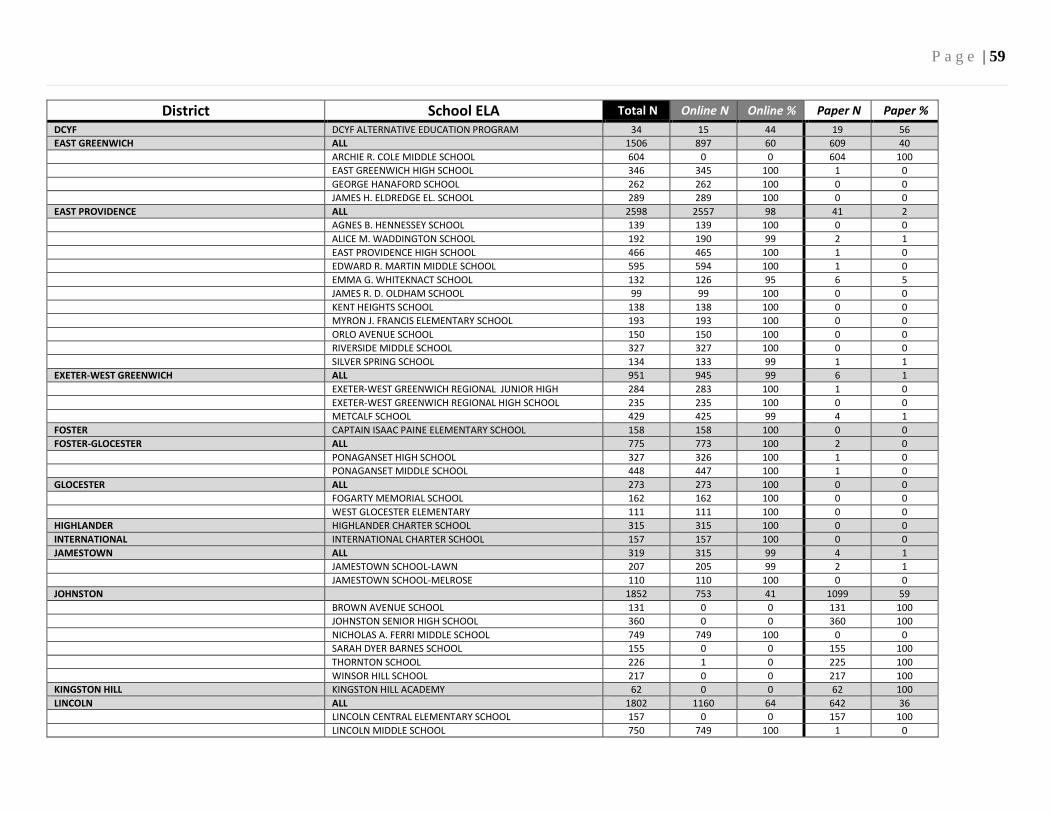
P a g e | 59
District School ELA Total N Online N Online % Paper N Paper %
DCYF DCYF ALTERNATIVE EDUCATION PROGRAM 34 15 44 19 56
EAST GREENWICH ALL 1506 897 60 609 40
ARCHIE R. COLE MIDDLE SCHOOL 604 0 0 604 100
EAST GREENWICH HIGH SCHOOL 346 345 100 1 0
GEORGE HANAFORD SCHOOL 262 262 100 0 0
JAMES H. ELDREDGE EL. SCHOOL 289 289 100 0 0
EAST PROVIDENCE ALL 2598 2557 98 41 2
AGNES B. HENNESSEY SCHOOL 139 139 100 0 0
ALICE M. WADDINGTON SCHOOL 192 190 99 2 1
EAST PROVIDENCE HIGH SCHOOL 466 465 100 1 0
EDWARD R. MARTIN MIDDLE SCHOOL 595 594 100 1 0
EMMA G. WHITEKNACT SCHOOL 132 126 95 6 5
JAMES R. D. OLDHAM SCHOOL 99 99 100 0 0
KENT HEIGHTS SCHOOL 138 138 100 0 0
MYRON J. FRANCIS ELEMENTARY SCHOOL 193 193 100 0 0
ORLO AVENUE SCHOOL 150 150 100 0 0
RIVERSIDE MIDDLE SCHOOL 327 327 100 0 0
SILVER SPRING SCHOOL 134 133 99 1 1
EXETER-WEST GREENWICH ALL 951 945 99 6 1
EXETER-WEST GREENWICH REGIONAL JUNIOR HIGH 284 283 100 1 0
EXETER-WEST GREENWICH REGIONAL HIGH SCHOOL 235 235 100 0 0
METCALF SCHOOL 429 425 99 4 1
FOSTER CAPTAIN ISAAC PAINE ELEMENTARY SCHOOL 158 158 100 0 0
FOSTER-GLOCESTER ALL 775 773 100 2 0
PONAGANSET HIGH SCHOOL 327 326 100 1 0
PONAGANSET MIDDLE SCHOOL 448 447 100 1 0
GLOCESTER ALL 273 273 100 0 0
FOGARTY MEMORIAL SCHOOL 162 162 100 0 0
WEST GLOCESTER ELEMENTARY 111 111 100 0 0
HIGHLANDER HIGHLANDER CHARTER SCHOOL 315 315 100 0 0
INTERNATIONAL INTERNATIONAL CHARTER SCHOOL 157 157 100 0 0
JAMESTOWN ALL 319 315 99 4 1
JAMESTOWN SCHOOL-LAWN 207 205 99 2 1
JAMESTOWN SCHOOL-MELROSE 110 110 100 0 0
JOHNSTON 1852 753 41 1099 59
BROWN AVENUE SCHOOL 131 0 0 131 100
JOHNSTON SENIOR HIGH SCHOOL 360 0 0 360 100
NICHOLAS A. FERRI MIDDLE SCHOOL 749 749 100 0 0
SARAH DYER BARNES SCHOOL 155 0 0 155 100
THORNTON SCHOOL 226 1 0 225 100
WINSOR HILL SCHOOL 217 0 0 217 100
KINGSTON HILL KINGSTON HILL ACADEMY 62 0 0 62 100
LINCOLN ALL 1802 1160 64 642 36
LINCOLN CENTRAL ELEMENTARY SCHOOL 157 0 0 157 100
LINCOLN MIDDLE SCHOOL 750 749 100 1 0
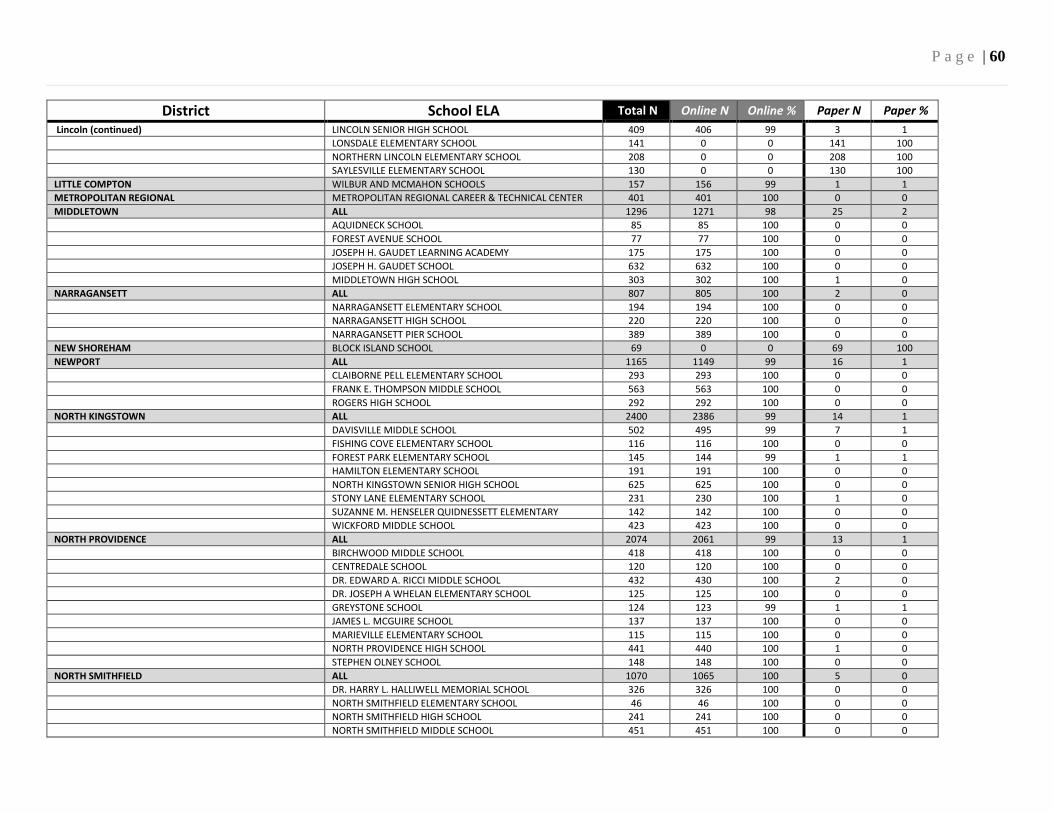
P a g e | 60
District School ELA Total N Online N Online % Paper N Paper %
Lincoln (continued) LINCOLN SENIOR HIGH SCHOOL 409 406 99 3 1
LONSDALE ELEMENTARY SCHOOL 141 0 0 141 100
NORTHERN LINCOLN ELEMENTARY SCHOOL 208 0 0 208 100
SAYLESVILLE ELEMENTARY SCHOOL 130 0 0 130 100
LITTLE COMPTON WILBUR AND MCMAHON SCHOOLS 157 156 99 1 1
METROPOLITAN REGIONAL METROPOLITAN REGIONAL CAREER & TECHNICAL CENTER 401 401 100 0 0
MIDDLETOWN ALL 1296 1271 98 25 2
AQUIDNECK SCHOOL 85 85 100 0 0
FOREST AVENUE SCHOOL 77 77 100 0 0
JOSEPH H. GAUDET LEARNING ACADEMY 175 175 100 0 0
JOSEPH H. GAUDET SCHOOL 632 632 100 0 0
MIDDLETOWN HIGH SCHOOL 303 302 100 1 0
NARRAGANSETT ALL 807 805 100 2 0
NARRAGANSETT ELEMENTARY SCHOOL 194 194 100 0 0
NARRAGANSETT HIGH SCHOOL 220 220 100 0 0
NARRAGANSETT PIER SCHOOL 389 389 100 0 0
NEW SHOREHAM BLOCK ISLAND SCHOOL 69 0 0 69 100
NEWPORT ALL 1165 1149 99 16 1
CLAIBORNE PELL ELEMENTARY SCHOOL 293 293 100 0 0
FRANK E. THOMPSON MIDDLE SCHOOL 563 563 100 0 0
ROGERS HIGH SCHOOL 292 292 100 0 0
NORTH KINGSTOWN ALL 2400 2386 99 14 1
DAVISVILLE MIDDLE SCHOOL 502 495 99 7 1
FISHING COVE ELEMENTARY SCHOOL 116 116 100 0 0
FOREST PARK ELEMENTARY SCHOOL 145 144 99 1 1
HAMILTON ELEMENTARY SCHOOL 191 191 100 0 0
NORTH KINGSTOWN SENIOR HIGH SCHOOL 625 625 100 0 0
STONY LANE ELEMENTARY SCHOOL 231 230 100 1 0
SUZANNE M. HENSELER QUIDNESSETT ELEMENTARY 142 142 100 0 0
WICKFORD MIDDLE SCHOOL 423 423 100 0 0
NORTH PROVIDENCE ALL 2074 2061 99 13 1
BIRCHWOOD MIDDLE SCHOOL 418 418 100 0 0
CENTREDALE SCHOOL 120 120 100 0 0
DR. EDWARD A. RICCI MIDDLE SCHOOL 432 430 100 2 0
DR. JOSEPH A WHELAN ELEMENTARY SCHOOL 125 125 100 0 0
GREYSTONE SCHOOL 124 123 99 1 1
JAMES L. MCGUIRE SCHOOL 137 137 100 0 0
MARIEVILLE ELEMENTARY SCHOOL 115 115 100 0 0
NORTH PROVIDENCE HIGH SCHOOL 441 440 100 1 0
STEPHEN OLNEY SCHOOL 148 148 100 0 0
NORTH SMITHFIELD ALL 1070 1065 100 5 0
DR. HARRY L. HALLIWELL MEMORIAL SCHOOL 326 326 100 0 0
NORTH SMITHFIELD ELEMENTARY SCHOOL 46 46 100 0 0
NORTH SMITHFIELD HIGH SCHOOL 241 241 100 0 0
NORTH SMITHFIELD MIDDLE SCHOOL 451 451 100 0 0
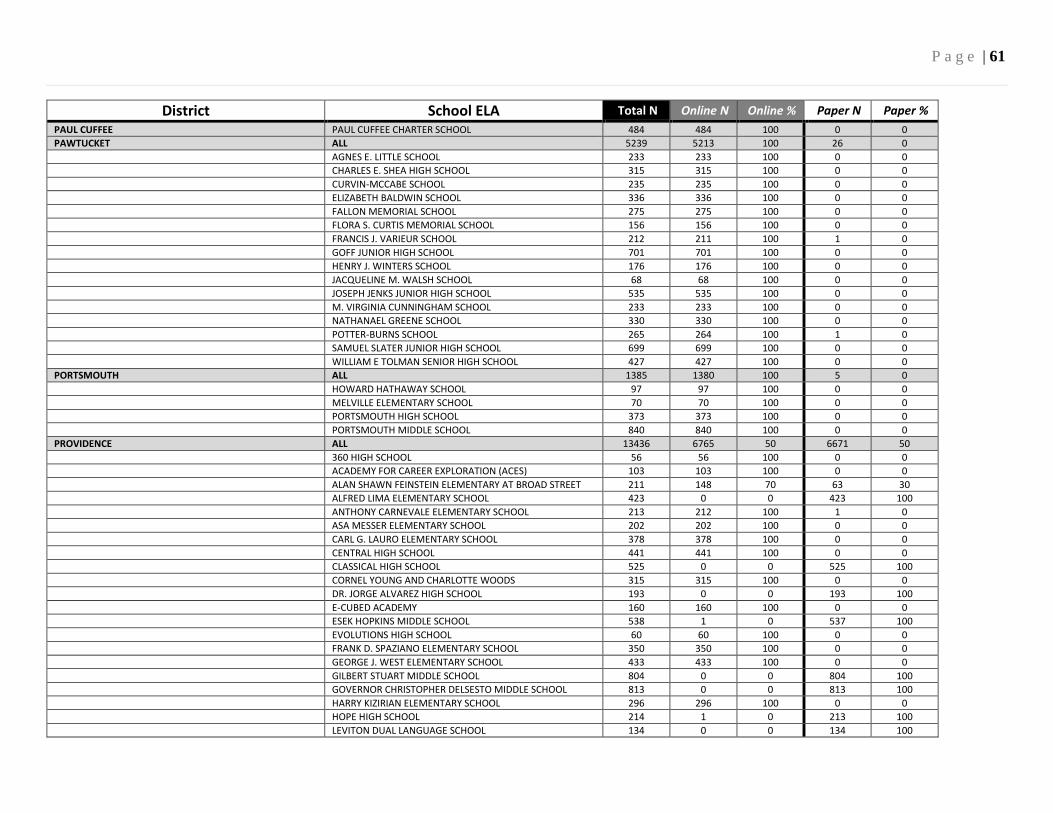
P a g e | 61
District School ELA Total N Online N Online % Paper N Paper %
PAUL CUFFEE PAUL CUFFEE CHARTER SCHOOL 484 484 100 0 0
PAWTUCKET ALL 5239 5213 100 26 0
AGNES E. LITTLE SCHOOL 233 233 100 0 0
CHARLES E. SHEA HIGH SCHOOL 315 315 100 0 0
CURVIN-MCCABE SCHOOL 235 235 100 0 0
ELIZABETH BALDWIN SCHOOL 336 336 100 0 0
FALLON MEMORIAL SCHOOL 275 275 100 0 0
FLORA S. CURTIS MEMORIAL SCHOOL 156 156 100 0 0
FRANCIS J. VARIEUR SCHOOL 212 211 100 1 0
GOFF JUNIOR HIGH SCHOOL 701 701 100 0 0
HENRY J. WINTERS SCHOOL 176 176 100 0 0
JACQUELINE M. WALSH SCHOOL 68 68 100 0 0
JOSEPH JENKS JUNIOR HIGH SCHOOL 535 535 100 0 0
M. VIRGINIA CUNNINGHAM SCHOOL 233 233 100 0 0
NATHANAEL GREENE SCHOOL 330 330 100 0 0
POTTER-BURNS SCHOOL 265 264 100 1 0
SAMUEL SLATER JUNIOR HIGH SCHOOL 699 699 100 0 0
WILLIAM E TOLMAN SENIOR HIGH SCHOOL 427 427 100 0 0
PORTSMOUTH ALL 1385 1380 100 5 0
HOWARD HATHAWAY SCHOOL 97 97 100 0 0
MELVILLE ELEMENTARY SCHOOL 70 70 100 0 0
PORTSMOUTH HIGH SCHOOL 373 373 100 0 0
PORTSMOUTH MIDDLE SCHOOL 840 840 100 0 0
PROVIDENCE ALL 13436 6765 50 6671 50
360 HIGH SCHOOL 56 56 100 0 0
ACADEMY FOR CAREER EXPLORATION (ACES) 103 103 100 0 0
ALAN SHAWN FEINSTEIN ELEMENTARY AT BROAD STREET 211 148 70 63 30
ALFRED LIMA ELEMENTARY SCHOOL 423 0 0 423 100
ANTHONY CARNEVALE ELEMENTARY SCHOOL 213 212 100 1 0
ASA MESSER ELEMENTARY SCHOOL 202 202 100 0 0
CARL G. LAURO ELEMENTARY SCHOOL 378 378 100 0 0
CENTRAL HIGH SCHOOL 441 441 100 0 0
CLASSICAL HIGH SCHOOL 525 0 0 525 100
CORNEL YOUNG AND CHARLOTTE WOODS 315 315 100 0 0
DR. JORGE ALVAREZ HIGH SCHOOL 193 0 0 193 100
E-CUBED ACADEMY 160 160 100 0 0
ESEK HOPKINS MIDDLE SCHOOL 538 1 0 537 100
EVOLUTIONS HIGH SCHOOL 60 60 100 0 0
FRANK D. SPAZIANO ELEMENTARY SCHOOL 350 350 100 0 0
GEORGE J. WEST ELEMENTARY SCHOOL 433 433 100 0 0
GILBERT STUART MIDDLE SCHOOL 804 0 0 804 100
GOVERNOR CHRISTOPHER DELSESTO MIDDLE SCHOOL 813 0 0 813 100
HARRY KIZIRIAN ELEMENTARY SCHOOL 296 296 100 0 0
HOPE HIGH SCHOOL 214 1 0 213 100
LEVITON DUAL LANGUAGE SCHOOL 134 0 0 134 100
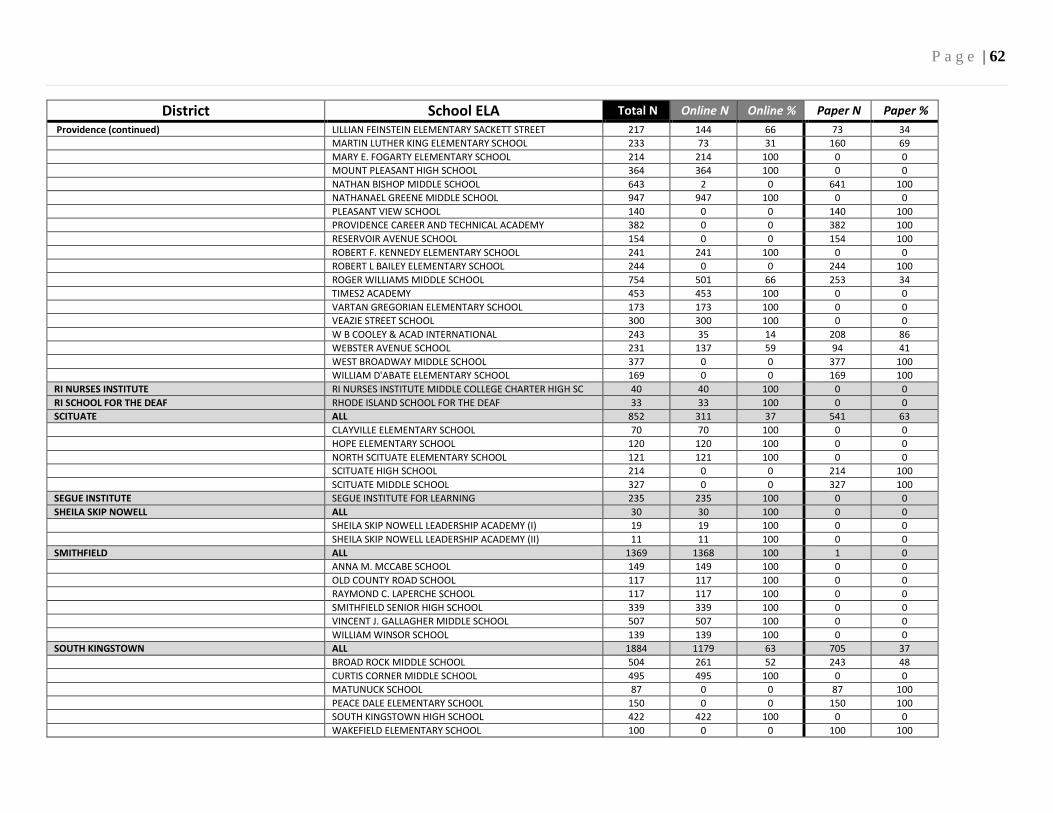
P a g e | 62
District School ELA Total N Online N Online % Paper N Paper %
Providence (continued) LILLIAN FEINSTEIN ELEMENTARY SACKETT STREET 217 144 66 73 34
MARTIN LUTHER KING ELEMENTARY SCHOOL 233 73 31 160 69
MARY E. FOGARTY ELEMENTARY SCHOOL 214 214 100 0 0
MOUNT PLEASANT HIGH SCHOOL 364 364 100 0 0
NATHAN BISHOP MIDDLE SCHOOL 643 2 0 641 100
NATHANAEL GREENE MIDDLE SCHOOL 947 947 100 0 0
PLEASANT VIEW SCHOOL 140 0 0 140 100
PROVIDENCE CAREER AND TECHNICAL ACADEMY 382 0 0 382 100
RESERVOIR AVENUE SCHOOL 154 0 0 154 100
ROBERT F. KENNEDY ELEMENTARY SCHOOL 241 241 100 0 0
ROBERT L BAILEY ELEMENTARY SCHOOL 244 0 0 244 100
ROGER WILLIAMS MIDDLE SCHOOL 754 501 66 253 34
TIMES2 ACADEMY 453 453 100 0 0
VARTAN GREGORIAN ELEMENTARY SCHOOL 173 173 100 0 0
VEAZIE STREET SCHOOL 300 300 100 0 0
W B COOLEY & ACAD INTERNATIONAL 243 35 14 208 86
WEBSTER AVENUE SCHOOL 231 137 59 94 41
WEST BROADWAY MIDDLE SCHOOL 377 0 0 377 100
WILLIAM D'ABATE ELEMENTARY SCHOOL 169 0 0 169 100
RI NURSES INSTITUTE RI NURSES INSTITUTE MIDDLE COLLEGE CHARTER HIGH SC 40 40 100 0 0
RI SCHOOL FOR THE DEAF RHODE ISLAND SCHOOL FOR THE DEAF 33 33 100 0 0
SCITUATE ALL 852 311 37 541 63
CLAYVILLE ELEMENTARY SCHOOL 70 70 100 0 0
HOPE ELEMENTARY SCHOOL 120 120 100 0 0
NORTH SCITUATE ELEMENTARY SCHOOL 121 121 100 0 0
SCITUATE HIGH SCHOOL 214 0 0 214 100
SCITUATE MIDDLE SCHOOL 327 0 0 327 100
SEGUE INSTITUTE SEGUE INSTITUTE FOR LEARNING 235 235 100 0 0
SHEILA SKIP NOWELL ALL 30 30 100 0 0
SHEILA SKIP NOWELL LEADERSHIP ACADEMY (I) 19 19 100 0 0
SHEILA SKIP NOWELL LEADERSHIP ACADEMY (II) 11 11 100 0 0
SMITHFIELD ALL 1369 1368 100 1 0
ANNA M. MCCABE SCHOOL 149 149 100 0 0
OLD COUNTY ROAD SCHOOL 117 117 100 0 0
RAYMOND C. LAPERCHE SCHOOL 117 117 100 0 0
SMITHFIELD SENIOR HIGH SCHOOL 339 339 100 0 0
VINCENT J. GALLAGHER MIDDLE SCHOOL 507 507 100 0 0
WILLIAM WINSOR SCHOOL 139 139 100 0 0
SOUTH KINGSTOWN ALL 1884 1179 63 705 37
BROAD ROCK MIDDLE SCHOOL 504 261 52 243 48
CURTIS CORNER MIDDLE SCHOOL 495 495 100 0 0
MATUNUCK SCHOOL 87 0 0 87 100
PEACE DALE ELEMENTARY SCHOOL 150 0 0 150 100
SOUTH KINGSTOWN HIGH SCHOOL 422 422 100 0 0
WAKEFIELD ELEMENTARY SCHOOL 100 0 0 100 100
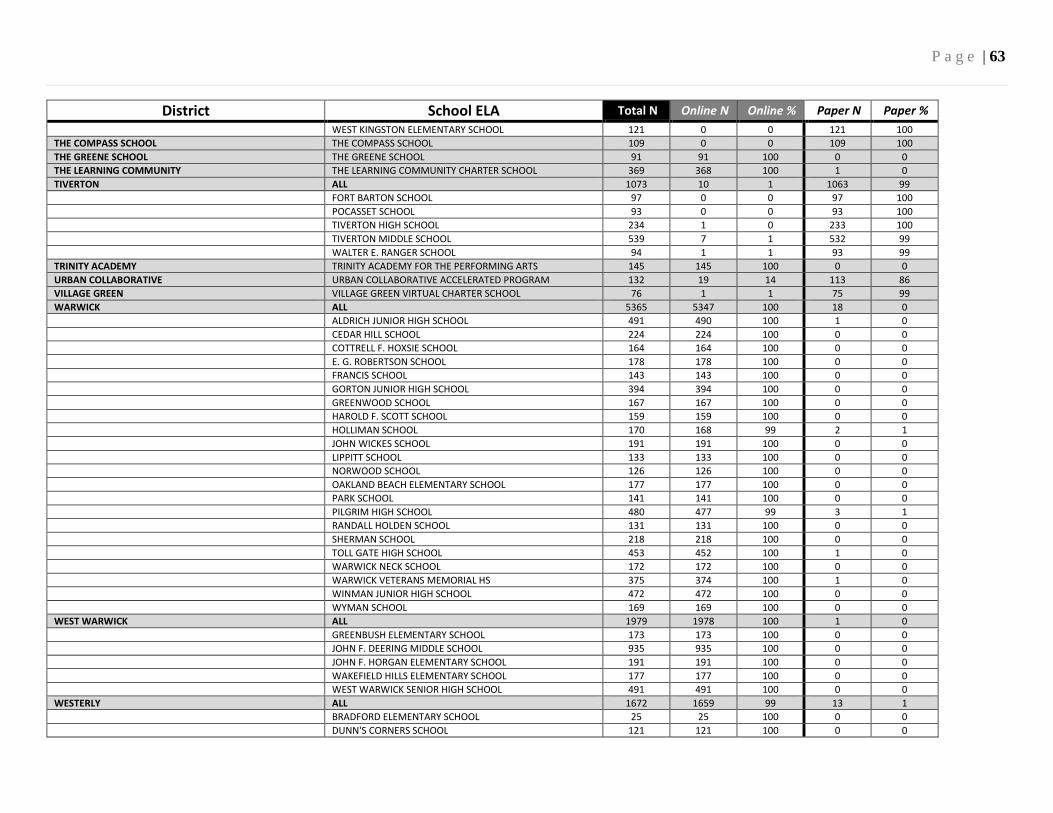
P a g e | 63
District School ELA Total N Online N Online % Paper N Paper %
WEST KINGSTON ELEMENTARY SCHOOL 121 0 0 121 100
THE COMPASS SCHOOL THE COMPASS SCHOOL 109 0 0 109 100
THE GREENE SCHOOL THE GREENE SCHOOL 91 91 100 0 0
THE LEARNING COMMUNITY THE LEARNING COMMUNITY CHARTER SCHOOL 369 368 100 1 0
TIVERTON ALL 1073 10 1 1063 99
FORT BARTON SCHOOL 97 0 0 97 100
POCASSET SCHOOL 93 0 0 93 100
TIVERTON HIGH SCHOOL 234 1 0 233 100
TIVERTON MIDDLE SCHOOL 539 7 1 532 99
WALTER E. RANGER SCHOOL 94 1 1 93 99
TRINITY ACADEMY TRINITY ACADEMY FOR THE PERFORMING ARTS 145 145 100 0 0
URBAN COLLABORATIVE URBAN COLLABORATIVE ACCELERATED PROGRAM 132 19 14 113 86
VILLAGE GREEN VILLAGE GREEN VIRTUAL CHARTER SCHOOL 76 1 1 75 99
WARWICK ALL 5365 5347 100 18 0
ALDRICH JUNIOR HIGH SCHOOL 491 490 100 1 0
CEDAR HILL SCHOOL 224 224 100 0 0
COTTRELL F. HOXSIE SCHOOL 164 164 100 0 0
E. G. ROBERTSON SCHOOL 178 178 100 0 0
FRANCIS SCHOOL 143 143 100 0 0
GORTON JUNIOR HIGH SCHOOL 394 394 100 0 0
GREENWOOD SCHOOL 167 167 100 0 0
HAROLD F. SCOTT SCHOOL 159 159 100 0 0
HOLLIMAN SCHOOL 170 168 99 2 1
JOHN WICKES SCHOOL 191 191 100 0 0
LIPPITT SCHOOL 133 133 100 0 0
NORWOOD SCHOOL 126 126 100 0 0
OAKLAND BEACH ELEMENTARY SCHOOL 177 177 100 0 0
PARK SCHOOL 141 141 100 0 0
PILGRIM HIGH SCHOOL 480 477 99 3 1
RANDALL HOLDEN SCHOOL 131 131 100 0 0
SHERMAN SCHOOL 218 218 100 0 0
TOLL GATE HIGH SCHOOL 453 452 100 1 0
WARWICK NECK SCHOOL 172 172 100 0 0
WARWICK VETERANS MEMORIAL HS 375 374 100 1 0
WINMAN JUNIOR HIGH SCHOOL 472 472 100 0 0
WYMAN SCHOOL 169 169 100 0 0
WEST WARWICK ALL 1979 1978 100 1 0
GREENBUSH ELEMENTARY SCHOOL 173 173 100 0 0
JOHN F. DEERING MIDDLE SCHOOL 935 935 100 0 0
JOHN F. HORGAN ELEMENTARY SCHOOL 191 191 100 0 0
WAKEFIELD HILLS ELEMENTARY SCHOOL 177 177 100 0 0
WEST WARWICK SENIOR HIGH SCHOOL 491 491 100 0 0
WESTERLY ALL 1672 1659 99 13 1
BRADFORD ELEMENTARY SCHOOL 25 25 100 0 0
DUNN'S CORNERS SCHOOL 121 121 100 0 0
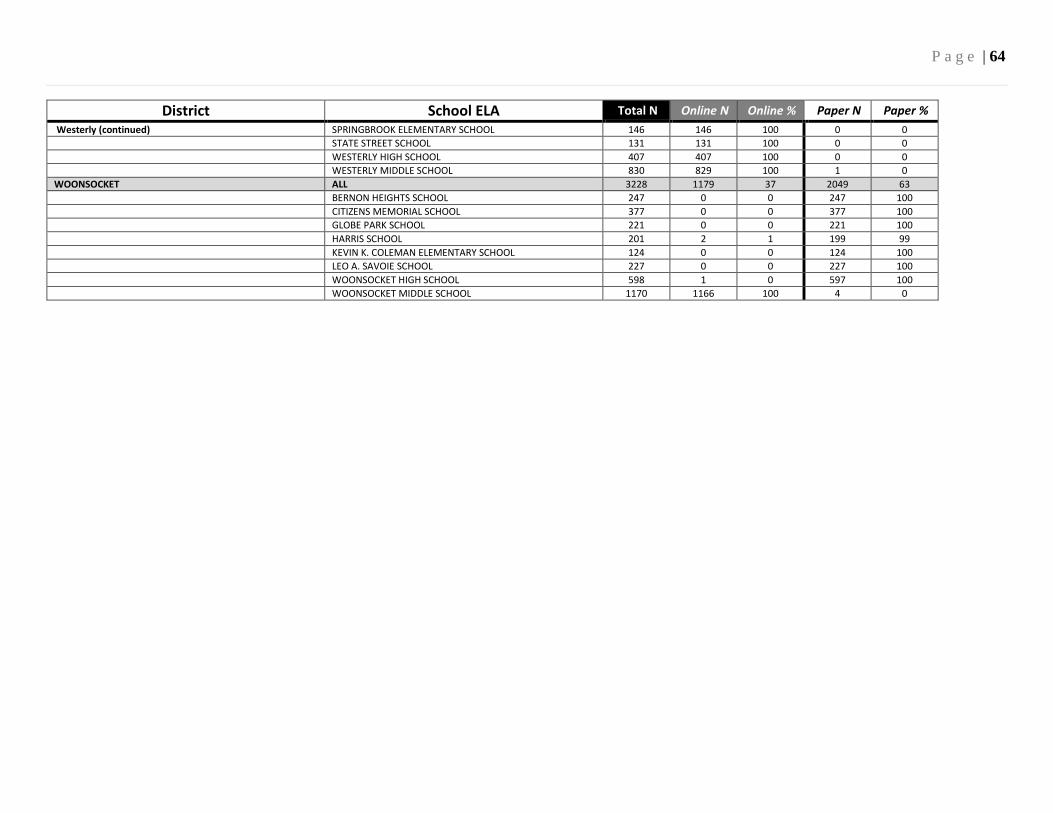
P a g e | 64
District School ELA Total N Online N Online % Paper N Paper %
Westerly (continued) SPRINGBROOK ELEMENTARY SCHOOL 146 146 100 0 0
STATE STREET SCHOOL 131 131 100 0 0
WESTERLY HIGH SCHOOL 407 407 100 0 0
WESTERLY MIDDLE SCHOOL 830 829 100 1 0
WOONSOCKET ALL 3228 1179 37 2049 63
BERNON HEIGHTS SCHOOL 247 0 0 247 100
CITIZENS MEMORIAL SCHOOL 377 0 0 377 100
GLOBE PARK SCHOOL 221 0 0 221 100
HARRIS SCHOOL 201 2 1 199 99
KEVIN K. COLEMAN ELEMENTARY SCHOOL 124 0 0 124 100
LEO A. SAVOIE SCHOOL 227 0 0 227 100
WOONSOCKET HIGH SCHOOL 598 1 0 597 100
WOONSOCKET MIDDLE SCHOOL 1170 1166 100 4 0
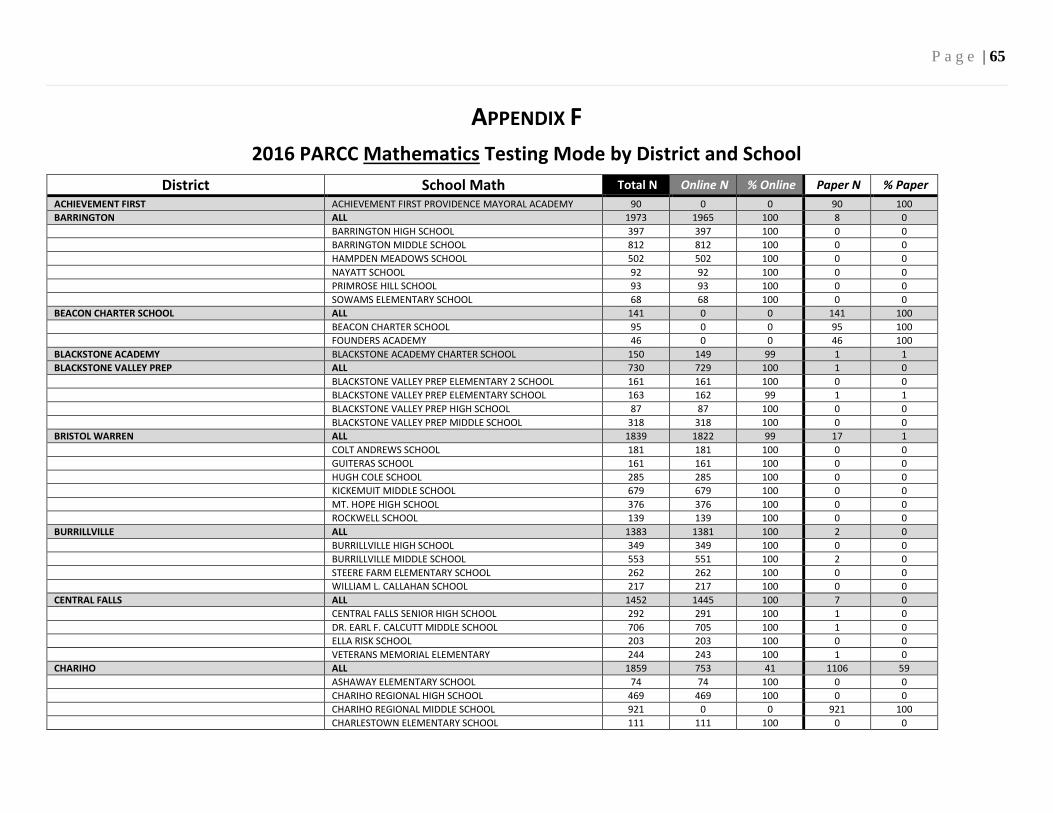
P a g e | 65
APPENDIX F
2016 PARCC Mathematics Testing Mode by District and School
District School Math Total N Online N % Online Paper N % Paper
ACHIEVEMENT FIRST ACHIEVEMENT FIRST PROVIDENCE MAYORAL ACADEMY 90 0 0 90 100
BARRINGTON ALL 1973 1965 100 8 0
BARRINGTON HIGH SCHOOL 397 397 100 0 0
BARRINGTON MIDDLE SCHOOL 812 812 100 0 0
HAMPDEN MEADOWS SCHOOL 502 502 100 0 0
NAYATT SCHOOL 92 92 100 0 0
PRIMROSE HILL SCHOOL 93 93 100 0 0
SOWAMS ELEMENTARY SCHOOL 68 68 100 0 0
BEACON CHARTER SCHOOL ALL 141 0 0 141 100
BEACON CHARTER SCHOOL 95 0 0 95 100
FOUNDERS ACADEMY 46 0 0 46 100
BLACKSTONE ACADEMY BLACKSTONE ACADEMY CHARTER SCHOOL 150 149 99 1 1
BLACKSTONE VALLEY PREP ALL 730 729 100 1 0
BLACKSTONE VALLEY PREP ELEMENTARY 2 SCHOOL 161 161 100 0 0
BLACKSTONE VALLEY PREP ELEMENTARY SCHOOL 163 162 99 1 1
BLACKSTONE VALLEY PREP HIGH SCHOOL 87 87 100 0 0
BLACKSTONE VALLEY PREP MIDDLE SCHOOL 318 318 100 0 0
BRISTOL WARREN ALL 1839 1822 99 17 1
COLT ANDREWS SCHOOL 181 181 100 0 0
GUITERAS SCHOOL 161 161 100 0 0
HUGH COLE SCHOOL 285 285 100 0 0
KICKEMUIT MIDDLE SCHOOL 679 679 100 0 0
MT. HOPE HIGH SCHOOL 376 376 100 0 0
ROCKWELL SCHOOL 139 139 100 0 0
BURRILLVILLE ALL 1383 1381 100 2 0
BURRILLVILLE HIGH SCHOOL 349 349 100 0 0
BURRILLVILLE MIDDLE SCHOOL 553 551 100 2 0
STEERE FARM ELEMENTARY SCHOOL 262 262 100 0 0
WILLIAM L. CALLAHAN SCHOOL 217 217 100 0 0
CENTRAL FALLS ALL 1452 1445 100 7 0
CENTRAL FALLS SENIOR HIGH SCHOOL 292 291 100 1 0
DR. EARL F. CALCUTT MIDDLE SCHOOL 706 705 100 1 0
ELLA RISK SCHOOL 203 203 100 0 0
VETERANS MEMORIAL ELEMENTARY 244 243 100 1 0
CHARIHO ALL 1859 753 41 1106 59
ASHAWAY ELEMENTARY SCHOOL 74 74 100 0 0
CHARIHO REGIONAL HIGH SCHOOL 469 469 100 0 0
CHARIHO REGIONAL MIDDLE SCHOOL 921 0 0 921 100
CHARLESTOWN ELEMENTARY SCHOOL 111 111 100 0 0
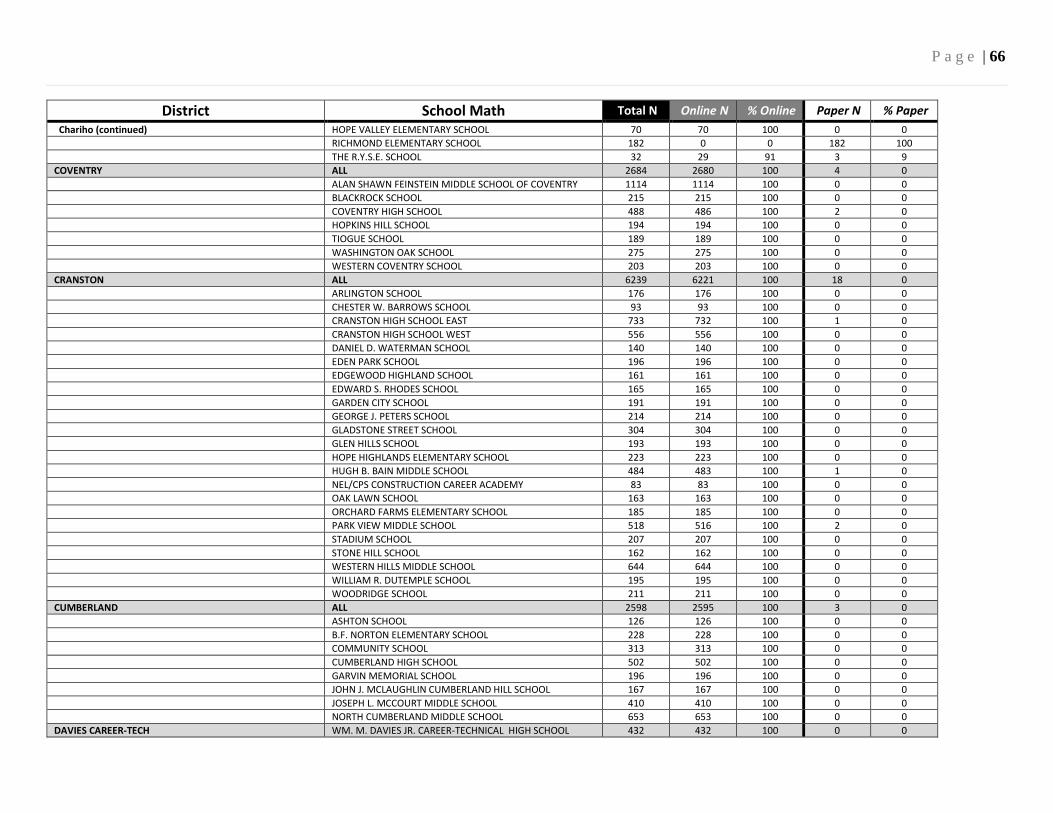
P a g e | 66
District School Math Total N Online N % Online Paper N % Paper
Chariho (continued) HOPE VALLEY ELEMENTARY SCHOOL 70 70 100 0 0
RICHMOND ELEMENTARY SCHOOL 182 0 0 182 100
THE R.Y.S.E. SCHOOL 32 29 91 3 9
COVENTRY ALL 2684 2680 100 4 0
ALAN SHAWN FEINSTEIN MIDDLE SCHOOL OF COVENTRY 1114 1114 100 0 0
BLACKROCK SCHOOL 215 215 100 0 0
COVENTRY HIGH SCHOOL 488 486 100 2 0
HOPKINS HILL SCHOOL 194 194 100 0 0
TIOGUE SCHOOL 189 189 100 0 0
WASHINGTON OAK SCHOOL 275 275 100 0 0
WESTERN COVENTRY SCHOOL 203 203 100 0 0
CRANSTON ALL 6239 6221 100 18 0
ARLINGTON SCHOOL 176 176 100 0 0
CHESTER W. BARROWS SCHOOL 93 93 100 0 0
CRANSTON HIGH SCHOOL EAST 733 732 100 1 0
CRANSTON HIGH SCHOOL WEST 556 556 100 0 0
DANIEL D. WATERMAN SCHOOL 140 140 100 0 0
EDEN PARK SCHOOL 196 196 100 0 0
EDGEWOOD HIGHLAND SCHOOL 161 161 100 0 0
EDWARD S. RHODES SCHOOL 165 165 100 0 0
GARDEN CITY SCHOOL 191 191 100 0 0
GEORGE J. PETERS SCHOOL 214 214 100 0 0
GLADSTONE STREET SCHOOL 304 304 100 0 0
GLEN HILLS SCHOOL 193 193 100 0 0
HOPE HIGHLANDS ELEMENTARY SCHOOL 223 223 100 0 0
HUGH B. BAIN MIDDLE SCHOOL 484 483 100 1 0
NEL/CPS CONSTRUCTION CAREER ACADEMY 83 83 100 0 0
OAK LAWN SCHOOL 163 163 100 0 0
ORCHARD FARMS ELEMENTARY SCHOOL 185 185 100 0 0
PARK VIEW MIDDLE SCHOOL 518 516 100 2 0
STADIUM SCHOOL 207 207 100 0 0
STONE HILL SCHOOL 162 162 100 0 0
WESTERN HILLS MIDDLE SCHOOL 644 644 100 0 0
WILLIAM R. DUTEMPLE SCHOOL 195 195 100 0 0
WOODRIDGE SCHOOL 211 211 100 0 0
CUMBERLAND ALL 2598 2595 100 3 0
ASHTON SCHOOL 126 126 100 0 0
B.F. NORTON ELEMENTARY SCHOOL 228 228 100 0 0
COMMUNITY SCHOOL 313 313 100 0 0
CUMBERLAND HIGH SCHOOL 502 502 100 0 0
GARVIN MEMORIAL SCHOOL 196 196 100 0 0
JOHN J. MCLAUGHLIN CUMBERLAND HILL SCHOOL 167 167 100 0 0
JOSEPH L. MCCOURT MIDDLE SCHOOL 410 410 100 0 0
NORTH CUMBERLAND MIDDLE SCHOOL 653 653 100 0 0
DAVIES CAREER-TECH WM. M. DAVIES JR. CAREER-TECHNICAL HIGH SCHOOL 432 432 100 0 0

P a g e | 67
District School Math Total N Online N % Online Paper N % Paper
DCYF DCYF ALTERNATIVE EDUCATION PROGRAM 31 11 35 20 65
EAST GREENWICH ALL 1391 781 56 610 44
ARCHIE R. COLE MIDDLE SCHOOL 605 0 0 605 100
EAST GREENWICH HIGH SCHOOL 230 229 100 1 0
GEORGE HANAFORD SCHOOL 262 262 100 0 0
JAMES H. ELDREDGE EL. SCHOOL 289 289 100 0 0
EAST PROVIDENCE ALL 2563 2528 99 35 1
AGNES B. HENNESSEY SCHOOL 141 141 100 0 0
ALICE M. WADDINGTON SCHOOL 192 190 99 2 1
EAST PROVIDENCE HIGH SCHOOL 472 472 100 0 0
EDWARD R. MARTIN MIDDLE SCHOOL 555 555 100 0 0
EMMA G. WHITEKNACT SCHOOL 133 128 96 5 4
JAMES R. D. OLDHAM SCHOOL 99 99 100 0 0
KENT HEIGHTS SCHOOL 139 139 100 0 0
MYRON J. FRANCIS ELEMENTARY SCHOOL 192 192 100 0 0
ORLO AVENUE SCHOOL 150 150 100 0 0
RIVERSIDE MIDDLE SCHOOL 327 327 100 0 0
SILVER SPRING SCHOOL 136 133 98 3 2
EXETER-WEST GREENWICH ALL 893 888 99 5 1
EXETER-WEST GREENWICH REGIONAL JUNIOR HIGH 284 283 100 1 0
EXETER-WEST GREENWICH REGIONAL HIGH SCHOOL 177 177 100 0 0
METCALF SCHOOL 430 426 99 4 1
FOSTER CAPTAIN ISAAC PAINE ELEMENTARY SCHOOL 157 157 100 0 0
FOSTER-GLOCESTER ALL 676 676 100 0 0
PONAGANSET HIGH SCHOOL 228 228 100 0 0
PONAGANSET MIDDLE SCHOOL 448 448 100 0 0
GLOCESTER FOGARTY MEMORIAL SCHOOL 163 163 100 0 0
ALL 274 274 100 0 0
WEST GLOCESTER ELEMENTARY 111 111 100 0 0
HIGHLANDER HIGHLANDER CHARTER SCHOOL 311 311 100 0 0
INTERNATIONAL INTERNATIONAL CHARTER SCHOOL 162 162 100 0 0
JAMESTOWN ALL 320 315 98 5 2
JAMESTOWN SCHOOL-LAWN 207 205 99 2 1
JAMESTOWN SCHOOL-MELROSE 110 110 100 0 0
JOHNSTON ALL 1780 753 42 1027 58
BROWN AVENUE SCHOOL 131 0 0 131 100
JOHNSTON SENIOR HIGH SCHOOL 287 0 0 287 100
NICHOLAS A. FERRI MIDDLE SCHOOL 749 749 100 0 0
SARAH DYER BARNES SCHOOL 155 0 0 155 100
THORNTON SCHOOL 227 0 0 227 100
WINSOR HILL SCHOOL 217 0 0 217 100
KINGSTON HILL KINGSTON HILL ACADEMY 62 0 0 62 100
LINCOLN ALL 1741 1102 63 639 37
LINCOLN CENTRAL ELEMENTARY SCHOOL 157 0 0 157 100
LINCOLN MIDDLE SCHOOL 747 746 100 1 0
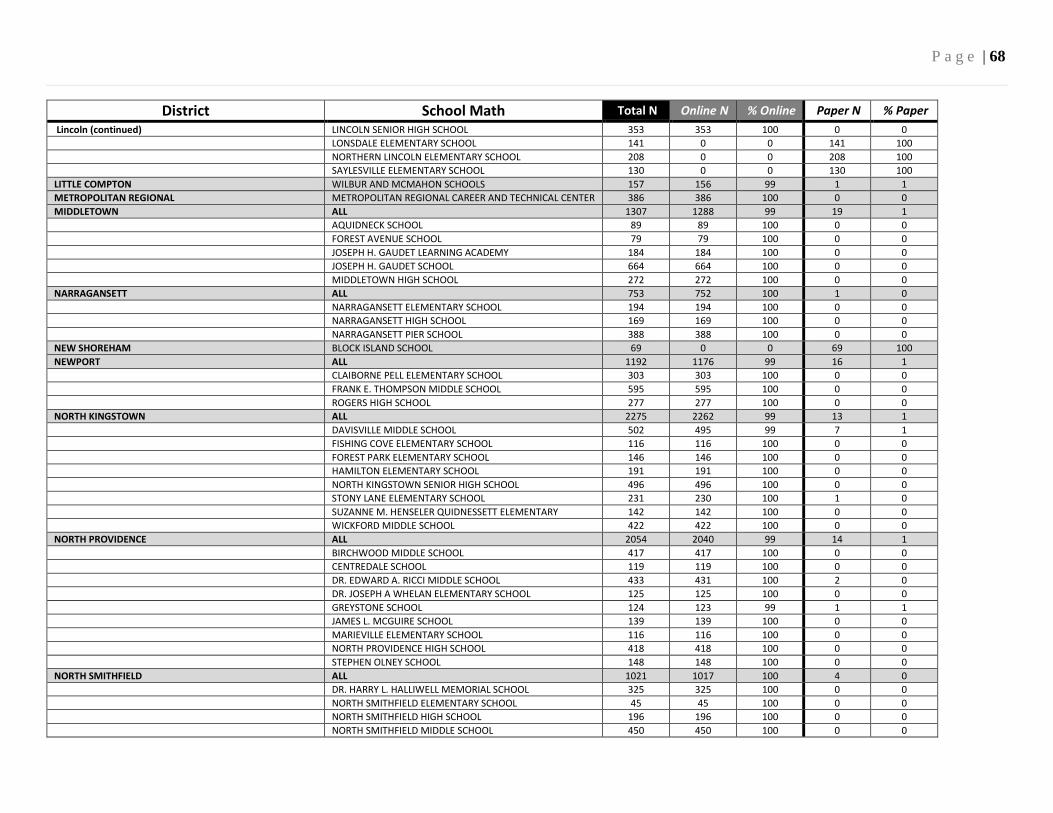
P a g e | 68
District School Math Total N Online N % Online Paper N % Paper
Lincoln (continued) LINCOLN SENIOR HIGH SCHOOL 353 353 100 0 0
LONSDALE ELEMENTARY SCHOOL 141 0 0 141 100
NORTHERN LINCOLN ELEMENTARY SCHOOL 208 0 0 208 100
SAYLESVILLE ELEMENTARY SCHOOL 130 0 0 130 100
LITTLE COMPTON WILBUR AND MCMAHON SCHOOLS 157 156 99 1 1
METROPOLITAN REGIONAL METROPOLITAN REGIONAL CAREER AND TECHNICAL CENTER 386 386 100 0 0
MIDDLETOWN ALL 1307 1288 99 19 1
AQUIDNECK SCHOOL 89 89 100 0 0
FOREST AVENUE SCHOOL 79 79 100 0 0
JOSEPH H. GAUDET LEARNING ACADEMY 184 184 100 0 0
JOSEPH H. GAUDET SCHOOL 664 664 100 0 0
MIDDLETOWN HIGH SCHOOL 272 272 100 0 0
NARRAGANSETT ALL 753 752 100 1 0
NARRAGANSETT ELEMENTARY SCHOOL 194 194 100 0 0
NARRAGANSETT HIGH SCHOOL 169 169 100 0 0
NARRAGANSETT PIER SCHOOL 388 388 100 0 0
NEW SHOREHAM BLOCK ISLAND SCHOOL 69 0 0 69 100
NEWPORT ALL 1192 1176 99 16 1
CLAIBORNE PELL ELEMENTARY SCHOOL 303 303 100 0 0
FRANK E. THOMPSON MIDDLE SCHOOL 595 595 100 0 0
ROGERS HIGH SCHOOL 277 277 100 0 0
NORTH KINGSTOWN ALL 2275 2262 99 13 1
DAVISVILLE MIDDLE SCHOOL 502 495 99 7 1
FISHING COVE ELEMENTARY SCHOOL 116 116 100 0 0
FOREST PARK ELEMENTARY SCHOOL 146 146 100 0 0
HAMILTON ELEMENTARY SCHOOL 191 191 100 0 0
NORTH KINGSTOWN SENIOR HIGH SCHOOL 496 496 100 0 0
STONY LANE ELEMENTARY SCHOOL 231 230 100 1 0
SUZANNE M. HENSELER QUIDNESSETT ELEMENTARY 142 142 100 0 0
WICKFORD MIDDLE SCHOOL 422 422 100 0 0
NORTH PROVIDENCE ALL 2054 2040 99 14 1
BIRCHWOOD MIDDLE SCHOOL 417 417 100 0 0
CENTREDALE SCHOOL 119 119 100 0 0
DR. EDWARD A. RICCI MIDDLE SCHOOL 433 431 100 2 0
DR. JOSEPH A WHELAN ELEMENTARY SCHOOL 125 125 100 0 0
GREYSTONE SCHOOL 124 123 99 1 1
JAMES L. MCGUIRE SCHOOL 139 139 100 0 0
MARIEVILLE ELEMENTARY SCHOOL 116 116 100 0 0
NORTH PROVIDENCE HIGH SCHOOL 418 418 100 0 0
STEPHEN OLNEY SCHOOL 148 148 100 0 0
NORTH SMITHFIELD ALL 1021 1017 100 4 0
DR. HARRY L. HALLIWELL MEMORIAL SCHOOL 325 325 100 0 0
NORTH SMITHFIELD ELEMENTARY SCHOOL 45 45 100 0 0
NORTH SMITHFIELD HIGH SCHOOL 196 196 100 0 0
NORTH SMITHFIELD MIDDLE SCHOOL 450 450 100 0 0
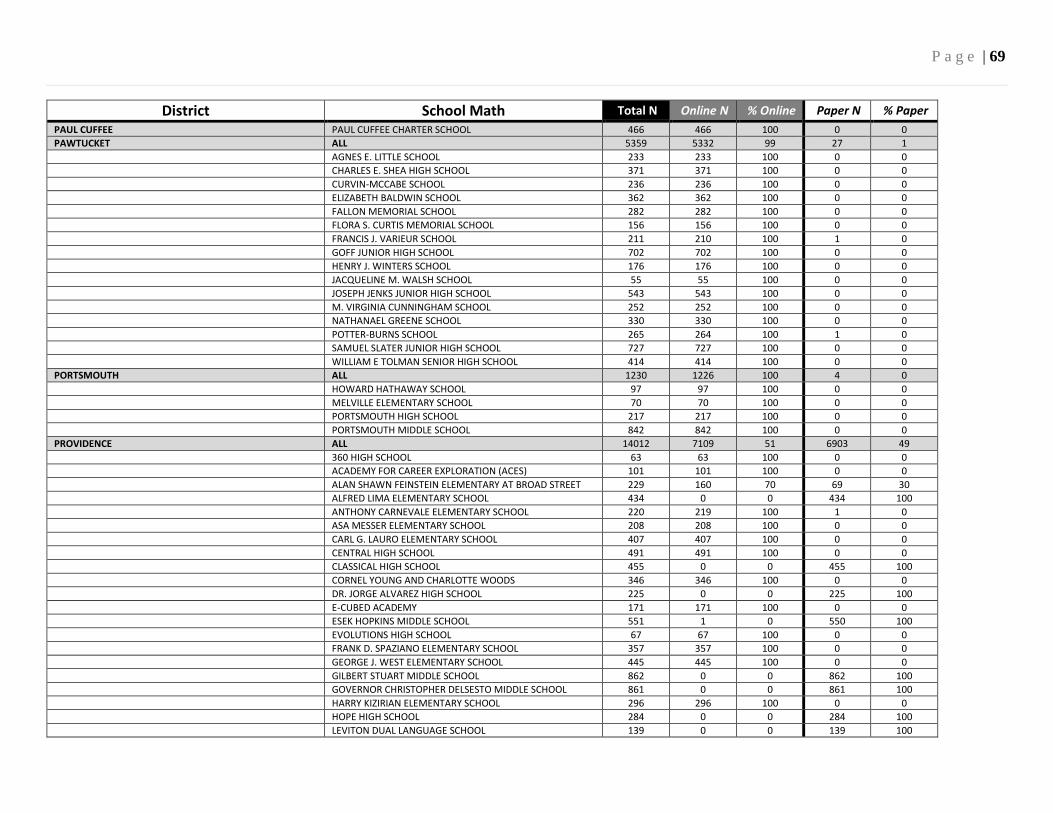
P a g e | 69
District School Math Total N Online N % Online Paper N % Paper
PAUL CUFFEE PAUL CUFFEE CHARTER SCHOOL 466 466 100 0 0
PAWTUCKET ALL 5359 5332 99 27 1
AGNES E. LITTLE SCHOOL 233 233 100 0 0
CHARLES E. SHEA HIGH SCHOOL 371 371 100 0 0
CURVIN-MCCABE SCHOOL 236 236 100 0 0
ELIZABETH BALDWIN SCHOOL 362 362 100 0 0
FALLON MEMORIAL SCHOOL 282 282 100 0 0
FLORA S. CURTIS MEMORIAL SCHOOL 156 156 100 0 0
FRANCIS J. VARIEUR SCHOOL 211 210 100 1 0
GOFF JUNIOR HIGH SCHOOL 702 702 100 0 0
HENRY J. WINTERS SCHOOL 176 176 100 0 0
JACQUELINE M. WALSH SCHOOL 55 55 100 0 0
JOSEPH JENKS JUNIOR HIGH SCHOOL 543 543 100 0 0
M. VIRGINIA CUNNINGHAM SCHOOL 252 252 100 0 0
NATHANAEL GREENE SCHOOL 330 330 100 0 0
POTTER-BURNS SCHOOL 265 264 100 1 0
SAMUEL SLATER JUNIOR HIGH SCHOOL 727 727 100 0 0
WILLIAM E TOLMAN SENIOR HIGH SCHOOL 414 414 100 0 0
PORTSMOUTH ALL 1230 1226 100 4 0
HOWARD HATHAWAY SCHOOL 97 97 100 0 0
MELVILLE ELEMENTARY SCHOOL 70 70 100 0 0
PORTSMOUTH HIGH SCHOOL 217 217 100 0 0
PORTSMOUTH MIDDLE SCHOOL 842 842 100 0 0
PROVIDENCE ALL 14012 7109 51 6903 49
360 HIGH SCHOOL 63 63 100 0 0
ACADEMY FOR CAREER EXPLORATION (ACES) 101 101 100 0 0
ALAN SHAWN FEINSTEIN ELEMENTARY AT BROAD STREET 229 160 70 69 30
ALFRED LIMA ELEMENTARY SCHOOL 434 0 0 434 100
ANTHONY CARNEVALE ELEMENTARY SCHOOL 220 219 100 1 0
ASA MESSER ELEMENTARY SCHOOL 208 208 100 0 0
CARL G. LAURO ELEMENTARY SCHOOL 407 407 100 0 0
CENTRAL HIGH SCHOOL 491 491 100 0 0
CLASSICAL HIGH SCHOOL 455 0 0 455 100
CORNEL YOUNG AND CHARLOTTE WOODS 346 346 100 0 0
DR. JORGE ALVAREZ HIGH SCHOOL 225 0 0 225 100
E-CUBED ACADEMY 171 171 100 0 0
ESEK HOPKINS MIDDLE SCHOOL 551 1 0 550 100
EVOLUTIONS HIGH SCHOOL 67 67 100 0 0
FRANK D. SPAZIANO ELEMENTARY SCHOOL 357 357 100 0 0
GEORGE J. WEST ELEMENTARY SCHOOL 445 445 100 0 0
GILBERT STUART MIDDLE SCHOOL 862 0 0 862 100
GOVERNOR CHRISTOPHER DELSESTO MIDDLE SCHOOL 861 0 0 861 100
HARRY KIZIRIAN ELEMENTARY SCHOOL 296 296 100 0 0
HOPE HIGH SCHOOL 284 0 0 284 100
LEVITON DUAL LANGUAGE SCHOOL 139 0 0 139 100
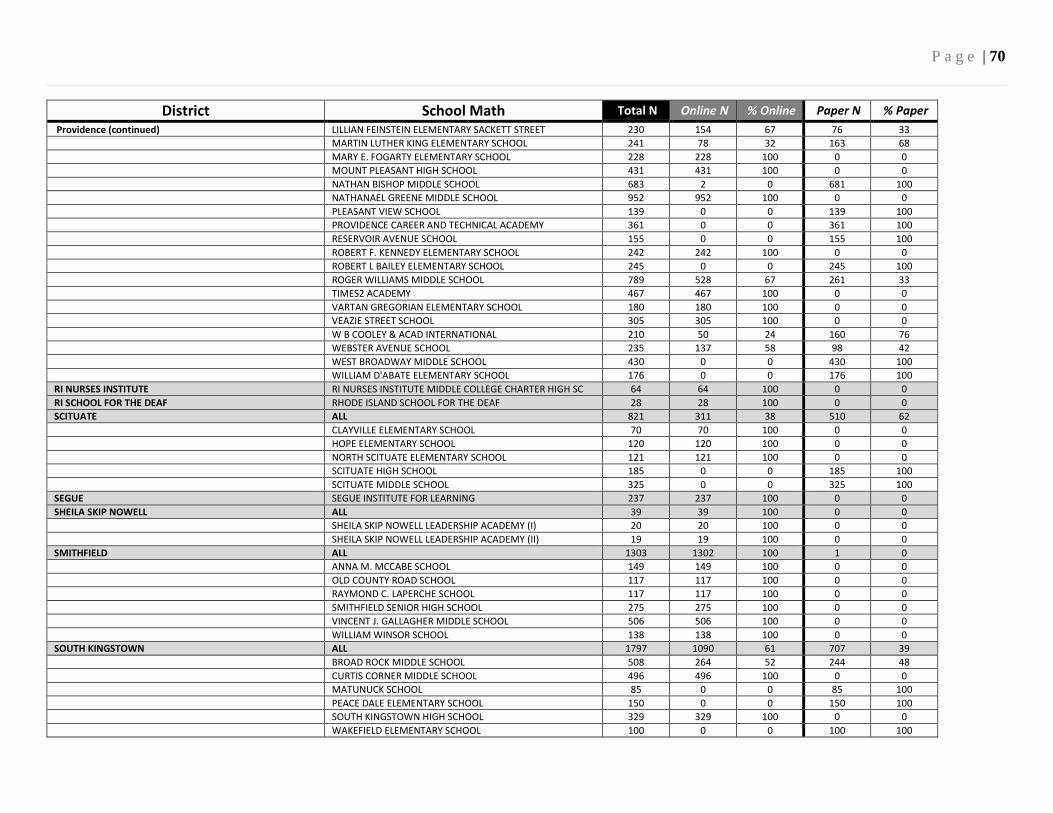
P a g e | 70
District School Math Total N Online N % Online Paper N % Paper
Providence (continued) LILLIAN FEINSTEIN ELEMENTARY SACKETT STREET 230 154 67 76 33
MARTIN LUTHER KING ELEMENTARY SCHOOL 241 78 32 163 68
MARY E. FOGARTY ELEMENTARY SCHOOL 228 228 100 0 0
MOUNT PLEASANT HIGH SCHOOL 431 431 100 0 0
NATHAN BISHOP MIDDLE SCHOOL 683 2 0 681 100
NATHANAEL GREENE MIDDLE SCHOOL 952 952 100 0 0
PLEASANT VIEW SCHOOL 139 0 0 139 100
PROVIDENCE CAREER AND TECHNICAL ACADEMY 361 0 0 361 100
RESERVOIR AVENUE SCHOOL 155 0 0 155 100
ROBERT F. KENNEDY ELEMENTARY SCHOOL 242 242 100 0 0
ROBERT L BAILEY ELEMENTARY SCHOOL 245 0 0 245 100
ROGER WILLIAMS MIDDLE SCHOOL 789 528 67 261 33
TIMES2 ACADEMY 467 467 100 0 0
VARTAN GREGORIAN ELEMENTARY SCHOOL 180 180 100 0 0
VEAZIE STREET SCHOOL 305 305 100 0 0
W B COOLEY & ACAD INTERNATIONAL 210 50 24 160 76
WEBSTER AVENUE SCHOOL 235 137 58 98 42
WEST BROADWAY MIDDLE SCHOOL 430 0 0 430 100
WILLIAM D'ABATE ELEMENTARY SCHOOL 176 0 0 176 100
RI NURSES INSTITUTE RI NURSES INSTITUTE MIDDLE COLLEGE CHARTER HIGH SC 64 64 100 0 0
RI SCHOOL FOR THE DEAF RHODE ISLAND SCHOOL FOR THE DEAF 28 28 100 0 0
SCITUATE ALL 821 311 38 510 62
CLAYVILLE ELEMENTARY SCHOOL 70 70 100 0 0
HOPE ELEMENTARY SCHOOL 120 120 100 0 0
NORTH SCITUATE ELEMENTARY SCHOOL 121 121 100 0 0
SCITUATE HIGH SCHOOL 185 0 0 185 100
SCITUATE MIDDLE SCHOOL 325 0 0 325 100
SEGUE SEGUE INSTITUTE FOR LEARNING 237 237 100 0 0
SHEILA SKIP NOWELL ALL 39 39 100 0 0
SHEILA SKIP NOWELL LEADERSHIP ACADEMY (I) 20 20 100 0 0
SHEILA SKIP NOWELL LEADERSHIP ACADEMY (II) 19 19 100 0 0
SMITHFIELD ALL 1303 1302 100 1 0
ANNA M. MCCABE SCHOOL 149 149 100 0 0
OLD COUNTY ROAD SCHOOL 117 117 100 0 0
RAYMOND C. LAPERCHE SCHOOL 117 117 100 0 0
SMITHFIELD SENIOR HIGH SCHOOL 275 275 100 0 0
VINCENT J. GALLAGHER MIDDLE SCHOOL 506 506 100 0 0
WILLIAM WINSOR SCHOOL 138 138 100 0 0
SOUTH KINGSTOWN ALL 1797 1090 61 707 39
BROAD ROCK MIDDLE SCHOOL 508 264 52 244 48
CURTIS CORNER MIDDLE SCHOOL 496 496 100 0 0
MATUNUCK SCHOOL 85 0 0 85 100
PEACE DALE ELEMENTARY SCHOOL 150 0 0 150 100
SOUTH KINGSTOWN HIGH SCHOOL 329 329 100 0 0
WAKEFIELD ELEMENTARY SCHOOL 100 0 0 100 100
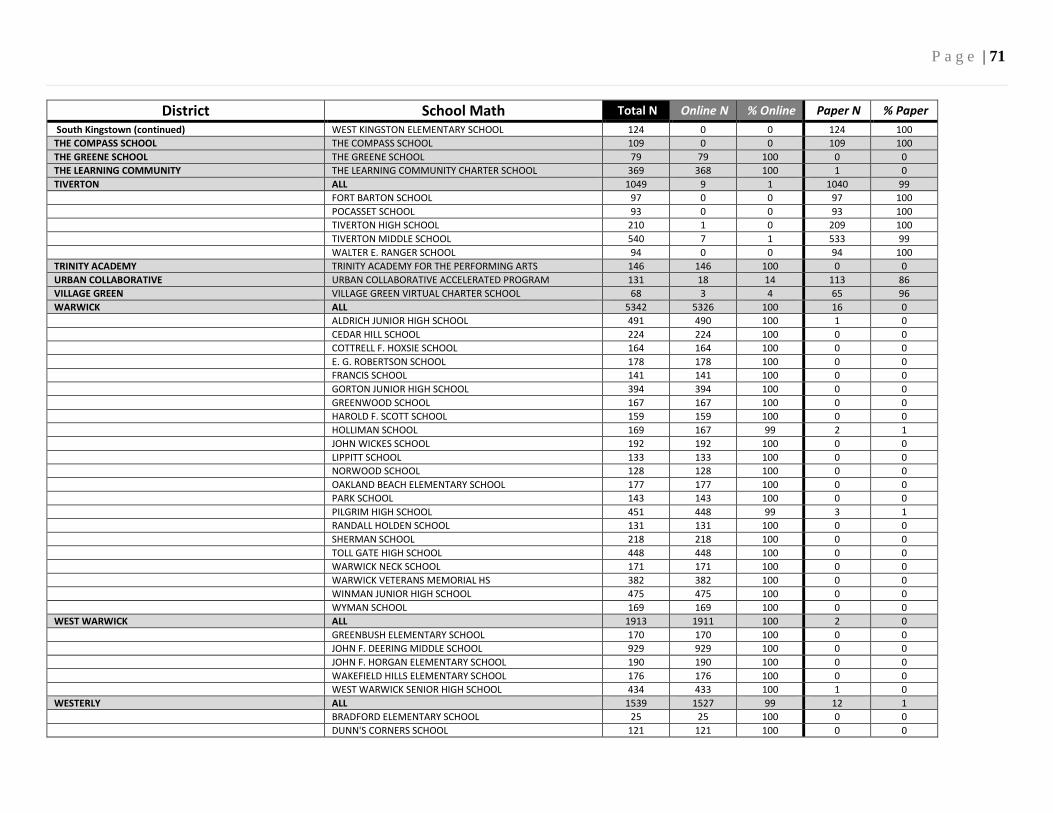
P a g e | 71
District School Math Total N Online N % Online Paper N % Paper
South Kingstown (continued) WEST KINGSTON ELEMENTARY SCHOOL 124 0 0 124 100
THE COMPASS SCHOOL THE COMPASS SCHOOL 109 0 0 109 100
THE GREENE SCHOOL THE GREENE SCHOOL 79 79 100 0 0
THE LEARNING COMMUNITY THE LEARNING COMMUNITY CHARTER SCHOOL 369 368 100 1 0
TIVERTON ALL 1049 9 1 1040 99
FORT BARTON SCHOOL 97 0 0 97 100
POCASSET SCHOOL 93 0 0 93 100
TIVERTON HIGH SCHOOL 210 1 0 209 100
TIVERTON MIDDLE SCHOOL 540 7 1 533 99
WALTER E. RANGER SCHOOL 94 0 0 94 100
TRINITY ACADEMY TRINITY ACADEMY FOR THE PERFORMING ARTS 146 146 100 0 0
URBAN COLLABORATIVE URBAN COLLABORATIVE ACCELERATED PROGRAM 131 18 14 113 86
VILLAGE GREEN VILLAGE GREEN VIRTUAL CHARTER SCHOOL 68 3 4 65 96
WARWICK ALL 5342 5326 100 16 0
ALDRICH JUNIOR HIGH SCHOOL 491 490 100 1 0
CEDAR HILL SCHOOL 224 224 100 0 0
COTTRELL F. HOXSIE SCHOOL 164 164 100 0 0
E. G. ROBERTSON SCHOOL 178 178 100 0 0
FRANCIS SCHOOL 141 141 100 0 0
GORTON JUNIOR HIGH SCHOOL 394 394 100 0 0
GREENWOOD SCHOOL 167 167 100 0 0
HAROLD F. SCOTT SCHOOL 159 159 100 0 0
HOLLIMAN SCHOOL 169 167 99 2 1
JOHN WICKES SCHOOL 192 192 100 0 0
LIPPITT SCHOOL 133 133 100 0 0
NORWOOD SCHOOL 128 128 100 0 0
OAKLAND BEACH ELEMENTARY SCHOOL 177 177 100 0 0
PARK SCHOOL 143 143 100 0 0
PILGRIM HIGH SCHOOL 451 448 99 3 1
RANDALL HOLDEN SCHOOL 131 131 100 0 0
SHERMAN SCHOOL 218 218 100 0 0
TOLL GATE HIGH SCHOOL 448 448 100 0 0
WARWICK NECK SCHOOL 171 171 100 0 0
WARWICK VETERANS MEMORIAL HS 382 382 100 0 0
WINMAN JUNIOR HIGH SCHOOL 475 475 100 0 0
WYMAN SCHOOL 169 169 100 0 0
WEST WARWICK ALL 1913 1911 100 2 0
GREENBUSH ELEMENTARY SCHOOL 170 170 100 0 0
JOHN F. DEERING MIDDLE SCHOOL 929 929 100 0 0
JOHN F. HORGAN ELEMENTARY SCHOOL 190 190 100 0 0
WAKEFIELD HILLS ELEMENTARY SCHOOL 176 176 100 0 0
WEST WARWICK SENIOR HIGH SCHOOL 434 433 100 1 0
WESTERLY ALL 1539 1527 99 12 1
BRADFORD ELEMENTARY SCHOOL 25 25 100 0 0
DUNN'S CORNERS SCHOOL 121 121 100 0 0

P a g e | 72
District School Math Total N Online N % Online Paper N % Paper
Westerly (continued) SPRINGBROOK ELEMENTARY SCHOOL 145 145 100 0 0
STATE STREET SCHOOL 131 131 100 0 0
WESTERLY HIGH SCHOOL 273 273 100 0 0
WESTERLY MIDDLE SCHOOL 832 831 100 1 0
WOONSOCKET ALL 3310 1194 36 2116 64
BERNON HEIGHTS SCHOOL 247 0 0 247 100
CITIZENS MEMORIAL SCHOOL 387 0 0 387 100
GLOBE PARK SCHOOL 221 0 0 221 100
HARRIS SCHOOL 200 1 1 199 100
KEVIN K. COLEMAN ELEMENTARY SCHOOL 125 0 0 125 100
LEO A. SAVOIE SCHOOL 228 0 0 228 100
WOONSOCKET HIGH SCHOOL 654 1 0 653 100
WOONSOCKET MIDDLE SCHOOL 1188 1184 100 4 0
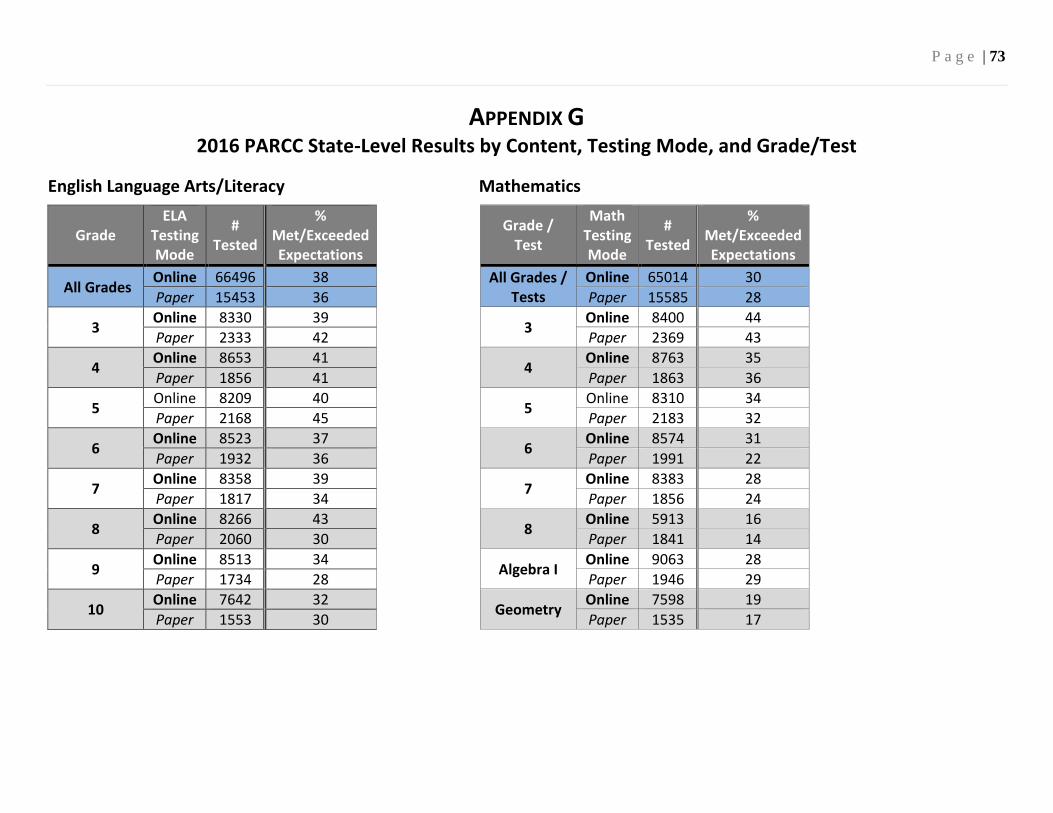
P a g e | 73
APPENDIX G 2016 PARCC State-Level Results by Content, Testing Mode, and Grade/Test
English Language Arts/Literacy Mathematics
Grade ELA
Testing Mode
# Tested
% Met/Exceeded Expectations
Grade /
Test
Math Testing Mode
# Tested
% Met/Exceeded Expectations
All Grades Online 66496 38 All Grades /
Tests Online 65014 30
Paper 15453 36 Paper 15585 28
3 Online 8330 39
3 Online 8400 44
Paper 2333 42 Paper 2369 43
4 Online 8653 41
4 Online 8763 35
Paper 1856 41 Paper 1863 36
5 Online 8209 40
5 Online 8310 34
Paper 2168 45 Paper 2183 32
6 Online 8523 37
6 Online 8574 31
Paper 1932 36 Paper 1991 22
7 Online 8358 39
7 Online 8383 28
Paper 1817 34 Paper 1856 24
8 Online 8266 43
8 Online 5913 16
Paper 2060 30 Paper 1841 14
9 Online 8513 34
Algebra I Online 9063 28
Paper 1734 28 Paper 1946 29
10 Online 7642 32
Geometry Online 7598 19
Paper 1553 30 Paper 1535 17
P a g e | 74
Rhode Island Department of Education 255 Westminster Street Providence, RI 02903 (401) 222-4600