rice bran oil report
Post on 06-Apr-2018
229 views
TRANSCRIPT

8/3/2019 Rice Bran Oil Report
http://slidepdf.com/reader/full/rice-bran-oil-report 1/8
Ricebran Oil
Special Commodity Report
102 A, Landmark, Suren Road, Chakala, Andheri (East), Mumbai - 400 093Tel: 022 66494000 / 26836016, Fax: 022 66494151
Email - [email protected] www.mcxindia.com

8/3/2019 Rice Bran Oil Report
http://slidepdf.com/reader/full/rice-bran-oil-report 2/8
IntroductionRice bran is a by-product of the rice milling industry. In the first stage of paddy processing thetough outer hulls are removed to produce brown rice or rice with the bran coats intact. In the nextstage the bran coat is removed and the rice is polished, packed and graded for use. The resultingbran is the by-product of the milling process and because of its short lifespan a major portion of itis disposed off without utilizing for human consumption. However, rice bran is an incrediblesource of the vitamins, minerals, amino acids, essential fatty acids and antioxidant nutrients thathelp fight diseases and promote good health.
Typically rice bran accounts for 7 –8 % of the rice produced, when paddy is milled. However, thisproduct has a low shelf life and can be produced economically and hygienically in modern ricemills. In traditional mills, this highly nutritious product is usually wasted. Rice bran is used directlyfor animal consumption. However, the common practice is to extract oil to produce rice bran oil.The recovery of rice bran oil from rice bran is usually 15%. Rice bran oil is used for humanconsumption. It also has several industrial uses. After oil extraction, the by product obtained isde-oiled rice bran. The de-oiled ricebran is primarly used in the manufacture of animal feeds. Oilcan be
Economic ImportanceResearch conducted worldwide has provided significant evidence that rice bran oil has several
characteristics, which makes it healthy oil. The studies conducted in India & abroad haveattributed the cholesterol reducing properties of rice bran oil to the presence of a uniquecomponent in this oil known as "Oryzanol", which is not found in any other edible oil. Theincreasing awareness in the world about its beneficial aspects is increasing the rice bran oilproduction and consumption in the world.
Consumption of rice bran oil is growing stronger, not only for food and nutritional supplements,but also as a specialty ingredient in the cosmetics/personal care market. As demand for natural,value-added, healthy ingredients in both food and cosmetics/personal care markets rises, ricebran oil is gaining attention and the market is becoming increasingly competitive. Rice bran oil asa cooking oil is gaining ground. The primary commercial use of the oil is in upscale snack foodproduction and in restaurants because of its stabiliy at high cooking temperatures and pleasantflavor characteristics.
Global ScenarioRice Bran Oil is extensively used in Japan, Korea, China, Taiwan and Thailand as 'PremiumEdible Oil'. In Japan, Rice Bran Oil is more popularly known as 'Heart Oil'. In Japan, rice ran oil isthe largest-volume domestically produced vegetable oil. Consumption, production and exports ofrice bran oil in Japan have increased in recent years as well because of increased global interest.
Indian ScenarioIndia is the second largest producer of rice in the world next to China, having potential to produceabout 10 lakh tons of ricebran oil per annum. Currently, the industry is processing about 30 lakhtons of ricebran producing about 4.4 lakh tons of ricebran oil per annum, out of which 4.8 lakhtons is of edible grade and the balance 1.2 lakh tons is of non edible grade. The production of de-
oiled rice bran in India is around 30 lakh tons a year.
Rice bran can be produced only in modern rice mills. Only 20% of Indian paddy is milled inmodern mills. They cannot be collected from unorganized mills and this is the major reason forthe production still not reaching the potential. The rice bran from the unorganized mills is wastedas this product is spoiled fast, if not stored well. The processing of rice bran for producingricebran oil and deoiled ricebran has been increasing in the country. Only 1.6 lakh tons was beingprocessed in 1974-75. This increased to 14.1 lakh tons in 1984-85, 27.81 lakh tons in 1994-95

8/3/2019 Rice Bran Oil Report
http://slidepdf.com/reader/full/rice-bran-oil-report 3/8
and 29.61 lakh tons in 2002-03. The corresponding graph, depicts the trends in processing ofricebran in India.
ProductionIndia is the second largest producer of rice in the World and thus it can be the second largestproducer of ricebran oil in the World. The production of ricebran oil in India has been increasingover the years as can be seen from the corresponding graph.
The increase in production has been due to the increasing production of ricebran and itsprocessing. During the initial years of processing of ricebran in India only inedible oil wasproduced in the country. However, now the production of industrial (inedible) ricebran oil is fallingover the years. In 2002-03, India produced 3.45 lakh tons of edible ricebran oil and 0.94 lakh tons
of inedible ricebran oil. The total production was thus 4.39 lakh tons of ricebran oil.
The production of deoiled rice bran has also been increasing at the same pace at which theprocessing of ricebran has been increasing in the country. The corresponding graph displays thetrends in India’s production of de-oiled ricebran.

8/3/2019 Rice Bran Oil Report
http://slidepdf.com/reader/full/rice-bran-oil-report 4/8
Rice Bran Oil Potential & Actual Exploitation(1993-94 to 2001-02)
2001-02
2000-01
1999-00
1998-99
1997-98
1996-97
1995-96
1994-95
1993-94
Paddy ProductionMillion tons
136.50 127.40 135.10 118.60 122.30 120.80 119.40 121.70 120.50
Rice ProductionMillion tons
91.00 84.90 89.70 86.10 82.50 81.70 79.60 81.80 80.30
Total Rice BranPotential, Million tons(7.5% of Rice)
6.38 6.37 6.73 6.46 6.19 6.13 6.00 6.10 6.00
Rice Bran OilPotential, Lakh tons(15% Recovery)
10.20 9.60 10.10 9.70 9.30 9.20 9.00 9.10 9.00
Actual Rice BranProcessing, Lakhtons
36.00 33.00 33.10 32.00 33.00 32.00 32.00 31.07 30.30
RBO ProductionEdible: Lakh tons
Non-Edible: Lakhtons
4.30
1.20
3.80
1.20
3.70
1.30
3.50
1.30
3.50
1.50
3.10
1.70
3.10
1.70
2.70
1.80
2.40
2.00
Total: Lakh tons 5.50 5.00 5.00 4.80 5.00 4.80 4.80 4.50 4.40
Untapped PotentialRice Bran Oil, Lakhtons
4.70 4.80 4.20 4.20 4.30 4.30 4.20 4.50 4.60
Percentage ofExploitation
54% 50% 54% 50% 53% 52% 53% 52% 51%
8/3/2019 Rice Bran Oil Report
http://slidepdf.com/reader/full/rice-bran-oil-report 5/8
Production of Refined Rice Bran Oil(1995-96 to 2001-02)
Year 2001-02 2000-01 1999-00 1998-99 1997-98 1996-97 1995-96
Production 1,75,000 1,50,000 1,35,000 1,23,921 1,13,591 97,558 84,269
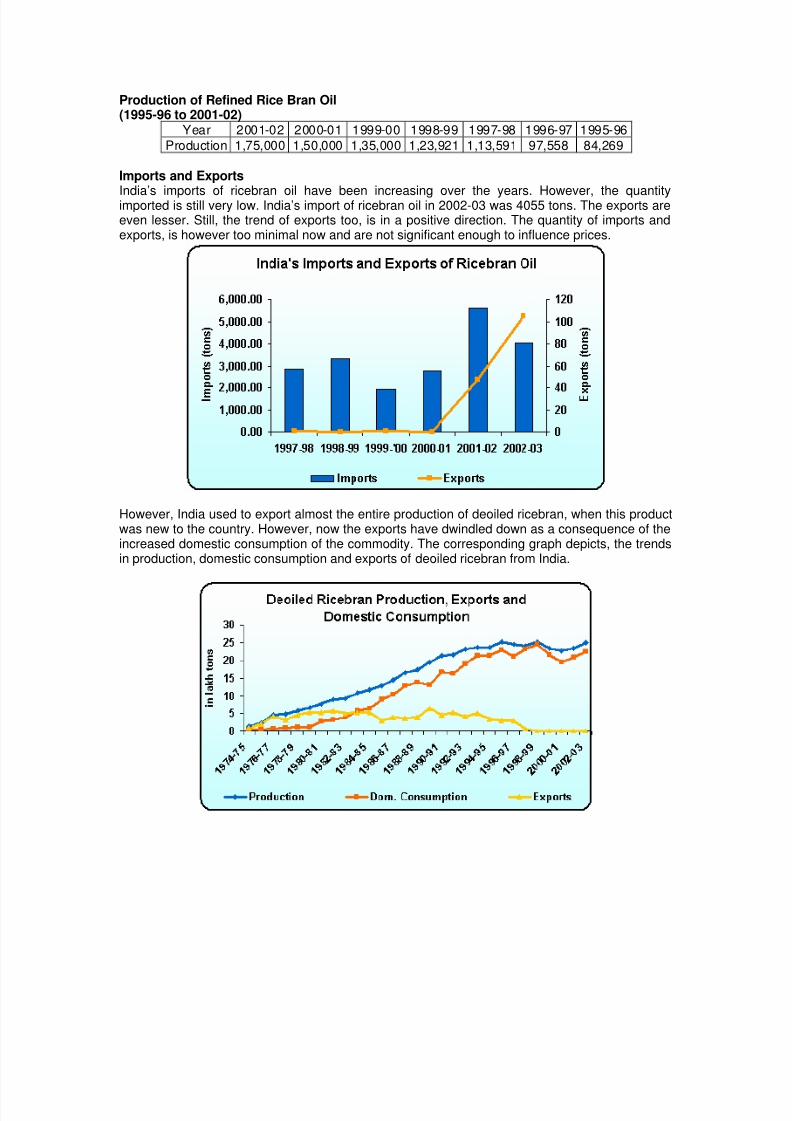
Imports and Exports
India’s imports of ricebran oil have been increasing over the years. However, the quantityimported is still very low. India’s import of ricebran oil in 2002-03 was 4055 tons. The exports areeven lesser. Still, the trend of exports too, is in a positive direction. The quantity of imports andexports, is however too minimal now and are not significant enough to influence prices.
However, India used to export almost the entire production of deoiled ricebran, when this productwas new to the country. However, now the exports have dwindled down as a consequence of theincreased domestic consumption of the commodity. The corresponding graph depicts, the trendsin production, domestic consumption and exports of deoiled ricebran from India.

8/3/2019 Rice Bran Oil Report
http://slidepdf.com/reader/full/rice-bran-oil-report 6/8
AnnexureTable 1
Ricebran Processed in India(lakh tons)
Year Ricebran Processed1974-75 1.6
1975-76 2.65
1976-77 5.4
1977-78 5.66
1978-79 6.8
1979-80 7.865
1980-81 9.22
1981-82 10.6
1982-83 10.9
1983-84 13
1984-85 14.1
1985-86 14.7271986-87 17.284
1987-88 19.405
1988-89 20.925
1989-90 23.404
1990-91 25.35
1991-82 25.534
1992-93 27.53404
1993-94 27.83318
1994-95 27.80677
1995-96 29.73588
1996-97 28.793021997-98 28.47412
1998-99 29.65767
1999-'00 27.59635
2000-01 26.94482
2001-02 27.85051
2002-03 29.61409
Source: Solvent Extractor’s Association of India
Table 2India’s Ricebran Oil Production
(in lakh tons)
Edible Industrial Total
1974-75 0.23 0.23
1975-76 0.36 0.36
1976-77 0.7 0.7
1977-78 0.8 0.8
1978-79 0.025 0.985 1.01
1979-80 0.0245 1.104 1.1285
1980-81 0.04 1.26 1.3

8/3/2019 Rice Bran Oil Report
http://slidepdf.com/reader/full/rice-bran-oil-report 7/8
1981-82 0.1 1.4 1.5
1982-83 0.265 1.26 1.525
1983-84 0.23 1.6 1.83
1984-85 0.192 1.81 2.002
1985-86 0.3285 1.8505 2.179
1986-87 0.9335 1.59 2.5235
1987-88 1.1805 2.179 3.3595
1988-89 1.2465 1.755 3.0015
1989-90 1.41125 2.086 3.49725
1990-91 1.6275 2.068 3.6955
1991-82 1.977 1.6875 3.6645
1992-93 2.06527 1.84612 3.91139
1993-94 2.30917 1.76539 4.07456
1994-95 2.45883 1.5342 3.99303
1995-96 2.59938 1.68402 4.2834
1996-97 2.65689 1.55456 4.21145
1997-98 2.84073 1.36892 4.20965
1998-99 3.05647 1.25287 4.309341999-'00 2.99075 1.10414 4.09489
2000-01 3.05816 1.07089 4.12905
2001-02 3.23131 1.00153 4.23284
2002-03 3.44763 0.93548 4.38311
*- Estimated productionSource: Solvent Extractor’s Association of India
Table 3India’s Deoiled Ricebran Production, Exports and Domestic Consumption
(in lakh tons)
Production Dom. Consumption Exports1974-75 1.37 0.35 1.02
1975-76 2.3 0.35 2.03
1976-77 4.65 0.63 4.02
1977-78 4.81 1.01 3.09
1978-79 5.74 1.1 4.46
1979-80 6.66 1.25 5.287
1980-81 7.8 2.65 5.133
1981-82 9 3.2 5.792
1982-83 9.22 3.9 4.965
1983-84 10.95 5.75 5.205
1984-85 11.93 6.25 5.12
1985-86 12.97 9 2.97651986-87 14.61 10.5 3.896
1987-88 16.498 12.97 3.5275
1988-89 17.4745 13.75 3.9645
1989-90 19.6355 13.25 6.3455
1990-91 21.461 16.9 4.5565
1991-82 21.587 16.38 5.199
1992-93 23.25552 19.14 4.04454

8/3/2019 Rice Bran Oil Report
http://slidepdf.com/reader/full/rice-bran-oil-report 8/8
1993-94 23.5455 21.3 4.97524
1994-95 23.61032 21.44 3.36079
1995-96 25.23658 22.95 3.02398
1996-97 24.439 21.15 2.95212
1997-98 24.09348 23.12 0.74862
1998-99 25.19481 24.56 0.0466
1999-'00 23.34622 21.49 0.0014
2000-01 22.64589 19.56 0
2001-02 23.42171 20.88 0.00287
2002-03 25.08265 22.43 0.00337
*- Estimated productionSource: Solvent Extractor’s Association of India
Table 4India’s Ricebran Oil Imports and Exports
(in tons)
Year Imports Exports
1997-98 2,871.74 0.51998-99 3,347.80 0
1999-'00 1,922.00 0.5
2000-01 2,767.69 0
2001-02 5617.44 47.19
2002-03 4055.83 105
Source: Ministry of Commerce, Govt. of India