rice county study
DESCRIPTION
Rice County StudyTRANSCRIPT

Rice County:
Economic Futures Workshop Final Report
Prepared by: Brigid Tuck
University of Minnesota Extension Center for Community Vitality
with assistance from:
Bruce Schwartau and David Nelson University of Minnesota Extension Center for Community Vitality
November 2009
ECONOMIC IMPACT
ANALYSIS
An Extension Community
Economics Program

2
Copyright © 2009, Regents of the University of Minnesota. All rights reserved. In accordance with the Americans with Disabilities Act, this material is available in alternative formats upon request. Please contact your University of Minnesota Extension office or the Distribution Center at (800) 876-8636. The University of Minnesota Extension is committed to the policy that all persons shall have equal access to its programs, facilities, and employment without regard to race, color, creed, religion, national origin, sex, age, marital status, disability, public assistance status, veteran status, or sexual orientation.

3
The Economic Futures Workshop has been designed by University of Minnesota Extension to assist communities in making informed economic development decisions. The Futures Workshop features the QuickTake 100 which highlights the economic impact in a designated county of 100 jobs in a selected industry. Along with the QuickTake 100, the Futures Workshop also provides an overview of the current economic structure of the county. This report features the QuickTake 100 results and the economic structure of Rice County, Minnesota.
A Primer of Terms Output Output is measured in dollars and is equivalent to total sales. The output measure can include significant double counting. For example, think of corn. The value of the corn is counted when it is sold to the mill, again when it is sold to the dairy farmer, again as part of the price of fluid milk, and then yet again when it is sold as cheese. The value of the corn is built into the price of each of these items and then the sales of each of these items are added up to get total sales (or output). Employment Employment includes full- and part-time workers and is measured in annual average jobs. Total wage and salaried employees as well as the self-employed are included in employment estimates in IMPLAN. Because employment is measured in jobs and not in dollar values, it tends to be a very stable metric. Labor Income Labor income measures the value that is added to the product by the labor component. For example, in the corn example, when the corn is sold, a certain percentage of the sale goes to the farmer for his/her labor. Then when the mill sells the corn as feed to the dairy farmer it includes in the price some markup for its labor costs. When the dairy farmer sells the milk to the cheese manufacturer, he/she includes a value for his/her labor. These individual value increments for labor can be measured. This is labor income. Labor income does not include double counting. Property Income Property income is a computation of the value that accrues due to ownership of property. This includes payments for rents, royalties, and dividends. Direct Impact The direct impact is equivalent to the initial change in the economy. For the QuickTake 100, the direct impact is 100 jobs. Indirect Impact The indirect impact is the summation of changes in the local economy that occur due to spending for inputs (goods and services) by the industry or industries directly impacted. For instance, if employment in a manufacturing plant increases by 100 jobs, this implies a corresponding increase in output by the plant. As the plant increases output, it must also
Introduction
4
purchase more of its inputs, such as electricity, steel, and equipment. As it increases its purchase of these items, its suppliers must also increase its production, and so forth. As these ripples move through the economy, they can be captured and measured. Ripples related to the purchase of goods and services are indirect impacts. Induced Impact The induced impact is the summation of changes in the local economy that occur due to spending by labor by the employees in the industry or industries directly impacted. For instance, if employment in a manufacturing plant increases by 100 jobs, the new employees will have more money to spend to purchase housing, buy groceries, and go out to dinner. As they spend their new income, more activity occurs in the local economy. This can be quantified and is called the induced impact. Total Impact The total impact is the summation of the direct, indirect and induced impacts.
Introduction

5
The following pie chart shows the percent each major industry in Rice County contributed to the overall total output of the county in 2007. Manufacturers in the county produced nearly one-half of the county’s output; compared to the average non-metro county where manufacturing provided only thirty percent of total output. Included in “All Other” are all other industries sectors in Rice County including, but not limited to: agriculture, health and social services, and retail trade. Since output is measured in dollar values and the price of agricultural commodities fluctuates widely from year-to-year, agriculture’s percent of total output can also vary widely by year.
Output by Major Industry Category, Rice County 2007
Manufacturing47%
All Other30%
Construction8%
Government6%
Real Estate / Rental
5%
Educational Services
4%
Definition Note: The educational services industry includes private schools (K-12), private colleges and universities and professional schools (dance studios, beauty schools, etc). Public schools (K-12), and public colleges and universities are included in the government sector.
Rice County Model
6
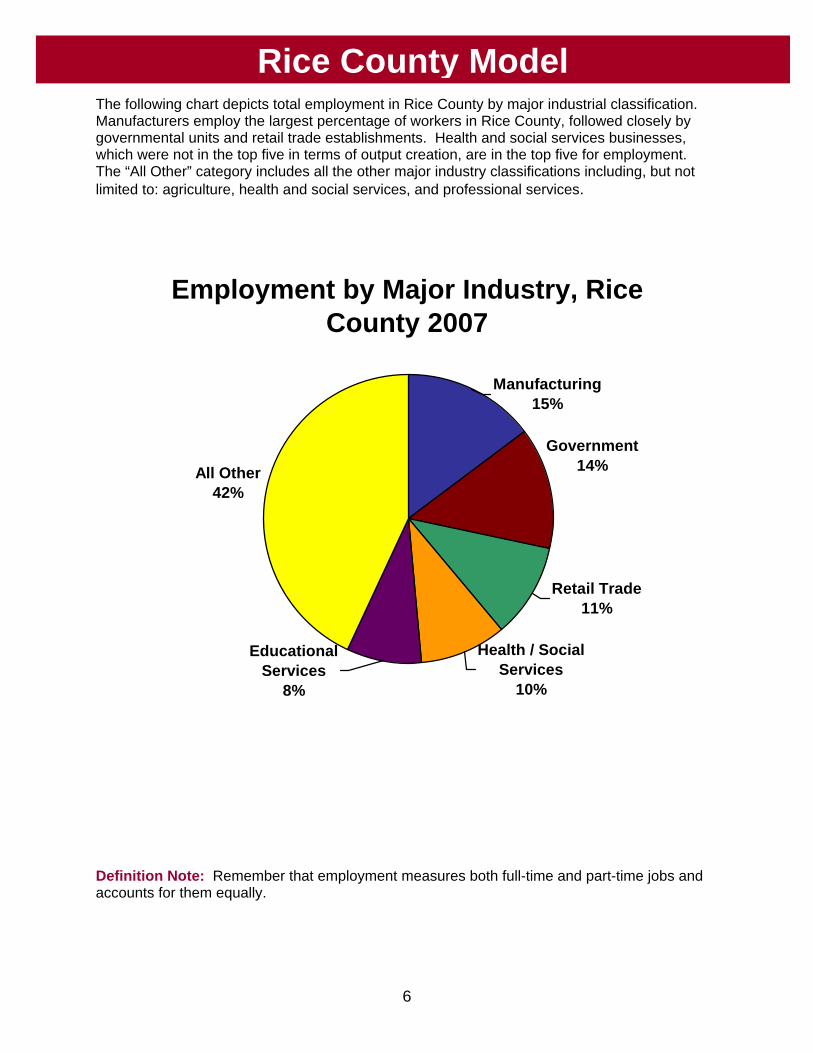
The following chart depicts total employment in Rice County by major industrial classification. Manufacturers employ the largest percentage of workers in Rice County, followed closely by governmental units and retail trade establishments. Health and social services businesses, which were not in the top five in terms of output creation, are in the top five for employment. The “All Other” category includes all the other major industry classifications including, but not limited to: agriculture, health and social services, and professional services.
Employment by Major Industry, Rice County 2007
All Other42%
Manufacturing15%
Government14%
Retail Trade11%
Health / Social Services
10%
Educational Services
8%
Definition Note: Remember that employment measures both full-time and part-time jobs and accounts for them equally.
Rice County Model

7
The following chart shows how each industry classification contributed to labor income in Rice County in 2007. Manufacturers contributed nearly one-quarter of Rice County’s total labor income with fifteen percent of the workforce. This implies a relatively higher wage for manufacturing workers. Concurrently, health and social services businesses employed ten percent of the workforce, but contributed only seven percent of labor income. This implies a relatively lower wage. The “All Other” category includes all the other major industry classifications including, but not limited to: agriculture, health and social services, and professional services.
Labor Income by Major Industry, Rice County 2007
All Other33%
Manufacturing24%
Government18%
Educational Services
9%Construction
9%
Retail Trade7%
Definition Note: Government includes federal, state and local governmental units. It also includes government activities for educational purposes (public K-12 and pubic colleges and universities) and non-educational purposes (county and city governments, for example).
Rice County Model

8
The following table contains the data to support the previous three pie charts. It shows output, employment, and employee compensation for each of the major industry classifications. Output and employee compensation are reported in millions of dollars.
Industry Output* Employment Labor Income* Agriculture, Forestry, Fishing and Hunting 158.1 1,831 25.0Mining 5.2 30 2.0Utilities 24.4 95 5.0Construction 329.1 2,607 101.8Manufacturing 2,066.7 4,608 270.0Wholesale Trade 176.9 1,124 67.6Retail Trade 183.5 3,335 77.5Transportation and Warehousing 70.9 686 24.8Information 57.7 220 10.8Finance and Insurance 132.3 550 26.3Real Estate and Rental 233.8 656 12.6Professional - Scientific and Technical - Services 63.8 660 30.3Management of Companies 15.8 127 4.2Administrative and Waste Services 47.9 543 15.4Educational Services 190.1 2,607 106.5Health and Social Services 148.6 3,007 76.3Arts - Entertainment and Recreation 12.5 348 5.4Accommodation and Food Services 108.2 2,052 33.8Other Services 106.2 1,957 36.6Government and non-NAICS 254.2 4,253 209.7Totals 4,385.9 31,294 1,141.7
*Millions of dollars
Rice County Model

9
The following tables show the top ten industries, as reported by IMPLAN, for Rice County in 2007. This data is reflective of a fixed point in time and may have changed significantly due to changes in the economy since 2007.
Top 10 Industries (Output) 2007 Total Output Percent of
Total Output Breakfast Cereal Manufacturing $537,883,000 12.3%Air Conditioning – Refrigeration – and Warm Air Heating Equipment Manufacturing $352,876,000 8.0%Fruit and Vegetable Canning – Picking – and Drying $271,630,000 6.2%Wholesale Trade Businesses $176,879,000 4.0%Imputed Rental Activity for Owner-Occupied Dwellings $169,331,000 3.9%Private Junior Colleges – Colleges – Universities and Professional Schools $166,521,000 3.8%Poultry Processing $132,849,000 3.0%State and Local Government – Non-Education $109,161,000 2.4%Construction – New Residential $99,700,000 2.3%State and Local Government – Education $95,260,000 2.2%Top 10 Total $2,112,090,000 48.2%All Industries Total $4,385,940,000 100.0%
Definition Note: The imputed rental activity for owner-occupied dwellings industry sector is an estimate of what owner/occupants would pay in rent if they rented rather than owned their home. It is included in the model to ensure consistency in the flow of funds, particularly for the maintenance and upkeep of the home.
Top 10 Industries (Employment) 2007 Total
Employment Percent of
Total Output Private Junior Colleges – Colleges – Universities and Professional Schools 2,026 6.5%State and Local Government – Non-Education 1,952 6.2%State and Local Government – Education 1,782 5.7%Food Services and Drinking Places 1,778 5.7%Nursing and Residential Care Facilities 1,293 4.1%Wholesale Trade Businesses 1,124 3.6%Construction – New Non-residential, Commercial 821 2.6%Offices of Physicians, Dentists, and Other Health Practitioners 755 2.4%Breakfast Cereal Manufacturing 713 2.3%Civic – Social – Professional and Other Similar Organizations 711 2.3%Top 10 Total 12,955 41.4%All Industries Total 31,294 100.0%
Definition Note: Civic-Social-Professional and Other Similar Organizations include a very wide range of activities including: girl scouts, fraternities, civic groups, alumni associations, Chambers of Commerce, business associations, farmers associations, and unions.
Rice County Model

10
The Rice County model provided background for the current state of the Rice County economy. With this in mind, it is now possible to look at the economic impact of 100 jobs in a specific industry. On July 20, 2009, economic development professionals representing each city within Rice County gathered to select industries that they wished to study. In the end, eighteen industries were selected. Those industries are listed below. Glass Manufacturing Surgical/Medical Manufacturing Wind Component Manufacturing Food Manufacturing Circuitry Manufacturing Fabricated Metal Manufacturing Veterinary Pharmaceutical Manufacturing Computer Data Warehousing Computer Software Development Trucking Wholesale Trade Construction Agriculture Agricultural Support Activities Retail Trade – General Retail Trade – Specialized Health Care Health Care Support Activities How to Interpret the Results The next eighteen pages will detail how 100 jobs in each of the selected industries impacts the Rice County economy. Each page features a bar chart highlighting the direct impact of 100 jobs, the indirect and induced impacts created by those 100 jobs, and the top three other industries affected. The number in parenthesis is the number of jobs created by the 100 direct jobs. In addition, each page will feature an important note about the industry and its impacts on the local economy. Each page will also report how much output and labor income is generated (including direct, indirect, and induced impacts) by 100 jobs in that industry. Finally, each page will have a bar chart that shows how many jobs in the industry currently exist in the county and illustrates how 100 jobs will change overall industry employment.
Selected Industries
Economic Impact of 100 Jobs
7 15
100 122
0
2040
6080
100120
140
Direct Indirect Induced Total
Jobs
Balance Ag/Forestry/Fish (8) Real Estate (3) Retail Trade (2)
Top three industries
affected by 100 jobs
11
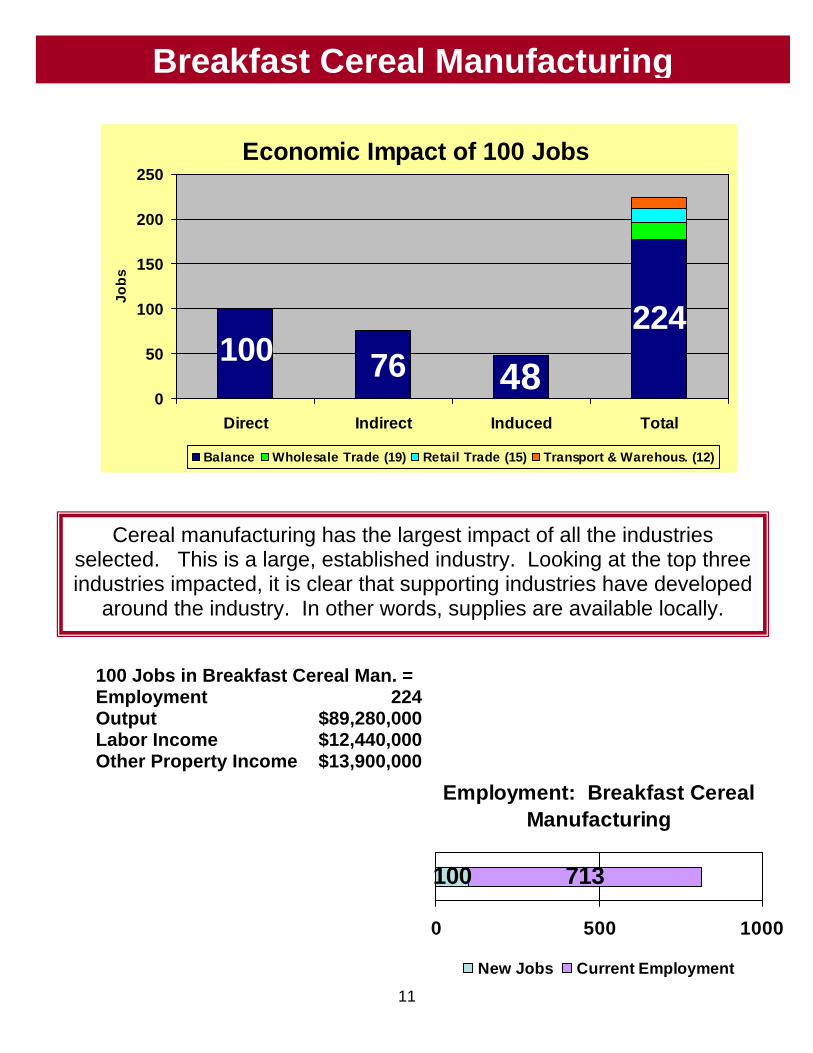
100 Jobs in Breakfast Cereal Man. = Employment 224Output $89,280,000Labor Income $12,440,000Other Property Income $13,900,000
Breakfast Cereal Manufacturing
Economic Impact of 100 Jobs
224 100 76 48
0
50
100
150
200
250
Direct Indirect Induced Total
Jobs
Balance Wholesale Trade (19) Retail Trade (15) Transport & Warehous. (12)
Cereal manufacturing has the largest impact of all the industries selected. This is a large, established industry. Looking at the top three industries impacted, it is clear that supporting industries have developed
around the industry. In other words, supplies are available locally.
Employment: Breakfast Cereal Manufacturing
100 713
0 500 1000
New Jobs Current Employment

12
100 Jobs in Glass Manufacturing = Employment 184Output $25,754,224Labor Income $10,139,154Other Property Income $4,850,000
Glass Manufacturing
Economic Impact of 100 Jobs
39 45 100 184
020406080
100120140160180200
Direct Indirect Induced Total
Jobs
Balance Wholesale Trade (9) Retail Trade (11) Manufacturing (15)
Glass manufacturing demands both inputs and labor. The relatively high indirect inputs imply that some inputs are available locally.
Employment: Glass Manufacturing
100 283
0 200 400 600
New Jobs Current Employment

13
100 Jobs in Surgical/Medical Manuf. = Employment 183Output $33,910,000Labor Income $8,850,000Other Property Income $3,300,000
Surgical/Medical Manufacturing
Economic Impact of 100 Jobs
183 100 49 34
020406080
100120140160180200
Direct Indirect Induced Total
Jobs
Balance Retail Trade (15) Manufacturing (13) Lodging/Food Services (9)
This industry does not currently exist in Rice County, therefore, the indirect effects may be slightly larger than could be expected initially.
Employment: Surgical/ Medical Manufacturing
100 0
0 50 100 150
New Jobs Current Employment
14
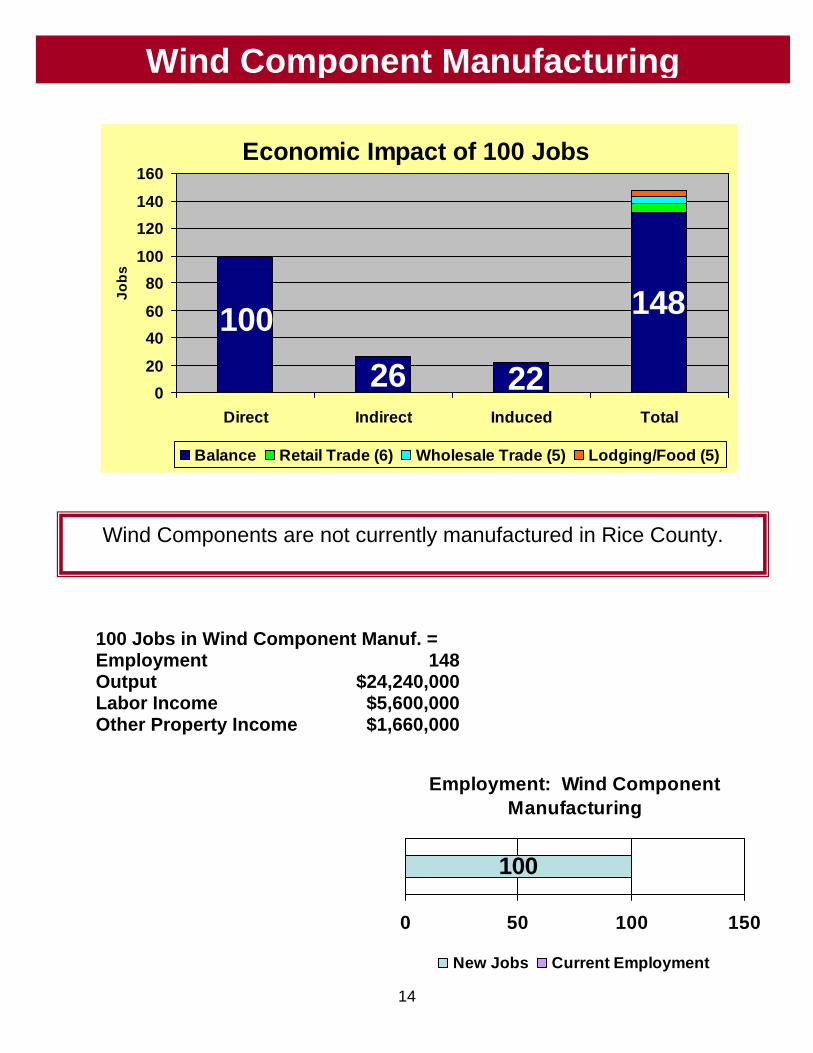
100 Jobs in Wind Component Manuf. = Employment 148Output $24,240,000Labor Income $5,600,000Other Property Income $1,660,000
Wind Component Manufacturing
Economic Impact of 100 Jobs
22 26 100 148
020
4060
80100
120140
160
Direct Indirect Induced Total
Jobs
Balance Retail Trade (6) Wholesale Trade (5) Lodging/Food (5)
Wind Components are not currently manufactured in Rice County.
Employment: Wind Component Manufacturing
100
0 50 100 150
New Jobs Current Employment
15
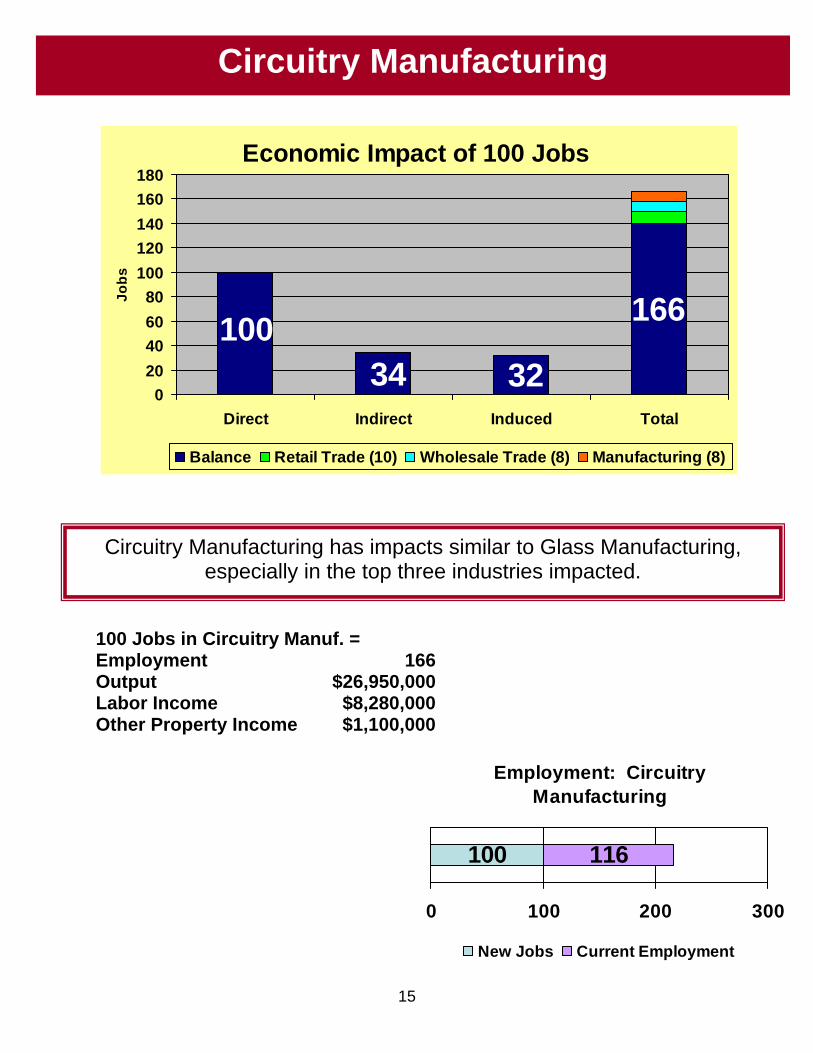
100 Jobs in Circuitry Manuf. = Employment 166Output $26,950,000Labor Income $8,280,000Other Property Income $1,100,000
Circuitry Manufacturing
Economic Impact of 100 Jobs
32 34 100 166
020406080
100120140160180
Direct Indirect Induced Total
Jobs
Balance Retail Trade (10) Wholesale Trade (8) Manufacturing (8)
Circuitry Manufacturing has impacts similar to Glass Manufacturing, especially in the top three industries impacted.
Employment: Circuitry Manufacturing
100 116
0 100 200 300
New Jobs Current Employment

16
100 Jobs in Fabricated Metal Manuf. = Employment 145Output $18,630,000Labor Income $6,830,000Other Property Income $1,690,000
Fabricated Metal Manufacturing
Economic Impact of 100 Jobs
145 100
19 260
20
40
60
80
100
120
140
160
Direct Indirect Induced Total
Jobs
Balance Retail Trade (7) Lodging/Food Srvcs (7) Health/Social Services (5)
Induced impacts are higher than indirect, which is different than other manufacturing thus far. This may be because core supplies to this
industry are not available locally.
Employment: Fabricated Metal Manufacturing
72 100
0 50 100 150 200
Current Employment New Jobs

17
100 Jobs in Veterinary Pharm. Manuf. = Employment 230Output $60,400,000Labor Income $12,300,000Other Property Income $6,000,000
Veterinary Pharmaceutical Manufacturing
Economic Impact of 100 Jobs
230 100 81 49
0
50
100
150
200
250
Direct Indirect Induced Total
Jobs
Balance Wholesale Trade (26) Manufacturing (18) Retail Trade (17)
This industry does not currently exist in Rice County. The indirect effects here could be overestimated, especially initially.
Employment: Veterinary Pharmaceutical Manufacturing
100 0
0 50 100 150
New Jobs Current Employment

18
100 Jobs in Computer Data Ware. = Employment 167Output $26,760,000Labor Income $8,360,000Other Property Income $2,890,000
Computer Data Warehousing
Economic Impact of 100 Jobs
32 35 100 167
020406080
100120140160180
Direct Indirect Induced Total
Jobs
Balance Lodging/Food Svs (12) Retail Trade (9) Health/Social Svs (6)
Although Computer Data Warehousing has a similar overall impact as Circuitry Manufacturing, the distribution of the impacts is very different.
Employment: Computer Data Warehousing
16 100
0 50 100 150
Current Employment New Jobs
19
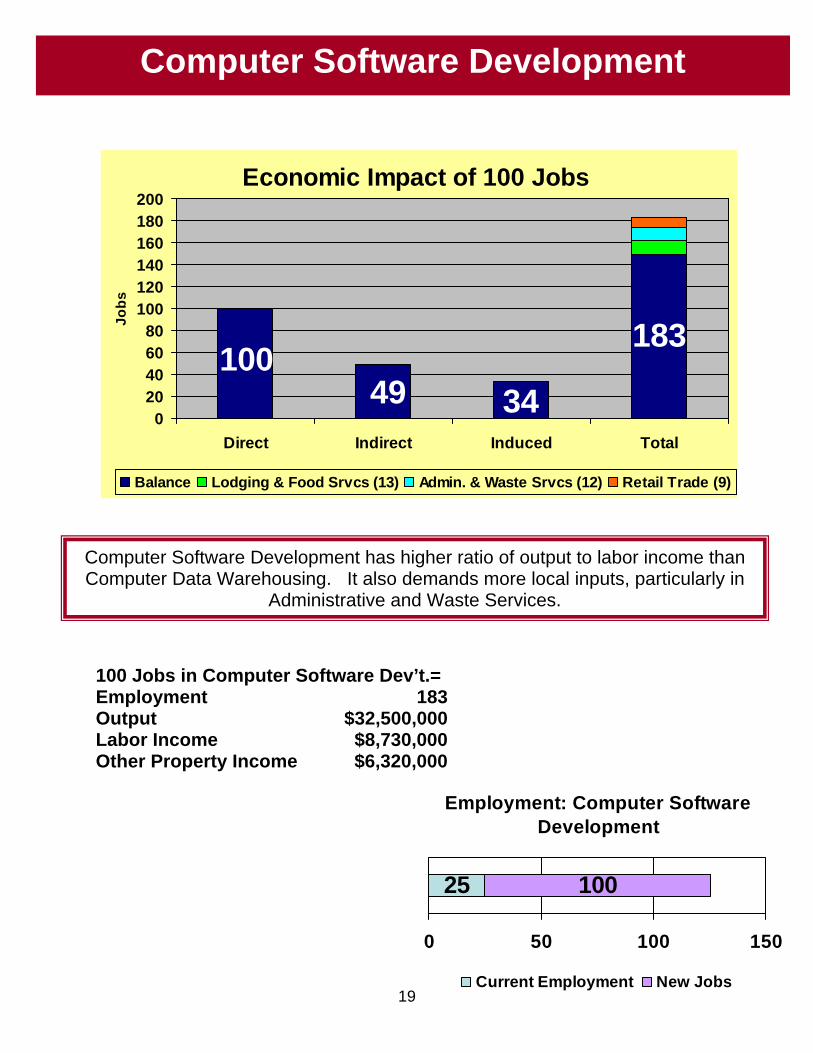
100 Jobs in Computer Software Dev’t.= Employment 183Output $32,500,000Labor Income $8,730,000Other Property Income $6,320,000
Computer Software Development
Economic Impact of 100 Jobs
34 49 100
183
020406080
100120140160180200
Direct Indirect Induced Total
Jobs
Balance Lodging & Food Srvcs (13) Admin. & Waste Srvcs (12) Retail Trade (9)
Computer Software Development has higher ratio of output to labor income than Computer Data Warehousing. It also demands more local inputs, particularly in
Administrative and Waste Services.
Employment: Computer Software Development
25 100
0 50 100 150
Current Employment New Jobs

20
100 Jobs in Trucking= Employment 149Output $16,930,000Labor Income $5,810,000Other Property Income $2,050,000
Truck Transportation
Economic Impact of 100 Jobs
149 100 26 23
020406080
100120140160
Direct Indirect Induced Total
Jobs
Balance Transport & Warehouse (12) Retail Trade (8) Health/Social Srvcs (5)
Truck transportation has impacts that are fairly evenly spread between indirect and induced. Impacts in 2008, due to higher fuel prices, could be significantly different.
Employment: Trucking
100 417
0 200 400 600
New Jobs Current Employment
21
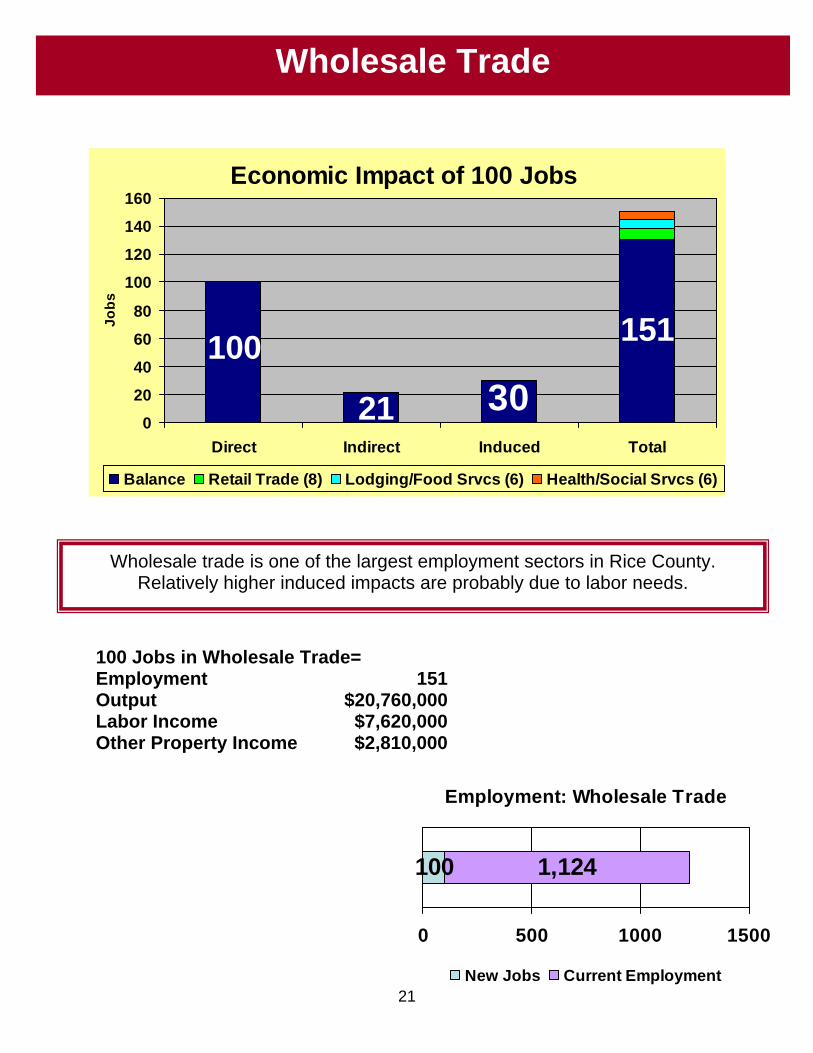
100 Jobs in Wholesale Trade= Employment 151Output $20,760,000Labor Income $7,620,000Other Property Income $2,810,000
Wholesale Trade
Economic Impact of 100 Jobs
151 100
21 300
20
40
60
80
100
120
140
160
Direct Indirect Induced Total
Jobs
Balance Retail Trade (8) Lodging/Food Srvcs (6) Health/Social Srvcs (6)
Wholesale trade is one of the largest employment sectors in Rice County. Relatively higher induced impacts are probably due to labor needs.
Employment: Wholesale Trade
100 1,124
0 500 1000 1500
New Jobs Current Employment
22
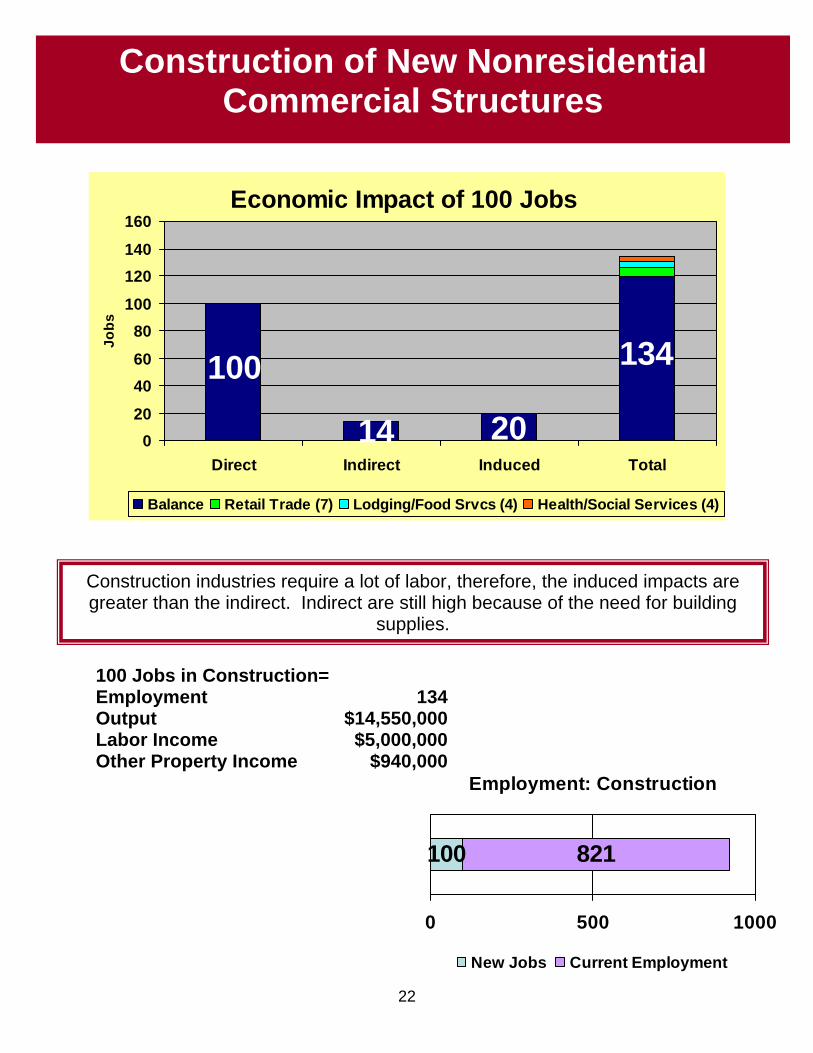
100 Jobs in Construction= Employment 134Output $14,550,000Labor Income $5,000,000Other Property Income $940,000
Construction of New Nonresidential Commercial Structures
Economic Impact of 100 Jobs
20 14
100 134
020
4060
80100
120140
160
Direct Indirect Induced Total
Jobs
Balance Retail Trade (7) Lodging/Food Srvcs (4) Health/Social Services (4)
Construction industries require a lot of labor, therefore, the induced impacts are greater than the indirect. Indirect are still high because of the need for building
supplies.
Employment: Construction
100 821
0 500 1000
New Jobs Current Employment
23
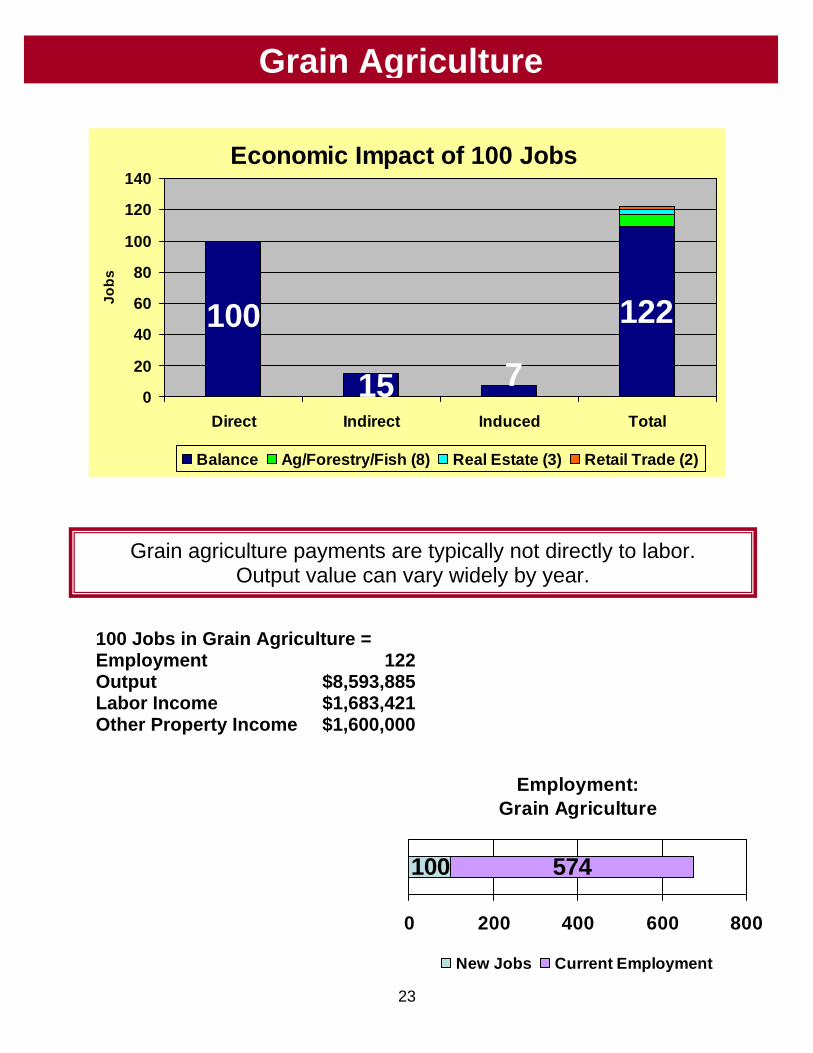
100 Jobs in Grain Agriculture = Employment 122Output $8,593,885Labor Income $1,683,421Other Property Income $1,600,000
Grain Agriculture
Grain agriculture payments are typically not directly to labor. Output value can vary widely by year.
Economic Impact of 100 Jobs
7 15
100 122
0
20
40
60
80
100
120
140
Direct Indirect Induced Total
Jobs
Balance Ag/Forestry/Fish (8) Real Estate (3) Retail Trade (2)
Employment: Grain Agriculture
100 574
0 200 400 600 800
New Jobs Current Employment

24
100 Jobs in Agricultural Support= Employment 115Output $4,180,000Labor Income $3,260,000Other Property Income -$159,000
Agricultural Support Activities
Economic Impact of 100 Jobs
14 1
100 115
0
20
40
60
80
100
120
140
Direct Indirect Induced Total
Jobs
Balance Retail Trade (4) Health and Social Srvcs (3) Lodging/Food (3)
Agricultural support activities are primarily service-based, therefore, high labor income and induced impacts.
Employment: Agricultural Support
100 69
0 50 100 150 200
New Jobs Current Employment

25
100 Jobs in Nursing and Residential= Employment 110Output $3,960,000Labor Income $1,630,000Other Property Income $600,000
Nursing and Residential Care Facilities
Economic Impact of 100 Jobs
110 100
4 60
20
40
60
80
100
120
Direct Indirect Induced Total
Jobs
Balance Lodging/Food Srvcs (2) Retail Trade (2) Health/Social Srvcs (1)
Nursing and Residential Care Facilities are one of the largest industry employers in Rice County. Low impact effects are due to the relative labor-intensity and
relatively low payments to labor.
Employment: Nursing and Residential Care
100 1,293
0 500 1000 1500
New Jobs Current Employment

26
100 Jobs in Medical/Diagnostic= Employment 136Output $15,740,000Labor Income $5,550,000Other Property Income $3,540,000
Medical and Diagnostic Labs and Outpatient Care
Economic Impact of 100 Jobs
136 100 15 21
0
20
40
60
80
100
120
140
160
Direct Indirect Induced Total
Jobs
Balance Retail Trade (6) Lodging/Food Srvcs (6) Health/Social Srvcs (5)
Although also considered “health care”, this industry has larger indirect and induced effects. This is due to the purchase of more supplies, higher payments to
labor and a higher output per worker ratio.
Employment: Medical and Diagnostic
37 100
0 50 100 150
Current Employment 100 Jobs
27
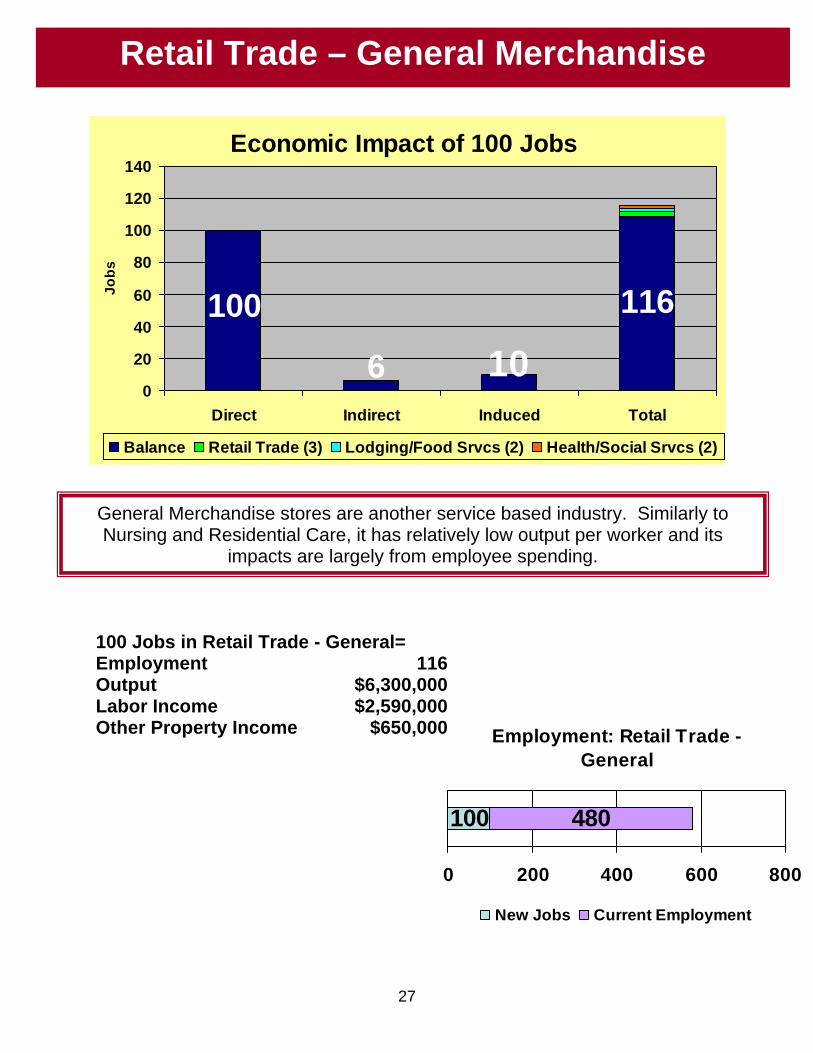
100 Jobs in Retail Trade - General= Employment 116Output $6,300,000Labor Income $2,590,000Other Property Income $650,000
Retail Trade – General Merchandise
Economic Impact of 100 Jobs
116 100
6 100
20
40
60
80
100
120
140
Direct Indirect Induced Total
Jobs
Balance Retail Trade (3) Lodging/Food Srvcs (2) Health/Social Srvcs (2)
General Merchandise stores are another service based industry. Similarly to Nursing and Residential Care, it has relatively low output per worker and its
impacts are largely from employee spending.
Employment: Retail Trade - General
100 480
0 200 400 600 800
New Jobs Current Employment

28
100 Jobs in Retail Trade – Hobby= Employment 111Output $4,300,000Labor Income $1,800,000Other Property Income $530,000
Retail Trade – Hobby, Sporting Goods, Books and Music
Economic Impact of 100 Jobs
111 100
4 70
20
40
60
80
100
120
Direct Indirect Induced Total
Jobs
Balance Retail Trade (2) Lodging/Food Srvcs (1) Health/Social Srvcs (1)
Specialty retail stores, such as hobby, sporting goods, book and music stores, have impacts very similar to that of general merchandise retailers.
Employment: Retail Trade - Hobby
100 64
0 50 100 150 200
New Jobs Current Employment