rice data systems for sub-saharan africa · silamana barry, ibrahim ouedraogo, julienne traore gue,...
TRANSCRIPT
1
Rice Data Systems for Sub-Saharan Africa: Contribution to the Japan-AfricaRice Emergency Rice Project
Updated Synthesis Report 30 September 2010
Africa Rice Center (AfricaRice) 01 B.P. 2031, Cotonou, BENIN
Tel +229 21 35 01 88 Fax +229 21 35 05 56 www.AfricaRice.org
‘From the People of Japan’

2
In collaboration with the
National Agricultural Research Systems (NARS) and the National Agricultural Statistical Services (NASS) of:
Benin, Burkina-Faso, Cameroon, Côte d’Ivoire, Gambia, Ghana, Guinea, Kenya, Liberia, Madagascar, Mali, Mozambique, Nigeria, Central African Republic, Democratic Republic of
Congo, Rwanda, Senegal, Sierra Leone, Tanzania, Togo and Uganda
lade
Service National
Service Nationaldesdes St
atis
tique
s A
gric
oles
Stat
istiq
ues
Agr
icol
es

3
Acknowledgements
This Synthesis Report is the work of a team of researchers at AfricaRice, the National Agricultural Research Systems (NARS) and the National Agricultural Statistical Services (NASS) in 21 countries across sub-Saharan Africa. The AfricaRice team is led by Aliou Diagne, Impact Assessment Economist and Leader of the Policy and Impact Assessment Program at AfricaRice. The AfricaRice team includes: Sourou Koubadjè Djaton, (Project Coordinator, West Africa Region) Akintunde N Akinnola (Project Coordinator, East Africa Region) Ali A Touré (Research Assistant) Eyram KT Amovin-Assagba (Research Assistant, Statistics and Programming) Ibrahima Bamba (Policy Economist) Perpetue Kouamé (Research Technician, Database Analyst) Didier Y Alia (Research Assistant, Statistics and Programming) Akahoua S N’cho (Research Assistant) In each country the project was implemented jointly by teams of researchers and statisticians from the NARS and the NASS with two focal points (one from the NARS and the other from the NASS) coordinating all in-country activities (national workshops, survey planning and implementation, data entry, processing and report writing). The country focal points are: Benin: Focal points: Laurent Oloukoï and Gilbert Ahouassou Team members: Marcelin Allagbe, Edgard Y Didavi, Patrice Y Adegbola, Abdoulaye Abbas, Delphin O Kouande and Assogba Hodonou Burkina Faso: Focal points: Mathieu Ouedraogo and Richard S Guissou Team members: Dona Dakouo, Souleymane Ouedraogo, Blaise Kaboré, Youssouf Dembele, Silamana Barry, Ibrahim Ouedraogo, Julienne Traore Gue, Drissa Hema, Blaise Kaboré, Bakary Belemou, Sibiri Yameogo, Besolbié Bationo, Y. Ouambi Ameogo and Bila Koumtoubre Cameroon: Focal points: Dorothy Malaa Kenyi and Pierre Nzodjo Team members: François Meppe, Serge Kamgaing, Thimothy Ayissi, Pascal Ngninbeyie and Jean Mfouandou Côte d’Ivoire: Focal points: Sekou Doumbia and Youssouf Traoré Team members: Alphonse Bouet, Ernest Depieu, Karidioula Gabehonry, Kouamé Kouassi, Pierre Koffi, Arsène Aye N’cho and Marie Luise Koffi Tanoe The Gambia: Focal points: Faye Manneh; Mary Mendy and Famara Kolly

4
Team members: Ebram Cham; Bakary Sanyang Ghana: Focal points: Alexander Nimo Wiredu and John Nortey Guinea: Focal points: Diawara Sekou and Aly Condé Team members: Mamadou Billo Barry; Sékou Keita and Thierno Saïdou Diallo Kenya: Focal points: Winfred Koré and Thuranira Elias Gitonga Team members: Researchers from KARI-Kibos, KARI-Mwea, KARI-Matuga, KARI-NARL and KARI-Kissii Liberia: Focal points: Jobson A Momo and Reginald W. Fannoh Team members: Nathaniel S Ketter, Oliver Gayflor R Subah, Daniel S Gbigbi, Kolubah Kortee, Joseph KF Jorkeah, Abibatou T Kroumah, James S Dolo and Joseph Jockeh Madagascar: Focal points: Jean N Randriamora and HL Abel-Rotovo Team member: Raymond Rabeson Mali: Focal points: Boubacar Maïga and Kotié Diakité; Team members: Mbaré Coulibaly and Bocar Dit Sire Ba Nigeria: Focal points: Vivian Ojehomon,; O Ogundele and S. B. Adebayo Team members: Victor Okuruwa, Olupomi Ajayi and Bandele Ogunlana; Central African Republic: Focal points: M Hervé Mbedane and Reginald Bida-Kette Team members: Théodore Oumarou, Alguesh Atim, Rigobert Ngouandji, Arnaud Bertrand Noudjeo, Serge Nzengoyu, Samson Ngarassem and Géneviève Yatangbando Democratic Republic of Congo (DRC): Focal points: Abang Olivier Kinzamba; Robert Ngonde Nsakala Team members: Daniel Dibwe, Francis Nkayilu, Katay Munkwese, Floribert Tshiakatumba, André Mampaka, Henriette Dina Rwanda: Focal points: Chantal Ingabire and Justine Mukayiranga Team members: Innocent Ndikumana, E.René Gasoré and Joseph Mutware Senegal: Focal points: Alioune Dieng and Mamadou Sagna

5
Team members: Abdoulaye Fall Sierra Leone: Focal points: Mahmood Ahmed Nazir and Mohamed Ajuba Sheriff Tanzania: Focal points: Elisha Martine Mkandya and Malemi Nyanda Team members: Togo: Focal points: Tsatsu K Domenyo and EZI Tsogli Team members: Koffi-Tessio, Lébene Kougnenya, Kodjo Dokodjo and Kodjo Labare Uganda: Focal points: Stella Adur, Benard Odur and Mary Frances Nakakawa Team members: Godfrey Asea Mozambique: Focal points: Marcos Langa, Domingos FR Diogo and Anina Manganhelg Team members: David J Megill and Fidélio Salamandane The authors and contributors are grateful to all those who contributed to the success of the activities (see Annex 6 for a full list of all the people who assisted the project in each country). The AfricaRice management provided continuous support to the project. This is a testimony to the Center’s commitment to provide good quality rice data and information, in partnership with the National Agricultural Research and Extension Systems (NARES) and other agencies, for the development of sound rice sector policies. Special thanks are due to Dr Papa A Seck, Director General of AfricaRice and Dr Marco Wopereis, Deputy Director General and Director of Research and Development. The strong support of the 21 NARS directors general and NASS managements made it possible to implement the project. The authors would like to thank the Government of Japan, which funded this project within the framework of the Coalition for African Rice Development (CARD) and the Emergency Rice Initiative with the aim of reinforcing the availability and access to rice statistics and quality rice seeds. This generous financial support is highly appreciated by AfricaRice, NARS partners and all the rice stakeholders of CARD and AfricaRice member countries. Special thanks are due to Mr Ken Tatsuo Fujimura, visiting Senior Advisor to JICA; Mr Hiroyuki Kubota, Executive Advisor to the Director General, Rural Development Department, JICA, and to the Embassy of Japan in Côte d’Ivoire for their strong support. The authors gratefully acknowledge the additional financial support by the European Union with technical support from the International Fund for Agriculture Development. This is part of their continuing support to AfricaRice’s Medium Term Plan project Rice policy and technology impact on food security and poverty reduction. The financial support from EU has in particular made possible the organization of the two review and follow up workshops (one for the Anglophone countries in Addis Ababa, Ethiopia, from 26 to 31 July 2010 and the second one for the

6
Francophone countries in Ouagadougou, Burkina Faso, from 16 to 20 August 2010) to review the draft country reports. Thanks also to the Syngenta foundation which provided financial contribution through the Michigan State University for the Ouagadougou workshop organized for the Francophone countries. The project has benefited from the technical and financial support of the African Development Bank (AfDB) within the framework of its Multinational Program for Statistical Capacity Building in its regional member countries for monitoring MDG implementation and the measurement of results. AfDB funded the project’s methodological workshop held in Abidjan from 27 to 31 July 2009 to address the sample design and harmonization challenges and facilitate the adoption of best practices in agricultural survey by the 21 countries involved in the project. The authors would like to thank Abdoulaye Adam, who facilitated the AfDB funding and provided valuable technical advice during the methodological workshop and the follow up workshop held in Ouagadougou inform 16 to 20 August, 2010 for Francophone countries. The authors also thank Tiral Sidi and Bakary Sacko (the two consultants statisticians hired for the Abidjan methodological workshop), Ibnou Dieng (who represented AGRHYMET in the Abidjan workshop) and Eric Crawford and Boubacar Diallo (who represented Michigan State University in the Ouagadougou workshop) for their technical inputs.

7
DISCLAIMER This is a report of a work in progress. It contains summary descriptive statistics of part of the data collected, aggregated across countries along with a cross- country comparative descriptive analysis that incorporate the results and analyses contained in the individual country reports. The synthesis report is based on updated datasets and revised reports from the countries. The results and analyses presented in the synthesis report and country reports should be considered provisional as the data is still being cleaned by the country and AfricaRice teams. Hence, at this moment care must be taken when using or referring to any statistics in the report. Data cleaning is expected to continue for at least six more months before the final country and synthesis reports are published with the definite results. All the information generated through the project activities are being posted on the project website. The information posted on the project web site will be continuously updated as corrections are made to the data. The final project report will also be posted on the project web site. Also, the data will be made publicly available when it is fully cleaned. Inquiries and /or requests for data and information can be addressed to the NARS of each country or to the project coordinating unit at AfricaRice.
8
Table of Contents
Acknowledgements .......................................................................................................................... 3 Table of Contents ............................................................................................................................. 8 List of Tables .................................................................................................................................. 10 List of Figures ................................................................................................................................ 11 Abbreviations ................................................................................................................................. 12 Rice data system for sub-Saharan Africa: Contribution to the Japan-AfricaRice Emergency Rice Project ............................................................................................................................................. 13 Executive Summary ....................................................................................................................... 13 Introduction .................................................................................................................................... 15 Part I ............................................................................................................................................... 17 Chapter 1 General information on Africa ...................................................................................... 18 1.1 Importance of rice .................................................................................................................... 18 Chapter 2 Strengthening the availability and access to rice Statistics for sub-Saharan Africa: A contribution to the Emergency Rice Initiative ............................................................................... 19 2.1 The Project ......................................................................................................................... 19 2.1.1. Background .......................................................................................................................... 19 2.1.2. Objectives ............................................................................................................................. 20 2.1.3. Expected outputs .................................................................................................................. 21 Chapter 3 Methodological background and achievements of the project ..................................... 22 Introduction .................................................................................................................................... 22 3.1. Organization and Project Implementation Steps ..................................................................... 23 3.1.1. The project launching workshops ........................................................................................ 25 3.1.2 Training workshop on agricultural survey methodology ...................................................... 26 3.1.3 Review and planning workshops ........................................................................................... 26 3.2. Implementation of national surveys for data collection ..................................................... 27 3.2.1. Sampling design ................................................................................................................... 27 3.2.2. Planning and implementation of data collection ............................................................ 28 3.2.3. Data processing (data entry, treatment and analysis) ..................................................... 29 3.3. Achievements by activity ........................................................................................................ 29 3.3.1. Institutional and Administrative Issues ................................................................................ 35 3.3.2. Logistical issues ................................................................................................................... 35 3.3.3. Project activity 1: Capacity building and training ................................................................ 35 3.3.4. Project activity 2: Harmonize rice data collection methodologies ....................................... 36 3.3.5. Project Activity 3: Collect, process, analyze and publish updated rice statistical data in 21 countries in Sub-Saharan Africa. ................................................................................................... 36 3.4. Major difficulties and lessons learned ..................................................................................... 37 3.5. Future activities ....................................................................................................................... 40 Part II .............................................................................................................................................. 41 Results of the Surveys .................................................................................................................... 41 Chapter 4 Results of the surveys ................................................................................................... 42 4.1. Socio-demographic characteristics .......................................................................................... 42 4.1.1. Distribution of the heads of the rice farming households by gender ................................... 42 4.1.2. Distribution of the heads of the rice farming households by age and gender ...................... 43 4.1.3. Distribution of the heads of the rice farming households by marital status and gender ...... 44 4.1.4. Household size ..................................................................................................................... 45

9
4.2. Area and variety ...................................................................................................................... 46 4.2.1. Area cropped by gender ....................................................................................................... 46 4.2.2. Varieties by field size ........................................................................................................... 47 4.3. Yield ........................................................................................................................................ 48 4.3.1. Average yield by ecology and type of variety (t/ha) ............................................................ 48 4.3.2. Average yield by country and ecology (t/ha) ....................................................................... 48 4.3.3. Average yield by country and type of variety (t/ha) ............................................................ 49 4.4. Constraints by category ........................................................................................................... 50 4.4.1. Major constraints in irrigated ecology ................................................................................. 50 4.4.2. Major constraints in upland ecology .................................................................................... 51 4.4.3. Major constraints in lowland ecology .................................................................................. 52 4.4.4. Major constraints in mangrove ecology ............................................................................... 53 Information dissemination and publishing through Google Maps ................................................. 54 Annex 1: Distribution of rice farmers (%) by country, age and gender ......................................... 57 Annex 2: Distribution of rice farmers (%) by country and marital status ...................................... 58 Annex 3: Schedule (monthly timetable) ......................................................................................... 59 Annex 4: Sampling design and sample size for the 21 countries ................................................... 61 Annex 5: Focal point/ representation by country ........................................................................... 64 Annex 6: Full list of contributors by country ................................................................................. 71

10
List of Tables
Table 1 : Sampling method and sample size in the 21 countries ................................................... 27 Table 2: Planning and implementation of data collection .............................................................. 28 Table 3: Monitoring and evaluation of the project in AfricaRice member countries – MOU, funds transfer, and logistics arrangement ................................................................................................. 30 Table 4: Monitoring and evaluation of the project in AfricaRice member countries – status of progress reports .............................................................................................................................. 31 Table 5: Monitoring and evaluation of the project in AfricaRice member countries – status of data collection, entry and analysis ......................................................................................................... 32 Table 6: Monitoring and evaluation of the project in AfricaRice member countries – status of country reports and databases. From 30 April to 30 September 2010 ........................................... 33 Table 7: Major difficulties .............................................................................................................. 37 Table 8: Major lessons learned ....................................................................................................... 39
11
List of Figures
Figure 1: Gender of heads of rice farming households .................................................................. 42 Figure 2: Distribution of the heads of the rice farming households by age and gender, % ........... 43 Figure 3: Marital Status of the heads of the rice farming households ............................................ 44 Figure 4: Distribution of rice farming household size, % .............................................................. 45 Figure 5: Area cropped by gender, % ............................................................................................ 46 Figure 6: Distribution farmers by type of varieties grown and by field size, % ............................ 47 Figure 7: Average yield by country and ecology (t/ha) ................................................................. 48 Figure 8: Major constraints identified in irrigated ecology (percentage of incidence) .................. 50 Figure 9: Major constraints identified in upland ecology (percentage of incidence) ..................... 51 Figure 10: Major constraints identified in lowland ecology (percentage of incidence) ................. 52 Figure 11: Major constraints identified in lowland ecology (percentage of incidence) ................. 53

12
Abbreviations
AfDB African Development Bank AGRA Alliance for a Green Revolution in Africa AGRHYMET Agro-Meteorological and Hydro-Meteorological programme CARD Coalition for African Rice Development CGIAR Consultative Group on International Agricultural Research ERI Emergency Rice Initiative EU European Union JICA Japanese International Cooperation Agency MDG Millennium Development Goals MOU Memorandum of Understanding NARS National Agricultural Research Systems NARES National Agricultural Research and Extension Systems NASS National Agricultural Statistical Services NRDS National Rice Development Strategy TICAD Tokyo International Conference on African Development

13
Rice data system for sub-Saharan Africa: Contribution to the Japan-AfricaRice Emergency Rice Project
Executive Summary The rice data system for sub-Saharan Africa, which is a contribution to the Japan-AfricaRice Emergency Rice Initiative (ERI), is funded by the government of Japan. The project was coordinated at the regional level by Africa Rice Center (AfricaRice) and implemented at national levels by the national focal points. ERI has two components: 1) improving access to quality seed, and 2) building a rice data system for sub-Saharan Africa. Within the framework of the rice data system component, the project is working with the national agricultural research systems (NARS) and the national agricultural statistics services (NASS) in the 21 CARD member countries (Benin, Burkina Faso, Cameroon, Central African Republic, Côte d’Ivoire, Democratic Republic of Congo, The Gambia, Ghana, Guinea, Kenya, Liberia, Madagascar, Mali, Mozambique, Nigeria, Rwanda, Senegal, Sierra Leone, Tanzania, Togo, and Uganda) to collect large detailed rice statistics and information from nationally representative samples. Throughout the course of the project implementation, country focal points have made substantial and active contributions to ensure a smooth coordination of the project in-country activities. The national focal points are from the national agricultural research systems (NARS) and the national agricultural statistical services (NASS) of the countries that are members of the Coalition for African Rice Development (CARD). To ensure an effective communication between the project coordination unit and the countries, an intensive networking was established, which included sending of quarterly progress reports by the countries. After the completion of the data collection for the project, country teams embarked on intensive data entry, processing and analysis in close collaboration with the project coordination unit at AfricaRice. By 30 April 2010, the countries provided the first drafts of country end-of-project technical reports. These draft reports were reviewed and commented by the project coordination unit at AfricaRice. Countries were advised to consider comments and/or revisions made by the coordination unit. Following this interactive process, some countries sent their revised reports. The data collection process is now completed in all countries. The entry and initial cleaning and processing of the data have also been completed in all countries except Tanzania. The coordination unit of the project based at AfricaRice, made tremendous efforts in contributing in data cleaning and quality control after which individual country datasets have been aggregated to perform some technical analyses that enable the computations of the summary statistics presented in this report. The set of databases constitute the foundation for the establishment of a sustainable system of rice statistics and information at both regional and national levels that will contribute to strengthen the capacity of AfricaRice member-states in generating, analyzing, disseminating and accessing information on technologies and rice economies. Most importantly, the in-depth data analysis of these statistics and information will help guide rice policy decisions, monitor and assess the impacts of investments made in the domestic rice sector.

14
Overall, the implementation of the project activities went well and it demonstrated the feasibility of building long-term collaborative working relationships between several national stakeholders to sustainably develop a multipurpose rice data systems. However, it is worthwhile to point out to a few shortfalls and internal operational difficulties faced by a few countries, although they were quickly corrected with the active technical assistance of the project coordination team. Some delays in data collection process were observed (Liberia and Tanzania) and data entry and processing (Uganda, Mozambique, and Rwanda). The present technical report is a synthesis of the project implementation activities in all participating countries and a summary of descriptive statistics and country aggregates based on producer level datasets. The results and analysis presented in the synthesis and country reports should be considered provisional as the data is still being cleaned by the country and AfricaRice teams. Hence, at this moment care must be taken when using or referring to any statistics in the report. Data cleaning is expected to continue for at least six more months before the final country and synthesis reports are published with the definite results.

15
Introduction The Government of Japan, within the framework of the Yokohama Action Plan adopted during the Fourth Tokyo International Conference on African Development (TICAD IV) in 2008, pledged to enhance Africa’s capacity to increase food production and agricultural productivity. Specifically, the Japanese Government committed itself to help African countries double their domestic rice production over the next 10 years. To achieve this goal, the Japanese Government through the Japan International Cooperation Agency (JICA), and in partnership with the Alliance for a Green Revolution in Africa (AGRA), launched the Coalition for African Rice Development (CARD). CARD is a consultative group of donors, research institutions and other organizations aiming to promote rice cultivation in Africa by sharing information, coordinating and harmonizing existing initiatives and projects, and advocating further investment. During the first CARD General Meeting in Nairobi, a group of 21 countries in sub-Saharan Africa that needed development assistance were identified. These countries received support to develop their own national rice development strategies. The Government of Japan funded the Emergency Rice Initiative (ERI) project in this context. ERI has two components: 1) improving access to quality seed, and 2) building a rice data system for sub-Saharan Africa. Within the framework of the rice data system component, the project is working with the national agricultural research systems (NARS) and the national agricultural statistics services (NASS) in the 21 CARD member countries (Benin, Burkina Faso, Cameroon, Central African Republic, Côte d’Ivoire, Democratic Republic of Congo, The Gambia, Ghana, Guinea, Kenya, Liberia, Madagascar, Mali, Mozambique, Nigeria, Rwanda, Senegal, Sierra Leone, Tanzania, Togo, and Uganda) to collect large detailed rice statistics and information from nationally representative samples. Throughout the course of the project implementation, country focal points have made substantial and active contributions to ensure a smooth coordination of the project in-country activities. The national focal points are from the national agricultural research systems (NARS) and the national agricultural statistical services (NASS) of the countries that are members of the Coalition for African Rice Development (CARD). At the regional coordination level hosted by AfricaRice through its Program 4 (Policy/Impact), active backstopping and monitoring missions were conducted by the Program 4 leader and staff involved in the implementation of the project activities. The project coordinating unit staff members visited each country at least once keeping in tune with the general monitoring framework. These monitoring missions helped the team to interact with country partners on project implementation, and to learn lessons while the project activities were evolving. The various field experiences provided insights for a future multi-country rice data collection project. To ensure an effective communication between the project coordination unit and the countries, an intensive networking was established, which included sending of quarterly progress reports by the countries.

16
Over the course of the project, two regional launching workshops and one methodological workshop were organized for the country participants. The methodological workshop (held in Abidjan, Côte d’Ivoire) was jointly organized with the Centre National de Recherches Agronomiques de la Cote d’Ivoire (CNRA) and the Regional Center of AGRHYMET, and funded by the African Development Bank (AfDB). At the end of the project activities, two additional workshops titled Strengthening the availability and access to rice statistics for Sub-Saharan Africa: Review and follow up activities were organized. One was for the Anglophone countries and the second one for the Francophone countries. The workshop for the Anglophone countries took place in Addis Ababa (Ethiopia) from 26 to 31 July 2010 and the one for the Francophone countries was held in Ouagadougou from 16 to 22 August 2010. Both workshops were made possible with financial contribution from the European Union while the Syngenta Foundation provided financial contribution through the Michigan State University for the workshop organized for the Francophone countries. In both Ethiopia and Burkina Faso, the NARS provided their full support for the events. The surveys helped the countries develop well-structured rice statistical databases. Overall, the project activities went well and the national surveys were successfully conducted in the majority of the countries leading to the development of up-to-date and accessible rice data and information. In fact, as future project activities, the country teams will work to conduct in-depth analysis of the data collected in this project to update the national rice development strategies (NRDS), conduct rice research priority setting exercises and publish papers and policy briefs. AfricaRice discussed with the main donor in Japan who accepted that in-depth analysis of the data collected can continue after 30 April 2010, to publish the data in a Google Map and transform the country reports into final and more comprehensive reports. The present technical report is a synthesis of the project implementation activities in all participating countries and a summary of major descriptive statistics and country aggregates. This report has two parts. The first part is subdivided into three chapters. Chapter 1 provides some general information on Africa. Chapter 2 presents the project titled Building a rice data system for sub-Saharan Africa: A contribution to the Emergency Rice Initiative. Chapter 3 provides the methodological background and achievements of the project. Part II gives findings from the surveys conducted (Chapter 4). The last section presents the annexes.

17
Part I

18
Chapter 1 General information on Africa
1.1 Importance of rice In 2008, Africa produced an estimated quantity of 23 million tonnes of paddy rice on 9.5 million hectares (FAOSTAT, accessed April 2010). Western, Northern and Eastern African regions had the biggest shares with 10.2 million tonnes, 7.3 million tonnes, and 5 million tonnes, respectively. These quantities of paddy were harvested on 5.8 million hectares, 0.76 million hectares and 2.4 million hectares in Western, Northern and Eastern Africa regions respectively. Among African staple food grains, the consumption of rice has been growing the fastest and it is the first source of food calorie in West Africa. Rice consumption increased at a rate of 4.5% while rice production grew at 3.2% per year between 1961 and 2006. The high increase in rice consumption is not limited to West Africa as high rice consumption growth rate has also been recorded in Eastern and Southern Africa. In Mozambique, for instance, rice consumption grew at a yearly rate of 15% during 1990-2005 with little increase in domestic production (Kajisa and Payongyong, 2008). Africa’s rice production has not been able to match the growth in demand. Rapidly rising imports (8.4% increase every year since 1997) have been filling the widening gap between regional supply and demand. This rapid growth in imports was estimated at 3.77 % in 2001-2006. In 2009, paddy rice production in Africa was 24.5 million tonnes (nearly 16 million tonnes of milled rice) and 9.6 million tonnes was imported, which is a third of the volume of rice traded in the global market (FAO Rice Market Monitor, 2009). In fact, Nigeria, South Africa, Côte d’Ivoire, and Senegal rank among the world’s ten leading rice importing countries. Nearly 40% of the rice consumed in Africa is imported. With such high dependence on imports, Africa is highly exposed to international market shocks with grave consequences for its food security and political stability as demonstrated to by events during the 2008 food crisis.

19
Chapter 2 Strengthening the availability and access to rice Statistics for sub-Saharan
Africa: A contribution to the Emergency Rice Initiative
2.1 The Project
2.1.1. Background Global rice stocks are at their lowest level since 1983/1984 and African countries can no longer rely on imports from Asia to feed their growing populations. Food, fuel and fertilizer prices soared in 2008 and riots to protest the vastly increased cost of living were reported from several of Africa’s major cities. Rice is particularly vulnerable as it is one of the two main crops (along with wheat) that show a huge deficit between local supply and demand. In 2006, sub-Saharan African countries imported about nine million tonnes, costing more than US$ 2 billion. At current rice prices, these imports would cost more than US$ 6 billion. Urgent action is needed to ensure that African countries will have enough rice to feed their rural and urban populations. The Government of Japan, within the framework of the Yokohama Action Plan adopted during the Fourth Tokyo International Conference on African Development (TICAD IV) in 2008, pledged to enhance Africa’s capacity to increase food production and agricultural productivity. Specifically, the Japanese Government committed itself to help African countries double their domestic rice production over the next 10 years. To achieve this goal, the Japanese Government, through the Japan International Cooperation Agency (JICA), and in partnership with the Alliance for a Green Revolution in Africa (AGRA), launched the Coalition for African Rice Development (CARD). CARD is a consultative group of donors, research institutions and other organizations aiming to promote rice cultivation in Africa by sharing information, coordinating and harmonizing existing initiatives and projects, and advocating further investment. During the first CARD General Meeting in Nairobi in 2008, a group of 21 countries in sub-Saharan Africa that needed development assistance were identified. These countries received support to develop their own National Rice Development Strategies (NRDS). For the sub-Saharan African countries to fully achieve their potential for rice production it is critical to have adequate and reliable information on their rice economies, to help formulate appropriate strategies and policies. The Africa Rice Center (AfricaRice) launched an initiative in December 2007 which is designed to improve the timely availability, reliability and relevance of rice statistics and information needed for quality rice research, evidence-based policy formulation, and monitoring and evaluation of rice related investments in sub-Saharan Africa (SSA). The initiative was implemented in collaboration with the national agricultural research systems (NARS), the national agricultural statistics services (NASS), the African Development Bank (AfDB), AGRHYMET and other regional stakeholders. The Government of Japan funded the Emergency Rice Initiative (ERI) project in this context. ERI has two components: 1) improving access to quality seed, and 2) building a rice data system for sub-Saharan Africa.

20
The project worked with NARS partners in the 21 CARD member countries (Benin, Burkina Faso, Cameroon, Central African Republic, Côte d’Ivoire, DR Congo, The Gambia, Ghana, Guinea, Kenya, Liberia, Madagascar, Mali, Mozambique, Nigeria, Rwanda, Senegal, Sierra Leone, Tanzania, Togo, and Uganda) to collect detailed rice statistics and information from nationally representative samples. In addition to collecting nationally representative rice data, the project has contributed to strengthening the capacity of NARS and NASS in designing and implementing surveys to collect detailed and reliable crop-specific data for rice from nationally representative samples. In most cases the samples currently used in the annual national crop surveys do not allow the collection of nationally representative crop-specific statistics in general and rice statistics in particular. For that to be possible, new sample frames and sampling methodologies were required in most countries. Another important achievement of the project was the harmonization of the various sampling methodologies and survey instruments used in the different countries. This harmonization of the methodologies was necessary in order to perform some cross- country aggregations and comparative analyses. The synthesis report includes the main results from countries (descriptive summary results) and analysis of the aggregated data pooled across the 21 countries. The harmonization of the sampling methodologies took into account theoretical and practical statistical considerations (such as selection of the appropriate sample frames, stratification method, probability sampling, multistage cluster sampling, etc.) as well as cost and crop specific constraints. This methodological task was the subject of a regional workshop that was attended by all participating countries and AGRHYMET, Niger, and a representative from the AfDB.
2.1.2. Objectives
The project addressed the need for better quality rice data in all of the 21 CARD countries to support the implementation and monitoring of national rice development strategies through various activities. The specific objectives of the project were to:
1. Strengthen the capacity of national agricultural statisticians and NARS scientists on best practices on agricultural survey design, sampling methodology for rice data collection and statistical analysis and publication. This was done through the organization of training courses for Anglophone and Francophone participants.
2. Harmonize rice data collection methodologies. 3. Collect, process, analyze and publish updated rice statistical data in 21 countries in sub-
Saharan Africa. 4. Publish policy briefs based on these data

21
2.1.3. Expected outputs
1. Scientists, agricultural extension agents and agricultural statisticians from the national agricultural research and extension systems (NARES) of the CARD candidate countries trained in implementing common rice data collection methodologies (total of 42 people).
2. Rice data collection methodologies and questionnaires harmonized across CARD member
countries. 3. Updated and reliable rice data (relevant data on ecologies, varieties, farmers’
characteristics, source of income and cost production) available for CARD member countries.
4. Policy briefs, which will help guide rice policy decisions monitor and assess the impacts of
investments, developed for the domestic rice sector. .

22
Chapter 3 Methodological background and achievements of the project
Introduction
As part of the launching of the project activities, two successive workshops were organized for the Francophone and Anglophone countries. The launching workshops enabled experts to consult on the best practices for data collection, rice survey design, and framework for organizing and analyzing the data collected. The workshops permitted country participants to share general information about their countries. The participants also recounted their experience on the methodological steps taken to gather agricultural data and information. The workshops also enabled discussions on the different approaches that can be taken to facilitate the inclusion of the emergency rice data collection activities within the existing data collection system. Another important achievement was the drafting of the work plans and budgets for the respective countries to initiate activities on the ground. The major events of the launching workshops were: official opening ceremony, keynote presentations, country’ presentations, group sessions, country action plans, development of budgets and roundtable discussions. The group sessions discussed the standard structure of survey questionnaires and sampling methods, plenary sessions discussed the outcomes of the group sessions, and country team sessions developed country work plans and budgets. The aim of the round table was to share views and perspectives from different practitioners on the subject. The roundtable gathered panelists from the NASS, NARS, and the CGIAR. A methodological workshop was also organized to provide a theoretical background for the design of appropriate sampling methods and procedures for collecting nationally representative data. To achieve the objectives of the workshop, two expert statisticians with good theoretical backgrounds in survey statistics and extensive experience in implementing agricultural surveys in developing countries were invited to serve as resource persons. The expert statisticians elaborated a technical document that was circulated to all country participants. The countries prepared their action plan and conducted the in-country surveys with technical support and assistance from the regional coordination unit at AfricaRice, Cotonou (Benin), and Dar Es Salam (Tanzania). Monitoring and evaluation missions were undertaken in the various countries during project activities implementation stages. In addition, active networking was maintained between the coordination units with all participating countries. Technical documents and statistical tools were prepared by the coordination unit and sent to the country focal points to assist them in data processing and analysis, and technical report writing.
23
3.1. Organization and Project Implementation Steps In line with the project’s objectives, the methodology used was structured into several important steps:
1. Preparation of the detailed project work plan and hiring of the project coordinators and their research assistants.
2. Organization of initial technical consultative workshops (launching workshops). 3. Follow up on the major outcomes of the initial technical consultative workshops. 4. Organization of national consultative workshops. 5. Organization of the regional methodological workshop. 6. Implementation of national surveys for data collection (pre-testing and review of
questionnaires, training of field enumerators and conduct of the survey). 7. Technical assistance provided by AfricaRice in various aspects:
a. Review of pre-tested questionnaires in countries; b. Development of data entry templates using Access software for countries; c. Development of standardized outline for the country reports in French and English
along with a tabulation plan; d. Stata programs to clean the data, produce the tables and perform the statistical
analyses; e. Field missions for monitoring project activities and provide technical backstopping for
data entry and analysis; and f. On-line technical assistance was also provided on a request basis.
The project was designed to be executed jointly by the NARS and the NASS. The project was designed to build a close and durable collaboration between the NARS and the NASS in each country to ensure regularity in data collection. The responsibilities of each of the two national partners were clearly delineated and assigned with the corresponding budget to manage as follows: 1. Overall project coordination was the responsibility of the NARS 2. Design of the survey, data collection and processing was done by the NASS 3. Adaptation of the questionnaire and training of enumerators were the joint responsibility of
both partners through a team of NARS rice researchers and NASS statisticians.

24
4. Data analysis (descriptive analysis and interpretation of results) and publication were also the joint responsibility of both partners and, in most cases, was performed by the same team of NARS rice researchers and NASS statisticians.
In each country, two focal points were nominated: 1) an economist and 2) a statistician to coordinate the project activities and work directly with the projects regional coordinators based in Cotonou, Benin, and Dar es Salaam, Tanzania. AfricaRice provided the standard questionnaires (divided into several modules), which were adapted by each country team to its specific needs even while maintaining the coherence and comparability of the data collected across countries. Each country team conducted its own data analysis to produce the country report. The countries first produced initial draft reports that were reviewed and analyzed by the project coordinating unit. Based on the reviews of the draft reports, comments and suggestions were made to the partners for improving the quality of the final reports. Updated and revised reports, including databases, were received from the countries. AfricaRice bought for each country two licenses of the statistical software Stata, recommended for the analysis of the data. AfricaRice provided a standardized outline for the country reports along with a tabulation plan and Stata programs to clean the data sets, produce the tables, and conduct the statistical analyses.1 The country data sets and reports were sent to AfricaRice for an aggregated and comparative cross-country analysis. Each country was required to produce and disseminate its own reports and briefs. To ensure a wide public dissemination of the project data and information, AfricaRice is actively working on the development of the project website that will make the information generated by the project available in a geo-referenced format using Google Maps. The project’s specialist in computer sciences and data management already made tremendous efforts in making the project web site functional in an interactive manner. Countries can already upload/download data and information on the web site (refer to section 5). AfricaRice signed a Memorandum of Understanding (MOU) with the NARS in each of the 21 countries. An important clause in the MOU requires that at least 53% of the budget be allocated to the data collection and processing activities and this should be given to the NASS to manage. Two other important clauses in the MOU define the data ownership and access rights. In particular, it is stipulated in Article 16 that “the data resulting from the questionnaire called the ‘specialized rice questionnaire’ added to the general questionnaire to cater for the specific needs of the present project are the joint property of the NASS, NARS and AfricaRice”. In article 17, dealing with data access, it is stipulated that “for the needs of analysis and publication, the researchers and students of NARS, AfricaRice, universities and other institutions associated with the present project will have free, unreserved and without prior notification, access to all data collected as part of the present agreement (raw data and cleaned data) and including data derived from the questionnaire called ‘general’ of the permanent agricultural survey”. The MOU also
1 AfricaRice has recommended countries to use either CSPro or Access for data entry and archiving. However the choice is left to the countries to decide (some countries were already using CSPro). AfricaRice will provide the data entry templates to countries using Access.

25
requires NARS and NASS of each country to facilitate access to the data set by researchers not associated with the projects, when they request it.
3.1.1. The project launching workshops AfricaRice Director General sent letters to each NARS director general requesting the nomination of one economist from the NARS and one statistician from the NASS for the launching workshops which took place in Cotonou from 11 to 15 May 2009 (for Francophone countries) and in Dar es Salam from 1 to 5 June 2009, (for Anglophone countries). Since Mozambique did not have representatives in the launching workshops, Dr Aliou Diagne, Program Leader, AfricaRice Policy and Impact Assessment, visited this country in August 2009 to brief the Mozambican NARS and NASS representatives on the objectives, methodology and work plans of the project. The initial technical consultative workshops were organized to officially launch the project and to have country representatives prepare and present their detailed country action plans and budgets. The workshops were also intended to serve as a venue for experts’ consultations on survey design and methodology and for review and exchange of countries’ experiences on survey methodology for rice data collection (data collection tools and sampling techniques, etc.). The economists and statisticians who participated in the launching workshops worked for five days on the survey methodology, questionnaires harmonization, work plans and budgets. The launching workshops’ programs consisted of 1) the presentation of the project objectives, work plans and budgets; 2) individual country presentations on their rice sectors and scope and methodologies of existing agricultural surveys; 3) working group sessions to review the structure and content of the questionnaires and discuss possible sampling methodologies for the rice statistics surveys; 4) country team sessions to develop country work plans and budgets; and 5) plenary sessions to discuss the outcomes of working group and country team sessions. The experiences from the five pilot countries (Burkina Faso, Côte d’Ivoire, Niger, Nigeria, and Senegal) which have established consultative frameworks on rice data harmonization and exchange were also presented in plenary sessions. On the last day of the workshop, a roundtable was organized to share views and perspectives on how to foster in each country an effective and long-term collaboration between the NARS and the NASS. One major outcome of the launching workshops was an agreement on key steps and milestones set for a quick start up of project activities that included the signature of an MOU, the transfer of project funds, and logistical arrangements within each country. This step was very critical as the remaining of the project activities depend entirely on the attention given by countries to the milestones set. Detailed reports for the workshops are available.

26
3.1.2 Training workshop on agricultural survey methodology AfricaRice and the AfDB organized a training workshop on agricultural methodology from 27 to 31 July 2009, in Abidjan, Côte d’Ivoire in collaboration with the Regional Center of AGRHYMET. The main aim of the workshop was to address the sample design and harmonization challenges and to facilitate the adoption of best practices in agricultural survey by the 21 countries involved in the project. The workshop was funded by the AfDB within the framework of its Multinational Program for Statistical Capacity Building in its regional member countries for MDG monitoring and result measurement. The main objectives of the workshop were to: 1) critically review the different sampling methodologies implemented in the 21 countries in 2009 to collect rice data; 2) discuss survey design options for collecting nationally–representative and detailed crop-specific data; 3) recommend sampling methodology guidelines for use in the future for the 21 countries. Besides the participants from the 21 project countries who attended the May and June launching workshops, participants from AGRHYMET and the NARS and NASS of Niger also took part in the workshop. The Methodological Training Workshop lasted for five days. The first two days were devoted to the presentation of sampling methods and design used in each country for rice data collection. The next three days focused on the design of appropriate sampling methods and procedures for collecting nationally representative crop-specific data. Two expert statisticians, with good theoretical backgrounds in survey statistics and experience in implementing agricultural surveys in developing countries, were hired to serve as resource persons for the workshop. The expert statisticians acted as facilitators/instructors during the methodology workshop. The consultants produced a technical manual containing a review of the methodologies followed by the 21 countries and a guideline for conducting such crop-specific surveys.
3.1.3 Review and planning workshops The main objectives of the two review and planning workshops organized for Anglophone countries (from 26 to 31 July 2010 in Addis Ababa, Ethiopia) and for Francophone countries (from 16 to 22 August 2010 in Ouagadougou, Burkina Faso) were: 1) to review past activities and plan for future ones, and 2) to conduct training sessions on policy and impact assessments tools that will be used for future activities two workshops. The specific objectives of these workshops were:
1. To review and discuss the 2009-2010 activities;
2. Initiation into impact assessment and policy analysis tools for further data analysis;

27
3. To familiarize collaborators with statistical tools and methodologies needed for future
activities;
4. Data publication with Google map; and
5. Development of country annual work plan and budget for 2010-2011. The workshops enabled country participants to share with colleagues their country reports and specific information about their countries in the framework of the project. Another important achievement is the progress with the drafting of the respective country work plans and budgets in order to very quickly complete all the activities on the ground and plan for 2010/2011 activities.
3.2. Implementation of national surveys for data collection
3.2.1. Sampling design Table1 presents the various methods and sample sizes used in the countries. In most countries, the 2-level sampling method was used. A few exceptions used 3-level (Liberia and Madagascar) and 4-level sampling methods (Tanzania). Table 1 : Sampling method and sample size in the 21 countries
COUNTRIES SAMPLING METHOD SAMPLE SIZE Benin Sampling at 2 levels 1255 Burkina Faso Sampling at 2 levels 760 Cameroon Sampling at 2 levels 1200 Côte d’Ivoire Sampling at 2 levels 3 325 The Gambia Sampling at 2 levels 370 Ghana Sampling at 2 levels 1120 Guinea Sampling at 2 levels 1085 Kenya Sampling at 2 levels 572 Liberia Sampling at 3 levels 1500 Madagascar Sampling at 3 levels 1606 Mali Sampling at 2 levels 2 495 Mozambique Sampling at 2 levels 492 Nigeria Sampling at 2 levels 10,500 Central African Republic Sampling at 2 levels 2140 Democratic Republic of Congo Sampling at 2 levels 848 Rwanda Sampling at 2 levels 395 Senegal Sampling at 2 levels 1863

28
COUNTRIES SAMPLING METHOD SAMPLE SIZE Sierra Leone Sampling at 2 levels 1300 Tanzania Sampling at 4 levels 1050 Togo Sampling at 2 levels 727 Uganda Sampling at 2 levels 1537
3.2.2. Planning and implementation of data collection The planning and implementation of data collection was conducted in each country according to the initial survey plan. Prior to data implementation, countries conducted in-country stakeholders’ meetings to discuss pertinent issues relating to the organizational and practical execution of the survey. Country teams created a pool of working staff in charge of conducting the surveys. In addition to the project country focal points, the teams were composed of supervisors, controllers, enumerators and data entry clerks (Table 2). All field staff involved in the data collection process benefited from a short training prior to the execution of the activity. Table 2: Planning and implementation of data collection
No. Countries Number Of
Enumerators Controllers Supervisors Data entry
clerks 1 Benin 63 17 8 15 2 Burkina Faso 78 28 9 3 Cameroon 120 16 4 Côte d’Ivoire 5 The Gambia 120 16 6 6 Ghana 165 7 Guinea 78 33 17 10 8 Kenya 60 12 9 Liberia 37 19 10 Madagascar 60 15 6 15 11 Mali 120 28 12 Mozambique 13 Nigeria 112 62 36
14 Central African Republic
72 6 10
15 Democratic Republic of Congo
16 Rwanda 16

29
No. Countries Number Of
Enumerators Controllers Supervisors Data entry
clerks 17 Senegal 18 Sierra Leone 130 13 4 19 Tanzania 105 5 21 20 Togo 25 2 21 Uganda
3.2.3. Data processing (data entry, treatment and analysis) In each country, several data entry clerks were trained in order to efficiently carry out the task of data entry and cleaning (Table 2). Furthermore, countries followed the supporting documents sent to assist them in their data analysis and report writing. Mostly, they made use of the reporting plan and the tabulation plan including the various Stata codes for data transfer, data cleaning, and analysis.
3.3. Achievements by activity
The national surveys for data collection (pre-testing and review of questionnaires, field training of enumerators and conduct of surveys) were implemented by the country teams following the specific work plans of the countries. Major achievements with respect to the outcomes of the various activities conducted to date are presented herewith. Project implementation was not uniform in all countries due to country specificities. The monitoring of the project activities started in September 2009 through a number of country visits made by the leader of Program 4, and the West Africa and East Africa coordinators including AfricaRice Program 4 staff. The monitoring visits were planned and conducted to enable a smooth implementation of project activities and ensure that the project will meet all its objectives. Apart from the field visits, intensive networking and technical dialogues were maintained between AfricaRice and all the project countries focal points. Tremendous efforts were also made by Program 4 staff to coordinate the development of the data entry templates in conformity with the revised questionnaires for the countries. All countries received their data entry templates and the Stata software for data analysis. Moreover, AfricaRice developed several Stata codes to assist the countries with data manipulation and analysis: 1) Stata codes and programs to transfer automatically all Access data files into Stata, 2) Stata codes for data cleaning, and 3) Stata codes to generate all the tables indicated in the tabulation plan. All the 21 countries received both the country reporting plan along with the tabulation plan. The following tables (3, 4, and 5) summarize the project implementation status in all countries. Specifically, Table 3 presents the project logistical arrangements status while Table 4 portrays status of

30
feedback received from countries focal points. Finally, Table 5 provides a summary status of data collection and entry. Table 3: Monitoring and evaluation of the project in AfricaRice member countries – MOU, funds transfer, and logistics arrangement
No. Countries MOU Funds received
Computer purchasing
2 Stata licenses DVD and books
received
1 Benin Yes Yes Yes Yes
2 Burkina Faso Yes Yes Yes Yes
3 Cameroon Yes Yes Yes Yes
4 Central African Republic Yes Yes No Yes
5 Côte d’Ivoire Yes Yes Yes Yes
6 Democratic Republic of Congo (DRC) Yes Yes Yes No2
7 The Gambia Yes Yes Yes Yes
8 Ghana Yes Yes Yes Yes
9 Guinea Yes Yes Yes Yes
10 Kenya Yes Yes Yes Yes
11 Liberia Yes Yes Yes Yes
12 Madagascar Yes Yes Yes Yes
13 Mali Yes Yes Yes Yes
14 Mozambique Yes Yes Yes Yes
15 Nigeria Yes Yes Yes Yes
16 Rwanda Yes Yes Yes Yes
17 Senegal Yes Yes Yes Yes
18 Sierra Leone Yes Yes Yes Yes
19 Tanzania Yes Yes Yes Yes
20 Togo Yes Yes Yes Yes
21 Uganda Yes Yes Yes Yes
2 In Democratic Republic of Congo (DRC), the Stata software was sent by Stata corporation (Quantec Research (Pty) Ltd, South Africa) but the partner in DRC has not received the Stata package because it was held at custom office.

31
Table 4: Monitoring and evaluation of the project in AfricaRice member countries – status of progress reports
N° Order Countries First quarterly
progress report Second quarterly progress report
1 Benin Yes Yes
2 Burkina Faso Yes Yes
3 Cameroon Yes Yes
4 Central African Republic Yes No
5 Côte d’Ivoire Yes Yes
6 DR Congo Yes Yes
7 Gambia Yes Yes
8 Ghana Yes Yes
9 Guinea Yes No
10 Kenya Yes Yes
11 Liberia Yes Yes
12 Madagascar Yes Yes
13 Mali Yes Yes
14 Mozambique Yes No
15 Nigeria Yes Yes
16 Rwanda Yes Yes
17 Senegal Yes Yes
18 Sierra Leone Yes No
19 Tanzania Yes No
20 Togo Yes Yes
21 Uganda Yes Yes

32
Table 5: Monitoring and evaluation of the project in AfricaRice member countries – status of data collection, entry and analysis
N° Countries Final adapted questionnaires
returned
Data Collection Completed
Countries data entry templates available
Data entry completed
Software used for
data entry
1 Benin Yes Yes Yes Yes Access
2 Burkina Faso Yes Yes Yes Yes CSPro
3 Cameroon Yes Yes Yes Yes Access
4 Central African Republic
Yes Yes Yes Yes Access
5 Côte d’Ivoire Yes Yes Yes Yes Access
6 DR Congo Yes Yes Yes Yes Access
7 The Gambia Yes Yes Yes Yes Access
8 Ghana Yes Yes Yes Yes Access
9 Guinea Yes Yes Yes Yes CSPro
10 Kenya Yes Yes Yes Yes Access
11 Liberia Yes Yes Yes Yes Excel
12 Madagascar Yes Yes Yes Yes Access
13 Mali Yes Yes Yes Yes CSPro
14 Mozambique Yes Yes Yes Yes Access
15 Nigeria Yes Yes Yes Yes Access
16 Rwanda Yes Yes Yes Yes Access
17 Senegal Yes Yes Yes Yes Access
18 Sierra Leone Yes Yes Yes Yes Access
19 Tanzania Yes Yes Yes Yes Access
20 Togo Yes Yes Yes Yes Access
21 Uganda Yes Yes Yes Yes Access

33
Table 6: Monitoring and evaluation of the project in AfricaRice member countries – status of country reports and databases. From 30 April to 30 September 2010
S/N Country Temporary
report sent by 30 April
Databases sent to AfricaRice by 30 April
Observations Status by 30 September
1 Benin Yes Yes, all modules
o Temporary report (results based on the sample)
o Complete Stata and incomplete Access versions of databases
o Final report submitted with extrapolated results
2 Burkina-Faso Yes Yes, all modules
o Temporary report (results based on the sample),
o Complete Stata and SPSS versions of databases
o Final report submitted
o Revised databases
3 Cameroon Yes Yes, all modules o Temporary report
based on sample
4 Côte d'Ivoire No Yes, all modules o Access databases o Report submitted
5 The Gambia Yes Yes, except Scientist data
o Temporary report based on the sample
o no comments on result tables
o SPSS and Stata versions of databases
o Updated report
6 Ghana Yes
Yes, except Complementary
and Scientist data
o Temporary report (results based on the sample)
o Access databases
o Updated report
7 Guinea Yes Only Producer data
o Draft report with extrapolated results
o Database in Stata
o Revised databases (Producer and Complementary)
8 Kenya Yes Yes, all modules
o Temporary report (results based on the sample)
o Excel, SPSS and Stata versions of databases

34
S/N Country Temporary
report sent by 30 April
Databases sent to AfricaRice by 30 April
Observations Status by 30 September
9 Liberia No No
o Draft Analysis based on the tabulation provided by MoA (Excel file); few tables
o Some databases but not with the same structure
10 Madagascar Yes Yes, except Scientist data
o Temporary report (results based on the sample)
o Stata version of databases
o Final report submitted with extrapolated results
11 Mali No No o Draft report with
some national pooled statistics
o Report submitted
12 Mozambique Yes No
o Report with executive summary including comments of the tables
o Updated report
13 Nigeria Yes Only part of Producer data
o Some tables and graphs in excel and SPSS
o Report
o Final report submitted with extrapolated results
o Village data
14 Central African Republic
Yes Yes, all modules o Temporary report o Access version of
databases o Revised report
15 Democratic Republic of Congo
No Yes, all modules
o Tables were generated and sent to partners for interpretation
o Databases in Access
o Revised report submitted
16 Rwanda Yes Yes, all modules o Tables at producer
level and scheme levels
17 Senegal Yes Only Producer data
o Preliminary draft report (results based on the sample)
o database in Stata
o Revised report o Producer and
Village data

35
S/N Country Temporary
report sent by 30 April
Databases sent to AfricaRice by 30 April
Observations Status by 30 September
18 Sierra Leone Yes Yes, except Scientist data
o Results presented in an Excel file but no report
o Final report submitted with extrapolated results
19 Tanzania No No o No report and
database
20 Togo Yes Yes, all modules
o Temporary report (results based on the sample)
o Access version of databases
o Revised report
21 Uganda No No o No report and database o All databases o Report submitted
3.3.1. Institutional and Administrative Issues • MOU between AfricaRice and NARS signed. • Transfer of funds completed for all participating countries. • In-country project coordination units well established with two main focal points for each
country (1 NARS & 1 NASS).
3.3.2. Logistical issues • Software for data analysis purchased and shipped to each participating country (two single-
user licenses for Stata 11 with two installation DVDs as well as one Micro-Econometrics Textbook).
• Countries purchased computers, and other supplies and stationery.
3.3.3. Project activity 1: Capacity building and training • Status - Achieved • At least 45 people were trained in agricultural survey design and other methodological issues
related to national crop-specific data collection (Annex 5).

36
• Regional collaboration established with AGRHYMET for monitoring the project activities. • Other technical support provided by AfDB: organization of a methodological workshop and a
technical report was produced by the consultants. • Both the French and English technical reports of the methodological workshop were
distributed to all country focal points
3.3.4. Project activity 2: Harmonize rice data collection methodologies • Status – Achieved • Survey questionnaires were reviewed and revised together with country project focal points. • Both French and English revised questionnaires were sent back to countries. • Both French and English technical manuals were developed and distributed to countries to
facilitate data collection using the standard data collection tools.
3.3.5. Project Activity 3: Collect, process, analyze and publish updated rice statistical data in 21 countries in Sub-Saharan Africa. • Status: – Achieved • First quarterly report submitted to the project coordination unit by all countries (Table 4). • Second quarterly report submitted to the project coordination unit by all countries (Table 4). • Survey completed in all countries – Table 5. • Data entry templates prepared and sent to all countries by taking into account each country
specific situation. • Data entry completed for all countries (Table 5). • After the task of data entry, countries proceeded to data cleaning and analysis. • Draft country reports and data sets sent to AfricaRice (Table 6).

37
3.4. Major difficulties and lessons learned Throughout the course of the project implementation, the country focal points made substantial and active contributions to ensure a smooth coordination of the project in-country surveys. After the completion of the project data collection, country teams embarked on intensive data entry, treatment, and analysis in close collaboration with the project coordination unit at AfricaRice. However, as data entry and analysis have been a major constraint, timely availability of the survey results has been a problem for the case of some participating countries. Also, some organizational and lack of technical expertise of national partners contributed to the delay of the implementation of national surveys in some countries (table 7). In particular, countries such as Liberia, Tanzania, Uganda, and the Democratic Republic of Congo were not able to send their reports on time due to a number of reasons. In Liberia the set of four questionnaires supplied by AfricaRice was not rigorously adapted and followed to collect the data set. Therefore, much of the data expected to be collected from the project activities could not be collected with the questionnaire developed by Liberia. In Tanzania, the implementation of the survey underwent long delays and the survey was completed only in the month of June 2010. In Uganda, the data collection was completed on time but the data entry was further delayed. In the Democratic Republic of Congo, the initial country team coordinator, Mr Gilbert Talongomo passed away. Also, the country did not receive the Stata package that was sent by Stata Corporation (Quantec Research (Pty) Ltd.) on time. Overall, the project activities went well and the national surveys were successfully conducted. All the countries except Mali and Tanzania have sent their databases which were used to generate cross-country data and information. The coordination unit has also received draft reports from all countries except Tanzania. Table 7: Major difficulties
Major difficulties Countries Observations
Initial start up of activities Benin, Tanzania
Delays in data collection Mozambique, Tanzania
Delays in data entry Mozambique, Tanzania, Uganda
Data entry software used Cameroon Excel

38
Major difficulties Countries Observations
Raising factors were not (yet) computed
Burkina, Cameroon, The Gambia, Côte d’Ivoire, Ghana, Kenya, Liberia, Mali, Mozambique, CAR, DRC, Rwanda, Tanzania, Togo, Uganda
Raising Factor will be used to have aggregate statistics at national level
Questionnaires sent were not used Liberia Database not received in appropriate (usable) format The Gambia, Liberia
Limited country-capacity in advanced statistical tools for analysis
Some countries
Database standardization All countries The standardization of names and databases format and structure

39
Table 8: Major lessons learned
Lessons learned Countries concerned Observations
Good quality of project report Benin, Burkina, Guinea
Good quality of databases Benin, Burkina, CAR, DRC, Nigeria, Rwanda, Senegal, Togo, Uganda
Use of raising factors Benin, Guinea, Madagascar, Nigeria, Sierra Leone, Senegal
Substantial support from AfricaRice All countries Through workshops and
monitoring missions Good partnership between NARS and NASS All countries

40
3.5. Future activities
As future perspectives of the project activities, the country teams in close collaboration with AfricaRice will work to conduct in-depth analysis of the data collected in this project to update the national rice development strategies (NRDS), conduct rice research priority setting exercises and publish papers and policy briefs. The data collected will also be used to conduct rice competitiveness studies in the various countries and also to finalize the Africa Rice Facts Book and Africa Rice Trends.

41
Part II
Results of the Surveys
42
Chapter 4 Results of the surveys
These results are based on the aggregated database which was developed based on the various datasets received from countries. The various statistics and aggregates were computed based on producer level data.
4.1. Socio-demographic characteristics
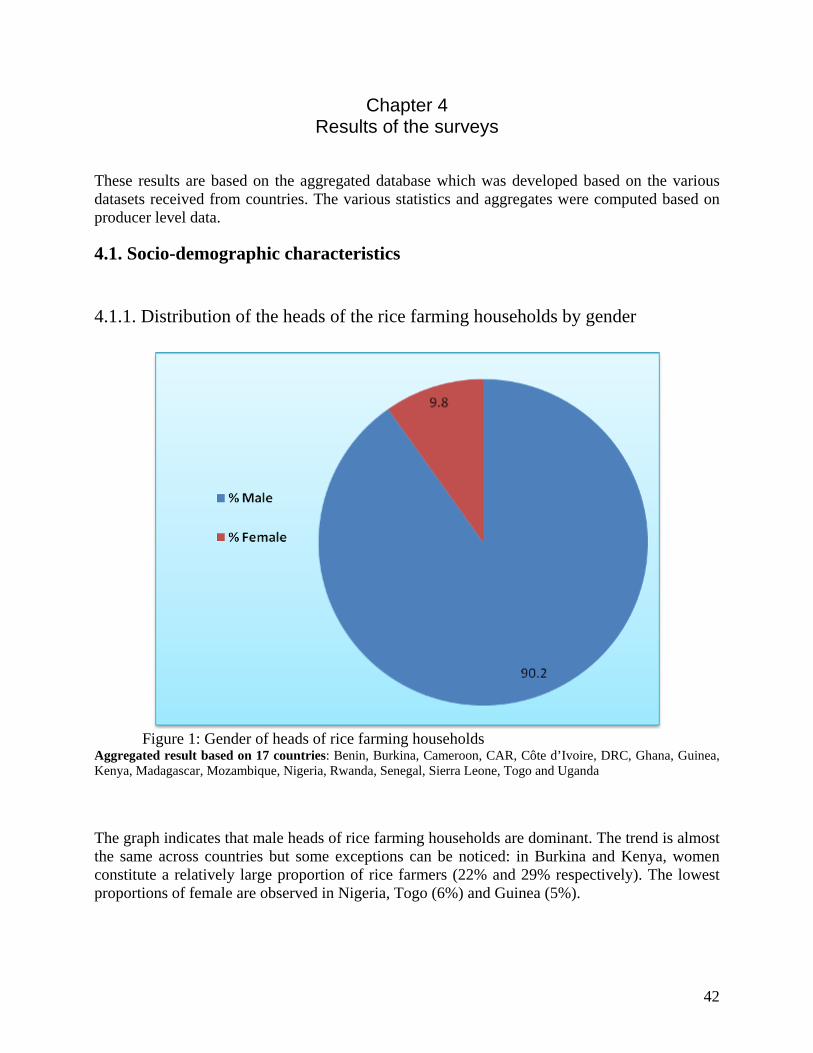
4.1.1. Distribution of the heads of the rice farming households by gender
Figure 1: Gender of heads of rice farming households
Aggregated result based on 17 countries: Benin, Burkina, Cameroon, CAR, Côte d’Ivoire, DRC, Ghana, Guinea, Kenya, Madagascar, Mozambique, Nigeria, Rwanda, Senegal, Sierra Leone, Togo and Uganda
The graph indicates that male heads of rice farming households are dominant. The trend is almost the same across countries but some exceptions can be noticed: in Burkina and Kenya, women constitute a relatively large proportion of rice farmers (22% and 29% respectively). The lowest proportions of female are observed in Nigeria, Togo (6%) and Guinea (5%).

43
4.1.2. Distribution of the heads of the rice farming households by age and gender
Figure 2: Distribution of the heads of the rice farming households by age and gender, % Aggregated result based on 17 countries: Benin, Burkina, Cameroon, CAR, Côte d’Ivoire, DRC, Ghana, Guinea, Kenya, Madagascar, Mozambique, Nigeria, Rwanda, Senegal, Sierra Leone, Togo and Uganda
Overall, 73% of heads of rice producing households are between 30 and 60 years old. This proportion is almost the same by gender. About 17% of heads of rice producing households are over 60 years old. The average age of heads of rice farming households is 45.4 years for men and 44.0 for women. Rice-growing is then an activity of adults in sub-Saharan Africa.

44
4.1.3. Distribution of the heads of the rice farming households by marital status and gender
Figure 3: Marital Status of the heads of the rice farming households
Aggregated result based on 17 countries: Benin, Burkina, Cameroon, CAR, Côte d’Ivoire, DRC, Ghana, Guinea, Kenya, Madagascar, Mozambique, Nigeria, Rwanda, Senegal, Sierra Leone, Togo and Uganda
While most male rice farming household heads (87%) are married, most women heads of households (40%) are widows. Bachelors and spinsters are almost in the same proportions and a relatively high proportion of women are divorced. The marital status of heads of rice households relates to the gender.

45
4.1.4. Household size
The graph below shows the distribution of the total number of people of rice-growing households.
Figure 4: Distribution of rice farming household size, % Aggregated result based on 16 countries: Benin, Burkina, Cameroon, CAR, Côte d’Ivoire, DRC, Ghana, Guinea, Kenya, Madagascar, Mozambique, Rwanda, Senegal, Sierra Leone, Togo and Uganda Most of rice-growing households (72%) have less than 9 members. The median household size is 6 and the average number of people in a rice farming household is about 7 as shown below:
Household size Average size Average age of members
<=2 1.3 40.6 3-5 4.1 25.8 6-8 6.9 22.5 9-12 10.2 22.3 13-15 14.0 22.4 >=16 21.7 21.5 Total 6.9 23.4
The average number of people in households of more than 15 members is high (about 22) and the average age of their members is the lowest. We can conclude that these households contain more young people or children.
46
4.2. Area and variety
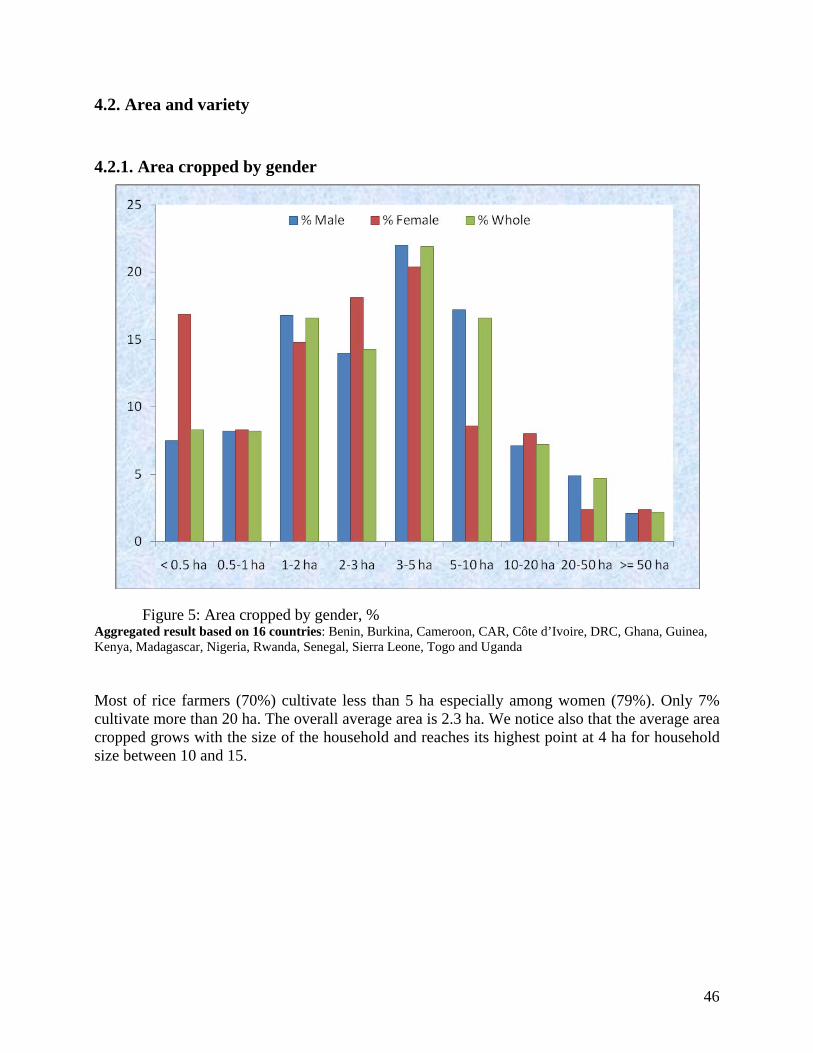
4.2.1. Area cropped by gender
Figure 5: Area cropped by gender, % Aggregated result based on 16 countries: Benin, Burkina, Cameroon, CAR, Côte d’Ivoire, DRC, Ghana, Guinea, Kenya, Madagascar, Nigeria, Rwanda, Senegal, Sierra Leone, Togo and Uganda Most of rice farmers (70%) cultivate less than 5 ha especially among women (79%). Only 7% cultivate more than 20 ha. The overall average area is 2.3 ha. We notice also that the average area cropped grows with the size of the household and reaches its highest point at 4 ha for household size between 10 and 15.

47
4.2.2. Varieties by field size
Figure 6: Distribution farmers by type of varieties grown and by field size, %
Aggregated result based on 15 countries: Benin, Burkina, Cameroon, CAR, Côte d’Ivoire, DRC, Guinea, Kenya, Madagascar, Nigeria, Rwanda, Senegal, Sierra Leone, Togo and Uganda
Large or small rice farmers generally grow all varieties but a preference for a variety depends also on the size of the field. So, large field farmers grow more NERICA, less other improved varieties from AfricaRice and not at all improved varieties from NARES. However, improved varieties from NARES are the most grown on areas of less than 1ha.

48
4.3. Yield
4.3.1. Average yield by ecology and type of variety (t/ha)
Traditional Improved AfricaRice NERICA
Improved AfricaRice
non-NERICA
Improved NARES
Other improved
Average yield of
the ecology
Irrigated 1.61 1.29 2.28 1.90 2.65 2.34 Upland strict 1.64 1.58 2.12 2.56 2.16 1.71 Lowland 2.94 3.01 3.24 3.10 2.85 2.87 Others 2.46 2.62 2.47 2.30 2.93 2.51
Aggregated result based on 15 countries: Benin, Burkina, Cameroon, CAR, Côte d’Ivoire, DRC, Guinea, Kenya, Madagascar, Nigeria, Rwanda, Senegal, Sierra Leone, Togo and Uganda The average yield varies from 1.7 t/ha in upland ecology to 2.9 t/ha in lowland. The distribution of the yield across types of varieties is more heterogeneous in upland and irrigated ecology than in lowland and other ecologies. The yield of NERICA varieties is more than two times higher in lowland compared to the yield of NERICA in irrigated ecology. These aggregated results may hide some specific details within countries. It will be interesting to see also how yields are distributed by country.
4.3.2. Average yield by country and ecology (t/ha)
Figure 7: Average yield by country and ecology (t/ha)

49
Highest average country yields (more than 2.5 t/ha) are observed in Senegal, Rwanda, Cameroon and Nigeria. Lowest yield (less than 1.5 t/ha) are in Uganda, Central African Republic, Guinea, Democratic Republic of Congo and Côte d’Ivoire. The yield in irrigated ecology can reach 4 t/ha in Senegal, Burkina and Rwanda. However, in Burkina, in this ecology, the country yield is only 2.2 t/ha.
4.3.3. Average yield by country and type of variety (t/ha)
Traditional Improved
AfricaRice NERICA
Improved AfricaRice
non-NERICA
Improved NARS
Other improved
Benin 1.61 1.59 1.51 Burkina 3.50 2.30 3.74 Cameroon 2.84 3.08 2.57 2.13 Côte d'Ivoire 1.17 1.20 2.02 1.58 2.08 DRC 1.16 1.63 1.11 1.29 Guinea 1.13 1.32 1.06 1.22 Kenya 2.09 1.56 2.67 1.91 Madagascar 1.64 1.88 0.64 1.89 2.27 Nigeria 2.30 2.23 2.49 2.42 2.88 Rwanda 4.09 2.90 4.19 3.41 Senegal 3.68 2.37 4.15 1.14 2.19 Sierra Leone 2.10 2.24 0.80 2.44 2.52 Togo 1.84 1.88 1.90 2.00 2.00 Uganda 0.97 1.00 1.19 0.97 1.41
Aggregated result based on 15 countries: Benin, Burkina, Cameroon, CAR, Côte d’Ivoire, DRC, Guinea, Kenya, Madagascar, Nigeria, Rwanda, Senegal, Sierra Leone, Togo and Uganda Highest yields are observed in Burkina, Rwanda and Senegal for traditional and improved AfricaRice non-NERICA varieties. Improved NARS varieties give greater yield in Burkina, Cameroon, Sierra Leone and Nigeria whereas non-NERICA varieties give the lowest yield in Madagascar and Sierra Leone.

50
4.4. Constraints by category
4.4.1. Major constraints in irrigated ecology
Figure 8: Major constraints identified in irrigated ecology (percentage of incidence) Aggregated result based on 8 countries: Benin, Burkina, Cameroon, CAR, DRC, Madagascar, Rwanda, and Togo
Each stress identified in irrigated ecology is experienced by more than 50% of rice farmers. The major biotic constraints are weeds and birds. Major abiotic constraints concern water management capacity, post-harvest grain losses and deficiency of N-P-K; among socio-economic constraints we have the high cost of fertilizers, low prices for rice, difficulty to acquire processing and production equipments and the small land size.

51
4.4.2. Major constraints in upland ecology
Figure 9: Major constraints identified in upland ecology (percentage of incidence) Aggregated result based on 9 countries: Benin, Burkina, CAR, DRC, Guinea, Madagascar, Sierra Leone, Togo and Uganda
Stresses in upland ecology are very severe (more than 70% of rice farmers experienced the stresses). Weeds, birds, grain losses and low prices for rice are still present as in the case of irrigated ecology; the low fertility of soil and drought are also cited among the major constraints.

52
4.4.3. Major constraints in lowland ecology
Figure 10: Major constraints identified in lowland ecology (percentage of incidence) Aggregated result based on 8 countries: Benin, Burkina, CAR, DRC, Guinea, Madagascar, Togo and Uganda
The incidence of stresses in lowland is higher than that of the case of irrigated and much lower than that of upland. The stresses are almost the same.

53
4.4.4. Major constraints in mangrove ecology
Figure 11: Major constraints identified in lowland ecology (percentage of incidence) Aggregated result based on 5 countries: Benin, Burkina, CAR, Guinea and Sierra Leone
When compared to irrigated, lowland, and upland ecologies, the mangrove rice growing ecology has very little incidence of constraints. Only socioeconomic stresses are well pronounced.

54
Information dissemination and publishing through Google Maps An initial website was set up as a portal for the Emergency Rice Initiative project. This is to facilitate the collaborative effort of the 21 countries involved in the project. However, after the workshop organized in Ouagadougou in August 2010 for Francophone countries, it was decided that it is more prudent for sites to be created for individual countries that will be linked to the central portal managed by AfricaRice on the Google sites. The country sites enable the focal persons in different countries to manage the content of their sites. Uploading and downloading of documents and datasets and other household functions are then being managed by the countries focal persons. The site embeds a mapping standard that will enable the display of important spatial information to the public and researchers. When completed, the Africa aggregated data, individual countries data, regionally aggregated data, and sub-regional data on specific subject categories will be dynamically linked to the website available to the public to support Rice information in Africa. The site can be viewed from the following web addresses:

55
The ERIP site central hub: https://sites.google.com/site/aricejapanerip/

56
Individual countries have a site similar to this, linked to the central hub https://sites.google.com/site/liberiaerip/ https://sites.google.com/site/rwandaerip/ https://sites.google.com/site/Ghanaerip/

Annex 1: Distribution of rice farmers (%) by country, age and gender
Countries < 20 years 20 - 30 years 30 - 40 years 40 - 50 years 50 - 60 years > 60 years Male Female Male Female Male Female Male Female Male Female Male Female
Benin 2.2 7.5 8 5.6 27.5 26.2 33.6 33.6 18.5 16.8 10.2 10.3 Burkina-Faso 1.9 4.8 6.2 13.7 25.3 24 26.7 24 19 18.5 20.9 15.1 Cameroon 0.4 0 2.8 2 25.7 36 34.3 36 22.1 16 14.7 10 Côte d'Ivoire 2 9.2 10.5 12.2 23.1 10.2 27.5 30.6 18.5 18.4 18.4 19.4 Gambia Ghana 0.0 0.0 3.9 3.7 31.4 7.4 31 33.3 20.6 48.1 13.1 7.4 Guinea 0.6 0.0 2.8 3.9 13.4 11.5 24.8 36.5 29.7 26.9 28.8 21.2 Kenya 12.8 33.2 11.7 13 17.8 14.7 21.3 14.7 17.4 11.4 19 13 Liberia Madagascar 0.3 0 9 4.9 26 19 28 26.7 19.6 24.3 17.1 25.1 Mali Mozambique Nigeria 0.7 0.8 8.3 6.1 26 16.9 29.2 27.1 18.8 26.3 17.1 22.8 RCA 5.9 14.8 16 13.6 24.4 20.5 26.6 31.8 19.1 15.9 8 3.4 RDC 1.8 12.5 14.7 0 25.2 16.1 23.7 26.8 22.5 32.1 12 12.5 Rwanda 0.7 0 13.9 19 32.6 42.9 27.8 19 19.4 14.3 5.6 4.8 Senegal 0.6 3.4 5.3 5.1 13.7 16.9 29.7 22 27.2 32.2 23.5 20.3 Sierra Leone 1.4 9.9 4.7 9.9 16.8 20.6 27.4 26 25.8 19.8 24 13.7 Tanzania Togo 0.6 2.3 7.4 7 21.6 11.6 33 34.9 18.4 30.2 19 14 Uganda 1.3 4.8 16.4 14.4 29.8 16.8 25.9 36 15.3 20 11.2 8 Whole 1.4 6.5 8.6 8.7 24.3 19.4 28.6 27.3 20 21.8 17 16.3

58
Annex 2: Distribution of rice farmers (%) by country and marital status
Countries Married Bachelor/spinster Divorced Widow/widower
Male Female Male Female Male Female Male Female Benin 89.8 64.1 9.2 7.7 0.6 5.1 0.3 23.1 Burkina-Faso 91.5 72.7 6.8 3 0.0 0.0 1.7 24.2 Cameroon 86.1 67 12.2 11.7 0.5 1.1 1.3 20.2 Côte d'Ivoire 79.3 33.3 19.8 11.1 0.3 3.7 0.6 51.9 Gambia Ghana 92.6 100 4.4 0 2.9 0 0.0 0.0 Guinea 99.1 50.0 0.3 1.9 0.2 1.9 0.4 46.2 Kenya 87.4 40.6 8.4 21.9 2.1 3.1 2.1 34.4 Liberia Madagascar 84.5 22.2 3.4 8.9 4.1 24.4 8.1 44.4 Mali Mozambique Nigeria 89.4 58.1 9.1 10.8 0.6 9 0.8 22.2 RCA 72 19.2 21.7 30.8 0.6 19.2 5.7 30.8 RDC 87.7 9.1 6.2 18.2 1.5 9.1 4.6 63.6 Rwanda 96.9 8.7 3.1 17.4 0 17.4 0 56.5 Senegal 97.6 80 2.4 0 0 0 0 20 Sierra Leone 93.4 33.3 3.3 25 0.8 11.1 2.5 30.6 Tanzania Togo 89.1 33.3 7.3 8.3 2.9 0 0.7 58.3 Uganda 91.3 35 4.3 5 2.5 15 1.9 45 Whole 87.1 34.9 10.5 11.3 1.3 13.5 1.2 40.3

59
Annex 3: Schedule (monthly timetable)
Specific Objective/Intermediate Result
Activity M 09
A 09
M 09
J 09
J 09
A 09
S 09
O 09
N 09
D 09
J 10
F 10
M 10
A 10
SO1: Strengthen the capacity of national agricultural statisticians and NARES scientists on best practices on agricultural survey design, sampling methodology for rice data collection and statistical analysis and publication.
IR.1. NARES scientists, agricultural extension agents and agricultural statisticians from CARD countries trained in implementing a common rice data collection methodologies (total of 42 people).
Partners: AfricaRice, NARES in CARD countries, Universities
A.1.1. The two consultants are recruited and operational
X WA*
A.1.2. Country focal points nominated and are fully operational
X
X
X
A.1.3. Preparation for the training session for country experts
X
X
X
A.1.4. Organization of the 2 training workshops for the country experts (West Africa and East Africa)
X
X
SO 2: Harmonize rice data collection methodologies.
IR.1. Rice data collection methodologies and questionnaires are harmonized across CARD countries
Partners:AfricaRice, NARES in CARD countries, Universities, AGRHYMET, AFRISTAT
A.2.1. Development of standard data collection tools, reviewed and field tested by country partners
X
X
X
X
SO 3: Collect, process, analyze and publish updated rice statistical data in 21 countries in Sub-Saharan Africa.
IR.1. Updated and reliable rice data (relevant data on ecologies, varieties, farmers
A.3.1. Implementation of country level survey for rice data collection in different sites with known sample size
X
X
X
X
A.3.2. Data analysis X
X
X
X
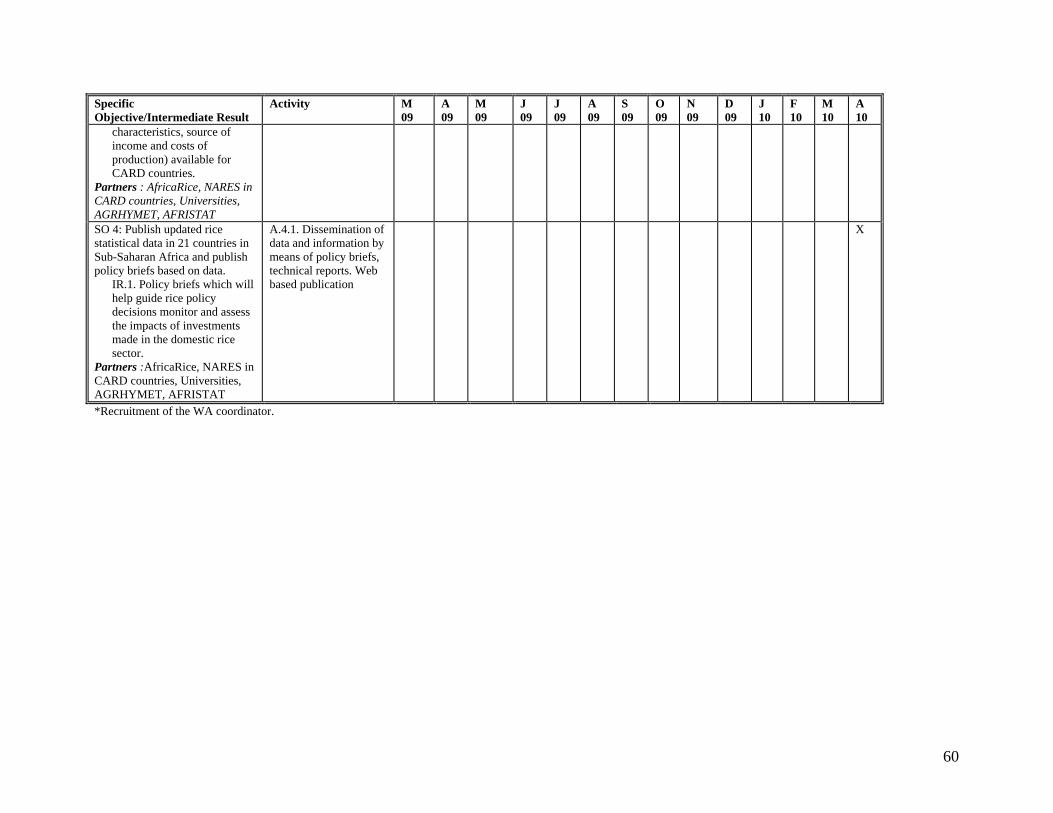
60
Specific Objective/Intermediate Result
Activity M 09
A 09
M 09
J 09
J 09
A 09
S 09
O 09
N 09
D 09
J 10
F 10
M 10
A 10
characteristics, source of income and costs of production) available for CARD countries.
Partners : AfricaRice, NARES in CARD countries, Universities, AGRHYMET, AFRISTAT SO 4: Publish updated rice statistical data in 21 countries in Sub-Saharan Africa and publish policy briefs based on data.
IR.1. Policy briefs which will help guide rice policy decisions monitor and assess the impacts of investments made in the domestic rice sector.
Partners :AfricaRice, NARES in CARD countries, Universities, AGRHYMET, AFRISTAT
A.4.1. Dissemination of data and information by means of policy briefs, technical reports. Web based publication
X
*Recruitment of the WA coordinator.

61
Annex 4: Sampling design and sample size for the 21 countries
Countries Sampling method Sample sites Régions/sites Benin
Sampling at 2 levels
1255
- 61 districts out the 77 districts - 11 districts out of 12 (except Littoral)
Burkina Faso
Sampling at 2 levels
760
- For upland rice, 8 regions out of 13 regions were selected - For plain and lowland rice, 9 regions out of 13 regions were selected
Cameroon Sampling at 2 levels
1200 5 rice basins
Côte d’Ivoire
Sampling at 2 levels
3 325
- 475 census districts (DR) in 672 regions
The Gambia Sampling at 2 levels
370
- 6 regions
Ghana Sampling at 2 levels
Guinea
Sampling at 2 levels
1085
- 7 Regions (Boke, Faranah, Kankan, Kindia, Labe, Mamou, N’zerekore) - 33 prefectures, - 217 enumeration areas
Kenya Sampling at 2 levels
572 - 5 provinces, - 9 districts (1 district in the central province and 2 districts in other areas).
Liberia Sampling at 3 levels
Madagascar
Sampling at 3 levels
1606
- Cultivated almost country wide -15 districts - 143 fokontany
Mali Sampling at 2 levels
2 495
Mozambique Sampling at 2 levels
Nigeria Sampling at 2 levels
10,500
- 6 Regions - 36 States
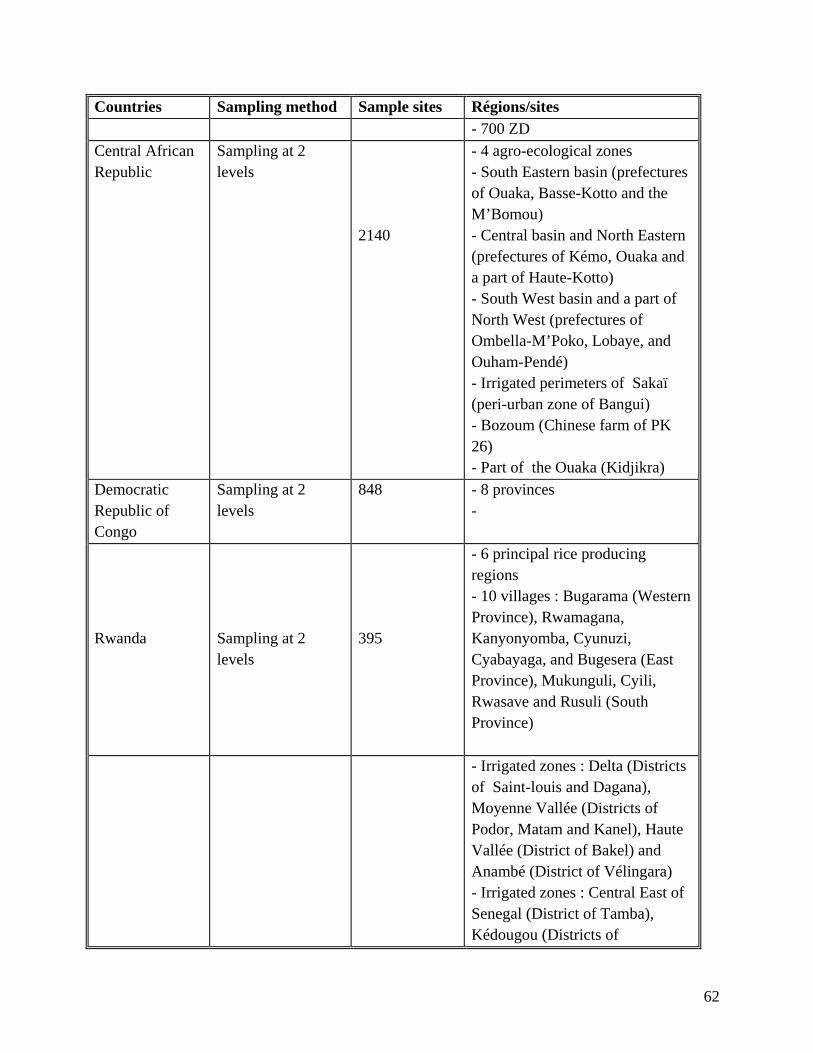
62
Countries Sampling method Sample sites Régions/sites - 700 ZD
Central African Republic
Sampling at 2 levels
2140
- 4 agro-ecological zones - South Eastern basin (prefectures of Ouaka, Basse-Kotto and the M’Bomou) - Central basin and North Eastern (prefectures of Kémo, Ouaka and a part of Haute-Kotto) - South West basin and a part of North West (prefectures of Ombella-M’Poko, Lobaye, and Ouham-Pendé) - Irrigated perimeters of Sakaï (peri-urban zone of Bangui) - Bozoum (Chinese farm of PK 26) - Part of the Ouaka (Kidjikra)
Democratic Republic of Congo
Sampling at 2 levels
848 - 8 provinces -
Rwanda
Sampling at 2 levels
395
- 6 principal rice producing regions - 10 villages : Bugarama (Western Province), Rwamagana, Kanyonyomba, Cyunuzi, Cyabayaga, and Bugesera (East Province), Mukunguli, Cyili, Rwasave and Rusuli (South Province)
- Irrigated zones : Delta (Districts of Saint-louis and Dagana), Moyenne Vallée (Districts of Podor, Matam and Kanel), Haute Vallée (District of Bakel) and Anambé (District of Vélingara) - Irrigated zones : Central East of Senegal (District of Tamba), Kédougou (Districts of

63
Countries Sampling method Sample sites Régions/sites Senegal
Sampling at 2 levels
2000
Kédougou, Salémata and Saraya), South West Basin (Districts of Fatick and Foundiougne), Haute Casamance (Districts of Kolda, Vélingara, and Médina Yoro Foulah), Moyenne Casamance (Districts of Sédhiou, Goudomp Bounkiling and Bignona) and Basse Casamance (Districts of Ziguinchor and Oussouye) -
Sierra Leone Sampling at 2 levels
1300 - 13 rice producing districts - 571 survey areas
Tanzania Sampling at 4 levels
- 21 districts and 105 villages sampled, - Lake zone (Mwanza, Mara, Shinyanga, and Kagera), - Northern zone (Manyara, Kilimanjaro and Arusha), - Eastern zone (Morogoro, Pwani, Dar es salaam and Tanga), - Western zone (Kigoma and Tabora), - Central zone (Dodoma and Singida), - Southern highland zone (Mbeya, Iringa and Rukwa), - Southern zone (Mtwara, lindi and Ruvuma).
Togo Sampling at 2 levels
727 - 5 regions (Maritime, Plateaux, Centrale, Kara, Savanes) - 251 villages
Uganda Sampling at 2 levels

64
Annex 5: Focal point/ representation by country
No Name Country Institution Designation Contact 1 Ahouassou G Gilbert
Benin
Ministère de l’Agriculture, de l’Elevage et de la Pêche MAEP
Collaborateur statistique/DPP
02 BP 2900 Cotonou Tel : 229 95420557 Email: [email protected]
2 Oloukoi Laurent
Institut National des Recherches Agricoles du Bénin INRAB/PAPA
Economiste BP 128 Porto Novo Tel : 229 90066004 Email: [email protected]
3 Guissou S Richard
Burkina Faso
Direction Générale de la Promotion de l’Economie Rurale DGPER
Ingénieur Statisticien
BP 7035 Ouagadougou 03 (DGPER) Tel : 226 70769346 Email : [email protected] [email protected]
4 Ouedraogo Mathieu
Institut de l’Environnement et de Recherches Agricoles INERA
Agroeconomiste
01BP 910 Bobodioulasso Station Farako Ba Tel: 226 70728542 Fax: 226 20970159 Email: [email protected]
5 Nzodjo Pierre
Cameroon
Ministère de l’Agriculture et du Développement Rural MINADER
Chef service des enquêtes et recensement agricoles
BP 225 Yaoundé Tel : 237 99540562 Fax : 237 22234507 Email : [email protected]
6 Dorothy Malaa Kenyi
Institute of Agricultural Research for Development IRAD
Agro economist
BP 44 Dschang Menoua Division, West region Tel: 237 77770069 Fax: 237 33442492
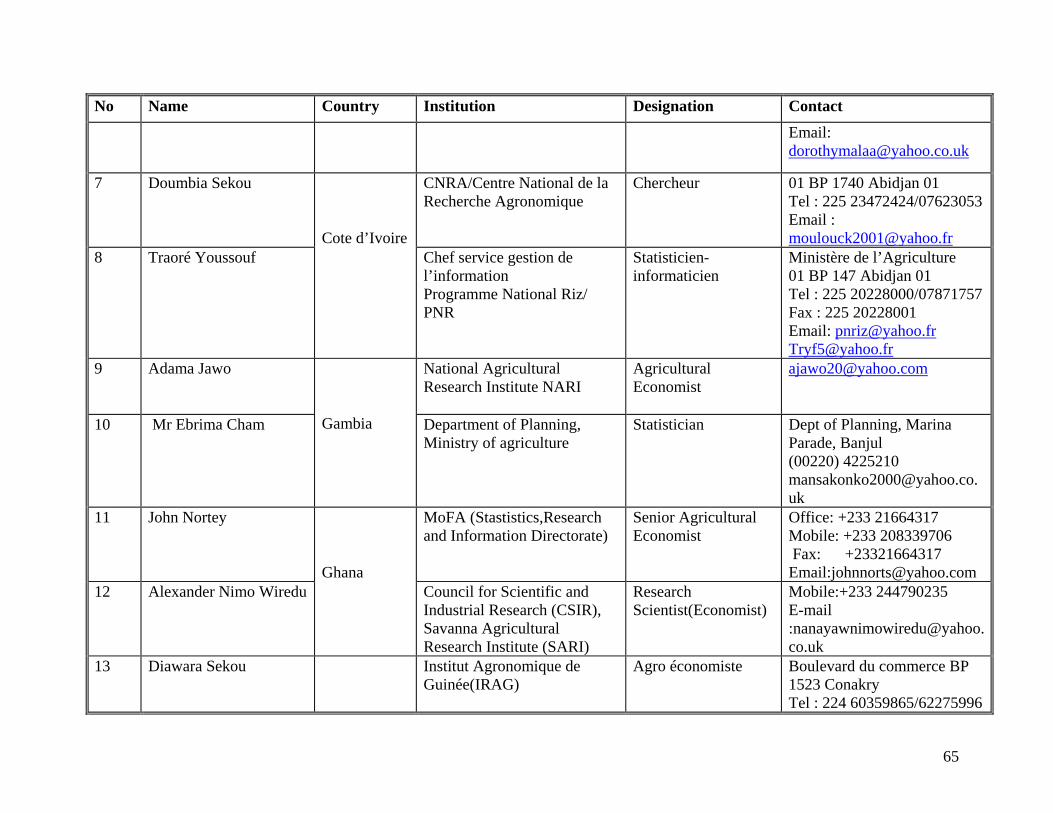
65
No Name Country Institution Designation Contact Email: [email protected]
7 Doumbia Sekou
Cote d’Ivoire
CNRA/Centre National de la Recherche Agronomique
Chercheur
01 BP 1740 Abidjan 01 Tel : 225 23472424/07623053 Email : [email protected]
8 Traoré Youssouf
Chef service gestion de l’information Programme National Riz/ PNR
Statisticien-informaticien
Ministère de l’Agriculture 01 BP 147 Abidjan 01 Tel : 225 20228000/07871757 Fax : 225 20228001 Email: [email protected] [email protected]
9 Adama Jawo Gambia
National Agricultural Research Institute NARI
Agricultural Economist
10 Mr Ebrima Cham Department of Planning, Ministry of agriculture
Statistician Dept of Planning, Marina Parade, Banjul (00220) 4225210 [email protected]
11 John Nortey Ghana
MoFA (Stastistics,Research and Information Directorate)
Senior Agricultural Economist
Office: +233 21664317 Mobile: +233 208339706 Fax: +23321664317 Email:[email protected]
12 Alexander Nimo Wiredu Council for Scientific and Industrial Research (CSIR), Savanna Agricultural Research Institute (SARI)
Research Scientist(Economist)
Mobile:+233 244790235 E-mail :[email protected]
13 Diawara Sekou
Institut Agronomique de Guinée(IRAG)
Agro économiste Boulevard du commerce BP 1523 Conakry Tel : 224 60359865/62275996

66
No Name Country Institution Designation Contact Guinea
Email : [email protected]
14 Aly Conde
Service National des Statistiques Agricoles
Responsable des Op de terrain
SNSA Ministère de l’Agriculture et de l’Elevage BP 576 Conakry Tel : 224 60291332/62213014 Email : [email protected]
15 Kore Winfred Kenya
Kenya Agricultural Research Institute
Senior Research Officer
KARI Mobile:+254 733 944 897 Email:[email protected]
16 Elias Gitonga Thuranira Kenya Agricultural Research Institute (KARI)- NARL
Biometrician Mobile: +254 (0) 723 606204 Email: [email protected]
17 Jobson A Momo Liberia Central Agricultural Research Institute
Program Officer/Special Projects
Office: +231 77 742463 Mobile: +231 64 77081 E-mail : [email protected]
18 HL Abel –Ratovo.
Madagascar
Centre National de la Recherche Appliquée au Développement Rural FOFIFA/CENRADERU
Chercheur enseignant
Rue Fernand Kansanga, enceinte CIDST, Tsimbazaza Antananarivo (101) Tel : 261 320406502/331478515 Email : [email protected]
19 Randriamora Jean N
Ministère de l’Agriculture, de L’Elevage et de la Pêche (MAEP)
Chef du service de la statistique agricole
Logt 1961, cité des 67 ha Antananarivo (101) Tel : 261 341575261 Email : [email protected]

67
No Name Country Institution Designation Contact 20 Bocar Dit Sire BA
Mali
Statistician – Directeur des Statistiques
Cellule de Planification et de Statistique du secteur du développement rural, CPS/SDR BP 2313 Bamako, Mali E-mail : [email protected]
21 Maiga Boubacar
IER/CRRA-Niono
Agro économiste, chercheur
Tel : 223 76140631 Email : [email protected] [email protected]
22 Bandele Ogunlana** Nigeria National Bureau of Statistics Assistant Director Mobile: 08027248902 Email:[email protected]
23 Vivian Ebihomon Ojehomon
Nigeria National Cereals Research Institute, Nigeria
Assistant Chief Research Officer
Office:+234 8036369760 Mobile:+234 8036369760 Email:[email protected]
24 Olorunfemi Ogundele, Nigeria NISER-Nigerian Institute of Social and Economic Research
Research Fellow Office: +234-7030574305 Mobile: +234-7030574305 E-mail: [email protected]
25 Mbedane M Hervé
RCA
Institut Centrafricain de la Recherche Agronomique ICRA
Chef service des systèmes des productions animales
BP 1762 Bangui Tel : 236 75059953/75044114 Email : [email protected]
26 Bida-Kette Reginald
Direction de la Statistique Agricole, de la Documentation et de l’Information
Directeur de la statistique agricole de la documentation et de l’informatique
DSDI, Ministère du Développement Rural et de l’Agriculture BP 786 Bangui Tel : 236 75756816/77088077 Email :
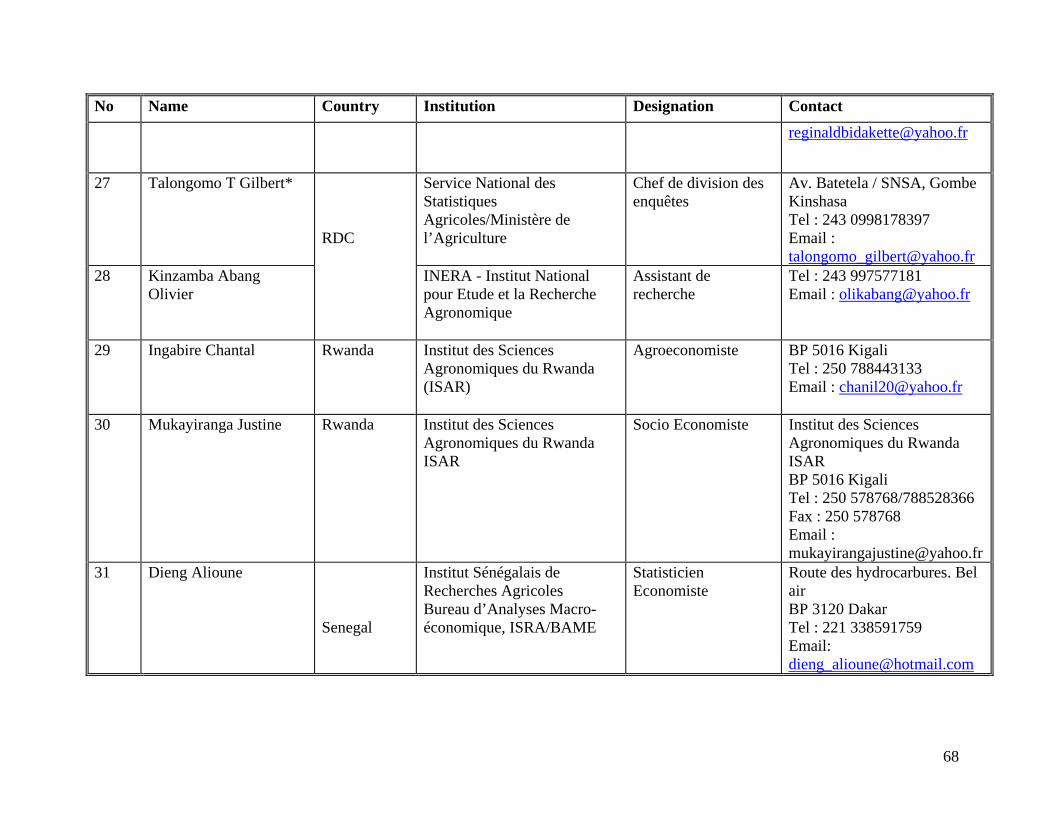
68
No Name Country Institution Designation Contact [email protected]
27 Talongomo T Gilbert*
RDC
Service National des Statistiques Agricoles/Ministère de l’Agriculture
Chef de division des enquêtes
Av. Batetela / SNSA, Gombe Kinshasa Tel : 243 0998178397 Email : [email protected]
28 Kinzamba Abang Olivier
INERA - Institut National pour Etude et la Recherche Agronomique
Assistant de recherche
Tel : 243 997577181 Email : [email protected]
29 Ingabire Chantal
Rwanda Institut des Sciences Agronomiques du Rwanda (ISAR)
Agroeconomiste
BP 5016 Kigali Tel : 250 788443133 Email : [email protected]
30 Mukayiranga Justine Rwanda Institut des Sciences Agronomiques du Rwanda ISAR
Socio Economiste Institut des Sciences Agronomiques du Rwanda ISAR BP 5016 Kigali Tel : 250 578768/788528366 Fax : 250 578768 Email : [email protected]
31 Dieng Alioune
Senegal
Institut Sénégalais de Recherches Agricoles Bureau d’Analyses Macro-économique, ISRA/BAME
Statisticien Economiste
Route des hydrocarbures. Bel air BP 3120 Dakar Tel : 221 338591759 Email: [email protected]
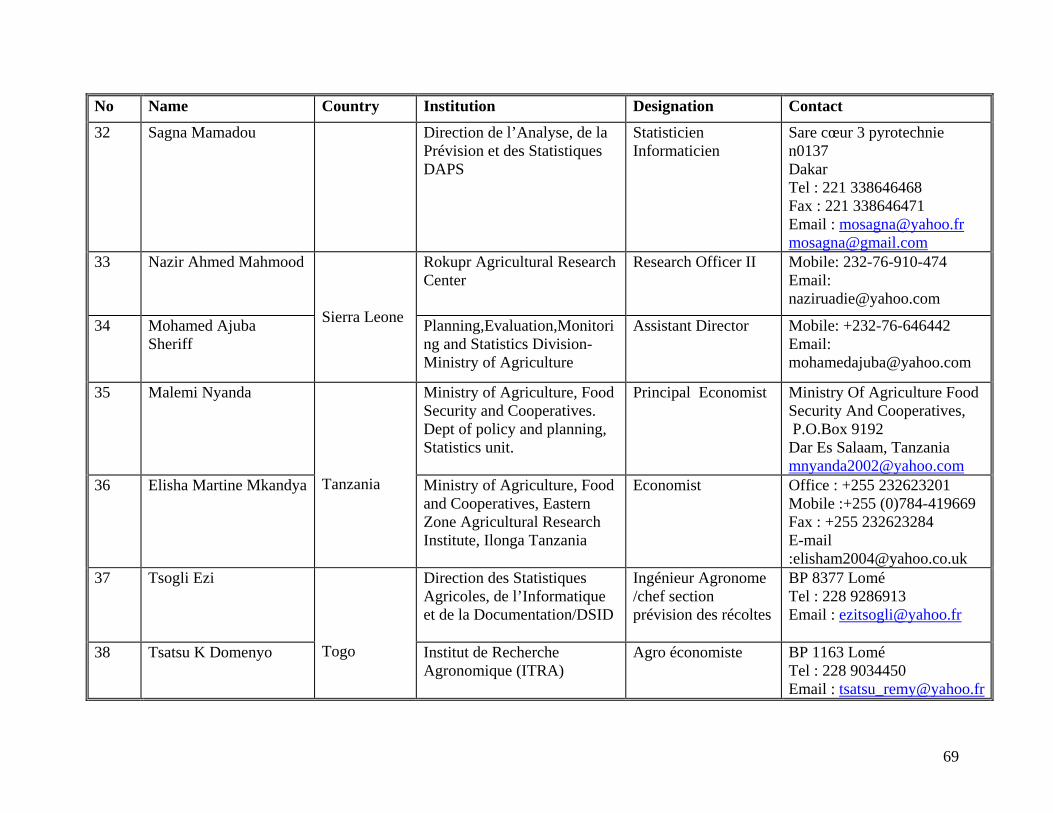
69
No Name Country Institution Designation Contact 32 Sagna Mamadou
Direction de l’Analyse, de la Prévision et des Statistiques DAPS
Statisticien Informaticien
Sare cœur 3 pyrotechnie n0137 Dakar Tel : 221 338646468 Fax : 221 338646471 Email : [email protected] [email protected]
33 Nazir Ahmed Mahmood Sierra Leone
Rokupr Agricultural Research Center
Research Officer II Mobile: 232-76-910-474 Email: [email protected]
34 Mohamed Ajuba Sheriff
Planning,Evaluation,Monitoring and Statistics Division-Ministry of Agriculture
Assistant Director Mobile: +232-76-646442 Email: [email protected]
35 Malemi Nyanda Tanzania
Ministry of Agriculture, Food Security and Cooperatives. Dept of policy and planning, Statistics unit.
Principal Economist Ministry Of Agriculture Food Security And Cooperatives, P.O.Box 9192 Dar Es Salaam, Tanzania [email protected]
36 Elisha Martine Mkandya Ministry of Agriculture, Food and Cooperatives, Eastern Zone Agricultural Research Institute, Ilonga Tanzania
Economist Office : +255 232623201 Mobile :+255 (0)784-419669 Fax : +255 232623284 E-mail :[email protected]
37 Tsogli Ezi
Togo
Direction des Statistiques Agricoles, de l’Informatique et de la Documentation/DSID
Ingénieur Agronome /chef section prévision des récoltes
BP 8377 Lomé Tel : 228 9286913 Email : [email protected]
38 Tsatsu K Domenyo
Institut de Recherche Agronomique (ITRA)
Agro économiste
BP 1163 Lomé Tel : 228 9034450 Email : [email protected]

70
No Name Country Institution Designation Contact
39 Mr Benard Odur, Uganda
National Agricultural Research Organization(NARO
Statistician National Agricultural Research Organization (NARO) [email protected] and [email protected]
40 Ms Nakakawa, Mary Frances.
National Agricultural Research Organization(NARO)
Socio-Economist Office:+256 414 320341/2 Mobile:+256 772 552 729 Fax: +256 414 321070 E-mail :[email protected] or [email protected]
41 Marcos Langa Mozambique
Researcher IIAM-Instituto de Investigacao Agraria de Mozambique, Av. FPLM 2698 P. Box 3658 Mavalane Maputo-Mocambique Tel:+258 28120318 Mobile: +258 829748530 marcoslanga @yahoo.com
42 Fidélio Salamandane Researcher IIAM-Instituto de Investigacao Agraria de Mozambique Av. FPLM 2698 P. Box 3658 Mavalane Maputo-Mocambique Tel:+258 28120318 Mobile: +258 829748530
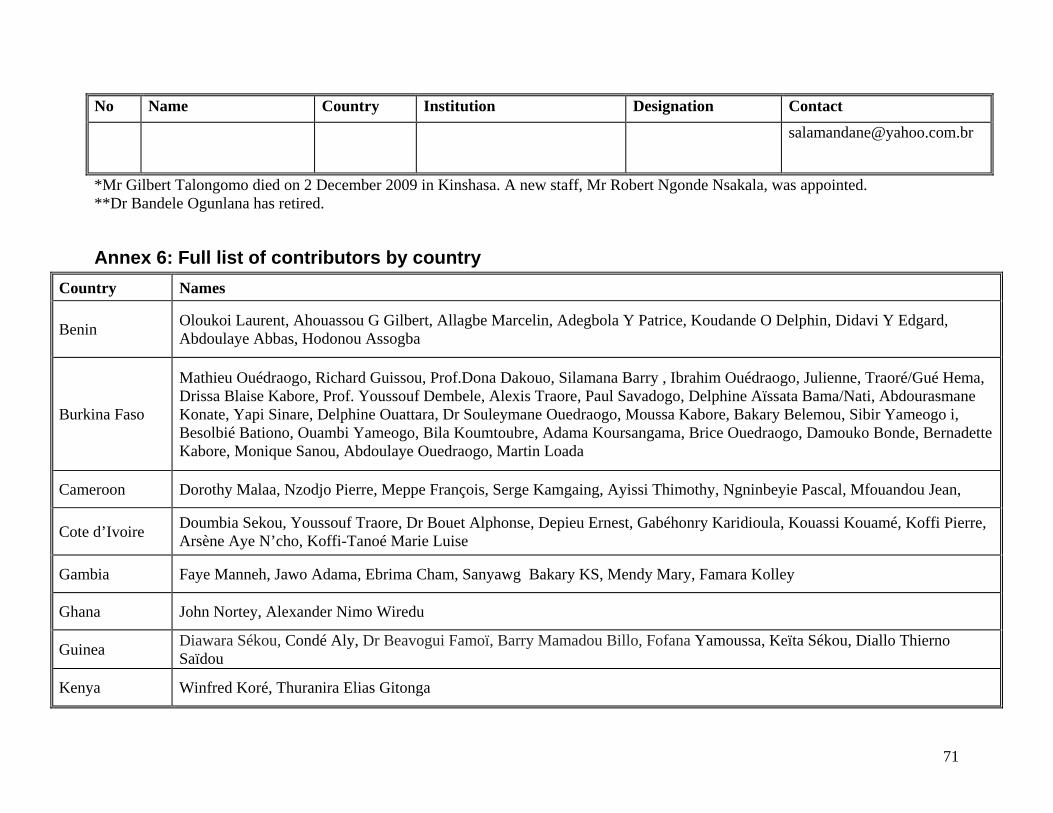
71
No Name Country Institution Designation Contact [email protected]
*Mr Gilbert Talongomo died on 2 December 2009 in Kinshasa. A new staff, Mr Robert Ngonde Nsakala, was appointed. **Dr Bandele Ogunlana has retired.
Annex 6: Full list of contributors by country Country Names
Benin Oloukoi Laurent, Ahouassou G Gilbert, Allagbe Marcelin, Adegbola Y Patrice, Koudande O Delphin, Didavi Y Edgard, Abdoulaye Abbas, Hodonou Assogba
Burkina Faso
Mathieu Ouédraogo, Richard Guissou, Prof.Dona Dakouo, Silamana Barry , Ibrahim Ouédraogo, Julienne, Traoré/Gué Hema, Drissa Blaise Kabore, Prof. Youssouf Dembele, Alexis Traore, Paul Savadogo, Delphine Aïssata Bama/Nati, Abdourasmane Konate, Yapi Sinare, Delphine Ouattara, Dr Souleymane Ouedraogo, Moussa Kabore, Bakary Belemou, Sibir Yameogo i, Besolbié Bationo, Ouambi Yameogo, Bila Koumtoubre, Adama Koursangama, Brice Ouedraogo, Damouko Bonde, Bernadette Kabore, Monique Sanou, Abdoulaye Ouedraogo, Martin Loada
Cameroon Dorothy Malaa, Nzodjo Pierre, Meppe François, Serge Kamgaing, Ayissi Thimothy, Ngninbeyie Pascal, Mfouandou Jean,
Cote d’Ivoire Doumbia Sekou, Youssouf Traore, Dr Bouet Alphonse, Depieu Ernest, Gabéhonry Karidioula, Kouassi Kouamé, Koffi Pierre, Arsène Aye N’cho, Koffi-Tanoé Marie Luise
Gambia Faye Manneh, Jawo Adama, Ebrima Cham, Sanyawg Bakary KS, Mendy Mary, Famara Kolley
Ghana John Nortey, Alexander Nimo Wiredu
Guinea Diawara Sékou, Condé Aly, Dr Beavogui Famoï, Barry Mamadou Billo, Fofana Yamoussa, Keïta Sékou, Diallo Thierno Saïdou
Kenya Winfred Koré, Thuranira Elias Gitonga

72
Country Names
Liberia Jobson A. Momo, Oliver Gayflor R Subah, Reginald W. Fannoh, Nathaniel S. Ketter, Daniel S. Gbigbi, Kolubah Kortee, Joseph K.F. Jorkeah, Abibatou T. Kroumah, James S. Dolo, Joseph Jockeh
Madagascar
Jean Nirisson Randriamoria, HL Abel-Rotovo, Raymond Rabeson, Justin Rakotomampionona, Maminirina Rakotoariliva, Claire Albine Ravaonindrina, Jaonarisoa Andriantseheno, Marie Agnès Lala Harinirina, Vola Lalao Albert Andriamanana, Niry Lanto Ranaivoson, Jean Albert Razafimahatratra, Justin Rakotoarimanana, Jean Rosa Liva Randriatahina, Ursula, Hajaniaina Victor Randrianandrasana, Edouard Henri Rakotondrazanany, Behaja Daniel Randrianantenaina, Souverain Randrianirina, Fameno Lanja Randremisa, Meltine Yalao Raliniel, Georgette Rasoaritompo, Madinirina Sandaniaina Andrianarison, Fidimalala Rahajarizafy Rambeloarison , Andriambolanoro Ramangatsalama, Lantonirina Rajaonarivelo, Samuel Randriamanampisoa, Michel Rolland Raharinirina, Armand Célestin Ramaroson, Nick Didier Alfred Fanomezantsoa,
Mali Bocar Dit Sire Ba, Boubacar Maiga, Mbaré Coulibaly, Diakité Kotié
Mozambique Diogo Domingos FR, Manganhelg Anina, Marcos Langa, Fidélio Salamandane, David J Megill
Nigeria Vivian Ojehomon, SB Adebayo, O Ogundele, Bandele Ogunlana, Olupomi Ajayi, Prof. Okoruwa Victor Olusegun
Central African Republic
M Hervé Mbedane, Reginald Bida-Kette, Théodore Oumarou, Alguesh Atim, Rigobert Ngouandji, Arnaud Bertrand Noudjeo, Serge Nzengoyu, Samson Ngarassem, Géneviève Yatangbando
Democratic Republic of Congo
Olivier Kinzamba, Robert Ngonde Nsakala, Daniel Dibwe, Francis Nkayilu, Gilbert Talongomo, Nono Katay Munkwese, André Mampaka, Floribert Tshiakatumba, Henriette Dina, Marcelline Diavezwa,
Rwanda Chantal Ingabire, Justine Mukayiranga, Innocent Ndikumana, E.René Gasoré, Joseph Mutware
Senegal
Alioune B. Dieng, Mamadou Sagna, Maîmouna Lô Gueye, Abdoulaye Mbengue, Mékha Babou, Fara Dione, Gorgui Djibril Diallo, Ousmane Diagne, Oumy Seck Lô, Sylvie Dasylva, Baldé Some, Moustapha Niang, Ndao née Tacko Diawara, Abiboulaye Sidibe, Diop née Madjiguène Diop, Falilou Faye, Badiane Badiane, Pierre Diouf, Maguette Ngom, Abdou Salam Seydi, Simon Diatta, Mamadou Lamine Konte, Boubacar BA, David Diatta, Mouhamed Mbaye, Djibril Soumare, Oumou khaïry Fall, Félicité Sidonie Gomis, Ibrahima Diatta, Boubacar Diop, Mamadou Sakhir Diene, Khady Dia, Oumou Basse, Khady Dieng, Soukey Dione

73
Country Names
Sierra Leone Mahmood Ahmed Nazir, Mohamed Ajuba Sheriff
Tanzania Malemi Nyanda, Elisha Martine Mkandya
Togo Tsogli Ezi, Tsatsu K. Domenyo, Pr Koffi-Tessio, Lébene Kougnenya, Kodjo Dokodjo, Kodjo Labare
Uganda
Stella Adur, Benard Odur, Mary Frances Nakakawa, Godfrey Asea, Trust Tumwesigye, Wilber Wambi, Moses Waswa, Maria Nsengiyunva, Geoffrey Onaga, Simpo Rose Akech Ogwang, Patrick Odur Okunyu, Jimmy Okori, Jane Alupo, Stephen Okanya, Moses Ebellu, Francis Ogune, Frances Nakakawa, Maria M. Nsengiyunva, Samuel James Kayongo, Wilber Wambi, Annette Nakayima, Teopista Namirimu, Moses Wasswa, Rachael Ajambo, Simon Alibu, Damalie B. Magala, Andrew Ssali, Solomon Kaboyo, Martin Muherezi, Macklean Kirungi, James Chiria, Wilber Wambi, Maria Nsengiyunva