rice in the delta – the potential to mitigate subsidence...
TRANSCRIPT
Agriculture and Food Research Initiative:
Rice in the Delta – The Potential to Mitigate Subsidence and Enhance
Sustainability
Philip Bachand, Sandra Bachand, Amy Merrrill, Stuart Siegel, Steve Deverel, Bruce Linquist, Emilie Kirk, Sara Knox, Rongzong Ye, Matt Espe, Jennifer Morris, Yacov Assa,
Dennis Baldocchi, Leslie Bulter, Duncan MacEwan, Andrea Brock, Jaclyn Hatala, Jacob Fleck and Will Horwath
Tetra Tech
530-564-4591 [email protected]
www.bachandassociates.com
Rice culture in the Sacramento – San Joaquin Delta to mitigate past
agricultural impacts, improve water quality and sequester carbon
Bay Delta Conference
Sacramento, CA
October 29, 2014
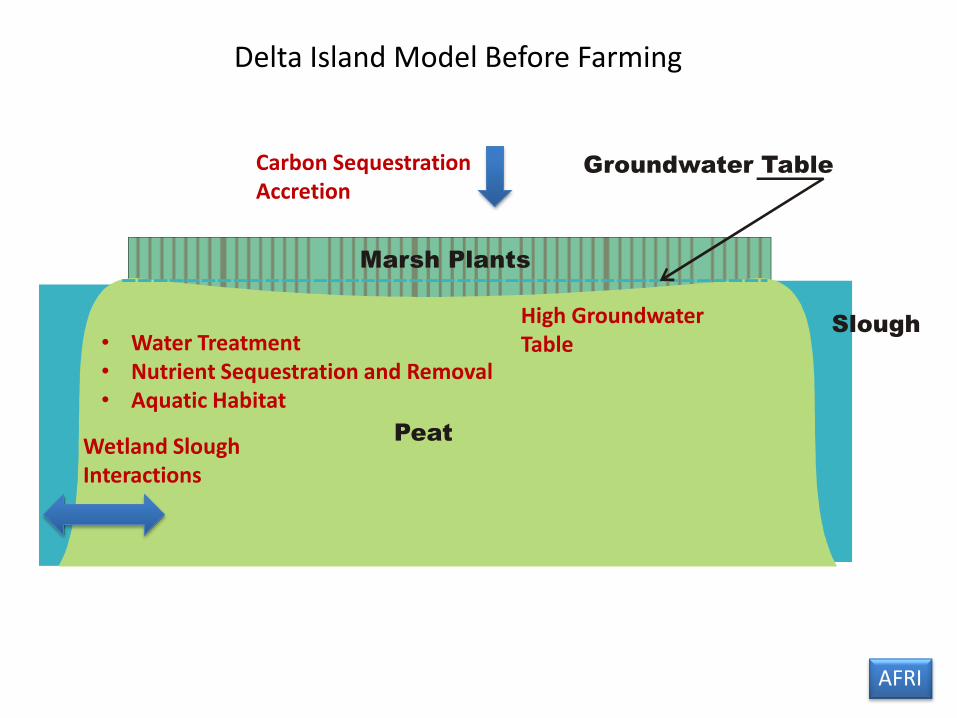
Marsh Plants
Peat
Slough
Groundwater Table
Delta Island Model Before Farming
Carbon Sequestration Accretion
• Water Treatment • Nutrient Sequestration and Removal • Aquatic Habitat
High Groundwater Table
Wetland Slough Interactions
AFRI
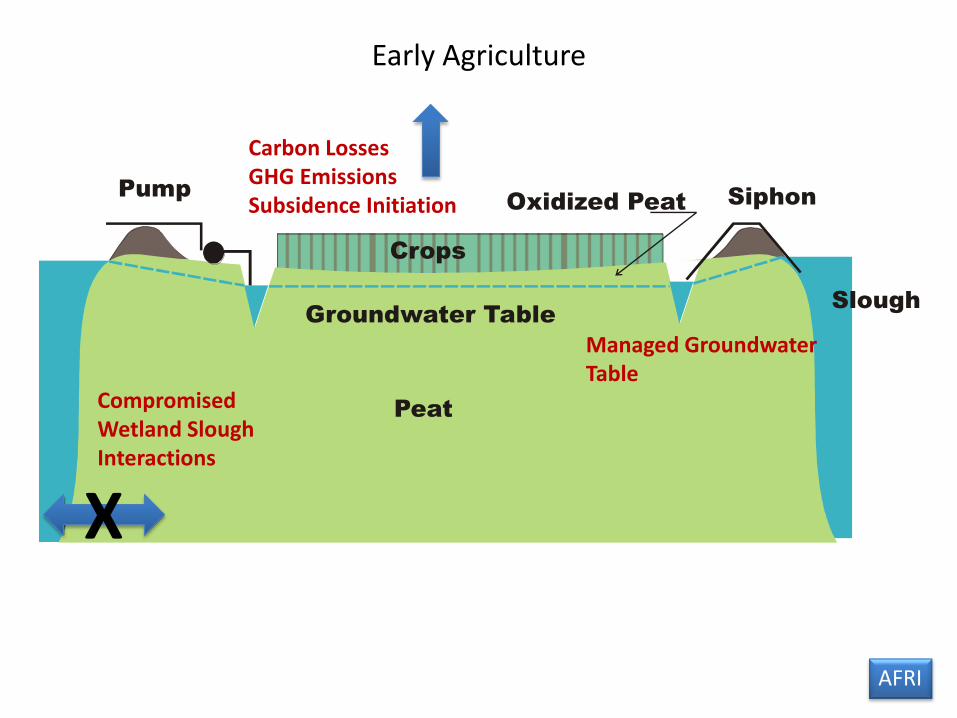
Crops
Peat
Slough
SiphonPump
Oxidized Peat
Groundwater Table
Early Agriculture
Managed Groundwater Table
Compromised Wetland Slough Interactions
Carbon Losses GHG Emissions Subsidence Initiation
AFRI
X
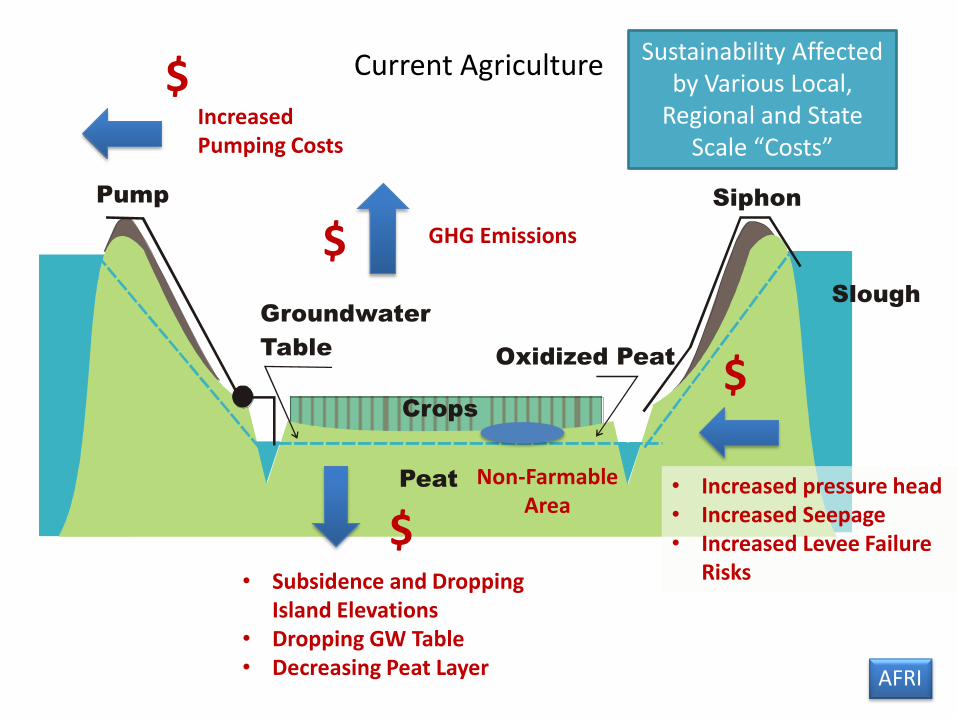
Crops
Peat
Slough
SiphonPump
Oxidized Peat
Groundwater
Table
Current Agriculture
• Subsidence and Dropping Island Elevations
• Dropping GW Table • Decreasing Peat Layer
• Increased pressure head • Increased Seepage • Increased Levee Failure
Risks
Increased Pumping Costs
GHG Emissions $
$
$
$
Non-Farmable Area
AFRI
Sustainability Affected by Various Local,
Regional and State Scale “Costs”

5
AFRI
Subsidence in the Delta
Subsidence in the Delta
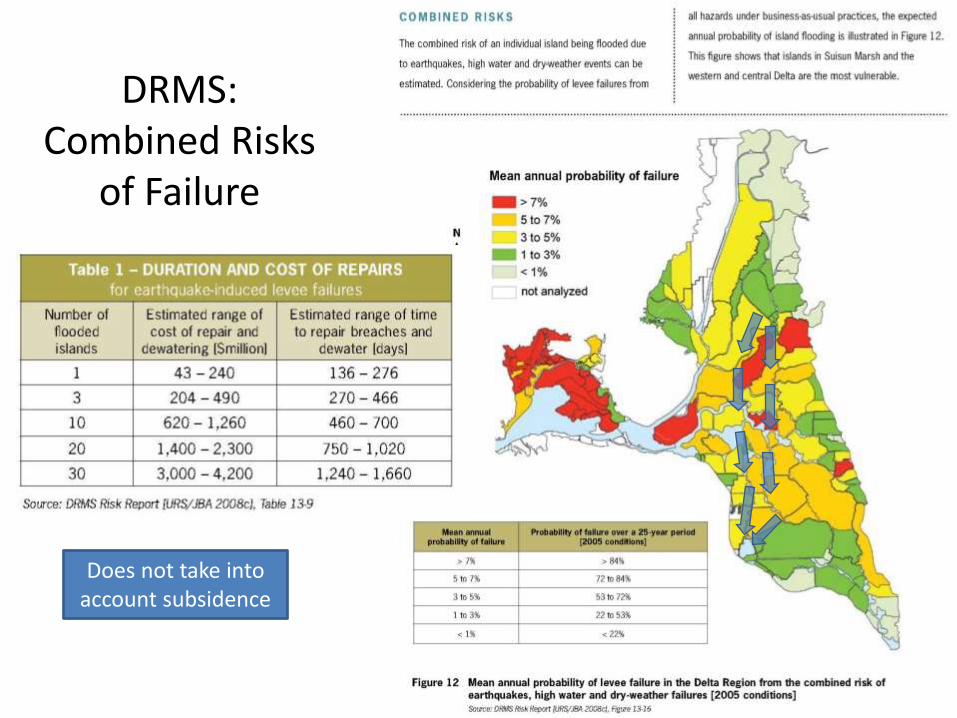
DRMS: Combined Risks
of Failure
Does not take into account subsidence
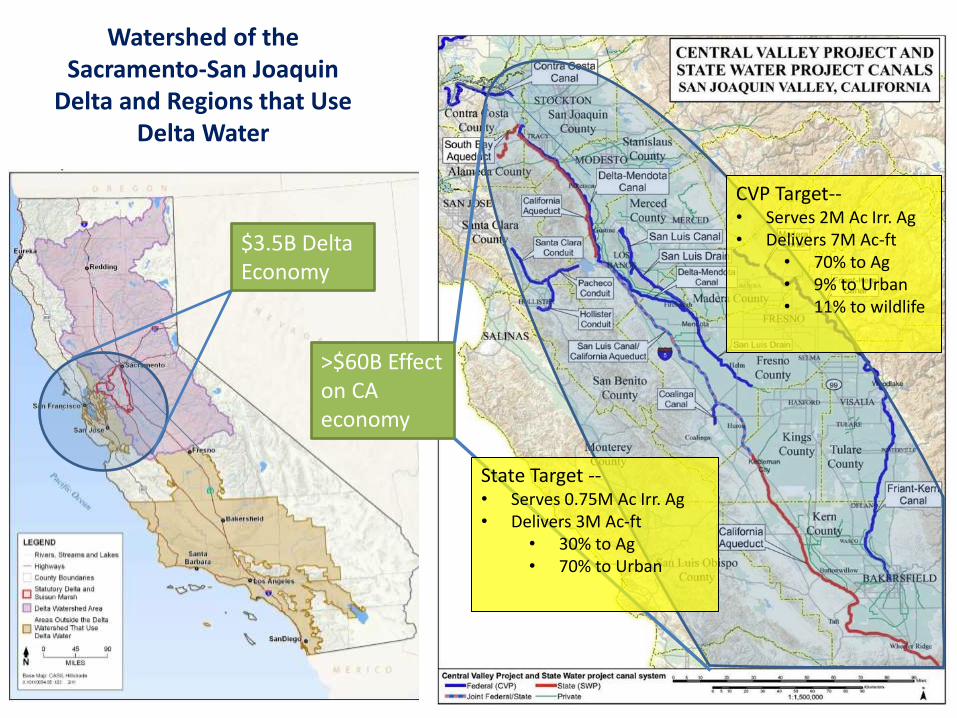
Watershed of the Sacramento-San Joaquin
Delta and Regions that Use Delta Water
$3.5B Delta Economy
>$60B Effect on CA economy
State Target -- • Serves 0.75M Ac Irr. Ag • Delivers 3M Ac-ft
• 30% to Ag • 70% to Urban
CVP Target-- • Serves 2M Ac Irr. Ag • Delivers 7M Ac-ft
• 70% to Ag • 9% to Urban • 11% to wildlife
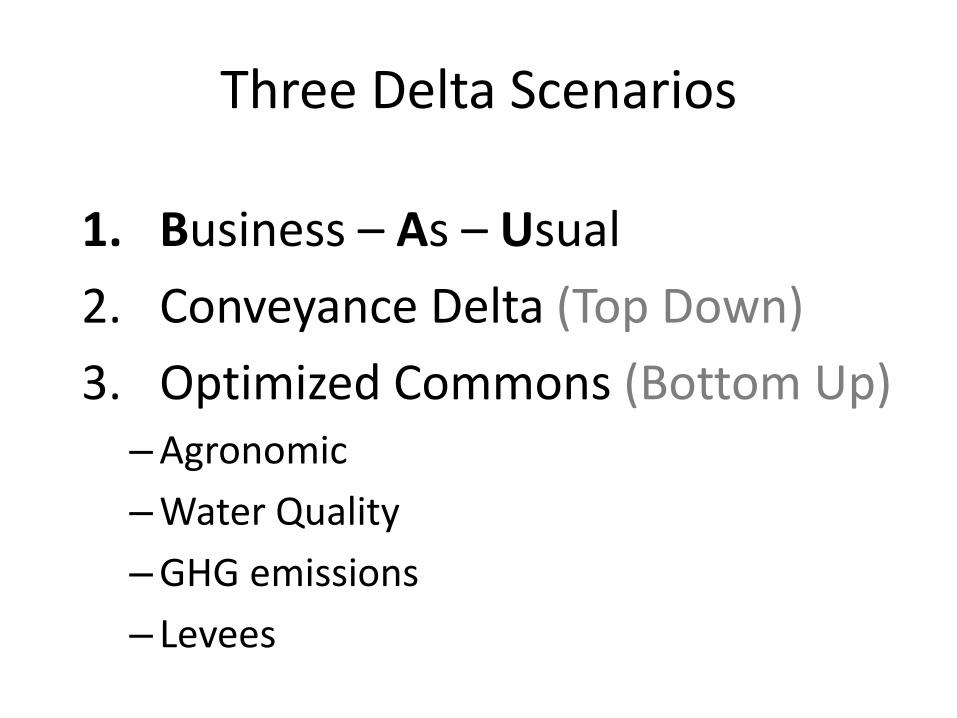
Three Delta Scenarios
1. Business – As – Usual
2. Conveyance Delta (Top Down)
3. Optimized Commons (Bottom Up) –Agronomic
–Water Quality
–GHG emissions
– Levees

Scenario 2: Conveyance Delta (Risk Reduction Driven)
• Conveyance Corridor
• Rice and Wetlands Placed to Reduce Levee Failure Risks from Subsidence and Sea Level Rise
• Primary Benefit & Value Reducing Risks to CA water supply
• Failure Risks = F(x1, x2 ….., xi) – Effects of depth of peat/mud on failure plane
– Effects of head pressure (water elevation – land elevation)
– Type of failure: Static, seepage, seismic
– Island water table
– Lands uses proximity to levees
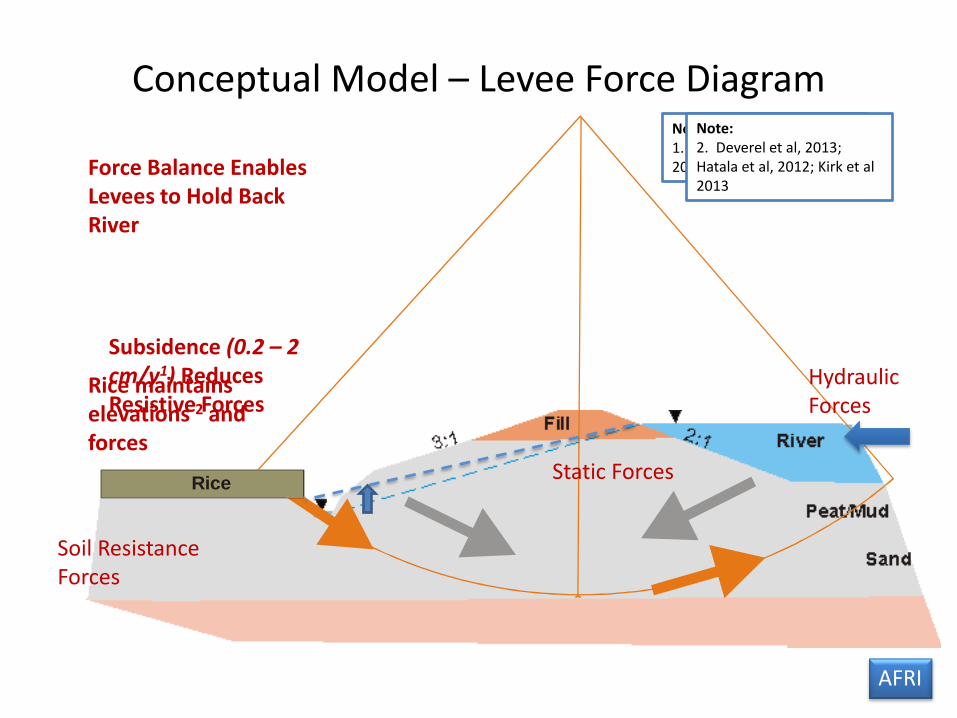
Conceptual Model – Levee Force Diagram
Soil Resistance Forces
Static Forces
Force Balance Enables Levees to Hold Back River
Subsidence (0.2 – 2 cm/y1) Reduces Resistive Forces
Rice
Rice maintains elevations 2 and forces
Hydraulic Forces
AFRI
Note: 1. Deverel et al, 1996, 2010, 2013; Hatala et al, 2012
Note: 2. Deverel et al, 2013; Hatala et al, 2012; Kirk et al 2013
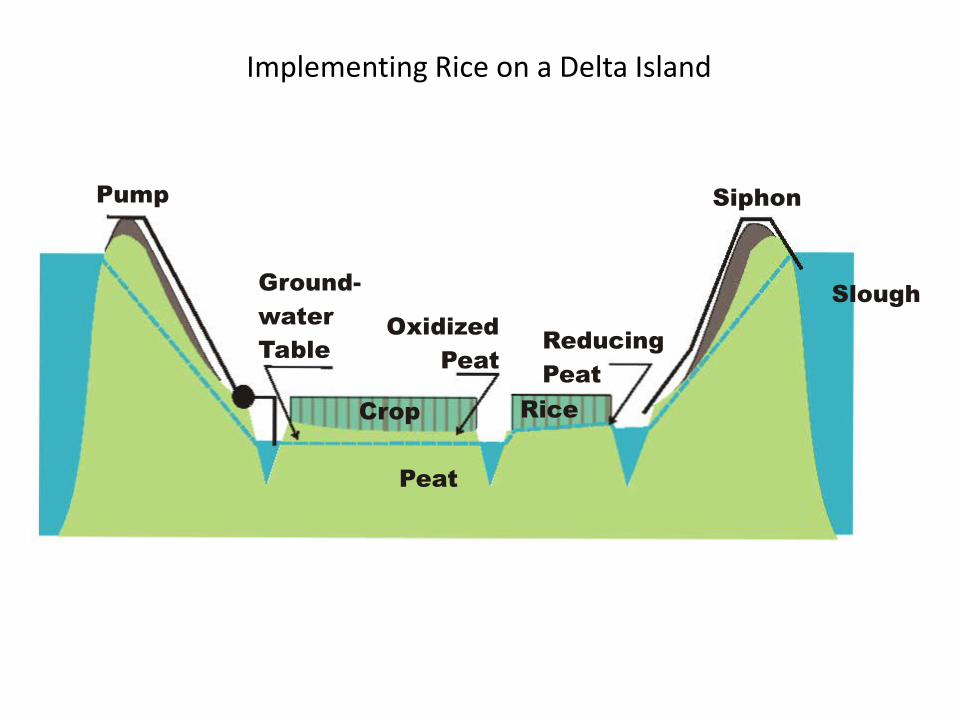
RiceCrop
Peat
Slough
SiphonPump
Oxidized
Peat
Reducing
Peat
Ground-
water
Table
Implementing Rice on a Delta Island
-------
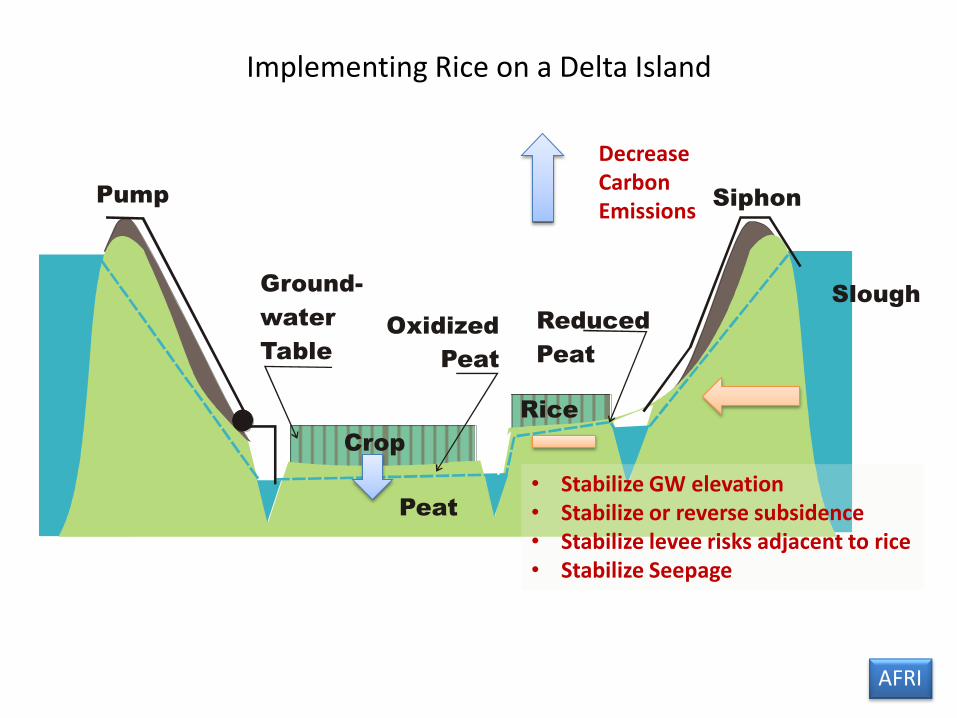
Rice
Crop
Peat
Slough
SiphonPump
Oxidized
Peat
Reduced
Peat
Ground-
water
Table
Implementing Rice on a Delta Island
• Stabilize GW elevation • Stabilize or reverse subsidence • Stabilize levee risks adjacent to rice • Stabilize Seepage
Decrease Carbon Emissions
AFRI
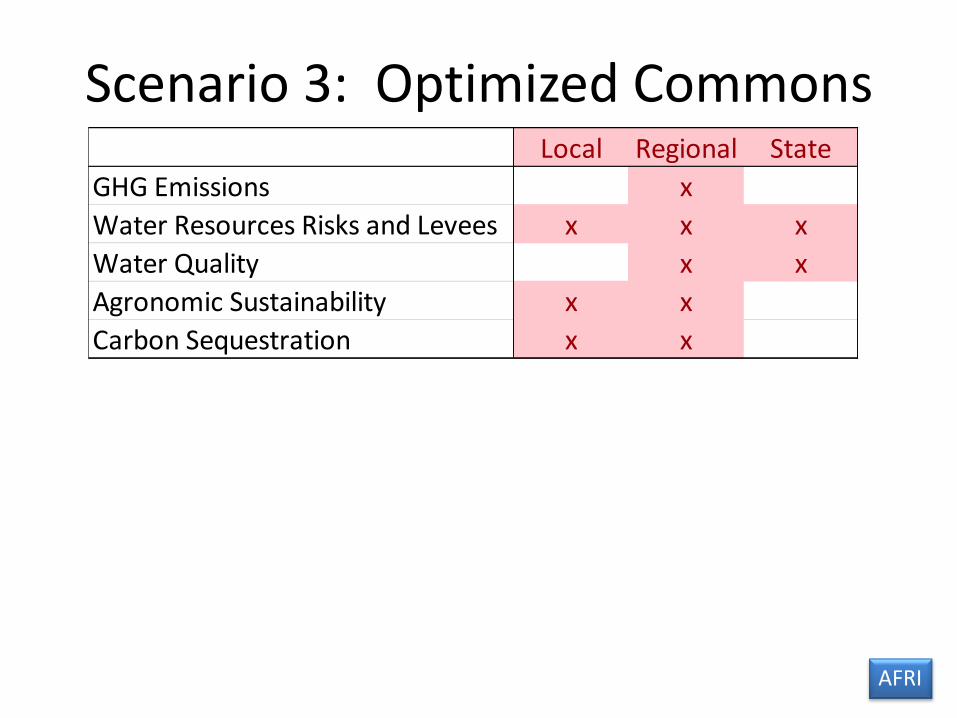
Scenario 3: Optimized Commons Local Regional State
GHG Emissions x
Water Resources Risks and Levees x x x
Water Quality x x
Agronomic Sustainability x x
Carbon Sequestration x x
AFRI

Scenario 3: Optimized Commons Local Regional State
GHG Emissions x
Water Resources Risks and Levees x x x
Water Quality x x
Agronomic Sustainability x x
Carbon Sequestration x x
GHG Emission = ∑GHG Emissions I =
CO2 Emission + CH4 Emissions + N2O Emissions
GHG Emission I,x,y = F (Soil Carbon, Hydrology/Redox, Management, Climate ….) x,y
GHG EmissionI = ∑GHG Emissions I,x,y
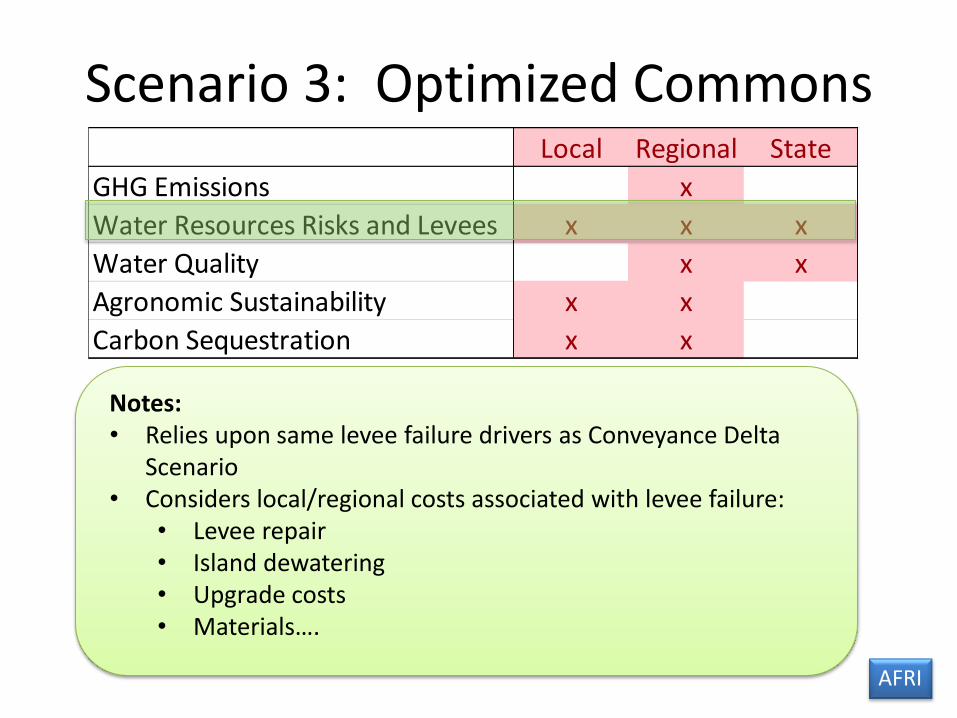
Scenario 3: Optimized Commons Local Regional State
GHG Emissions x
Water Resources Risks and Levees x x x
Water Quality x x
Agronomic Sustainability x x
Carbon Sequestration x x
AFRI
Notes: • Relies upon same levee failure drivers as Conveyance Delta
Scenario • Considers local/regional costs associated with levee failure:
• Levee repair • Island dewatering • Upgrade costs • Materials….
Scenario 3: Optimized Commons Local Regional State
GHG Emissions x
Water Resources Risks and Levees x x x
Water Quality x x
Agronomic Sustainability x x
Carbon Sequestration x x
AFRI
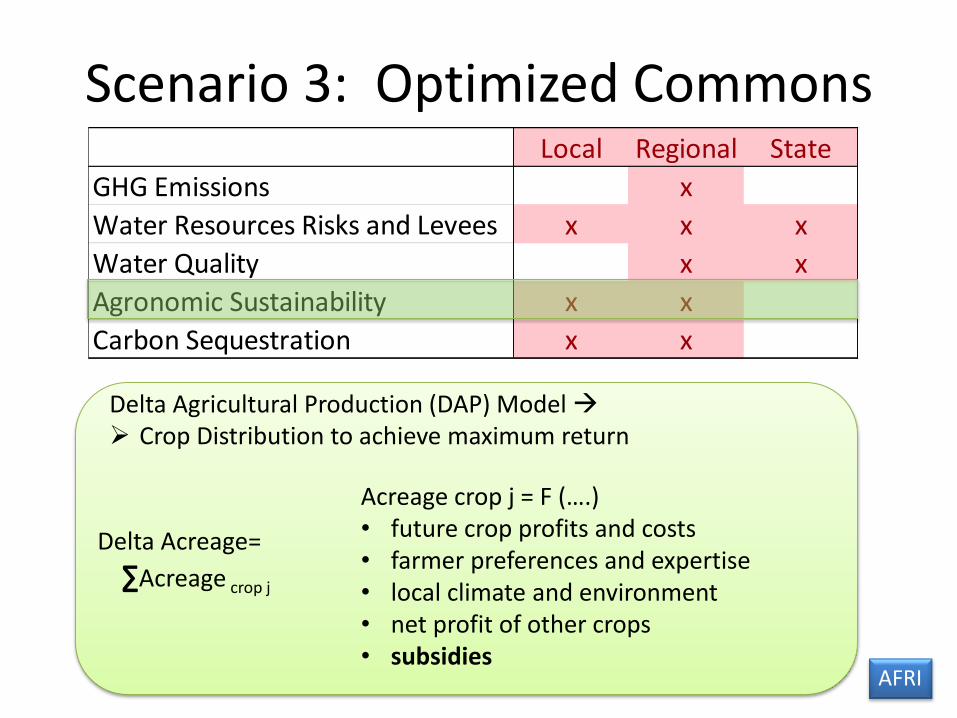
Delta Agricultural Production (DAP) Model Crop Distribution to achieve maximum return
Delta Acreage=
∑Acreage crop j
Acreage crop j = F (….) • future crop profits and costs • farmer preferences and expertise • local climate and environment • net profit of other crops • subsidies

Scenario 3: Optimized Commons Local Regional State
GHG Emissions x
Water Resources Risks and Levees x x x
Water Quality x x
Agronomic Sustainability x x
Carbon Sequestration x x
Discharge Loads = ∑Seasonal LoadI = Summer Load + Winter Load
Seasonal Island Load = F(…..) • Crop Distribution and Acreage on Island • Island Crop Mosaic • Island size and elevation • Management (crop, field, island)
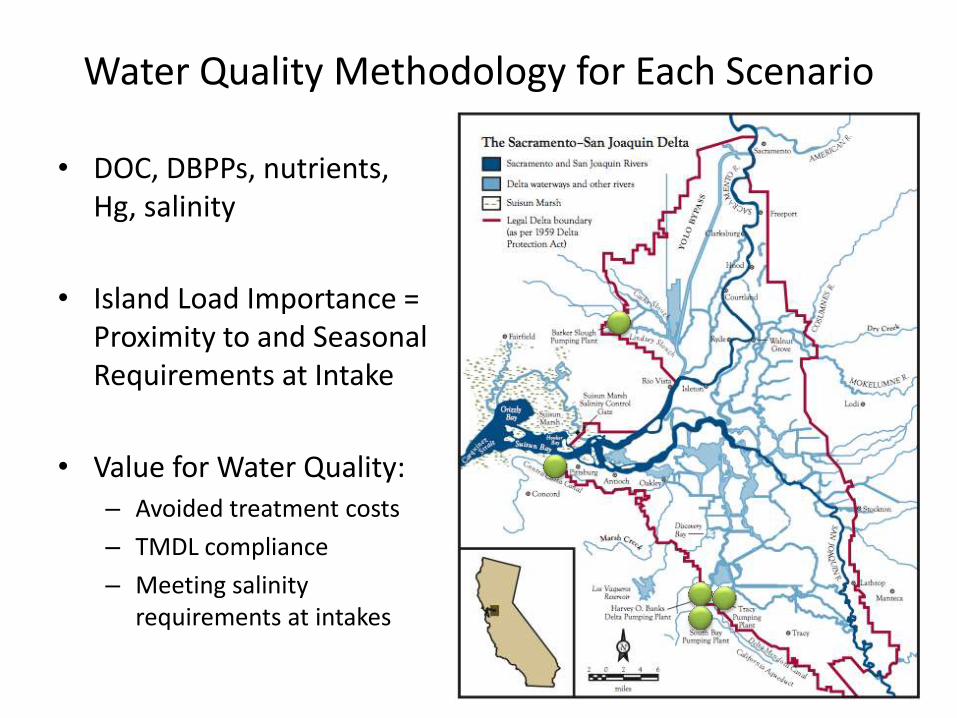
Water Quality Methodology for Each Scenario
• DOC, DBPPs, nutrients, Hg, salinity
• Island Load Importance = Proximity to and Seasonal Requirements at Intake
• Value for Water Quality: – Avoided treatment costs
– TMDL compliance
– Meeting salinity requirements at intakes
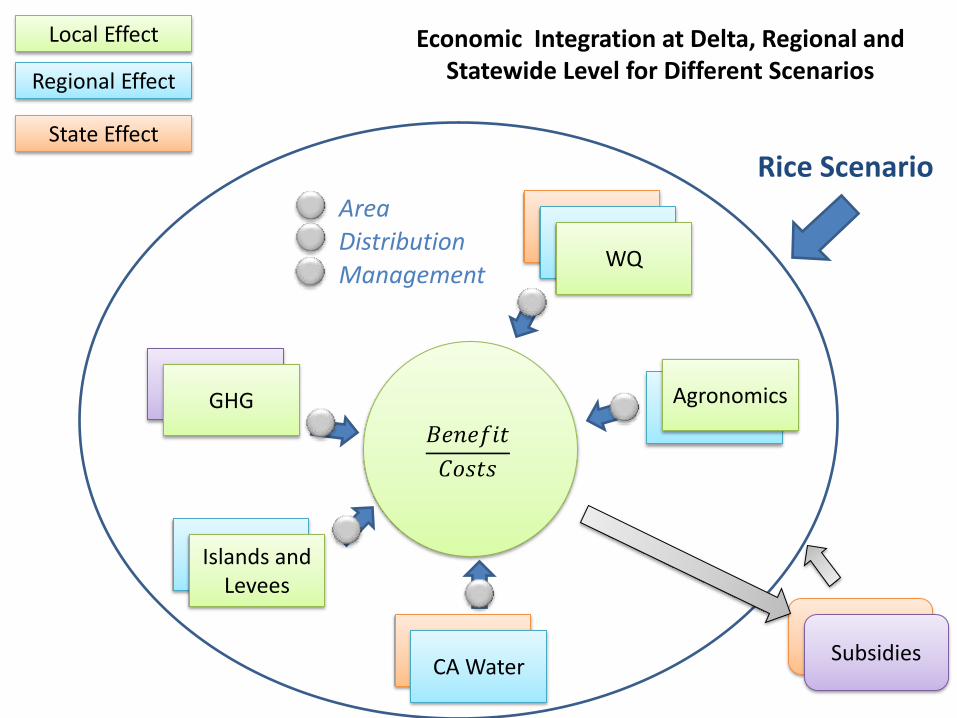
Economic Integration at Delta, Regional and Statewide Level for Different Scenarios
GHG
WQ
CA Water
𝐵𝑒𝑛𝑒𝑓𝑖𝑡
𝐶𝑜𝑠𝑡𝑠
GHG
Islands and Levees
Agronomics
WQ WQ
CA Water
Local Effect
Regional Effect
State Effect
Subsidies Subsidies
Area Distribution
Management
Rice Scenario

Summary • Rice agriculture and wetlands can be a means towards
more stable levees and a more sustainable Delta. • Strong interdisciplinary assessment serves as a planning
model for change in the Delta • Two more years and addressing big picture issues
associated with land management in the Delta • AFRI Posters:
– Flood Management: • R. Gehlke, Delta Science Center. N fertilizer treatments for Delta Rice
– Human Consequences: • R. Ye. Effects of N fertilization and Soil Carbon on GHG emissions from
Delta rice
– Integrative Applied Science • N. Stern. Integrating Surface and Shallow Subsurface Hydrologic and
WQ interactions in Delta Rice
Questions?


Rice Impacts in the Delta
Water Resources
Water Qual -
Hg
Water Qual -
DOC
Water Supply
- Conveyance
Water Supply
- Volume
Rice
Fields
Agro-
nomic
Practices
Cultivars
Seasonal
Hydrology
Flow to Drains
Terrestrial
Crops
Agro-
nomic
Practices
Cultivars
Seasonal
Hydrology
Island Mgmt
ETMethylation
Decompostion
Transport
Net Island Exports
Accretion
Oxidation
Water Supply
- Security
Levee
Stability
Seepage
Local Scale
Regional
Scale
Water
Project Scale
C -
Sequestration
Subsidence /
Accretion
GHGs
Accretion
Oxidation
AFRI
Drivers: • Soil Organic Matter • C:N ratio • Redox (O2, NO3,
Fe, SO4) • Land Use • Cultural Practices • Irrigation • Climate and
Temperature
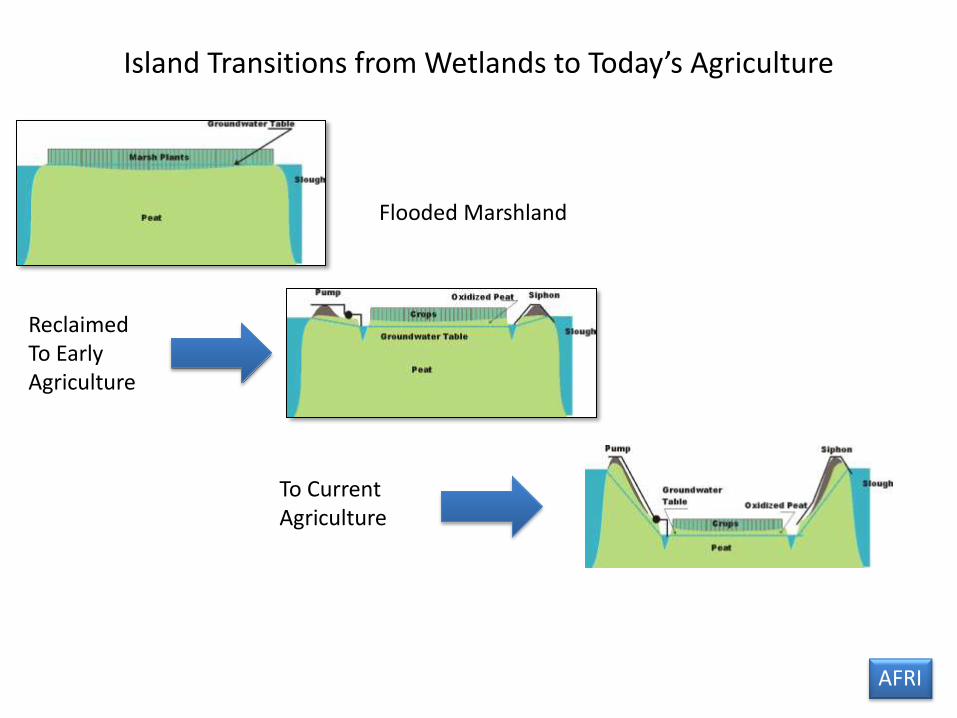
Island Transitions from Wetlands to Today’s Agriculture
Flooded Marshland
Reclaimed To Early Agriculture
To Current Agriculture
AFRI

Future Opportunities with Rice and Wetlands
With Rice (Now)
Current Agriculture
With Rice (One Future Scenario)
AFRI
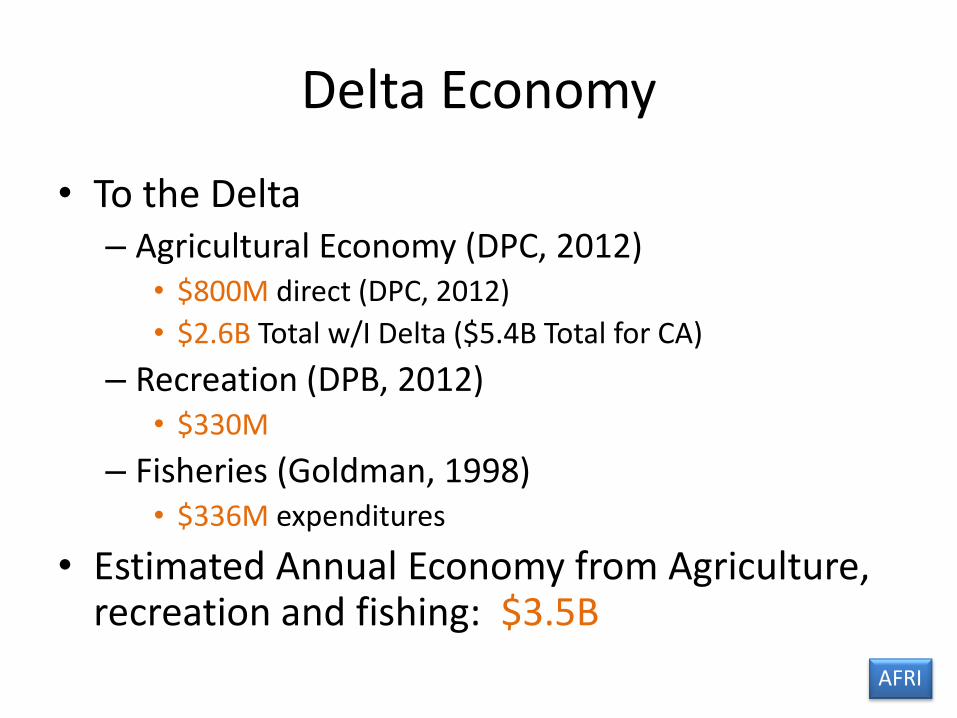
Delta Economy
• To the Delta – Agricultural Economy (DPC, 2012)
• $800M direct (DPC, 2012)
• $2.6B Total w/I Delta ($5.4B Total for CA)
– Recreation (DPB, 2012) • $330M
– Fisheries (Goldman, 1998) • $336M expenditures
• Estimated Annual Economy from Agriculture, recreation and fishing: $3.5B
26 AFRI
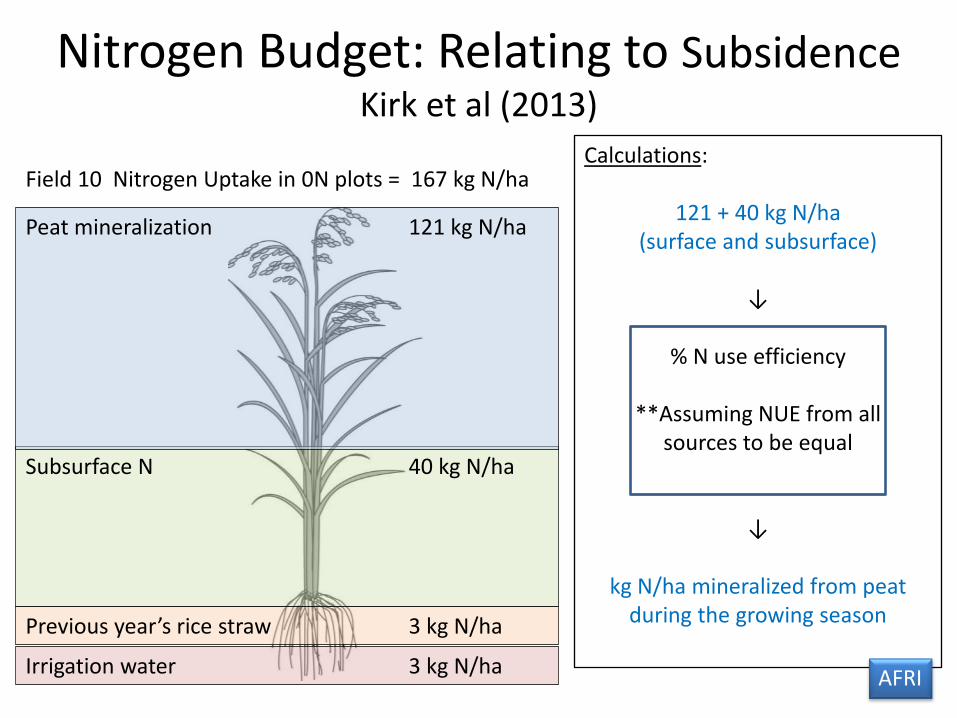
Subsurface N 40 kg N/ha
Nitrogen Budget: Relating to Subsidence Kirk et al (2013)
Irrigation water 3 kg N/ha
Previous year’s rice straw 3 kg N/ha
Peat mineralization 121 kg N/ha
Field 10 Nitrogen Uptake in 0N plots = 167 kg N/ha Calculations:
121 + 40 kg N/ha (surface and subsurface)
↓
% N use efficiency
**Assuming NUE from all
sources to be equal
↓
kg N/ha mineralized from peat during the growing season
AFRI

Net Ecosystem Exchange (g-C/m2/d) Hatala et al 2012)
AFRI
0.000
0.500
1.000
1.500
2.000
2.500
-20.00
0.00
20.00
40.00
60.00
80.00
100.00
120.00
140.00
160.00
Wate
r le
vel re
cord
ed b
y tr
anducer
(m)
Ch
an
ge
in
la
nd
su
rfa
ce
ele
va
tio
n (
mm
)
LVDT Manual land surface elevation measurements Water level
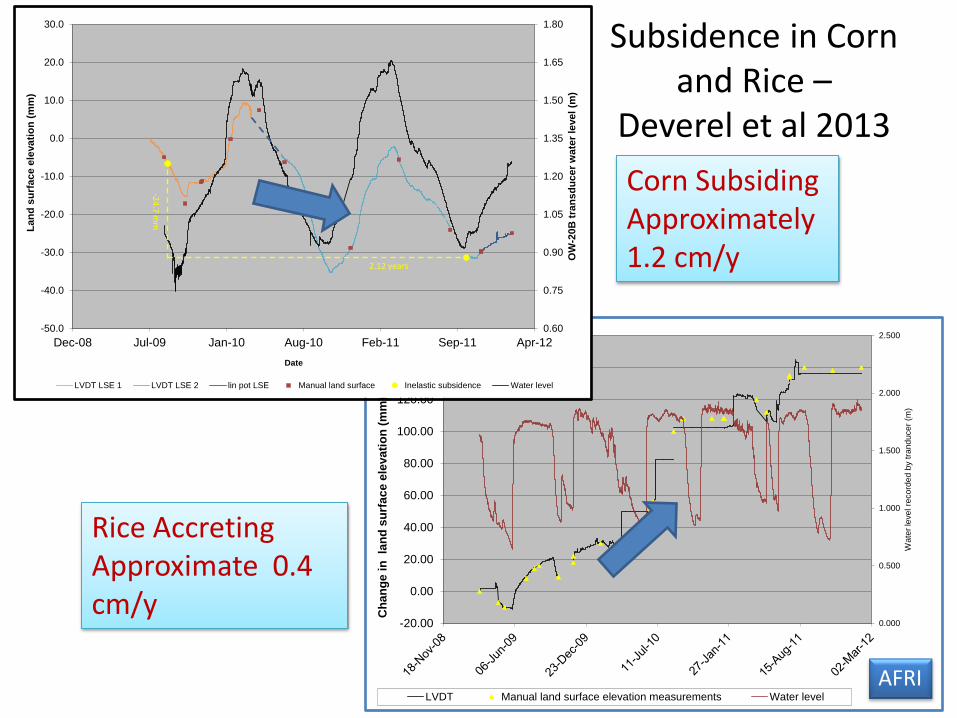
Subsidence in Corn and Rice –
Deverel et al 2013
0.60
0.75
0.90
1.05
1.20
1.35
1.50
1.65
1.80
-50.0
-40.0
-30.0
-20.0
-10.0
0.0
10.0
20.0
30.0
Dec-08 Jul-09 Jan-10 Aug-10 Feb-11 Sep-11 Apr-12
OW
-20
B t
ran
sd
uc
er
wa
ter
leve
l (m
)
La
nd
su
rfa
ce
ele
va
tio
n (
mm
)
Date
LVDT LSE 1 LVDT LSE 2 lin pot LSE Manual land surface Inelastic subsidence Water level
2.12 years
-24
.7 m
m
Corn Subsiding Approximately 1.2 cm/y
AFRI
Rice Accreting Approximate 0.4 cm/y
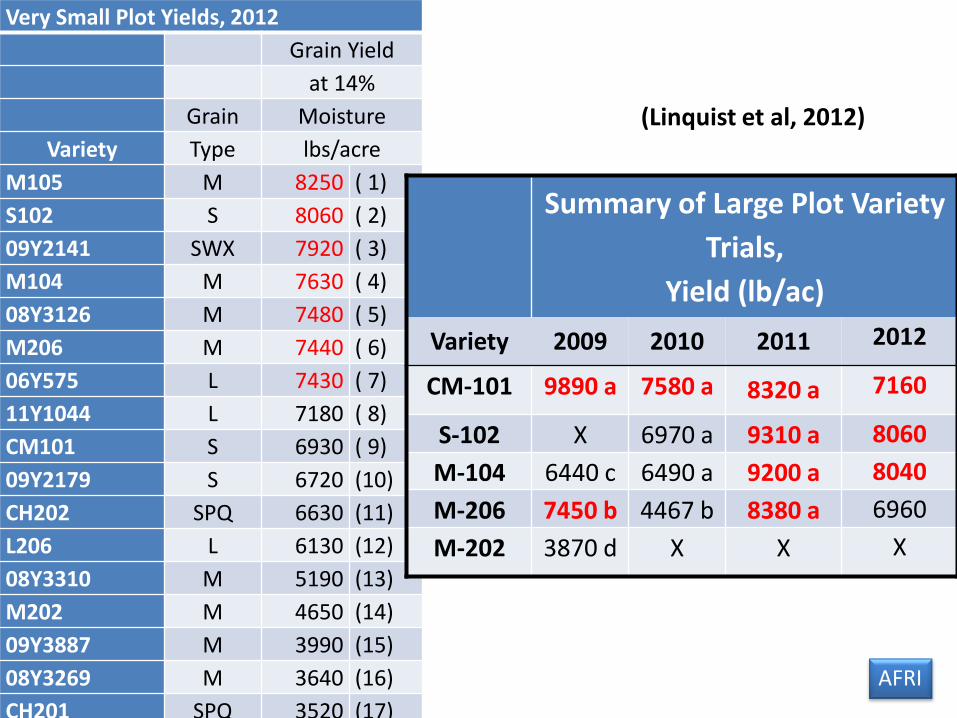
(Linquist et al, 2012)
30
Very Small Plot Yields, 2012
Grain Yield
at 14%
Grain Moisture
Variety Type lbs/acre
M105 M 8250 ( 1)
S102 S 8060 ( 2)
09Y2141 SWX 7920 ( 3)
M104 M 7630 ( 4)
08Y3126 M 7480 ( 5)
M206 M 7440 ( 6)
06Y575 L 7430 ( 7)
11Y1044 L 7180 ( 8)
CM101 S 6930 ( 9)
09Y2179 S 6720 (10)
CH202 SPQ 6630 (11)
L206 L 6130 (12)
08Y3310 M 5190 (13)
M202 M 4650 (14)
09Y3887 M 3990 (15)
08Y3269 M 3640 (16)
CH201 SPQ 3520 (17)
M205 M 2990 (18)
Summary of Large Plot Variety
Trials,
Yield (lb/ac)
Variety 2009 2010 2011 2012
CM-101 9890 a 7580 a 8320 a 7160
S-102 X 6970 a 9310 a 8060
M-104 6440 c 6490 a 9200 a 8040
M-206 7450 b 4467 b 8380 a 6960
M-202 3870 d X X X
AFRI
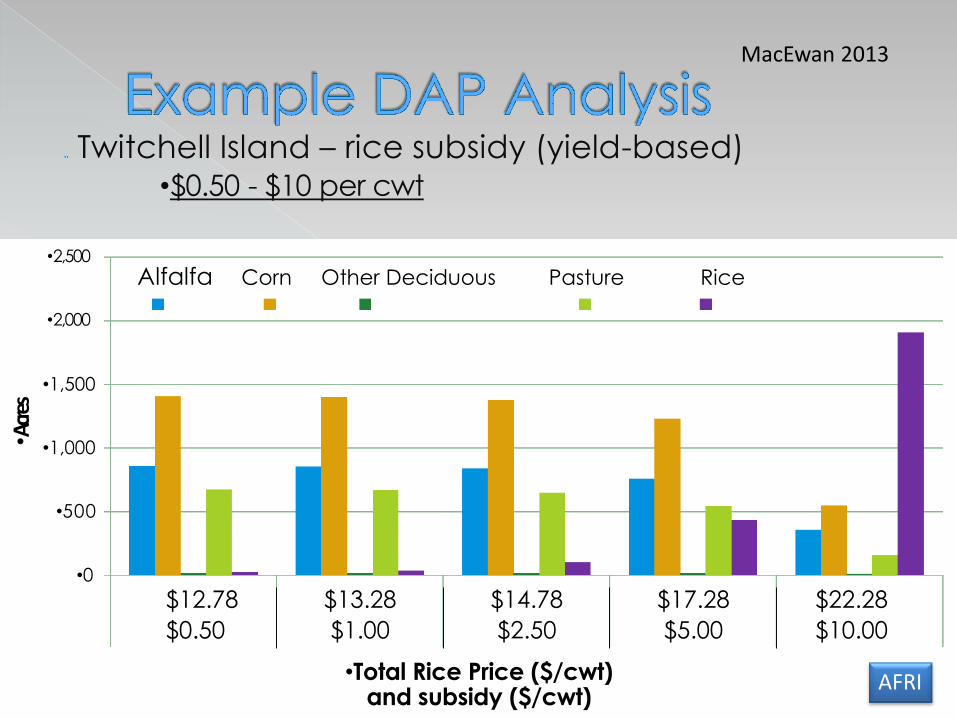
• Twitchell Island – rice subsidy (yield-based) •$0.50 - $10 per cwt
Alfalfa Corn Other Deciduous Pasture Rice •2,500
•2,000
•500
•0
$12.78 $13.28 $14.78 $17.28 $22.28
$0.50 $1.00 $2.50 $5.00 $10.00
•Total Rice Price ($/cwt) and subsidy ($/cwt)
•Acre
s
•1,500
•1,000
MacEwan 2013
AFRI
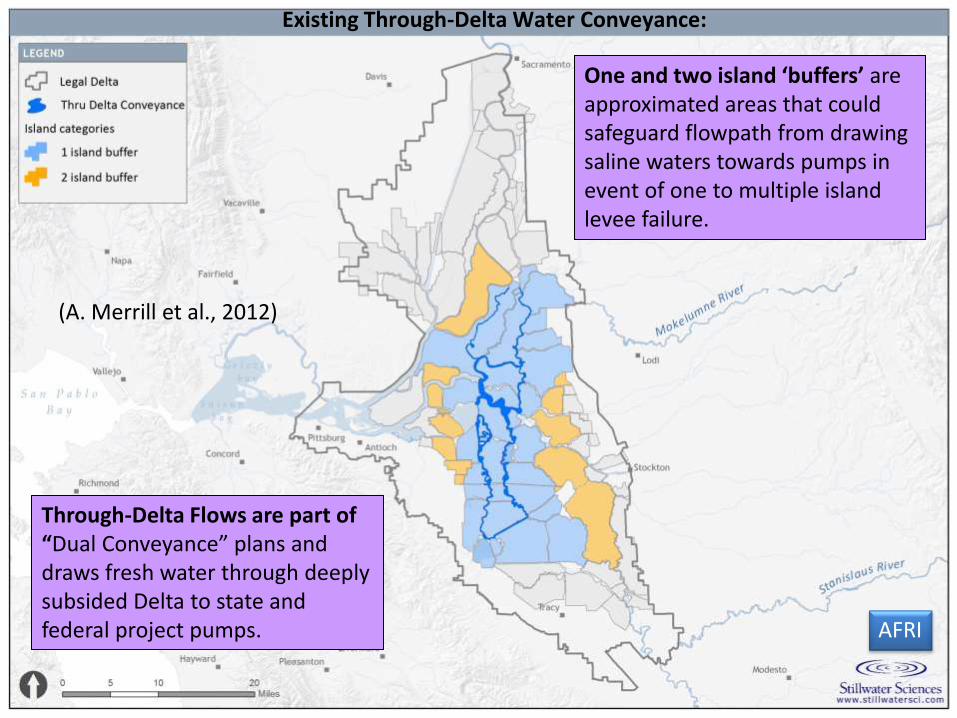
Existing Through-Delta Water Conveyance:
Through-Delta Flows are part of “Dual Conveyance” plans and draws fresh water through deeply subsided Delta to state and federal project pumps.
(A. Merrill et al., 2012)
One and two island ‘buffers’ are approximated areas that could safeguard flowpath from drawing saline waters towards pumps in event of one to multiple island levee failure.
AFRI
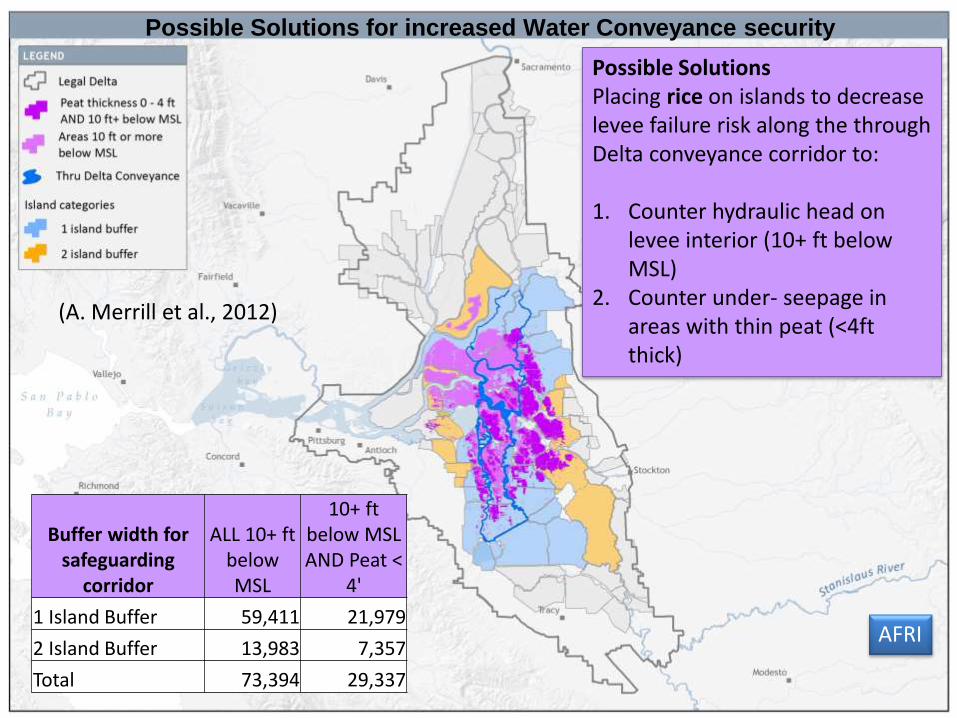
Possible Solutions Placing rice on islands to decrease levee failure risk along the through Delta conveyance corridor to: 1. Counter hydraulic head on
levee interior (10+ ft below MSL)
2. Counter under- seepage in areas with thin peat (<4ft thick)
Buffer width for safeguarding
corridor
ALL 10+ ft below MSL
10+ ft below MSL AND Peat <
4'
1 Island Buffer 59,411 21,979
2 Island Buffer 13,983 7,357
Total 73,394 29,337
Possible Solutions for increased Water Conveyance security
(A. Merrill et al., 2012)
AFRI

Rice – How Much to Manage Subsidence Risks to Levee Failure?
• Too early to know – Estimate of 10,000s of Acres
• Say 15,000 – 40,000
– Subsidy likely needed to promote rice • High value crops: Tomatos, grapes, etc…
• Alfalfa ….
• Past subsidies to promote rice have been about $150/ac (2004/05 Delta Rice Project)
• Potentially range of $5/sack ($400/ac)
– Reasonable estimate of $2 – 16M annually to prevent increasing levee subsidence risk through rice subsidy
• Numbers will be product of AFRI AFRI

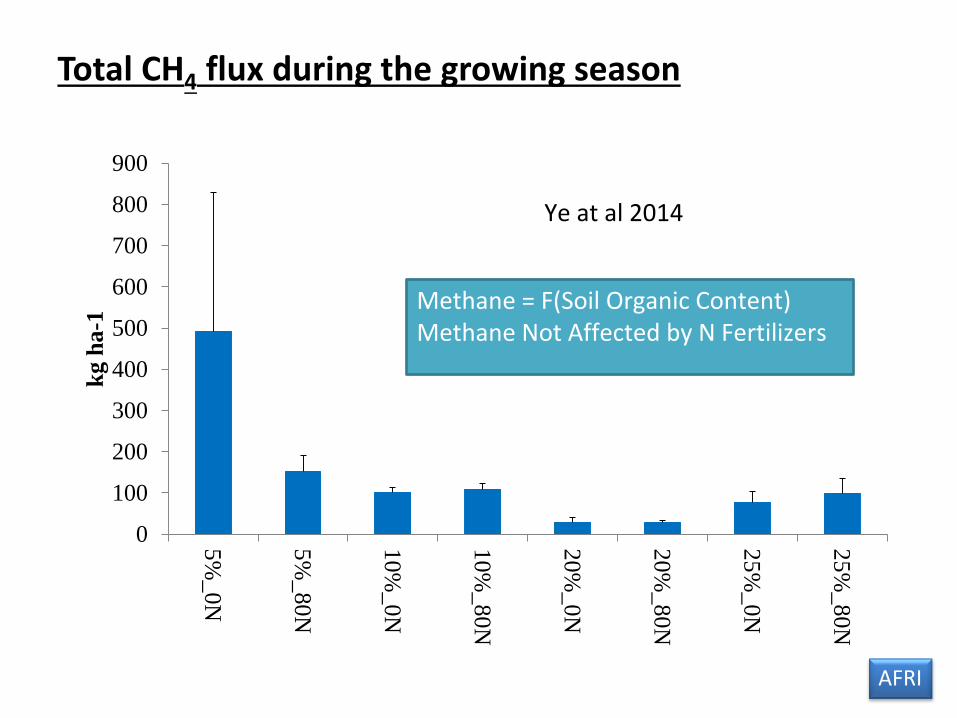
Fertilizer and Yield, Espe 2013 Yield Vs N Fertilizer for Delta Soils as % Carbon
3% Carbon
11% Carbon
23% Carbon
0
100
200
300
400
500
600
700
800
900
5%
_0N
5%
_80N
10%
_0N
10%
_80N
20%
_0N
20%
_80N
25%
_0N
25%
_80N
kg h
a-1
Ye at al 2014
Methane = F(Soil Organic Content) Methane Not Affected by N Fertilizers
Total CH4 flux during the growing season
AFRI
-1.0
-0.5
0.0
0.5
1.0
1.5
2.0
2.5
3.0
5%
_0N
5%
_80N
10%
_0N
10%
_80N
20%
_0N
20%
_80N
25%
_0N
25%
_80N
kg
ha
-1
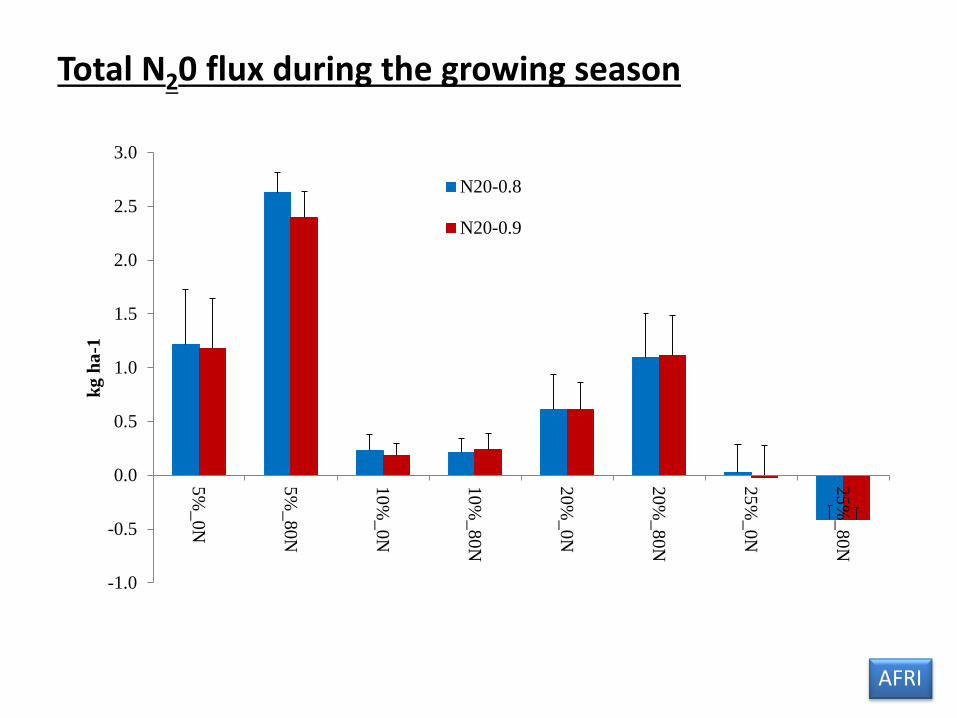
N20-0.8
N20-0.9
Total N20 flux during the growing season
AFRI
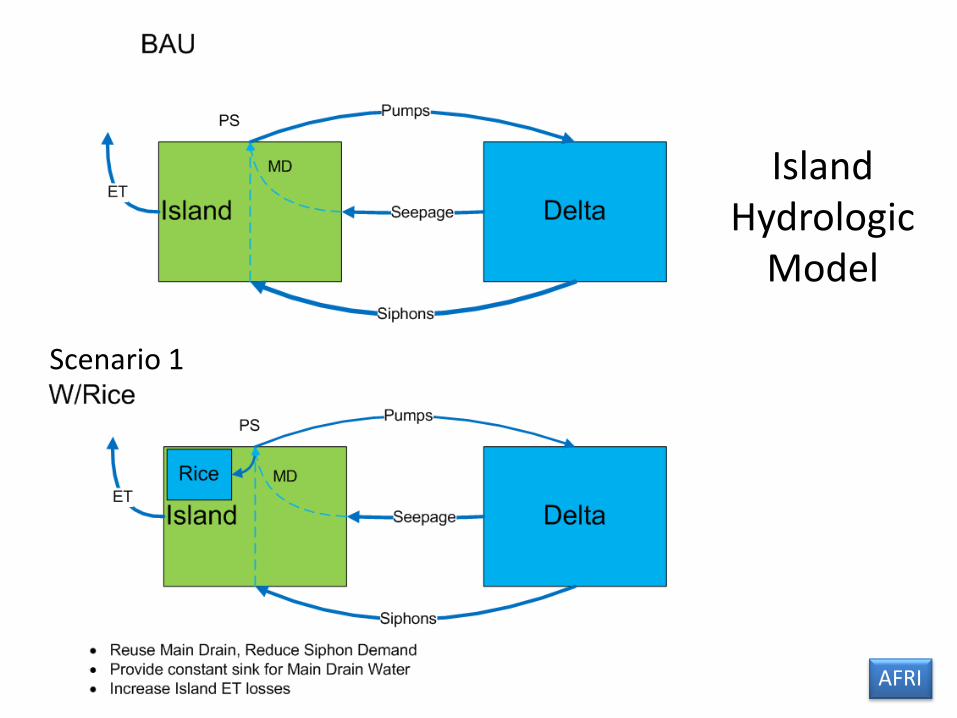
Island Hydrologic
Model
38
Scenario 1
AFRI
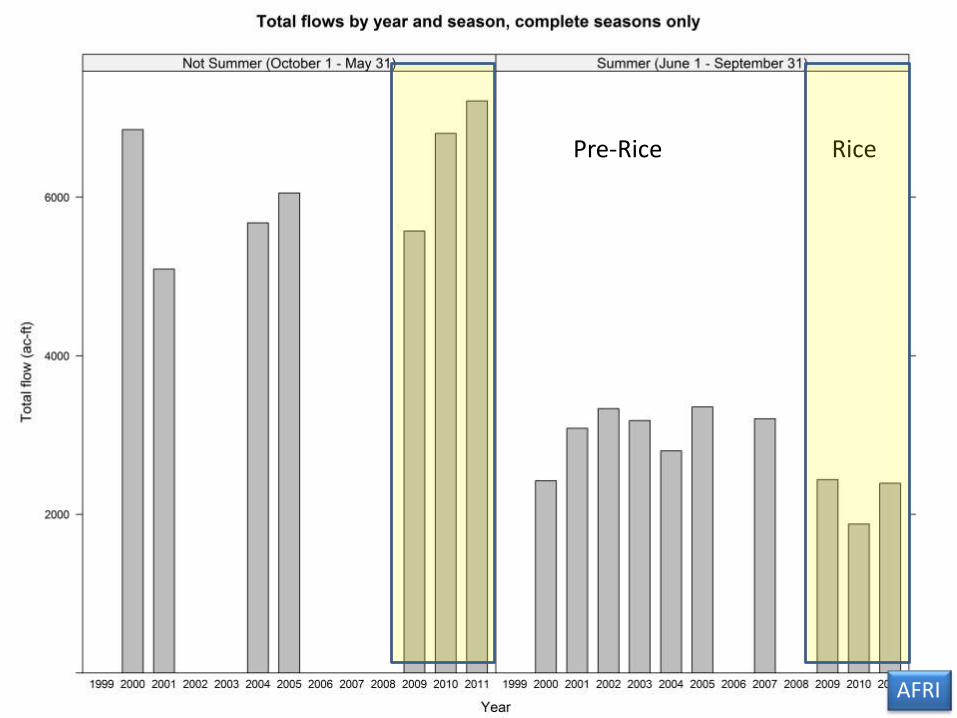
Pre-Rice Rice
AFRI
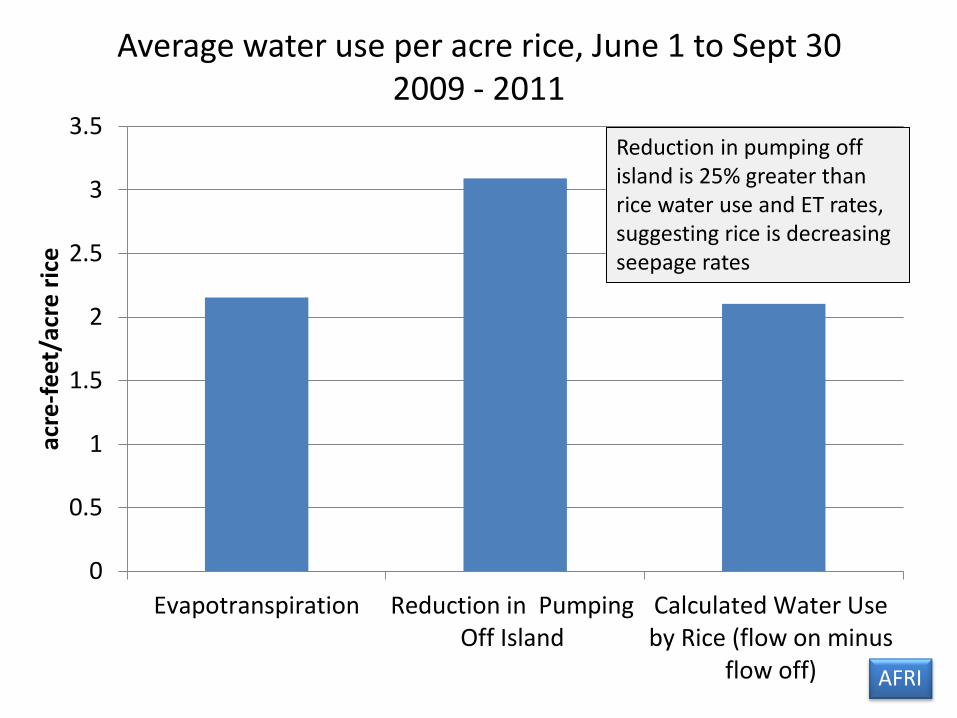
Average water use per acre rice, June 1 to Sept 30 2009 - 2011
0
0.5
1
1.5
2
2.5
3
3.5
Evapotranspiration Reduction in PumpingOff Island
Calculated Water Useby Rice (flow on minus
flow off)
acre
-fe
et/a
cre
ric
e
Reduction in pumping off island is 25% greater than rice water use and ET rates, suggesting rice is decreasing seepage rates
AFRI
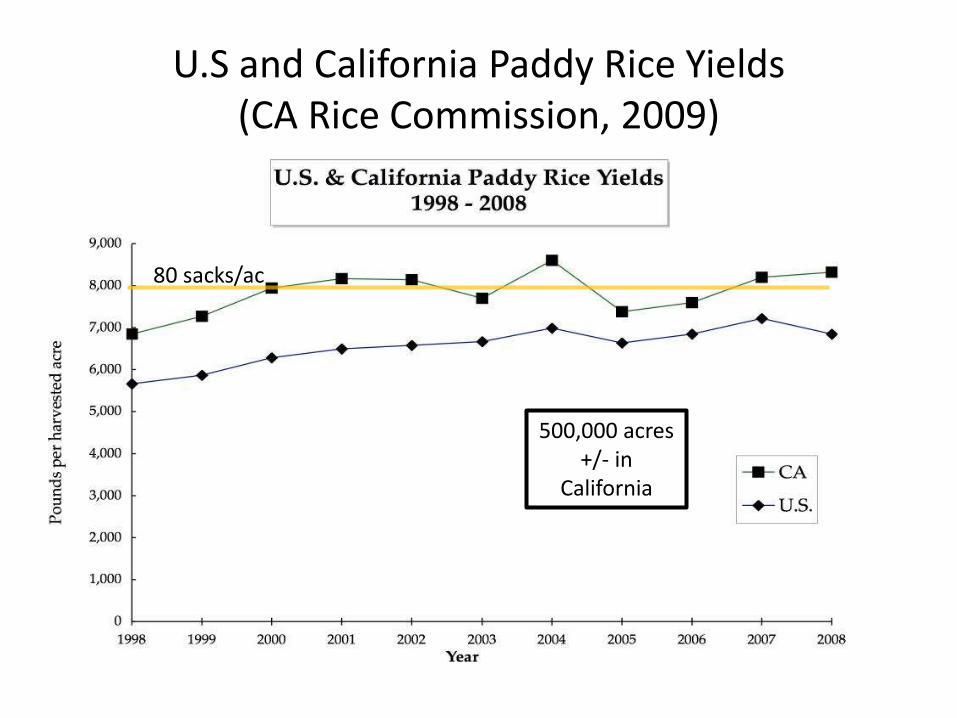
U.S and California Paddy Rice Yields (CA Rice Commission, 2009)
80 sacks/ac
500,000 acres +/- in
California
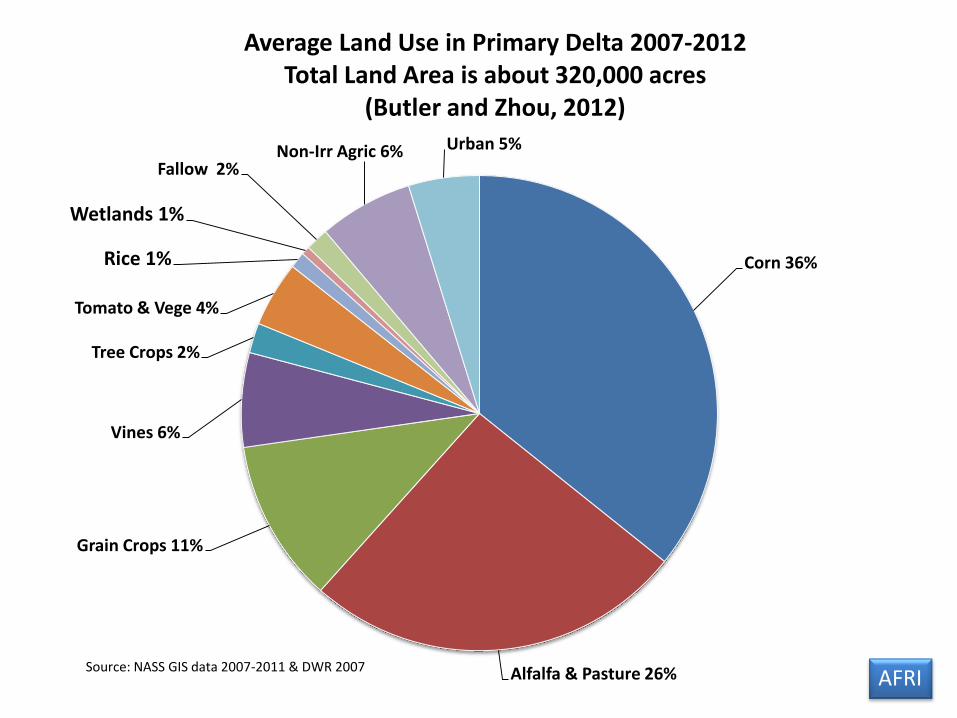
Corn 36%
Alfalfa & Pasture 26%
Grain Crops 11%
Vines 6%
Tree Crops 2%
Tomato & Vege 4%
Rice 1%
Wetlands 1%
Fallow 2% Non-Irr Agric 6% Urban 5%
Average Land Use in Primary Delta 2007-2012 Total Land Area is about 320,000 acres
(Butler and Zhou, 2012)
Source: NASS GIS data 2007-2011 & DWR 2007 AFRI
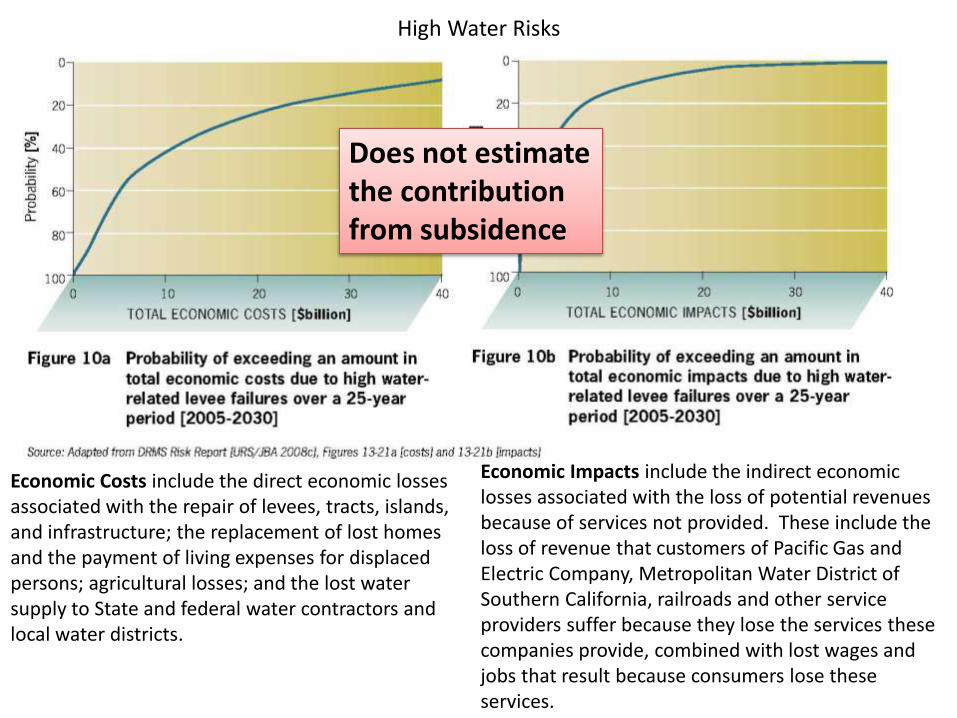
Economic Costs include the direct economic losses associated with the repair of levees, tracts, islands, and infrastructure; the replacement of lost homes and the payment of living expenses for displaced persons; agricultural losses; and the lost water supply to State and federal water contractors and local water districts.
Economic Impacts include the indirect economic losses associated with the loss of potential revenues because of services not provided. These include the loss of revenue that customers of Pacific Gas and Electric Company, Metropolitan Water District of Southern California, railroads and other service providers suffer because they lose the services these companies provide, combined with lost wages and jobs that result because consumers lose these services.
High Water Risks
Does not estimate the contribution from subsidence
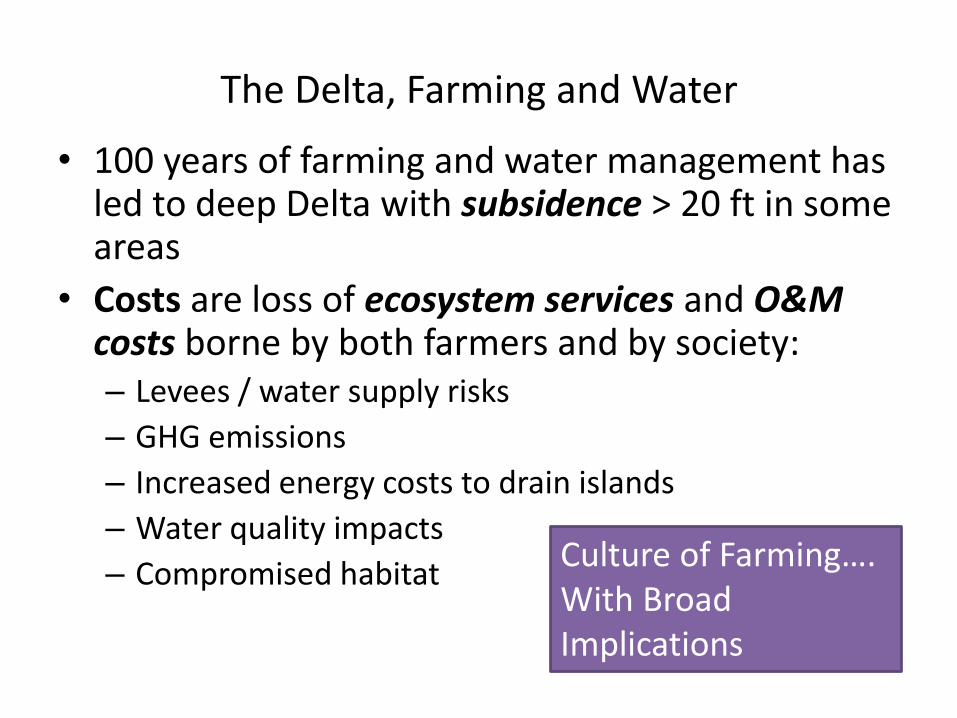
The Delta, Farming and Water
• 100 years of farming and water management has led to deep Delta with subsidence > 20 ft in some areas
• Costs are loss of ecosystem services and O&M costs borne by both farmers and by society: – Levees / water supply risks
– GHG emissions
– Increased energy costs to drain islands
– Water quality impacts
– Compromised habitat
Culture of Farming…. With Broad Implications
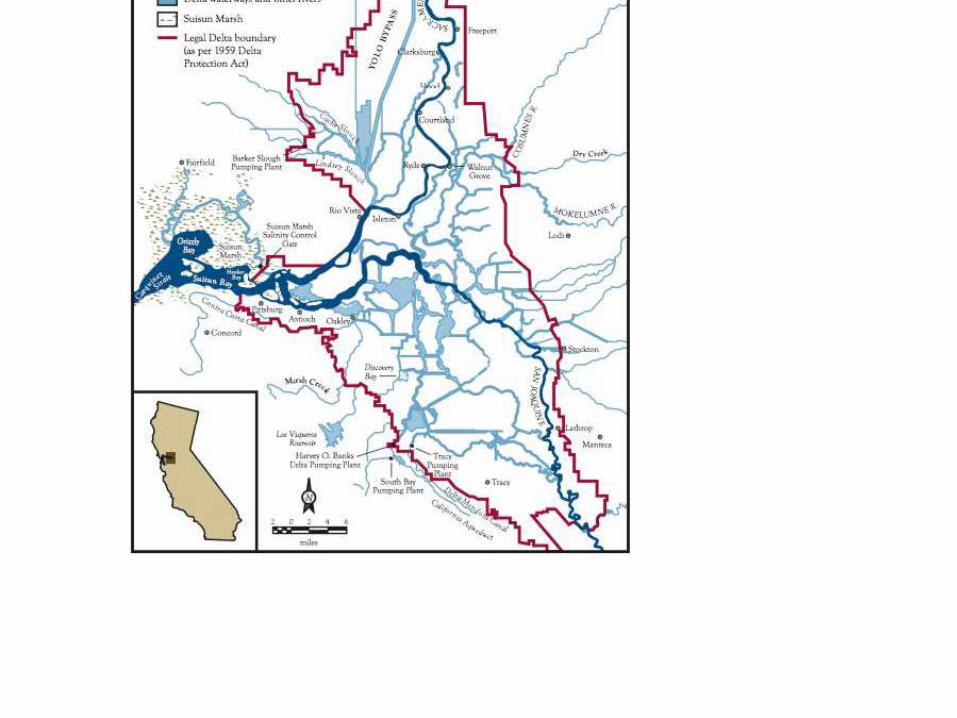
"""'--' ~~ • .., ''"~' .,.,/~ •~·~ w ... ~, • • ·~ ·~
1--j &1i!>ur\ ~1:11.nh
Ltg;:i! Ddta bound.1ry (a.~ per l959 Della Prou.•ction Acr)
' miln
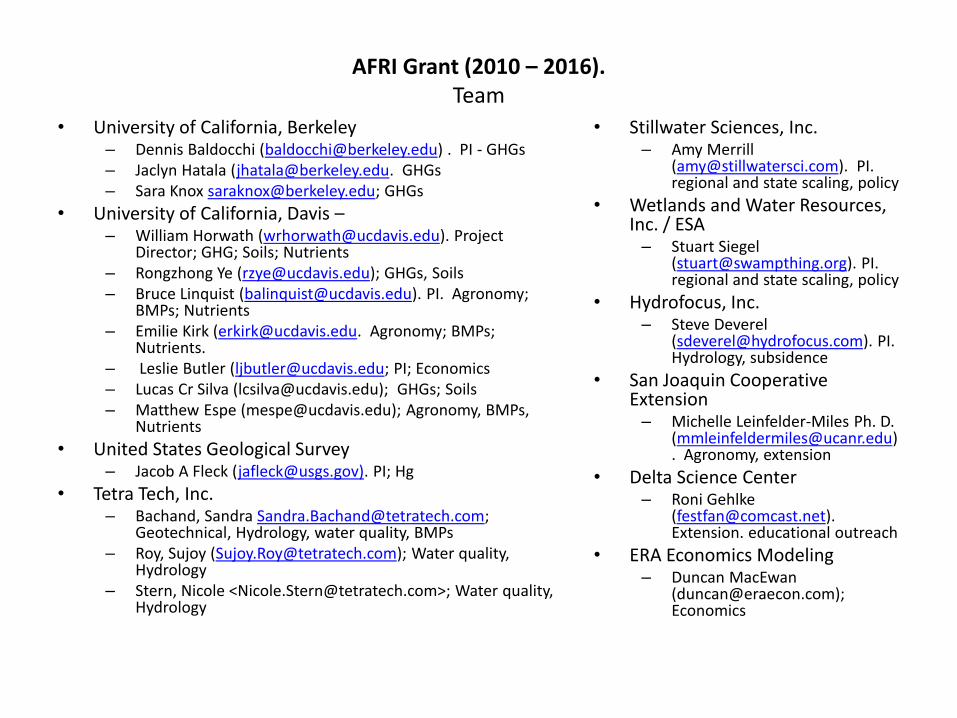
AFRI Grant (2010 – 2016). Team
• University of California, Berkeley – Dennis Baldocchi ([email protected]) . PI - GHGs – Jaclyn Hatala ([email protected]. GHGs – Sara Knox [email protected]; GHGs
• University of California, Davis – – William Horwath ([email protected]). Project
Director; GHG; Soils; Nutrients – Rongzhong Ye ([email protected]); GHGs, Soils – Bruce Linquist ([email protected]). PI. Agronomy;
BMPs; Nutrients – Emilie Kirk ([email protected]. Agronomy; BMPs;
Nutrients. – Leslie Butler ([email protected]; PI; Economics – Lucas Cr Silva ([email protected]); GHGs; Soils – Matthew Espe ([email protected]); Agronomy, BMPs,
Nutrients
• United States Geological Survey – Jacob A Fleck ([email protected]). PI; Hg
• Tetra Tech, Inc. – Bachand, Sandra [email protected];
Geotechnical, Hydrology, water quality, BMPs – Roy, Sujoy ([email protected]); Water quality,
Hydrology – Stern, Nicole <[email protected]>; Water quality,
Hydrology
• Stillwater Sciences, Inc. – Amy Merrill
([email protected]). PI. regional and state scaling, policy
• Wetlands and Water Resources, Inc. / ESA – Stuart Siegel
([email protected]). PI. regional and state scaling, policy
• Hydrofocus, Inc. – Steve Deverel
([email protected]). PI. Hydrology, subsidence
• San Joaquin Cooperative Extension – Michelle Leinfelder-Miles Ph. D.
([email protected]). Agronomy, extension
• Delta Science Center – Roni Gehlke
([email protected]). Extension. educational outreach
• ERA Economics Modeling – Duncan MacEwan
([email protected]); Economics
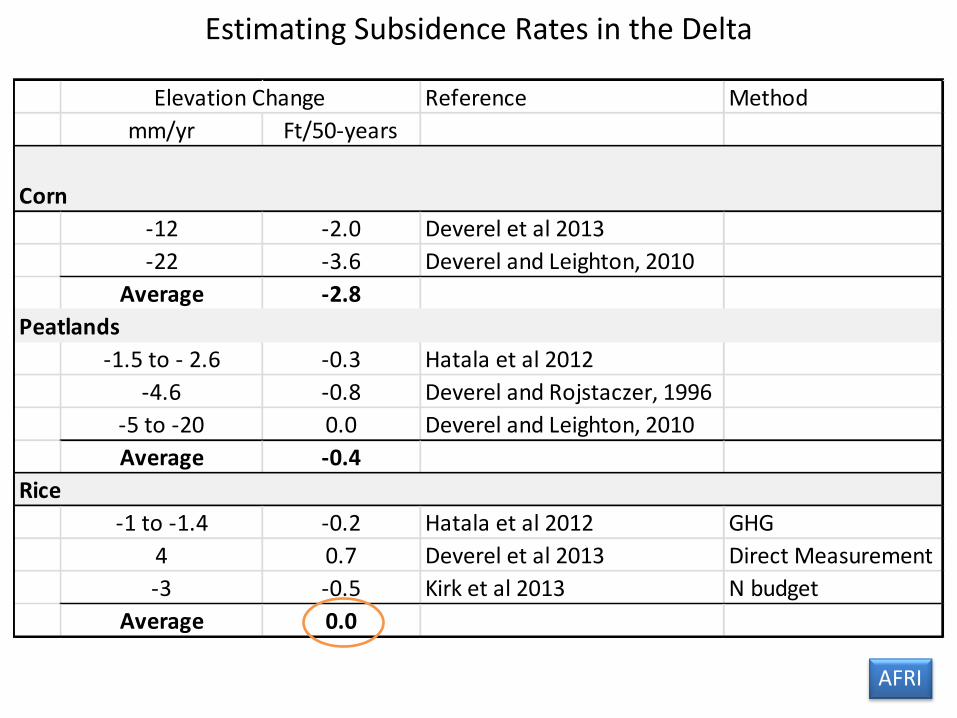
Estimating Subsidence Rates in the Delta
Reference Method
mm/yr Ft/50-years
Corn
-12 -2.0 Deverel et al 2013
-22 -3.6 Deverel and Leighton, 2010
Average -2.8
Peatlands
-1.5 to - 2.6 -0.3 Hatala et al 2012
-4.6 -0.8 Deverel and Rojstaczer, 1996
-5 to -20 0.0 Deverel and Leighton, 2010
Average -0.4
Rice
-1 to -1.4 -0.2 Hatala et al 2012 GHG
4 0.7 Deverel et al 2013 Direct Measurement
-3 -0.5 Kirk et al 2013 N budget
Average 0.0
Elevation Change
AFRI
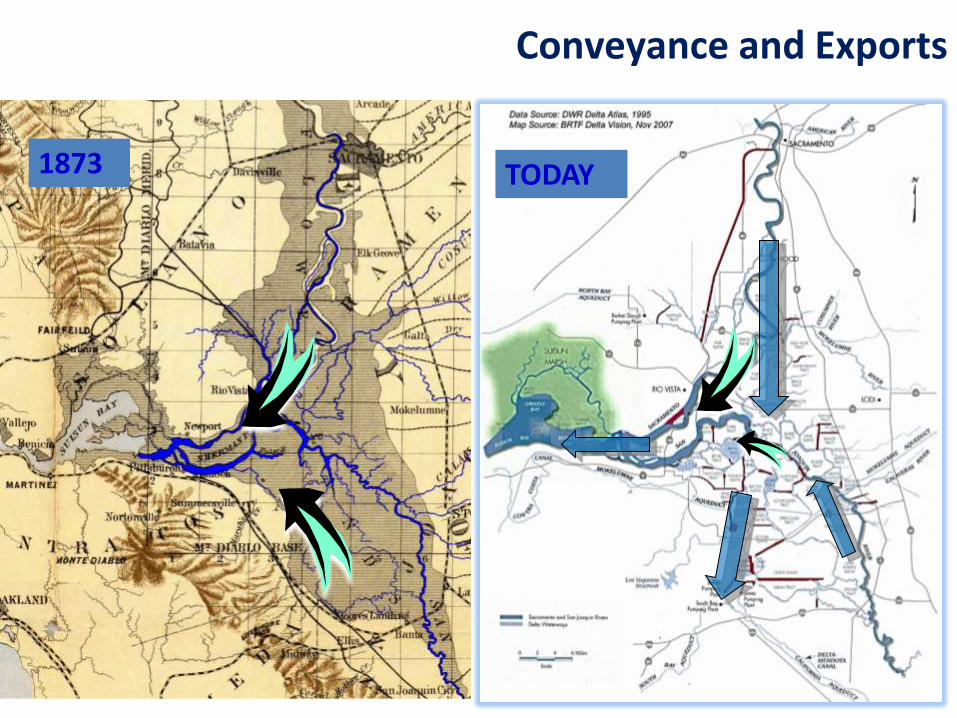
Conveyance and Exports
1873 TODAY

California Economy
• To California: – Drinking Water
• Provides Drinking Water to 22M Californians – $3.6B billed by water agencies to households annually
– Irrigation Water to 2.75M acres outside the Delta • Increases land values by about $24B
• San Joaquin Valley – Ag production and processing 36B annually
– Dependence upon within Delta Infrastructure • Highways, electrical grid, gas, etc….
49 AFRI
>$60B
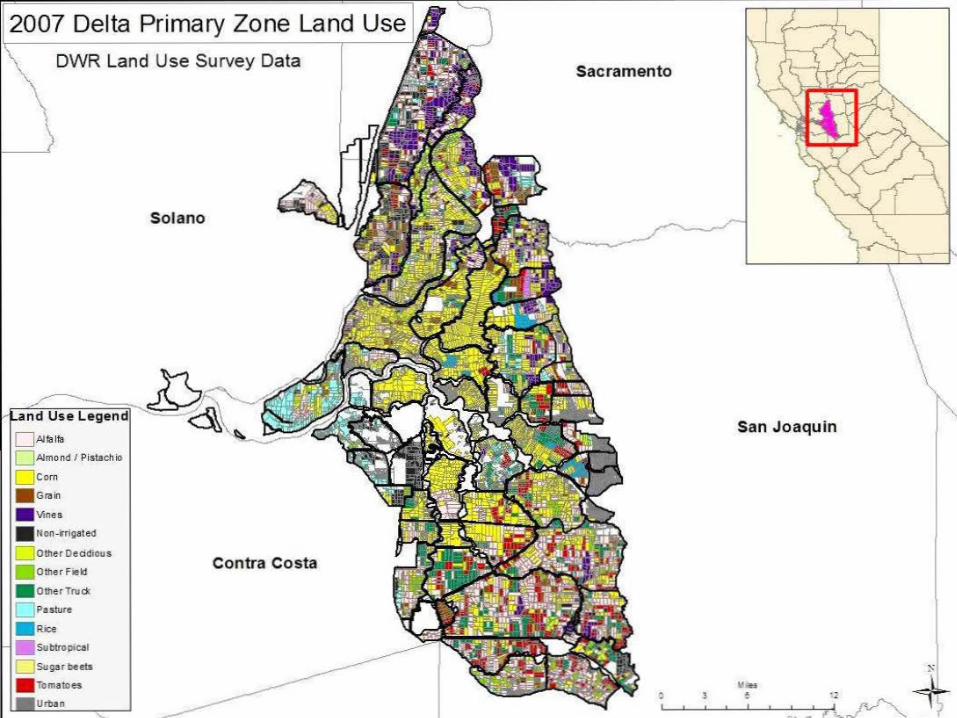
2007 Delta Primary Zone Land Use
\ DWR Land Use Survey Data
'>
and Use Legend
O A1m1ra O ..o.1mood I Pistachio
O corn II Gra in
. Vines
II Non-Irrigated
O other Oed dious
. Othe rfoekl
. Othe r Trude
[]Pasture
. Rice
. subtropical
'.:::] sugar beets
. Tomatoes
Urban
Solano
Contra Costa
Sacramento
San Joaquin

The AFRI Project: Rice as a Potential Delta Solution
1. Large-scale & strategic distribution of rice in the
Delta to decrease subsidence and protect CA water supply
2. Maximize local, regional and state values: a. Water Resources b. Agronomics c. GHG emissions d. Water Quality
AFRI Grant Team (2010 – 2016)
• University of California, Berkeley: Dennis Baldocchi, Jaclyn Hatala and Sara Knox
• University of California, Davis:
• William Horwath, Rongzhong Ye, Lucas Silva, Jennifer Morris, Yacov Assa
• Bruce Linquist, Emilie Kirk and Matt Espe
• Leslie Butler, Andrea Brock, Paul Jacobs
• ERA Economics Modeling: Duncan MacEwan
• United States Geological Survey: Jacob A Fleck
• Tetra Tech, Inc.: Philip Bachand, Sandra Bachand, Sujoy Roy, Nicole Stern
• Stillwater Sciences, Inc.: Amy Merrill
• Wetlands and Water Resources, Inc. / ESA: Stuart Siegel
• Hydrofocus, Inc.: Steve Deverel
• San Joaquin Cooperative Extension: Michelle Leinfelder-Miles
• Delta Science Center: Roni Gehlke
• Hultgren – Tillis Engineers: Kevin Tillis