rice supply and demand - coocan
TRANSCRIPT

Global Trend of
Rice Supply and Demand
Osamu Koyama
JIRCAS
需給

Contents
1. Rice as a Commodity
2. Situation of Trade
3. Price Trend
4. Demand Shift
5. Future Perspectives

Rice supplies a major part of
human energy.
World Asia
Kcal/day % Kcal/day %
Total
Food2,831 100 2,719 100
Cereals 1,410 50 1,496 55
Wheat 532 19 503 18
Rice 560 20 823 30
Source: FAOSTAT (2004)

Rice as a commodity: classification
Biological
• Indica
• Japonica
• Javanica
• Glaberrima
• Glutinous
• Non-glutinous
Commercial
• Long grain
• Medium grain
• Short grain
• Aromatic
– Basmati
– Fragrant
• Parboiled

Market share estimate
Total 26,818 100%
Indica 20,068 75%
Japonica 3,186 12%
Aromatic 3,322 12%
Glutinous 242 1%
High Quality 20,226 75%
Low Quality 6,592 25%
Paddy 1,122 4%
Husked 1,077 4%
Milled 20,639 77%
Parboiled 3,980 15%
By quality
By process
By variety
Source: C. Calpe, (FAO, 2004)
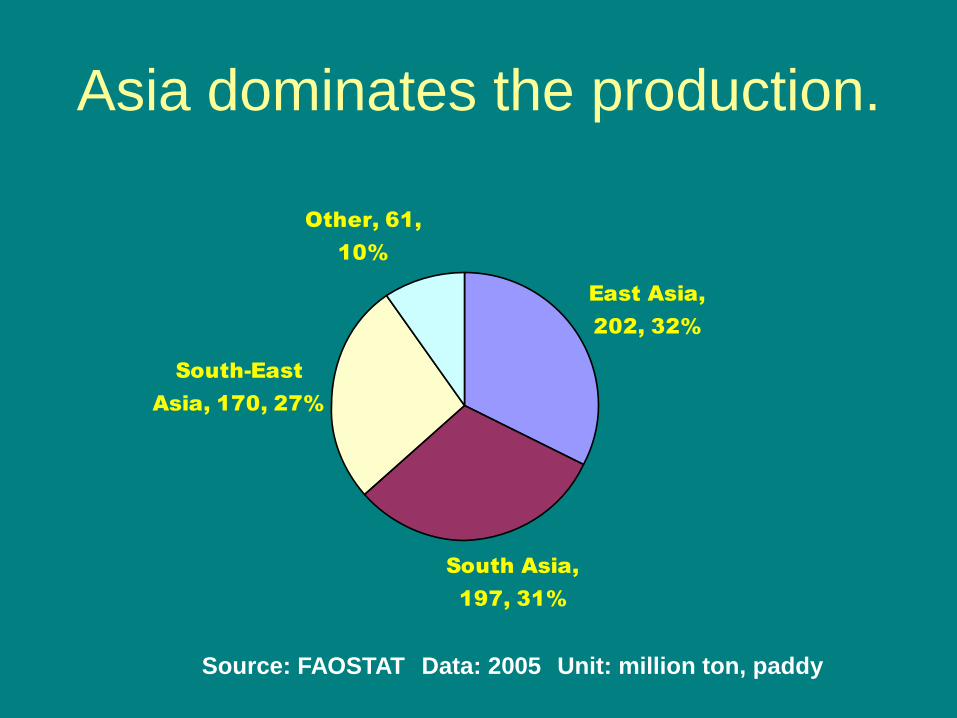
Asia dominates the production.
East Asia,
202, 32%
South Asia,
197, 31%
South-East
Asia, 170, 27%
Other, 61,
10%
Source: FAOSTAT Data: 2005 Unit: million ton, paddy

Source: IRRI
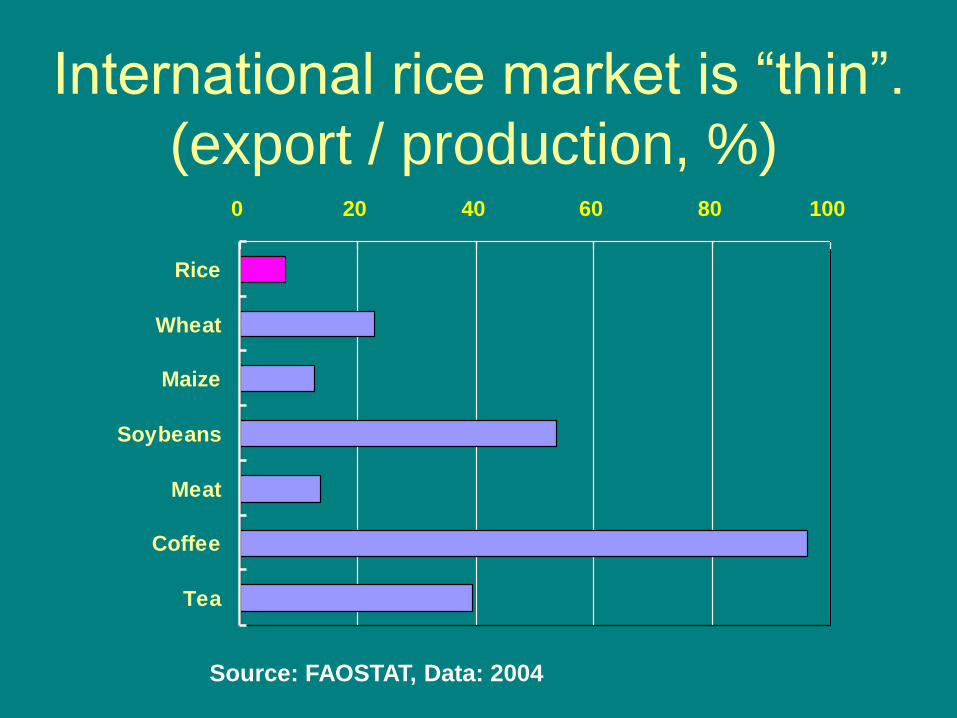
International rice market is “thin”.
(export / production, %)0 20 40 60 80 100
Rice
Wheat
Maize
Soybeans
Meat
Coffee
Tea
Source: FAOSTAT, Data: 2004

But, it becomes a global commodity.Major importing countries (2002/03-04/05)
Philippines 1,594 Brazil 667
Nigeria 1,582 Cuba 656
Saudi Arabia 1,435 Indonesia 563
EU-27 1,108 Mexico 553
Iran 1,061 United States 510
Iraq 994 Ghana 425
South Africa 877 Singapore 365
Senegal 827 Mozambique 358
Cote d'Ivoire 822 Vietnam 323
China 795 Canada 313
Malaysia 779 Cameroon 311
Japan 725 Hong Kong 311
Bangladesh 706 Guinea 257
Source: USDA, Unit: 1,000 tons
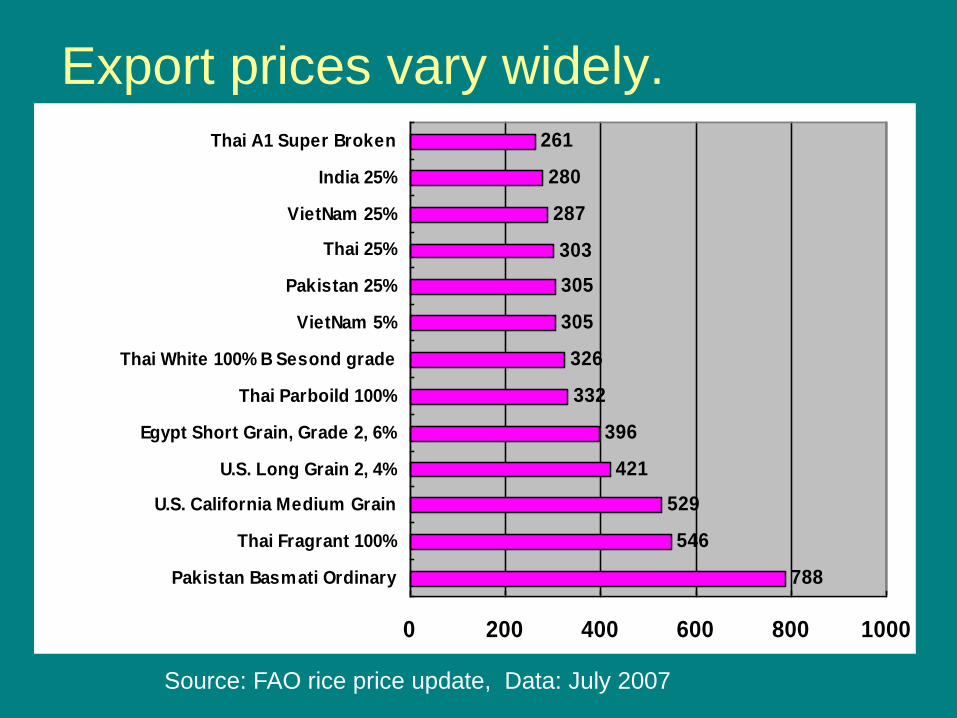
Export prices vary widely.
788
546
529
421
396
332
326
305
305
303
287
280
261
0 200 400 600 800 1000
Pakistan Basmati Ordinary
Thai Fragrant 100%
U.S. California Medium Grain
U.S. Long Grain 2, 4%
Egypt Short Grain, Grade 2, 6%
Thai Parboild 100%
Thai White 100% B Sesond grade
VietNam 5%
Pakistan 25%
Thai 25%
VietNam 25%
India 25%
Thai A1 Super Broken
Source: FAO rice price update, Data: July 2007

Rice is relatively expensive food,
But, losing ground recently.
0
50
100
150
200
250
300
350
400
4501990
1992
1994
1996
1998
2000
2002
2004
Rice, Thailand
Wheat, U.S.
Maize, U.S.
Soybeans, U.S.
Source: FAOSTAT, export unit value, US$ / ton

Because, demand is weak in Asia.
per capita food (kg/year)
0
20
40
60
80
100
120
140
1601
99
0
19
92
19
94
19
96
19
98
20
00
20
02
20
04
China
Indonesia
Malaysia
S. Korea
Japan
Source: FAOSTAT

Diversification of supply side follows.
• From quantity to quality
Japonica increases in China.
• Conversion from rice field to oil crops, feed crops, vegetable and fruits.
How to raise the value of rice.

In Africa, the situation is different.
0
5
10
15
20
25
30
1990
1993
1996
1999
2002
2005
Consumption
Production
Source: FAOSTAT, Unit: million tons

Scenery at village market in Africa

Future constraints: water resources
• Rice requires more water than other crops.
• Conflict with industrial and urban use
• New water saving technologies
• Additional investment for water

Yield growth reaches the ceiling?
0
1
2
3
4
5
6
71960
1964
1968
1972
1976
1980
1984
1988
1992
1996
2000
2004
ton
s/h
a East Asia
South Asia
Southeast Asia
Source: USDA, PS&D Views
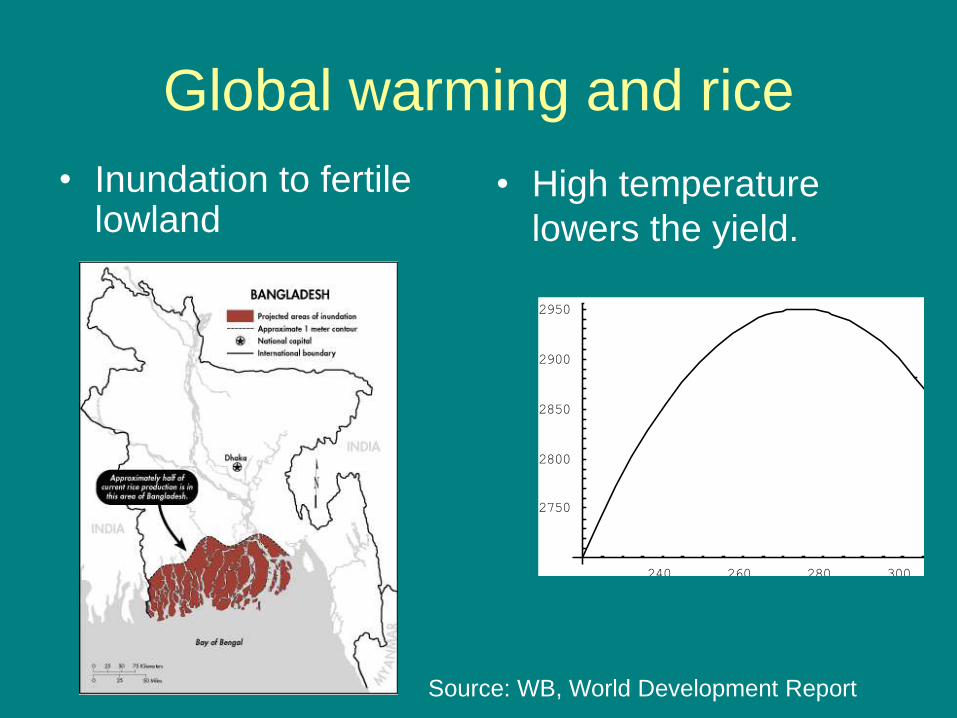
Global warming and rice
• Inundation to fertile lowland
• High temperature
lowers the yield.
240 260 280 300 320
2750
2800
2850
2900
2950
Source: WB, World Development Report
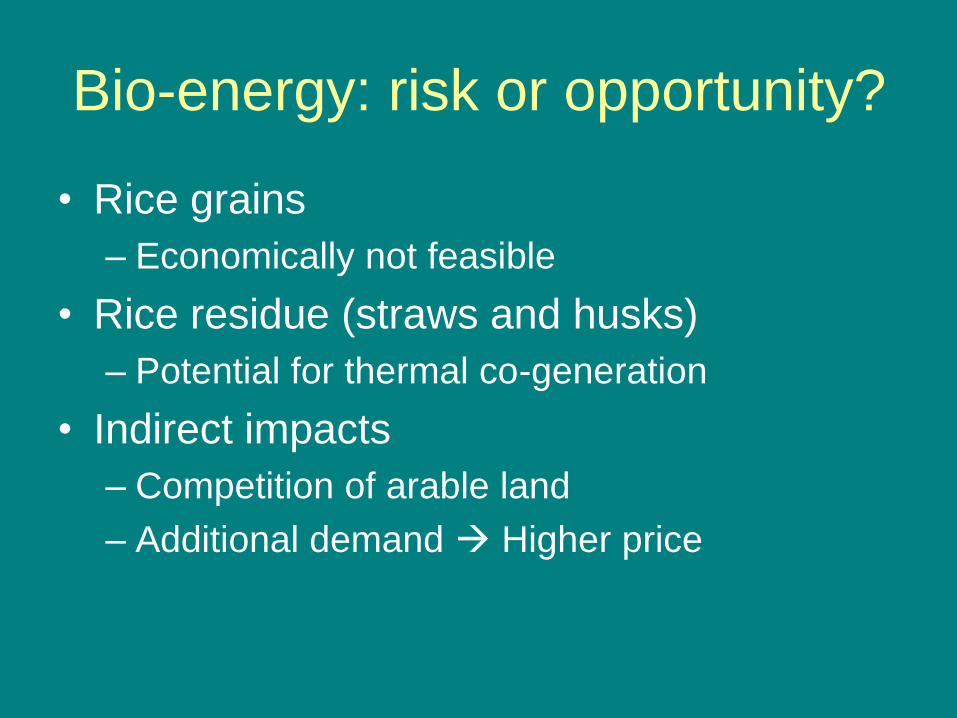
Bio-energy: risk or opportunity?
• Rice grains
– Economically not feasible
• Rice residue (straws and husks)
– Potential for thermal co-generation
• Indirect impacts
– Competition of arable land
– Additional demand Higher price
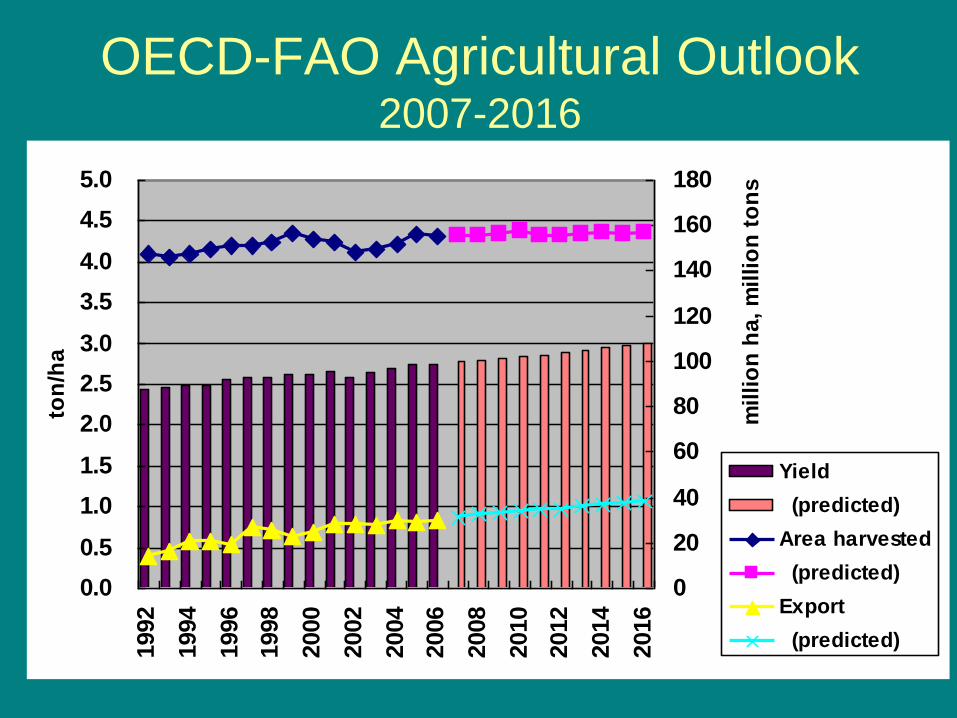
OECD-FAO Agricultural Outlook2007-2016
0.0
0.5
1.0
1.5
2.0
2.5
3.0
3.5
4.0
4.5
5.0
1992
1994
1996
1998
2000
2002
2004
2006
2008
2010
2012
2014
2016
ton
/ha
0
20
40
60
80
100
120
140
160
180
mil
lio
n h
a,
mil
lio
n t
on
s
Yield
(predicted)
Area harvested
(predicted)
Export
(predicted)
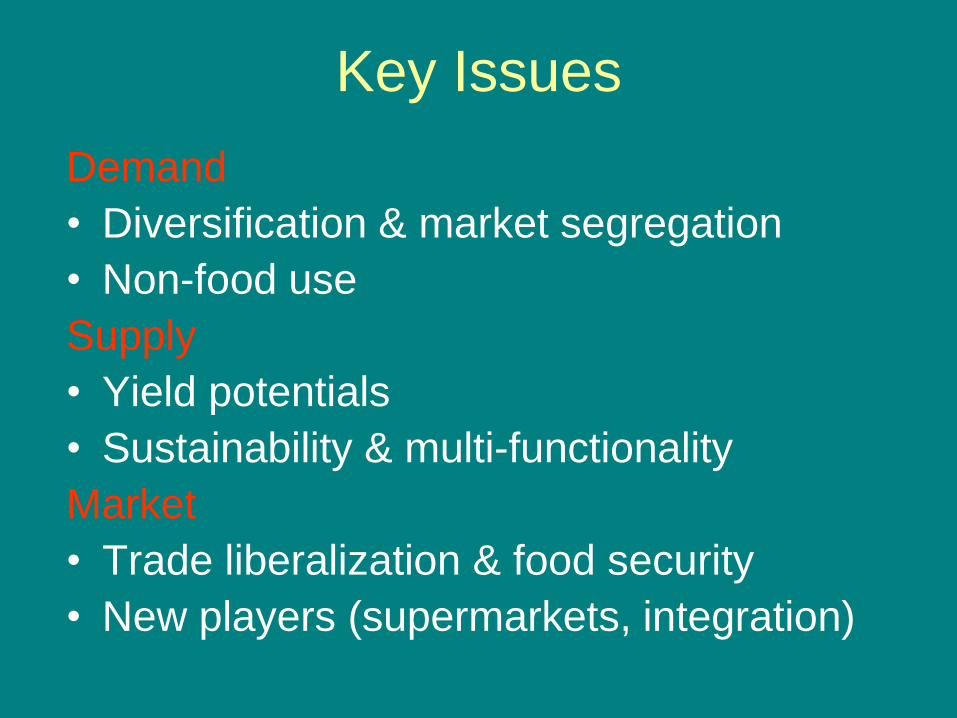
Key Issues
Demand
• Diversification & market segregation
• Non-food use
Supply
• Yield potentials
• Sustainability & multi-functionality
Market
• Trade liberalization & food security
• New players (supermarkets, integration)