richard ghail thomas widemann colin wilson · pdf file28th october 2015 -- vexag 13 slide...
TRANSCRIPT

28th October 2015 -- VEXAG 13 © Rich Ghail Venus Mission Plans in Europe
Richard GhailLead Proposer
Thomas WidemannProgramme Management Lead
Colin WilsonScience Investigation Lead
28th October 2015 -- VEXAG 13 Slide 2 © Rich Ghail Venus Mission Plans in Europe
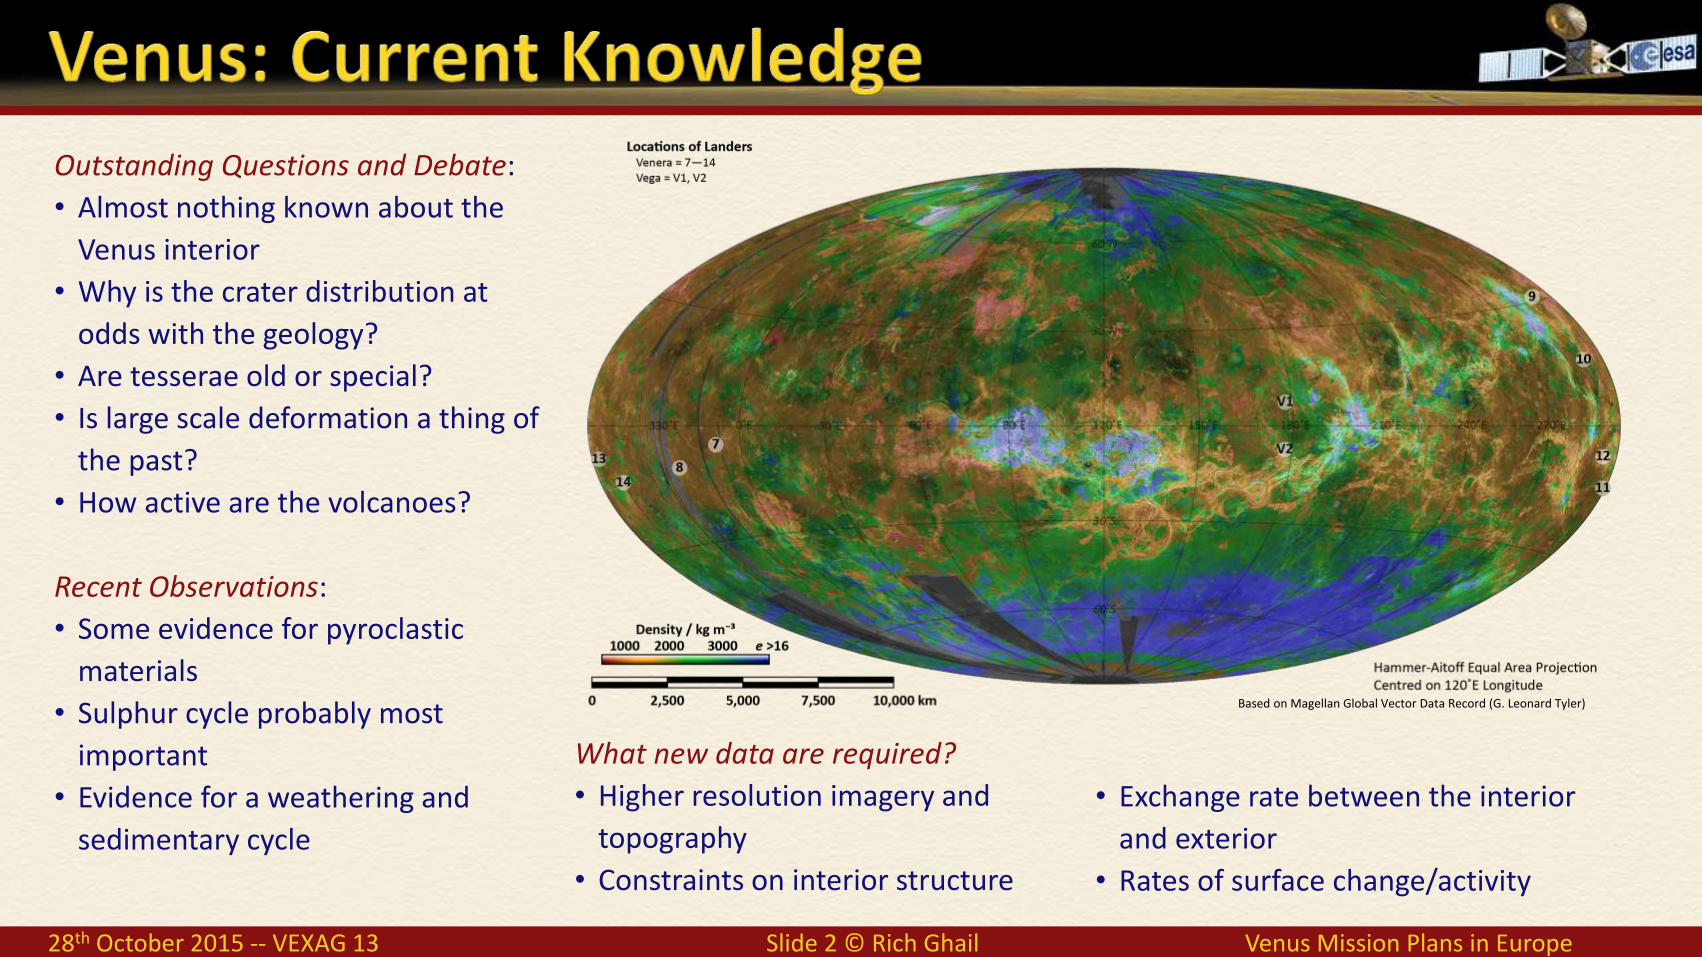
Outstanding Questions and Debate:• Almost nothing known about the
Venus interior• Why is the crater distribution at
odds with the geology?• Are tesserae old or special?• Is large scale deformation a thing of
the past?• How active are the volcanoes?
Recent Observations:• Some evidence for pyroclastic
materials• Sulphur cycle probably most
important• Evidence for a weathering and
sedimentary cycle
Based on Magellan Global Vector Data Record (G. Leonard Tyler)
What new data are required?• Higher resolution imagery and
topography• Constraints on interior structure
• Exchange rate between the interior and exterior
• Rates of surface change/activity

28th October 2015 -- VEXAG 13 Slide 3 © Rich Ghail Venus Mission Plans in Europe
[Herrick 2014]
Radiometric resolution (sensitivity) across a large dynamic range is critical to distinguish features in bright and dark areas
Low spatial resolution prevents identification of most geological relationships and changes

28th October 2015 -- VEXAG 13 Slide 4 © Rich Ghail Venus Mission Plans in Europe
Changes in slope have been incorrectly interpreted as different units from which an onlap relationship is inferred. In fact, the differences are mostly attributable to slope angle and talus.
Our understanding of Venus today is no better than was our understanding of Mars after Viking
[Ivanov and Head 2015]
[JPL 400-528H 6/94]
SIR-C image of Furnace Creek alluvial fan, Death Valley

28th October 2015 -- VEXAG 13 Slide 5 © Rich Ghail Venus Mission Plans in Europe
The conventional view is that all volcanic features are produced by hot spots (plumes) of different sizes.
The 6 or 7 volcanic rises are mostlikely produced by core-mantleboundary plumes, with smallerfeatures formed by plumes fromshallower depths.
Corona and related features most likelyresult from magmatic intrusion.
Variations in SO₂ abundance mayrecord large volcanic eruption events,and would imply abundant volatilesin the source magma.
© 2007 Eric H. Christiansen and W. Kenneth Hamblin
E. Marcq et al. (Venus Express); L. Esposito et al. (earlier data); image ESA/AOES Medialab

28th October 2015 -- VEXAG 13 Slide 6 © Rich Ghail Venus Mission Plans in Europe
Outstanding Questions and Debate:• Almost nothing known about the
Venus interior• Why is the crater distribution at
odds with the geology?• Are tesserae old or special?• Is large scale deformation a thing of
the past?• How active are the volcanoes?
Recent Observations:• Some evidence for pyroclastic
materials• Sulphur cycle probably most
important• Evidence for a weathering and
sedimentary cycle
Based on Magellan Global Vector Data Record (G. Leonard Tyler)
What new data are required?• Higher resolution imagery and
topography• Constraints on interior structure
• Exchange rate between the interior and exterior
• Rates of surface change/activity
Goal Measurement Resolution Coverage
Surface change < ±1 cm a⁻¹ at 10–50 m spatial >20% global
Geomorphology Images at 10–50 m spatial Global
Topography at 10–50 m vertical, 100–500 m spatial Global
Specified targets Images at 1–10 m spatial As required
Subsurface structure Profiles at 10–50 m vertical and 100–500 m spatial Global
Thermal emissivity Signal to noise >100 at <50 km spatial Global
SO₂ concentration < ±1% at <300 km spatial and 30–40 km altitude Global
H₂O concentration < ±10% at <300 km spatial and <15 altitude Global
D/H ratio < ±10% at <300 km spatial and <15 altitude Global
Gravity field Spherical harmonic degree and order 120 Uniform
Spin Rate < ±10⁻⁸ (1 minute in one Venus day) Global
Spin Axis < ±0·001° in right ascension and declination North Pole

28th October 2015 -- VEXAG 13 Slide 7 © Rich Ghail Venus Mission Plans in Europe
30
35
40
45
50
55
60
0 0.01 0.02 0.03 0.04 0.05Al
titud
e in
km
H₂SO₄ Losses in dB/km
S-Band
X-Band
Shrouded in permanent clouds, the 90 bar, 750 K Venus atmosphere is prohibitive for surface rovers and opaque at wavelengths shorter than ~3·5 cm.
Total one-way losses are (add 3 dB for two-way):• 6·20 dB at 3·8 cm, 8·4 GHz X-band• 1·69 dB at 5·6 cm, 5·4 GHz C-band• 0·55 dB at 9·4 cm, 3·2 GHz S-band
[based on Muhleman 1969]EnVision’s InSAR coherence requirement drives our choice for an S-band radar.
In other respects the atmosphere is benign:• The total electron count is <1 TeV• IR brightness temperature ~50 K cooler than Earth• Drag-free orbits above 220 km altitude

28th October 2015 -- VEXAG 13 Slide 8 © Rich Ghail Venus Mission Plans in Europe
NovaSAR being assembled at SSTLNovaSAR will consist of four small low cost SAR satellites providing continuous global environmental management and disaster monitoring.
The first is being funded by the UK government for launch in 2016.
EnVision is a proposed ESA M-class mission to Venus designed to find out what made Earth’s closest neighbour so different. It will carry a subsurface sounder, emissivity mapper and spectrometer, and its primary instrument, the NovaSAR-S based VenSAR.
[Thales Alenia Space]
[SSTL]

28th October 2015 -- VEXAG 13 Slide 9 © Rich Ghail Venus Mission Plans in Europe
The reverse side of each phase centre has:• a power conditioning unit,• a 115 W RF transmit unit,• a radiator unit, and• a receive/beam control unit,making for an independently controllable, fully scalable array.
The VenSAR antenna consists of 24 of these phase centres arranged in 6 columns of 4 rows spread over 3 panels (2 columns per panel), oriented with the orbit track along the major axis.
28th October 2015 -- VEXAG 13 Slide 10 © Rich Ghail Venus Mission Plans in Europe
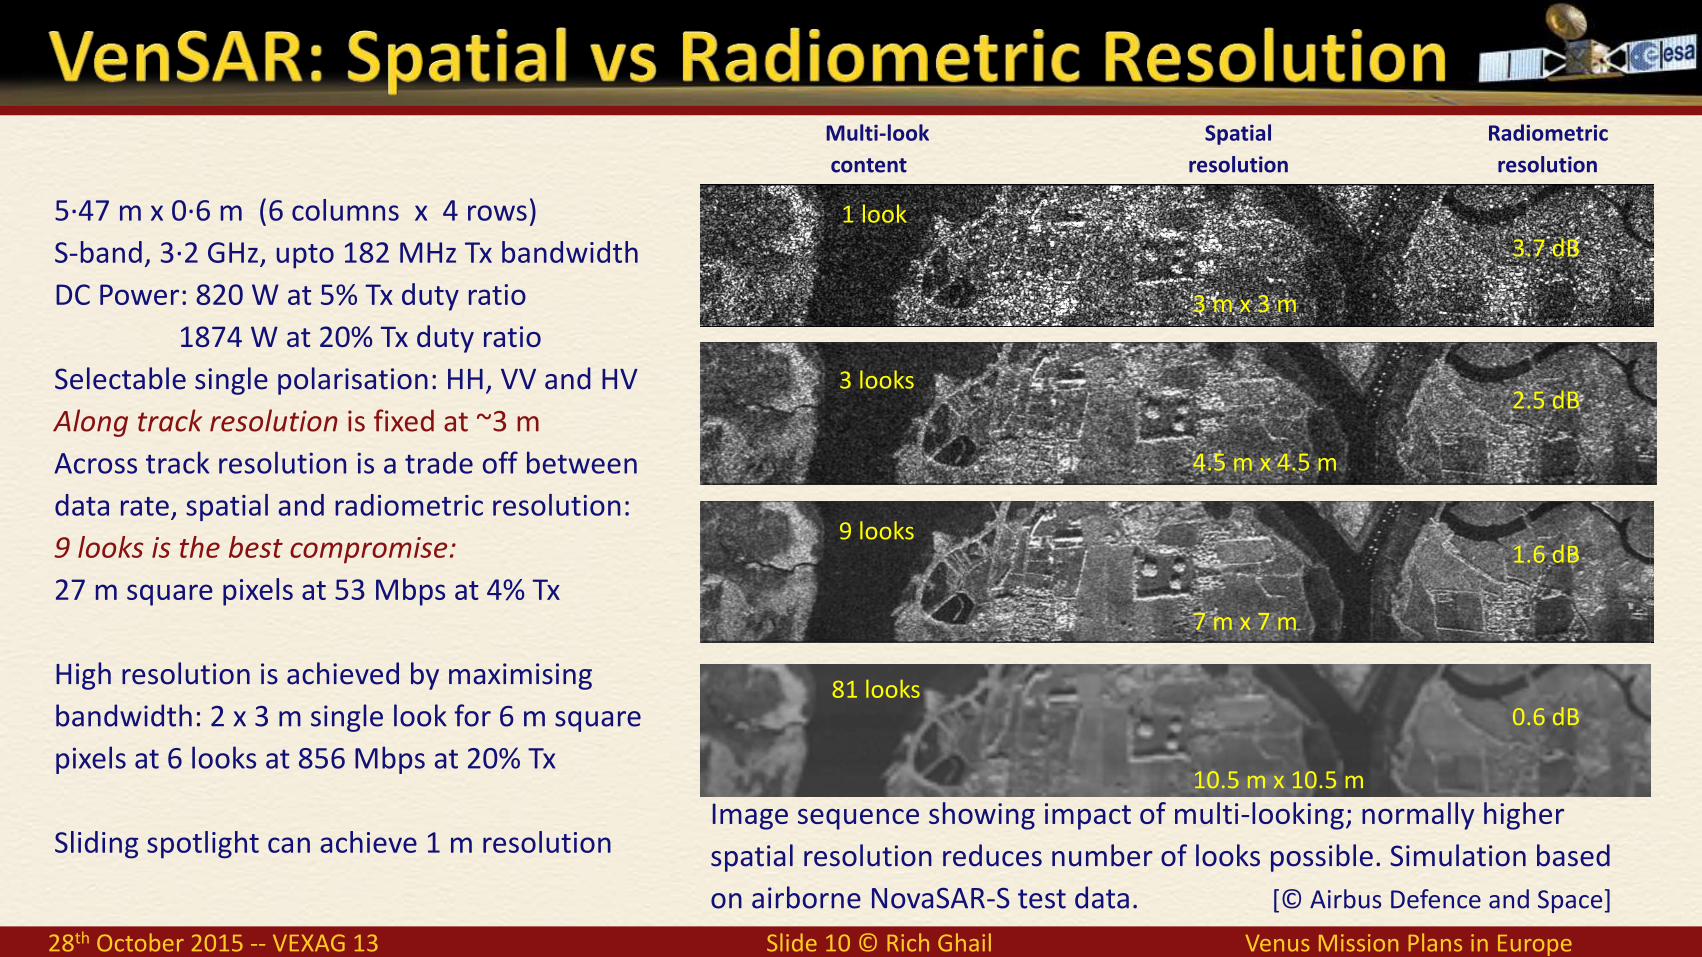
5·47 m x 0·6 m (6 columns x 4 rows)S-band, 3·2 GHz, upto 182 MHz Tx bandwidthDC Power: 820 W at 5% Tx duty ratio
1874 W at 20% Tx duty ratioSelectable single polarisation: HH, VV and HVAlong track resolution is fixed at ~3 mAcross track resolution is a trade off between data rate, spatial and radiometric resolution:9 looks is the best compromise:27 m square pixels at 53 Mbps at 4% Tx
High resolution is achieved by maximising bandwidth: 2 x 3 m single look for 6 m square pixels at 6 looks at 856 Mbps at 20% Tx
Sliding spotlight can achieve 1 m resolutionImage sequence showing impact of multi-looking; normally higher spatial resolution reduces number of looks possible. Simulation based on airborne NovaSAR-S test data. [© Airbus Defence and Space]
Multi-look content
1 look
3 looks
9 looks
81 looks
3.7 dB
2.5 dB
1.6 dB
0.6 dB
Radiometric resolution
Spatial resolution
3 m x 3 m
4.5 m x 4.5 m
7 m x 7 m
10.5 m x 10.5 m

28th October 2015 -- VEXAG 13 Slide 11 © Rich Ghail Venus Mission Plans in Europe

28th October 2015 -- VEXAG 13 Slide 12 © Rich Ghail Venus Mission Plans in Europe

28th October 2015 -- VEXAG 13 Slide 13 © Rich Ghail Venus Mission Plans in Europe
Operating Mode Transmit Duty Ratio
Mean RF Power
Input Power†
Image Duration
Swath Width
Data Rate
Stereo 3% + 10% 179 W 898 W 11·5 min 45 km 139 Mbps
Interferometry 4% 110 W 660 W 16·1 min 43 km 53 Mbps
Polarimetry 4% 110 W 660 W 15·3 min 45 km 81 Mbps
High Resolution 20% 552 W 1874 W 5·0 min 40 km 856 Mbps
Sliding Spotlight 20% 552 W 1874 W 2·184 s 10 km 591 Mbps

28th October 2015 -- VEXAG 13 Slide 14 © Rich Ghail Venus Mission Plans in Europe
Left: 110 m resolution, 5-look image posted at 75 m per pixel to simulate a Magellan image from Venus. Note that the volcanic cone suffers from layover.
Right: Simulated standard resolution (27 m) 9-look VenSAR image. Layover is corrected using the stereo-derived 135 m resolution DEM. In addition to higher spatial resolution and reduced noise, the image has greater sensitivity and a factor of 4 improvement in radiometric resolution.
[All images derived from Sentinel 1a data]
10 km
10 km

28th October 2015 -- VEXAG 13 Slide 15 © Rich Ghail Venus Mission Plans in Europe
Left: 110 m resolution, 5-look image posted at 75 m per pixel to simulate a Magellan image from Venus. Note that the volcanic cone suffers from layover.
Right: Simulated high resolution (6 m) 9-look VenSAR image. This simulation uses scale 3-look 14 m Sentinel-1 data; VenSAR will achieve better spatial and radiometric resolution.
[All images derived from Sentinel 1a data]
10 km
10 km

28th October 2015 -- VEXAG 13 Slide 16 © Rich Ghail Venus Mission Plans in Europe
Pass to Pass InSAR:• Increases the quality of InSAR
observations by minimizing atmospheric phase distortions while maximizing coherence
• Variance of estimated topography and deformation parameters can be reduced
• Long spatial baselines increases topographic resolution
• Helps separate topographic and deformation related phase components
• Can be achieved using electronic shift in transmitted frequency, reducing bandwidth and data rates
Provides initial results in hours not months
7½ hour interferogram of Venus north pole from Magellan[Goldstein et al. pers. comm.]
Magmatic inflation at Etna (ERS data)
InSAR detection of post-seismic deformation.
[Peltzer 1997]

28th October 2015 -- VEXAG 13 Slide 17 © Rich Ghail Venus Mission Plans in Europe
Resolution requirement:• Globally to better than a few tens of metres
(Magellan was >100 m)• Resolve flow boundaries, tesserae fault
blocks, crater floor darkening• Individual lava flows, canali, boundaries,
etc. in apparently featureless areasInSAR:• Unwrapped DEM at 27 m spatial and ~5 cm
vertical resolution• Most suited to smooth terrain; fails if
coherence lost over ~90 minutesStereo:• Achieves topographic data at better than
250 m spatial and 20 m vertical resolution• Works best in rough areas, complementing
interferometric topography
[R Herrick]

28th October 2015 -- VEXAG 13 Slide 18 © Rich Ghail Venus Mission Plans in Europe
Understanding the character and extent of different surface materials requires polarimetric data.
Terrestrial studies show that the HV and VH polarisations states are almost identical, so that only HH, VV, and HV polarised data are required.
VenSAR can transmit and receive bursts of both horizontal and vertical polarisations, allowing a mix of HH, VV, HV polarised images to be obtained.
Burst mode causes scalloping that degrades the along track image resolution by a factor of 2N + 1, where N is the number of polarisation states, hence the degradation is a factor of 7.
Polarimetric mapping will normally have a resolution of 160 m but a maximum 1-look resolution of 17 m is achievable in high resolution mode.
Although Venus lacks vegetation, Venera lander images show a variety of surface materials that can be distinguished in multipolar imagery. [© Airbus Defence and Space]
NovaSAR-S Airborne Demonstrator

28th October 2015 -- VEXAG 13 Slide 19 © Rich Ghail Venus Mission Plans in Europe
Sentinel-1 VV-VH-HH 120m image (left) pan-sharpened with 9-look 30m VV image (right) of mid-Atlantic rift, Iceland.
5 km

28th October 2015 -- VEXAG 13 Slide 20 © Rich Ghail Venus Mission Plans in Europe
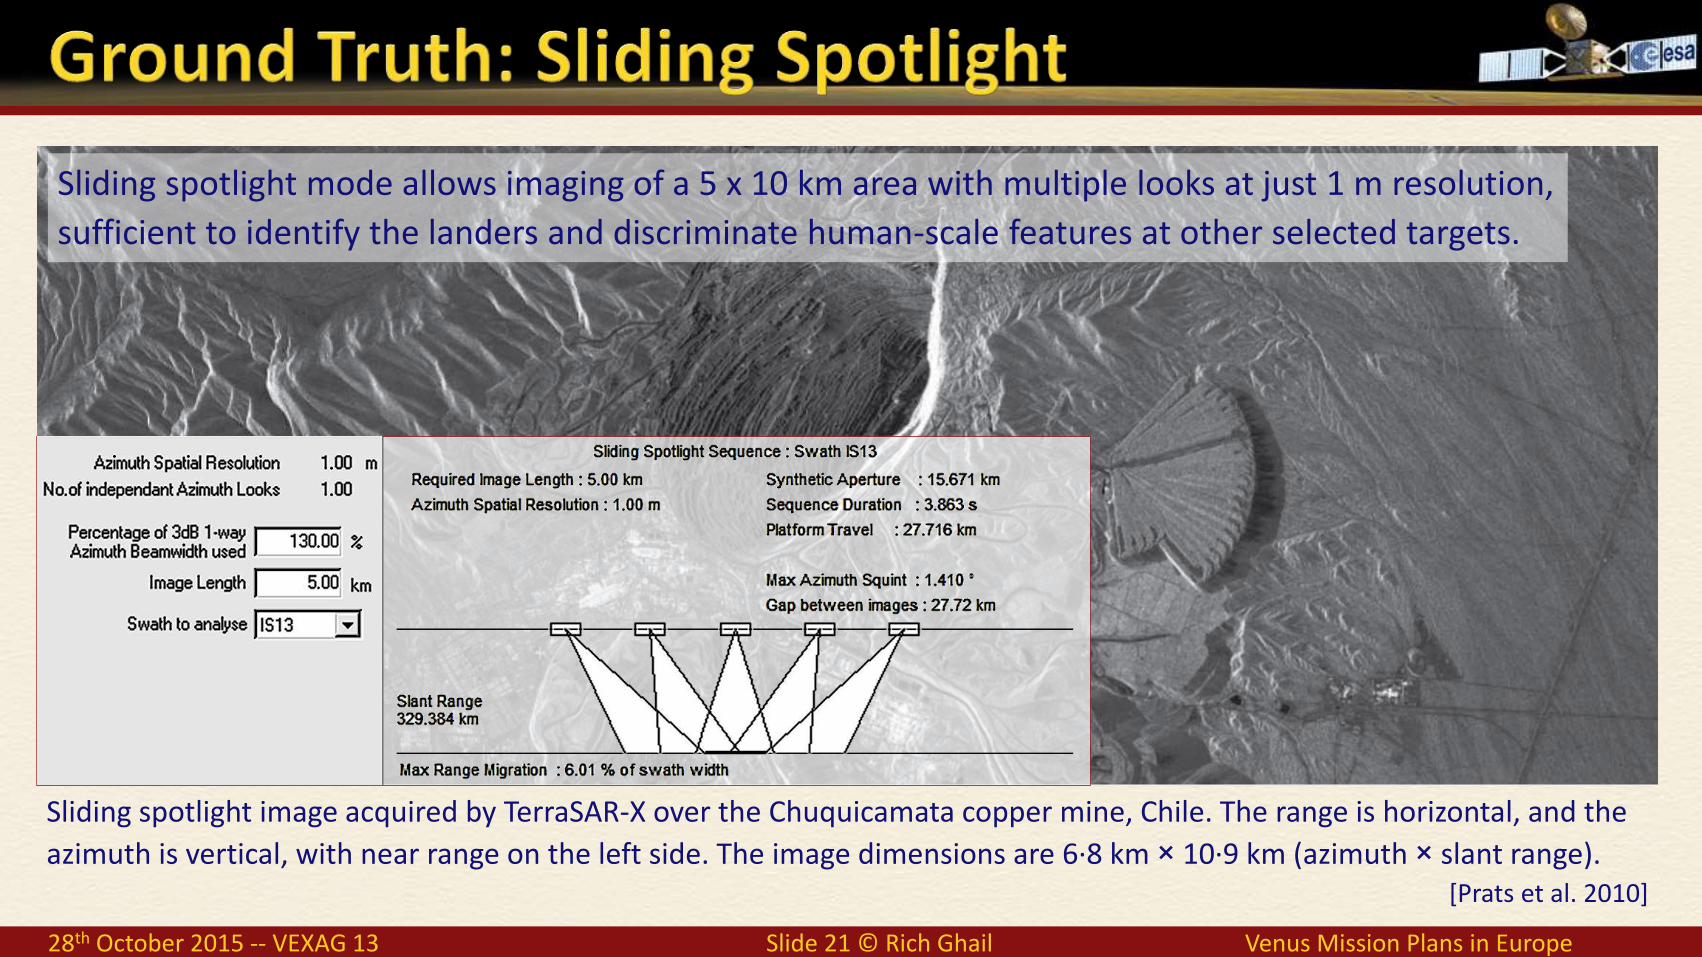
The 2 m diameter metallic body and coiled antenna array of the Venera landers will contrast strongly with the Venus surface.
Increasing the transmit power and bandwidth to the maximum sustainable permits a 40 km wide swath at 2·4 m resolution (1 look), in which the landers will be identifiable as a very bright spot in the terrain.
This high resolution mode will also be useful for imaging canali, tesserae and other features of geological interest.
28th October 2015 -- VEXAG 13 Slide 21 © Rich Ghail Venus Mission Plans in Europe
Sliding spotlight image acquired by TerraSAR-X over the Chuquicamata copper mine, Chile. The range is horizontal, and the azimuth is vertical, with near range on the left side. The image dimensions are 6·8 km × 10·9 km (azimuth × slant range).
[Prats et al. 2010]
Sliding spotlight mode allows imaging of a 5 x 10 km area with multiple looks at just 1 m resolution, sufficient to identify the landers and discriminate human-scale features at other selected targets.

28th October 2015 -- VEXAG 13 Slide 22 © Rich Ghail Venus Mission Plans in Europe
VIRTIS has mapped the hot surface at 1 μm using emissivity data[Helbert, Müller, et al. 2008& Müller, Helbert et al. 2009, 2010]
Key Parameter ValueInstrument Concept Pushbroom design
FOV / swath 60° / 250 kmDetector SOFRADIR “Neptune” 500 X 256 HgCdTe array
Cooled focal plane 150 K, pulse-tube cooler
14 spectral bands Bandwidth < 10 nm Variation < 1nm
Processed Data Rate 190 kb/s (1 Mb/orbit)
Mass / Power (CBE) ~5.4 kg / ~18.5 W
Volume 30 cm x 30 cm x 40 cm
VEM-M spectral bands and science themes

28th October 2015 -- VEXAG 13 Slide 23 © Rich Ghail Venus Mission Plans in Europe
E. Marcq et al. (Venus Express); L. Esposito et al. (earlier data); image ESA/AOES Medialab
Left: the optical assembly, which is inverted and mounted on a baseplate on the underside of the radiator.Right: the SOFRADIR detector for NOMAD on ExoMars.
VEM-H is a spectrometer probing the near-infrared nightside windows with very high spectral resolution (resolving power ~ 40,000). It will:• Quantify SO₂, H₂O and HDO in the lower atmosphere• Characterise of volcanic plumes• Detect other sources of gas exchange with the surface• Complement VenSAR and VEM-M surface observations
VEM-U is a small, light, UV spectrometer which will map mesospheric SO₂abundances on the dayside of Venus. Together with VEM-M and VEM-H it will link surface, tropospheric and mesospheric changes in SO₂, H₂O and other gases.

28th October 2015 -- VEXAG 13 Slide 24 © Rich Ghail Venus Mission Plans in Europe
The Radar Sounder for EnVision can acquire information on the shallow subsurface with the following main scientific goals:• Characterisation of the different stratigraphic and structural
patterns of the subsurface.• Study the volcanism phenomena and their impact on the
geological evolution of the Venusian topography.• Detection of subsurface structures non directly linked with
surface.• Analysis of the materials in the surface and subsurface and
their metamorphism linked to the burial process.• Synergistic analysis of the data provided by SAR and radar
sounder sensors to study the evolution of the planet.• Analysis of the total electron content of the
ionosphere.One of the main issues for the design of theradar sounder instrument for EnVision concernsthe physical and electromagnetic modelling ofthe surface and subsurface targets.
A Radar Sounder Instrument for EnVision
[1] Ford, P. G., Pettengill, G. H. Venus topography and kilometer-scale slopes. Journal of Geophysical Research 97, 13103. 1992. [2] Picardi, G., and 33 colleagues. Radar Soundings of the Subsurface of Mars. Science 310, 1925-1928. 2005. [3] Seu, R., and 11 colleagues. SHARAD sounding radar on the Mars Reconnaissance Orbiter. Journal of Geophysical Research (Planets)
112, 5. 2007. [4] Bruzzone, L., and 15 colleagues. RIME: Radar for Icy Moon Exploration, IGARSS 2013.
Transmitted central frequency (fc) In the range 6 - 30 MHz
Transmitted bandwidth (Bw) In the range 2 - 10 MHz
Antenna type Dipole (deployable)
Antenna dimension TBD (depending on the central frequency)
Power 30 W
Along track resolution < 1 km
Across track resolution < 5 km
Vertical resolution 75 m (Bw=2 MHz) - 15 m (Bw=10 MHz) (vacuum)
Estimated maximum penetration depth 1.5 Km (fc=6 MHz) - 600 m (fc=30 MHz)
Data rate 300 – 10000 kbps (depending on selected parameters and operation scenarios)
Mass (without antenna) 10 kg
Size 37×25×13 cm
Pointing requirements Nadir
L. Bruzzone1, F. Bovolo2, R. Orosei3, D. Castelletti1, R. Seu4
1 Dept. of Information Engineering and Computer Science, University of Trento, Trento, Italy,
2 Fondazione Bruno Kessler, Trento, Italy 3 INAF, Bologna, Italy
4 University of R
o
ma “La Sa pienza”, Roma, Italy
Corresponding author: [email protected]
Many open science questions of the ESA M-class EnVision mission proposal are related to the characterization of the surface and the subsurface of Venus. Given the atmospheric conditions and the properties of the surface, some of the key science questions and the related science goals can be effectively addressed only by using properly designed radar instruments. Currently, the use of a C-band (or S-band) SAR system with interferometric capabilities is considered in the core payload. This is aimed to address science goals related to the measurements of the topography and of the surface displacements according to differential interferometric techniques. However, this system can only study the surface vertical structure and cannot provide any direct measure on the subsurface. Accordingly, in this poster we propose and discuss a complementary radar instrument which is a low-frequency radar sounder.
1. Introduction
One of the main issues for the design of the radar sounder instrument for EnVision concerns the physical and electromagnetic modelling of the surface and subsurface targets. Magellan radar measurements provided information on terrain dielectric properties and surface roughness. We can distinguish two main areas:
Highland areas which are mostly characterized by high values of the dielectric permittivity ε (e.g., around 20), supposedly because of rocks with metal content; and high surface roughness. Lowland areas are composed by basalt materials with expected high porosity that entails an expected value of ε = 5 ± 0.9. Lowland areas present smoother topography.
Highlands (about 20% of the Venus area) may represent a critical scenario for the penetration the radar electromagnetic waves, whereas lowland (about 80% of the Venus area) have dielectric constants that are suitable for sounding.
3. Science goals
False-color representation of Venus surface topography, data acquired by Magellan satellite [1].
Clutter is given by off-nadir surface reflections reaching the radar at the same time as subsurface nadir reflections, thus potentially masking them. The strength of clutter is controlled by statistical parameters of the topography of natural surfaces scattering the radiation.
The signal ambiguity introduce by the clutter could limit data analysis and interpretation.
5. Clutter
Different approaches are possible for identifying and reducing clutter effects. These approaches require the availability of Digital Terrain Model (DTM) for identifying clutter features in areas where the surface is rough with respect to the considered wavelength. This should not be a problem in EnVision given the SAR instrument and its interferometric capababilities that can acquire topographic information at the scale required for clutter mitigation in post-processing.
Example of L2 products on SHARAD data: (a) radargram obtained by azimuth and range processing; (b) simulation of clutter effects based on the DTM of the target; (c) false color composition that superimposes the radargram with the detected clutter (in green the measured data, in white the surface reflection and the detected surface clutter) [8].
6. Preliminary Instrument Parameters
• MARSIS (Mars Advanced Radar for Subsurface and Ionosphere Sounding) on ESA Mars Express [2] and SHARAD (Shallow Radar) on NASA Mars Reconnaissance Orbiter [3].
• RIME (Radar for Icy Moon Exploration) on ESA Jupiter Icy Moon Explorer [4]-[5].
4. Heritage and Examples of Radargrams Relevant to Venus
This poster summarizes the potentials of a radar sounder for Venus. A radar sounder can be a very effective instrument for complementing the suite of payloads in EnVision. The main gain in terms of scientific return is that the radar sounder can perform measurements at either shallow or moderate depth of the subsurface of Venus. These measurments integrated with all the information extracted by the C-band SAR system would result in an exceptional capability to study jointly surface and subsurface properties and phenomena of Venus. Preliminary studies and experience gained with MARSIS and SHARAD on areas on Mars having similar properties to what expected in some part at of Venus point out the feasibility of the sounding and the rich amount of information that can be extracted. Further studies are currently in progress for reducing the uncertainty on the expected subsurface scenario.
7. Conclusions
2. Radar Sounding of Venus
The use of a low frequency nadir looking radar sounder can provide the ideal complementary information to both the SAR data obtained by Magellan and the information acquired by the C-band (or S-band) interferometric SAR. This would result in a full and detailed investigation of the surface and subsurface geology of Venus.
A radar sounder, which can operate at VHF or UHF central frequencies, can acquire fundamental information on subsurface geology which cannot be achieved with the InSAR system. In particular it can focus on mapping the vertical structure of geologic units by exploring the subsurface properties of tessera, plains, lava flows and impact
debris. The sounder could analyze the shallow subsurface of Venus to detect and map geological structures and to
identify mechanical and dielectric interfaces.
A radar sounder instrument also provides information on the surface in terms of roughness, composition and
dielectrical properties at wavelength completely different from those of SAR, thus allowing a better understanding of the surface properties. Moreover, a fusion of the InSAR data (both intensity, topography and displacement variables) with the sounder data would result in an exceptional capability to understand the link between the
surface and subsurface processes on Venus. Note that depending on the design of the system, the sounder could also acquire measurements for characterizing the ionosphere.
The Radar Sounder for EnVision can acquire information on the shallow subsurface with the following main scientific goals:
• Characterization of the different stratigraphic and structural patterns of the subsurface. • Study the volcanism phenomena and their impact on the geological evolution of the Venusian topography. • Detection of subsurface structures non directly linked with surface. • Analysis of the materials in the surface and subsurface and their metamorphism linked to the burial process. • Synergistic analysis of the data provided by SAR and radar sounder sensors to study the evolution of the planet. • Analysis of the total electron content of the ionosphere.
The sounder can be designed to study either the shallow subsurface with high vertical resolution or to obtain moderate penetration with reduced vertical resolution. Taking into account the plasma frequency, the lowest central frequency that can be used is of 6 MHz. The table below reports a preliminary identification of the possible ranges
in which selecting the sounder parameters.
The ionosphere of Venus can affect radar signal propagation, but offers additional opportunities for science. The maximum plasma frequency on the day side is around 5-6 MHz, below 1 MHz on the night side. Signals below those frequencies cannot propagate to the surface. Similarly to Mars, a radar signal will be distorted in crossing the dispersive plasma, but such distortion can be corrected, and the correction algorithm can provide information on the total electron content of the ionosphere.
[5] Bruzzone, L., Alberti, G., Catallo, C., Ferro, A., Kofman, W., Orosei, R., Sub-Surface Radar Sounding of the Jovian Moon Ganymede, Proceedings of the IEEE, Vol. 99, No.5, 2011, pp. 837-857.
[6] Carter, L. M., and 12 colleagues, Shallow radar (SHARAD) sounding observations of the Medusae Fossae Formation, Mars, Icarus, Volume 199, Issue 2, February 2009.
[7] Carter, L. M., and 8 colleagues, Dielectric properties of lava flows west of Ascraeus Mons, Mars. Geoph. Research Letters 36, 23204. 2009. [8] Ferro, A., Bruzzone, L., "Automatic Extraction and Analysis of Ice Layering in Radar Sounder Data," Geoscience and Remote Sensing, IEEE
Transactions on , vol.51, no.3, pp.1622,1634, March 2013.
SHARAD radargram over a portion of western Medusae Fossae Formation, a low-density pyroclastic deposit spanning across the crustal dichotomy of Mars. The deposit labelled "North Hill“ (nh) is about 500 m thick (taken from [6]). SHARAD radargram across two distinct lava flows emanating from Ascraeus Mons, Mars. Estimates of dielectric permittivity are between 6 and 17, loss tangent is in the range 0.01-0.03. These values are consistent with those of terrestrial and lunar basalts (taken from [7]).
Venus RMS meter-scale surface roughness [1].

28th October 2015 -- VEXAG 13 Slide 25 © Rich Ghail Venus Mission Plans in Europe
The Radar Sounder for EnVision can acquire information on the shallow subsurface with the following main scientific goals:• Characterization of the different stratigraphic and structural
patterns of the subsurface.• Study the volcanism phenomena and their impact on the
geological evolution of the Venusian topography.• Detection of subsurface structures non directly linked with
surface.• Analysis of the materials in the surface and subsurface and
their metamorphism linked to the burial process.• Synergistic analysis of the data provided by SAR and radar
sounder sensors to study the evolution of the planet.• Analysis of the total electron content of the
ionosphere.One of the main issues for the design of theradar sounder instrument for EnVision concernsthe physical and electromagnetic modelling ofthe surface and subsurface targets.
A Radar Sounder Instrument for EnVision
[1] Ford, P. G., Pettengill, G. H. Venus topography and kilometer-scale slopes. Journal of Geophysical Research 97, 13103. 1992. [2] Picardi, G., and 33 colleagues. Radar Soundings of the Subsurface of Mars. Science 310, 1925-1928. 2005. [3] Seu, R., and 11 colleagues. SHARAD sounding radar on the Mars Reconnaissance Orbiter. Journal of Geophysical Research (Planets)
112, 5. 2007. [4] Bruzzone, L., and 15 colleagues. RIME: Radar for Icy Moon Exploration, IGARSS 2013.
Transmitted central frequency (fc) In the range 6 - 30 MHz
Transmitted bandwidth (Bw) In the range 2 - 10 MHz
Antenna type Dipole (deployable)
Antenna dimension TBD (depending on the central frequency)
Power 30 W
Along track resolution < 1 km
Across track resolution < 5 km
Vertical resolution 75 m (Bw=2 MHz) - 15 m (Bw=10 MHz) (vacuum)
Estimated maximum penetration depth 1.5 Km (fc=6 MHz) - 600 m (fc=30 MHz)
Data rate 300 – 10000 kbps (depending on selected parameters and operation scenarios)
Mass (without antenna) 10 kg
Size 37×25×13 cm
Pointing requirements Nadir
L. Bruzzone1, F. Bovolo2, R. Orosei3, D. Castelletti1, R. Seu4
1 Dept. of Information Engineering and Computer Science, University of Trento, Trento, Italy,
2 Fondazione Bruno Kessler, Trento, Italy 3 INAF, Bologna, Italy
4 University of R
o
ma “La Sa pienza”, Roma, Italy
Corresponding author: [email protected]
Many open science questions of the ESA M-class EnVision mission proposal are related to the characterization of the surface and the subsurface of Venus. Given the atmospheric conditions and the properties of the surface, some of the key science questions and the related science goals can be effectively addressed only by using properly designed radar instruments. Currently, the use of a C-band (or S-band) SAR system with interferometric capabilities is considered in the core payload. This is aimed to address science goals related to the measurements of the topography and of the surface displacements according to differential interferometric techniques. However, this system can only study the surface vertical structure and cannot provide any direct measure on the subsurface. Accordingly, in this poster we propose and discuss a complementary radar instrument which is a low-frequency radar sounder.
1. Introduction
One of the main issues for the design of the radar sounder instrument for EnVision concerns the physical and electromagnetic modelling of the surface and subsurface targets. Magellan radar measurements provided information on terrain dielectric properties and surface roughness. We can distinguish two main areas:
Highland areas which are mostly characterized by high values of the dielectric permittivity ε (e.g., around 20), supposedly because of rocks with metal content; and high surface roughness. Lowland areas are composed by basalt materials with expected high porosity that entails an expected value of ε = 5 ± 0.9. Lowland areas present smoother topography.
Highlands (about 20% of the Venus area) may represent a critical scenario for the penetration the radar electromagnetic waves, whereas lowland (about 80% of the Venus area) have dielectric constants that are suitable for sounding.
3. Science goals
False-color representation of Venus surface topography, data acquired by Magellan satellite [1].
Clutter is given by off-nadir surface reflections reaching the radar at the same time as subsurface nadir reflections, thus potentially masking them. The strength of clutter is controlled by statistical parameters of the topography of natural surfaces scattering the radiation.
The signal ambiguity introduce by the clutter could limit data analysis and interpretation.
5. Clutter
Different approaches are possible for identifying and reducing clutter effects. These approaches require the availability of Digital Terrain Model (DTM) for identifying clutter features in areas where the surface is rough with respect to the considered wavelength. This should not be a problem in EnVision given the SAR instrument and its interferometric capababilities that can acquire topographic information at the scale required for clutter mitigation in post-processing.
Example of L2 products on SHARAD data: (a) radargram obtained by azimuth and range processing; (b) simulation of clutter effects based on the DTM of the target; (c) false color composition that superimposes the radargram with the detected clutter (in green the measured data, in white the surface reflection and the detected surface clutter) [8].
6. Preliminary Instrument Parameters
• MARSIS (Mars Advanced Radar for Subsurface and Ionosphere Sounding) on ESA Mars Express [2] and SHARAD (Shallow Radar) on NASA Mars Reconnaissance Orbiter [3].
• RIME (Radar for Icy Moon Exploration) on ESA Jupiter Icy Moon Explorer [4]-[5].
4. Heritage and Examples of Radargrams Relevant to Venus
This poster summarizes the potentials of a radar sounder for Venus. A radar sounder can be a very effective instrument for complementing the suite of payloads in EnVision. The main gain in terms of scientific return is that the radar sounder can perform measurements at either shallow or moderate depth of the subsurface of Venus. These measurments integrated with all the information extracted by the C-band SAR system would result in an exceptional capability to study jointly surface and subsurface properties and phenomena of Venus. Preliminary studies and experience gained with MARSIS and SHARAD on areas on Mars having similar properties to what expected in some part at of Venus point out the feasibility of the sounding and the rich amount of information that can be extracted. Further studies are currently in progress for reducing the uncertainty on the expected subsurface scenario.
7. Conclusions
2. Radar Sounding of Venus
The use of a low frequency nadir looking radar sounder can provide the ideal complementary information to both the SAR data obtained by Magellan and the information acquired by the C-band (or S-band) interferometric SAR. This would result in a full and detailed investigation of the surface and subsurface geology of Venus.
A radar sounder, which can operate at VHF or UHF central frequencies, can acquire fundamental information on subsurface geology which cannot be achieved with the InSAR system. In particular it can focus on mapping the vertical structure of geologic units by exploring the subsurface properties of tessera, plains, lava flows and impact
debris. The sounder could analyze the shallow subsurface of Venus to detect and map geological structures and to
identify mechanical and dielectric interfaces.
A radar sounder instrument also provides information on the surface in terms of roughness, composition and
dielectrical properties at wavelength completely different from those of SAR, thus allowing a better understanding of the surface properties. Moreover, a fusion of the InSAR data (both intensity, topography and displacement variables) with the sounder data would result in an exceptional capability to understand the link between the
surface and subsurface processes on Venus. Note that depending on the design of the system, the sounder could also acquire measurements for characterizing the ionosphere.
The Radar Sounder for EnVision can acquire information on the shallow subsurface with the following main scientific goals:
• Characterization of the different stratigraphic and structural patterns of the subsurface. • Study the volcanism phenomena and their impact on the geological evolution of the Venusian topography. • Detection of subsurface structures non directly linked with surface. • Analysis of the materials in the surface and subsurface and their metamorphism linked to the burial process. • Synergistic analysis of the data provided by SAR and radar sounder sensors to study the evolution of the planet. • Analysis of the total electron content of the ionosphere.
The sounder can be designed to study either the shallow subsurface with high vertical resolution or to obtain moderate penetration with reduced vertical resolution. Taking into account the plasma frequency, the lowest central frequency that can be used is of 6 MHz. The table below reports a preliminary identification of the possible ranges
in which selecting the sounder parameters.
The ionosphere of Venus can affect radar signal propagation, but offers additional opportunities for science. The maximum plasma frequency on the day side is around 5-6 MHz, below 1 MHz on the night side. Signals below those frequencies cannot propagate to the surface. Similarly to Mars, a radar signal will be distorted in crossing the dispersive plasma, but such distortion can be corrected, and the correction algorithm can provide information on the total electron content of the ionosphere.
[5] Bruzzone, L., Alberti, G., Catallo, C., Ferro, A., Kofman, W., Orosei, R., Sub-Surface Radar Sounding of the Jovian Moon Ganymede, Proceedings of the IEEE, Vol. 99, No.5, 2011, pp. 837-857.
[6] Carter, L. M., and 12 colleagues, Shallow radar (SHARAD) sounding observations of the Medusae Fossae Formation, Mars, Icarus, Volume 199, Issue 2, February 2009.
[7] Carter, L. M., and 8 colleagues, Dielectric properties of lava flows west of Ascraeus Mons, Mars. Geoph. Research Letters 36, 23204. 2009. [8] Ferro, A., Bruzzone, L., "Automatic Extraction and Analysis of Ice Layering in Radar Sounder Data," Geoscience and Remote Sensing, IEEE
Transactions on , vol.51, no.3, pp.1622,1634, March 2013.
SHARAD radargram over a portion of western Medusae Fossae Formation, a low-density pyroclastic deposit spanning across the crustal dichotomy of Mars. The deposit labelled "North Hill“ (nh) is about 500 m thick (taken from [6]). SHARAD radargram across two distinct lava flows emanating from Ascraeus Mons, Mars. Estimates of dielectric permittivity are between 6 and 17, loss tangent is in the range 0.01-0.03. These values are consistent with those of terrestrial and lunar basalts (taken from [7]).
Venus RMS meter-scale surface roughness [1].
A Radar Sounder Instrument for EnVision
[1] Ford, P. G., Pettengill, G. H. Venus topography and kilometer-scale slopes. Journal of Geophysical Research 97, 13103. 1992. [2] Picardi, G., and 33 colleagues. Radar Soundings of the Subsurface of Mars. Science 310, 1925-1928. 2005. [3] Seu, R., and 11 colleagues. SHARAD sounding radar on the Mars Reconnaissance Orbiter. Journal of Geophysical Research (Planets)
112, 5. 2007. [4] Bruzzone, L., and 15 colleagues. RIME: Radar for Icy Moon Exploration, IGARSS 2013.
Transmitted central frequency (fc) In the range 6 - 30 MHz
Transmitted bandwidth (Bw) In the range 2 - 10 MHz
Antenna type Dipole (deployable)
Antenna dimension TBD (depending on the central frequency)
Power 30 W
Along track resolution < 1 km
Across track resolution < 5 km
Vertical resolution 75 m (Bw=2 MHz) - 15 m (Bw=10 MHz) (vacuum)
Estimated maximum penetration depth 1.5 Km (fc=6 MHz) - 600 m (fc=30 MHz)
Data rate 300 – 10000 kbps (depending on selected parameters and operation scenarios)
Mass (without antenna) 10 kg
Size 37×25×13 cm
Pointing requirements Nadir
L. Bruzzone1, F. Bovolo2, R. Orosei3, D. Castelletti1, R. Seu4
1 Dept. of Information Engineering and Computer Science, University of Trento, Trento, Italy,
2 Fondazione Bruno Kessler, Trento, Italy 3 INAF, Bologna, Italy
4 University of R
o
ma “La Sa pienza”, Roma, Italy
Corresponding author: [email protected]
Many open science questions of the ESA M-class EnVision mission proposal are related to the characterization of the surface and the subsurface of Venus. Given the atmospheric conditions and the properties of the surface, some of the key science questions and the related science goals can be effectively addressed only by using properly designed radar instruments. Currently, the use of a C-band (or S-band) SAR system with interferometric capabilities is considered in the core payload. This is aimed to address science goals related to the measurements of the topography and of the surface displacements according to differential interferometric techniques. However, this system can only study the surface vertical structure and cannot provide any direct measure on the subsurface. Accordingly, in this poster we propose and discuss a complementary radar instrument which is a low-frequency radar sounder.
1. Introduction
One of the main issues for the design of the radar sounder instrument for EnVision concerns the physical and electromagnetic modelling of the surface and subsurface targets. Magellan radar measurements provided information on terrain dielectric properties and surface roughness. We can distinguish two main areas:
Highland areas which are mostly characterized by high values of the dielectric permittivity ε (e.g., around 20), supposedly because of rocks with metal content; and high surface roughness. Lowland areas are composed by basalt materials with expected high porosity that entails an expected value of ε = 5 ± 0.9. Lowland areas present smoother topography.
Highlands (about 20% of the Venus area) may represent a critical scenario for the penetration the radar electromagnetic waves, whereas lowland (about 80% of the Venus area) have dielectric constants that are suitable for sounding.
3. Science goals
False-color representation of Venus surface topography, data acquired by Magellan satellite [1].
Clutter is given by off-nadir surface reflections reaching the radar at the same time as subsurface nadir reflections, thus potentially masking them. The strength of clutter is controlled by statistical parameters of the topography of natural surfaces scattering the radiation.
The signal ambiguity introduce by the clutter could limit data analysis and interpretation.
5. Clutter
Different approaches are possible for identifying and reducing clutter effects. These approaches require the availability of Digital Terrain Model (DTM) for identifying clutter features in areas where the surface is rough with respect to the considered wavelength. This should not be a problem in EnVision given the SAR instrument and its interferometric capababilities that can acquire topographic information at the scale required for clutter mitigation in post-processing.
Example of L2 products on SHARAD data: (a) radargram obtained by azimuth and range processing; (b) simulation of clutter effects based on the DTM of the target; (c) false color composition that superimposes the radargram with the detected clutter (in green the measured data, in white the surface reflection and the detected surface clutter) [8].
6. Preliminary Instrument Parameters
• MARSIS (Mars Advanced Radar for Subsurface and Ionosphere Sounding) on ESA Mars Express [2] and SHARAD (Shallow Radar) on NASA Mars Reconnaissance Orbiter [3].
• RIME (Radar for Icy Moon Exploration) on ESA Jupiter Icy Moon Explorer [4]-[5].
4. Heritage and Examples of Radargrams Relevant to Venus
This poster summarizes the potentials of a radar sounder for Venus. A radar sounder can be a very effective instrument for complementing the suite of payloads in EnVision. The main gain in terms of scientific return is that the radar sounder can perform measurements at either shallow or moderate depth of the subsurface of Venus. These measurments integrated with all the information extracted by the C-band SAR system would result in an exceptional capability to study jointly surface and subsurface properties and phenomena of Venus. Preliminary studies and experience gained with MARSIS and SHARAD on areas on Mars having similar properties to what expected in some part at of Venus point out the feasibility of the sounding and the rich amount of information that can be extracted. Further studies are currently in progress for reducing the uncertainty on the expected subsurface scenario.
7. Conclusions
2. Radar Sounding of Venus
The use of a low frequency nadir looking radar sounder can provide the ideal complementary information to both the SAR data obtained by Magellan and the information acquired by the C-band (or S-band) interferometric SAR. This would result in a full and detailed investigation of the surface and subsurface geology of Venus.
A radar sounder, which can operate at VHF or UHF central frequencies, can acquire fundamental information on subsurface geology which cannot be achieved with the InSAR system. In particular it can focus on mapping the vertical structure of geologic units by exploring the subsurface properties of tessera, plains, lava flows and impact
debris. The sounder could analyze the shallow subsurface of Venus to detect and map geological structures and to
identify mechanical and dielectric interfaces.
A radar sounder instrument also provides information on the surface in terms of roughness, composition and
dielectrical properties at wavelength completely different from those of SAR, thus allowing a better understanding of the surface properties. Moreover, a fusion of the InSAR data (both intensity, topography and displacement variables) with the sounder data would result in an exceptional capability to understand the link between the
surface and subsurface processes on Venus. Note that depending on the design of the system, the sounder could also acquire measurements for characterizing the ionosphere.
The Radar Sounder for EnVision can acquire information on the shallow subsurface with the following main scientific goals:
• Characterization of the different stratigraphic and structural patterns of the subsurface. • Study the volcanism phenomena and their impact on the geological evolution of the Venusian topography. • Detection of subsurface structures non directly linked with surface. • Analysis of the materials in the surface and subsurface and their metamorphism linked to the burial process. • Synergistic analysis of the data provided by SAR and radar sounder sensors to study the evolution of the planet. • Analysis of the total electron content of the ionosphere.
The sounder can be designed to study either the shallow subsurface with high vertical resolution or to obtain moderate penetration with reduced vertical resolution. Taking into account the plasma frequency, the lowest central frequency that can be used is of 6 MHz. The table below reports a preliminary identification of the possible ranges
in which selecting the sounder parameters.
The ionosphere of Venus can affect radar signal propagation, but offers additional opportunities for science. The maximum plasma frequency on the day side is around 5-6 MHz, below 1 MHz on the night side. Signals below those frequencies cannot propagate to the surface. Similarly to Mars, a radar signal will be distorted in crossing the dispersive plasma, but such distortion can be corrected, and the correction algorithm can provide information on the total electron content of the ionosphere.
[5] Bruzzone, L., Alberti, G., Catallo, C., Ferro, A., Kofman, W., Orosei, R., Sub-Surface Radar Sounding of the Jovian Moon Ganymede, Proceedings of the IEEE, Vol. 99, No.5, 2011, pp. 837-857.
[6] Carter, L. M., and 12 colleagues, Shallow radar (SHARAD) sounding observations of the Medusae Fossae Formation, Mars, Icarus, Volume 199, Issue 2, February 2009.
[7] Carter, L. M., and 8 colleagues, Dielectric properties of lava flows west of Ascraeus Mons, Mars. Geoph. Research Letters 36, 23204. 2009. [8] Ferro, A., Bruzzone, L., "Automatic Extraction and Analysis of Ice Layering in Radar Sounder Data," Geoscience and Remote Sensing, IEEE
Transactions on , vol.51, no.3, pp.1622,1634, March 2013.
SHARAD radargram over a portion of western Medusae Fossae Formation, a low-density pyroclastic deposit spanning across the crustal dichotomy of Mars. The deposit labelled "North Hill“ (nh) is about 500 m thick (taken from [6]). SHARAD radargram across two distinct lava flows emanating from Ascraeus Mons, Mars. Estimates of dielectric permittivity are between 6 and 17, loss tangent is in the range 0.01-0.03. These values are consistent with those of terrestrial and lunar basalts (taken from [7]).
Venus RMS meter-scale surface roughness [1].
28th October 2015 -- VEXAG 13 Slide 26 © Rich Ghail Venus Mission Plans in Europe

28th October 2015 -- VEXAG 13 Slide 27 © Rich Ghail Venus Mission Plans in Europe
EnVision carries a 2-m diameter 100 WRF X-band high gain antenna to deliver a signal to noise in excess of 45 dB from 1.7 AU (the maximum Earth-Venus distance), sufficient to permit the use of QAM256 which allows 8 bits per symbol to be transmitted to Earth (shown at left is QAM16 for clarity). It is used from geostationary orbit but never before from deep space.
X-band is favoured for its lower cost, higher TWT power and low susceptibility to rain and transmitter losses.
VenSAR’s 5·47 m long antenna must be folded for launch and unfolded after the SRS dipole perpendicular to it.
[Spacecraft design and communications solution by Thales Alenia Space.]
[Wikipedia]

28th October 2015 -- VEXAG 13 Slide 28 © Rich Ghail Venus Mission Plans in Europe
• 550M€ cost on completion provides significant margin for EnVision (M4 was 450M€)
• VenSAR is already optimised for Venus and will not fundamentally change
• VEM gains a UV spectrometer channel for mesospheric SO2
• HGA antenna size reduced from 3.2 m to 2.0 m
• 25% reduction in total data volume to ~700 Tb
• Nominal mission length extended to 5 years
• Suggested launch opportunityis October 2029

28th October 2015 -- VEXAG 13 Slide 29 © Rich Ghail Venus Mission Plans in Europe
Targeting of Venera landing sites at high resolution
Spotlight imaging of Venera landing sites [Illustrative only]

28th October 2015 -- VEXAG 13 Slide 30 © Rich Ghail Venus Mission Plans in Europe
Targeting of Venera landing sites at high resolution
Spotlight imaging of Venera landing sites
Data Type Data Volume Coverage
Stereo 208·9 Tbits 70·8%
Interferometry 343·8 Tbits 26·8%
Polarimetry 67·0 Tbits 27·6%
High Resolution 23·7 Tbits 8·0%
Sliding Spotlight 0·9 Tbits <0·1%
Subsurface Sounder 23·9 Tbits ~100%
VEM-M 11·1 Tbits ~100%
[Illustrative only]
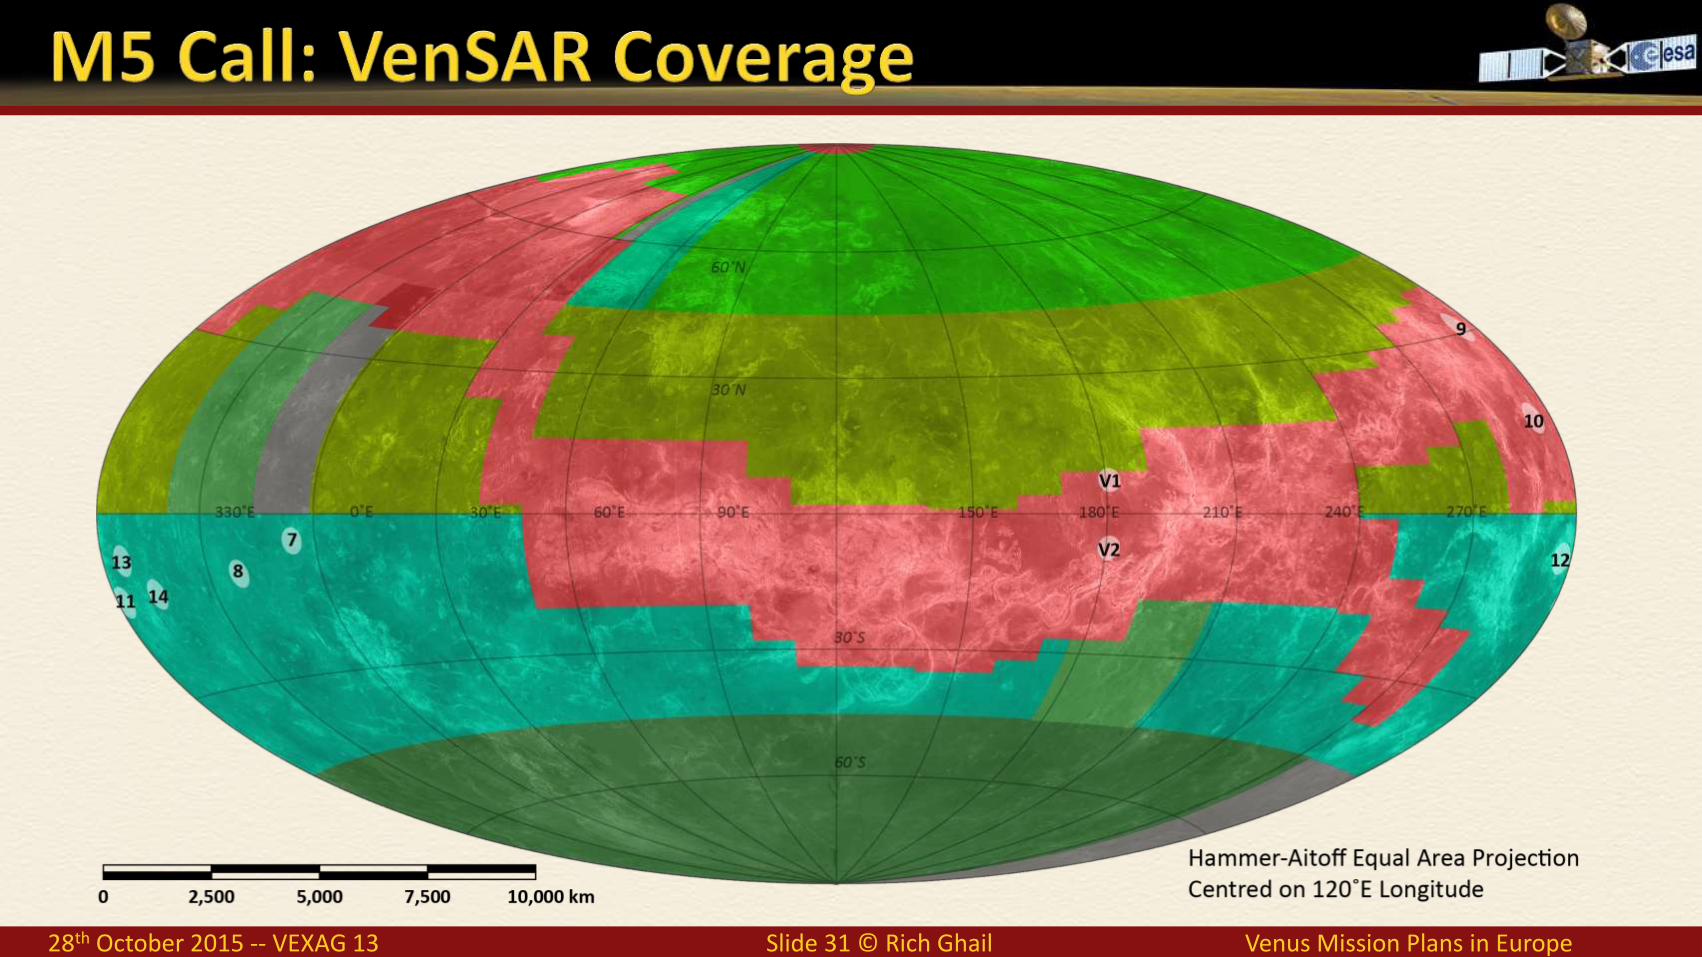
28th October 2015 -- VEXAG 13 Slide 31 © Rich Ghail Venus Mission Plans in Europe

28th October 2015 -- VEXAG 13 Slide 32 © Rich Ghail Venus Mission Plans in Europe

28th October 2015 -- VEXAG 13 Slide 33 © Rich Ghail Venus Mission Plans in Europe
Davinci• Deep Atmosphere Venus Investigation of Noble gases, Chemistry, and Imaging (DAVINCI) • will study the chemical composition of Venus’ atmosphere during a 63-minute descent.• It would find whether there are volcanoes active today on the surface of Venus and how the surface
interacts with the atmosphere of the planet.• If flown, there is no significant impact on EnVision’s mission goals but VenSAR could provide
geological context for the landing site of the probe.
Veritas• The primary mission goals, accomplished by seven objectives, require a radar (VISAR), VEM(-M) and a
gravity science investigation over a 2-year orbital mission (2022-2024).• VISAR (Venus Interferometric Synthetic Aperture Radar) generates a DEM (digital elevation model)
with an accuracy of 250 m horizontal by 5 m vertical.• If flown, VERITAS will have addressed EnVision’s global mapping and topography goals, freeing
VenSAR to focus on targeted observations for change detection and surface-atmosphere interactions at key sites with high resolution imaging, polarimetry, and differential InSAR.
28th October 2015 -- VEXAG 13 Slide 34 © Rich Ghail Venus Mission Plans in Europe
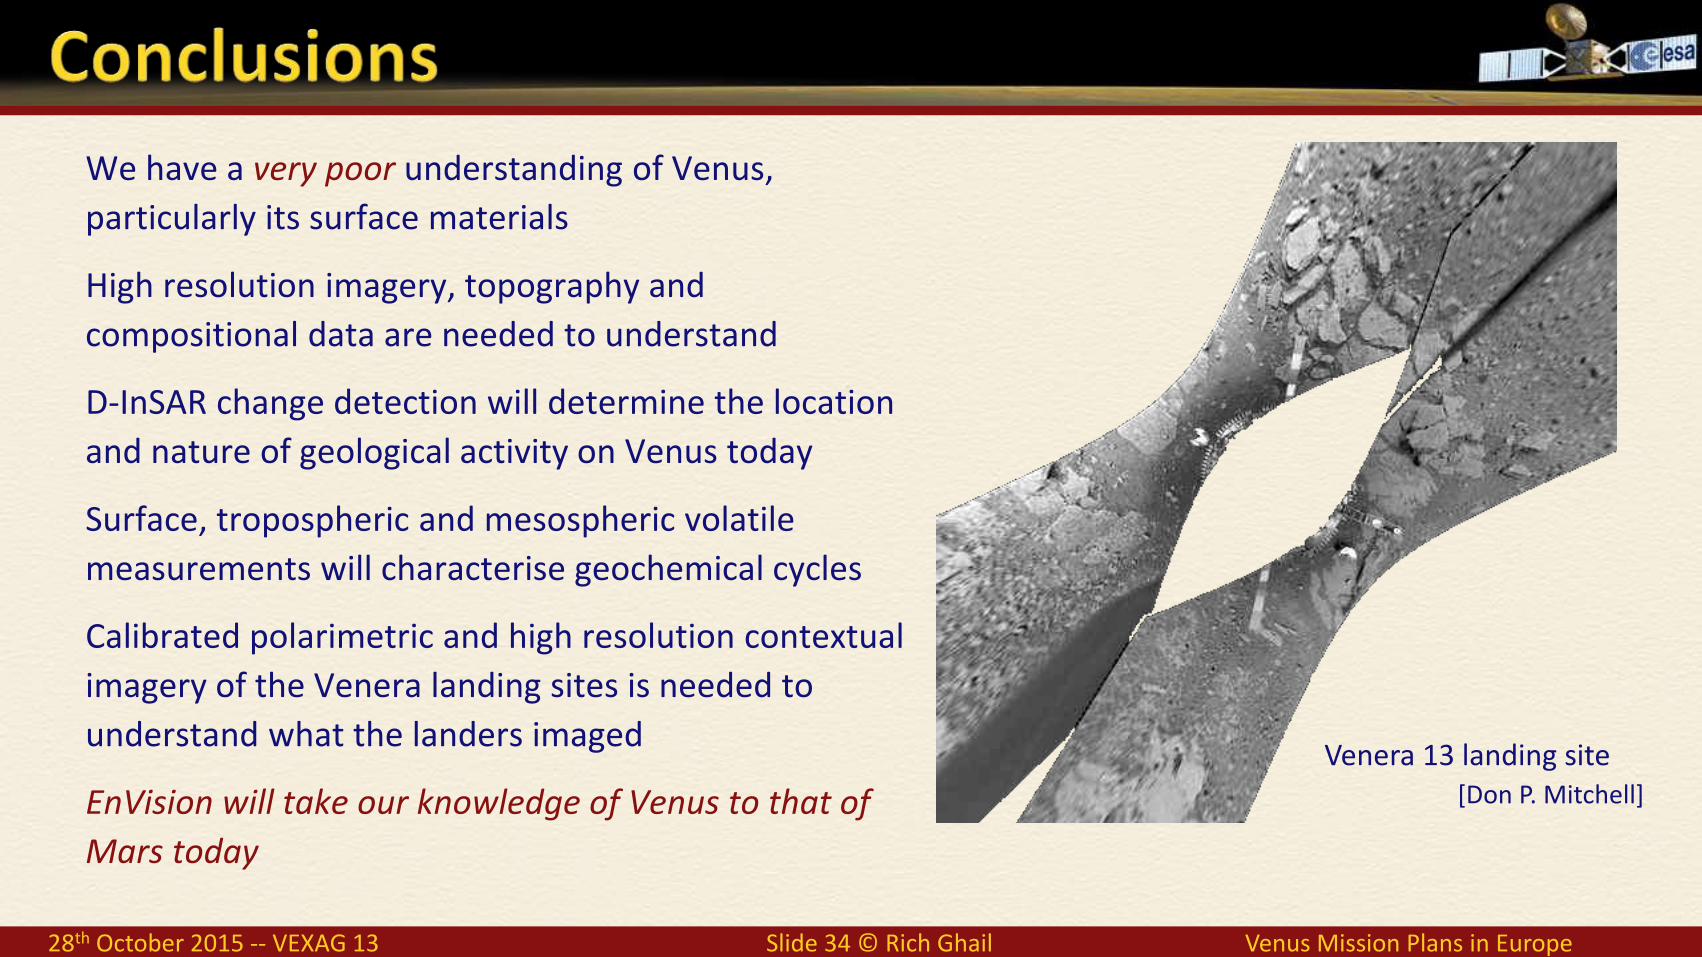
We have a very poor understanding of Venus, particularly its surface materials
High resolution imagery, topography and compositional data are needed to understand
D-InSAR change detection will determine the location and nature of geological activity on Venus today
Surface, tropospheric and mesospheric volatile measurements will characterise geochemical cycles
Calibrated polarimetric and high resolution contextual imagery of the Venera landing sites is needed to understand what the landers imaged
EnVision will take our knowledge of Venus to that of Mars today
Venera 13 landing site[Don P. Mitchell]