richard woods, eorgia’s school superintendent …. john d. barge, state school superintendent...
TRANSCRIPT

Dr. John D. Barge, State School Superintendent
“Making Education Work for All Georgians”
www.gadoe.org
Richard Woods, Georgia’s School Superintendent“Educating Georgia’s Future”
gadoe.org
CCRPI
Progress/ Gap/SLDSThey work hand in hand
Terri Gaspierik District Effectiveness Specialist [email protected]
Charles Price School Effectiveness Specialist [email protected]

Tests 20 pointsReadiness 15 pointsGraduation 15 points
50 points
Student Progress -- 40 pointsClosing the GAP -- 10 points
100 PointsChallenge Points 10 Points
Total 110 Points
} 50 Points

Achievement Points
(50 pts)Progress
Points
(SGPs)
Achievement
Gap
Challenge Points
Content
Mastery
(Tests)
Post
School
Readiness
Graduation
Predictor
ED/EL/SWD
Performance
(Flags)
Exceeding
the Bar
Indicators
2015 CCRPI Performance Categories
20 pts 15 pts 15 pts 40 pts 10 pts 10 pts

Background on
Student Growth Percentiles
Students obtain growth percentiles,
ranging from 1 to 99, which indicate
how their current achievement compares
with that of their statewide academic
peers who had similar score histories.
http://www.youtube.com/watch?v=dyArv7184ZY&feature=player_embedded


SGPs SLDS Median (Middle)
SGPs CCRPI % 35 and Above
SGPs TEM & LEM Mean (Average)

The list of students on the
left are all in one class.
These 11 students are
sorted in order from low to
high SGP.
The median SGP is the
middle value, where 50%
of students have a lower
SGP and 50% have a
higher SGP.
SLDS: Median or Middle SGPs

Higher Achievement
Lower Growth
Lower Achievement
Lower Growth
Higher Achievement
Higher Growth
Lower Achievement
Higher Growth
% M
eets
& E
xceed
s
Median Student Growth Percentile
GROWTH
AC
HIE
VE
ME
NT
in SLDS

Higher Achievement
Lower Achievement
Lower Growth
Higher Achievement
Higher Growth
Lower Achievement
Higher Growth
Lower Growth
% M
eets
& E
xce
ed
s
Median Student Growth Percentile
100%
90%
80%
70%
60%
50%
40%
30%
20%
10%
0%
0% 10% 20% 30% 40% 50% 60% 70% 80% 90% 100%

34% 66%Low
Growth
Typical
Growth
High
Growth
% M
eets
& E
xce
ed
s
100%
90%
80%
70%
60%
50%
40%
30%
20%
10%
0%
0% 10% 20% 30% 40% 50% 60% 70% 80% 90% 100%

SGPs 35 or Higher By Content Area
56%62%
49%
38%
49%
20%
30%
40%
50%
60%
70%
80%
90%
100%
ELA Reading Math Science Soc. Studies
File 11

Tests 20 pointsReadiness 15 pointsGraduation 15 points
50 points
Student Progress -- 40 pointsClosing the GAP -- 10 points
100 PointsChallenge Points 10 Points
Total 110 Points
} 50 Points

Tests 20 pointsReadiness 15 pointsGraduation 15 points
50 points
Student Progress -- 40 pointsClosing the GAP -- 10 points
100 PointsChallenge Points 10 Points
Total 110 Points
} 50 Points


School’s lowest quartile of FAY students(focal group)
State’s mean performance of FAY students(reference group)

ACHIEVEMENT GAP SIZE
Big Gap = Fewer Points
Small Gap = More Points
GAP SIZE SCORE
1.2 or Greater 0
0.9 – 1.19 1
0.5 – 0.89 2
Less than 0.5 3
BIG GAP
SMALL GAP
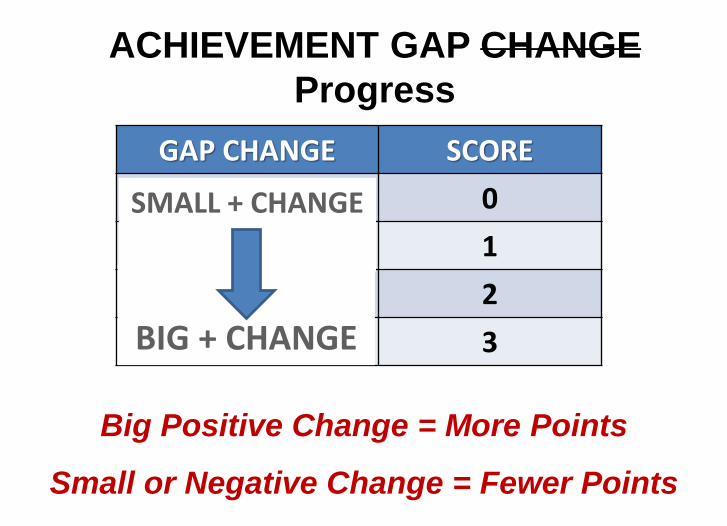
ACHIEVEMENT GAP CHANGE
Progress
Big Positive Change = More Points
Small or Negative Change = Fewer Points
GAP CHANGE SCORE
0.05 or Greater 0
-0.04 – 0.04 1
-0.15 – -0.05 2
Less than -0.15 3
SMALL + CHANGE
BIG + CHANGE


Dr. John D. Barge, State School Superintendent
“Making Education Work for All Georgians”
www.gadoe.org
Richard Woods, Georgia’s School Superintendent“Educating Georgia’s Future”
gadoe.org
Don’t practice for basketball with a
football!• Where are we making Progress by Milestone
• Where are we closing the Gap by Milestone
• Which teacher has consistently made the
greatest Progress
• Which teacher has consistently made the
least Progress
• What are our school’s weakest domains for
Progress
• Which teachers show the greatest gains by
Domain

Dr. John D. Barge, State School Superintendent
“Making Education Work for All Georgians”
www.gadoe.org
Richard Woods, Georgia’s School Superintendent“Educating Georgia’s Future”
gadoe.org
Tools for School
ComparisonBobby Smith, Coastal Plains RESA tools
https://www.dropbox.com/sh/qftli82p29he1li/AACQUHLhS9uTyfj-
7CTDH8tga?dl=0
Progress for each school by Milestone
http://www.gadoe.org/Curriculum-Instruction-and-
Assessment/Assessment/Pages/GSGM-Data-Files.aspx
Link to 2017 Changes
http://www.gadoe.org/Curriculum-Instruction-and-
Assessment/Accountability/Documents/Indicators%20and%20Targets
/2017%20Summary%20of%20Changes.pdf

Implications for Our Work
Scoring on the CCRPI is heavily influenced by good practices for teaching and learning.
Work on those good practices rather than adding programs or chasing half points here and there.
30

SMART Goal: Increase graduation rates for subgroups by
designated percentages shown in Appendix A.
Actions, Strategies, Interventions
1. Implement extra learning time for struggling seniors
(CCRPI 17-18)
a) Zero Block -- Before school tutoring
b) Fifth Block -- After school tutoring
c) SOS Program (Save Our Seniors) – Tutoring during
lunch
2. Implement differentiation/UDL (TK #4)
Mark SIP Actions with CCRPI Indicators

1. Improve CCRPI understanding of school
and district leaders.
2. Develop a communication plan.
3. Push understanding to the teacher level.
4. Improve portal proficiency of administrators.
5. Improve teacher and leader proficiency with SLDS.
6. Understand the math behind the numbers.
7. Appoint Webinar/Accountability Scouts.

9. Teach Science and Social Studies.
10. Find the “low hanging” fruit.
11. Monitor and improve RTI, FLP, ILT (Lowest
quartile gap).
12. Improve co-teaching practices.
13. Recognize that the big problems are district
problems (grad rate, literacy, math, etc.)
14. Use the spreadsheet tools to drill into CCRPI
category and indicator performance.
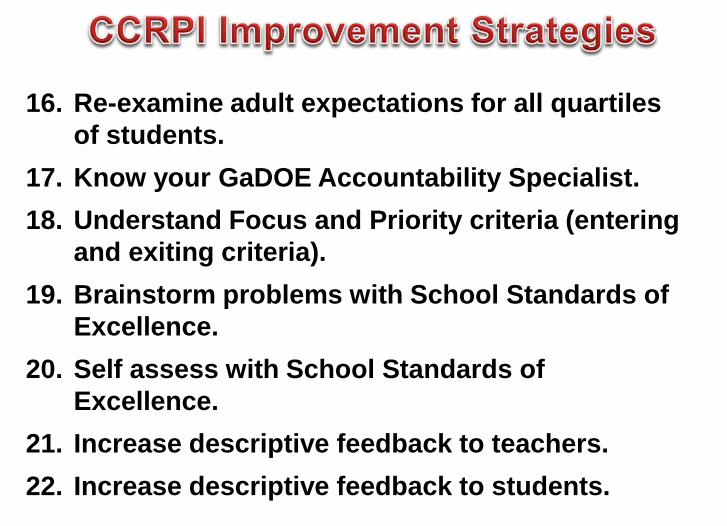
16. Re-examine adult expectations for all quartiles
of students.
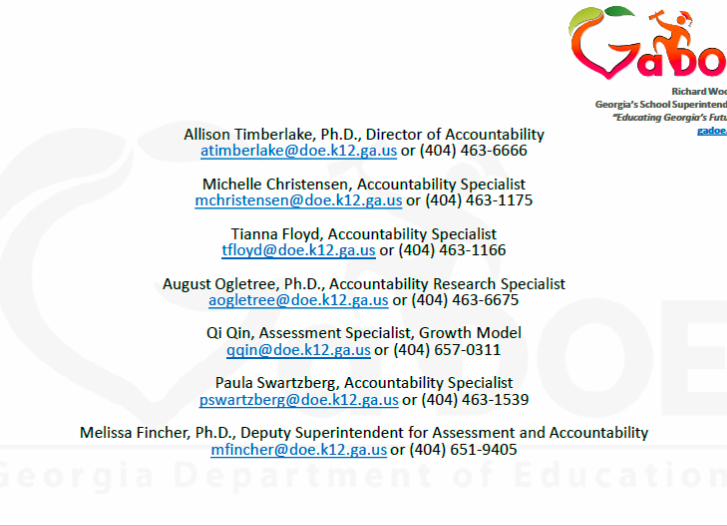
17. Know your GaDOE Accountability Specialist.
18. Understand Focus and Priority criteria (entering
and exiting criteria).
19. Brainstorm problems with School Standards of
Excellence.
20. Self assess with School Standards of
Excellence.
21. Increase descriptive feedback to teachers.
22. Increase descriptive feedback to students.

24. Drill into domain performance in all content
areas on CRCTs/EOCTs.
25. Use the modified 80/20 principle.
26. Examine lessons, units, and assessments of the
weakest domains.
27. Drill into subgroup performance.
28. Know your flag targets.
29. Understand the “stars.”
30. Use regression analysis when possible.

31. Develop leading indicators such as “passing
four core classes” in all grades.
32. View CRCT performance with new performance
levels.
33. Harvest formative data from CCRPI.
34. Use CCRPI data to determine the effectiveness
of professional learning.
35. Implement great school and district planning
practices.
36. Crosswalk the strategies in all plans,
including SIP, with CCRPI indicators.

37. Be upfront with teachers regarding the
upcoming evaluations.
38. Align the intended, taught, and tested
curricula.
39. Increase staff understanding of SGPs.
40. Create healthy competition between content
areas (with SGPs 35 and higher).
41. Avoid layering on extra work.

Dr. John D. Barge, State School Superintendent
“Making Education Work for All Georgians”
www.gadoe.org
Richard Woods, Georgia’s School Superintendent“Educating Georgia’s Future”
gadoe.org
Senate Bill 364 –Intended Consequences
Senate Bill 364 reduces the amount of testing tied to teacher
performance and reduces the weight of test results in teacher
evaluations.
Reduces to 24 the number of state tests that a student must
take. The legislation eliminates science and social studies
Georgia Milestones tests in third, fourth, sixth and seventh
grades. That’s down from 32 mandated tests but still above the
17 required under the federal ESSA
Student growth, or Progress Score is based on 90%
attendance not 65% enrollment

Dr. John D. Barge, State School Superintendent
“Making Education Work for All Georgians”
www.gadoe.org
Richard Woods, Georgia’s School Superintendent“Educating Georgia’s Future”
gadoe.org
Senate Bill 364 –Unintended Consequences If Science and Social Studies are not tested in grades 3, 4,
6, and 7:
Elementary schools Progress and Achievement CCRPI
Scores will be impacted due to the lack of scores from
previous year to provide benchmarks. These areas often
reflected the most significant growth from previous years.
Elementary school leaders may desire to focus on
Reading and math which will negatively impact science
and social studies achievement in the grades that do test
for ES/MS/HS. (return to AYP-like teaching)
.

Dr. John D. Barge, State School Superintendent
“Making Education Work for All Georgians”
www.gadoe.org
Richard Woods, Georgia’s School Superintendent“Educating Georgia’s Future”
gadoe.org
If Student Growth requires 90% attendance not
65% enrollment:
School leaders and teachers may choose to
focus only on students who meet the
attendance threshold, which is a much less
inclusive measurement.

Dr. John D. Barge, State School Superintendent
“Making Education Work for All Georgians”
www.gadoe.org
Richard Woods, Georgia’s School Superintendent“Educating Georgia’s Future”
gadoe.org
Senate Bill 364 – Thoughts Teachers may not feel or be held accountable for
untested content areas at their grade levels.
Just as Lexiles do not begin in grade 3, science and
social studies content does not spontaneously appear in
grades 5 and 8.
What if the pendulum swings back again. If we go back
to old ways, we will be right back were we were in 2014.
Schools, leaders, and teachers will have to keep the big
picture in mind when it comes to scheduling, staffing,
planning, and monitoring.

Dr. John D. Barge, State School Superintendent
“Making Education Work for All Georgians”
www.gadoe.org
Richard Woods, Georgia’s School Superintendent“Educating Georgia’s Future”
gadoe.org
Tools Provided:
• This PowerPoint
•Office of Accountability –
Progress/ Gap PowerPoint
•Bobby’s Tools

Dr. John D. Barge, State School Superintendent
“Making Education Work for All Georgians”
www.gadoe.org
Richard Woods, Georgia’s School Superintendent“Educating Georgia’s Future”
gadoe.org
CCRPI
Progress/ Gap/SLDSThey work hand in hand
Terri Gaspierik District Effectiveness Specialist [email protected]
Charles Price School Effectiveness Specialist [email protected]