rick weinzierl, university of illinois
TRANSCRIPT

Rick Weinzierl, University of Illinois
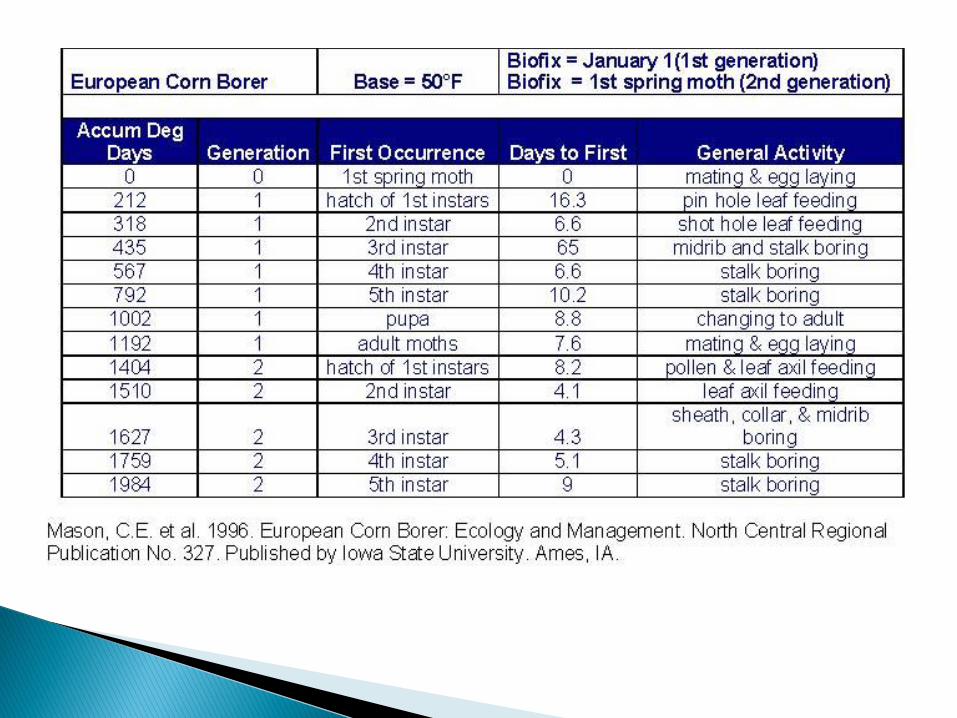
Know: Insect growth and development are temperature-dependent. The developmental threshold for a phenology model
represents the temperature below which insect development is negligible.
Insect development models calculate developmental units --"degree-days" -- that can be used to measure and predict insect development.
Know how to calculate the number of degree-days that accumulate in a day if given the maximum and minimum temperatures and a specific insect's developmental threshold.
A biofix is an observable event (often the capture of insects in a pheromone trap) that signals when to start counting degree days.
Phenology models are designed to predict or understand insect development to time sampling or control efforts as efficiently as possible.
Insect monitoring and insect management practices are necessary in crop production, horticulture, forestry, etc.
Monitoring and management are expensive◦ Costs of field scouting efforts◦ Costs of insecticide application
Timing monitoring and management activities accurately makes them efficient and effective
Seasonality in growth and activity of insects is related to poikilothermy ... cold-blooded animals' developmental rates are temperature-dependent.
If we want to predict the timing of insect occurrence, it makes sense to base predictions on “physiological time” -- developmental time indicated somehow by heat accumulations, not calendar days.
Modelling and predictions also depend on life cycles of specific insects◦ What stage overwinters?◦ What triggers immigration?
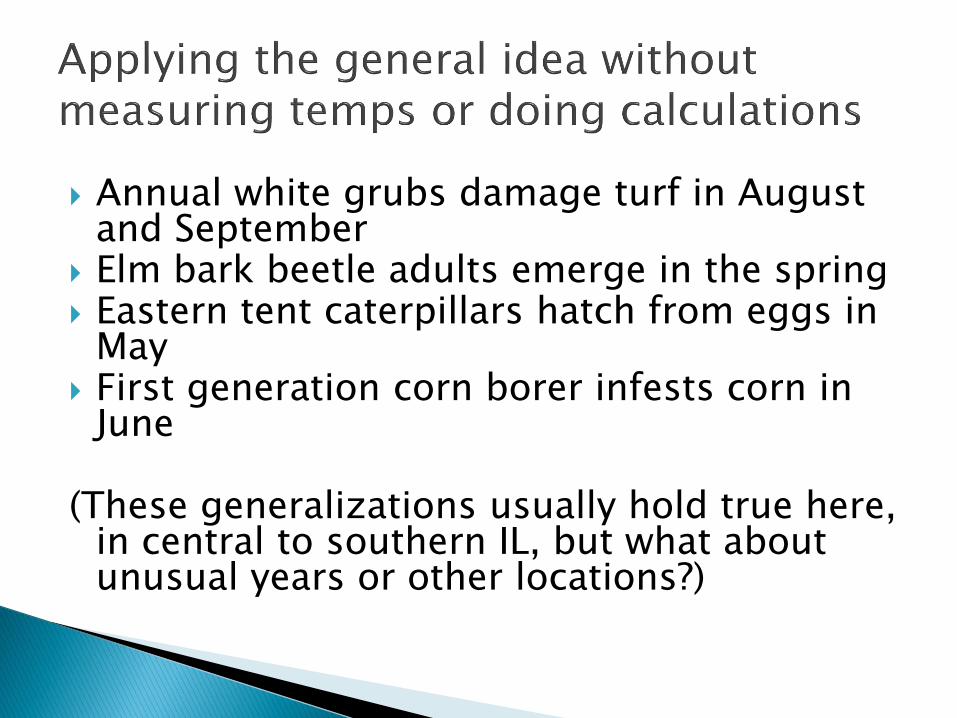
Annual white grubs damage turf in August and September
Elm bark beetle adults emerge in the spring Eastern tent caterpillars hatch from eggs in
May First generation corn borer infests corn in
June
(These generalizations usually hold true here, in central to southern IL, but what about unusual years or other locations?)
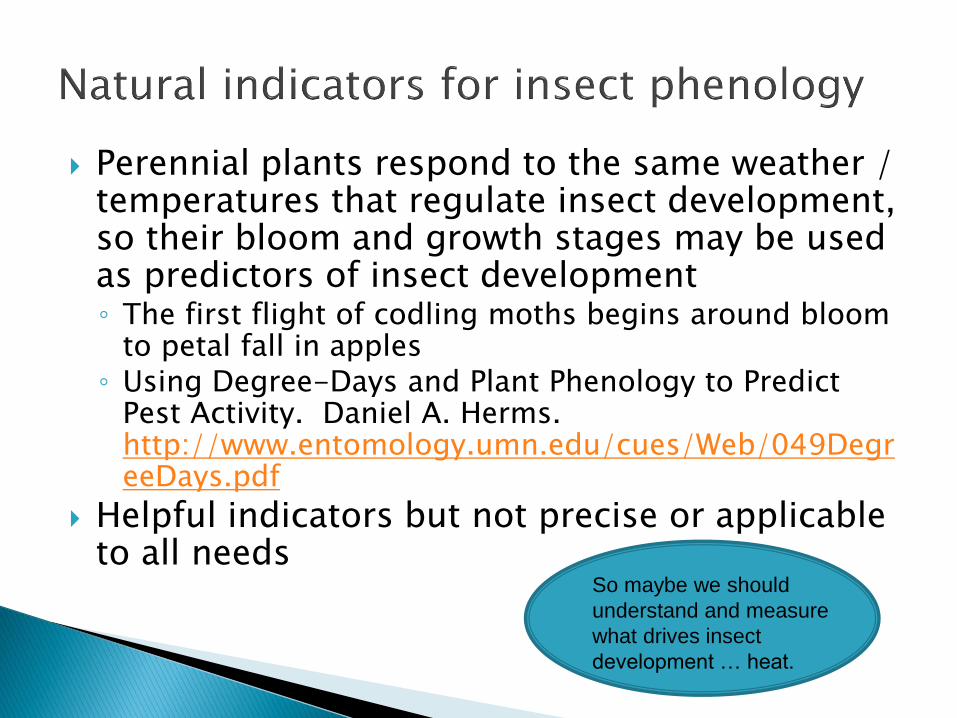
Perennial plants respond to the same weather / temperatures that regulate insect development, so their bloom and growth stages may be used as predictors of insect development◦ The first flight of codling moths begins around bloom
to petal fall in apples◦ Using Degree-Days and Plant Phenology to Predict
Pest Activity. Daniel A. Herms. http://www.entomology.umn.edu/cues/Web/049DegreeDays.pdf
Helpful indicators but not precise or applicable to all needs
So maybe we should
understand and measure
what drives insect
development … heat.
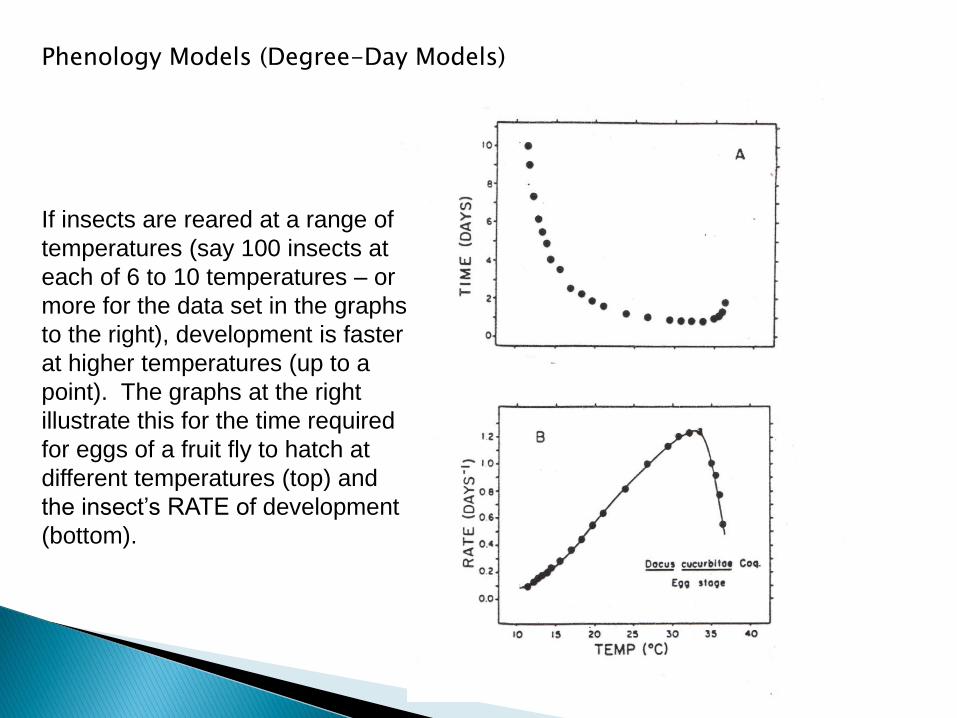
Phenology Models (Degree-Day Models)
If insects are reared at a range of
temperatures (say 100 insects at
each of 6 to 10 temperatures – or
more for the data set in the graphs
to the right), development is faster
at higher temperatures (up to a
point). The graphs at the right
illustrate this for the time required
for eggs of a fruit fly to hatch at
different temperatures (top) and
the insect’s RATE of development
(bottom).
Rearing Temperature
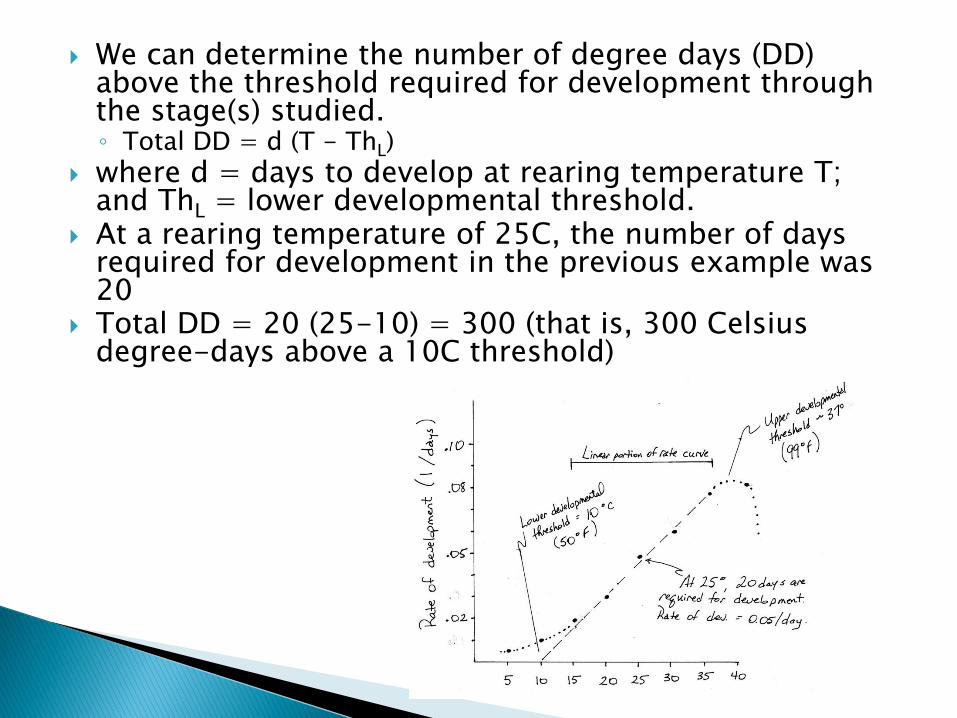
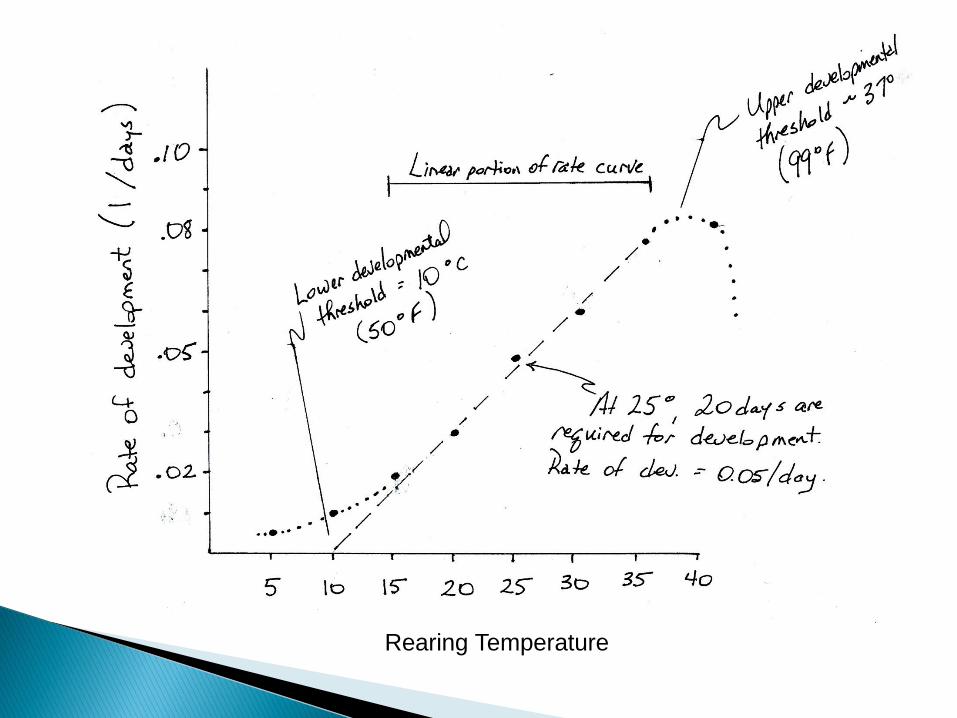
We can determine the number of degree days (DD) above the threshold required for development through the stage(s) studied. ◦ Total DD = d (T - ThL)
where d = days to develop at rearing temperature T; and ThL = lower developmental threshold.
At a rearing temperature of 25C, the number of days required for development in the previous example was 20
Total DD = 20 (25-10) = 300 (that is, 300 Celsius degree-days above a 10C threshold)
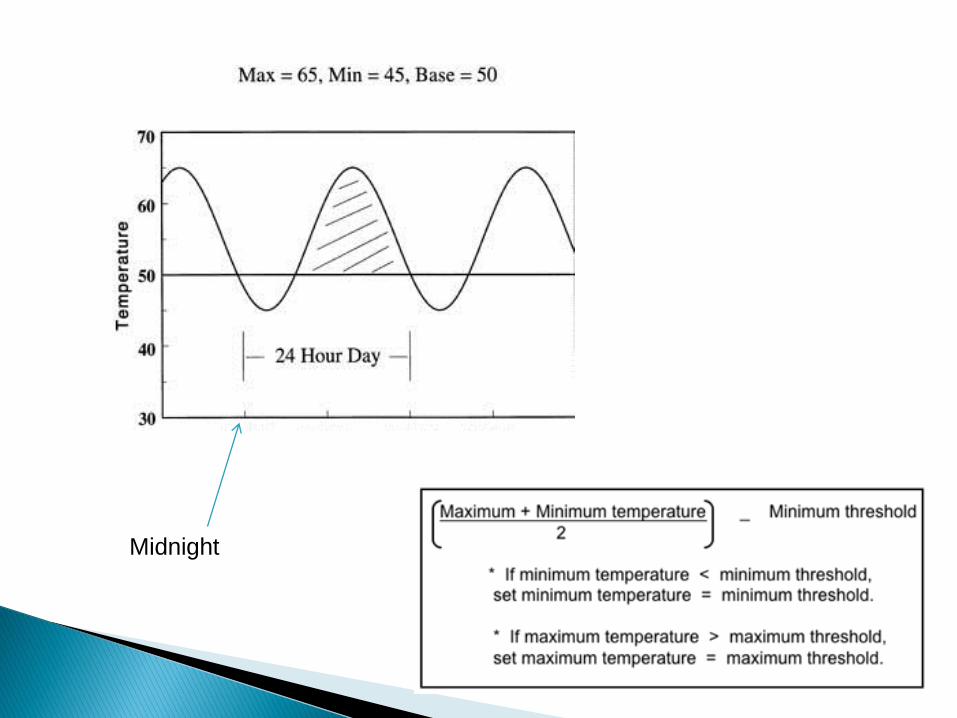
Midnight
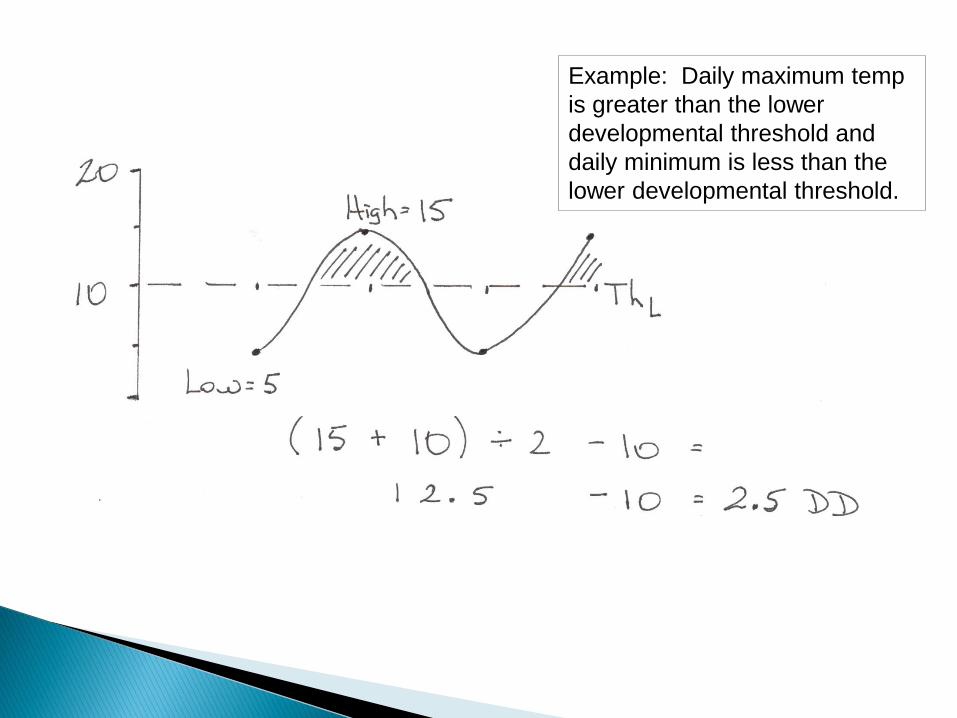
Example: Daily maximum temp
is greater than the lower
developmental threshold and
daily minimum is less than the
lower developmental threshold.

Example: Daily maximum and
minimum temps are greater than
the lower developmental
threshold.
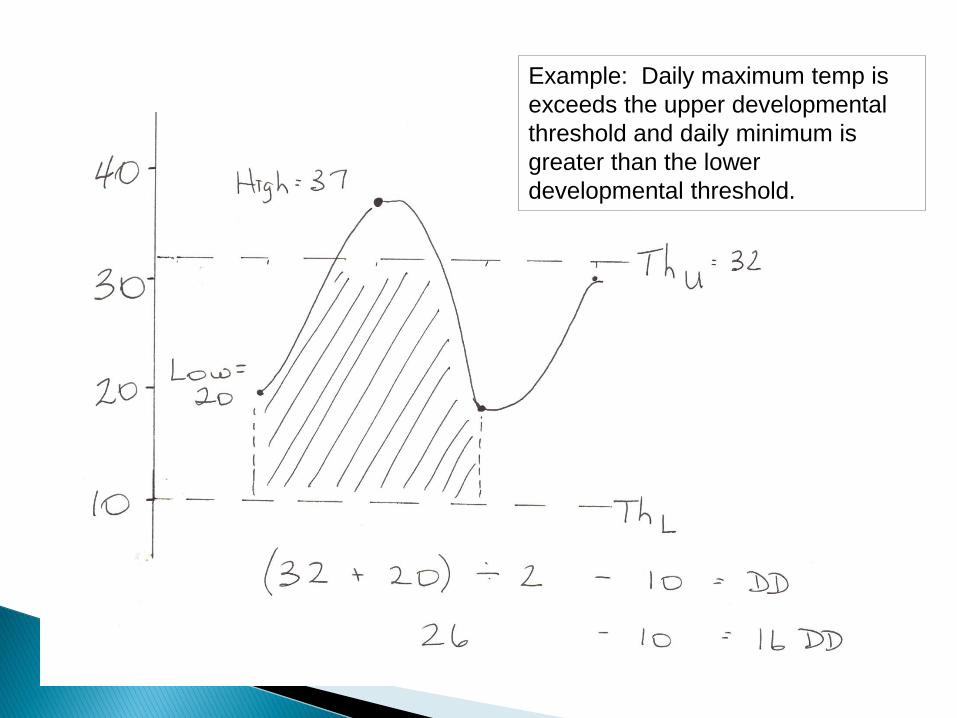
Example: Daily maximum temp is
exceeds the upper developmental
threshold and daily minimum is
greater than the lower
developmental threshold.
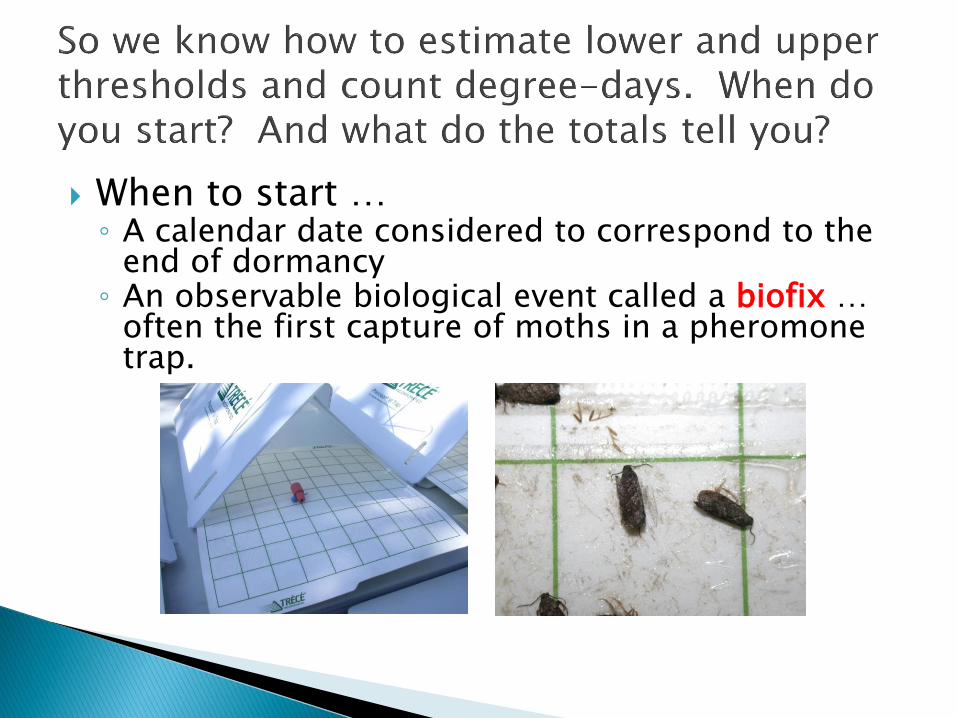
When to start …◦ A calendar date considered to correspond to the
end of dormancy◦ An observable biological event called a biofix …
often the first capture of moths in a pheromone trap.
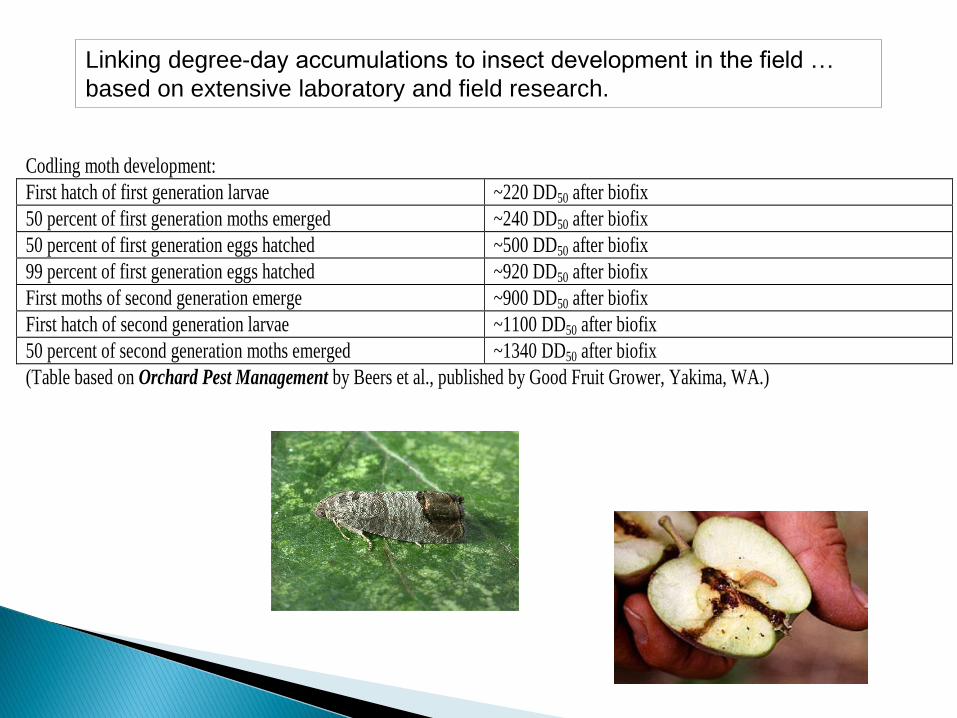
Codling moth development:
First hatch of first generation larvae ~220 DD50 after biofix
50 percent of first generation moths emerged ~240 DD50 after biofix
50 percent of first generation eggs hatched ~500 DD50 after biofix
99 percent of first generation eggs hatched ~920 DD50 after biofix
First moths of second generation emerge ~900 DD50 after biofix
First hatch of second generation larvae ~1100 DD50 after biofix
50 percent of second generation moths emerged ~1340 DD50 after biofix
(Table based on Orchard Pest Management by Beers et al., published by Good Fruit Grower, Yakima, WA.)
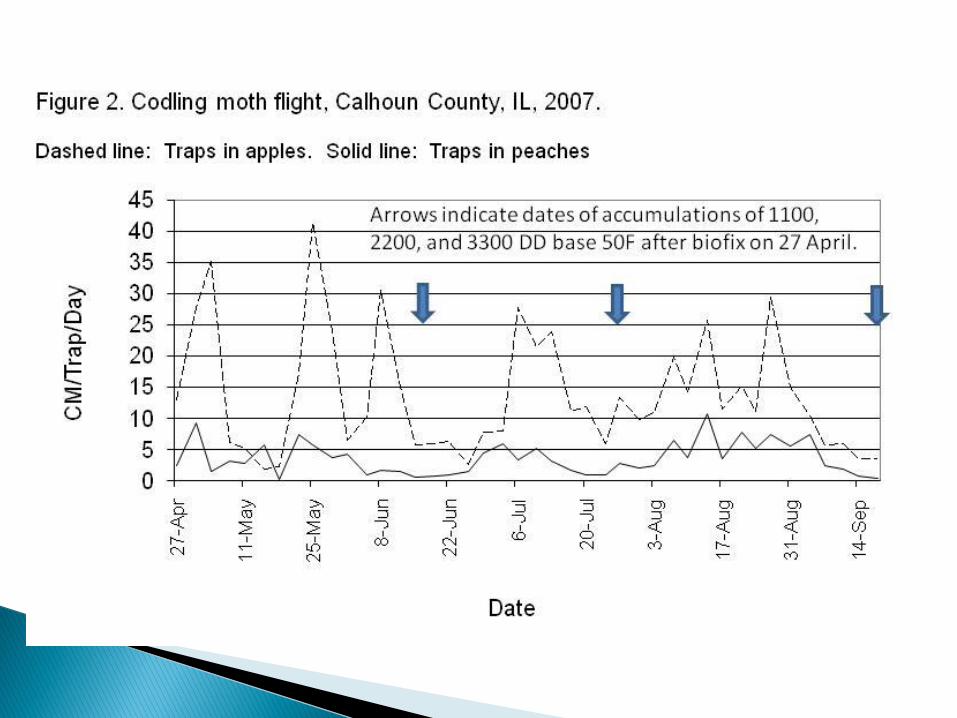
Linking degree-day accumulations to insect development in the field …
based on extensive laboratory and field research.
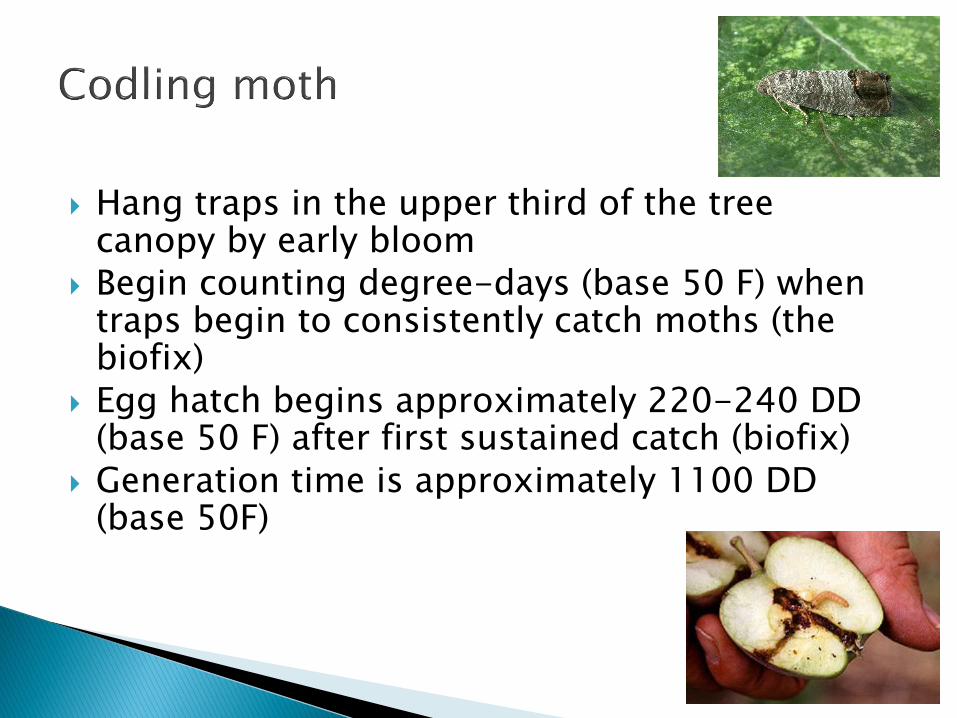
Hang traps in the upper third of the tree canopy by early bloom
Begin counting degree-days (base 50 F) when traps begin to consistently catch moths (the biofix)
Egg hatch begins approximately 220-240 DD (base 50 F) after first sustained catch (biofix)
Generation time is approximately 1100 DD (base 50F)
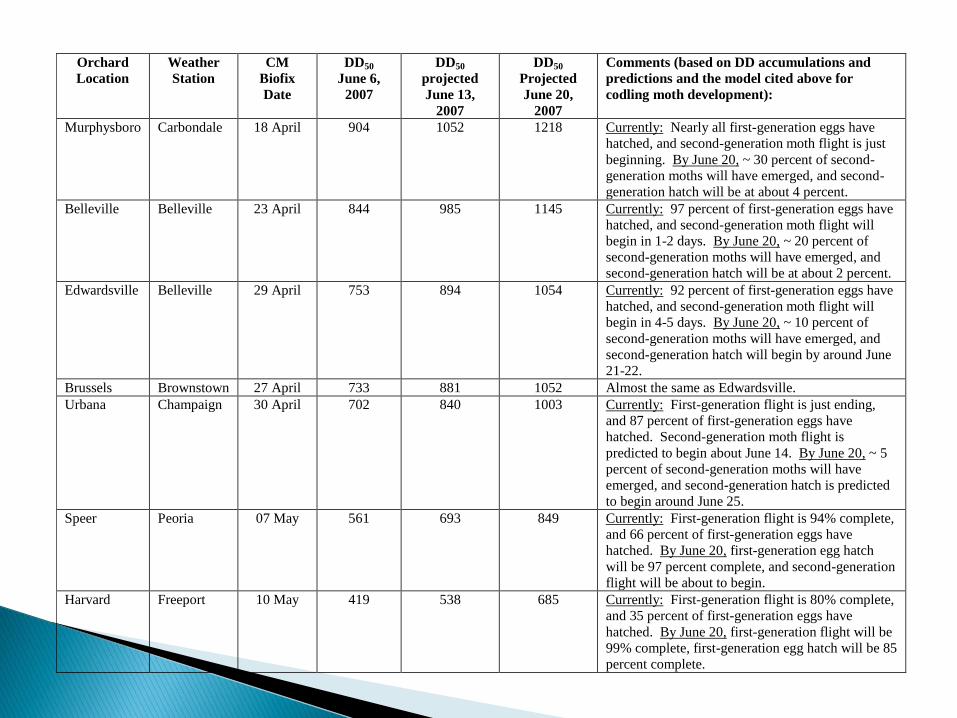
Orchard
Location
Weather
Station
CM
Biofix
Date
DD50
June 6,
2007
DD50
projected
June 13,
2007
DD50
Projected
June 20,
2007
Comments (based on DD accumulations and
predictions and the model cited above for
codling moth development):
Murphysboro Carbondale 18 April 904 1052 1218 Currently: Nearly all first-generation eggs have
hatched, and second-generation moth flight is just
beginning. By June 20, ~ 30 percent of second-
generation moths will have emerged, and second-
generation hatch will be at about 4 percent.
Belleville Belleville 23 April 844 985 1145 Currently: 97 percent of first-generation eggs have
hatched, and second-generation moth flight will
begin in 1-2 days. By June 20, ~ 20 percent of
second-generation moths will have emerged, and
second-generation hatch will be at about 2 percent.
Edwardsville Belleville 29 April 753 894 1054 Currently: 92 percent of first-generation eggs have
hatched, and second-generation moth flight will
begin in 4-5 days. By June 20, ~ 10 percent of
second-generation moths will have emerged, and
second-generation hatch will begin by around June
21-22.
Brussels Brownstown 27 April 733 881 1052 Almost the same as Edwardsville.
Urbana Champaign 30 April 702 840 1003 Currently: First-generation flight is just ending,
and 87 percent of first-generation eggs have
hatched. Second-generation moth flight is
predicted to begin about June 14. By June 20, ~ 5
percent of second-generation moths will have
emerged, and second-generation hatch is predicted
to begin around June 25.
Speer Peoria 07 May 561 693 849 Currently: First-generation flight is 94% complete,
and 66 percent of first-generation eggs have
hatched. By June 20, first-generation egg hatch
will be 97 percent complete, and second-generation
flight will be about to begin.
Harvard Freeport 10 May 419 538 685 Currently: First-generation flight is 80% complete,
and 35 percent of first-generation eggs have
hatched. By June 20, first-generation flight will be
99% complete, first-generation egg hatch will be 85
percent complete.
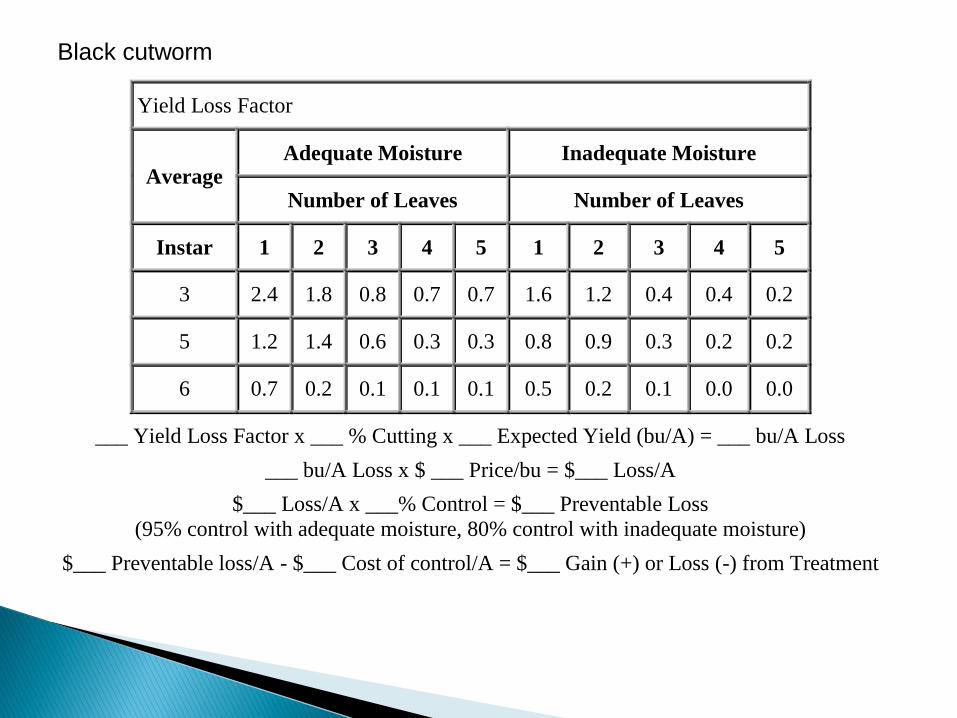
Yield Loss Factor
Average Adequate Moisture Inadequate Moisture
Number of Leaves Number of Leaves
Instar 1 2 3 4 5 1 2 3 4 5
3 2.4 1.8 0.8 0.7 0.7 1.6 1.2 0.4 0.4 0.2
5 1.2 1.4 0.6 0.3 0.3 0.8 0.9 0.3 0.2 0.2
6 0.7 0.2 0.1 0.1 0.1 0.5 0.2 0.1 0.0 0.0
___ Yield Loss Factor x ___ % Cutting x ___ Expected Yield (bu/A) = ___ bu/A Loss
___ bu/A Loss x $ ___ Price/bu = $___ Loss/A
$___ Loss/A x ___% Control = $___ Preventable Loss
(95% control with adequate moisture, 80% control with inadequate moisture)
$___ Preventable loss/A - $___ Cost of control/A = $___ Gain (+) or Loss (-) from Treatment
Black cutworm
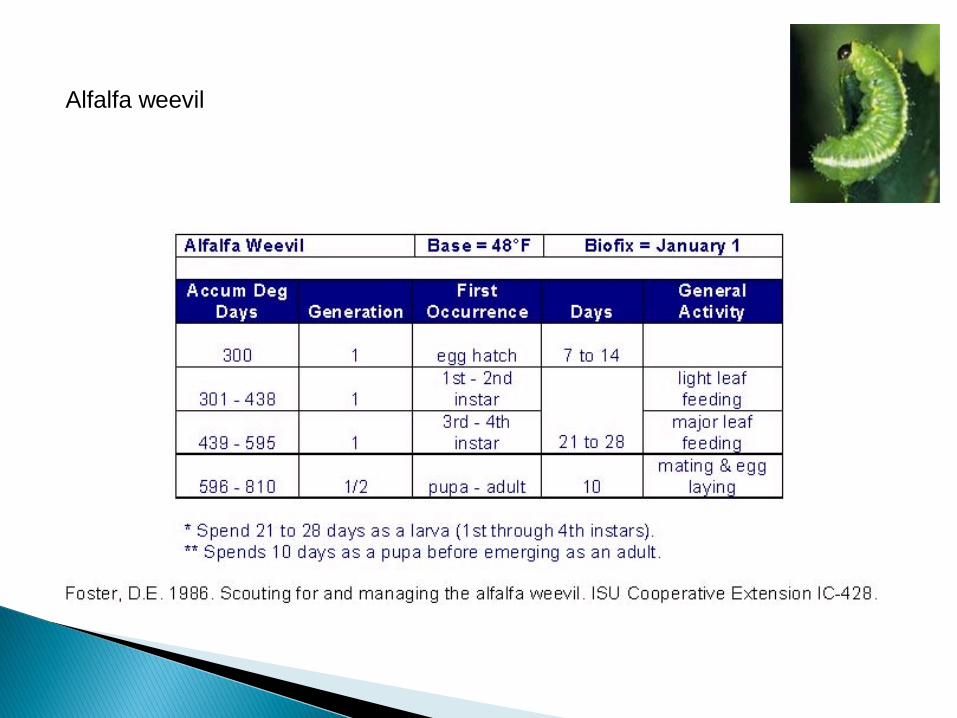
Alfalfa weevil
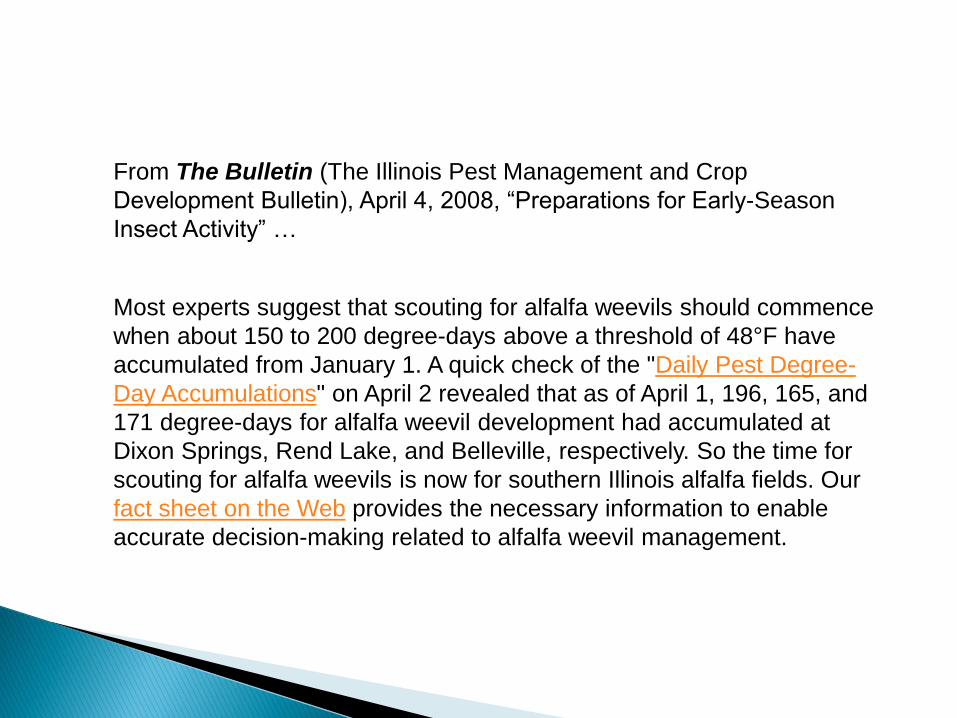
Most experts suggest that scouting for alfalfa weevils should commence
when about 150 to 200 degree-days above a threshold of 48°F have
accumulated from January 1. A quick check of the "Daily Pest Degree-
Day Accumulations" on April 2 revealed that as of April 1, 196, 165, and
171 degree-days for alfalfa weevil development had accumulated at
Dixon Springs, Rend Lake, and Belleville, respectively. So the time for
scouting for alfalfa weevils is now for southern Illinois alfalfa fields. Our
fact sheet on the Web provides the necessary information to enable
accurate decision-making related to alfalfa weevil management.
From The Bulletin (The Illinois Pest Management and Crop
Development Bulletin), April 4, 2008, “Preparations for Early-Season
Insect Activity” …
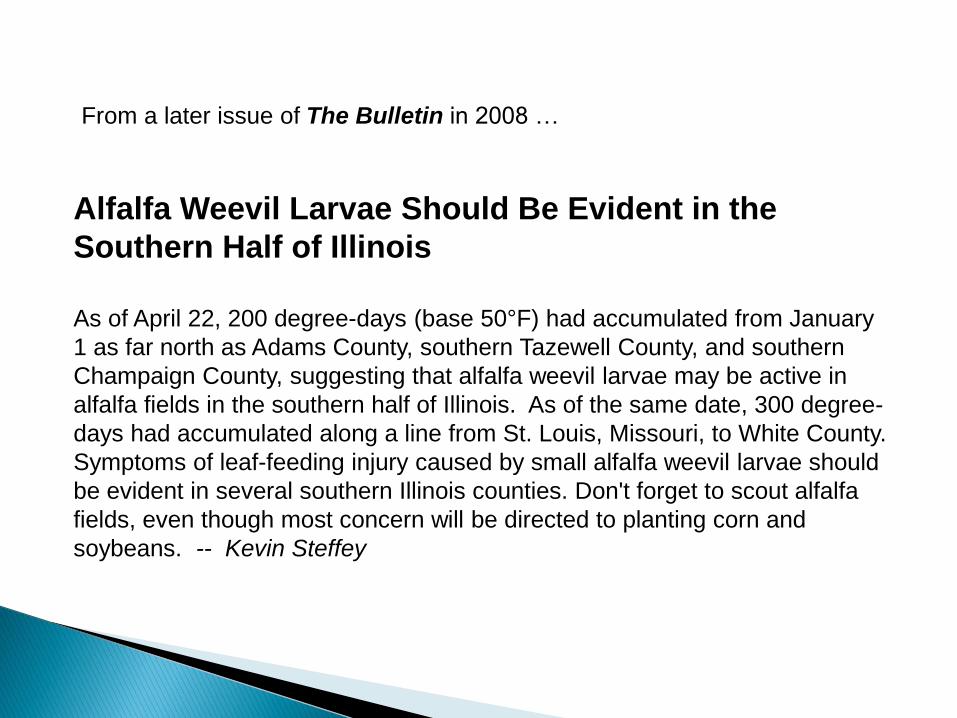
Alfalfa Weevil Larvae Should Be Evident in the
Southern Half of Illinois
As of April 22, 200 degree-days (base 50°F) had accumulated from January
1 as far north as Adams County, southern Tazewell County, and southern
Champaign County, suggesting that alfalfa weevil larvae may be active in
alfalfa fields in the southern half of Illinois. As of the same date, 300 degree-
days had accumulated along a line from St. Louis, Missouri, to White County.
Symptoms of leaf-feeding injury caused by small alfalfa weevil larvae should
be evident in several southern Illinois counties. Don't forget to scout alfalfa
fields, even though most concern will be directed to planting corn and
soybeans. -- Kevin Steffey
From a later issue of The Bulletin in 2008 …
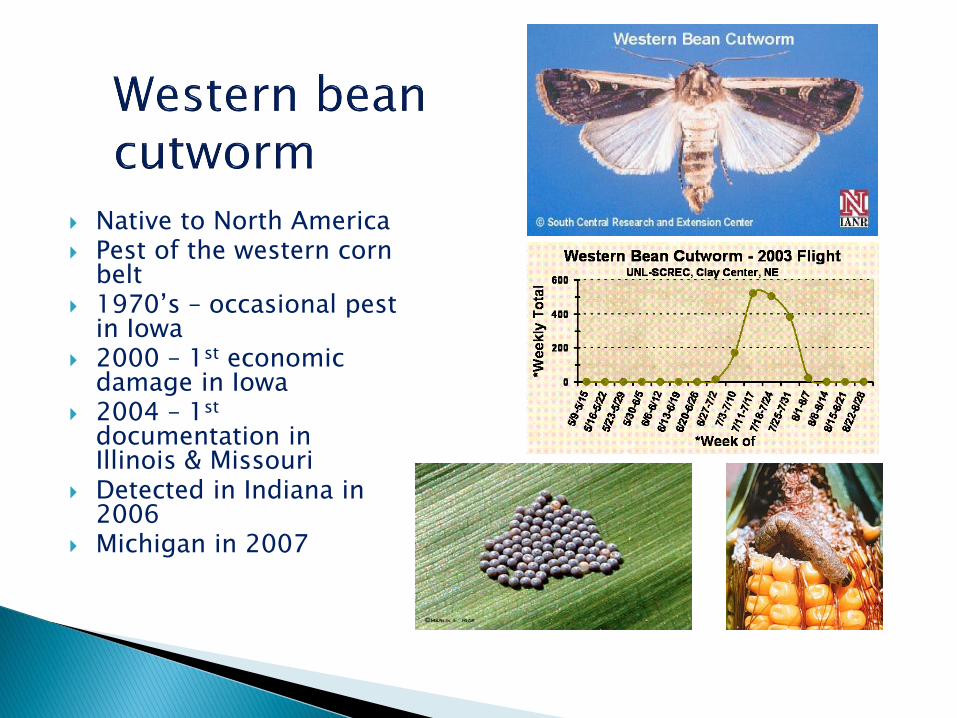
Native to North America Pest of the western corn
belt 1970’s – occasional pest
in Iowa 2000 – 1st economic
damage in Iowa 2004 – 1st
documentation in Illinois & Missouri
Detected in Indiana in 2006
Michigan in 2007
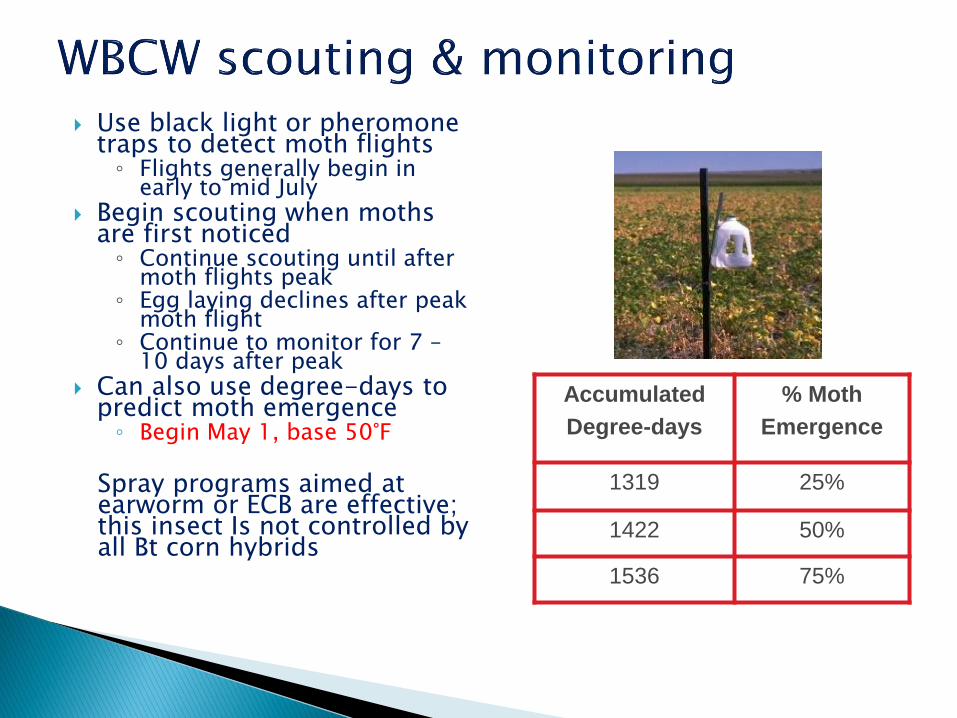
Use black light or pheromone traps to detect moth flights◦ Flights generally begin in
early to mid July Begin scouting when moths
are first noticed◦ Continue scouting until after
moth flights peak◦ Egg laying declines after peak
moth flight◦ Continue to monitor for 7 –
10 days after peak Can also use degree-days to
predict moth emergence◦ Begin May 1, base 50°F
Spray programs aimed at earworm or ECB are effective; this insect Is not controlled by all Bt corn hybrids
Accumulated
Degree-days
% Moth
Emergence
1319 25%
1422 50%
1536 75%
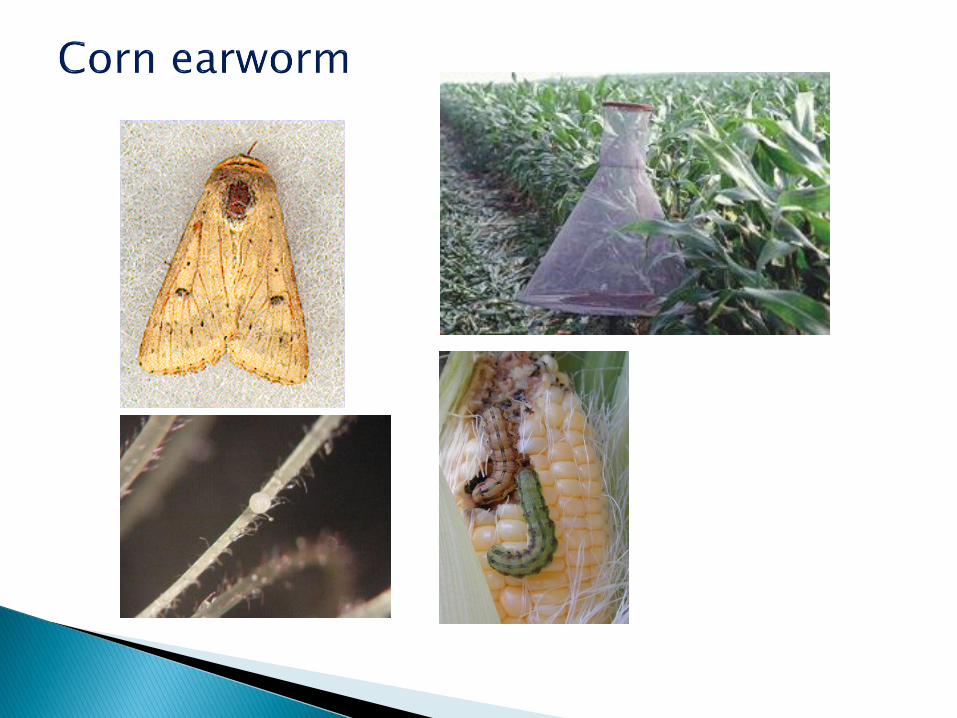
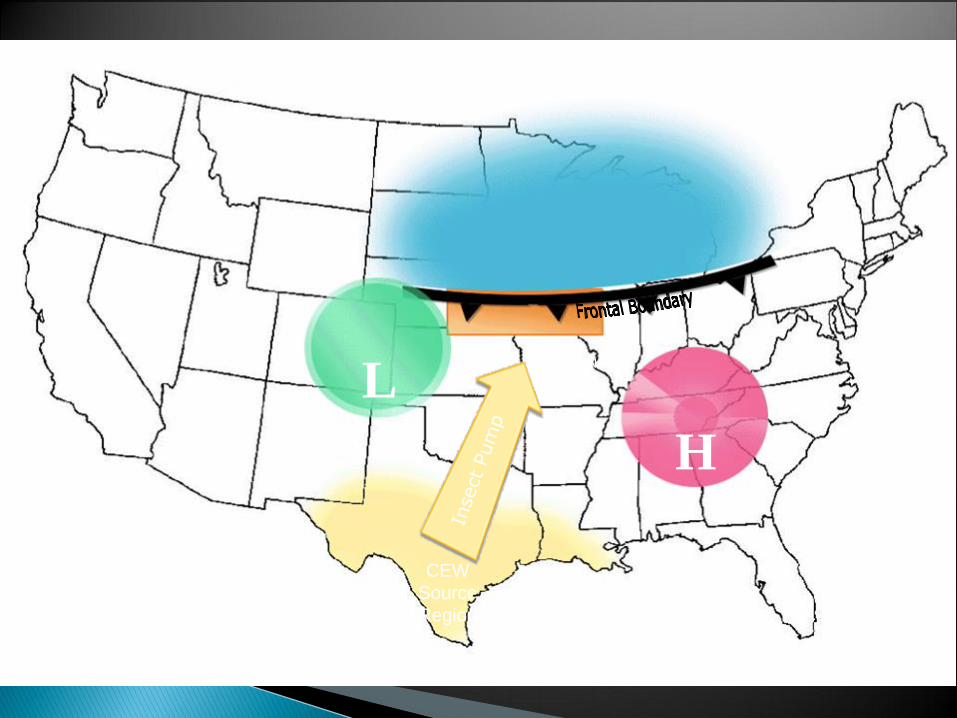
CEW
Source
Region
L
H
DROP ZONE
0
100
200
300
400
500
6002
3-M
ay
30
-Ma
y
6-J
un
13-J
un
20-J
un
27-J
un
4-J
ul
11-J
ul
18-J
ul
25-J
ul
1-A
ug
8-A
ug
15-A
ug
22-A
ug
29-A
ug
5-S
ep
12-S
ep
19-S
ep
26-S
ep
3-O
ct
Mo
ths
/ P
he
rom
on
e T
rap
/ N
igh
t
Date
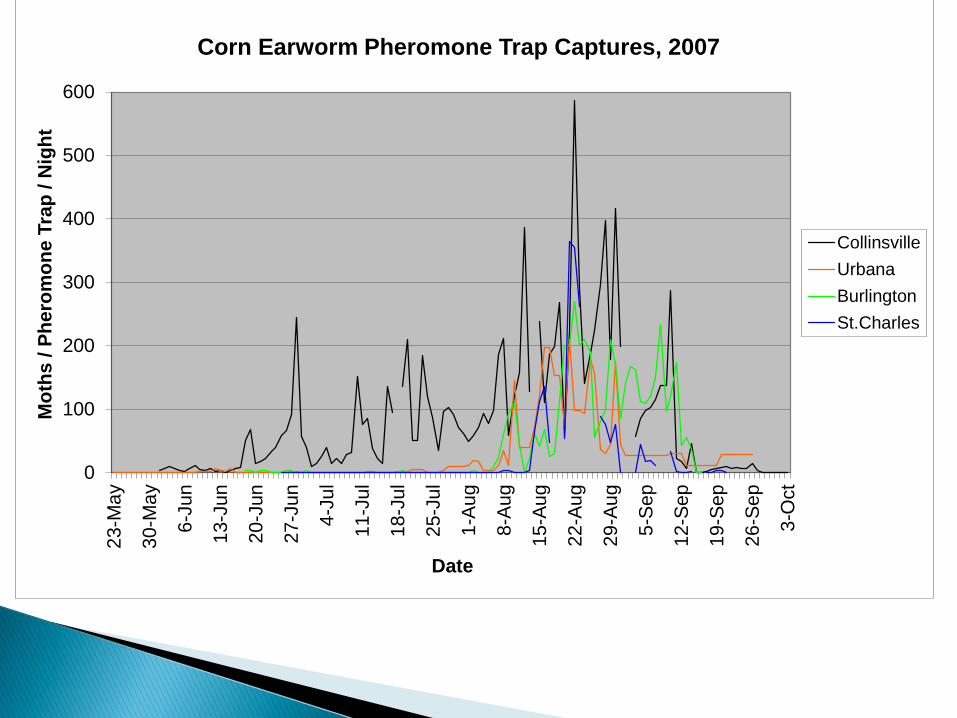
Corn Earworm Pheromone Trap Captures, 2007
Collinsville
Urbana
Burlington
St.Charles
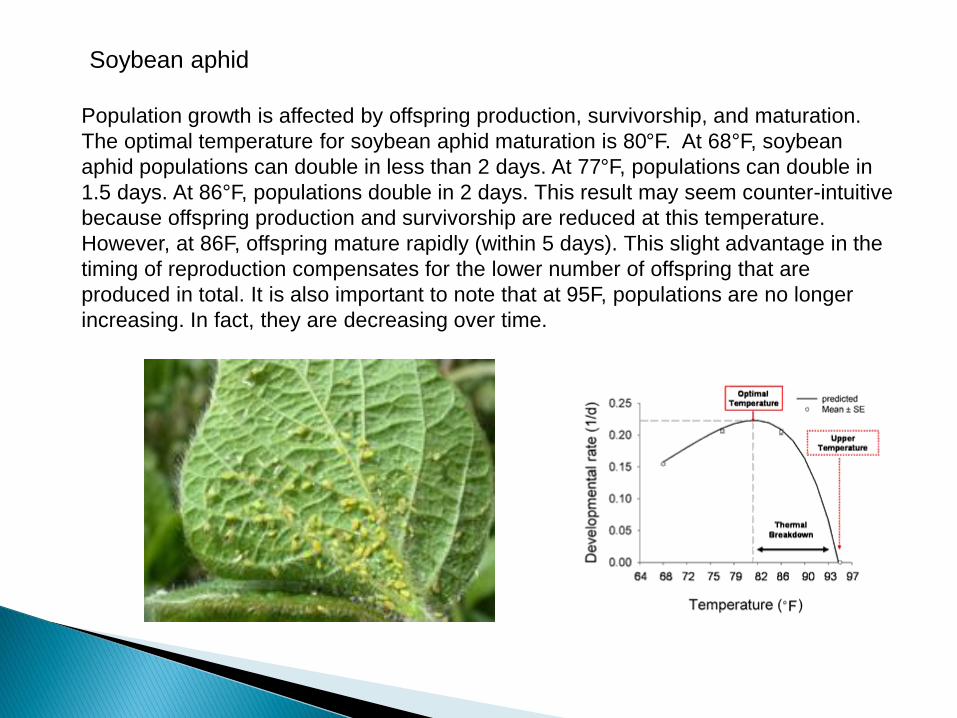
Population growth is affected by offspring production, survivorship, and maturation.
The optimal temperature for soybean aphid maturation is 80°F. At 68°F, soybean
aphid populations can double in less than 2 days. At 77°F, populations can double in
1.5 days. At 86°F, populations double in 2 days. This result may seem counter-intuitive
because offspring production and survivorship are reduced at this temperature.
However, at 86F, offspring mature rapidly (within 5 days). This slight advantage in the
timing of reproduction compensates for the lower number of offspring that are
produced in total. It is also important to note that at 95F, populations are no longer
increasing. In fact, they are decreasing over time.
Soybean aphid
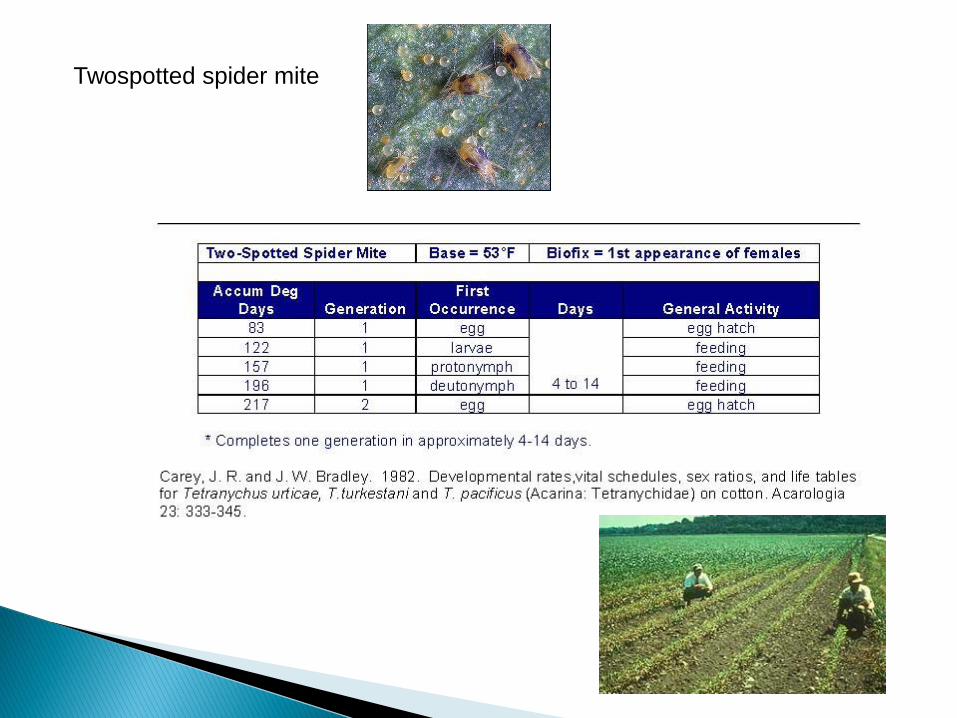
Twospotted spider mite
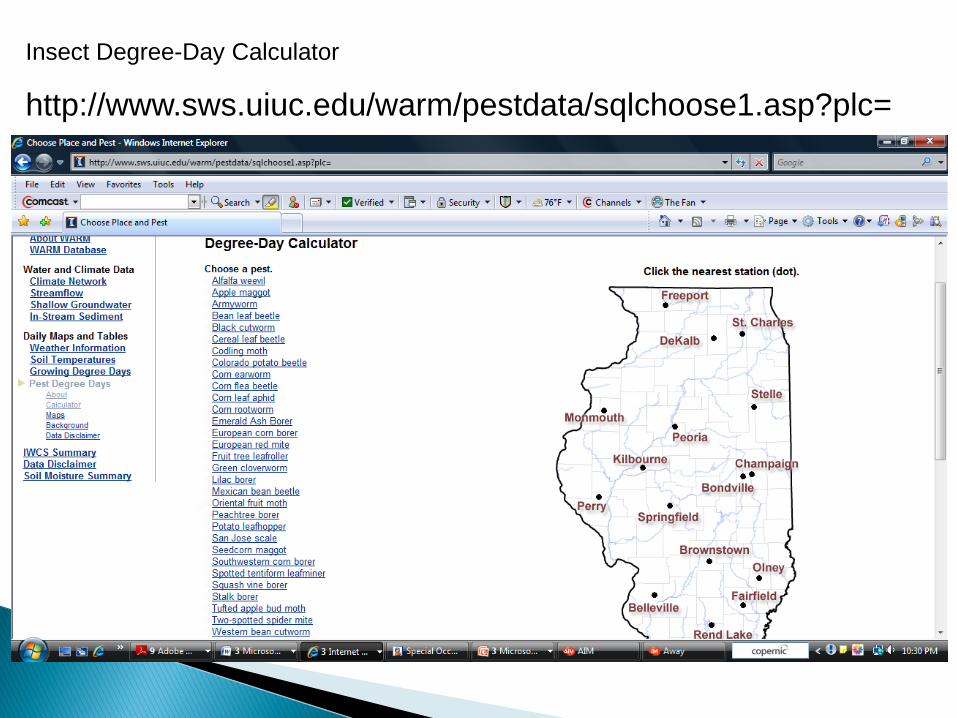
http://www.sws.uiuc.edu/warm/pestdata/sqlchoose1.asp?plc=
Insect Degree-Day Calculator
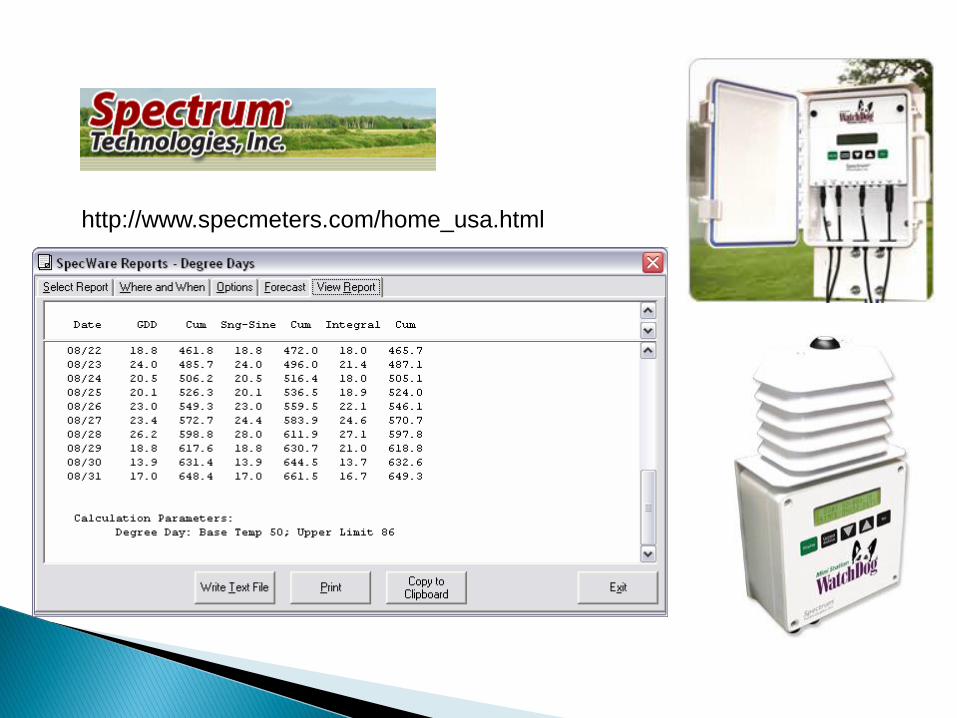
http://www.specmeters.com/home_usa.html

Specialty suppliers:◦ Great Lakes IPM (lures, traps, mating disruption
products), 989-268-5693; http://www.greatlakesipm.com/
◦ Spectrum Technologies (environmental monitoring equipment and phenology programs); 12360 South Industrial Dr. East - Plainfield, Illinois 60585(800) 248-8873 / (815) 436-4440 Fax: (815) 436-4460; http://www.specmeters.com/home_usa.html
References: ◦ Consult the University of California's web site titled
Degree-Days and Phenology Models(http://www.ipm.ucdavis.edu/WEATHER/ddconcepts.html)
◦ Consult the University of Illinois web site titled Degree-Day Calculator(http://www.sws.uiuc.edu/warm/pestdata/sqlchoose1.asp?plc=)