rickmers holding gmbh & cie. kg
TRANSCRIPT
Rickmers Holding GmbH & Cie. KG
Company Presentation
November 13th, 2013
2
Disclaimer
This document and its contents are confidential and not meant for forwarding, transmission, publication, duplication, or disclosure (in wholly or partly) to other persons. Outside of
Germany the distribution of this document may be restricted by applicable laws.
This document does not constitute an offer to sell or an invitation to make an offer to buy or subscribe for securities of Rickmers Holding GmbH & Cie. KG.
This document includes 'forward-looking statements'. Forward-looking statements are all statements, which do not describe facts of the past, but containing the words "believe",
"estimate", "expect", "anticipate", "assume", "plan", "intend", "could", and words of similar meaning. These forward-looking statements are subject to inherent risks and
uncertainties since they relate to future events and are based on current assumptions and estimates of Rickmers Holding GmbH & Cie. KG, which might not occur at all or occur
not as assumed. They therefore do not constitute a guarantee for the occurrence of future results or performances of Rickmers Holding GmbH & Cie. KG. The actual financial
position and the actual results of Rickmers Holding GmbH & Cie. KG, as well as the overall economic development and the regulatory environment may differ materially from the
expectations, which are assumed explicitly or implicitly in the forward-looking statements and do not comply to them. Therefore, investors are warned to base their investment
decisions with respect to Rickmers Holding GmbH & Cie. KG on the forward-looking statements mentioned in this document.
3
Table of Contents
A. Executive Summary
B. Company profile
I. Tradition
II. Management
III. Business Model
IV. Market and Competition
V. Strategy
VI. Bond and Use of Proceeds
VII. Half-Year Financials
C. Appendix
Executive Summary
4
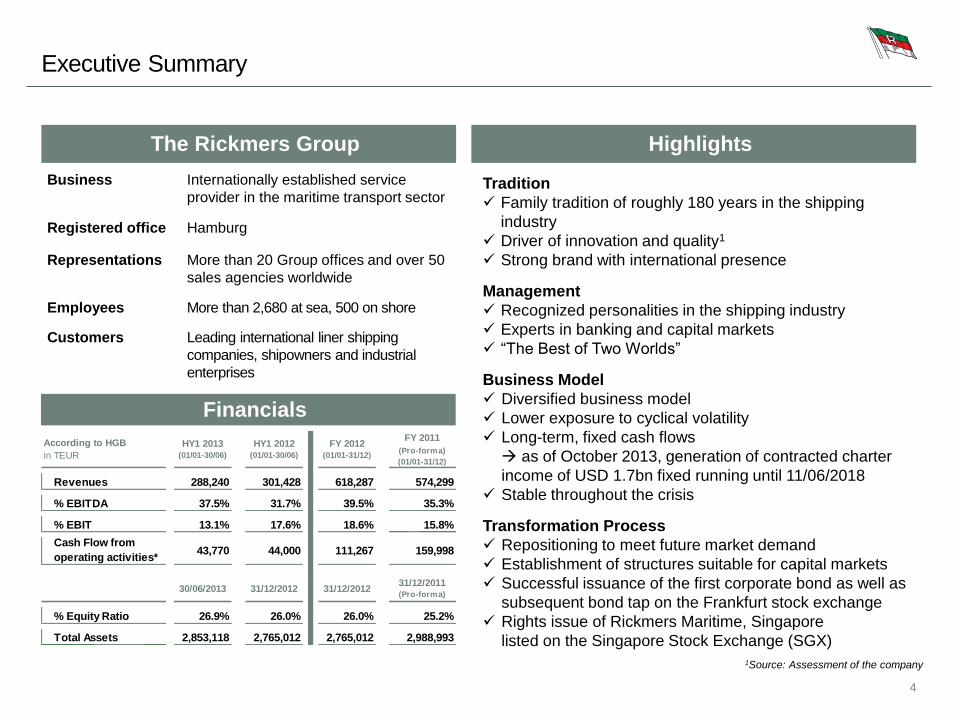
The Rickmers Group
Business Internationally established service
provider in the maritime transport sector
Registered office Hamburg
Representations More than 20 Group offices and over 50
sales agencies worldwide
Employees More than 2,680 at sea, 500 on shore
Customers Leading international liner shipping
companies, shipowners and industrial
enterprises
Highlights
Financials
Tradition
Family tradition of roughly 180 years in the shipping
industry
Driver of innovation and quality1
Strong brand with international presence
Management
Recognized personalities in the shipping industry
Experts in banking and capital markets
“The Best of Two Worlds”
Business Model
Diversified business model
Lower exposure to cyclical volatility
Long-term, fixed cash flows
as of October 2013, generation of contracted charter
income of USD 1.7bn fixed running until 11/06/2018
Stable throughout the crisis
Transformation Process
Repositioning to meet future market demand
Establishment of structures suitable for capital markets
Successful issuance of the first corporate bond as well as
subsequent bond tap on the Frankfurt stock exchange
Rights issue of Rickmers Maritime, Singapore
listed on the Singapore Stock Exchange (SGX)
1Source: Assessment of the company
Cash Flow from
operating activities*
Total Assets 2,853,118 2,765,012 2,765,012 2,988,993
% Equity Ratio 26.9% 26.0% 26.0% 25.2%
15.8%
43,770 44,000 111,267 159,998
% EBIT 13.1% 17.6% 18.6%
Revenues 288,240 301,428 618,287
31/12/2011(Pro-forma)
According to HGB
in TEUR
HY1 2013(01/01-30/06)
HY1 2012(01/01-30/06)
FY 2012(01/01-31/12)
FY 2011
(Pro-forma)
(01/01-31/12)
574,299
% EBITDA 37.5% 31.7% 39.5% 35.3%
30/06/2013 31/12/2012 31/12/2012
5
Table of Contents
A. Executive Summary
B. Company profile
I. Tradition
II. Management
III. Business Model
IV. Market and Competition
V. Strategy
VI. Bond and Use of Proceeds
VII. Half-Year Financials
C. Appendix
6
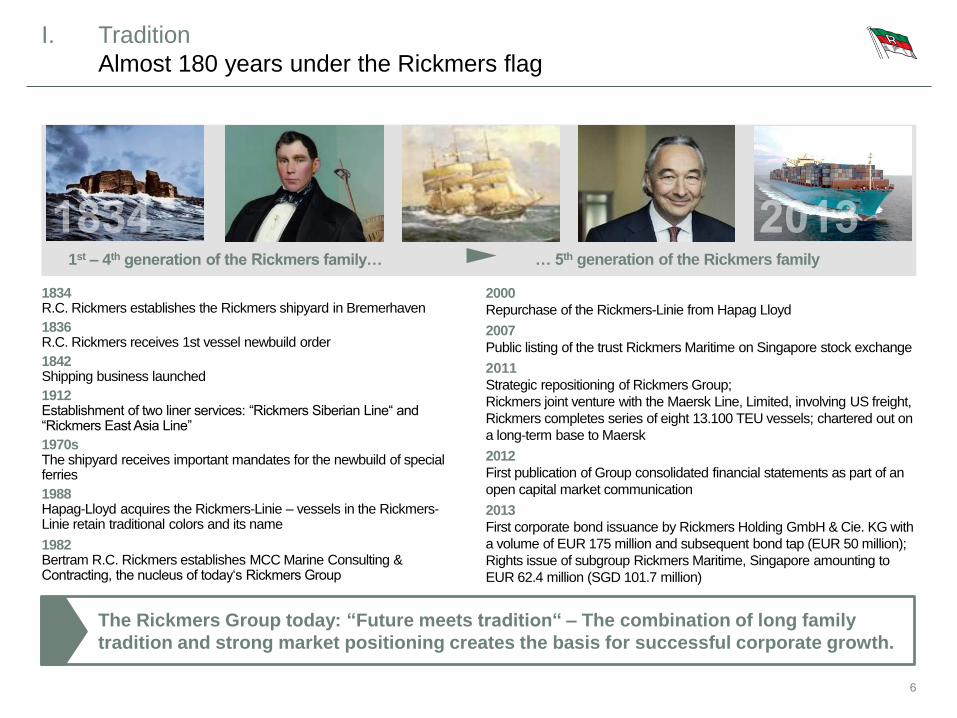
I. Tradition
Almost 180 years under the Rickmers flag
The Rickmers Group today: “Future meets tradition“ – The combination of long family
tradition and strong market positioning creates the basis for successful corporate growth.
1834 R.C. Rickmers establishes the Rickmers shipyard in Bremerhaven
1836 R.C. Rickmers receives 1st vessel newbuild order
1842 Shipping business launched
1912 Establishment of two liner services: “Rickmers Siberian Line“ and “Rickmers East Asia Line”
1970s The shipyard receives important mandates for the newbuild of special ferries
1988 Hapag-Lloyd acquires the Rickmers-Linie – vessels in the Rickmers-Linie retain traditional colors and its name
1982 Bertram R.C. Rickmers establishes MCC Marine Consulting & Contracting, the nucleus of today‘s Rickmers Group
2000
Repurchase of the Rickmers-Linie from Hapag Lloyd
2007
Public listing of the trust Rickmers Maritime on Singapore stock exchange
2011
Strategic repositioning of Rickmers Group;
Rickmers joint venture with the Maersk Line, Limited, involving US freight,
Rickmers completes series of eight 13.100 TEU vessels; chartered out on
a long-term base to Maersk
2012
First publication of Group consolidated financial statements as part of an
open capital market communication
2013
First corporate bond issuance by Rickmers Holding GmbH & Cie. KG with
a volume of EUR 175 million and subsequent bond tap (EUR 50 million);
Rights issue of subgroup Rickmers Maritime, Singapore amounting to
EUR 62.4 million (SGD 101.7 million)
… 5th generation of the Rickmers family 1st – 4th generation of the Rickmers family…
7
Table of Contents
A. Executive Summary
B. Company profile
I. Tradition
II. Management
III. Business Model
IV. Market and Competition
V. Strategy
VI. Bond and Use of Proceeds
VII. Half-Year Financials
C. Appendix
8
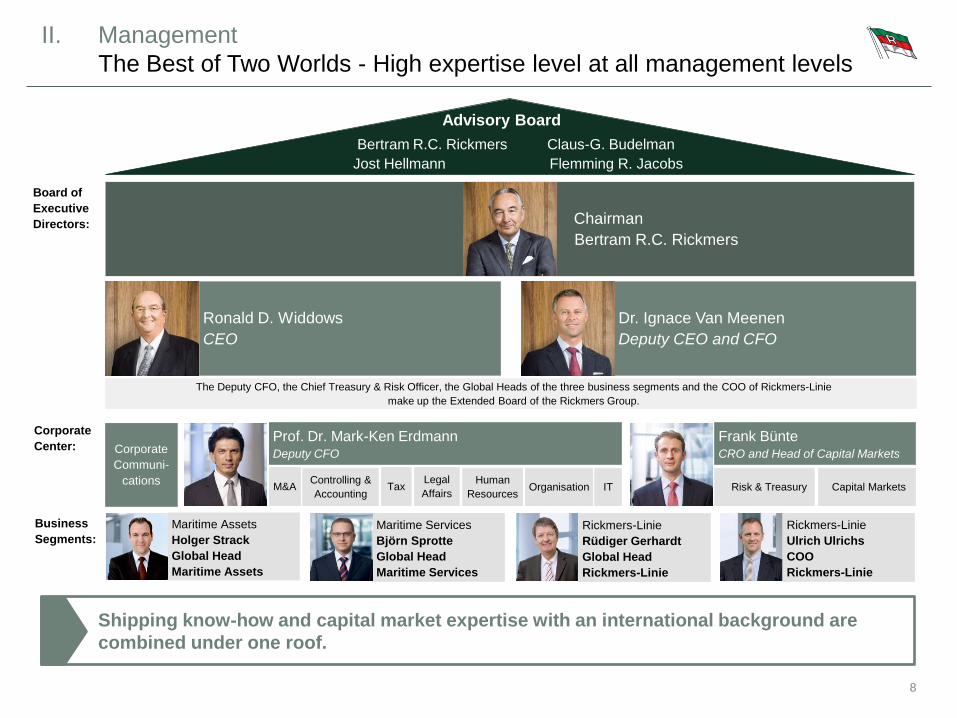
II. Management
The Best of Two Worlds - High expertise level at all management levels
Shipping know-how and capital market expertise with an international background are
combined under one roof.
Chairman
Bertram R.C. Rickmers
Board of
Executive
Directors:
Ronald D. Widdows
CEO
Dr. Ignace Van Meenen
Deputy CEO and CFO
The Deputy CFO, the Chief Treasury & Risk Officer, the Global Heads of the three business segments and the COO of Rickmers-Linie
make up the Extended Board of the Rickmers Group.
Corporate
Center: Corporate
Communi-
cations
Prof. Dr. Mark-Ken Erdmann
Deputy CFO
Frank Bünte CRO and Head of Capital Markets
Controlling &
Accounting Tax M&A IT
Human
Resources
Legal
Affairs Risk & Treasury Capital Markets
Business
Segments:
Maritime Assets
Holger Strack
Global Head
Maritime Assets
Maritime Services
Björn Sprotte
Global Head
Maritime Services
Rickmers-Linie
Rüdiger Gerhardt
Global Head
Rickmers-Linie
Organisation
Advisory Board
Bertram R.C. Rickmers Claus-G. Budelman
Jost Hellmann Flemming R. Jacobs
Rickmers-Linie
Ulrich Ulrichs
COO
Rickmers-Linie
9
Table of Contents
A. Executive Summary
B. Company profile
I. Tradition
II. Management
III. Business Model
IV. Market and Competition
V. Strategy
VI. Bond and Use of Proceeds
VII. Half-Year Financials
C. Appendix
10
III. Business Model
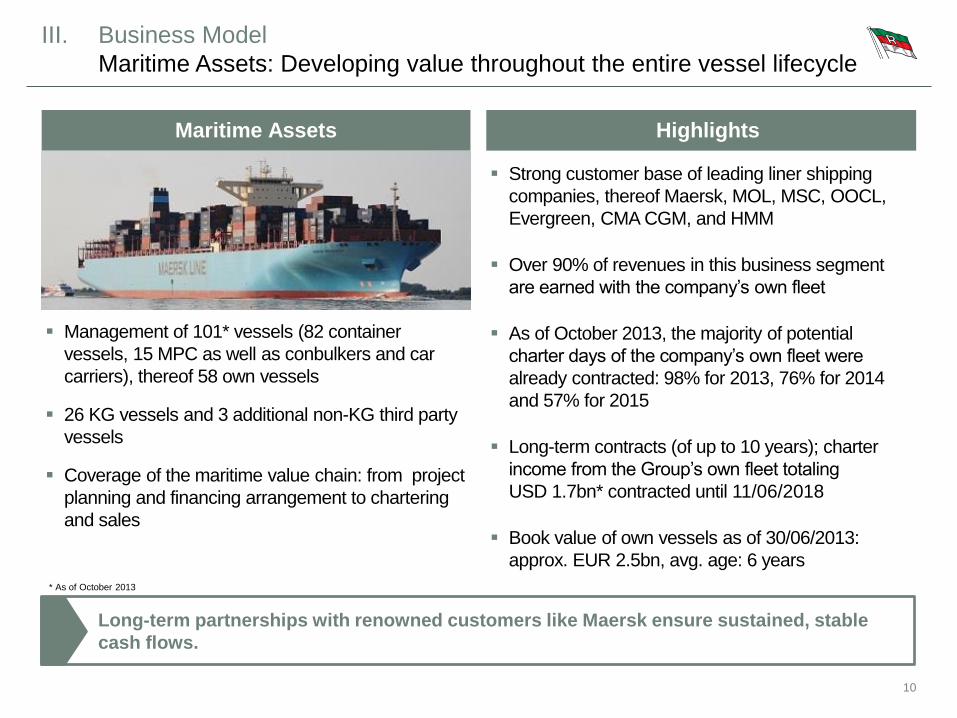
Maritime Assets: Developing value throughout the entire vessel lifecycle
Long-term partnerships with renowned customers like Maersk ensure sustained, stable
cash flows.
Strong customer base of leading liner shipping
companies, thereof Maersk, MOL, MSC, OOCL,
Evergreen, CMA CGM, and HMM
Over 90% of revenues in this business segment
are earned with the company’s own fleet
As of October 2013, the majority of potential
charter days of the company’s own fleet were
already contracted: 98% for 2013, 76% for 2014
and 57% for 2015
Long-term contracts (of up to 10 years); charter
income from the Group’s own fleet totaling
USD 1.7bn* contracted until 11/06/2018
Book value of own vessels as of 30/06/2013:
approx. EUR 2.5bn, avg. age: 6 years
Maritime Assets
Management of 101* vessels (82 container
vessels, 15 MPC as well as conbulkers and car
carriers), thereof 58 own vessels
26 KG vessels and 3 additional non-KG third party
vessels
Coverage of the maritime value chain: from project
planning and financing arrangement to chartering
and sales
Highlights
* As of October 2013
11
III. Business Model
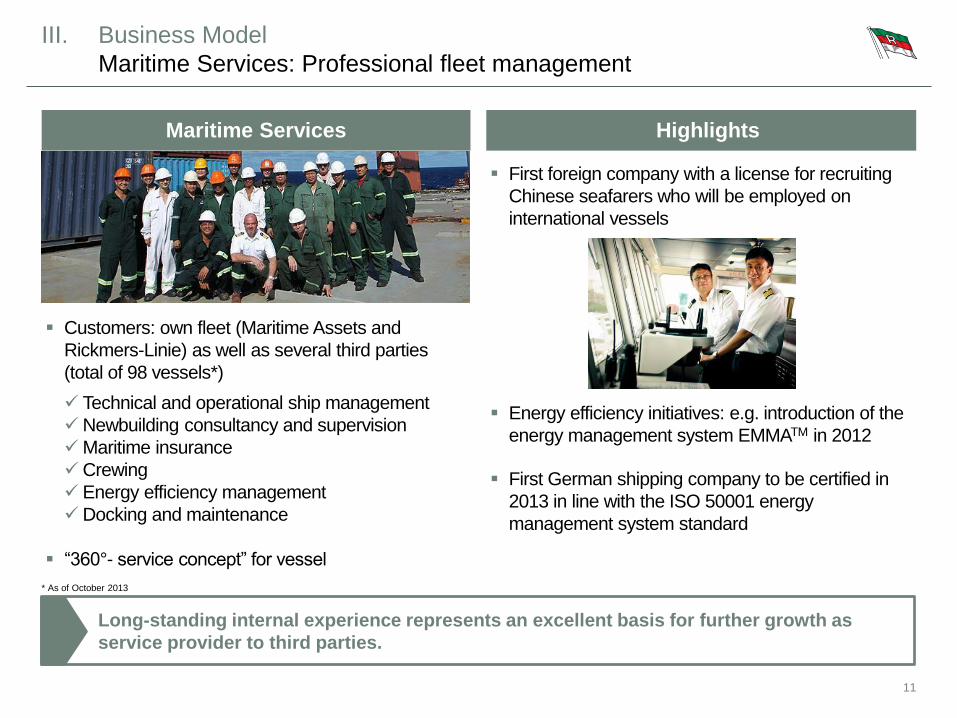
Maritime Services: Professional fleet management
Customers: own fleet (Maritime Assets and
Rickmers-Linie) as well as several third parties
(total of 98 vessels*)
Technical and operational ship management
Newbuilding consultancy and supervision
Maritime insurance
Crewing
Energy efficiency management
Docking and maintenance
“360°- service concept” for vessel
Long-standing internal experience represents an excellent basis for further growth as
service provider to third parties.
First foreign company with a license for recruiting
Chinese seafarers who will be employed on
international vessels
Energy efficiency initiatives: e.g. introduction of the
energy management system EMMATM in 2012
First German shipping company to be certified in
2013 in line with the ISO 50001 energy
management system standard
Maritime Services Highlights
* As of October 2013
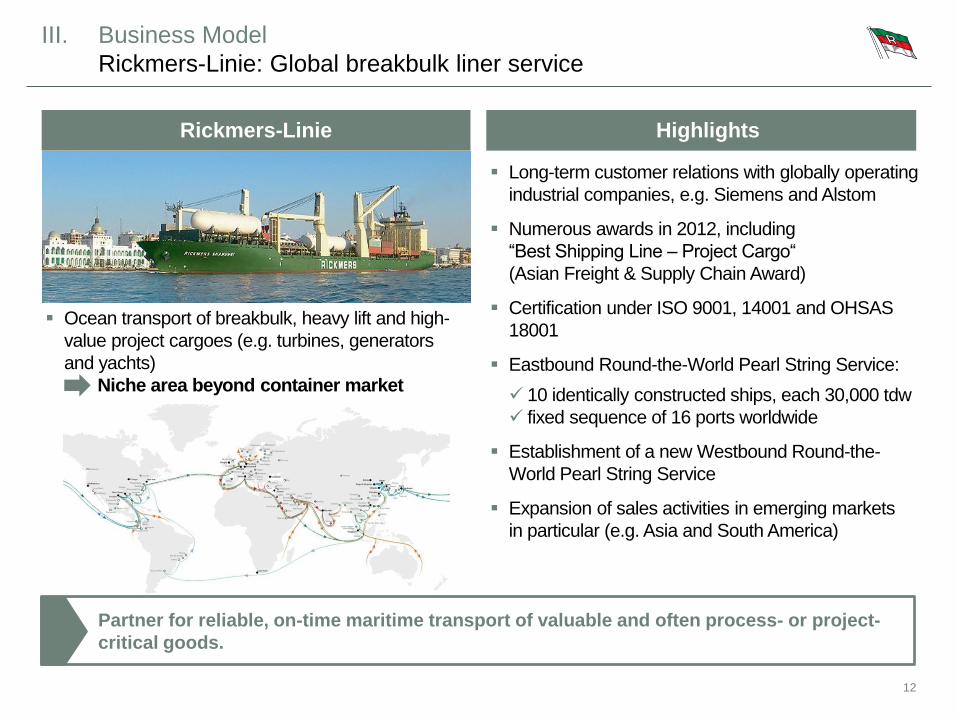
Long-term customer relations with globally operating
industrial companies, e.g. Siemens and Alstom
Numerous awards in 2012, including
“Best Shipping Line – Project Cargo“
(Asian Freight & Supply Chain Award)
Certification under ISO 9001, 14001 and OHSAS
18001
Eastbound Round-the-World Pearl String Service:
10 identically constructed ships, each 30,000 tdw
fixed sequence of 16 ports worldwide
Establishment of a new Westbound Round-the-
World Pearl String Service
Expansion of sales activities in emerging markets
in particular (e.g. Asia and South America)
Ocean transport of breakbulk, heavy lift and high-
value project cargoes (e.g. turbines, generators
and yachts)
Niche area beyond container market
12
Partner for reliable, on-time maritime transport of valuable and often process- or project-
critical goods.
III. Business Model
Rickmers-Linie: Global breakbulk liner service
Rickmers-Linie Highlights
13
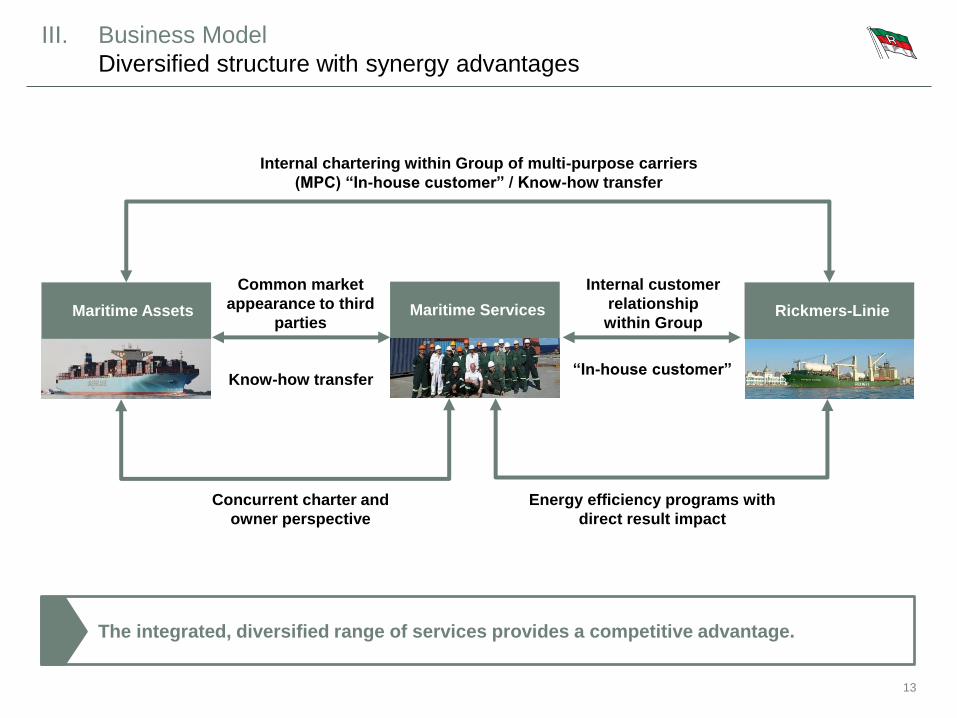
The integrated, diversified range of services provides a competitive advantage.
III. Business Model
Diversified structure with synergy advantages
Maritime Assets Maritime Services Rickmers-Linie
Concurrent charter and
owner perspective
Energy efficiency programs with
direct result impact
Internal chartering within Group of multi-purpose carriers
(MPC) “In-house customer” / Know-how transfer
Common market
appearance to third
parties
Internal customer
relationship
within Group
Know-how transfer “In-house customer”
14
Table of Contents
A. Executive Summary
B. Company profile
I. Tradition
II. Management
III. Business Model
IV. Market and Competition
V. Strategy
VI. Bond and Use of Proceeds
VII. Half-Year Financials
C. Appendix
15
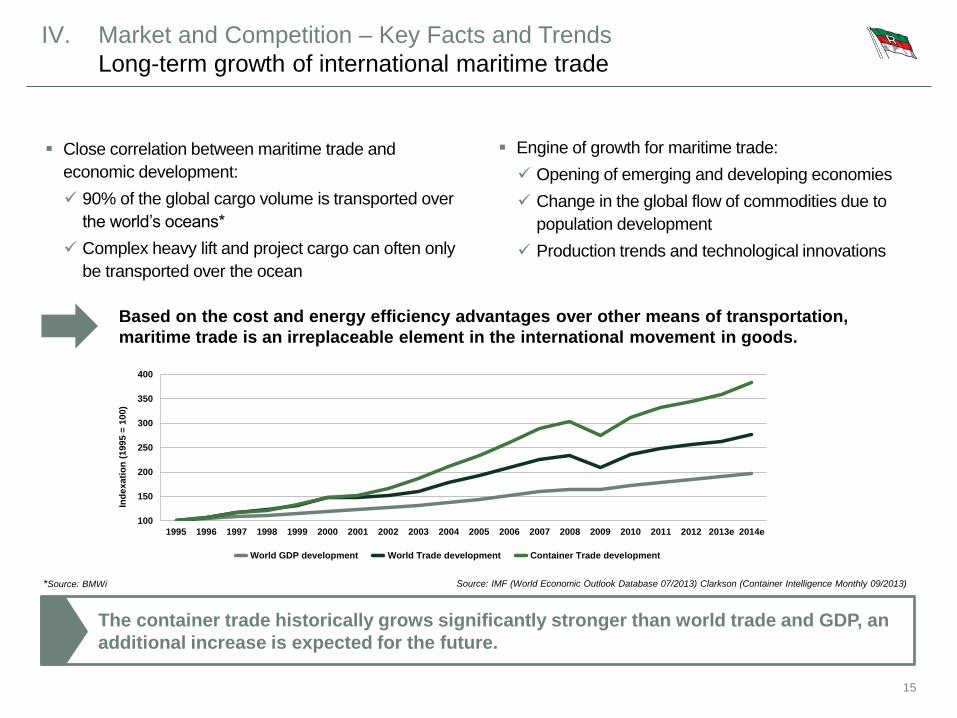
The container trade historically grows significantly stronger than world trade and GDP, an
additional increase is expected for the future.
IV. Market and Competition – Key Facts and Trends
Long-term growth of international maritime trade
Engine of growth for maritime trade:
Opening of emerging and developing economies
Change in the global flow of commodities due to
population development
Production trends and technological innovations
Close correlation between maritime trade and
economic development:
90% of the global cargo volume is transported over
the world’s oceans*
Complex heavy lift and project cargo can often only
be transported over the ocean
Based on the cost and energy efficiency advantages over other means of transportation,
maritime trade is an irreplaceable element in the international movement in goods.
*Source: BMWi Source: IMF (World Economic Outlook Database 07/2013) Clarkson (Container Intelligence Monthly 09/2013)
100
150
200
250
300
350
400
1995 1996 1997 1998 1999 2000 2001 2002 2003 2004 2005 2006 2007 2008 2009 2010 2011 2012 2013e 2014e
Ind
ex
ati
on
(1
99
5 =
10
0)
World GDP development World Trade development Container Trade development
5.7%
6.9% 7.0%6.4%
4.8%
7.7%
0%
1%
2%
3%
4%
5%
6%
7%
8%
9%
2013 2014 2015
Demand Growth Fleet Growth
16
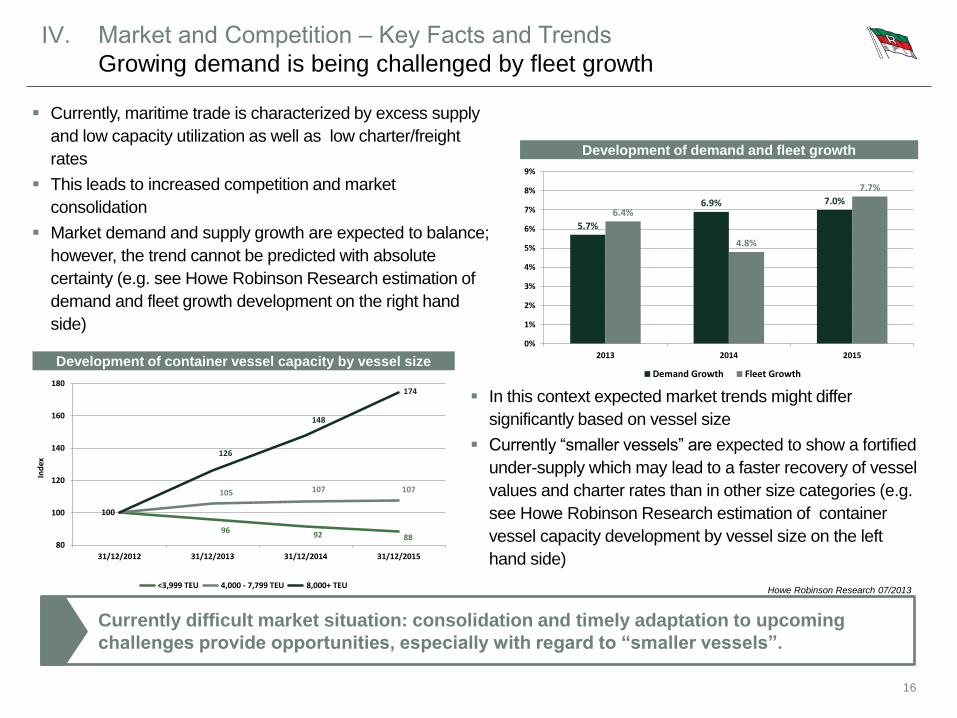
Currently difficult market situation: consolidation and timely adaptation to upcoming
challenges provide opportunities, especially with regard to “smaller vessels”.
IV. Market and Competition ‒ Key Facts and Trends
Growing demand is being challenged by fleet growth
Currently, maritime trade is characterized by excess supply
and low capacity utilization as well as low charter/freight
rates
This leads to increased competition and market
consolidation
Market demand and supply growth are expected to balance;
however, the trend cannot be predicted with absolute
certainty (e.g. see Howe Robinson Research estimation of
demand and fleet growth development on the right hand
side)
Howe Robinson Research 07/2013
9692 88
105 107 107
100
126
148
174
80
100
120
140
160
180
31/12/2012 31/12/2013 31/12/2014 31/12/2015
Ind
ex
<3,999 TEU 4,000 - 7,799 TEU 8,000+ TEU
Development of container vessel capacity by vessel size
Development of demand and fleet growth
In this context expected market trends might differ
significantly based on vessel size
Currently “smaller vessels” are expected to show a fortified
under-supply which may lead to a faster recovery of vessel
values and charter rates than in other size categories (e.g.
see Howe Robinson Research estimation of container
vessel capacity development by vessel size on the left
hand side)
17
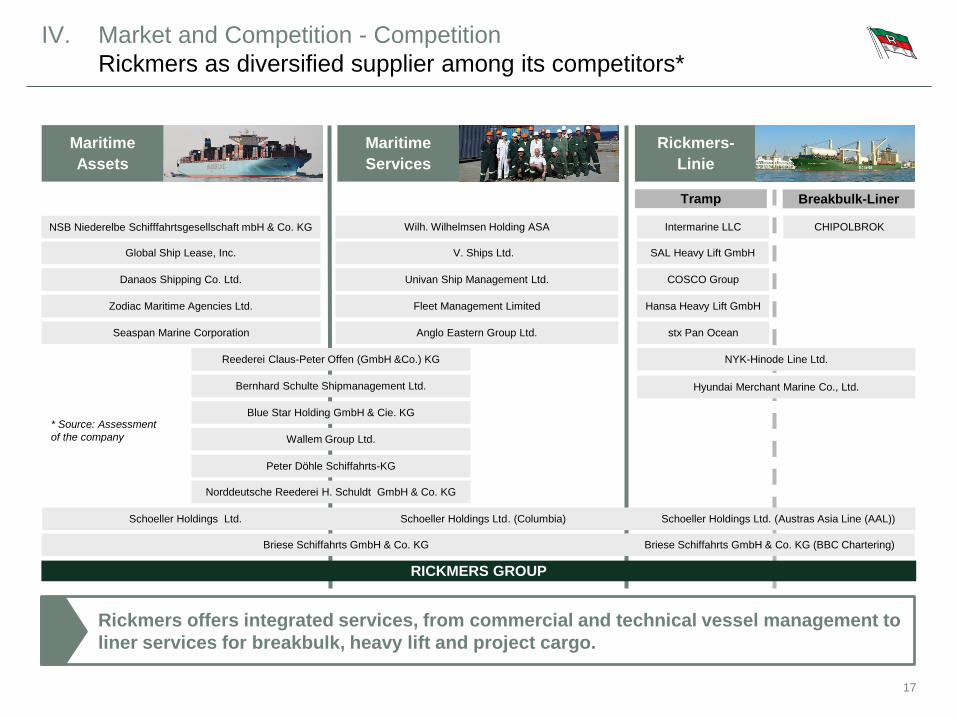
Rickmers offers integrated services, from commercial and technical vessel management to
liner services for breakbulk, heavy lift and project cargo.
IV. Market and Competition - Competition
Rickmers as diversified supplier among its competitors*
Maritime
Assets
Maritime
Services
Rickmers-
Linie
* Source: Assessment
of the company
RICKMERS GROUP
Bernhard Schulte Shipmanagement Ltd.
Reederei Claus-Peter Offen (GmbH &Co.) KG
NSB Niederelbe Schifffahrtsgesellschaft mbH & Co. KG CHIPOLBROK Intermarine LLC
V. Ships Ltd.
Wilh. Wilhelmsen Holding ASA
Wallem Group Ltd.
Univan Ship Management Ltd.
Blue Star Holding GmbH & Cie. KG
Peter Döhle Schiffahrts-KG
Briese Schiffahrts GmbH & Co. KG Briese Schiffahrts GmbH & Co. KG (BBC Chartering)
Seaspan Marine Corporation
Hyundai Merchant Marine Co., Ltd.
COSCO Group
SAL Heavy Lift GmbH
Schoeller Holdings Ltd. Schoeller Holdings Ltd. (Columbia) Schoeller Holdings Ltd. (Austras Asia Line (AAL))
NYK-Hinode Line Ltd.
Danaos Shipping Co. Ltd.
Global Ship Lease, Inc.
Zodiac Maritime Agencies Ltd.
Norddeutsche Reederei H. Schuldt GmbH & Co. KG
Fleet Management Limited
Anglo Eastern Group Ltd.
Hansa Heavy Lift GmbH
stx Pan Ocean
Tramp Breakbulk-Liner

18
Table of Contents
A. Executive Summary
B. Company profile
I. Tradition
II. Management
III. Business Model
IV. Market and Competition
V. Strategy
VI. Bond and Use of Proceeds
VII. Half-Year Financials
C. Appendix
19
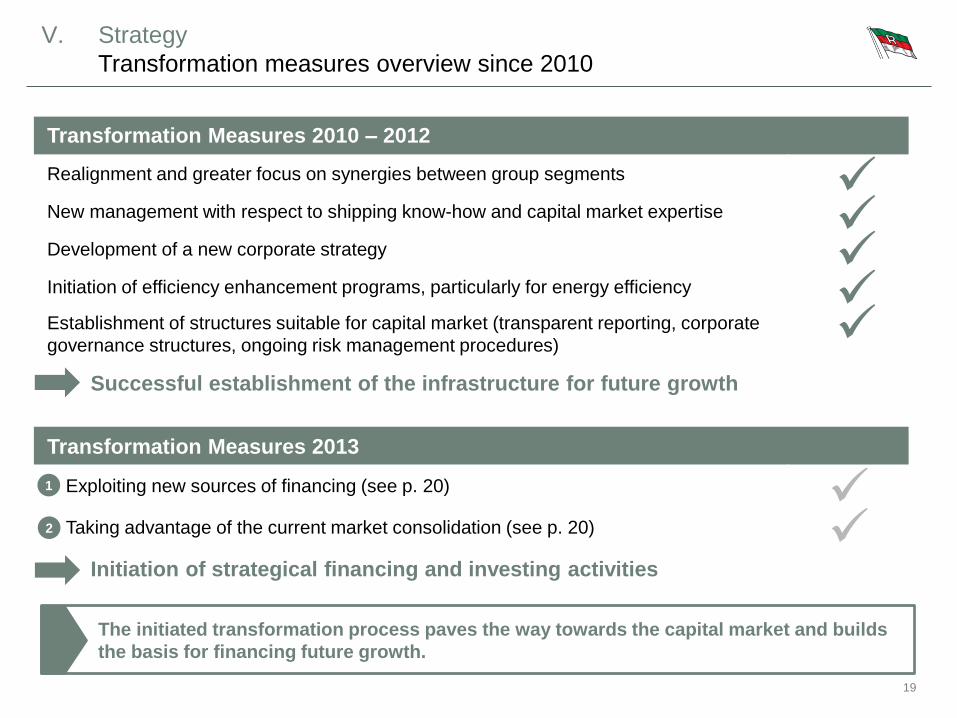
V. Strategy
Transformation measures overview since 2010
Transformation Measures 2010 – 2012
Realignment and greater focus on synergies between group segments
New management with respect to shipping know-how and capital market expertise
Development of a new corporate strategy
Initiation of efficiency enhancement programs, particularly for energy efficiency
Establishment of structures suitable for capital market (transparent reporting, corporate
governance structures, ongoing risk management procedures)
Successful establishment of the infrastructure for future growth
Transformation Measures 2013
Exploiting new sources of financing (see p. 20)
Taking advantage of the current market consolidation (see p. 20)
Initiation of strategical financing and investing activities
The initiated transformation process paves the way towards the capital market and builds
the basis for financing future growth.
1
2
20
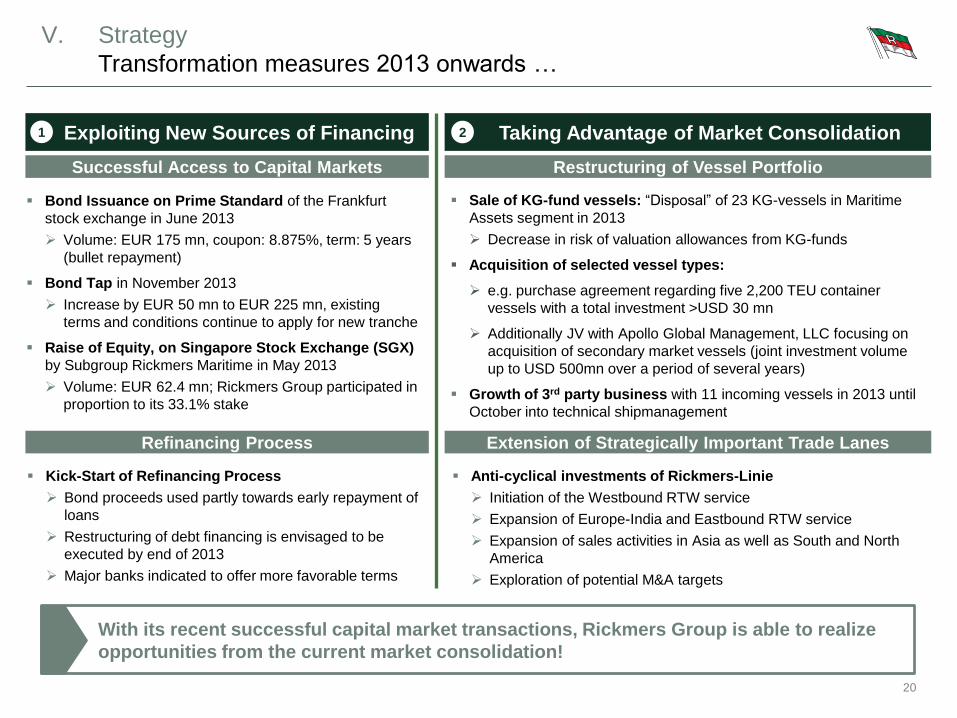
V. Strategy
Transformation measures 2013 onwards …
Kick-Start of Refinancing Process
Bond proceeds used partly towards early repayment of
loans
Restructuring of debt financing is envisaged to be
executed by end of 2013
Major banks indicated to offer more favorable terms
Bond Issuance on Prime Standard of the Frankfurt
stock exchange in June 2013
Volume: EUR 175 mn, coupon: 8.875%, term: 5 years
(bullet repayment)
Bond Tap in November 2013
Increase by EUR 50 mn to EUR 225 mn, existing
terms and conditions continue to apply for new tranche
Raise of Equity, on Singapore Stock Exchange (SGX)
by Subgroup Rickmers Maritime in May 2013
Volume: EUR 62.4 mn; Rickmers Group participated in
proportion to its 33.1% stake
Refinancing Process
Successful Access to Capital Markets
With its recent successful capital market transactions, Rickmers Group is able to realize
opportunities from the current market consolidation!
Exploiting New Sources of Financing Taking Advantage of Market Consolidation
Extension of Strategically Important Trade Lanes
Restructuring of Vessel Portfolio
Sale of KG-fund vessels: “Disposal” of 23 KG-vessels in Maritime
Assets segment in 2013
Decrease in risk of valuation allowances from KG-funds
Acquisition of selected vessel types:
e.g. purchase agreement regarding five 2,200 TEU container
vessels with a total investment >USD 30 mn
Additionally JV with Apollo Global Management, LLC focusing on
acquisition of secondary market vessels (joint investment volume
up to USD 500mn over a period of several years)
Growth of 3rd party business with 11 incoming vessels in 2013 until
October into technical shipmanagement
Anti-cyclical investments of Rickmers-Linie
Initiation of the Westbound RTW service
Expansion of Europe-India and Eastbound RTW service
Expansion of sales activities in Asia as well as South and North
America
Exploration of potential M&A targets
1 2
21
Table of Contents
A. Executive Summary
B. Company profile
I. Tradition
II. Management
III. Business Model
IV. Market and Competition
V. Strategy
VI. Bond and Use of Proceeds
VII. Half-Year Financials
C. Appendix
0 €
5.000.000 €
10.000.000 €
15.000.000 €
20.000.000 €
25.000.000 €
98,00
98,50
99,00
99,50
100,00
100,50
101,00
101,50
102,00
102,50
103,00Trad
e Vo
lum
eP
rice
22
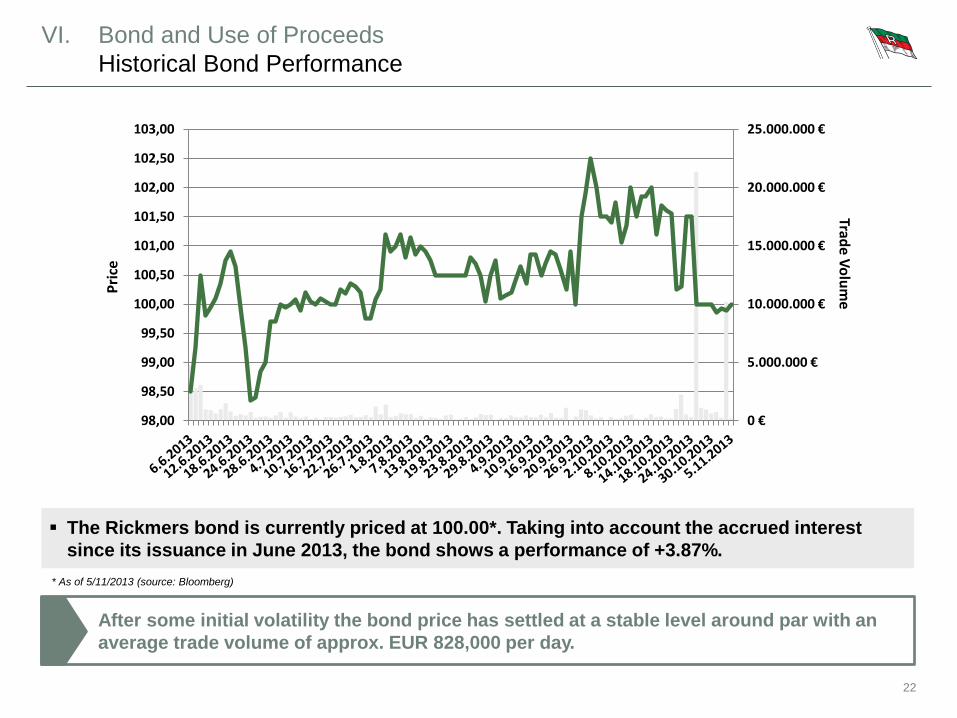
VI. Bond and Use of Proceeds
Historical Bond Performance
After some initial volatility the bond price has settled at a stable level around par with an
average trade volume of approx. EUR 828,000 per day.
* As of 5/11/2013 (source: Bloomberg)
The Rickmers bond is currently priced at 100.00*. Taking into account the accrued interest
since its issuance in June 2013, the bond shows a performance of +3.87%.
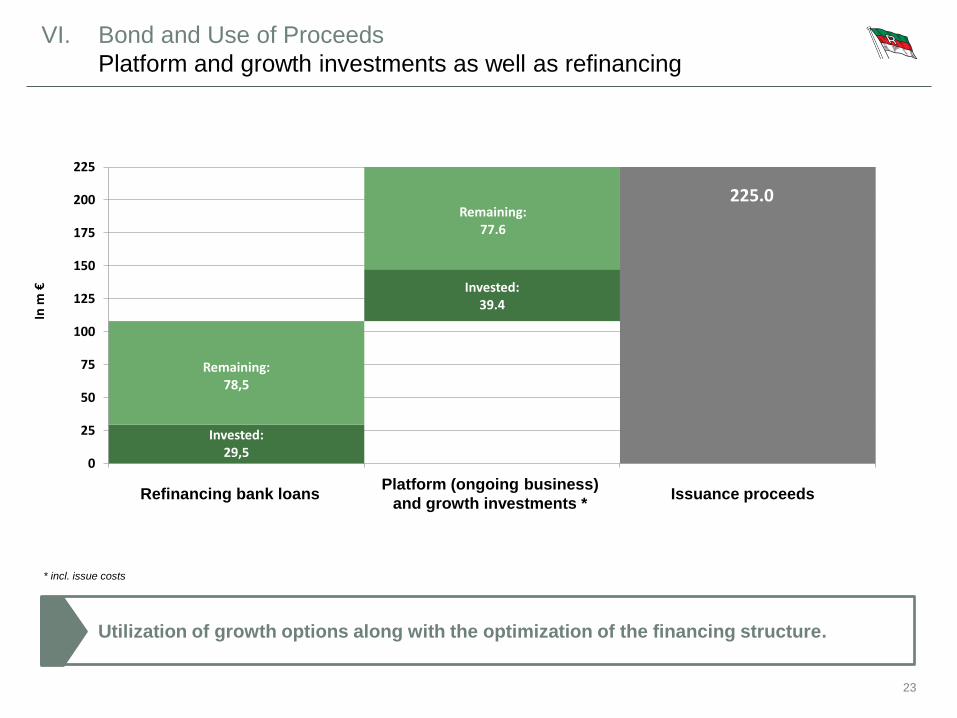
Remaining:78,5
Remaining:77.6
225.0
Invested:29,5
Invested:39.4
0
25
50
75
100
125
150
175
200
225
In m
€
23
VI. Bond and Use of Proceeds
Platform and growth investments as well as refinancing
Utilization of growth options along with the optimization of the financing structure.
* incl. issue costs
Issuance proceeds Platform (ongoing business)
and growth investments * Refinancing bank loans

24
Table of Contents
A. Executive Summary
B. Company profile
I. Tradition
II. Management
III. Business Model
IV. Market and Competition
V. Strategy
VI. Bond and Use of Proceeds
VII. Half-Year Financials
C. Appendix
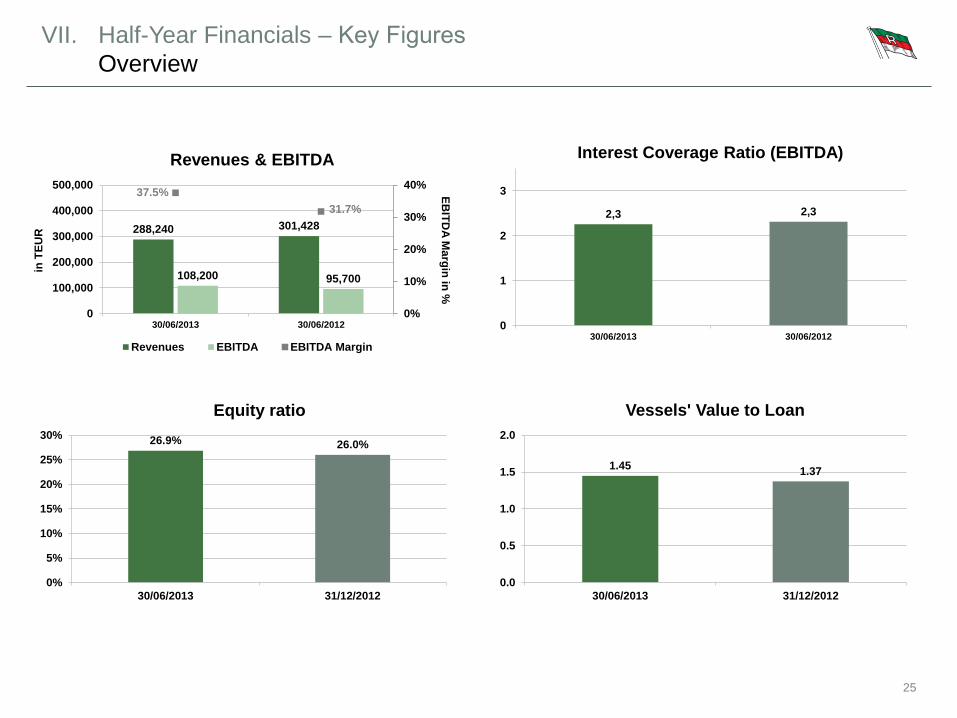
2,3 2,3
0
1
2
3
30/06/2013 30/06/2012
Interest Coverage Ratio (EBITDA)
25
VII. Half-Year Financials ‒ Key Figures
Overview
26.9% 26.0%
0%
5%
10%
15%
20%
25%
30%
30/06/2013 31/12/2012
Equity ratio
1.451.37
0.0
0.5
1.0
1.5
2.0
30/06/2013 31/12/2012
Vessels' Value to Loan
288,240 301,428
108,200 95,700
37.5%
31.7%
0%
10%
20%
30%
40%
0
100,000
200,000
300,000
400,000
500,000
30/06/2013 30/06/2012
EB
ITD
A M
arg
in in
%
in T
EU
R
Revenues & EBITDA
Revenues EBITDA EBITDA Margin

26
Shipping crisis and Rickmers Group’s transformation process temporarily burdens the
income statement. However, results remain positive and stay profitable.
VII. Half-Year Financials ‒ Income Statement
Stable operating performance despite challenging market conditions
Decrease in revenues results from low
freight rates and less voyages at
Rickmers-Linie as well as the planned sale
of KG-fund vessels at Maritime Services
However, Maritime Assets grew revenues,
mainly due to 6-month inclusion of
Rickmers Maritime sub-group; this effect
also explains the increase in EBITDA
In contrast, the EBIT decreased due to a
higher depreciation effect, again, resulting
from the 6-month inclusion effect of
Rickmers Maritime
Revenue margin
= Group Net Income
-Depreciation of f ixed intangible and
tangible assets-69.524
-140.643
-35.892
-32.580
-
-
According to HGB (in TEUR)
Total output
Other operating income
Personnel expenses
Other operating expenses
- Cost of materials
Consolidated Income Statement
+
+/-
30/06/2013
288.240
2.533
290.773
26.085
30/06/2012
301.428
5.274
306.702
33.881
Revenues
Finished goods and w ork in progress
-158.577
-37.720
EBIT margin
EBITDA margin
EBIT
13,1%
EBITDA
1.555
0,5%
108.200
37,5%
37.700
-41.615
-51.952
53.200
17,6%
11.053
3,6%
95.700
31,7%
27
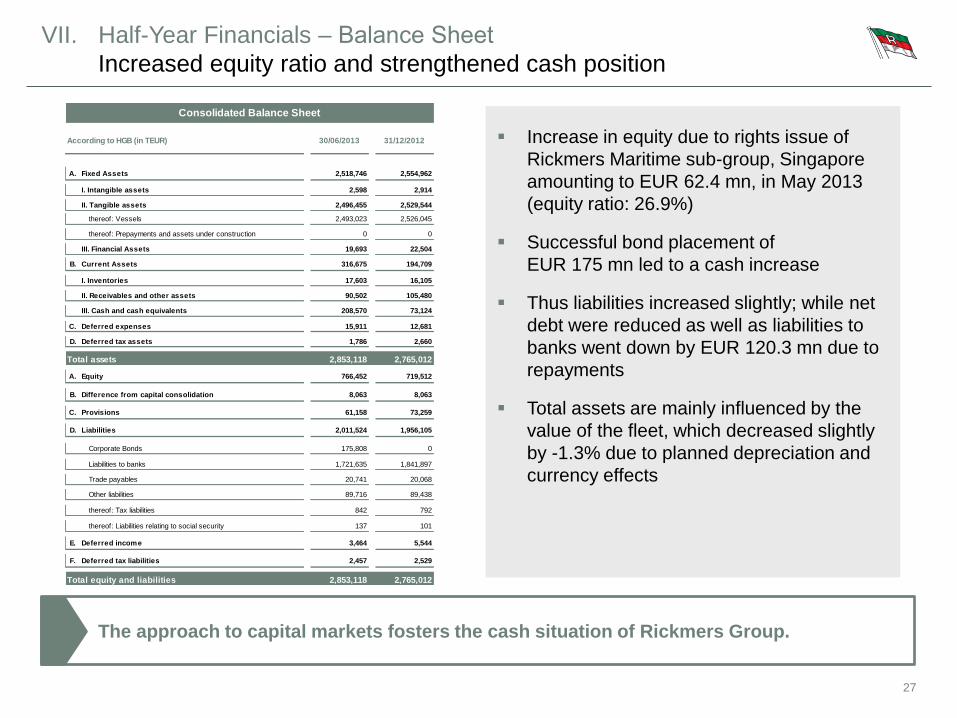
The approach to capital markets fosters the cash situation of Rickmers Group.
VII. Half-Year Financials ‒ Balance Sheet
Increased equity ratio and strengthened cash position
Increase in equity due to rights issue of
Rickmers Maritime sub-group, Singapore
amounting to EUR 62.4 mn, in May 2013
(equity ratio: 26.9%)
Successful bond placement of
EUR 175 mn led to a cash increase
Thus liabilities increased slightly; while net
debt were reduced as well as liabilities to
banks went down by EUR 120.3 mn due to
repayments
Total assets are mainly influenced by the
value of the fleet, which decreased slightly
by -1.3% due to planned depreciation and
currency effects
2,011,524
175,808
1,721,635
Equity
III. Cash and cash equivalents
Total assets
719,512
Deferred expensesC.
73,124
12,681
2,765,012
D. Deferred tax assets 2,660
A.
208,570
15,911
1,786
2,853,118
766,452
8,063
1,841,897
8,063B. Difference from capital consolidation
Trade payables 20,068
Total equity and liabilities
5,544
F. Deferred tax liabilities 2,529
E. Deferred income
Other liabilities
2,765,012
89,438
thereof: Liabilities relating to social security 101
thereof: Tax liabilities 792
16,105
II. Receivables and other assets 105,480
194,709
III. Financial Assets
17,603
2,914
I. Inventories
Consolidated Balance Sheet
31/12/2012
A.
According to HGB (in TEUR)
I. Intangible assets
2,554,962Fixed Assets
2,526,045thereof: Vessels
B.
22,504
Current Assets
19,693
316,675
thereof: Prepayments and assets under construction 0
2,529,544II. Tangible assets
0
73,259
1,956,105D.
Provisions
Liabilities
C.
Liabilities to banks
Corporate Bonds 0
61,158
30/06/2013
2,518,746
2,598
2,496,455
2,493,023
20,741
89,716
842
137
3,464
2,457
2,853,118
90,502
0
0
1,756
51,470
80,689
3,113
0
-8,444
0
-50,809
-59,253
-12,140
41,993
-634
114
2,948
-1,312
-393
30/06/2012
107
1,540
-714
-1
0
30/06/2013
+/- Effect on cash and cash equivalents due to exchange rate movements
Cash flow from financing activities
= Cash and cash equivalents at end of period
+ Cash and cash equivalents at beginning of period
+ Increase in cash and cash equivalents due to changes in scope of
= Net change in cash and cash equivalents
376
73,124
208,570
66,940
135,070
0
- Payments to ow ners and minority shareholders
- Payments made for the repayment of borrow ings
+ Payments received from the raising of borrow ings
-5,787
195,865
-164,859
= Cash flow from investing activities
-Payments made for the purchase of consolidated companies and other
business units
+ Changes in f inancial receivables
+Payments received from equity increases and advances of
shareholders
0
23,428
24,360
41,721
Payments received from disposal of f inancial assets and repayments
- Payments made for investments in tangible and intangible assets
+Payments received from the sale of consolidated companies and other
business units
- Payments made for investments in f inancial assets
=
+ Payments received from disposal of tangible and intangible assets
+
Cash flow statement
-4,029
9,579
3,961
-11,409
44,000
30/06/2012
11,053
55,576
-12,814
-55
3,690
-11,301
-248
-3
-10,369
-12,572
-3,974
43,770
30/06/2013
1,555
68,065
-65
0
5,837
-3,273
-6
5
Increase (+) / decrease (-) in long-term provisions (> 1 year)
+ Other non-cash expenses
+ Depreciation, amortisation and impairment of f ixed assets
- Write-up of f ixed assets
+ Loss from disposal of f ixed assets
Increase (-) / decrease (+) in inventories (incl. prepayments)
- Other non-cash income
- Gain from disposal of f ixed assets
-1,433
Net income
= Cash flow from operating activities
Increase (+) / decrease (-) in liabilities and deferred income (w ithout
f inancial liabilities)
Cash flow statement
Increase (-) / decrease (+) in receivables, other assets and deferred
expenses
Increase (+) / decrease (-) in current provisions (< 1 year)
28
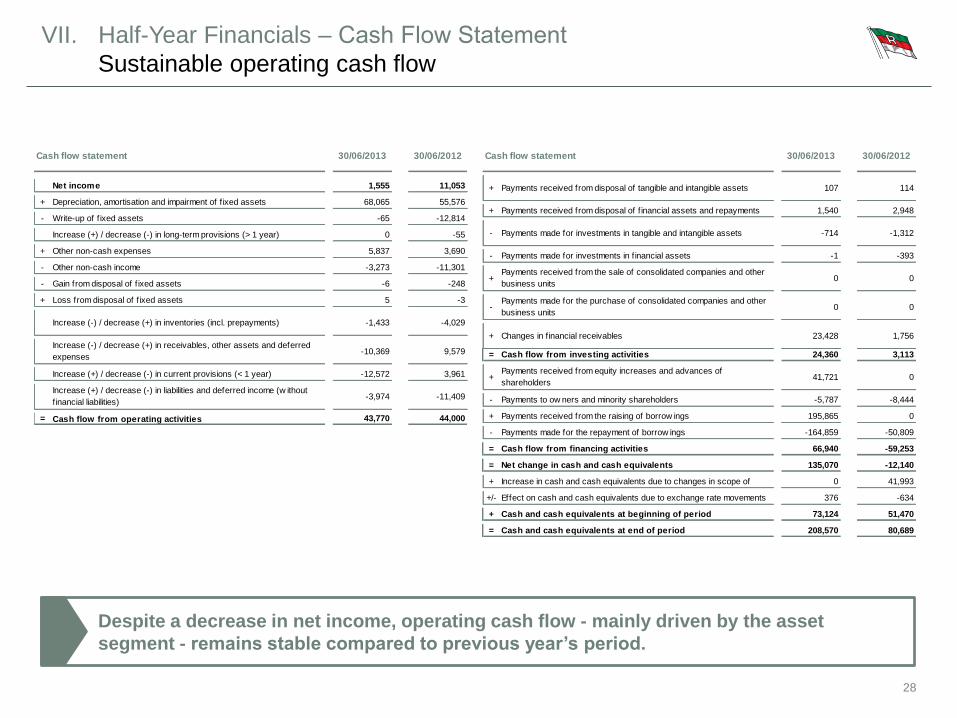
Despite a decrease in net income, operating cash flow - mainly driven by the asset
segment - remains stable compared to previous year’s period.
VII. Half-Year Financials ‒ Cash Flow Statement
Sustainable operating cash flow
29
Thank you for your attention.
Contact
Bertram R. C. Rickmers Chairman
Ronald D. Widdows CEO
Dr. Ignace Van Meenen Deputy CEO and CFO
Prof. Dr. Mark-Ken Erdmann Deputy CFO
Frank Bünte Chief Risk & Treasury Officer and Head of Capital Markets
Tobias Radloff Senior Manager | Tax
Rickmers Holding GmbH & Cie. KG
Neumühlen 19
22763 Hamburg, Germany
Tel. +49 (0)40.38 91 77-0
Fax +49 (0)40.38 91 77-500
www.rickmers.com
30
Table of Contents
A. Executive Summary
B. Company profile
I. Tradition
II. Management
III. Business Model
IV. Market and Competition
V. Strategy
VI. Bond and Use of Proceeds
VII. Half-Year Financials
C. Appendix
31
Appendix
Definitions
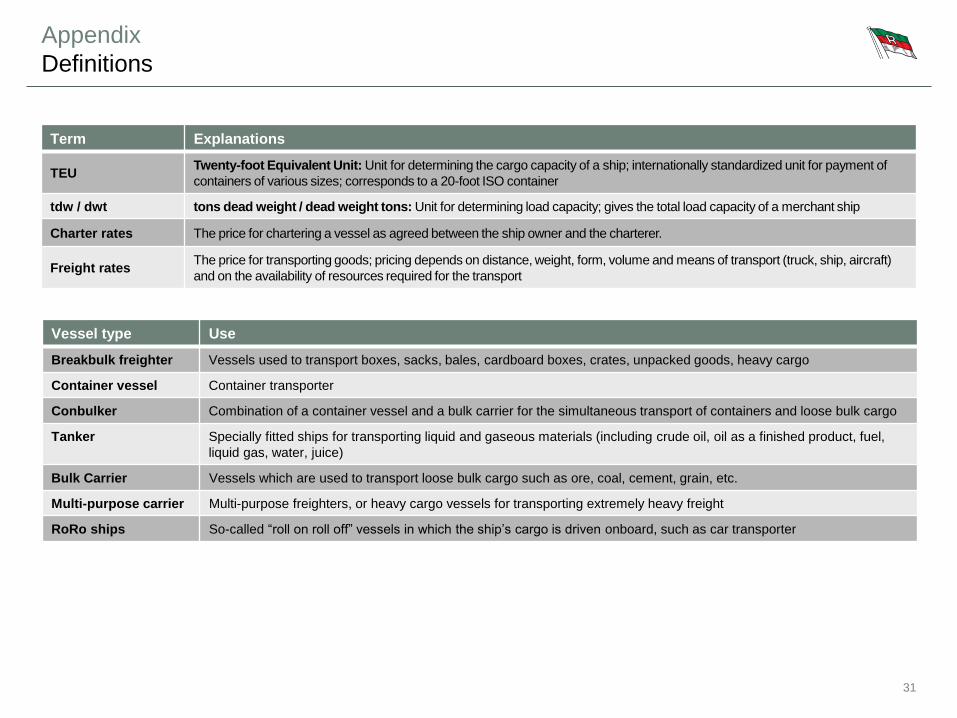
Term Explanations
TEU Twenty-foot Equivalent Unit: Unit for determining the cargo capacity of a ship; internationally standardized unit for payment of
containers of various sizes; corresponds to a 20-foot ISO container
tdw / dwt tons dead weight / dead weight tons: Unit for determining load capacity; gives the total load capacity of a merchant ship
Charter rates The price for chartering a vessel as agreed between the ship owner and the charterer.
Freight rates The price for transporting goods; pricing depends on distance, weight, form, volume and means of transport (truck, ship, aircraft)
and on the availability of resources required for the transport
Vessel type Use
Breakbulk freighter Vessels used to transport boxes, sacks, bales, cardboard boxes, crates, unpacked goods, heavy cargo
Container vessel Container transporter
Conbulker Combination of a container vessel and a bulk carrier for the simultaneous transport of containers and loose bulk cargo
Tanker Specially fitted ships for transporting liquid and gaseous materials (including crude oil, oil as a finished product, fuel,
liquid gas, water, juice)
Bulk Carrier Vessels which are used to transport loose bulk cargo such as ore, coal, cement, grain, etc.
Multi-purpose carrier Multi-purpose freighters, or heavy cargo vessels for transporting extremely heavy freight
RoRo ships So-called “roll on roll off” vessels in which the ship’s cargo is driven onboard, such as car transporter
32
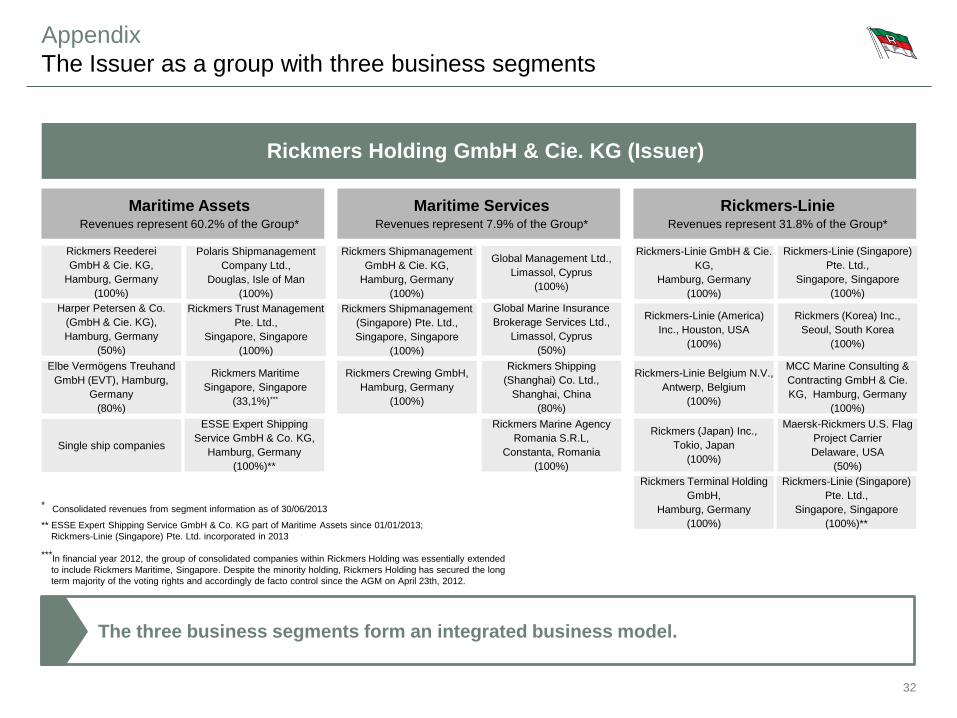
Appendix
The Issuer as a group with three business segments
Rickmers-Linie Revenues represent 31.8% of the Group*
Rickmers Holding GmbH & Cie. KG (Issuer)
The three business segments form an integrated business model.
Maritime Assets Revenues represent 60.2% of the Group*
Maritime Services Revenues represent 7.9% of the Group*
* Consolidated revenues from segment information as of 30/06/2013
** ESSE Expert Shipping Service GmbH & Co. KG part of Maritime Assets since 01/01/2013;
Rickmers-Linie (Singapore) Pte. Ltd. incorporated in 2013
***In financial year 2012, the group of consolidated companies within Rickmers Holding was essentially extended
to include Rickmers Maritime, Singapore. Despite the minority holding, Rickmers Holding has secured the long
term majority of the voting rights and accordingly de facto control since the AGM on April 23th, 2012.
Rickmers Reederei
GmbH & Cie. KG,
Hamburg, Germany
(100%)
Harper Petersen & Co.
(GmbH & Cie. KG),
Hamburg, Germany
(50%)
Polaris Shipmanagement
Company Ltd.,
Douglas, Isle of Man
(100%)
Rickmers Trust Management
Pte. Ltd.,
Singapore, Singapore
(100%)
Elbe Vermögens Treuhand
GmbH (EVT), Hamburg,
Germany
(80%)
Rickmers Maritime
Singapore, Singapore
(33,1%)***
Single ship companies
Rickmers Shipmanagement
GmbH & Cie. KG,
Hamburg, Germany
(100%)
Global Management Ltd.,
Limassol, Cyprus
(100%)
Rickmers Shipmanagement
(Singapore) Pte. Ltd.,
Singapore, Singapore
(100%)
Rickmers Marine Agency
Romania S.R.L,
Constanta, Romania
(100%)
Rickmers Crewing GmbH,
Hamburg, Germany
(100%)
ESSE Expert Shipping
Service GmbH & Co. KG,
Hamburg, Germany
(100%)**
Global Marine Insurance
Brokerage Services Ltd.,
Limassol, Cyprus
(50%)
Rickmers-Linie GmbH & Cie.
KG,
Hamburg, Germany
(100%)
Rickmers (Korea) Inc.,
Seoul, South Korea
(100%)
MCC Marine Consulting &
Contracting GmbH & Cie.
KG, Hamburg, Germany
(100%)
Rickmers-Linie Belgium N.V.,
Antwerp, Belgium
(100%)
Rickmers Terminal Holding
GmbH,
Hamburg, Germany
(100%)
Rickmers (Japan) Inc.,
Tokio, Japan
(100%)
Rickmers-Linie (America)
Inc., Houston, USA
(100%)
Rickmers Shipping
(Shanghai) Co. Ltd.,
Shanghai, China
(80%)
Rickmers-Linie (Singapore)
Pte. Ltd.,
Singapore, Singapore
(100%)
Maersk-Rickmers U.S. Flag
Project Carrier
Delaware, USA
(50%)
Rickmers-Linie (Singapore)
Pte. Ltd.,
Singapore, Singapore
(100%)**
33
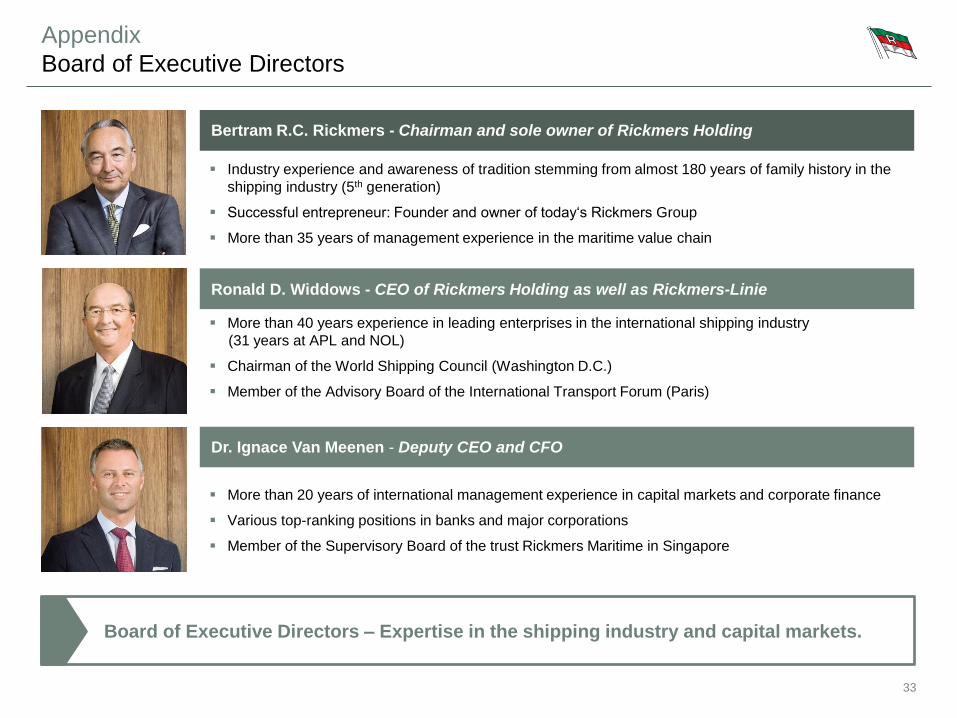
Appendix
Board of Executive Directors
Board of Executive Directors – Expertise in the shipping industry and capital markets.
More than 40 years experience in leading enterprises in the international shipping industry
(31 years at APL and NOL)
Chairman of the World Shipping Council (Washington D.C.)
Member of the Advisory Board of the International Transport Forum (Paris)
Industry experience and awareness of tradition stemming from almost 180 years of family history in the
shipping industry (5th generation)
Successful entrepreneur: Founder and owner of today‘s Rickmers Group
More than 35 years of management experience in the maritime value chain
Bertram R.C. Rickmers - Chairman and sole owner of Rickmers Holding
Ronald D. Widdows - CEO of Rickmers Holding as well as Rickmers-Linie
Dr. Ignace Van Meenen - Deputy CEO and CFO
More than 20 years of international management experience in capital markets and corporate finance
Various top-ranking positions in banks and major corporations
Member of the Supervisory Board of the trust Rickmers Maritime in Singapore
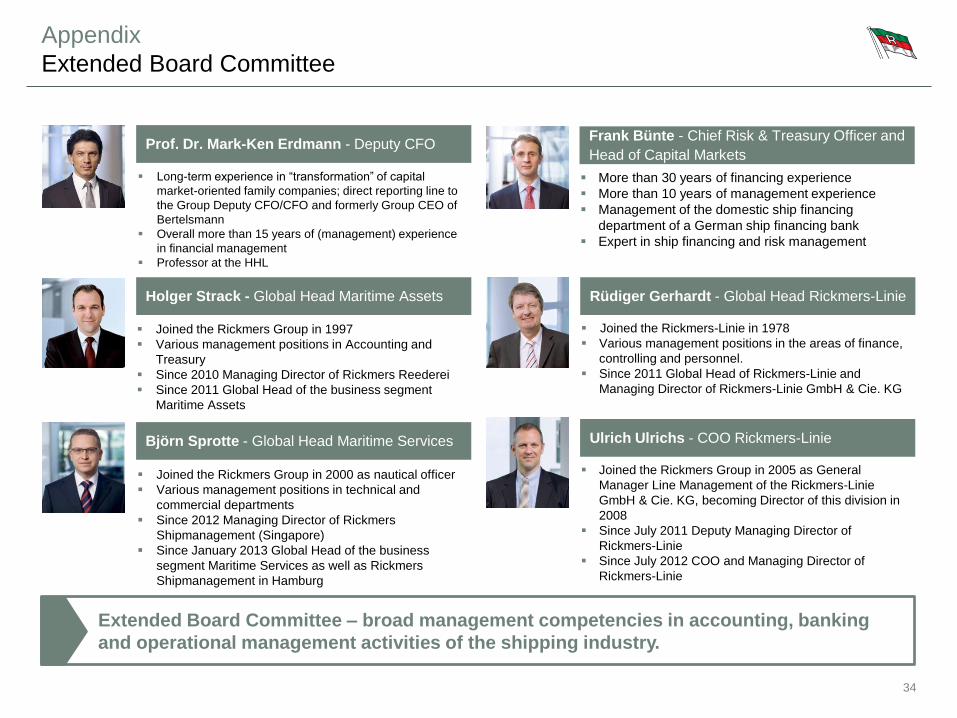
Joined the Rickmers Group in 2000 as nautical officer
Various management positions in technical and
commercial departments
Since 2012 Managing Director of Rickmers
Shipmanagement (Singapore)
Since January 2013 Global Head of the business
segment Maritime Services as well as Rickmers
Shipmanagement in Hamburg
Joined the Rickmers Group in 1997
Various management positions in Accounting and
Treasury
Since 2010 Managing Director of Rickmers Reederei
Since 2011 Global Head of the business segment
Maritime Assets
34
Appendix
Extended Board Committee
Extended Board Committee – broad management competencies in accounting, banking
and operational management activities of the shipping industry.
Long-term experience in “transformation” of capital
market-oriented family companies; direct reporting line to
the Group Deputy CFO/CFO and formerly Group CEO of
Bertelsmann
Overall more than 15 years of (management) experience
in financial management
Professor at the HHL
Prof. Dr. Mark-Ken Erdmann - Deputy CFO
More than 30 years of financing experience
More than 10 years of management experience
Management of the domestic ship financing
department of a German ship financing bank
Expert in ship financing and risk management
Frank Bünte - Chief Risk & Treasury Officer and
Head of Capital Markets
Holger Strack - Global Head Maritime Assets
Björn Sprotte - Global Head Maritime Services
Joined the Rickmers-Linie in 1978
Various management positions in the areas of finance,
controlling and personnel.
Since 2011 Global Head of Rickmers-Linie and
Managing Director of Rickmers-Linie GmbH & Cie. KG
Rüdiger Gerhardt - Global Head Rickmers-Linie
Joined the Rickmers Group in 2005 as General
Manager Line Management of the Rickmers-Linie
GmbH & Cie. KG, becoming Director of this division in
2008
Since July 2011 Deputy Managing Director of
Rickmers-Linie
Since July 2012 COO and Managing Director of
Rickmers-Linie
Ulrich Ulrichs - COO Rickmers-Linie

35
New energy-efficient ship generation offers diversification potential – modern forms of
financing and access to financing sources crucial for the future.
Appendix
The maritime transport sector and its demands are changing
Capacities
Financing
Efficiency
Ship
newbuildings
Competition
Excessive demand Excessive supply Tendency towards equilibrium with
excess demand
High financing willingness
(Banks / LP models) Slump in financing market
Lower bunker prices /
Low pressure to act
High number of
market participants
Over-utilisation of the shipyards/
Standardised ship specifications
Under-utilization of the shipyards /
Individualized ship specifications
High bunker prices /
High pressure to act to modernize
existing fleets
Search for alternative financing sources
and partners
Uncertainty over bunker prices / strategic
focus on energy efficiency
Potentially more stable shipyard capacity
utilization / New generation of energy-
efficient ship specifications
Completed
market consolidation Market consolidation
Vessel Prices Vessel prices at a high level Tendency towards increasing vessel
prices
Declining vessel prices with current
historical low points
Charter and
Freight Rates High price level
Significantly deceasing prices,
stabilization on low level Tendency towards increasing prices
Before 2008 Today Future expectation *
* Assessment of the company
36
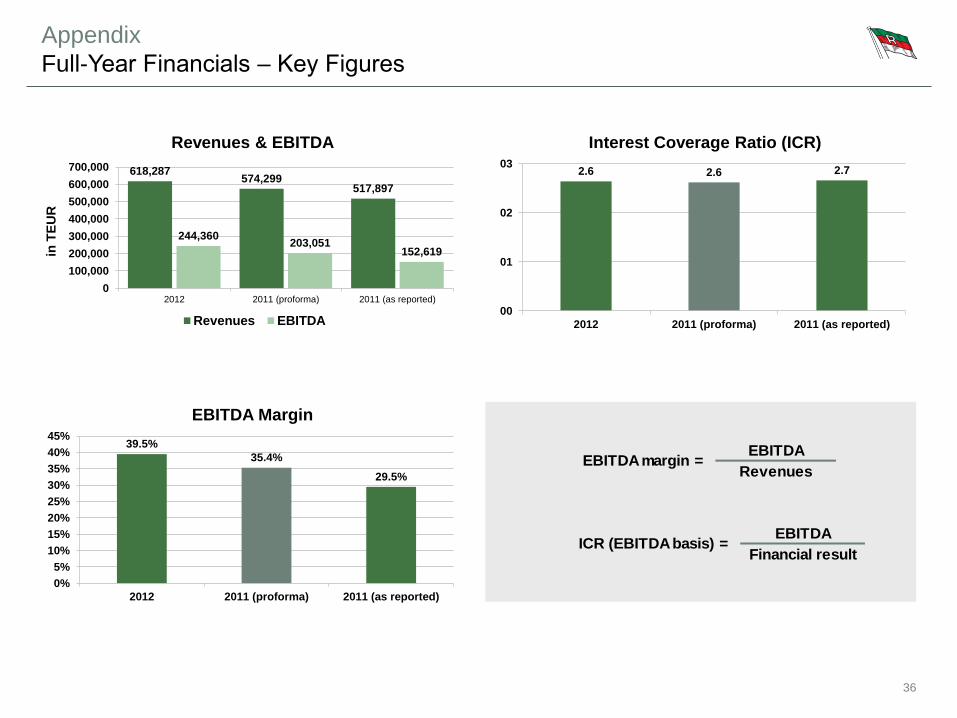
Appendix
Full-Year Financials ‒ Key Figures
EBITDA
RevenuesEBITDA margin =
EBITDA
Financial resultICR (EBITDA basis) =
618,287574,299
517,897
244,360203,051
152,619
0
100,000
200,000
300,000
400,000
500,000
600,000
700,000
2012 2011 (proforma) 2011 (as reported)
in T
EU
R
Revenues & EBITDA
Revenues EBITDA
2.6 2.6 2.7
00
01
02
03
2012 2011 (proforma) 2011 (as reported)
Interest Coverage Ratio (ICR)
39.5%
35.4%
29.5%
0%
5%
10%
15%
20%
25%
30%
35%
40%
45%
2012 2011 (proforma) 2011 (as reported)
EBITDA Margin
37
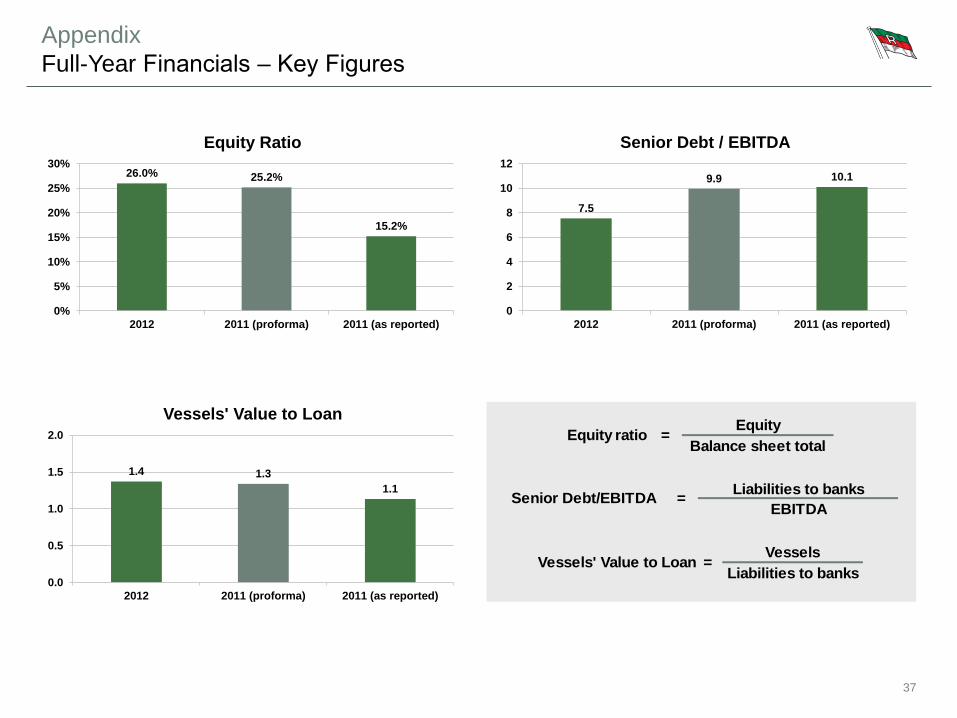
Appendix
Full-Year Financials ‒ Key Figures
Equity
Balance sheet total=Equity ratio
Vessels
Liabilities to banksVessels' Value to Loan =
Liabilities to banks
EBITDASenior Debt/EBITDA =
26.0% 25.2%
15.2%
0%
5%
10%
15%
20%
25%
30%
2012 2011 (proforma) 2011 (as reported)
Equity Ratio
7.5
9.9 10.1
0
2
4
6
8
10
12
2012 2011 (proforma) 2011 (as reported)
Senior Debt / EBITDA
1.4 1.3
1.1
0.0
0.5
1.0
1.5
2.0
2012 2011 (proforma) 2011 (as reported)
Vessels' Value to Loan
38
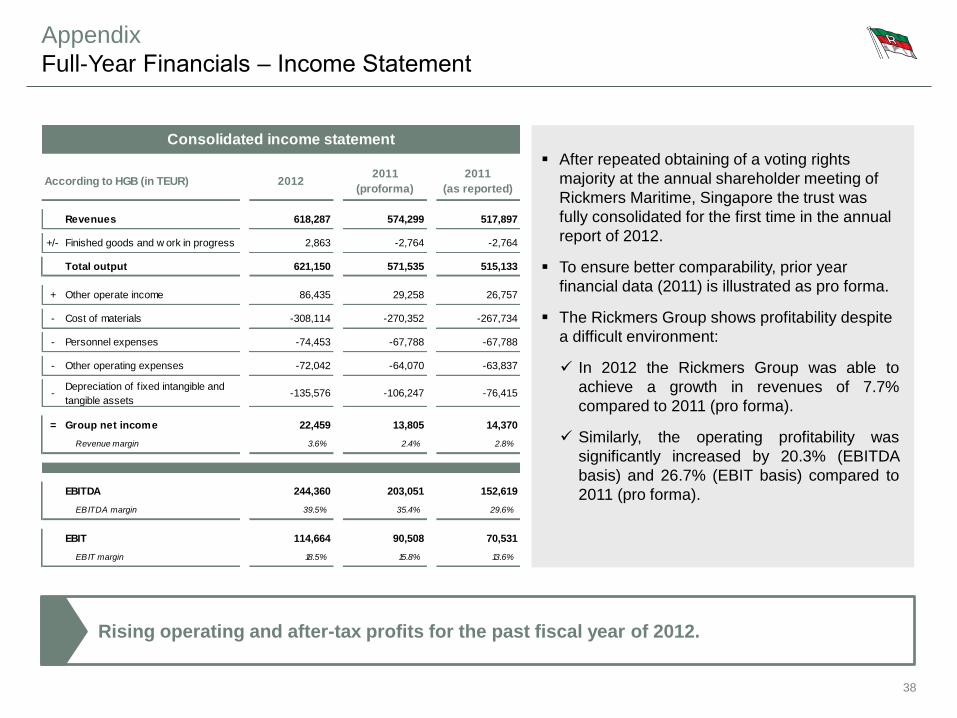
Rising operating and after-tax profits for the past fiscal year of 2012.
Appendix
Full-Year Financials ‒ Income Statement
After repeated obtaining of a voting rights
majority at the annual shareholder meeting of
Rickmers Maritime, Singapore the trust was
fully consolidated for the first time in the annual
report of 2012.
To ensure better comparability, prior year
financial data (2011) is illustrated as pro forma.
The Rickmers Group shows profitability despite
a difficult environment:
In 2012 the Rickmers Group was able to
achieve a growth in revenues of 7.7%
compared to 2011 (pro forma).
Similarly, the operating profitability was
significantly increased by 20.3% (EBITDA
basis) and 26.7% (EBIT basis) compared to
2011 (pro forma).
Consolidated income statement
According to HGB (in TEUR) 20122011
(proforma)
2011
(as reported)
Revenues 618,287 574,299 517,897
+/- Finished goods and w ork in progress 2,863 -2,764 -2,764
Total output 621,150 571,535 515,133
+ Other operate income 86,435 29,258 26,757
- Cost of materials -308,114 -270,352 -267,734
- Personnel expenses -74,453 -67,788 -67,788
- Other operating expenses -72,042 -64,070 -63,837
-Depreciation of f ixed intangible and
tangible assets-135,576 -106,247 -76,415
= Group net income 22,459 13,805 14,370
Revenue margin 3.6% 2.4% 2.8%
EBITDA 244,360 203,051 152,619
EBITDA margin 39.5% 35.4% 29.6%
EBIT 114,664 90,508 70,531
EBIT margin 18.5% 15.8% 13.6%
39
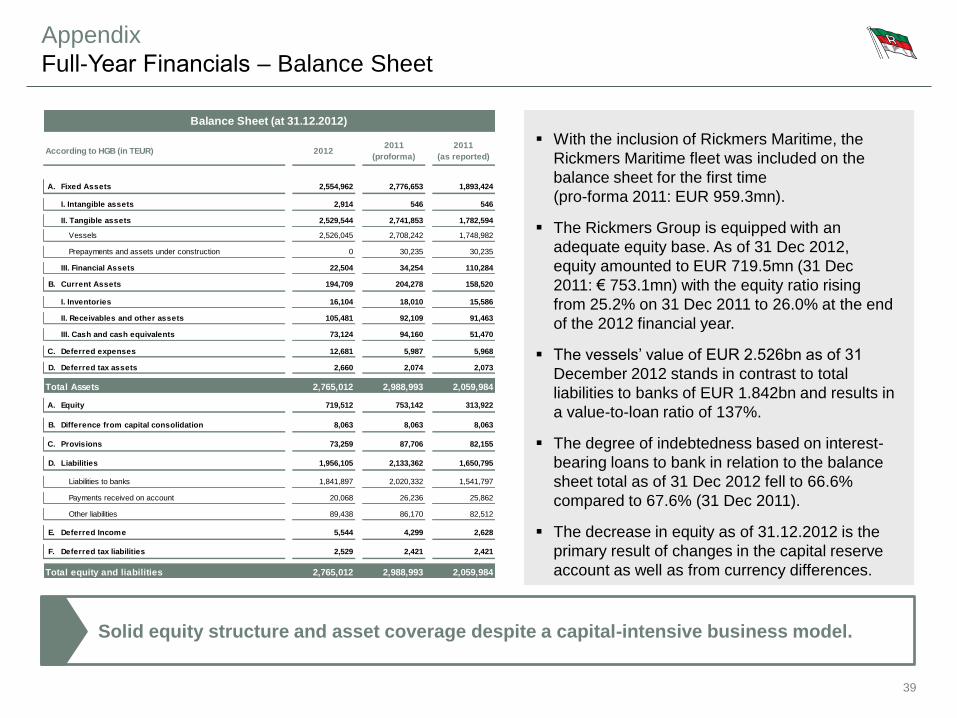
Solid equity structure and asset coverage despite a capital-intensive business model.
Appendix
Full-Year Financials ‒ Balance Sheet
With the inclusion of Rickmers Maritime, the
Rickmers Maritime fleet was included on the
balance sheet for the first time
(pro-forma 2011: EUR 959.3mn).
The Rickmers Group is equipped with an
adequate equity base. As of 31 Dec 2012,
equity amounted to EUR 719.5mn (31 Dec
2011: € 753.1mn) with the equity ratio rising
from 25.2% on 31 Dec 2011 to 26.0% at the end
of the 2012 financial year.
The vessels’ value of EUR 2.526bn as of 31
December 2012 stands in contrast to total
liabilities to banks of EUR 1.842bn and results in
a value-to-loan ratio of 137%.
The degree of indebtedness based on interest-
bearing loans to bank in relation to the balance
sheet total as of 31 Dec 2012 fell to 66.6%
compared to 67.6% (31 Dec 2011).
The decrease in equity as of 31.12.2012 is the
primary result of changes in the capital reserve
account as well as from currency differences.
Payments received on account 20,068 26,236 25,862
8,063
82,512
2,059,984
82,155
1,650,795
2,628
2,421
2,073
51,470
5,968
1,541,797
2,059,984
313,922
8,063
2,020,332
158,520
15,586
91,463
Total equity and liabilities
4,299
F. Deferred tax liabilities 2,529 2,421
E. Deferred Income 5,544
Other liabilities
2,988,9932,765,012
89,438 86,170
1,841,897
8,063B. Difference from capital consolidation
1,956,105Liabilities
C. 73,259
Liabilities to banks
Equity
546
I. Inventories
Balance Sheet (at 31.12.2012)
20122011
(proforma)
A.
110,284
2011
(as reported)
1,893,424
546
1,782,594
30,235
1,748,982
According to HGB (in TEUR)
I. Intangible assets 2,914
2,708,242Vessels
2,529,544
B.
18,010
2,776,6532,554,962Fixed Assets
2,988,993
92,109
2,765,012
73,124 94,160
12,681 5,987
22,504 34,254
Current Assets 194,709 204,278
III. Financial Assets
105,481II. Receivables and other assets
16,104
Prepayments and assets under construction 0 30,235
2,741,853
2,526,045
II. Tangible assets
719,512
D. Deferred tax assets 2,660 2,074
A.
III. Cash and cash equivalents
Total Assets
753,142
Deferred expensesC.
87,706
2,133,362D.
Provisions
40
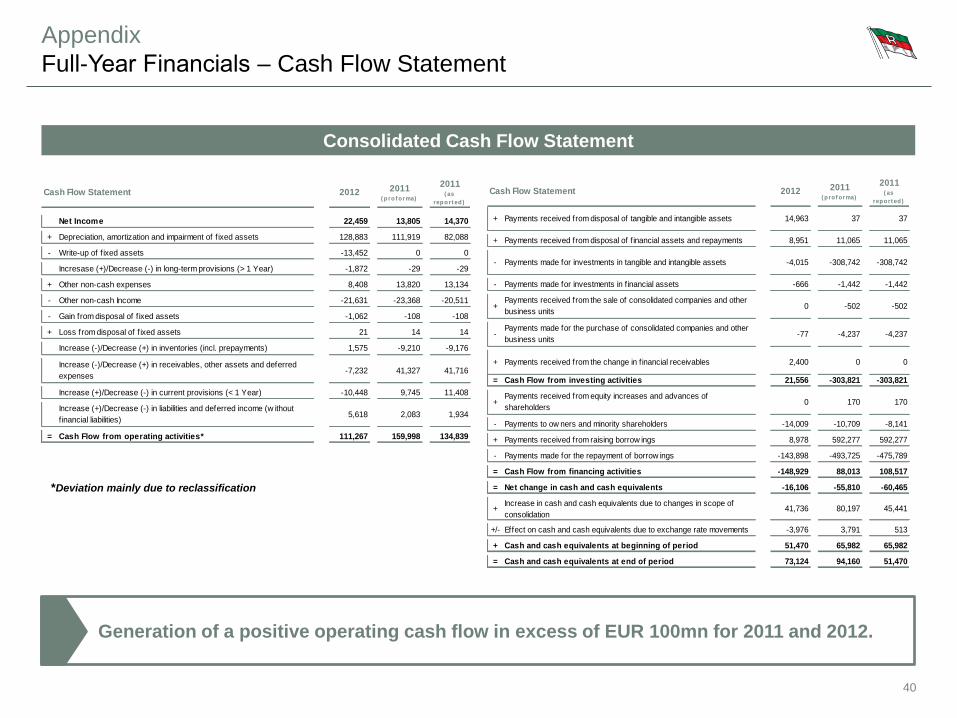
Generation of a positive operating cash flow in excess of EUR 100mn for 2011 and 2012.
Appendix
Full-Year Financials ‒ Cash Flow Statement
Consolidated Cash Flow Statement
+/- Effect on cash and cash equivalents due to exchange rate movements -3,976 3,791 513
Cash Flow from financing activities
= Cash and cash equivalents at end of period 73,124 94,160 51,470
+ Cash and cash equivalents at beginning of period 51,470 65,982 65,982
+Increase in cash and cash equivalents due to changes in scope of
consolidation 41,736
= Net change in cash and cash equivalents -16,106 -55,810 -60,465
80,197 45,441
- Payments to ow ners and minority shareholders -14,009 -10,709 -8,141
- Payments made for the repayment of borrow ings -143,898 -493,725 -475,789
+ Payments received from raising borrow ings 8,978 592,277 592,277
0 170 170
= Cash Flow from investing activities 21,556 -303,821 -303,821
-Payments made for the purchase of consolidated companies and other
business units -77 -4,237 -4,237
+ Payments received from the change in f inancial receivables 2,400 0 0
+Payments received from equity increases and advances of
shareholders
+Payments received from the sale of consolidated companies and other
business units 0 -502 -502
- Payments made for investments in f inancial assets -666 -1,442 -1,442
Payments received from disposal of f inancial assets and repayments 8,951 11,065 11,065
- Payments made for investments in tangible and intangible assets -4,015 -308,742 -308,742
Cash Flow Statement 2012 2011( p ro f o rma)
2011( as
report ed )
108,517= -148,929 88,013
+ Payments received from disposal of tangible and intangible assets 14,963 37 37
+
*Deviation mainly due to reclassification
+ Depreciation, amortization and impairment of f ixed assets 128,883 111,919 82,088
- Write-up of f ixed assets -13,452 0 0
Incresase (+)/Decrease (-) in long-term provisions (> 1 Year) -1,872 -29 -29
+ Other non-cash expenses 8,408 13,820 13,134
-9,210 -9,176
- Other non-cash Income -21,631 -23,368 -20,511
- Gain from disposal of f ixed assets -1,062 -108 -108
2,083 1,934
Cash Flow Statement 2012 2011( p ro f orma)
2011( as
report ed )
Increase (-)/Decrease (+) in receivables, other assets and deferred
expenses-7,232 41,327 41,716
Increase (+)/Decrease (-) in current provisions (< 1 Year) -10,448 9,745 11,408
+ Loss from disposal of f ixed assets 21 14 14
Increase (-)/Decrease (+) in inventories (incl. prepayments) 1,575
Net Income 22,459 13,805 14,370
= Cash Flow from operating activities* 111,267 159,998 134,839
Increase (+)/Decrease (-) in liabilities and deferred income (w ithout
f inancial liabilities) 5,618
41
Appendix
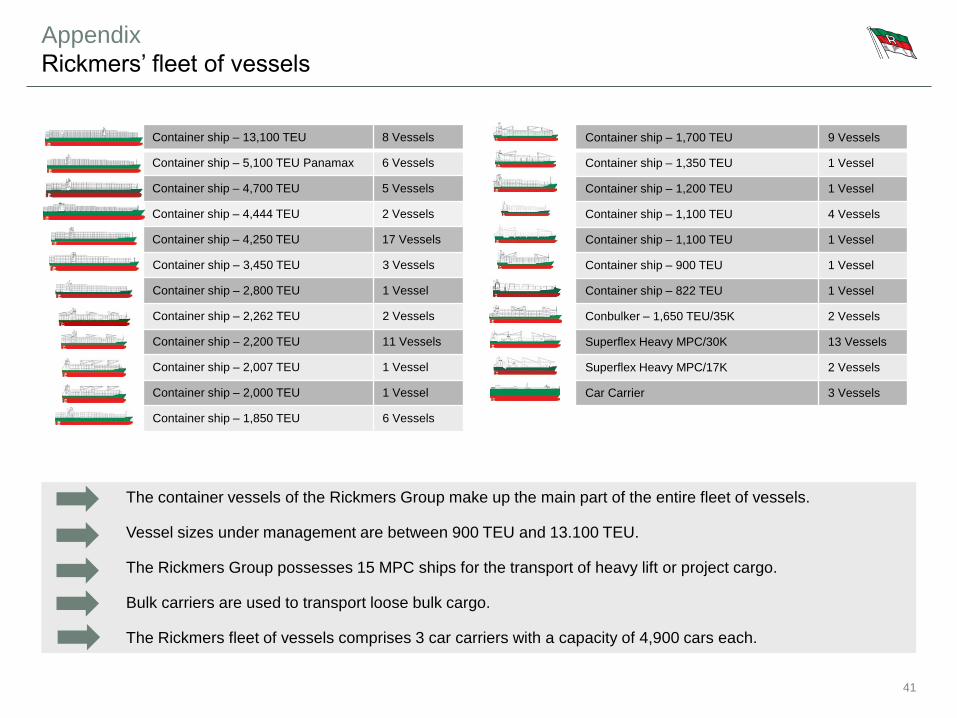
Rickmers’ fleet of vessels
The container vessels of the Rickmers Group make up the main part of the entire fleet of vessels.
Vessel sizes under management are between 900 TEU and 13.100 TEU.
The Rickmers Group possesses 15 MPC ships for the transport of heavy lift or project cargo.
Bulk carriers are used to transport loose bulk cargo.
The Rickmers fleet of vessels comprises 3 car carriers with a capacity of 4,900 cars each.
Container ship – 13,100 TEU 8 Vessels
Container ship – 5,100 TEU Panamax 6 Vessels
Container ship – 4,700 TEU 5 Vessels
Container ship – 4,444 TEU 2 Vessels
Container ship – 4,250 TEU 17 Vessels
Container ship – 3,450 TEU 3 Vessels
Container ship – 2,800 TEU 1 Vessel
Container ship – 2,262 TEU 2 Vessels
Container ship – 2,200 TEU 11 Vessels
Container ship – 2,007 TEU 1 Vessel
Container ship – 2,000 TEU 1 Vessel
Container ship – 1,850 TEU 6 Vessels
Container ship – 1,700 TEU 9 Vessels
Container ship – 1,350 TEU 1 Vessel
Container ship – 1,200 TEU 1 Vessel
Container ship – 1,100 TEU 4 Vessels
Container ship – 1,100 TEU 1 Vessel
Container ship – 900 TEU 1 Vessel
Container ship – 822 TEU 1 Vessel
Conbulker – 1,650 TEU/35K 2 Vessels
Superflex Heavy MPC/30K 13 Vessels
Superflex Heavy MPC/17K 2 Vessels
Car Carrier 3 Vessels
42
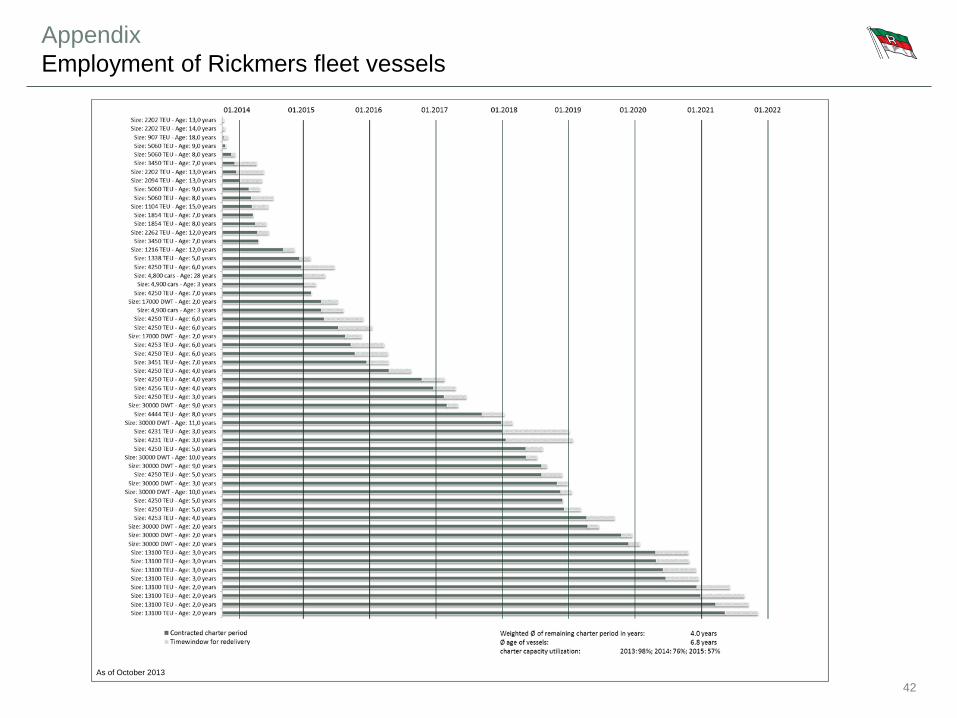
Appendix
Employment of Rickmers fleet vessels
As of October 2013