rietveld processing of phases in highly textured refractory - icdd
TRANSCRIPT

RIETVELD PROCESSING OF PHASES IN HIGHLY TEXTURED REFRACTORY STEELS
Jorge L. Garin and Rodolfo L. Mannheim
Universidad de Santiago de Chile Department of Metallurgical Engineering
Casilla 10233, Santiago, Chile
ABSTRACT
Quantitative phase analysis by means of X-ray diffraction Rietveld refinement was performed on cast heat-resistant steels of the HC (25Cr-3Ni) and HD (30Cr-6Ni) type. These kinds of alloys usually contain strong preferred orientations due to dendritic solidification of the austenitic and ferritic solid solution phases, which must be taken into account whether accurate processing of powder diffraction data is required. The X-ray powder diffraction data analysis was performed in such a way that the strong orientation effects caused by the solid solution components austenite and ferrite were adequately corrected by using the March-Dollase model. The results obtained indicate that among all the other compounds, a proper correction of the texture effects of the solid solution phases is mandatory to yield a successful matching of the calculated X-ray diffraction profile with the experimental data.
INTRODUCTION
A number of cast high-alloy stainless steels have been developed for a variety of service requirements among many industrial applications. These materials, currently known as heat-resistant steels or simply refractory steels, compose a unique family of Fe-Cr-Ni alloys having excellent mechanical properties such as toughness, strength, and corrosion resistance for service at elevated temperatures, normally above 873 K [1-3]. Depending upon the chromium and nickel content, the microstructure of the casting can result in a fully austenitic (γ), ferritic (α), or duplex-phase distribution, together with a fine dispersion of carbides or intermetallic compounds in the matrix [4], which increases high-temperature strength considerably. Alloys with carbon contents greater than 0.20 wt % show chromium carbides in the microstructure, regardless of solution treatment. In ferritic or partly ferritic steels the ferrite pools undergo a transformation to the intermediate phase σ and, to a lesser extent, to phase χ when the alloy is heated above 813 K. Particularly the formation of sigma-phase can be very detrimental in many applications because of its influence on the mechanical properties of the material; in fact, embrittlement and corrosion penetration may result. Sigma-phase usually precipitates when the alloy is subjected to lengthy heating in the range from 813 K to 1173 K [5-7]. This phase is a complex intermetallic compound of Fe and Cr, which considerably affects the toughness and creep properties. The structure type of the compound is based upon an ideal stoichiometric composition AX2, Pearson’s code tP30, and space group P42/mnm [8,9]. Since the chemical composition in the Fe-Cr system is approximately Cr6Fe7, the Fe and Cr atoms are disorderly located with fractional site occupation factors among the suitable equivalent positions in the space group, disclosing a polyhedral array of the Frank-Kasper type. Sigma preferably nucleates along grain boundaries of δ-ferrite-austenite, α-ferrite-austenite, or δ-ferrite-δ-ferrite. Figure 1 shows a phase diagram of
Copyright ©JCPDS - International Centre for Diffraction Data 2005, Advances in X-ray Analysis, Volume 48. 82 ISSN 1097-0002

This document was presented at the Denver X-ray Conference (DXC) on Applications of X-ray Analysis. Sponsored by the International Centre for Diffraction Data (ICDD). This document is provided by ICDD in cooperation with the authors and presenters of the DXC for the express purpose of educating the scientific community. All copyrights for the document are retained by ICDD. Usage is restricted for the purposes of education and scientific research. DXC Website – www.dxcicdd.com
ICDD Website - www.icdd.com
ISSN 1097-0002
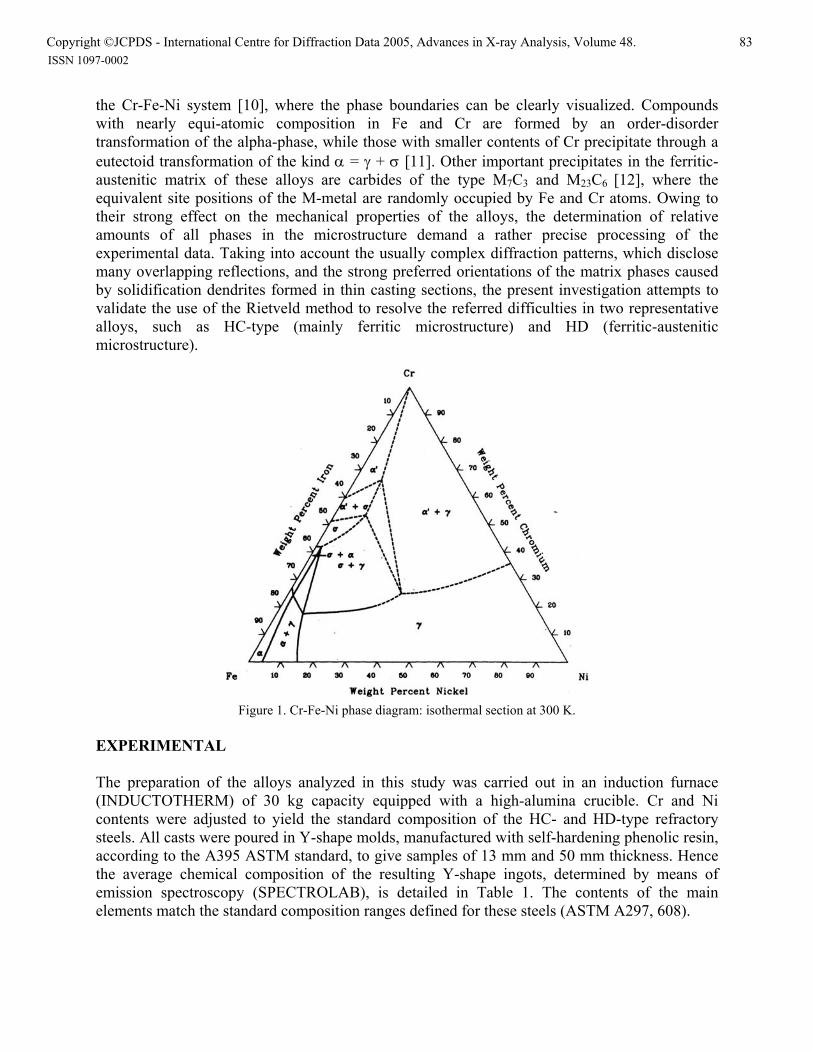
the Cr-Fe-Ni system [10], where the phase boundaries can be clearly visualized. Compounds with nearly equi-atomic composition in Fe and Cr are formed by an order-disorder transformation of the alpha-phase, while those with smaller contents of Cr precipitate through a eutectoid transformation of the kind α = γ + σ [11]. Other important precipitates in the ferritic-austenitic matrix of these alloys are carbides of the type M7C3 and M23C6 [12], where the equivalent site positions of the M-metal are randomly occupied by Fe and Cr atoms. Owing to their strong effect on the mechanical properties of the alloys, the determination of relative amounts of all phases in the microstructure demand a rather precise processing of the experimental data. Taking into account the usually complex diffraction patterns, which disclose many overlapping reflections, and the strong preferred orientations of the matrix phases caused by solidification dendrites formed in thin casting sections, the present investigation attempts to validate the use of the Rietveld method to resolve the referred difficulties in two representative alloys, such as HC-type (mainly ferritic microstructure) and HD (ferritic-austenitic microstructure).
Figure 1. Cr-Fe-Ni phase diagram: isothermal section at 300 K.
EXPERIMENTAL The preparation of the alloys analyzed in this study was carried out in an induction furnace (INDUCTOTHERM) of 30 kg capacity equipped with a high-alumina crucible. Cr and Ni contents were adjusted to yield the standard composition of the HC- and HD-type refractory steels. All casts were poured in Y-shape molds, manufactured with self-hardening phenolic resin, according to the A395 ASTM standard, to give samples of 13 mm and 50 mm thickness. Hence the average chemical composition of the resulting Y-shape ingots, determined by means of emission spectroscopy (SPECTROLAB), is detailed in Table 1. The contents of the main elements match the standard composition ranges defined for these steels (ASTM A297, 608).
Copyright ©JCPDS - International Centre for Diffraction Data 2005, Advances in X-ray Analysis, Volume 48. 83 ISSN 1097-0002

Table 1. Chemical composition of the samples (wt. %).
Sample C Cr Ni Si Mn P S Mo HC 0,53 25,02 4,26 0,66 0,43 0,05 0,04 0,10 HD 0,36 31,23 6,08 0,43 0,38 0,04 0,05 0,14
Specimens suitable for heat treatment, light microscopy, and X-ray diffraction experiments, of dimensions 45 × 25 × 5 mm3, were machined from the test section of the Y-blocks; the observation surfaces were prepared by typical metallographic techniques, up to wet polishing with alumina of 0.05 µm particle size. The heat treatment processes carried out to induce sigma-phase precipitation consisted of heating the samples at 1053 K for various periods of time, in the range from 1 to 104 hours; for the sake of the present work, two representative samples have been considered, i.e. 24 hour treatment for the HC-steel and 80 hours for the HD-steel. The metallography carried out on the heat-treated specimens revealed the microstructures shown in Figures 2(a) and 2(b); the matrix is composed of ferrite (gray background), containing a distribution of big austenite isles (white zones). The precipitation of sigma-phase can be visualized along the ferrite-austenite grain boundaries in Figure 2(a) and Figure 2(b), while some precipitation has also occurred inside the grains as shown only in Figure 2(a). The darkest small areas in the pictures correspond to metal carbides which form eutectic mixtures in Figure 2(a) and isolated carbides in Figure 2(b). On the other side, the orientation effects of the austenite grains are clearly illustrated in Figure 2(b). (a) (b)
Figure 2. Microstructure of the samples: (a) HC-steel, (b) HD-steel. The X-ray powder diffraction data were collected on a SIEMENS D5000 diffractometer equipped with a diffracted-beam graphite-monochromator, CuKα radiation (λ=0.15406 nm, 40 kV, 30 mA), Bragg-Brentano geometry, θ-θ scan, sample spinning, divergence slit of 1 mm, antiscatter slit of 1 mm, and receiving slit of 0.1 mm. RESULTS The Rietveld refinements were performed based upon typical measurement and global parameters, using the distribution package for DBWS-9807a system of programs [13,14]. The
Copyright ©JCPDS - International Centre for Diffraction Data 2005, Advances in X-ray Analysis, Volume 48. 84 ISSN 1097-0002

powder diffraction patterns of both specimens resulted in strong preferred orientation effects of the austenite and ferrite solid solution phases along [123] and [111] directions respectively. It is well known that body-centered and face-centered cubic metals usually have their columnar grains with [100] normal to the mold wall and parallel to the direction of the heat flow. However, there are exceptions; when the ideal direction of the heat flow deviates from being normal to the wall, the resulting orientations are not typical. In the present work this phenomenon was caused by the insertion of chilling copper plates in the bottom of the mold, giving rise to preferred orientations of the type [123] and [111]. Hence the correction term in the Rietveld refinement utilized the March-Dollase function [15], calculated as: PK = (G2
1 cos2 α + (1/G1) sin2 α)-3/2 (1) where α is the angle between the normal to the diffracting plane and the presumed cylindrical-symmetry axis of the texture, and G1 is a numerical refinable parameter. This model was privileged over the Rietveld-Toraya model, where the G1 adjustable parameter tends to be highly correlated with the scale parameter if preferred orientations are strong. Due to the somewhat simpler formation of dendrites in the castings, the uniaxial March-Dollase model is applicable to cast steels, and so has been extensively used by the authors within this scope. Conversely, preferred orientations resulting from cold work will demand a more-complex texture model where the orientation distribution function must be taken into account. The pseudo-Voigt function was used for the simulation of the peak shapes [16]. Finally, the background was modeled by a 3rd order polynomial in 2θ with refinable coefficients. A total of five phases were considered in the refinement process, namely Fe(Cr,Ni) ferrite, Fe(Cr,Ni) austenite, sigma phase, Cr23C6, and Cr7C3. The crystal data utilized in the calculation were those reported from single-crystal analysis of sigma-phase [17,18], Cr23C6 [19], and Cr7C3 [20]. At the first step, scaling factors, overall temperature factors, background, lattice constants and profile parameters were fitted, then preferred orientations parameters were taken into account due to marked texture effects of the ferritic and austenitic phases. Figure 3 illustrates the final Rietveld plot of the HC sample. Although not shown here, similar results were obtained from the HD steel. Afterward, the content of the component phases of the microstructure, as calculated through the expression [21]:
is detailed in Table 2, together with the resulting numerical criteria of fit, Rp and Rwp [22].
Table 2. Content of phases in the microstructure (mass %).
Sample α γ σ Cr23C6 Cr7C3 Rp Rwp
HC 75.41 13.40 9.81 0.11 1.27 0.09 0.13
HD 50.10 13.2 38.2 0.12 1.13 0.08 0.12
∑=
= N
iii
ppp
ZMVS
ZMVSW
1)(
)( (2)
Copyright ©JCPDS - International Centre for Diffraction Data 2005, Advances in X-ray Analysis, Volume 48. 85 ISSN 1097-0002

Figure 3. Final Rietveld plot of the HC sample.
CONCLUDING REMARKS Two samples of different heat-resistant steels with severe preferred orientations of the solid solution component phases were quantitatively analyzed by means of Rietveld refinement. The main advantage of this processing was the use of the March-Dollase model for correction of the strong texture effects on the diffraction pattern, which yielded the lower R-values and much better represented the relative amounts of phases in the samples. This statement is based upon comparison to poor-quality data obtained by means of computer-aided microscopy, where image analysis depends greatly upon the ability of the optical system to resolve the subject in question. In this study, the presence of more than three phases made it very hard to obtain accurate results. ACKNOWLEDGEMENTS Support for this work was provided by Universidad de Santiago de Chile and FONDECYT Project N° 1020058. The authors greatly appreciate this assistance. REFERENCES [1] Davis, J.R., Heat-Resistant Materials, American Society for Metals Specialty
Handbook: Materials Park, 1997, 87-200. [2] Davis, J.R., Stainless Steels, American Society for Metals Specialty Handbook:
Materials Park, 1994, 66-88.
Copyright ©JCPDS - International Centre for Diffraction Data 2005, Advances in X-ray Analysis, Volume 48. 86 ISSN 1097-0002

[3] Wiefer, P.F., Steel Casting Handbook, Steel Founders’ Society of America: Rocky River, 1980, 19-1-19-11.
[4] Sasmal, B., Metall. Mater. Trans., 1999, 30A, 2791-2801. [5] Schwind, M., Källqvist, J., Nilson, J.O., Ågren, J. and Andrén, H.O., Acta Mater., 2000,
48, 2473-2471. [6] Sopousek, J. and Kruml, T., Scr. Mater., 1996, 35, 689-693. [7] Shortsleeve, J. and Nicholson, M.E., Trans. ASM, 1951, 43, 142-157. [8] Sinha, A.K., Progr. Mater. Sci., 1972, 15, 104-109. [9] Pearson, W.B., The Crystal Chemistry and Physics of Metals and Alloys, Wiley
Interscience: New York, 1972, 673-676. [10] Baker, H., Alloy Phase Diagrams, American Society for Metals: Materials Park, 1992,
3.44. [11] Tseng, C., Thompson, S., Mataya, M. and Krauss, G., Metall. Trans., 1994, 25A, 1147-
1158. [12] Roberts, G.A. and Cary, R.A., Tools Steels; American Society for Metals: Materials
Park, 1980, 193-198. [13] Young, R.A., J. Appl. Crystallogr., 1995, 10, 366-367. [14] Young, R.A., Larson, A.C. and Paiva-Santos, C.O., Rietveld Analysis of X-Ray and
Neutron Powder Diffraction Patterns, Program DBWS-980a, Georgia Institute of Technology, 1999, Atlanta.
[15] Dollase, W.A., J. Appl. Crystallogr., 1986, 19, 267-272. [16] Young, R.A. and Wiles, D.B., J. Appl. Crystallogr., 1982, 15, 430-438. [17] Yakel, H.L., Acta Crystallogr., 1983, B39, 20-28. [18] Yakel, H.L., Acta Crystallogr., 1983, B39, 28-33. [19] Bowman, A.L., Arnold, G.P., Storms, E.K. and Nereson, N.G., Acta Crystallogr., 1972,
B28, 3102-3103. [20] Rouault, M.A., Herpin, P. and Fruchart, M.R., Ann. Chim., 1970, 5, 461-470. [21] Hill, R.J., Powder Diffr., 1991, 6, 74-77. [22] Young, R.A., The Rietveld Method, International Union of Crystallography, Oxford
University Press: Oxford, 1993, 21-24.
Copyright ©JCPDS - International Centre for Diffraction Data 2005, Advances in X-ray Analysis, Volume 48. 87 ISSN 1097-0002