rimlen eceived 15.1.2018. seismic risk assessment using
TRANSCRIPT

Građevinar 5/2019
375
Primljen / Received:
Ispravljen / Corrected:
Prihvaćen / Accepted:
Dostupno online / Available online:
GRAĐEVINAR 71 (2019) 5, 375-387
Authors:
Assist.Prof. Ferhat Pakdamar, PhD. CEGebze Technical University, TurkeyFaculty of [email protected]
Fatma İlknur Kara, PhD. CEGebze Technical University, TurkeyFaculty of [email protected]
Yaşasın Eryılmaz, PhD. CEGebze Technical University, TurkeyFaculty of [email protected]
Ali Yeşilyurt, MCEGebze Technical University, TurkeyFaculty of [email protected]
Research paper
Ferhat Pakdamar, Fatma İlknur Kara, Yaşasın Eryılmaz, Ali Yeşilyurt
Seismic risk assessment using updated hazard and building inventory data
This study focuses on the assessment of potential seismic impacts from two active segments of the North Anatolian Fault running across the Sea of Marmara. Two seismic scenarios with moment magnitudes of Mw 6.9 and Mw 6.7 were developed for individual segment rupture, and the third one with the magnitude of Mw 7.2 was developed for simultaneous activation of both segments. 15,871 existing buildings were grouped into 10 main classes. Each class was assigned a respective capacity curve and a set of fragility curves that determine the probability of exceeding one of the following five damage states: none, slight, moderate, extensive, and complete.
Key words:
seismic scenario, seismic risk assessment, building damage, capacity curve, fragility curve
Prethodno priopćenje
Ferhat Pakdamar, Fatma İlknur Kara, Yaşasın Eryılmaz, Ali Yeşilyurt
Ocjena seizmičkog rizika primjenom novih podataka o rizicima i stambenom fondu
U ovom se radu analizira potencijalno seizmičko djelovanje dvaju aktivnih segmenata sjevernoanatolijskog rasjeda u Mramornom moru. Istražena su dva seizmička scenarija pojedinačnih magnituda 6,9 i 6,7 za slučaj pojedinačnih aktivacija rasjeda, te treći scenarij magnitude 7,2 za slučaj istovremene aktivacije oba rasjeda. Skupina postojećih građevina sastavljena od 15.871 zgrade svrstana je u deset osnovnih kategorija. Svakoj je kategoriji pripisana odgovarajuća krivulja otpornosti i niz krivulja oštetljivosti koje određuju vjerojatnost prekoračenja jednog od pet stupnjeva oštećenja: nikakvo, neznatno, manje, srednje, jako i potpuno.
Ključne riječi:
seizmički scenarij, ocjena seizmičkog rizika, oštećenje zgrade, krivulja otpornosti, krivulja oštetljivosti
Vorherige Mitteilung
Ferhat Pakdamar, Fatma İlknur Kara, Yaşasın Eryılmaz, Ali YeşilyurtBewertung der seismischen Risiken durch Anwendung neuer Daten über Risiken und den Wohnungsfond
In dieser Abhandlung wird die potenzielle seismische Auswirkung zweier aktiver Segmente in der nordanatolischen Verwerfung im Marmarameer analysiert. Für den Fall einzelner Aktivierung der Verwerfungen wurden zwei seismische Szenarien einzelner Magnituden 6,9 und 6,7 untersucht, und das dritte Szenario der Magnitude 7,2 für den Fall einer gleichzeitigen Aktivierung beider Verwerfungen. Die Gruppe der bestehenden Gebäude besteht aus 15.871 Gebäuden in zehn Grundkategorien eingeteilt sind. Jeder Kategorie wird eine entsprechende Widerstandskurve und eine Reihe von Beschädigungskurven zugeordnet, welche die Wahrscheinlichkeit der Überschreitung einer der fünf Beschädigungsstufen festlegen: keine, gering, weniger, mittel, schwer und vollständig.
Schlüsselwörter:seismisches Szenario, Bewertung des seismischen Risikos, Gebäudebeschädigung, Widerstandskurve, Beschädigungskurve
Seismic risk assessment using updated hazard and building inventory data
15.1.2018.
8.10.2018.
3.11.2018.
10.6.2019.
DOI: https://doi.org/10.14256/JCE.2329.2018
brought to you by COREView metadata, citation and similar papers at core.ac.uk
Građevinar 5/2019
376 GRAĐEVINAR 71 (2019) 5, 375-387
Ferhat Pakdamar, Fatma İlknur Kara, Yaşasın Eryılmaz, Ali Yeşilyurt
1. Introduction
Each year, natural disasters such as earthquakes, floods, storms, droughts and wild fires generate significant loss of life and property. For example, several major earthquakes occurred in recent years in China, Pakistan, Chile, Afghanistan, Tajikistan, Turkey, etc. The 2015 Mw 7.8 earthquake in Nepal caused 8,831 fatalities and about 100,000 injuries requiring hospitalization. At the same time, about 500,000 buildings were destroyed and 269,000 buildings were damaged. Also, landslides and avalanches occurred as aftershocks of the earthquakes and caused 218 additional casualties. The total economic loss was about US$ 4,8 billion [1]. The Istanbul Metropolitan Municipality (IMM) is also a well-known earthquake prone region that was the scene of a number of devastating earthquakes. One of them is the 1999 Mw 7.4 Kocaeli earthquake that destroyed about 250,000 buildings in total [2]. Although the epicentre distance to downtown Istanbul was 85 km, as many as 3,073 buildings were damaged beyond repair, 13,339 were moderately damaged, and 12,455 buildings suffered slight damage. Furthermore, 454 people died and another 1,880 persons were injured [3]. The total economic loss from this earthquake was reported to range between US$ 16 to 20 billion [4].Seismic risk assessment, considered herein as a convolution of seismic hazard, assets at risk, and respective vulnerability, is an important factor in the mitigation of seismic losses, as it provides the knowledge needed for an informed decision-making [5]. Conducting risk assessments in earthquake prone regions is the first necessary step towards a comprehensive planning of emergency actions, such as the first-aid points and shelters, as well as towards a long term mitigation planning. The evaluation of potential earthquake impacts in a given region, in terms of physical damage and economic and social losses, is however not an exact process. It is subject to important uncertainties of both epistemic and aleatory nature. The epistemic uncertainty is related to the lack of knowledge on the seismic hazard potential of the region, local site conditions, and dynamic response of buildings, and this in each phase of seismic risk assessment [6]. An example of aleatory uncertainty can be two residential units of the same structural type and built in the same manner, which suffered significantly different damage although they were located in the same neighbourhood and were exposed to practically the same shaking intensities. All these factors related to the potential seismic event and structural characteristics have to be taken into account and analysed systematically during the risk assessment process. Therefore, the seismic performance of the existing buildings has to be determined as accurately as possible to lower the earthquake hazard in the studied region. This slow process of learning and adaptation contributes to the overall risk reduction and to an increase in the social awareness about disaster hazard.
Seismic risk assessments have already been carried out for many cities, e.g., Thessaloniki [7], Barcelona [8], Algiers [9], Lorca [10], Bishkek [11], Byblos [12], Tabriz [13], Quebec [14], etc. [15, 16]. Regional seismic risk assessment studies can also be found in the literature about various methods that are used for scenario-based earthquakes with deterministic and probabilistic earthquake hazard [23-28]. Earthquake damage and loss estimations were also conducted for the IMM, where the seismic hazard and expected risk are known to be high [17-19]. The first major comprehensive project in terms of earthquake risk assessment and loss mitigation was the joint study conducted by the IMM and the Japan International Cooperation Agency (JICA) [18]. The aim of this project focusing on Istanbul was to compile seismic microzoning maps that may form the basis for the seismic disaster prevention/damage reduction plan for the city of Istanbul and its surroundings. The project also provides advice relating to earthquake resistant urbanization. Another similar study was carried out by the Kandilli Observatory and the Institute of Earthquake Research [17] for Istanbul. With a population of some 14 million, the IMM is not only the most populated metropolitan area in Turkey, but also its fastest growing urbanized region.The main objective of this study is to conduct an update of the potential seismic impact on the township of Tuzla. The township of Tuzla, considered herein as a case-study area, is one of the highly industrialized and densely populated parts of the IMM. It is understood that such fast growing regions have a constantly changing building stock. In addition, the knowledge about the seismic hazard is gradually evolving with new insights from observation of the activities at the North Anatolian Fault Line (NAF), distanced about 10-15 km from downtown Tuzla. The potential physical and social losses in case of a future strong earthquake event can be high. They may affect the local industrial output and a full scale crisis for Turkish economy. These aspects impose the need for regular and consistent updating of the assessments on potential seismic impact. Another important objective of this study is to take into account the fault uncertainties related to two segments of the NAF active zone.The first section contains the aim of the study, problem identification, and literature review. Some explanations about the study area are given in the second section. Methodologies for Seismic Risk Assessment and Seismic Hazard Assessment are defined in Section 3 and Section 4, respectively. The building inventory of the study area is detailed in Section 5. A brief explanation of the seismic vulnerability assessment method and the damage assessment procedure is given in Section 6. The information about software used, shake maps, maps with distribution of damaged buildings, building damage percentages, injuries depending on possible earthquake scenarios, is given in Section 7. The results obtained are discussed in Section 8.

Građevinar 5/2019
377GRAĐEVINAR 71 (2019) 5, 375-387
Seismic risk assessment using updated hazard and building inventory data
2. Study area
The township of Tuzla is located at the far eastern boundary of the IMM on the Asian side, bordering the city of Kocaeli (Figure 1). It has a 13 km long coastline along the Sea of Marmara, distanced about 10-15 km from the active NAF zone. With its ports, shipyards and numerous well-organized industrial zones, Tuzla contributes significantly to the economic performance of the IMM and Turkey. Major industrial zones are shown in turquoise colour in Figure 1. The growing attraction due to job opportunities in the industrial zones has led to migration from other parts of Istanbul as well as from other cities. In the last 15 years, the urban area of Tuzla has increased considerably in response to increased demands for new housing developments. The population growth rate was also high, amounting to about 4.3 %/year. Comparing the 2000 census data with those of 2016, the population increased from 123,716 to 242,232 inhabitants [20]. Presently, the population of Tuzla accounts for 1.64 % of the total IMM population. It is predicted that, in the years to come, the population will continue to rise at the same rate, together with the number of housing developments in the region [21].The western extension of the Kocaeli Mountains chain, on the Istanbul Anatolian Coast, includes the Tuzla township. The southern hills form numerous individual valleys and watersheds with outlets in the Marmara Sea. They also separate the Tuzla urban area thus forming a loosely connected neighbourhood. At the seacoast, the town has also a segmented shape with its bays and capes, the farthest being the Cape of Tuzla and the Cape of Sarp. The gently rolling relief dips toward the seacoast with slopes ranging between 2 and 4 %. The altitudes increase with the distance from the seacoast. The maximum altitude of about 90 meters above sea level is found to the northeast of the region. Regions with the slope of <10 % are preferred for the development of urban areas, transport facilities, and industrial infrastructure [21].
3. Methodology for seismic risk assessment
The standard HAZUS [6] based assessment method was used in this study for earthquake risk assessment. The procedure consists of six main steps (Figure 2).
Figure 2. Operation flowchart of building damage estimation [27]
First step: This step involves investigation of seismic hazard in the region. The seismic scenarios can be considered as deterministic earthquake or probabilistic hazard with a given return period. This depends on the assumed geological structure, seismological data for the region, seismic sources and observed seismic activity [23-26].Second step: The potential amplification of the seismic shaking due to local site effect is considered in this step. The impact of local soil conditions can be inferred from observations made during past earthquakes. The ground motion is Figure 1. Location of town of Tuzla [22]

Građevinar 5/2019
378 GRAĐEVINAR 71 (2019) 5, 375-387
Ferhat Pakdamar, Fatma İlknur Kara, Yaşasın Eryılmaz, Ali Yeşilyurt
generated first at the rock-stiff soil boundary with shear wave velocity Vs = 760 m/s (site B/C) and then amplified based on local soil parameters to obtain the intensity of shaking activity on the ground surface [6].Third step: The building inventory in the region can be studied as aggregated on computational geographical units (census or dissemination units, regular grid cells, etc.) or at detailed building-by-building level. The buildings are categorized in broad classes according to their load-bearing structural system, year of construction, number of storeys, material types, construction quality, and seismic design levels. The building inventory is made using the Geographical Information System (GIS) software which stores and displays spatial distribution of building categories in the region.Fourth step: This step involves setting up the building capacity curves, which determine the building performance for the base shear force. Capacity curves are obtained for each building category and are used in the determination of the performance point. The Capacity Spectrum Method (CSM) is applied to combine the capacity curve with the seismic input (demand spectrum). Their intersection point is referred to as performance point.Fifth step: The building fragility curves determine the probability of exceedance of different performance levels of a given building category under seismic loading. In this case, it is the spectral displacement of the performance point obtained in the previous step. Four damage thresholds are defined: slight, moderate, extensive, and complete.Sixth step: In the last step, a spatial distribution map is generated with the buildings’ damage states or damage ratios map.
This steps briefly describe the approach applied to conduct the seismic risk assessment in the town of Tuzla.
4. Seismic hazard assessment
The northern part of Turkey is located on a very active and complex geographical structure. The region on which the seismic hazard analysis is made extends across parts of the NAF zone in the Sea of Marmara. NAF is one of the fastest moving and the most active strike-slip fault in the world [28]. NAF activity is a result of the interaction between the Arabian plate to the south (with rapid compression activity reaching 25 mm per year) and the Eurasian plate to the north (almost without any activity). Due to this
interaction, NAF has a high seismic activity and moves rapidly towards the west [29]. In 2017, Turkey’s Mineral Research and Exploration Directorate (MTA) published the Active Fault Map of Turkey [30]. According to this map, there are two major fault segments associated to the NAF zone in the Sea of Marmara. They are referred to as Adalar and Avcılar (Figure 3).A map [31] showing the distribution of earthquake magnitudes (Ms > 6.8) recorded in the last 2,000 years along the NAF zone in the Marmara region is given in Figure 4. It can be observed from these historical earthquake records that the Adalar and Avcılar segments are the ones behind the strong Istanbul earthquakes that occurred in 1509 and 1766, respectively. Currently, it is uncertain when these faults will activate again, or whether they could rupture individually or both at the same time. In any case, it is expected that the next strong earthquake(s) that could occur on the Avcılar and Adalar segments would have considerable negative effects on the region.a) When will a rupture occur on the Avcılar and Adalar segments?b) Whether these two segments will rupture at the same time?
For the present study, three different scenarios were generated based on the uncertainty for an individual or combined rupture. The first scenario, referred to as S1, considers that only the Adalar Segment will be activated across a rupture length
Figure 4. Active faults in Marmara Region and distribution map of large earthquake epicentres (Ms > 6.8) for which records are available. Faults that ruptured in the 20th century are marked in red [30]
Figure 3. Active fault line in the Sea of Marmara and position of Tuzla [30], The region marked with red circle represents the town of Tuzla that is selected as study area

Građevinar 5/2019
379GRAĐEVINAR 71 (2019) 5, 375-387
Seismic risk assessment using updated hazard and building inventory data
of about 41.3 km. The second scenario involves the Avcılar Segment, referred to as S2, with 25 km long rupture zone. The third scenario assumes that both S1 and S2 will rupture at the same time. According to Stein et al. [32], the fault depth for all three scenarios ranges from 12.5 to 25 km, as illustrated in Figure 5.
Figure 5. Secular slip model used to calculate the loading of the NAF system - Steady deep slip below 12.5 km, as inferred from GPS observations [32]
Several empirical equations proposed in the literature enable correlation between the earthquake magnitude and dimensions of the active fault segment (rupture zone). They take into account the plate movement and sliding dynamics, where the length of the fault is referred to as “L” and the area as “A”. The maximum earthquake magnitudes that may occur applying the considered empirical equations for the S1, S2 and S3 scenarios are given in Table 1.
Table 1. Earthquake magnitudes that may occur for three scenarios
The disparate estimates of magnitudes shown in Table 1 are due to different approaches used for assuming the tectonic structure of NAF. The empirical equations proposed by Hanks and Bakun [33] and Field et al. [34] in the study UCERF2 take into account the area of the fault segment. On the other hand, Wesnousky [35] calculates the magnitude by using the estimated length of rupture only. Assuming a simple arithmetic average, it can be predicted that the maximum possible earthquake moment magnitudes will be: Mw = 6.9
for S1 scenario, Mw = 6.7 for S2 scenario, and Mw = 7.2 for S3 scenario, provided that both S1 and S2 segments rupture together (Table 1). The deterministic approach was chosen to determine the damage caused by an earthquake, i.e. the probabilistic approach is not the subject of this study.
5. Building inventory
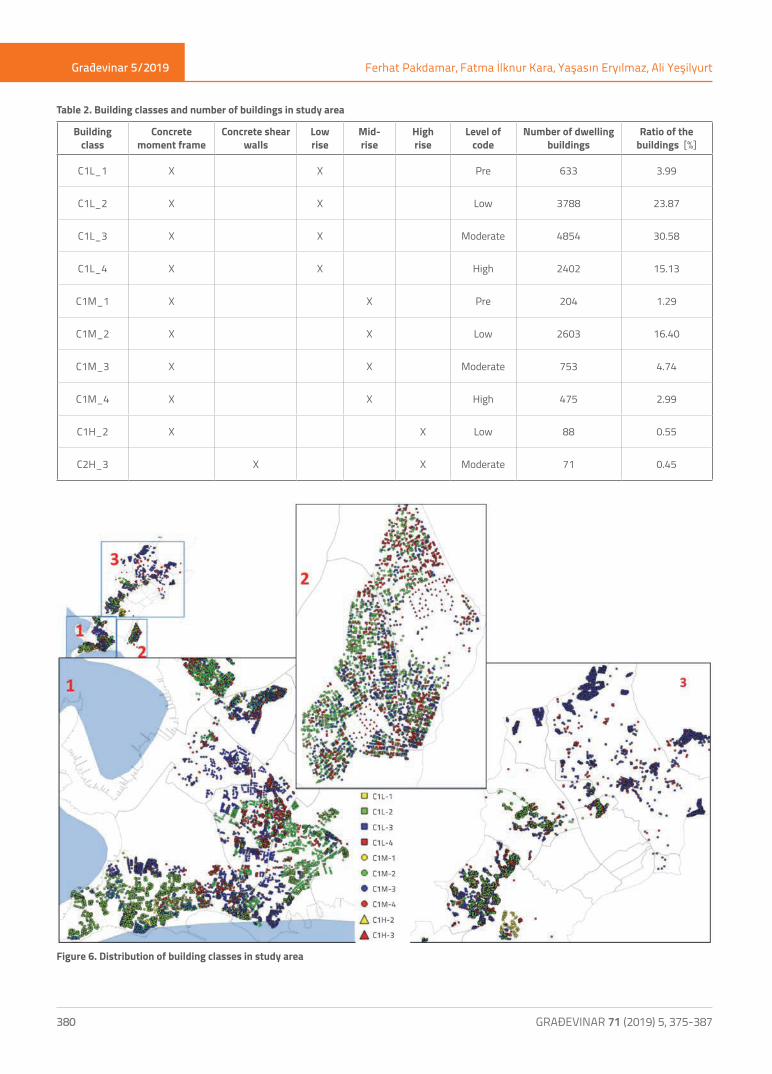
Only residential buildings were taken into account in this study. Other facilities, such as industrial facilities, transport facilities (roads, highways and railways), lifelines (pipelines), and other infrastructure, were not considered and are beyond the scope of the study. A detailed building inventory was made, and the information on building parameters used as input for seismic risk assessment, was stored in a digital database. Among other information, the database contains parameters such as the number of storeys, occupancy (residential, commercial, educational, industrial, etc.), structural type, quality of construction (code level), etc. The coordinates of the centroid of the footprint of each building were recorded first. The latitudes and longitudes were then converted to the World Coordinate System (WCS) using GIS. A total of 15,871 buildings were selected for analysis, out of approximately 30,000 existing buildings. The distribution of population was determined by calculating the number of dwellings per building and the total number of residents obtained from 2016 population census [20]. Housing areas were also identified as land parcels, each identified by its own identification number. They contained geological, geotechnical and geophysical information needed for microzoning and analysis of potential amplification of seismic shaking.The selected buildings were categorized into 10 broad structural classes in accordance with HAZUS [6]. First, the buildings were sorted out by their occupancy. Residential buildings take up about 52 % of the building inventory. Structural types were then analysed according to the dominant material and lateral load resisting systems. The building classification scheme proposed in HAZUS was retained for this study [6]. According to this classification, the dominant structural material in the study area is C: concrete. Lateral load resisting systems are “moment frames” or “shear walls”. The height of the building can be: low-rise with ≤3 storeys (L), mid-rise with 3-7 storeys (M), and high-rise with ≥ 8 storeys (H). The quality of the construction (the design code) is pre-code (P), low-code (L), moderate-code (M), and high-code (H). For instance, C1L_3 refers to the low-rise reinforced concrete moment frame with low-code. Less frequent structural types, such as steel buildings, were ignored to simplify the analyses. The considered classes and the number of buildings are presented in Table 2.The spatial distribution of the building classes in the study area is shown in Figure 6.
Reference Empirical formulas S1(Mw)
S2(Mw)
S3(Mw)
Hanks & Bakun [33] Mw = 4/3log(A)+(3.07±0.04) 6.8 6.7 7.3
Field et al. [34] Mw = 4.2775×A0.0726 6.8 6.7 7.2
Wesnousky [35] Mw = 5.56+0.87log(L) 7.0 6.8 7.2
Mean 6.9 6.7 7.2
Građevinar 5/2019
380 GRAĐEVINAR 71 (2019) 5, 375-387
Ferhat Pakdamar, Fatma İlknur Kara, Yaşasın Eryılmaz, Ali Yeşilyurt
Table 2. Building classes and number of buildings in study area
Figure 6. Distribution of building classes in study area
Building class
Concrete moment frame
Concrete shear walls
Low rise
Mid-rise
Highrise
Level of code
Number of dwelling buildings
Ratio of the buildings [%]
C1L_1 X X Pre 633 3.99
C1L_2 X X Low 3788 23.87
C1L_3 X X Moderate 4854 30.58
C1L_4 X X High 2402 15.13
C1M_1 X X Pre 204 1.29
C1M_2 X X Low 2603 16.40
C1M_3 X X Moderate 753 4.74
C1M_4 X X High 475 2.99
C1H_2 X X Low 88 0.55
C2H_3 X X Moderate 71 0.45
Građevinar 5/2019
381GRAĐEVINAR 71 (2019) 5, 375-387
Seismic risk assessment using updated hazard and building inventory data
6. Methodology of vulnerability analysis
Preciado Orduña [36] classified the seismic vulnerability assessment methods in the following three main categories: empirical, analytical, and hybrid methods. This classification is based on the sources of damage data. If the derived data is obtained from post-earthquake questionnaires, it is empirical, if it is obtained after an analytical simulation, it is analytical, and if the data obtained are from a combination of the previous two methods, then it is a hybrid assessment method. Empirical seismic assessment methods are based on observation and data collection techniques [37]. Analytical methods are based on more complicated studies such as nonlinear modelling of structural system, probabilistic assessment of earthquake data, etc. These concepts make the approach expensive and are therefore better suited for smaller areas or for a single structure. In this study, vulnerability analysis is performed using the analytical method. If making numerical simulation is more difficult, then it may require calibration of analytical method results with those of the empirical method. Similarly, if the empirical method is insufficient for seismic assessment, then the need for numerical simulation may arise. In such cases the hybrid method can be used [38].
6.1. Capacity spectrum method
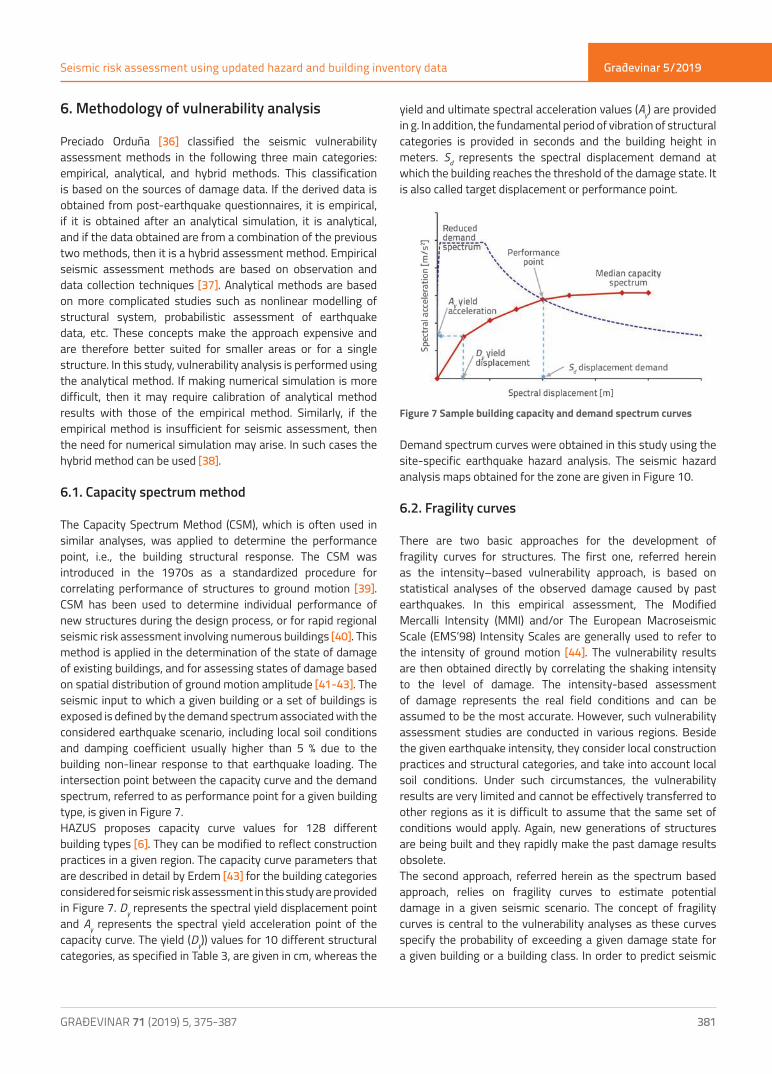
The Capacity Spectrum Method (CSM), which is often used in similar analyses, was applied to determine the performance point, i.e., the building structural response. The CSM was introduced in the 1970s as a standardized procedure for correlating performance of structures to ground motion [39]. CSM has been used to determine individual performance of new structures during the design process, or for rapid regional seismic risk assessment involving numerous buildings [40]. This method is applied in the determination of the state of damage of existing buildings, and for assessing states of damage based on spatial distribution of ground motion amplitude [41-43]. The seismic input to which a given building or a set of buildings is exposed is defined by the demand spectrum associated with the considered earthquake scenario, including local soil conditions and damping coefficient usually higher than 5 % due to the building non-linear response to that earthquake loading. The intersection point between the capacity curve and the demand spectrum, referred to as performance point for a given building type, is given in Figure 7.HAZUS proposes capacity curve values for 128 different building types [6]. They can be modified to reflect construction practices in a given region. The capacity curve parameters that are described in detail by Erdem [43] for the building categories considered for seismic risk assessment in this study are provided in Figure 7. Dy represents the spectral yield displacement point and Ay represents the spectral yield acceleration point of the capacity curve. The yield (Dy)) values for 10 different structural categories, as specified in Table 3, are given in cm, whereas the
yield and ultimate spectral acceleration values (Ay) are provided in g. In addition, the fundamental period of vibration of structural categories is provided in seconds and the building height in meters. Sd represents the spectral displacement demand at which the building reaches the threshold of the damage state. It is also called target displacement or performance point.
Figure 7 Sample building capacity and demand spectrum curves
Demand spectrum curves were obtained in this study using the site-specific earthquake hazard analysis. The seismic hazard analysis maps obtained for the zone are given in Figure 10.
6.2. Fragility curves
There are two basic approaches for the development of fragility curves for structures. The first one, referred herein as the intensity–based vulnerability approach, is based on statistical analyses of the observed damage caused by past earthquakes. In this empirical assessment, The Modified Mercalli Intensity (MMI) and/or The European Macroseismic Scale (EMS’98) Intensity Scales are generally used to refer to the intensity of ground motion [44]. The vulnerability results are then obtained directly by correlating the shaking intensity to the level of damage. The intensity-based assessment of damage represents the real field conditions and can be assumed to be the most accurate. However, such vulnerability assessment studies are conducted in various regions. Beside the given earthquake intensity, they consider local construction practices and structural categories, and take into account local soil conditions. Under such circumstances, the vulnerability results are very limited and cannot be effectively transferred to other regions as it is difficult to assume that the same set of conditions would apply. Again, new generations of structures are being built and they rapidly make the past damage results obsolete.The second approach, referred herein as the spectrum based approach, relies on fragility curves to estimate potential damage in a given seismic scenario. The concept of fragility curves is central to the vulnerability analyses as these curves specify the probability of exceeding a given damage state for a given building or a building class. In order to predict seismic

Građevinar 5/2019
382 GRAĐEVINAR 71 (2019) 5, 375-387
Ferhat Pakdamar, Fatma İlknur Kara, Yaşasın Eryılmaz, Ali Yeşilyurt
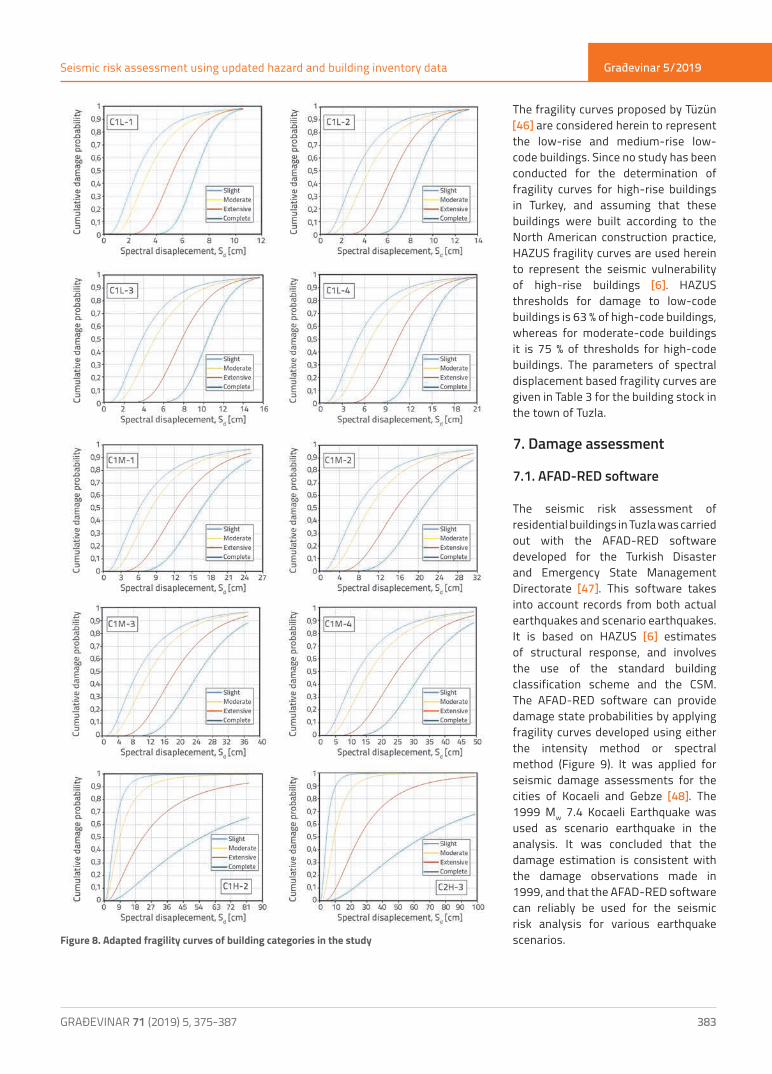
performance of a structural group exposed to a given ground motion, the fragility curves are combined with the building capacity curve that gives the building response to seismic loading. The states of damage that are predicted with fragility curves are: none, slight, moderate, extensive, and complete. These states are defined assuming the log-normal distribution of damage [45]. The analytic expression of each damage probability curve is based on the assumption of the standard cumulative log-normal distribution of earthquake-damage states [6]. The KOERI Casualty Model is used for the estimation of human casualties [17]. This model is based on the population per building, number of damaged buildings, and casualty rate. For extensive and complete damage states, the accepted ratios are 5 % for “death” and 0.01 % “seriously injured”.In this study, the fragility curve parameters proposed by Tüzün [46] for reinforced concrete buildings in downtown Bolu, Turkey, are used as representative of the existing low-rise and medium-rise buildings. These fragility curves were obtained from damage inflicted on buildings during the 1999 M7.2 Düzce earthquake. Horizontal axes of the Cartesian coordinate system representing the fragility curves depict the spectral displacement demand, whereas vertical axes show the cumulative probability of reaching or exceeding a given damage state. In other words, fragility curves are used to calculate probability that the structure will reach or exceed a determined damage caused by non-linear spectral displacements, as a consequence of a given ground motion intensity. According to the central limit theorem, if the capacity of a structure to sustain earthquake action, and the seismic shaking, are both assumed to be random variables for which normal or log-normal probability distributions are applicable, it can be accepted that the composite performance
result is with log-normal distribution. Therefore, the probabilistic distribution of damage to structure is expressed in the form of a log-normal cumulative probability function referred to as the fragility curve.Two basic parameters fully define fragility curves: the median of displacement values, and the standard deviation of demand parameter (PGA or Sd). Four sets of parameters are, hence, necessary to define the probability of either slight, moderate, extensive, or complete damage. Fragility curves for different damage states are defined as follows [26]:
(1)
where (cm) is the median value of the spectral displacement for a given damage state, and εds is the log-normal random variable with the unit median value. Fragility curves with respect to the probability of occurrence or exceedance of certain damage state (ds) for a given earthquake intensity measure (e.g., spectral displacement) are defined by the following equation
(2)
where, Sd refers to the performance point, d,ds to the median spectral displacement of a given damage state, βds is the logarithmic standard deviation of spectral displacement for that damage state, and is the standard cumulative normal distribution function.Figure 8.a-8.j, shows fragility curves for each building class (Table 3) based on (spectral displacement) and (threshold level for the respective damage state). Displacements are expressed in cm.
Building class
Slight(s)
Moderate(m)
Extensive (e)
Complete(c)
Yield capacity Period
d.s [cm] β. sd.m [cm] β. m
d.e [cm] β. ed.c [cm] β.c Dy [cm] Ay [g] T [s]
C1L_1 2.6 0.7 3.4 0.5 5.3 0.3 7.0 0.2 0.25 0.06 0.41
C1L_2 3.2 0.7 4.3 0.5 6.6 0.3 8.8 0.2 0.25 0.06 0.41
C1L_3 3.8 0.7 5.1 0.5 7.8 0.3 10.4 0.2 0.51 0.13 0.40
C1L_4 5.1 0.7 6.8 0.5 10.4 0.3 13.9 0.2 0.99 0.25 0.40
C1M_1 6.1 0.8 8.1 0.6 12.5 0.5 16.6 0.3 0.74 0.05 0.77
C1M_2 7.6 0.8 10.1 0.6 15.6 0.5 20.8 0.3 0.74 0.10 0.55
C1M_3 9.0 0.8 12.0 0.6 18.5 0.5 24.7 0.3 1.47 0.21 0.53
C1M_4 12.0 0.8 16.0 0.6 24.7 0.5 32.9 0.3 2.92 0.24 0.70
C1H_2 5.5 0.7 8.8 0.8 22.0 0.9 54.9 1.0 1.27 0.02 1.60
C2H_3 4.4 0.7 9.3 0.7 25.4 0.7 65.8 0.9 3.73 0.13 1.07
Table 3. Spectral displacement based fragility curve parameters [6, 46]
Građevinar 5/2019
383GRAĐEVINAR 71 (2019) 5, 375-387
Seismic risk assessment using updated hazard and building inventory data
The fragility curves proposed by Tüzün [46] are considered herein to represent the low-rise and medium-rise low-code buildings. Since no study has been conducted for the determination of fragility curves for high-rise buildings in Turkey, and assuming that these buildings were built according to the North American construction practice, HAZUS fragility curves are used herein to represent the seismic vulnerability of high-rise buildings [6]. HAZUS thresholds for damage to low-code buildings is 63 % of high-code buildings, whereas for moderate-code buildings it is 75 % of thresholds for high-code buildings. The parameters of spectral displacement based fragility curves are given in Table 3 for the building stock in the town of Tuzla.
7. Damage assessment
7.1. AFAD-RED software
The seismic risk assessment of residential buildings in Tuzla was carried out with the AFAD-RED software developed for the Turkish Disaster and Emergency State Management Directorate [47]. This software takes into account records from both actual earthquakes and scenario earthquakes. It is based on HAZUS [6] estimates of structural response, and involves the use of the standard building classification scheme and the CSM. The AFAD-RED software can provide damage state probabilities by applying fragility curves developed using either the intensity method or spectral method (Figure 9). It was applied for seismic damage assessments for the cities of Kocaeli and Gebze [48]. The 1999 Mw 7.4 Kocaeli Earthquake was used as scenario earthquake in the analysis. It was concluded that the damage estimation is consistent with the damage observations made in 1999, and that the AFAD-RED software can reliably be used for the seismic risk analysis for various earthquake scenarios.Figure 8. Adapted fragility curves of building categories in the study

Građevinar 5/2019
384 GRAĐEVINAR 71 (2019) 5, 375-387
Ferhat Pakdamar, Fatma İlknur Kara, Yaşasın Eryılmaz, Ali Yeşilyurt
Figure 9 AFAD-RED software workflow
Ground motion attenuation relationships proposed in the literature and applicable for the NAF high interplate seismic activity conditions were integrated into the program:Booreet al. [49]: 10 < R < 100 km; 5.5 < Mw < 7.5 Sadighet al. [50]: 10 < R < 300 km; 4.0 < Mw < 8.0 Ambraseys et al. [51]: 10 < R < 40 km; 4.0 < Mw < 7.5
These three attenuation relationships reflect the mechanism of the S1 and S2 faults and remain within the limits of the estimated earthquake magnitudes. The AFAD-RED software also allows for selection of one or all three attenuation relationships with assigned different proportions to include a statistical approach to uncertainties in the analyses. All three attenuation equations were considered herein with equal weighing factors.
7.2. Building damage states
The building damage assessment process starts with creation of seismic hazard maps. These maps were generated for the S1, S2 and S3 scenarios considering uncertainties in active segments of the NAF line in the Marmara Region, as previously described. According to Figure 10.a-10.c, the regions that will be mainly affected by possible earthquake scenarios are the towns of Tuzla, Bakırköy, and Adalar (Prince Islands). The figures also
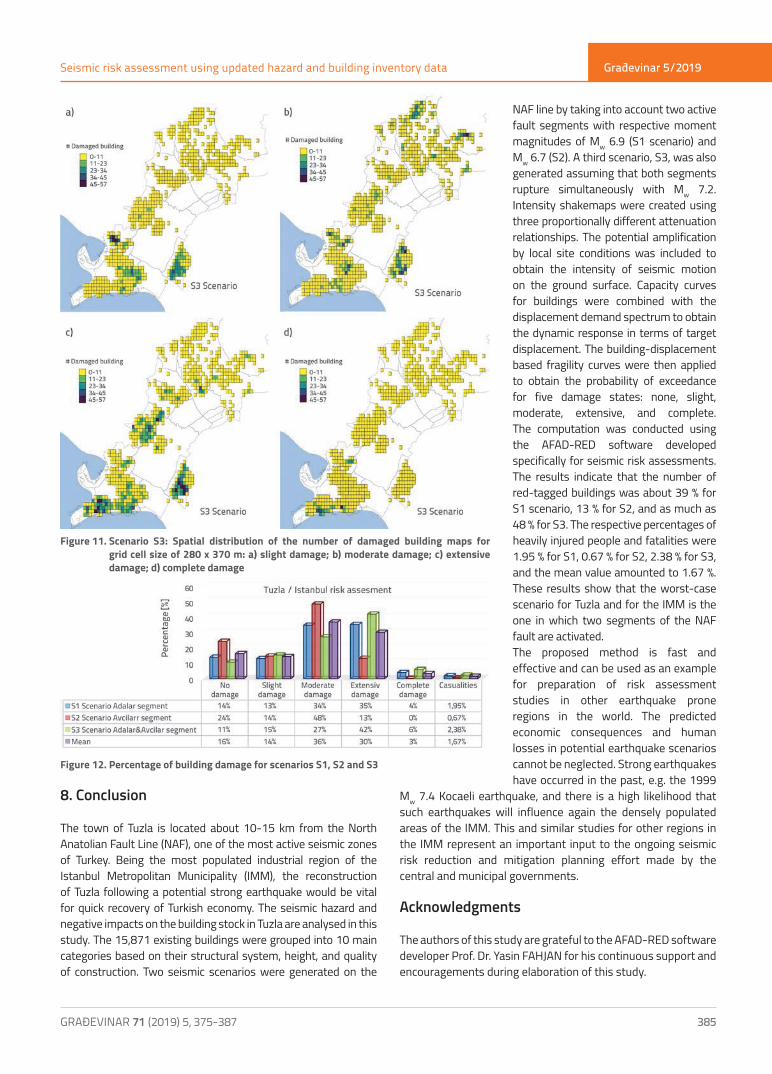
reveal that the most affected region appears to be the town of Tuzla.The acceleration and spectral displacements that will have an effect on the studied region were determined based on hazard maps shown in Figure 10. These displacements were related to the earthquake spectral displacement demand. Although the analyses were conducted on the building-by- building basis, a raster method was used herein to illustrate the probabilities of the states of damage for the building stock considered. In this method, the area was divided into a regular grid with 280 x 370 m cell size. The damage distribution maps for the most hazardous scenario, S3, are shown in Figure 11(a)-(d). The number of damaged buildings in the damage maps is shown by different colours, each corresponding to a given number of buildings. The building risk is determined by two main variables. The first one is the magnitude of earthquake hazard and the second one is the fragility of the building inventory in every cell. These two variables are “discrete variables” and they are not related to each other. Therefore, although heavy damage can be observed in far-fault areas, slight damage can be observed in near-fault areas. So the risk is not only proportional to the level of danger but also to the fragility of buildings. These explanations are the reason for damage ratio distributions in far-fault and near-fault areas as shown in Figure 11.As the other two seismic scenarios, S1 and S2, are not shown in figures due to the space limitations for this manuscript, a comparison of the predicted damage percentage of buildings in each damage state between the three seismic scenarios is given in the histogram format in Figure 12. As can be observed in Figure 12, the highest number of buildings with no damage and moderate damage were predicted for the S1 scenario. The S3 scenario produces most buildings in the states of slight, extensive and complete damage. The S3 scenario has the highest percentage of buildings with extensive and complete damage. Following a strong earthquake event, access is forbidden to the population. In fact, most people seeking shelter will come from these heavily damaged buildings as they are not safe enough for the population, and could easily collapse following the aftershocks that usually accompany the main earthquake event. As mentioned before, KOERI Casualty Model [17] is used for estimation of human casualties. Based on this approach, the summation of heavily injured and fatality results is given as a percentage of population in Figure 12.
Figure 10. Intensity shakemaps for three scenarious: a) S1; b) S2; c) S3
Građevinar 5/2019
385GRAĐEVINAR 71 (2019) 5, 375-387
Seismic risk assessment using updated hazard and building inventory data
8. Conclusion
The town of Tuzla is located about 10-15 km from the North Anatolian Fault Line (NAF), one of the most active seismic zones of Turkey. Being the most populated industrial region of the Istanbul Metropolitan Municipality (IMM), the reconstruction of Tuzla following a potential strong earthquake would be vital for quick recovery of Turkish economy. The seismic hazard and negative impacts on the building stock in Tuzla are analysed in this study. The 15,871 existing buildings were grouped into 10 main categories based on their structural system, height, and quality of construction. Two seismic scenarios were generated on the
NAF line by taking into account two active fault segments with respective moment magnitudes of Mw 6.9 (S1 scenario) and Mw 6.7 (S2). A third scenario, S3, was also generated assuming that both segments rupture simultaneously with Mw 7.2. Intensity shakemaps were created using three proportionally different attenuation relationships. The potential amplification by local site conditions was included to obtain the intensity of seismic motion on the ground surface. Capacity curves for buildings were combined with the displacement demand spectrum to obtain the dynamic response in terms of target displacement. The building-displacement based fragility curves were then applied to obtain the probability of exceedance for five damage states: none, slight, moderate, extensive, and complete. The computation was conducted using the AFAD-RED software developed specifically for seismic risk assessments. The results indicate that the number of red-tagged buildings was about 39 % for S1 scenario, 13 % for S2, and as much as 48 % for S3. The respective percentages of heavily injured people and fatalities were 1.95 % for S1, 0.67 % for S2, 2.38 % for S3, and the mean value amounted to 1.67 %. These results show that the worst-case scenario for Tuzla and for the IMM is the one in which two segments of the NAF fault are activated.The proposed method is fast and effective and can be used as an example for preparation of risk assessment studies in other earthquake prone regions in the world. The predicted economic consequences and human losses in potential earthquake scenarios cannot be neglected. Strong earthquakes have occurred in the past, e.g. the 1999
Mw 7.4 Kocaeli earthquake, and there is a high likelihood that such earthquakes will influence again the densely populated areas of the IMM. This and similar studies for other regions in the IMM represent an important input to the ongoing seismic risk reduction and mitigation planning effort made by the central and municipal governments.
Acknowledgments
The authors of this study are grateful to the AFAD-RED software developer Prof. Dr. Yasin FAHJAN for his continuous support and encouragements during elaboration of this study.
Figure 11. Scenario S3: Spatial distribution of the number of damaged building maps for grid cell size of 280 x 370 m: a) slight damage; b) moderate damage; c) extensive damage; d) complete damage
Figure 12. Percentage of building damage for scenarios S1, S2 and S3

Građevinar 5/2019
386 GRAĐEVINAR 71 (2019) 5, 375-387
Ferhat Pakdamar, Fatma İlknur Kara, Yaşasın Eryılmaz, Ali Yeşilyurt
REFERENCES[1] Re, M.: Topics GEO. Natural Catastrophes 2015: Analyses,
assessments, positions. Munich Re Group, Munich. 2016.[2] Holzer, T.L.: Implications for earthquake risk reduction in the
United States from the Kocaeli, Turkey, earthquake of August 17, 1999. Vol. 1193. 2000: US Government Printing Office.
[3] Özmen, B.: Ağustos 1999 İzmit Körfezi Depremi’nin Hasar Durumu (Rakamsal Verilerle), Ankara, Türkiye Deprem Vakfı. 2000.
[4] Erdik, M.: Report on 1999 Kocaeli and Duzce (Turkey) Earthquakes. Structural control for civil and infrastructure engineering: World Scientific, pp. 149-186, 2001.
[5] Šipoš, T.K., Hadzima-Nyarko, M.: Rapid seismic risk assessment. International journal of disaster risk reduction, 24 (2017), pp. 348-360, https://doi.org/10.1016/j.ijdrr.2017.06.025
[6] FEMA, H.M.M.: Multi-hazard Loss Estimation Methodology/Earthquake Model/Technical Manual. 2010: Wasington, D.C.
[7] Riga, E., Karatzetzou, A., Mara, A., Pitilakis, K.: Studying the uncertainties in the seismic risk assessment at urban scale applying the Capacity Spectrum Method: The case of Thessaloniki. Soil Dynamics and Earthquake Engineering, 92 (2017), pp. 9-24, https://doi.org/10.1016/j.soildyn.2016.09.043
[8] Barbat, A.H., Pujades, L.G., Lantada, N.: Seismic damage evaluation in urban areas using the capacity spectrum method: application to Barcelona. Soil Dynamics and Earthquake Engineering, 28 (2008) 10, pp. 851-865.
[9] Remki, M., Kehila, F., Bechtoula, H., Bourzam, A.: Seismic vulnerability assessment of composite reinforced concrete-masonry building. Earthquakes and Structures, 11 (2016) 2, pp. 371-386.
[10] Salgado-Gálvez, A.M., Barbat, H.A., Cardona, D.O., Carreño, L.M.: Comparing observed damages and losses with modelled ones using a probabilistic approach: The Lorca 2011 case. International Journal of Disaster Risk Reduction, 19 (2016), pp. 355-365, https://doi.org/10.1016/j.ijdrr.2016.09.008
[11] Erdik, M., Rashidov, T., Safak, E., Turdukulov, A.: Assessment of seismic risk in Tashkent, Uzbekistan, Bishkek, Kyrgyz Republicc, Soil Dynamics and Earthquake Engineering, 25 (2005) 7, pp. 473-486.
[12] Makhoul, N., Navarro, C., Lee, J.S., Abi-Youness, A.: Assessment of seismic damage to buildings in resilient Byblos City, International journal of disaster risk reduction, 18 (2016), pp. 12-22, https://doi.org/10.1016/j.ijdrr.2016.05.007
[13] Karimzadeh, S., Miyajima, M., Hassanzadeh, R., Amiraslanzadeh, R.: A GIS-based seismic hazard, building vulnerability and human loss assessment for the earthquake scenario in Tabriz, Soil Dynamics and Earthquake Engineering, 66 (2014), pp. 263-280, https://doi.org/10.1016/j.soildyn.2014.06.026
[14] El Ezz, A.A., Nollet, M.J., Nastev, M.: Assessment of earthquake-induced damage in Quebec city, Canada. International journal of disaster risk reduction, 12 (2015), pp. 16-24, https://doi.org/10.1016/j.ijdrr.2014.11.004
[15] Isik, E., Kutanis, M., Bal, I.E.: Estimated loss and rating of earthquake risk in eastern Turkey, Gradevinar, 69 (2017) 7, pp. 581-592, , https://doi.org/10.14256/JCE.1242.2015
[16] Kalman Sipos, T., Hadzima-Nyarko, M.: Seismic Risk of Croatian Cities Based on Building’s Vulnerability. Tehnicki Vjesnik-Technical Gazette, 25 (2018) 4, pp. 1088-1094.
[17] Erdik, M., Rashidov, T., Safak, E., Turdukulov, A.: Earthquake risk assessment for Istanbul metropolitan area. Earthquake Engineering and Engineering Vibration, 2 (2003) 1, pp. 1-23, https://doi.org/10.1007/BF02857534
[18] IMM, I.M.M.: The study on a disaster prevention/mitigation basic plan in Istanbul including seismic microzonation in the Republic of Turkey. 2002.
[19] Konukcu, B.E., Karaman, H., Şahin, M.: Building damage analysis for the updated building dataset of Istanbul. Natural Hazards, 84 (2016) 3, pp. 1981-2007.
[20] TUIK. Adrese dayalı nüfus kayıt sistemi sonuçları. Ankara, Turkey 2017 [cited 2017 23.04.2017]; Available from: https://biruni.tuik.gov.tr/.
[21] TBSP, Tuzla Belediyesi,Stratejik Plan 2015 - 2019. 2015 15.03.2017].
[22] Openstreetmap, Map of Tuzla district 2017 15.03.2017]; Available from: https://www.openstreetmap.org/#map = 11/40.8323/29.3156.
[23] Erdik, M.: Deprem Risk Belirlemesi in İstanbul Bülten 2011, TMMOB- İMO: İstanbul. pp. 8-20.
[24] Marulanda, M.C., Carreño, M.L., Cardona, O.D., Ordaz, M.G., Barbat, A.H.: Probabilistic earthquake risk assessment using CAPRA: application to the city of Barcelona, Spain. Natural hazards, 69 (2013) 1, pp. 59-84.
[25] Razeghi, H.R., Ghodrati Amiri, G., Razavian Amrei, S.A., Rahimi, M.A.: Probabilistic seismic hazard analyses and otaining Uniform haard sectra of Tabriz, Iran. Ksce Journal of Civil Engineering, 20 (2016) 5, pp. 1813-1823.
[26] Sedan, O., Negulescu, K., Terrier, M., Roulle, A., Winter, T., Bertil, D.: Armagedom - a tool for seismic risk assessment illustrated with applications. Journal of earthquake engineering, 17 (2013) 2, pp. 253-281.
[27] Miura, H., Midorikawa, S., Fujimoto, K., Pacheco, B., Yamanaka, H.: Earthquake damage estimation in Metro Manila, Philippines based on seismic performance of buildings evaluated by local experts’ judgments. Soil Dynamics and Earthquake Engineering, 28 (2008) 10, pp. 764-777.
[28] Tarı, U., Tüysüz, O.: The effects of the North Anatolian Fault on the geomorphology in the Eastern Marmara Region, Northwestern Turkey. Geodinamica Acta, 28 (2016) 3, pp. 139-159.
[29] Barka, A.: The north Anatolian fault zone. Annales tectonicae, 6 (1992) Suppl, pp. 164-195.
[30] MTA, Yenilenmiş diri fay haritaları, 2017 [cited 2017 23.04.2017]; Available from: http://www.mta.gov.tr/v3.0/hizmetler/yenilenmis-diri-fay-haritalari.
[31] Özalp, S., Emre, Ö., Doğan, A.: The segment structure of southern branch of the North Anatolian Fault and paleoseismological behaviour of the Gemlik fault. NW Anatolia Bulletin of MTA, 147 (2013), pp. 1-17.
[32] Stein, R.S., Barka, A.A., Dieterich, J.H.: Progressive failure on the North Anatolian fault since 1939 by earthquake stress triggering. Geophysical Journal International, 128 (1997) 3, pp. 594-604.
[33] Hanks, T.C., Bakun, W.H.: M-logA observations for recent large earthquakes. Bulletin of the Seismological Society of America, 98 (2008) 1, pp. 490-494.

Građevinar 5/2019
387GRAĐEVINAR 71 (2019) 5, 375-387
Seismic risk assessment using updated hazard and building inventory data
[34] Field, E.H., Dawson, T.E., Felzer, K.R., Frankel, A.D., Gupta, V., Jordan, T.H., Parsons, T., Petersen, M.D., Stein, R.S., Weldon, R.J., Wills, C.J.: Uniform California earthquake rupture forecast, version 2 (UCERF 2). Bulletin of the Seismological Society of America, 99 (2009) 4, pp. 2053-2107.
[35] Wesnousky, S.G.: Displacement and geometrical characteristics of earthquake surface ruptures: Issues and implications for seismic-hazard analysis and the process of earthquake rupture. Bulletin of the Seismological Society of America, 98 (2008) 4, pp. 1609-1632.
[36] Preciadoa, A., Orduña, A., Bartoli, G., Budelmann, H.: Façade seismic failure simulation of an old Cathedral in Colima, Mexico by 3D Limit Analysis and nonlinear Finite Element Method. Engineering Failure Analysis, 49 (2015), pp. 20-30, https://doi.org/10.1016/j.engfailanal.2014.12.003
[37] Hadzima-Nyarko, M., Mišetić, V., Morić, D.: Seismic vulnerability assessment of an old historical masonry building in Osijek, Croatia, using Damage Index. Journal of Cultural Heritage, 28 (2017), pp. 140-150, https://doi.org/10.1016/j.culher.2017.05.012
[38] NDMA, N.D.M.A.: Seismic Vulnerability Assessment of Building Types in India N.D.M.A.G.o. India, Editor. 2013: India.
[39] Freeman, S., Nicoletti, J., Tyrell, J.: Evaluations of existing buildings for seismic risk–A case study of Puget Sound Naval Shipyard, Bremerton, Washington. in Proceedings of the 1st US National Conference on Earthquake Engineering. 1975. Earthquake Engineering Research Institute Oakland, CA.
[40] Freeman, S.A.: Review of the development of the capacity spectrum method. ISET Journal of Earthquake Technology, 41 (2004) 1, pp. 1-13.
[41] Freeman, S.A.: Development and use of capacity spectrum method. in Proceedings of the 6th US national conference on earthquake engineering. 1998. EERI Seattle, WA.
[42] Freeman, S.A.: The capacity spectrum method. in Proceedings of the 11th European conference on earthquake engineering. 1998. Paris.
[43] Erdem, T.: Performance evaluation of reinforced concrete buildings with softer ground floors, Gradevinar, 68 (2016) 1, pp. 39-49, https://doi.org/10.14256/JCE.1133.2014
[44] Lazzali, F.: Seismic vulnerability of Algerian reinforced concrete houses. Earthquakes and Structures, 5 (2013) 5, pp. 571-588.
[45] Masi, A., Digrisolo, A., Manfredi, V.: Fragility curves of gravity-load designed RC buildings with regularity in plan. Earthquakes and Structures, 9 (2015) 1, pp. 1-27.
[46] Tüzün, C.: A Seismic Vulnerability Analysis Procedure For Urban Loss Assessment. 2008, Boğaziçi University: Kandilli Observatory and Earthquake Research Institute, İstanbul, Turkey.
[47] Fahjan, Y.: AFAD-RED software. 2013, AFAD - Disaster and Emergency Management Presidency of R.T.: Turkey.
[48] Fahjan, Y., Pakdamar, F., Eryılmaz, E., Kara, F.I.: Afet planlamasında deprem riski belirsizliklerinin değerlendirilmesi. Doğal Afetler ve Çevre Dergisi, 1 (2015) 1-2, pp. 21-39, https://doi.org/10.21324/dacd.61132
[49] Boore, D.M., Joyner, W.B., Fumal, T.E.: Equations for estimating horizontal response spectra and peak acceleration from western North American earthquakes: a summary of recent work. Seismological research letters, 68 (1997) 1, pp. 128-153.
[50] Sadigh, K., Chang, C.Y., Egan, J.A., Makdisi, F., Youngs, R.R.: Attenuation relationships for shallow crustal earthquakes based on California strong motion data. Seismological research letters, 68 (1997) 1, pp. 180-189.
[51] Ambraseys, N.N., Simpson, K.U., Bommer, J.J.: Prediction of horizontal response spectra in Europe. Earthquake Engineering & Structural Dynamics, 25 (1996) 4, pp. 371-400.