rising selectivity at california’s public universities
TRANSCRIPT
ACCESS DENIED
November 2015
Rising Selectivity at California’s Public Universities
Executive Summary
Introduction
The Role of State Funding in Shaping College Opportunity in California
Higher Education in California: A Brief Overview
Admission to the University of California
Admission to the California State University
How the Structure of California’s Public Four-Year Universities is Impacting Admissions and Enrollment
Conclusion
Policy Implications and Recommendations
Appendix 1
Appendix 2
Appendix 3
Appendix 4
Appendix 5
Acknowledgments
Endnotes
Infographic Notes & Sources
Table of Contents03
04
05
10
14
20
32
36
37
39
40
41
42
43
44
44
45

Access Denied: Rising Selectivity at California’s Public Universities 3
The value of a college degree in the 21st century has never been higher. More Californians are prepared for college and want to go, yet our public universities cannot accommodate all of the eligible students and the state has failed to invest the resources necessary to expand college access to keep pace with demand.
In response to the mismatch between student and workforce demand and a shortage of college seats in California’s public universities, our research seeks to provide a clearer picture of admissions standards, capacity challenges, and the role of state funding and policy priorities in Sacramento on the University of California (UC) and California State University (CSU) systems. We are especially concerned with the impact of increased competition faced by California students today on our ability to produce the college graduates we need.
At a time when an educated workforce is crucial for the California economy, is it fair that it is more difficult for today’s generation of Californians to enroll directly in a four-year university after high school than it was for previous generations?
Key Findings:
• California has experienced rapid population growth (265 percent since 1950) and is younger than most other states, creating pressure to accommodate more students seeking a college education.
• High school graduates today are better prepared (42 percent of high school graduates in 2013 completed A-G courses required for UC and CSU eligibility, up from 36 percent in 1996), yet as a whole are less educated than the Baby Boomers who will be rapidly leaving the workforce.
• The gap between the number of Californians applying to the UC and those admitted has doubled since 1996. This is also true in the CSU.
• Those who wish to attend the UC must have near perfect grades and scores to get in, something we did not expect of previous generations. Today the average weighted GPA is 3.90 and the median SAT score is 1840 for students admitted to the UC. Freshman students admitted to six of the nine UC campuses in 2014 had an average weighted GPA of over a 4.0.
• Between 2009 and 2014, budget cuts and limited space have forced the CSU to turn away 139,697 eligible California students.
• At the CSU, six of 23 campuses have raised admission standards for all applicants through the use of impaction, and within the CSU system impacted majors that require students to meet a higher GPA and/or SAT score have increased by 135 percent since 2004.
• California ranks 49th among states in the percentage of undergraduate students enrolled in a four-year university(publicorprivatenot-for-profit).
• Between 2003-2010, California’s prison population increased by only one percent, while general fund expenditures on corrections increased by 26 percent. During the same period, UC and CSU enrollment increased by 13 percent, while general expenditures for higher education decreased by 9 percent.
• As state funding has decreased, tuition has increased by almost 200 percent in the UC and over 175 percent in the CSU since 2000.
When our four-year public university system cannot serve all qualified California students, we produce fewer bachelor’s degree holders and ultimately hurt the economy and threaten the future of our state.
EXECUTIVE SUMMARY

4 Access Denied: Rising Selectivity at California’s Public Universities
While the value of a college degree has increased over time, the percent of California’s population with a college degree is decreasing. In fact, today’s generation of Californians is on track to be less educated than previous generations.1 A college degree is a game changer. Having a bachelor’s degreebenefitsCaliforniansinanumberofways,includingdecreasingtheirlikelihoodofbeingunemployed,significantlyincreasing their lifetime earnings, and reducing their reliance on the state’s safety net.2ThestateofCaliforniaalsobenefitsfrom a college-educated citizenry by reaping lifetime tax benefits of over $100,000 per person who has earned abachelor’sdegreeandsavingover$10,000perpersondueto reduced time spent in poverty.3
California ranks 45th in the nation in terms of bachelor’s degree completion within its college-age population. Several reasons limit our ability to produce more college graduates: (1) California’s four-year university systems are simply too small to serve the growing college-age population,4 (2) the 1960 Master Plan eligibility caps limit enrollment to the top thirdofhighschoolgraduates,(3)statefundingisinsufficient,and (4) growing demand from both students and employers are increasing competition as more students understand the value of a college degree. California is facing considerable challenges when it comes to ensuring all eligible students have a spot in public four-year institutions and is in danger of not meeting workforce demand and losing out on the societalbenefitsthatcomealongwithaneducatedcitizenry.
Introduction
Why is it harder for students today to access California’s public university system?
Master Plan Cap on Four-Year
Enrollment
Growth in California’s College-
Age Population
Limited Physical Space on
Campuses
Insufficient State Funding
Increase in Number of College Applicants
and Applications
Increase in Demand for a College Degree
by Both Students and Employers
Access Denied: Rising Selectivity at California’s Public Universities 5
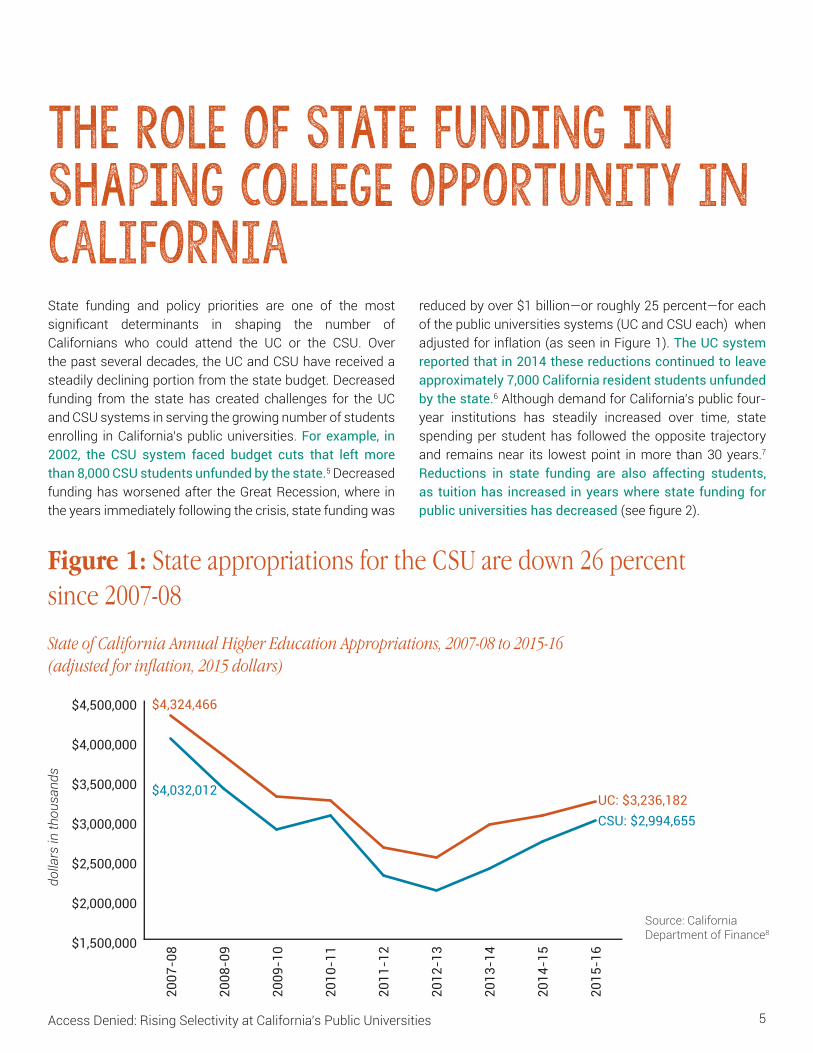
State funding and policy priorities are one of the most significant determinants in shaping the number ofCalifornians who could attend the UC or the CSU. Over the past several decades, the UC and CSU have received a steadily declining portion from the state budget. Decreased funding from the state has created challenges for the UC and CSU systems in serving the growing number of students enrolling in California’s public universities. For example, in 2002, the CSU system faced budget cuts that left more than 8,000 CSU students unfunded by the state.5 Decreased funding has worsened after the Great Recession, where in the years immediately following the crisis, state funding was
reducedbyover$1billion—orroughly25percent—foreachof the public universities systems (UC and CSU each) when adjusted for inflation (as seen in Figure 1). The UC system reported that in 2014 these reductions continued to leave approximately 7,000 California resident students unfunded by the state.6 Although demand for California’s public four-year institutions has steadily increased over time, state spending per student has followed the opposite trajectory and remains near its lowest point in more than 30 years.7 Reductions in state funding are also affecting students, as tuition has increased in years where state funding for public universities has decreased(seefigure2).
THE ROLE OF STATE FUNDING IN SHAPING College Opportunity in California
Figure 1: State appropriations for the CSU are down 26 percent since 2007-08
State of California Annual Higher Education Appropriations, 2007-08 to 2015-16 (adjusted for inflation, 2015 dollars)
Source: California Department of Finance8
$1,500,000
$2,000,000
$2,500,000
$3,000,000
$3,500,000
$4,000,000
$4,500,000
2015
-16
2014
-15
2013
-14
2012
-13
2011
-12
2010
-11
2009
-10
2008
-09
2007
-08
$4,032,012
$4,324,466
UC: $3,236,182CSU: $2,994,655
dolla
rs in
thou
sand
s

6 Access Denied: Rising Selectivity at California’s Public Universities
Figure 2: As state funding decreases, tuition increases at California’s public universities
Tuition at UC and CSU Compared to Total State Funding for Both Systems, 2000-01 to 2015-16 (adjusted for inflation, 2015 dollars)
dolla
rs in
thou
sand
s
$0
$4,000
$8,000
$12,000
2015
-16
2014
-15
2013
-14
2012
-13
2011
-12
2010
-11
2009
-10
2008
-09
2007
-08
2006
-07
2005
-06
2004
-05
2003
-04
2002
-03
2001
-02
2000
-01
$1,972
$3,751
UC: $11,160
CSU: $5,472
$0
$2,000,000
$4,000,000
$6,000,000
$8,000,000
$10,000,000$8,046,714
State Funding:$6,230,837
dollars in thousands
Sources:LegislativeAnalystOfficeandtheCaliforniaDepartmentofFinance9
Budget cuts have played a significant role in limitingenrollment in the UC and CSU and, as a result, have influenced the competitiveness of the admissions pool. For example, in 2004, the UC system admitted a historically low percentage of eligible students due to the elimination of funding for enrollment growth that year.10 It should be noted that these denied students were given a guaranteed transfer option after completing lower-division course requirements at a California community college. Due to diminished state fundingfollowingthefinancialcrisisin2008,UC campuses began to limit the number of admitted California residents and significantly increased the number of admitted international and out-of-state students in order to boost tuition revenue.11 Similarly, the funding shortfalls prompted CSU campuses to turn away as many as 28,000 eligible students per year, including community college transfer students.12
These budget cuts are particularly troubling when juxtaposed alongside budget items that increased during
the same time period, such as corrections. More stunning is the fact that between 2003-2010, California’s prison population increased by only one percent, but general fund expenditures on corrections increased by 26 percent. During the same period, UC and CSU enrollment increased by 13 percent, while general expenditures for higher education decreased by 9 percent.13
Thankfully, the past three state budgets have provided increasesinstatefundingfortheUCandCSU—althoughstillnot anywhere near pre-2007 funding levels after adjusting for inflation. Both the general recovery of the state economy and the passage of Proposition 30 in 2012, which temporarily raised tax rates to help prevent more than $5 billion ineducation cuts, have contributed to annual increases in General Fund allocations for higher education since 2012. Subsequently, in 2013 Governor Brown committed to a multi-year stable funding plan for the UC and CSU, which assumed increased General Fund support over a four-year period.Under theplan, theUCandCSUwouldreceivefive

Access Denied: Rising Selectivity at California’s Public Universities 7
percent annual base funding increases in 2013-14 and 2014-15 and a four percent increase in the following two years with an expectation that they maintained their current tuition and fee levels.
The 2015-2016 state budget, also provides the UC with an additional $25million in General Fund support, on top ofthe $119.5million already allocated, if it can demonstrateit will increase resident undergraduate enrollment by 5,000 students by the 2016-2017 academic year. At $5,000 perstudent, this is half of the traditional funding that the state has provided for new students. In addition to increases in student enrollment for the 2016-2017 academic year, the UC released a proposal in November of 2015 to add 5,000 spots for in-state students between 2017-2018 and the 2018-2019 academic years, for a total of 10,000 new college seats.14 These additional spots for in-state students would be paid for by tuition increases on out-of-state students and other sources. As a result of receiving an increase of
$216.5 million in General Fund support, the CSU is alsoexpected to increase enrollment by 10,400 FTES students.15 This demonstrates a concern by the Governor and our policymakers on the importance of growing enrollment funding that provide greater opportunity for California students, but it is not enough.
Inconsistentandinsufficientfundingfromthestatehasmadeit difficult for the UC and CSU systems to accommodatestudents who are eligible according to the Master Plan. As a result, the UC system has turned to out-of-state and international student enrollment to supplement decreases in state funding in order to serve California residents; and the CSU system has turned away tens of thousands of eligible studentseachyear.Withoutsubstantialincreasesinfinancialsupport from the state, California’s public universities will be unable to serve and ensure equitable access for all eligible students.
0
10,000,000
20,000,000
30,000,000
40,000,000
20152010200019901980197019601950
Figure 3: California Experienced Rapid Population Growth Between 1950 and 2015
Population Estimates for California, 1950-2015
Source: California Department of Finance

8 Access Denied: Rising Selectivity at California’s Public Universities
Enrollment capacity is the ability of a university campus or a system (e.g., the University of California system or the California State University system) to serve all qualifiedstudents. If a campus or system lacks the funding or physical capacity to enroll all eligible students, the response is to tighten admissions standards in order to determine who gets the spots available, in essence a solution to limit enrollment. Figure 3 shows California’s population growth
over time. From 1950 to 2015 California’s population has increased by 265 percent. In addition to California’s rapid population growth over the past 65 years, California’s current population is younger than most other states in the U.S., which has put additional pressure on our public colleges and universities to accommodate more and more students seeking a college degree (see Figure 4).16
Figure 4: California is younger and more diverse than the rest of the country
Population Estimates by Age for California and the Nation, 2010 Census
10% 8% 6% 4% 2% 00-45-9
10-1415-1920-2425-2930-3435-3940-4445-4950-5455-5960-6465-6970-7475-7980-84
85+
2% 4% 6% 8% 10%
age
percent of the population
non-Hispanic White
Hispanic
African American
Asian/PacificIslander
Other
Source: The Campaign for College Opportunity17
From 1950 to 2015 California’s population has increased by 265 percent.
United States, except California California

Access Denied: Rising Selectivity at California’s Public Universities 9
Figure 5: The number of California public high school graduates completing the A-G requirements is up 82% since 1996
California Public High School Graduates with UC/CSU Required Courses, 1996-97 to 2013-14
0
50,000
100,000
150,000
200,000
250,000
300,000
350,000
400,000
450,000
2013
-14
2012
-13
2011
-12
2010
-11
2009
-10
2008
-09
2007
-08
2006
-07
2005
-06
2004
-05
2003
-04
2002
-03
2001
-02
2000
-01
1999
-00
1998
-99
1997
-98
1996
-97
269,071
Total HighSchool Grads:
421,636
96,879(36%)
HS Grads withUC/CSU Req. Courses:
176,688(42%) Source: California Department
of Education Data Reporting Office
California is also in the midst of an exodus of highly educated Baby Boomers retiring from the workforce.18 This shift of Baby Boomers into retirement along with a demand for more educated workers will contribute to what is projected to be adeficitof1.1millioncollege-educatedworkersneededtomeet future workforce demands.19
More California Students Prepared to Enter California’s Public Universities
The good news is that both the total number of high school graduates and the number of high school graduates successfully completing the sequence of courses required for CSU and UC admission have increased over time.
10 Access Denied: Rising Selectivity at California’s Public Universities
Higher Education in California
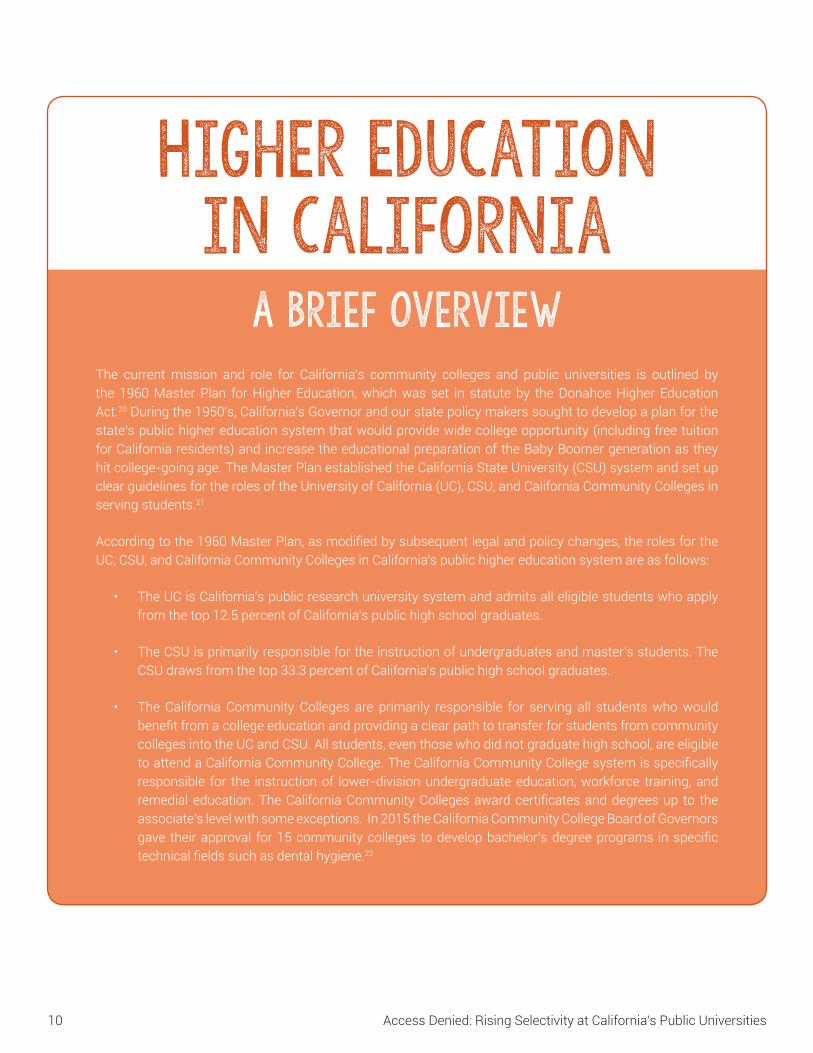
A Brief OverviewThe current mission and role for California’s community colleges and public universities is outlined by the 1960 Master Plan for Higher Education, which was set in statute by the Donahoe Higher Education Act.20 During the 1950’s, California’s Governor and our state policy makers sought to develop a plan for the state’s public higher education system that would provide wide college opportunity (including free tuition for California residents) and increase the educational preparation of the Baby Boomer generation as they hit college-going age. The Master Plan established the California State University (CSU) system and set up clear guidelines for the roles of the University of California (UC), CSU, and California Community Colleges in serving students.21
Accordingtothe1960MasterPlan,asmodifiedbysubsequentlegalandpolicychanges,therolesfortheUC, CSU, and California Community Colleges in California’s public higher education system are as follows:
• The UC is California’s public research university system and admits all eligible students who apply from the top 12.5 percent of California’s public high school graduates.
• The CSU is primarily responsible for the instruction of undergraduates and master’s students. The CSU draws from the top 33.3 percent of California’s public high school graduates.
• The California Community Colleges are primarily responsible for serving all students who would benefitfromacollegeeducationandprovidingaclearpathtotransferforstudentsfromcommunitycolleges into the UC and CSU. All students, even those who did not graduate high school, are eligible toattendaCaliforniaCommunityCollege.TheCaliforniaCommunityCollegesystemisspecificallyresponsible for the instruction of lower-division undergraduate education, workforce training, and remedial education.TheCaliforniaCommunityCollegesawardcertificatesanddegreesup to theassociate’s level with some exceptions. In 2015 the California Community College Board of Governors gave theirapproval for15communitycolleges todevelopbachelor’sdegreeprograms inspecifictechnicalfieldssuchasdentalhygiene.22

Access Denied: Rising Selectivity at California’s Public Universities 11
The Master Plan was a historic effort by California leaders that reflected a commitment to the educational preparation of its citizens. The Master Plan created a framework for addressing pressing higher education needs for the impending population growth of the Baby Boomers. It established the largest system of public higher education inthecountry,ifnottheworld—asystemthattodayservestwo million students and was rightfully lauded for expanding access for California’s then rapidly growing college-age population.23 It also made a promise to its residents, that regardless of economic resources (the Master Plan noted that in state students should not pay any tuition), all talented and eligible studentswould finda spot in oneof its community colleges or universities. This promise has been broken as state funding has failed to keep pace with the growing demand and preparation for college amongst our young people and tuition has been used as revenue to provide funding for the UC and CSU.
To accommodate the increase in students, all three segments of California’s public higher education system have increased enrollment since the 1960s. The UC added four universities, the CSU added eight, and the California Community Colleges have added 46 new campuses to meet the demands of the college-age population.24
The architects of the Master Plan created a phenomenal framework responsible for economic prosperity and innovation while addressing pressing higher education needs for the impending population growth of the Baby Boomers. However, a much smaller share of the population attended college at the time and a high school diploma provided access to greater opportunities into the middle class than it does today. The UC and CSU enrollment and eligibility limitations may have made sense back then; however, with the growing value and demand for bachelor’s degree holders, the unintended consequences of a framework designed to address past needs—no matter how visionary—could not be expected to address the needs today of a very different California in the 21st century from the one in 1960.
Dear Califor
nia Student,
We are sorry
to inform
you that, wh
ile you have
done
everything y
ou needed to
do to
prepare your
self, the Sta
te of
California h
as not saved
a spot
for you in o
ne of our fo
ur-
year state u
niversities.
Regretfully,
California P
ublic Univer
sities
Cal
iforn
ia Public University
1960 Master Plan
12 Access Denied: Rising Selectivity at California’s Public Universities
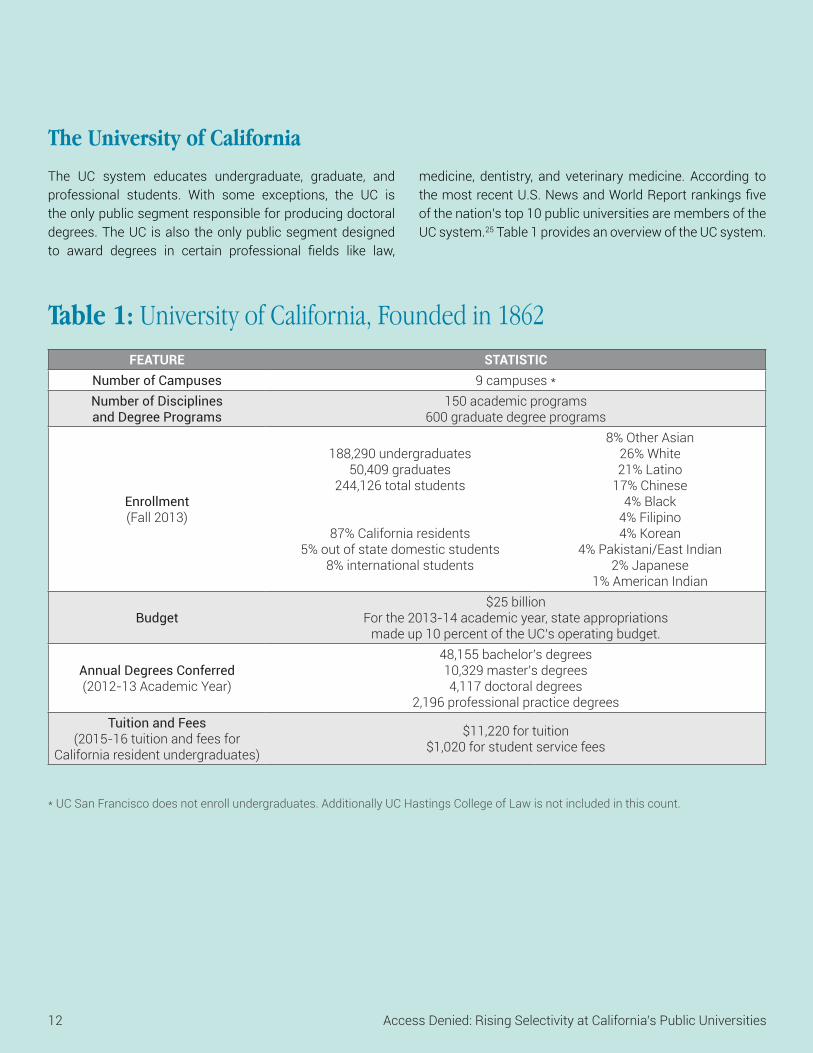
The UC system educates undergraduate, graduate, and professional students. With some exceptions, the UC is the only public segment responsible for producing doctoral degrees. The UC is also the only public segment designed to award degrees in certain professional fields like law,
medicine, dentistry, and veterinary medicine. According to themostrecentU.S.NewsandWorldReportrankingsfiveof the nation’s top 10 public universities are members of the UC system.25 Table 1 provides an overview of the UC system.
The University of California
Table 1: University of California, Founded in 1862FEATURE STATISTIC
Number of Campuses 9 campuses *Number of Disciplines and Degree Programs
150 academic programs600 graduate degree programs
Enrollment (Fall 2013)
188,290 undergraduates50,409 graduates
244,126 total students
87% California residents5% out of state domestic students
8% international students
8% Other Asian26% White21% Latino
17% Chinese4% Black
4% Filipino4% Korean
4% Pakistani/East Indian2% Japanese
1% American Indian
Budget$25billion
For the 2013-14 academic year, state appropriations made up 10 percent of the UC’s operating budget.
Annual Degrees Conferred(2012-13 Academic Year)
48,155 bachelor’s degrees 10,329 master’s degrees 4,117 doctoral degrees
2,196 professional practice degreesTuition and Fees
(2015-16 tuition and fees for California resident undergraduates)
$11,220fortuition$1,020forstudentservicefees
* UC San Francisco does not enroll undergraduates. Additionally UC Hastings College of Law is not included in this count.
Access Denied: Rising Selectivity at California’s Public Universities 13
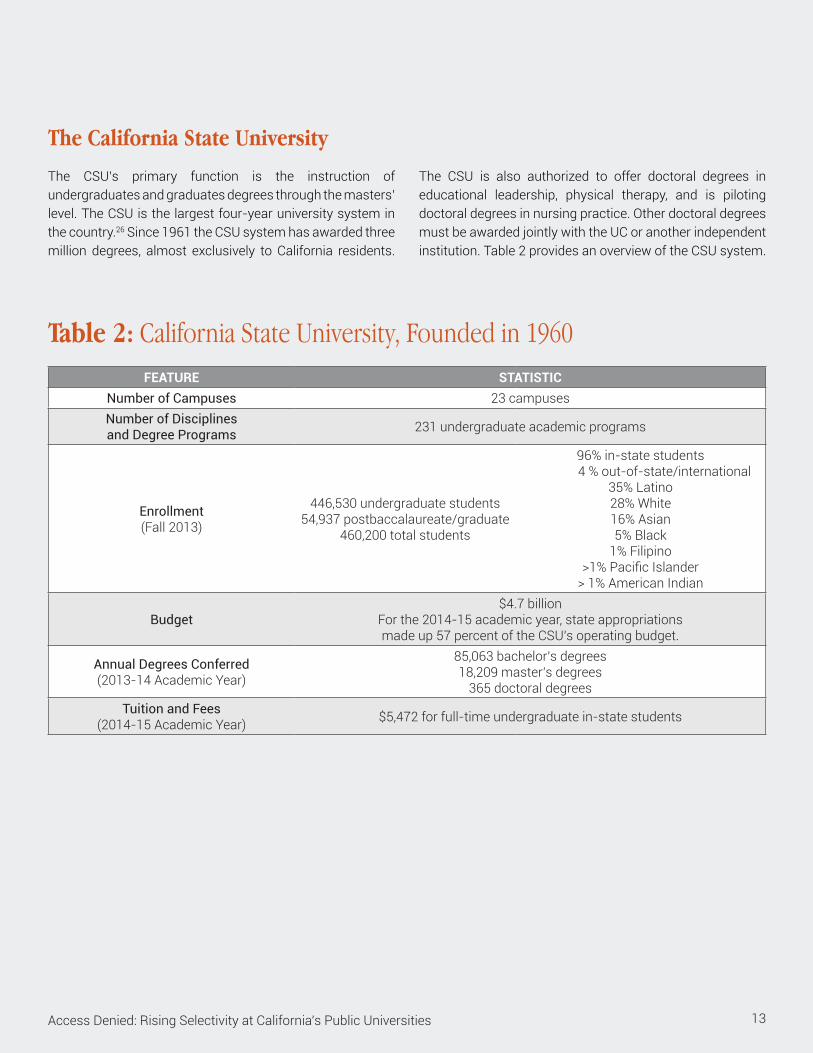
The CSU’s primary function is the instruction of undergraduates and graduates degrees through the masters’ level. The CSU is the largest four-year university system in the country.26 Since 1961 the CSU system has awarded three million degrees, almost exclusively to California residents.
The CSU is also authorized to offer doctoral degrees in educational leadership, physical therapy, and is piloting doctoral degrees in nursing practice. Other doctoral degrees must be awarded jointly with the UC or another independent institution. Table 2 provides an overview of the CSU system.
The California State University
Table 2: California State University, Founded in 1960FEATURE STATISTIC
Number of Campuses 23 campusesNumber of Disciplines and Degree Programs 231 undergraduate academic programs
Enrollment (Fall 2013)
446,530 undergraduate students 54,937 postbaccalaureate/graduate
460,200 total students
96% in-state students 4 % out-of-state/international
35% Latino 28% White16% Asian5% Black
1% Filipino>1%PacificIslander
> 1% American Indian
Budget$4.7billion
For the 2014-15 academic year, state appropriations made up 57 percent of the CSU’s operating budget.
Annual Degrees Conferred(2013-14 Academic Year)
85,063 bachelor’s degrees 18,209 master’s degrees
365 doctoral degrees Tuition and Fees
(2014-15 Academic Year) $5,472forfull-timeundergraduatein-statestudents

14 Access Denied: Rising Selectivity at California’s Public Universities
Admission to the University of California
Access Denied: Rising Selectivity at California’s Public Universities 15
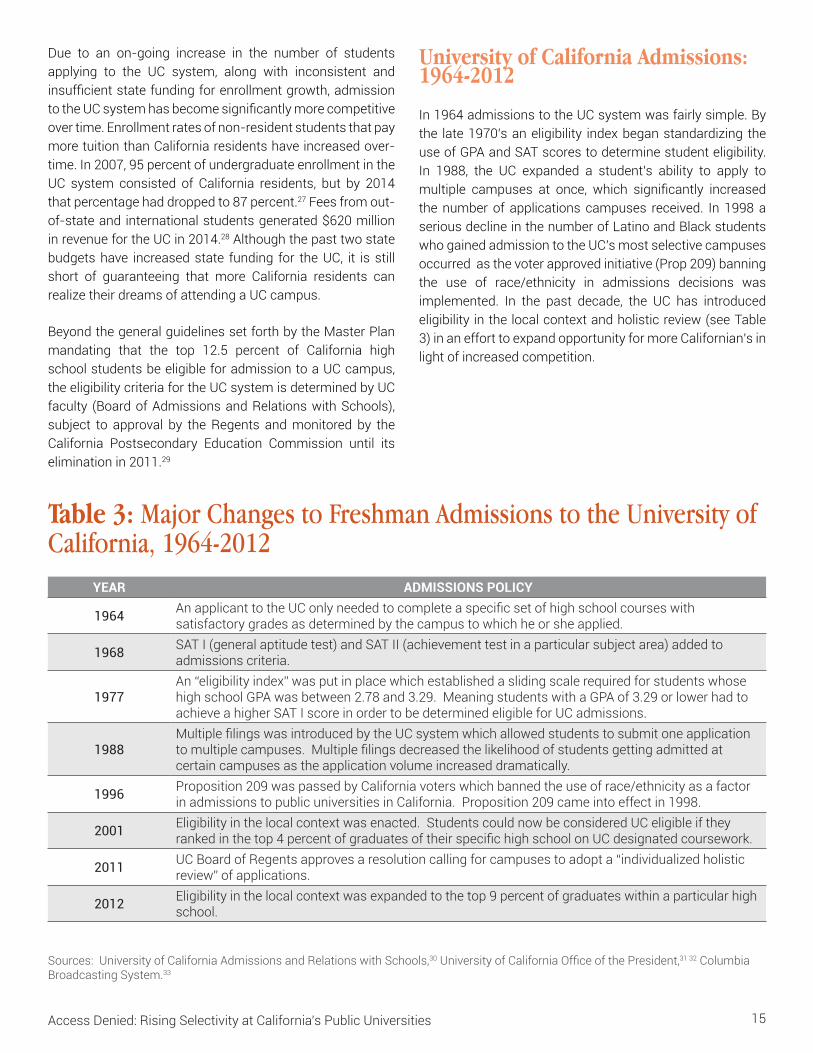
Due to an on-going increase in the number of students applying to the UC system, along with inconsistent and insufficientstatefundingforenrollmentgrowth,admissiontotheUCsystemhasbecomesignificantlymorecompetitiveover time. Enrollment rates of non-resident students that pay more tuition than California residents have increased over-time. In 2007, 95 percent of undergraduate enrollment in the UC system consisted of California residents, but by 2014 that percentage had dropped to 87 percent.27 Fees from out-of-stateand internationalstudentsgenerated$620millionin revenue for the UC in 2014.28 Although the past two state budgets have increased state funding for the UC, it is still short of guaranteeing that more California residents can realize their dreams of attending a UC campus.
Beyond the general guidelines set forth by the Master Plan mandating that the top 12.5 percent of California high school students be eligible for admission to a UC campus, the eligibility criteria for the UC system is determined by UC faculty (Board of Admissions and Relations with Schools), subject to approval by the Regents and monitored by the California Postsecondary Education Commission until its elimination in 2011.29
University of California Admissions: 1964-2012
In 1964 admissions to the UC system was fairly simple. By the late 1970’s an eligibility index began standardizing the use of GPA and SAT scores to determine student eligibility. In 1988, the UC expanded a student’s ability to apply to multiple campuses at once, which significantly increasedthe number of applications campuses received. In 1998 a serious decline in the number of Latino and Black students who gained admission to the UC’s most selective campuses occurred as the voter approved initiative (Prop 209) banning the use of race/ethnicity in admissions decisions was implemented. In the past decade, the UC has introduced eligibility in the local context and holistic review (see Table 3) in an effort to expand opportunity for more Californian’s in light of increased competition.
cdrin
/ Sh
utte
rsto
ck.c
omTable 3: Major Changes to Freshman Admissions to the University of California, 1964-2012
YEAR ADMISSIONS POLICY
1964 AnapplicanttotheUConlyneededtocompleteaspecificsetofhighschoolcourseswithsatisfactory grades as determined by the campus to which he or she applied.
1968 SAT I (general aptitude test) and SAT II (achievement test in a particular subject area) added to admissions criteria.
1977An “eligibility index” was put in place which established a sliding scale required for students whose high school GPA was between 2.78 and 3.29. Meaning students with a GPA of 3.29 or lower had to achieve a higher SAT I score in order to be determined eligible for UC admissions.
1988MultiplefilingswasintroducedbytheUCsystemwhichallowedstudentstosubmitoneapplicationtomultiplecampuses.Multiplefilingsdecreasedthelikelihoodofstudentsgettingadmittedatcertain campuses as the application volume increased dramatically.
1996 Proposition 209 was passed by California voters which banned the use of race/ethnicity as a factor in admissions to public universities in California. Proposition 209 came into effect in 1998.
2001 Eligibility in the local context was enacted. Students could now be considered UC eligible if they rankedinthetop4percentofgraduatesoftheirspecifichighschoolonUCdesignatedcoursework.
2011 UC Board of Regents approves a resolution calling for campuses to adopt a “individualized holistic review” of applications.
2012 Eligibility in the local context was expanded to the top 9 percent of graduates within a particular high school.
Sources: University of California Admissions and Relations with Schools,30UniversityofCaliforniaOfficeofthePresident,31 32 Columbia Broadcasting System.33

16 Access Denied: Rising Selectivity at California’s Public Universities
When applying for admission into the UC system, California high school students have several pathways available to them (Table 4).34 The “statewide” path guarantees admission to students among the top 9 percent of all California high school graduates and the “Eligibility in the Local Context” (ELC) path provides admission for students among the top 9 percent of their high school’s graduating class. Recent reforms, such as eliminating SAT II scores and considering multiple measures of achievement and promise, have moved the UC from an “eligibility index” model towards a “holistic” model, which emphasizes comprehensive review of students’ applications and qualifications beyond highschool GPA and standardized test scores.
The current admissions process to the University of California
Table 4: California Resident UC Admissions Pathways (UCOP 2015)
Minimum Requirements
Earn a 3.0 or better cumulative high school GPA in A-G courses*Successfully complete 11 of the 15 required A-G courses prior to beginning senior year
Take either the SAT or ACT by December of senior year
Admissions Guarantee Criteria
Statewide Path
Within top 9 percent of California high school graduates on the admissions index (which is based on student’s
combined high school GPA and SAT/ACT score)
Eligibility in the Local Context (ELC) Path
Within top 9 percent of his or her high school graduating class (based on student’s overall GPA including A-G
courses*)
Admission to a UC Campus by Exam
StudentswhoarenoteligibleviathestatewidepathnortheELCpathmaybeconsideredforadmissiontoaspecificUCcampus based on the strength of test scores.
Admission to a UC Campus by Exception
A small number of students who have the ability and potential to succeed at UC, but are not UC eligible via the state wide pathnortheELCpath,mayalsobeadmittedtoaspecificUCcampus.
Source:UniversityofCaliforniaOfficeofthePresident37
*A-Gcoursesaresubject-specificcollegepreparatoryhigh-schoollevelcoursesdesignatedbyUCfaculty
The UC gives students bonus points for successfully completing advanced placement (AP courses). Over the past decade the number of students taking AP courses nationally has doubled.35 One reason why the average high school GPA has increased within the UC has to do with the increased access to AP classes for high school students. While student access to AP courses is increasing, access is not necessarily equitable. Across California, students who are underrepresented minorities, first-generation college-going, and/or low-income have less access to AP classes than do their white,non-firstgenerationandhigh-incomepeers.36

Access Denied: Rising Selectivity at California’s Public Universities 17
The percentage of high school graduates applying to the UC system has risen approximately 5 percent since the 1996-97 academic year (see Figure 6). As the number of applicants to the UC increased, the gap between the number of applicants and those admitted more than doubled from 3 percent (1996) to 8.1 percent (2013).
The average high school GPA and median SAT scores of students admitted to the UC system and to specificcampuses have also increased over time.39 High school students admitted into the UC system in 2014 average a 3.90 weighted GPA and a median SAT score of 1840 (max score is 2400). Figure 7 shows the continuously increasing average GPA of admitted students from 2001 to 2014, and indicates that freshman students admitted to six of the nine UC campuses in 2014 had an average weighted GPA of over 4.0.40 41
Figure 8 shows the continuously increasing median combined SAT score of admitted students from 2001 to 2014, and indicates that freshmen admits in 2014 had a median combined SAT score of 1840.
Figure 6: While the percentage of high school graduates applying to the UC system has grown by 5 percentage points in the past 18 years, the percent enrolling has decreased by almost 1 percentage point
Percentage of California High School Graduates Applying to, Admitted to, and Enrolling in the UC System (Unduplicated), 1996-97 to 2013-14
0%
5%
10%
15%
20%
25%
2013201220102008200620042002200019981996
14%
17%
8%
Applicants: 21%
Admits: 14%
Enrolled: 7%
Sources: University of CaliforniaOfficeofthePresident Division of Analytic Studies; California Department of Education DataQuest; Western Interstate Commission for Higher Education, Knocking at the College Door38
A Note About GPAs and SAT Scores
In the traditional sense, a 4.0 is considered a perfect GPA; a student who earned all A’s would get a 4.0. The reason why a student’s GPA can be over a 4.0 is that the UC gives students a GPA bump for taking Advanced Placement classes.42 When we refer to a weighted average high school GPA, we are indicating that this GPA accounts for bonus points students receive for taking Advanced Placement classes. The new SAT (Scholastic Aptitude Test) added a writing component to meet the demand of colleges which asked students to submit writing samples as part of their application package.43 As the new SAT added an additional component, the scoring guidelines were updated (see below).44
The Old SAT The New SATMax Score 1600 2400Average Score Nationally 1050 1520
Source: PowerScore SAT Preparation45

18 Access Denied: Rising Selectivity at California’s Public Universities
Figure 7: The average weighted high school GPA of students admitted to six of the nine UC campuses in 2014 was over a 4.0
Average Weighted High School GPA of Students Admitted to the University of California, 2001-2014
Source: University of California OfficeofthePresident
Figure 8: Near Perfect: The median SAT score of students admitted to UCLA, UC Berkeley, and UC San Diego in 2014 was less than 400 points from a perfect score
Median SAT Combined Score of Students Admitted to the University of California, 2001-2014
1500
1600
1700
1800
1900
2000
2100
2200
20142013201220112010200920082007200620052004200320022001
Berkeley: 2140Los Angeles: 2120San Diego: 2070
Davis: 1980Irvine: 1900
Santa Barbara: 1980
Universitywide: 1840Santa Cruz: 1840
Riverside: 1750
Merced: 1630
20302020
1970
18601840
17901740
1660 1670
1820
Source: University of California OfficeofthePresident
Los Angeles: 4.21
3.40
3.50
3.60
3.70
3.80
3.90
4.00
4.10
4.20
4.30
20142013201220112010200920082007200620052004200320022001
Berkeley: 4.20San Diego: 4.18Davis: 4.11Irvine: 4.09Santa Barbara: 4.05
Universitywide: 3.90Santa Cruz: 3.87Riverside: 3.78
Merced: 3.63
4.124.07
4.043.863.84
3.743.633.55
3.52
3.83

Access Denied: Rising Selectivity at California’s Public Universities 19
While the number of Californians applying to the UC has increased, enrollment of California residents has remained flat or even declined at some UC campuses. According to arecentstateassemblyreportonhighereducation,fiveofthe UC’s nine campuses enrolled fewer California resident freshmen in 2013 than in 2007.46 This decrease in California resident students occurred despite growth during this period in the number of high school graduates in the state, as well as the proportion of those graduates who had taken college preparatory courses.47 The UC admissions process has become increasingly competitive and restrictive, as evidenced by the rising GPA and SAT scores of admitted freshmen. In the 1960s and 70s, most eligible students hadlittledifficultybeingadmittedtotheUC,butfortoday’sgeneration that is not the case.48 49 At a time when a college degree is needed more than ever for one’s economic mobility, is it fair that it is harder for students today to be admitted to the UC than it was 10, 20 or 30 years ago?
Today’s generation of Californians is less likely to have a four-year degree than their parents’ generation.50 The Baby Boomer generation is well educated today due to the fact that they had a great investment from the state, which made California’s public university system easily accessible. California also benefited from an influx of educated Americans from other states, a trend unlikely to be large enough to fill all of the state’s workforce needs in the future. The Campaign calls on policy makers to increase funding for the UC system so that the UC can admit more in-state students, decrease unnecessary competition, and give today’s generation of diverse Californians the same level of access to its public universities as previous generations.
GPA SATUCLA:
4.21
UC Davis: 4.11
UC Merced: 3.63
UCLA: 2120
UC Davis: 1980
UC Merced: 1630
Access Denied: Rising Selectivity at California’s Public Universities 19
20 Access Denied: Rising Selectivity at California’s Public Universities
Admission to the California State University

Access Denied: Rising Selectivity at California’s Public Universities 21
Since its inception, the CSU system has been the point of access for tens of thousands of California high school graduates each year. According to guidelines established by the Master Plan, CSU selects its applicants from the top 33.3 percent of California High School graduates. Historically, CSU admissions have been relatively non-competitive and based on students meeting a minimum “eligibility index” score on a sliding scale (i.e., for students with a GPA below 3.0, lower GPAs must correspond with higher ACT/SAT scores).51 Although not specifically outlined in theMasterPlan,52 most CSU campuses have also served the function of regional colleges by directing most of their recruiting efforts at their local areas and giving priority in admissions to local resident students.
CSU campuses are the least selective of California’s public universities and, until recently, have had little difficulty(with some exception) providing a spot in college for all eligible students who sought admissions, regardless of the student’s proximity to the campus.53 The relatively open access of the CSU system has contributed to its success in educating hundreds of thousands of undergraduate students each year. For a public university system that currently admits around 75 percent of freshman applicants under tight economic constraints, this is a considerable achievement—but one that is endangered by the lack ofsufficientinvestmentbypolicymakersthatcanguaranteeallCSU eligible Californians the spot in college they deserve.
Table 5: CSU Freshmen California Resident Baseline Admissions Eligibility Criteria
High School GPA
Successful completion of the 15 unit “A-G” course sequence after the 9th grade (2.0 GPA or better).
Honors Points
Students may receive bonus points for up to eight grades of C or better in approved honors courses taken after the 9th grade, including a maximum of two International Baccalaureate (I.B.) or Advanced Placement (A.P.), or honors courses
taken in the tenth grade.
Test Scores—ACT/SAT
Test required for applicants to non-impacted campuses who have earned an “A-G” GPA of less than 3.0. CSU combines best scores from multiple sittings of SAT and ACT to calculate best composite score. Regardless of GPA, students are
encouraged to take the ACT/SAT assessment text in their junior year of high school.
Source:CaliforniaStateUniversityOfficeoftheChancellor54

22 Access Denied: Rising Selectivity at California’s Public Universities
Figure 9 shows while CSU student applications are up, the gaps between those who applied and were admitted,55 and the gap between those admitted and those who eventually enrolledintheCSUhasgrownsignificantlyovertime.Inonlythe last 13 years, the applicant and admit gap grew from 7 percent to 13.2 percent and the admit and enrollment gap
more than doubled from 8.9 percent 18.5 percent. In 2000, 27 percent of California high school graduates applied to the CSU system—13 years later nearly 50 percent of allCalifornia high school graduates applied while the percent of those students enrolling has not risen in kind.
Figure 9: Nearly 50 percent of California high school graduates applied to the CSU system in 2013
Percentage of California High School Graduates Applying to, Admitted to, and Enrolling in the CSU system (Unduplicated), 2001-02 to 2013-14
Sources: California State University, Division of Analytic Studies; California Department of Education DataQuest; Western Interstate Commission for Higher Education, Knocking at the College Door56
Note: The CSU does not provide data on California resident admissions years prior to 2011.
0%
10%
20%
30%
40%
50%
20132012201120102009200820072006200520042003200220012000
20%
27%
11%
Applicants: 46%
Admits: 32%
Enrolled: 14%
Access Denied: Rising Selectivity at California’s Public Universities 23
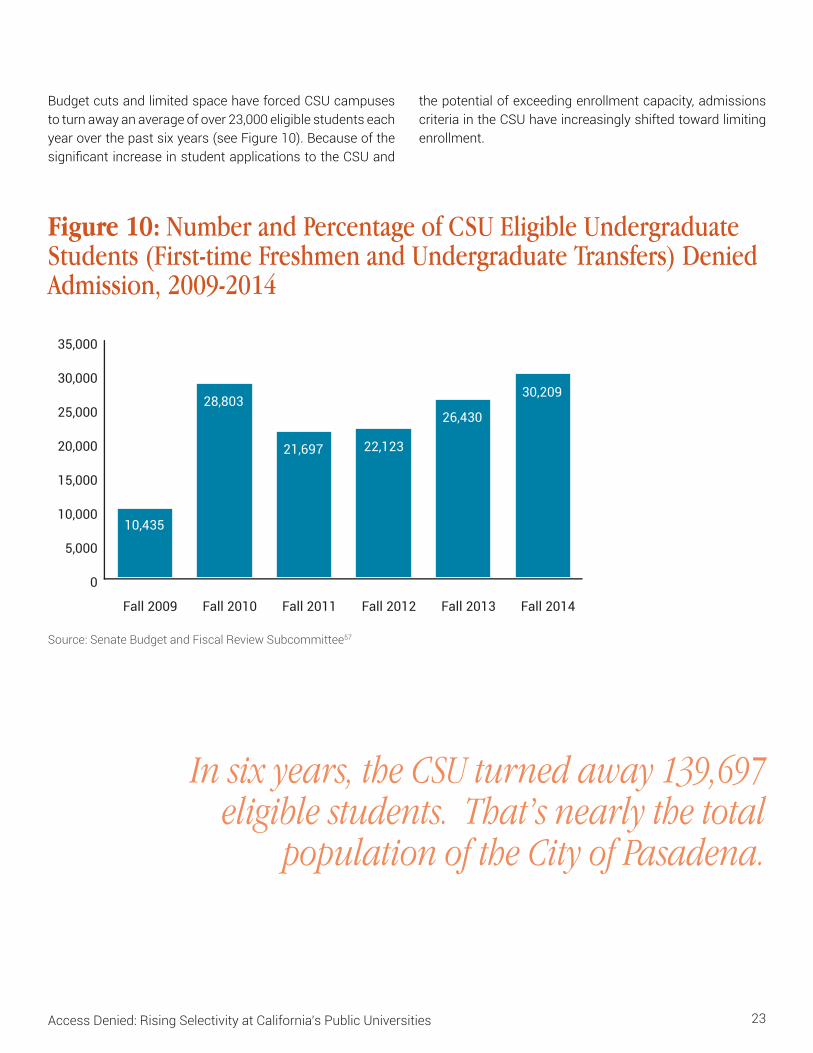
Budget cuts and limited space have forced CSU campuses to turn away an average of over 23,000 eligible students each year over the past six years (see Figure 10). Because of the significantincreaseinstudentapplicationstotheCSUand
the potential of exceeding enrollment capacity, admissions criteria in the CSU have increasingly shifted toward limiting enrollment.
Figure 10: Number and Percentage of CSU Eligible Undergraduate Students (First-time Freshmen and Undergraduate Transfers) Denied Admission, 2009-2014
Source: Senate Budget and Fiscal Review Subcommittee57
0
5,000
10,000
15,000
20,000
25,000
30,000
35,000
Fall 2014Fall 2013Fall 2012Fall 2011Fall 2010Fall 2009
10,435
28,803
21,697 22,123
26,430
30,209
In six years, the CSU turned away 139,697 eligible students. That’s nearly the total
population of the City of Pasadena.
24 Access Denied: Rising Selectivity at California’s Public Universities
Impacts of Increased Selectivity (Impaction) on CSU Freshmen Admissions
Limiting enrollment has been accomplished by university leaders requesting that their institution be designated as “impacted.”58 A campus or undergraduate major is determined to be impacted when the number of applications from eligible students exceeds the number of available seats. Impaction in the CSU system began as early as 1965 when Executive Order No. 8 from the CSU Chancellor’s office directed the presidents of each campus to limitenrollment for the 1965-66 academic year. Each campus wasgivenaspecificenrollmentnumbertoadhereto,alongwith instructions that anymodifications to the enrollmentnumber or plan to reserve admissions spots on any basis other than the chronological receipt of applications required coordinationwiththeCSUOfficeoftheChancellor.59
It was not until September of 2010, when California Assembly Bill 2402 (Block) was passed, that state policymakers got involved and established a legislative mandate for a CSU campus proposing changes to admissions criteria that would affect applicants residing within the local admission area of the institution.60 This mandate was created “to provide notice to the public and ensure the transparency of decisions affecting admissions criteria for all of the campuses of the California State University” in response to concerns that impaction was happening without considering the needs of local stakeholders.61
When a CSU campus is impacted, a student applying for admission to the campus will need a GPA and SAT score that is above the minimum CSU eligibility requirement in order to be admitted. At times, an institution may not be impacted at the campus level, but may have a number of individual majors that are impacted (as shown in Table 6). When a specificmajorisimpacted,astudentapplyingforadmissioninto the major will need to meet the GPA and SAT score requirement determined by the department overseeing that major of interest. GPA and SAT test score requirements are determined by each campus or major department after all applications have been received.64 Adding to the complexity of impaction is that it can occur at both the freshman and/or transfer student admissions levels.
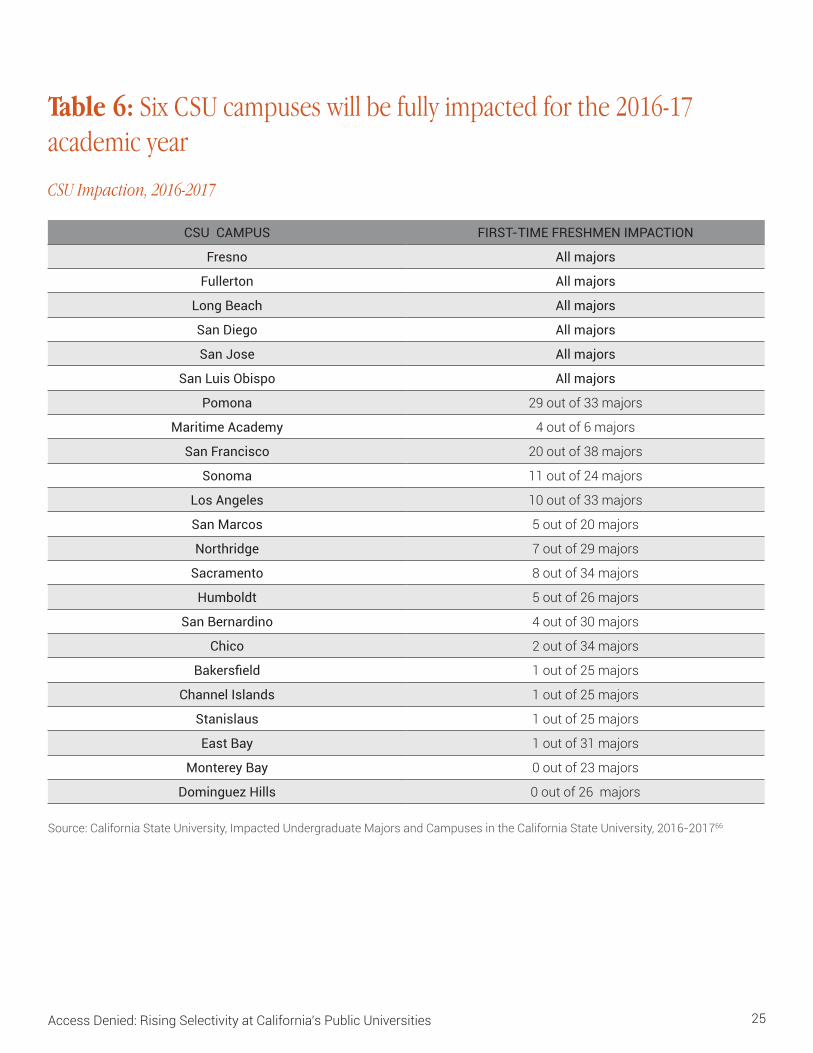
The first CSU campus to be impacted in all majors wasSan Luis Obispo in the late 1990’s, and by 2014, Fullerton, San Diego, San Jose, and Long Beach had also declared their campuses fully impacted. On these campuses, all
undergraduate majors have reached enrollment capacity and must turn away qualified students. Starting in 2016,CSU Fresno will also become fully impacted at the freshman admit level, and CSU Northridge is set increase their use of impaction as well.65
Between 2004 and 2013, the number of campuses declaring any level of impaction doubled and the number of academic programs declared impacted in the CSU system increased approximately 135 percent. Campuses such as San Francisco and Sonoma State, while not fully impacted, have asignificantnumberofmajorsthatareimpacted(roughly52and 46 percent, respectively), and others like Pomona went from 12 impacted majors in the 2015-16 academic year to 29 in the 2016-17 academic year.
A CSU campus or major can only be designated as impacted after proving to the CSU Office of theChancellor that the campus has exhausted all other options to accommodate all eligible students, which include approaches such as flexible scheduling, expanding distance learning and use of technology, and using existing facilities imaginatively, to name a few.62 As outlined in Assembly Bill No. 2402, any institution proposing changes to admissions criteria that would affect applicants residing within the local admission area(a geographic location near a specific campuswhere students receiver preferences in freshman and transfer admissions) must also satisfy a series of steps, including: a) consulting with stakeholders located within the local admission area in a public meeting; b) holding three public hearings in the campus’ local admission area to solicit public comment on the proposed change; c) providing public notice of the proposed change on the campus’ website and in three newspapers of general circulation in the local admission area that includes a description of the proposed change, the right of the public to comment, and the date, time and locations of the meetings; d) publishing all public comments and university responses, as well as the university’s finaldecision on the website of the affected campus; and e) submitting the proposed change to the of the CSU for approval who is required to decide and report on the decision to the Trustees in writing at their next regularly scheduled meeting.63 After being approved by the CSU OfficeoftheChancellor,animpactedcampuscanthenadopt more competitive admissions processes as an enrollment management strategy.
Access Denied: Rising Selectivity at California’s Public Universities 25
Table 6: Six CSU campuses will be fully impacted for the 2016-17 academic year
CSU Impaction, 2016-2017
CSU CAMPUS FIRST-TIME FRESHMEN IMPACTION
Fresno All majors
Fullerton All majors
Long Beach All majors
San Diego All majors
San Jose All majors
San Luis Obispo All majors
Pomona 29 out of 33 majors
Maritime Academy 4 out of 6 majors
San Francisco 20 out of 38 majors
Sonoma 11 out of 24 majors
Los Angeles 10 out of 33 majors
San Marcos 5 out of 20 majors
Northridge 7 out of 29 majors
Sacramento 8 out of 34 majors
Humboldt 5 out of 26 majors
San Bernardino 4 out of 30 majors
Chico 2 out of 34 majors
Bakersfield 1 out of 25 majors
Channel Islands 1 out of 25 majors
Stanislaus 1 out of 25 majors
East Bay 1 out of 31 majors
Monterey Bay 0 out of 23 majors
Dominguez Hills 0 out of 26 majors
Source: California State University, Impacted Undergraduate Majors and Campuses in the California State University, 2016-201766
26 Access Denied: Rising Selectivity at California’s Public Universities
CSU impaction bodes poorly for students, as several thousand are being completely turned away from the CSU system. And for those who may still be able to gain admission to campuses that are not fully impacted, they may not be able to gain admission to their desired campus or major.
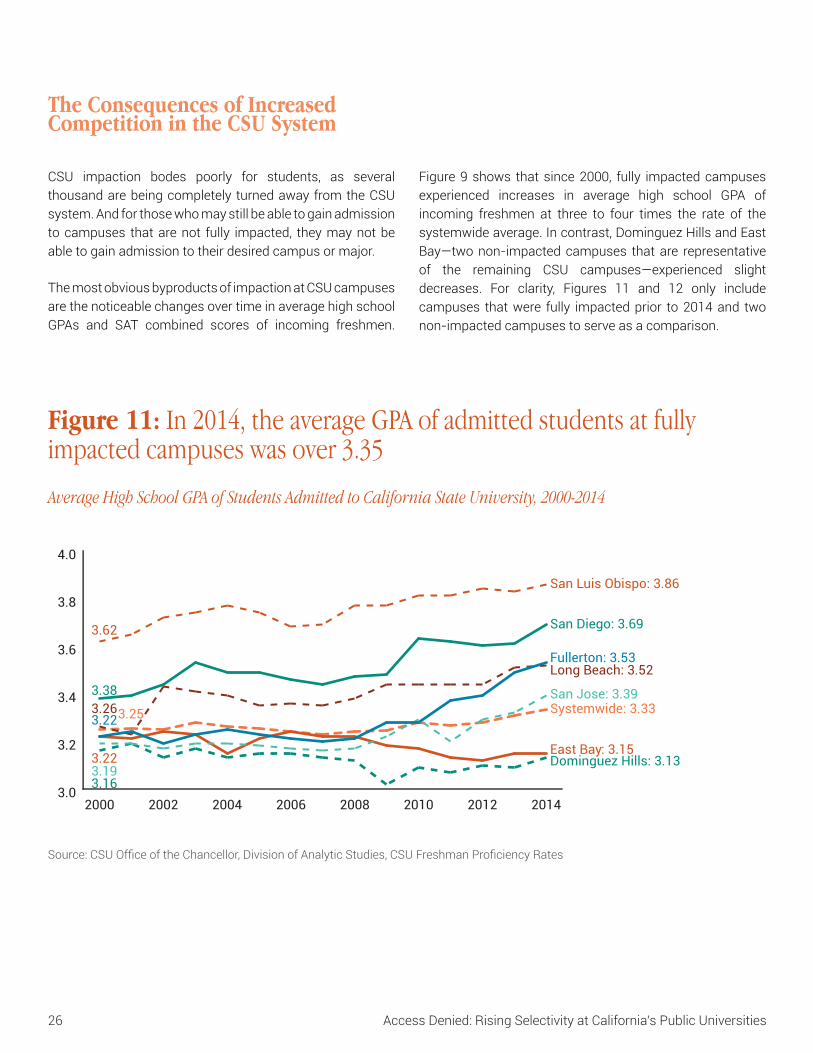
The most obvious byproducts of impaction at CSU campuses are the noticeable changes over time in average high school GPAs and SAT combined scores of incoming freshmen.
Figure 9 shows that since 2000, fully impacted campuses experienced increases in average high school GPA of incoming freshmen at three to four times the rate of the systemwide average. In contrast, Dominguez Hills and East Bay—twonon-impactedcampuses thatare representativeof the remaining CSU campuses—experienced slightdecreases. For clarity, Figures 11 and 12 only include campuses that were fully impacted prior to 2014 and two non-impacted campuses to serve as a comparison.
Figure 11: In 2014, the average GPA of admitted students at fully impacted campuses was over 3.35
Average High School GPA of Students Admitted to California State University, 2000-2014
Source:CSUOfficeoftheChancellor,DivisionofAnalyticStudies,CSUFreshmanProficiencyRates
3.0
3.2
3.4
3.6
3.8
4.0
20142012201020082006200420022000
San Luis Obispo: 3.86
Long Beach: 3.52
San Diego: 3.69
San Jose: 3.39
Fullerton: 3.53
Systemwide: 3.33
Dominguez Hills: 3.13East Bay: 3.15
3.62
3.38
3.253.263.22
3.193.16
3.22
The Consequences of Increased Competition in the CSU System

Access Denied: Rising Selectivity at California’s Public Universities 27
Figure 12 demonstrates similar trends in the average SAT combined scores, with impacted campuses showing steady increases over time while non-impacted campuses generally experienced no change or slight decreases in average scores. Systemwide, the average SAT combined score
increased only 2 points, whereas fully impacted campuses experienced increases ranging from 40 to 72 points. This means that as campuses become impacted, they raise the admissions bar making it harder for students today to get in.
Figure 12: In 2013, the average SAT scores at fully impacted campuses were over 1000
Average SAT Combined Score of Students Admitted California State University, 2000-2013
Long Beach: 1050
800
850
900
950
1000
1050
1100
1150
1200
1250
1300
20132012201020082006200420022000
San Luis Obispo: 1236
San Diego: 1115
San Jose: 1037Fullerton: 1018Systemwide: 985
Dominguez Hills: 848
East Bay: 913
1164
1069
983981
978
992
840
934
Source:CSUOfficeoftheChancellor,DivisionofAnalyticStudies,CaliforniaStateUniversityGraduationRatesConsortiumforStudentRetention Data Exchange (CSRDE).
Note: The CSU uses the old SAT scoring method.
On top of the differences in the admissions processes created by impaction, CSU admissions processes also differ for local and non-local students. In general, CSUs are regional-serving universities and typically have given priority in admissions to students residing in the local areas that they serve. To be admitted to a local CSU campus, a student attending a high school in the CSU campus’ local admission area would generally just need to meet minimum
CSU systemwide eligibility requirements. However, a student interested in applying to a CSU campus that does not serve his or her local area must often meet more selective admissions criteria in order to be admitted to that campus. Hence, a student who is applying to an impacted major on a CSU campus that is outside her local area must cross the double-hurdle of meeting more stringent admissions criteria at both the campus and major level.
CSU Local Areas
28 Access Denied: Rising Selectivity at California’s Public Universities
Recent changes at California State University, Northridge (CSUN) provide insight into how impaction affects local admission areas. Prior to the 2015-16 academic year, CSUN’s local admission area included all high schools from most of Los Angeles County and all of Ventura County. In February of 2015, however, CSUN announced plans to change its admissions criteria and localadmissionareasbywayofimpaction.Specificallyrelated to local admission areas, what was once a fairly expansive local admission area for freshmen has now been reduced by excluding all of Ventura County and a portion of east Los Angeles County. Eligible students graduating from high schools in these now-excluded areas are not guaranteed a spot at CSUN as they once were, must possess a higher eligibility index score than the CSU minimum, and must meet even higher admissions criteria if they apply to certain academic
majors (e.g., accounting, business administration, finance,psychology,kinesiology,music,andcinemaandtelevision arts). In the midst of these changes, however, CSUN is taking steps to make it a smooth transition for students affected by the changes. For example, students who reside in Ventura and Santa Barbara counties may still be given local admission priority at CSUN if their desired major is not offered at Cal State Channel Islands, the only campus available to Ventura County students with a local area admission guarantee.67 Despite these additional accommodations, the fact remains that a student’s ability to access the CSU system is reduced by changes in local admission areas. Students at certain East Los Angeles high schools now only have Cal State Los Angeles as an option for local preferences instead of having both Cal State LA and CSUN.
Effects of CSU Northridge’s Local Area Change on Freshmen Applicants
Having discussed the various aspects of impaction, it may be useful to provide a real-world scenario that sheds light on some of the barriers to Californians accessing CSU campuses. Consider a student graduating from Whittier High School in Whittier, California (southeast Los Angeles County) who meets the minimum eligibility criteria for CSU admissions as discussed above. Within 20 miles in various directions, this student has five CSU campuses: Pomona, Fullerton, Long Beach,Los Angeles, and Dominguez Hills. Seemingly, having five CSU campuses in such close proximity wouldsignificantly increase the chances of accessing theCSU system. However, campus/major impaction and local admissions preference areas at the institutional level decrease the ability of this student to access a CSU campus close to home through minimum CSU admissions eligibility. In this scenario, Fullerton is a fully
impacted campus, which means the “local” student may receive an additional bump in her eligibility index score (as opposed to the local admissions guarantee offered by some other non-impacted campuses), but is then required to compete against all applicants and must meet higher initial admissions criteria and/or higher admissions criteria for specific majors. Pomona, LosAngeles, and Long Beach do not include Whittier in their first-time freshman “local”admissionsarea,andallofthem have a significant number of impacted majors;therefore, she would be required to meet the higher admissions criteria established for “non-local” students and/or higher admissions standards for an impacted major. Dominguez Hills is the only institution in the student’s “local” area that is not currently impacted and would be accessible through the minimum eligibility criteria for the CSU system.
The Whittier High School Graduate Scenario

Access Denied: Rising Selectivity at California’s Public Universities 29
Ultimately, this scenario underscores the confusing and competitive process of gaining admission to a CSU campus. Furthermore, if these trends continue, this scenario will become more and more common for students across the state of California attempting to access the CSU system. The Task Force for a Sustainable Financial Model for the CSU recognized these issues and recommended in a recent draft report that the CSU system develop a robust process for re-directing denied eligible students from campuses at capacity to other campuses across the system that are able to accommodate additional students.68 While certainly an approach that needs to be considered, re-direction is only one part of a solution to a more complex problem of ensuring adequate funding for enrolling all eligible students.
Even considering some of the efforts discussed previously to ensure access to the CSU system, impaction in the CSU systemhasmadethecollege-goingprocessmoredifficultover time relative to demand. What used to be a fairly simple application process for students seeking admission to the CSU system is now full of variation, where students must often times navigate their way through vague or ambiguous information on admissions websites in an effort to determine if they meet minimum eligibility requirements, if their major or campus is impacted, and what that means for their chances to be admitted to college. And although we know about and can describe the criteria for a campus or major declaring impaction, no information is publicly available that speaks to the process campuses and departments go through to determine varying eligibility requirements and whether they are considering disproportionate impact or equity concerns in the admissions process for those impacted campuses or majors. A more transparent process is necessary that ensures colleges are evaluating the impact of raising the admissions bar to their universities and that guarantees a method for reversing impaction when possible and that fully address any disparate impact that this process may have for some Californians. The Campaign calls on policy makers to increase funding for the CSU system so that the CSU no longer has to deny eligible students, decrease unnecessary competition and give today’s generation of diverse Californians the same level of access to our public universities as previous generations.
The Importance of Community College Transfer Pathways
This report is focused on the ability of California’s UC and CSU to serve first-time freshman applicants. However, itis important to understand the role the community college system plays in bachelor’s degree attainment in California.
By design, the Master Plan caps enrollment in the UC and CSU to the top 12.5 and 33.3 percent of high school graduates, and assigns the community college system with the important role of preparing students for transfer to the UC and CSU. Therefore, transferring from a community college is intended to serve as another pathway to bachelor’s degree attainment for students falling outside of the top 33.3 percent of high school graduates. This community college transfer option is important, as over 70 percent of all students enrolled in California’s public higher education system are enrolled in a community college (see Figure 16). Unfortunately, the transfer process is broken. Between 1980 and 2013, enrollment in California’s community college system has grown by 65 percent, from 885,658 students to 1,462,866 students (see Figure 15); yet, the number of students community colleges send to the UC and CSU has remained fairly consistent over time ranging from around 57,000 students to 64,000 student annually.69 On a positive note more recent efforts like the adoption of Transfer Reform SB 1440/440 (Padilla) have established clearer pathways for community college students seeking admission to the CSU system.
Another major issue with the transfer process is that both theUCandtheCSUhaveafinitenumberofnewstudentsthat they can enroll each year. In accordance with the Master Plan, the UC determines their new student enrollment using a 2:1 ratio of new freshmen and community college transfers.
Despite the statutory ratio, approximately 70 percent of all new student enrollment within the UC system occurs at the freshmen level (as seen in Figure 13).

30 Access Denied: Rising Selectivity at California’s Public Universities
Figure 13: The UC system enrolls freshmen to transfers at nearly a 2:1 ratio
Percentage of First-time Freshmen to Undergraduate Transfer Students at the University of California, Fall Enrollment, 1996-2014
20%
30%
40%
50%
60%
70%
80%
2014
2013
2012
2011
2010
2009
2008
2007
2006
2005
2004
2003
2002
2001
2000
1999
1998
1997
1996
30%
71% First-timeFreshmen: 70%
Transfer: 30%
Source:UniversityofCaliforniaOfficeofthePresident
29 percent of UC graduates and 51 percent of CSU graduates started their college journeys
in a California community college.70

Access Denied: Rising Selectivity at California’s Public Universities 31
Historically, new student enrollment in the CSU system was weighted heavily towards community college students over first-time freshmen. Despite an increase in the numberof community college transfer students enrolling in the CSU system, enrollment figures suggest that the typicallyhigher percentage of community college transfer student enrollment has changed in recent years. In 1996, 57 percent of all CSU new student enrollment came from community college transfers (see Figure 14). By 2014, that percentage had decreased to 45 percent. Conversely, the percentage of newCSUstudentenrollmentfromfirst-timefreshmenhasincreased from 43 percent in 1996 to 56 percent in 2014. Although not included in Figure 14, it is important to note that we also calculated new student enrollment for the entire academic year as opposed to only fall enrollment and found
a similar pattern where the CSU has switched to enrolling more new students as freshmen as opposed to community college transfers.
California’s UC and CSU engage in a give and take when it comes to enrolling freshmen versus transfer students. That means that if current reforms to transfer pathways (e.g., SB 1440)significantlyincreasethenumberoftransferstudents,there may not be space for the CSU and UC to absorb those studentswithoutdisplacingfirst-timefreshmen.The bottom line is that capacity must be expanded at the four-year level to serve any potential increase in transfer enrollment and meet the growing demand of eligible freshman applicants. The UC and CSU should not be forced to choose between enrolling freshmen or transfer students.
Figure 14: Since 2000, first-time freshmen make up a greater percentage of enrollments in the CSU than transfer students
Percentage of First-time freshmen to Undergraduate Transfer Students at California State University, Fall Enrollment, 1996-2014
40%
45%
50%
55%
60%
2014
2013
2012
2011
2010
2009
2008
2007
2006
2005
2004
2003
2002
2001
2000
1999
1998
1997
1996
57%
43%
First-timeFreshmen: 56%
Transfer: 45%
California State University, Division of Analytic Studies
32 Access Denied: Rising Selectivity at California’s Public Universities
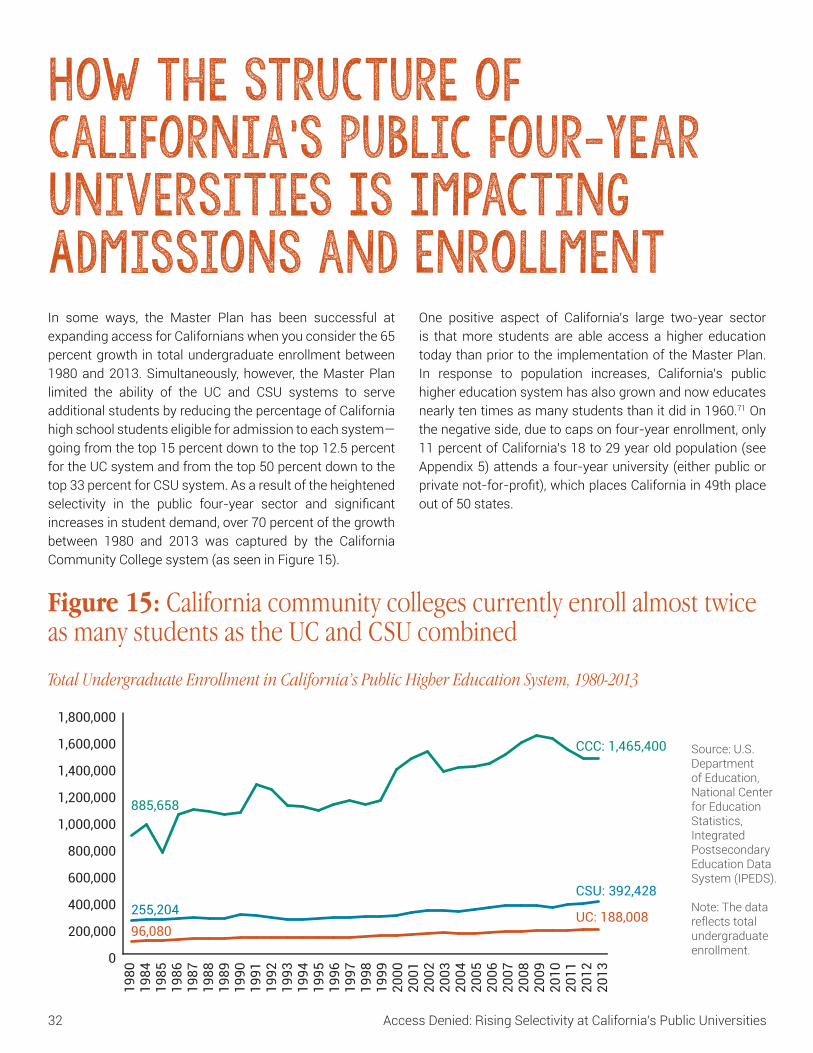
In some ways, the Master Plan has been successful at expanding access for Californians when you consider the 65 percent growth in total undergraduate enrollment between 1980 and 2013. Simultaneously, however, the Master Plan limited the ability of the UC and CSU systems to serve additional students by reducing the percentage of California highschoolstudentseligibleforadmissiontoeachsystem—going from the top 15 percent down to the top 12.5 percent for the UC system and from the top 50 percent down to the top 33 percent for CSU system. As a result of the heightened selectivity in the public four-year sector and significantincreases in student demand, over 70 percent of the growth between 1980 and 2013 was captured by the California Community College system (as seen in Figure 15).
One positive aspect of California’s large two-year sector is that more students are able access a higher education today than prior to the implementation of the Master Plan. In response to population increases, California’s public higher education system has also grown and now educates nearly ten times as many students than it did in 1960.71 On the negative side, due to caps on four-year enrollment, only 11 percent of California’s 18 to 29 year old population (see Appendix 5) attends a four-year university (either public or privatenot-for-profit),whichplacesCaliforniain49thplaceout of 50 states.
How the Structure of California’s Public Four-Year Universities Is Impacting Admissions and Enrollment
Figure 15: California community colleges currently enroll almost twice as many students as the UC and CSU combined
Total Undergraduate Enrollment in California’s Public Higher Education System, 1980-2013
Source: U.S. Department of Education, National Center for Education Statistics, Integrated Postsecondary Education Data System (IPEDS).
Note: The data reflects total undergraduate enrollment.0
200,000
400,000
600,000
800,000
1,000,000
1,200,000
1,400,000
1,600,000
1,800,000
2013
2012
2011
2010
2009
2008
2007
2006
2005
2004
2003
2002
2001
2000
1999
1998
1997
1996
1995
1994
1993
1992
1991
1990
1989
1988
1987
1986
1985
1984
1980
255,204
885,658
96,080
CCC: 1,465,400
CSU: 392,428
UC: 188,008

Access Denied: Rising Selectivity at California’s Public Universities 33
92.9%92.9%
0% 20% 40% 60% 80% 100%
CALIFORNIAIllinois
WyomingArizona
IowaNew Mexico
North CarolinaTexas
MississippiOregon
MinnesotaHawaii
New JerseySouth Carolina
VirginiaMaryland
MassachusettsConnecticut
KansasNew YorkNebraskaMichiganKentucky
TennesseeMissouri
Rhode IslandWashington
WisconsinArkansas
OhioOklahoma
MaineAlabama
LouisianaDelawareColorado
New HampshireGeorgia
PennsylvaniaIdaho
IndianaVermont
West VirginiaUtah
MontanaSouth DakotaNorth Dakota
NevadaFloridaAlaska 92.9% 7.1%
90.3%88.2%
73.8%75.6%
79.8%83.3%83.4%
61.1%62.0%62.5%62.7%
64.6%66.8%
73.8%
59.4%59.8%60.0%60.3%60.7%60.7%
53.4%53.6%54.1%54.6%
59.1%59.3%
48.5%48.8%
50.2%51.8%51.9%52.9%
45.9%
46.8%
46.1%46.2%
46.8%46.8%47.1%48.2%
42.7%45.7%
42.2%39.2%39.0%
36.0%30.8%
29.2%28.4%
9.7%11.8%
26.2%24.4%
20.2%16.7%16.6%
39.3%39.3%38.9%38.0%37.5%37.3%
35.4%33.2%
26.2%
40.9%40.7%40.6%40.2%40.0%39.7%
49.8%48.2%48.1%
47.1%46.6%46.4%45.9%45.4%
54.1%53.9%53.8%53.2%53.2%53.2%52.9%51.8%51.5%51.2%
71.6%70.8%
69.2%64.0%
61.0%60.8%
57.8%57.3%
54.3%
Figure 16: California ranks last nationally in terms of the percentage of undergraduate students enrolled in a four-year public university
Percent Public Institution Undergraduate Enrollment by Two-Year and Four-Year Institutions, Fall 2013
Four-year
Two-year
Source: U.S. Department of Education, National Center for Education Statistics, Integrated Postsecondary Education Data System (IPEDS). Data reflects total undergraduate enrollment.

34 Access Denied: Rising Selectivity at California’s Public Universities
States that enroll a smaller proportion of their college-age population in four-year institutions also tend to have lower bachelor’s degree completions.72 Thus, despite the rapid growth in California’s public higher education system, California is still falling behind other states, ranking 45th nationally in bachelor’s degree completions within the college-age population (see Appendix 4).
Why is it important that eligible CSU and UC applicants get their spot in four-year systems?
Where a student starts their college career is an important factor in determining whether they will complete their bachelor’s degree. Students enrolling as freshmen directly into a four-year institutions are more likely to eventually complete a bachelor’s degree.73
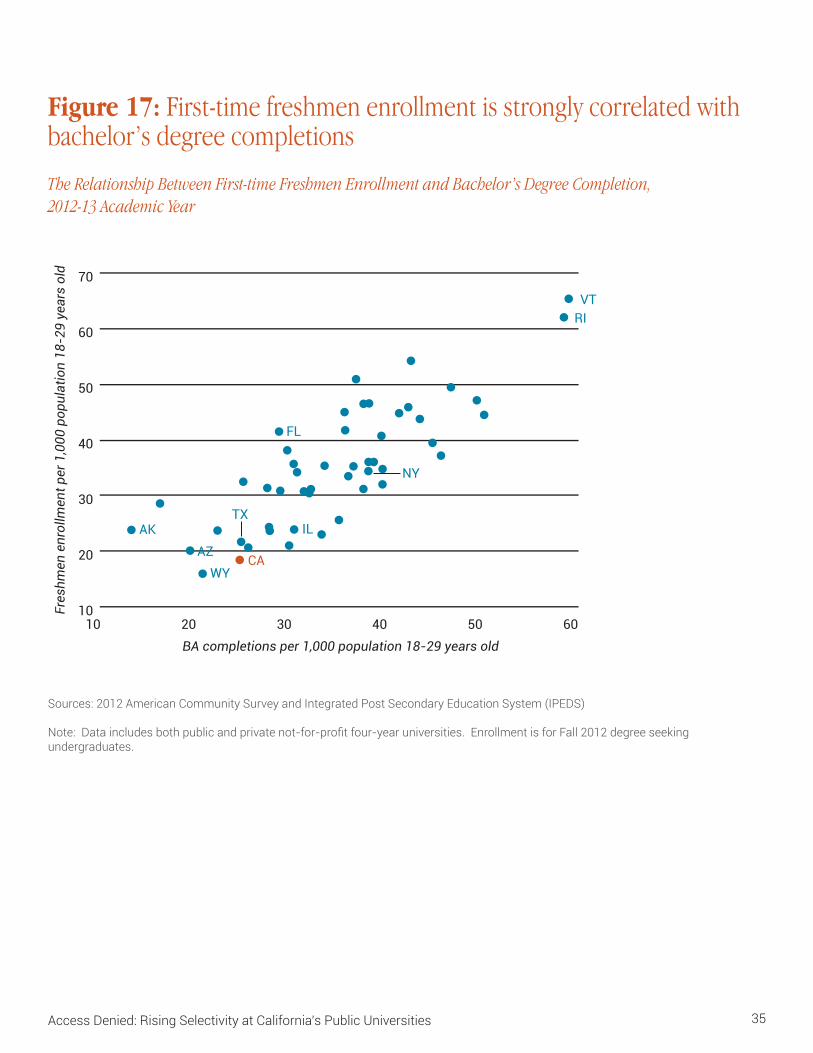
Figure 17 shows the relationship between first-timefreshmen enrollment in a four-year institution and bachelor’s degree completion among students 18-29 years old for all 50 states.Results indicate that a state’s rate of first-timefreshmen enrollment in a four-year university is strongly related to a state’s rate of bachelor’s degree completion within each state’s college-age population.
Our analysis of U.S. Department of Education (IPEDS) enrollment and completions data finds similar results towhat others have found with regard to the importance of first-time freshman enrollment over transfer enrollment inbachelor’s degree completions. At the national level, results suggestthattherateoffirst-timefreshmenenrollmentinafour-year university for the college-age (18 to 29) population is more strongly associated with the rate of bachelor’s degree completion within the college-age population than is the rate of transfer enrollment within the college-age population(seeAppendix1).OurfindingsfromCaliforniaalsoyielded similar results, in which after controlling for sector offour-yearinstitution(i.e.,publicorprivatenot-for-profit),first-timefreshmenenrollmentismorestronglyassociatedwith bachelor’s degree completions than transfer student enrollment (see Appendix 2).
Thesefindingssuggestthatincreasingfirst-timefreshmanenrollment at the four-year level is crucial for improving rates of college completion in California and is therefore vital foraddressingthestate’sbachelor’sdegreedeficit.Whileitmay be tempting for some to blame academic preparation for California’s low bachelor’s degree attainment rate, other states are contending with similar issues yet enroll a greater proportion of their student population in four-year colleges and universities and have better outcomes as it relates to bachelor’s degree completions.
Due to the small enrollment in California’s four-year sector relative to its two-year sector,
Caifornia ranks last in the nation in the proportion of its students enrolled in four-
year versus two-year colleges.
Access Denied: Rising Selectivity at California’s Public Universities 35
Figure 17: First-time freshmen enrollment is strongly correlated with bachelor’s degree completions
The Relationship Between First-time Freshmen Enrollment and Bachelor’s Degree Completion, 2012-13 Academic Year
Sources: 2012 American Community Survey and Integrated Post Secondary Education System (IPEDS)
Note:Dataincludesbothpublicandprivatenot-for-profitfour-yearuniversities.EnrollmentisforFall2012degreeseekingundergraduates.
10 20 30 40 50 6010
20
30
40
50
60
70
CA
BA completions per 1,000 population 18-29 years old
Fres
hmen
enr
ollm
ent p
er 1
,000
pop
ulat
ion
18-2
9 ye
ars
old
VTRI
WYAZ
AK
NY
TXIL
FL

36 Access Denied: Rising Selectivity at California’s Public Universities
At a time when California is predicted to be short 1.1 million bachelor’s degrees needed to meet the future demands of its economy, it should not be harder for the current generation of California high school graduates be admitted to either the UC or CSU today than it was for past generations.
One of the greatest strengths of the Master Plan was its ability to adapt to California’s rapid population growth while still providing access to higher education for a significantproportion of Californians. While the Master Plan should be lauded for providing access, the percentage caps placed on enrollment in the University of California (12.5 percent) and California State University (33.3 percent) are creating a zero-sum game. Increased competition for limited spots in college isnotawin-winsituation—itcreateswinnersandlosersatatime when our economy demands that more students have the college preparation that more jobs require.
In addition to the zero-sum nature of college eligibility in a system that is not able to expand to meet growing student and workforce demands, students seeking to obtain admission to popular UC and CSU campuses are facing an increasingly competitive environment. As the number of applications to schools like UC Berkeley, UCLA, Cal Poly-San
Luis Obispo, and San Diego State soar, students are forced to compete with each other at an unprecedented level for a limited number of spots. This level of competition is heightened in years where the state cuts or inadequately funds enrollment for the UC and CSU.
California is in the enviable position of having a diverse and growing young adult population that is more prepared for college than ever before, wants to go to college, and can compete in a more globalized economy if it receives the preparation and skills necessary for the 21st century. While the enrollment caps of the Master Plan for Higher Education in 1960 were visionary for those times, they are inadequate for today. Increasing the number of Californians able to attend our UC and CSU is what the state needs to ensure that it prepares the educated workforce needed to strengthen our economy, and stop making it harder for our students today to realize their college dreams. We need courageous and visionary leadership from the Governor and state policymakers who need to renew their commitment to investing in California’s human capital. Just like California’s drought threatens our future and calls for immediate solutions, so does the state’s potential shortage of a college-educated populace.
Conclusion
Just like California’s drought threatens our future and calls for immediate
solutions, so does the state’s potential shortage of a college-educated populace.

Access Denied: Rising Selectivity at California’s Public Universities 37
California needs a new strategic vision that acknowledges the limitations of its public higher education system and can focus on meeting the increased demands of both students who want to go to college and employers who need better skilled workers. Californians need a vision for higher education focused on the 21st century and not steeped in the history of the 1960’s. This vision includes ensuring that college opportunity and success are equally available to all Californians across the diversity of race/ethnicity, income status, and regions. Californians need courageous college leaders willing to do things differently in order to serve more studentsandensuretheirsuccess.Belowaresomespecificrecommendations:
The Governor and Legislature need to develop and adopt a statewide plan for higher education. A statewide plan would allow California to be intentional about maintaining and strengthening access to public higher education for all students in California. While the Master Plan of 1960 was visionary for its time, it no longer reflects California’s diverse and growing population or the future needs of the economy. The plan would provide policymakers and stakeholders the opportunity to assess the state’s needs, identify attainment goals, and align all policy and funding priorities to achieving those goals.
Revise the Master Plan enrollment caps to allow more students to enroll directly into California’s UC and CSU systems, beyond what the current 12.5 percent for the UC and 33.3 percent for the CSU permits. California’s public four-year sector is
simply too small to adequately serve the growing population and the increased demand by employers for better skilled workers.74 California policy makers should at a minimum consider increasing the enrollment caps so that the UC once again draws from the top 15 percent of high school graduates and the CSU draws from the top 40 percent of high school graduates.
Werecognizethatsuchmodificationshaveseriousimpacts on state investments in higher education. We believe a thorough review of how to grow enrollment, improve success rates for students once they are in college and explore innovation to increase college access is long over due. Given the exceptional return on investment for state funds spent on our human capital, we also trust that in the long term, expanding college opportunity and increasing the number of college graduates in California will be worth every dollar.
Even if a statewide plan for higher education is not adopted and enrollment caps are not moved, today the legislature and Governor could fully fund the UC and CSU to serve all eligible students. It is clear that demand outweighs capacity at California’s public four-year institutions.
a. For the UC, funding should be allocated in a way that allows the UC to enroll more eligible in-state students at a campus of their choice, thus, eliminating the need for the referral pool and expanding diversity at all campuses.
Policy Implications and Recommendations
2
1
3

38 Access Denied: Rising Selectivity at California’s Public Universities
b. For the CSU, funding should be allocated such that the CSU no longer has to turn away eligible in-state students and lessens or fully eliminates the need for impaction of campuses and within majors.
c. For both systems, efforts should be made to increase the participation rate of California high school graduates in both the UC and CSU system directly after graduating from high school.
The UC should further cap out of state and international students, particularly at its most popularcampuses,especiallywithsomanyqualifiedand talented Californians seeking admission. It should also phase out the practice of providing anyaidtonon-residentstudentsuntilthefinancialneeds of all low- and middle-income Californians are met.
The CSU system should immediately work to ensure that impaction is better understood by students and their families, both across campuses and majors. As students navigate the application process, they deserve a clear understanding of
what their chances are for admissions. All CSU campuses should make sure information related to the academic credentials needed for students to gain admission to a particular campus/major are clearly presented on each campus’ website. While some CSU campuses post information with regards to the minimum admissions index score needed, others do not. The CSU should mandate that all schools present this information.
CSU impaction should be reviewed on a regular basis. While a formal process for CSU campuses to declare impaction exists, to our knowledge there is no process for reevaluating the need for impaction at each campus at any regular interval, nor is there a process for reviewing whether impaction is having adisproportionateimpactonaspecificcommunityof students.
The CSU system should construct a formal referral process so that CSU eligible students denied admission at impacted campuses are admitted to and are able to enroll at another regional area campus.
4
5
6
7

Access Denied: Rising Selectivity at California’s Public Universities 39
Linearregressionmodelexaminingtherelationshipbetweentherateoffirst-timefreshmenenrollmentinthecollege-agepopulation (18 to 29) and transfer enrollment in the college-age population on BA degree completions in the college-age population.
APPENDIX 1
Source SS df MSModel
Residual3104.97591 2 1552.487961386.975 47 29.5101064
Total 4491.95091 49 91.6724675
Number of obs = 50F (31 74) = 52.61Prob > F = 0.0000R-squared = 0.6912Adj R-squared = 0.6781Root MSE = 5.4323
BAcomp_All_pop Coef. Std. Err. t P>|t| BetaUGenroll_All_Fresh_popUGenroll_All_Trans_pop
_cons
.6675455 .0727821 9.17 0.000 .770169 .4383305 .2152575 2.04 0.047 .1709909 3.970359 3.80971 1.04 0.303 .
Notes:Weused fall 2012data for first-time freshmenenrollment ina four-yearuniversityand transfer enrollment. ThedependentvariableBAcompletionsrepresentsthegrandtotalofbachelor’sdegreesawarded(firstmajor).Foreachstate,a rate was calculated using the sum of their enrollment (freshmen and transfer) or degree completions based on 2012 American Community Survey (ACS) estimates of the 18-29 population for each state. Note. The IPEDS transfer variable is an imperfect measure as we don’t know from which school students transferred. IPEDS enrollment and completions data is representativeofpublicandprivatenotforprofitinstitutions.
Stata code formulas for calculating rates
bysort State: gen UGenroll_All__Fresh_pop=( sum freshmen enrollment /ACS population estimate)*1000
bysort State: gen UGenroll_All__trans_pop=( sum transfer enrollment /ACS population estimate)*1000
bysort State: gen BAcomp_All=( sum BA degrees awarded/ACS population estimate)*1000
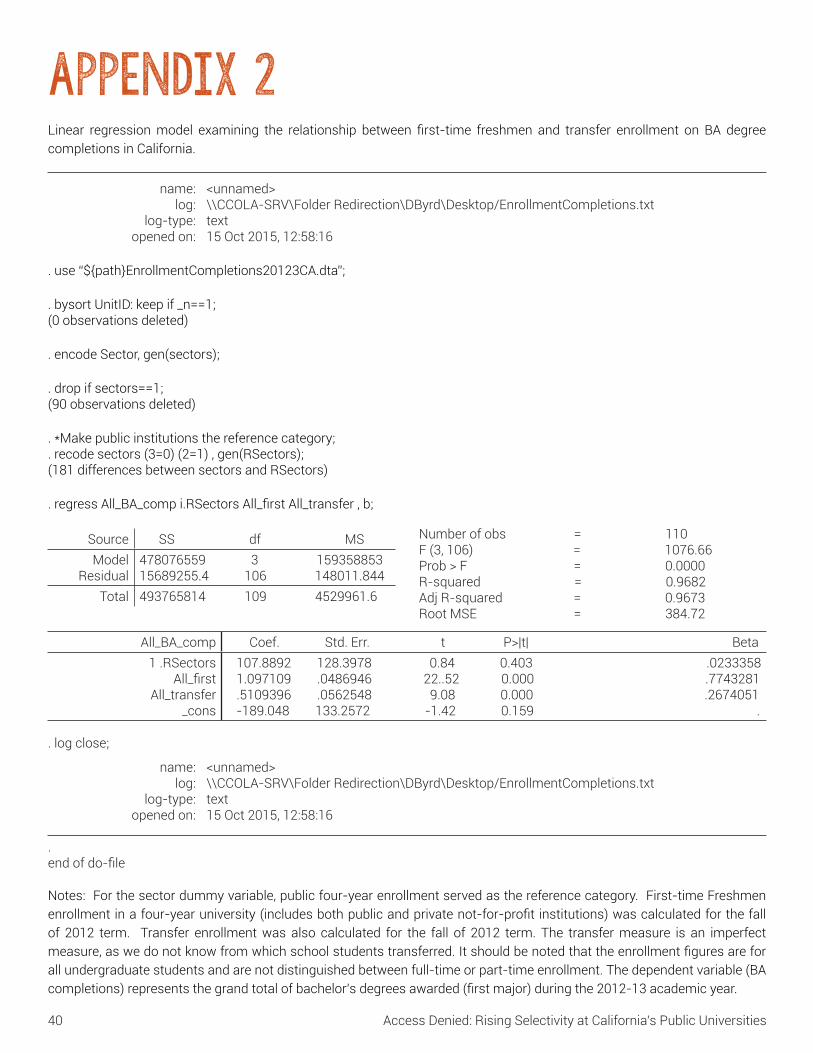
40 Access Denied: Rising Selectivity at California’s Public Universities
Linear regressionmodel examining the relationship between first-time freshmen and transfer enrollment on BA degreecompletions in California.
APPENDIX 2
name:log:
log-type:opened on:
<unnamed>\\CCOLA-SRV\Folder Redirection\DByrd\Desktop/EnrollmentCompletions.txttext15 Oct 2015, 12:58:16
.use“${path}EnrollmentCompletions20123CA.dta”;
. bysort UnitID: keep if _n==1; (0 observations deleted)
. encode Sector, gen(sectors);
. drop if sectors==1; (90 observations deleted)
. *Make public institutions the reference category;
. recode sectors (3=0) (2=1) , gen(RSectors); (181 differences between sectors and RSectors)
.regressAll_BA_compi.RSectorsAll_firstAll_transfer,b;
Source SS df MSModel
Residual478076559 3 15935885315689255.4 106 148011.844
Total 493765814 109 4529961.6
Number of obs = 110F (3, 106) = 1076.66Prob > F = 0.0000R-squared = 0.9682Adj R-squared = 0.9673Root MSE = 384.72
All_BA_comp Coef. Std. Err. t P>|t| Beta1 .RSectors
All_firstAll_transfer
_cons
107.8892 128.3978 0.84 0.403 .0233358 1.097109 .0486946 22..52 0.000 .7743281 .5109396 .0562548 9.08 0.000 .2674051 -189.048 133.2572 -1.42 0.159 .
. log close;
name:log:
log-type:opened on:
<unnamed>\\CCOLA-SRV\Folder Redirection\DByrd\Desktop/EnrollmentCompletions.txttext15 Oct 2015, 12:58:16
.endofdo-file
Notes: For the sector dummy variable, public four-year enrollment served as the reference category. First-time Freshmen enrollmentinafour-yearuniversity(includesbothpublicandprivatenot-for-profitinstitutions)wascalculatedforthefallof 2012 term. Transfer enrollment was also calculated for the fall of 2012 term. The transfer measure is an imperfect measure,aswedonotknowfromwhichschoolstudentstransferred.Itshouldbenotedthattheenrollmentfiguresareforall undergraduate students and are not distinguished between full-time or part-time enrollment. The dependent variable (BA completions)representsthegrandtotalofbachelor’sdegreesawarded(firstmajor)duringthe2012-13academicyear.

Access Denied: Rising Selectivity at California’s Public Universities 41
Bachelor’s Degree Completion per 1,000 in the 18 to 29 College-Age Population Per State
State Bachelor’s Degree Completion State Bachelor’s Degree
CompletionAlaska 13.22 North Carolina 31.85
Alabama 33.45 North Dakota 42.50Arkansas 29.55 Nebraska 45.64Arizona 19.37 New Hampshire 46.68
California 24.57 New Jersey 29.74Colorado 32.02 New Mexico 22.24
Connecticut 38.06 Nevada 16.22Delaware 41.26 New York 38.04
Florida 28.68 Ohio 35.61Georgia 24.94 Oklahoma 30.57Hawaii 25.46 Oregon 34.95Iowa 44.76 Pennsylvania 43.43Idaho 38.60 Rhode Island 58.52Illinois 30.26 South Carolina 28.81Indiana 42.22 South Dakota 37.53Kansas 39.52 Tennessee 31.28
Kentucky 30.21 Texas 24.71Louisiana 27.45 Utah 50.16
Massachusetts 49.40 Virginia 35.94Maryland 33.14 Vermont 59.02
Maine 38.11 Washington 27.71Michigan 36.48 Wisconsin 39.40
Minnesota 37.52 West Virginia 36.75Missouri 39.53 Wyoming 20.68
Mississippi 27.64Montana 35.54 California Rank 45th in the country
Note:Dataincludesgraduatesfrompublicfour-yearuniversitiesandprivatenotforprofitfour-yearuniversities.
APPENDIX 3
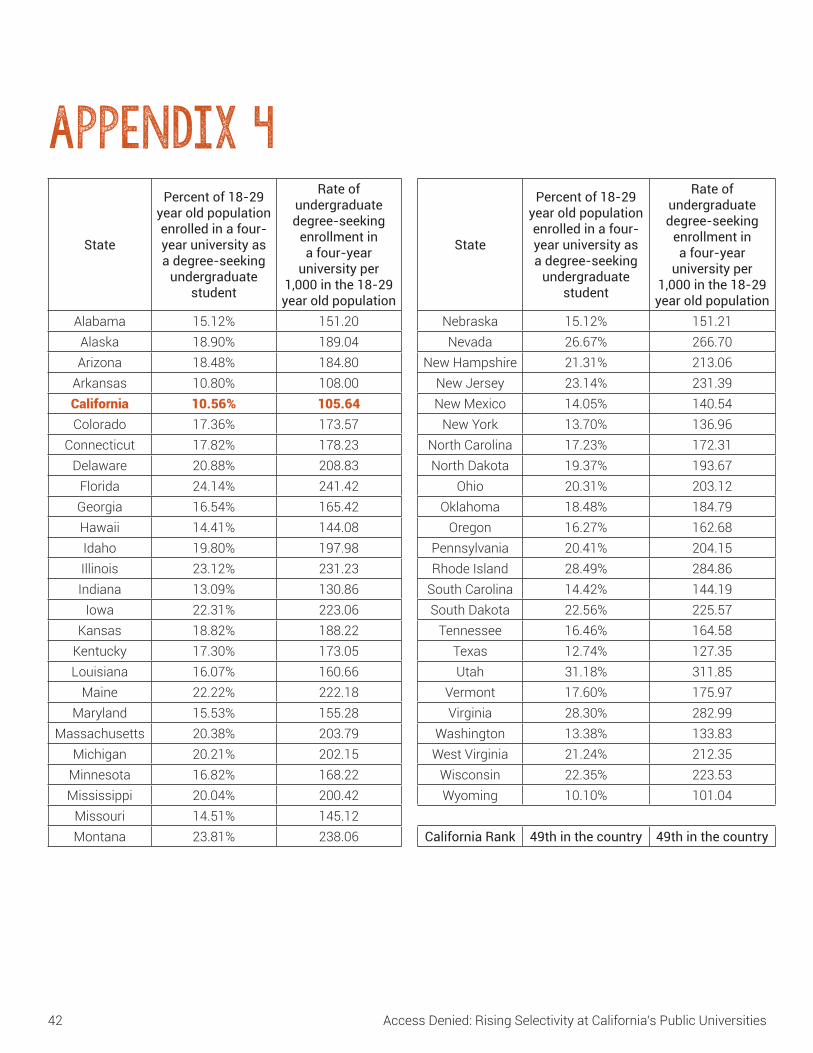
42 Access Denied: Rising Selectivity at California’s Public Universities
State
Percent of 18-29 year old population enrolled in a four-year university as a degree-seeking
undergraduate student
Rate of undergraduate degree-seeking
enrollment in a four-year
university per 1,000 in the 18-29 year old population
State
Percent of 18-29 year old population enrolled in a four-year university as a degree-seeking
undergraduate student
Rate of undergraduate degree-seeking
enrollment in a four-year
university per 1,000 in the 18-29 year old population
Alabama 15.12% 151.20 Nebraska 15.12% 151.21Alaska 18.90% 189.04 Nevada 26.67% 266.70Arizona 18.48% 184.80 New Hampshire 21.31% 213.06
Arkansas 10.80% 108.00 New Jersey 23.14% 231.39California 10.56% 105.64 New Mexico 14.05% 140.54Colorado 17.36% 173.57 New York 13.70% 136.96
Connecticut 17.82% 178.23 North Carolina 17.23% 172.31Delaware 20.88% 208.83 North Dakota 19.37% 193.67
Florida 24.14% 241.42 Ohio 20.31% 203.12Georgia 16.54% 165.42 Oklahoma 18.48% 184.79Hawaii 14.41% 144.08 Oregon 16.27% 162.68Idaho 19.80% 197.98 Pennsylvania 20.41% 204.15Illinois 23.12% 231.23 Rhode Island 28.49% 284.86Indiana 13.09% 130.86 South Carolina 14.42% 144.19
Iowa 22.31% 223.06 South Dakota 22.56% 225.57Kansas 18.82% 188.22 Tennessee 16.46% 164.58
Kentucky 17.30% 173.05 Texas 12.74% 127.35Louisiana 16.07% 160.66 Utah 31.18% 311.85
Maine 22.22% 222.18 Vermont 17.60% 175.97Maryland 15.53% 155.28 Virginia 28.30% 282.99
Massachusetts 20.38% 203.79 Washington 13.38% 133.83Michigan 20.21% 202.15 West Virginia 21.24% 212.35
Minnesota 16.82% 168.22 Wisconsin 22.35% 223.53Mississippi 20.04% 200.42 Wyoming 10.10% 101.04
Missouri 14.51% 145.12Montana 23.81% 238.06 California Rank 49th in the country 49th in the country
APPENDIX 4
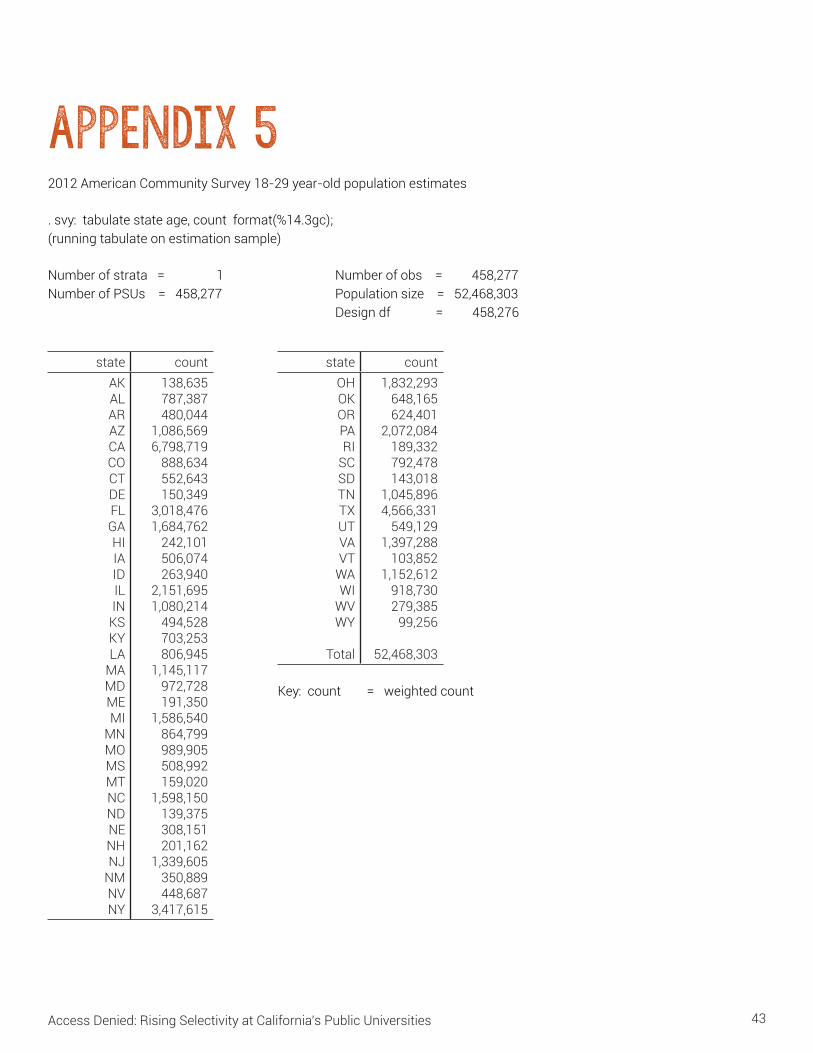
Access Denied: Rising Selectivity at California’s Public Universities 43
2012 American Community Survey 18-29 year-old population estimates
. svy: tabulate state age, count format(%14.3gc); (running tabulate on estimation sample)
Number of strata = 1 Number of obs = 458,277 Number of PSUs = 458,277 Population size = 52,468,303 Design df = 458,276
APPENDIX 5
state countAKALARAZCACOCTDEFLGAHIIAIDILIN
KSKYLA
MAMDMEMI
MNMOMSMTNCNDNENHNJ
NMNVNY
138,635787,387480,044
1,086,5696,798,719
888,634552,643150,349
3,018,4761,684,762
242,101506,074263,940
2,151,6951,080,214
494,528703,253806,945
1,145,117972,728191,350
1,586,540864,799989,905508,992159,020
1,598,150139,375308,151201,162
1,339,605350,889448,687
3,417,615
state countOHOKORPARI
SCSDTNTXUTVAVT
WAWI
WVWY
Total
1,832,293648,165624,401
2,072,084189,332792,478143,018
1,045,8964,566,331
549,1291,397,288
103,8521,152,612
918,730279,385
99,256
52,468,303
Key: count = weighted count

44 Access Denied: Rising Selectivity at California’s Public Universities
A special thanks to our principal funders for this project: California Education Policy Fund, College Futures Foundation, Sand Hill Foundation, Angell Foundation, Evelyn & Walter Haas Jr. Fund, Ford Foundation, Kresge Foundation, Lumina Foundation, Rosalinde and Arthur Gilbert Foundation, and Walter S. Johnson Foundation. Their commitment and dedication to increasing opportunity for all Americans in higher education is to be admired. We would also like to thank the additional funders who make our work possible, including: The California Wellness Foundation, David & Lucille Packard Foundation, and the Working Poor Families Project.
Thisreportwouldnothavebeenpossiblewithoutthecriticalinput,feedback,andsignificanttimeofourreviewers.TheCampaign for College Opportunity is grateful for their involvement, expertise, and guidance. Our reviewers included Saul Geiser, Pam Burdman, Hans Johnson, Stephen Handel, Nina Robinson, Colleen Moore, Nancy Shulock, Edward Sullivan, Ginger Reyes, Mary Gill, and Charles Masten.
We would also like to thank the numerous people and organizations which have been calling attention to this issue for decades. Principal authors and researchers of this report are Daniel Byrd, Ph.D., Rob Shorette, Ph.D., and Michele Siqueiros, with contributions from Tiffany Tsang and Audrey Dow.
Acknowledgments
Page 1
Getting into the University of California:Sourceforallfigures-UniversityofCaliforniaOfficeofthePresident(UCOP).Getting into the California State University:Fullyimpactedcampuses–CaliforniaStateUniversityChancellor’sOffice;Numberofdenied students - Senate Budget and Fiscal Review Subcommittee.
Page 2
Where California ranks:Sourcesforallfigures-U.S.CensusBureauandNationalCenterforEducationStatistics,IntegratedPostsecondary Education Data System. Who’s paying for college?:Statefundingvstuitionchart–LegislativeAnalystOfficeand the California Department of Finance; State funding chart - California Department of Finance.
Infographic Notes and Sources

Access Denied: Rising Selectivity at California’s Public Universities 45
1 Johnson, Hans. (2012). Defunding Higher Education: What are the Effects on College Enrollment? A report produced by the Public Policy Institute of California. Retrieved from http://www.ppic.org/content/pubs/report/R_512HJR.pdf on October 12, 2015.
2 Stiles, J., Hout, M. & Deutsch, M. (2012). Economic Payoff: Investing in College Access & Completion. The Campaign for College Opportunity. Retrieved from http://collegecampaign.org/wp-content/uploads/2014/06/Californias_Economic_Payoff_Full_Report_FINAL.pdf on October 12, 2015.
3 Stiles, J., Hout, M. & Deutsch, M. (2012). Economic Payoff: Investing in College Access & Completion. The Campaign for College Opportunity. Retrieved from http://collegecampaign.org/wp-content/uploads/2014/06/Californias_Economic_Payoff_Full_Report_FINAL.pdf on October 12, 2015.
4 Geiser, S. & Atkinson, R.C. (2012). Beyond the Master Plan: The Case for Restructuring Baccalaureate Education in California. California Journal of Politics and Policy. Retrieved from http://www.cshe.berkeley.edu/sites/default/files/shared/publications/docs/Geiser_S-Beyond_the_Master_Plan.pdf on October 12, 2015.
5 California State University. (2002). Budget Cuts Force California State University Board of Trustees to Raise Fees. Retrieved from https://www.calstate.edu/pa/news/2002/BOTfees2.shtml on November 20, 2015.
6UniversityofCaliforniaOfficeofthePresident(2014).UniversityofCaliforniaReporttotheGovernorandtheLegislature:Three‐YearFinancialSustainabilityPlanandPerformanceOutcomeMeasureGoals.Retrievedfromhttp://regents.universityofcalifornia.edu/regmeet/nov14/l5attach.pdf on November, 17, 2015.
7 California Budget & Policy Center. (2015). State Spending Per Student at CSU and UC Remains Near the Lowest Point in More Than 30 Years. Retrieved from http://calbudgetcenter.org/resources/state-spending-per-student-at-csu-and-uc-remains-near-the-lowest-point-in-more-than-30-years/ on November 17, 2015.
8 California Department of Finance. (2015). California Budget 2015-16. Retrieved from http://www.ebudget.ca.gov/home.php?selectedYear=2015-16 on November 20, 2015.
9 California Department of Finance. (2015). California Budget 2015-16. Retrieved from http://www.ebudget.ca.gov/home.php?selectedYear=2015-16 on November 20, 2015.
10 Geiser, S. (2014). Back to the Future: Freshman Admissions at the University of California, 1994 to the Present and Beyond. Retrieved from http://www.cshe.berkeley.edu/publications/back-future-freshman-admissions-university-california-1994-present-and-beyond on November 20, 2015.
11 Koseff, A. (2014). University of California steps up out-of-state recruiting. The Sacramento Bee. Retrieved from http://www.sacbee.com/news/politics-government/article2606325.html on August 3, 2015.
12CaliforniaStateUniversityOfficeoftheChancellor.(2015).California Faces a Degree Gap: CSU is the Solution. Retrieved from http://blogs.calstate.edu/pa/news/wp-content/uploads/2015/04/Enrollment.pdf on July 5, 2015.
13 Johnson, Hans. (2012). Defunding Higher Education: What are the Effects on College Enrollment? A report produced by the Public Policy Institute of California. Retrieved from http://www.ppic.org/content/pubs/report/R_512HJR.pdf on October 12, 2015.
14 Murphy, K. (2015). University of California proposes a major enrollment expansion. Retrieved from http://www.mercurynews.com/news/ci_29098147/uc-proposes-enrolling-10-000-more-state-students on November 11, 2015.
Endnotes

46 Access Denied: Rising Selectivity at California’s Public Universities
15 The State of California. (2015). California State Budget – 2015-2016. Retrieved from http://www.dof.ca.gov/documents/FullBudgetSummary-2015.pdf on November 20, 2015.
16 Stiles, J., Hout, M. & Brady, H. (2012). California’s Economic Payoff: Investing in College Access & Completion. The Campaign for College Opportunity. Retrieved from http://collegecampaign.org/wp-content/uploads/2014/06/Californias_Economic_Payoff_Full_Report_FINAL.pdf on October 8, 2015.
17 Stiles, J., Hout, M. & Brady, H. (2012). California’s Economic Payoff: Investing in College Access & Completion. The Campaign for College Opportunity. Retrieved from http://collegecampaign.org/wp-content/uploads/2014/06/Californias_Economic_Payoff_Full_Report_FINAL.pdf on October 8, 2015.
18 Myers, D. (2012). California Futures: New Narratives for a Changing Society. Boom: A Journal of California, Vol. 2, Number 2, pps 37–54. Retrieved from http://www.usc.edu/schools/price/research/popdynamics/pdf/2012_Myers_CaliforniaFutures_Boom.pdf on October 12, 2015.
19 Johnson, H., Mejia, M., & Bohn, S. (2015). Will California Run Out of College Graduates? A report produced by the Public Policy Institute of California. Retrieved from http://www.ppic.org/main/publication_quick.asp?i=1166 on November 20, 2015.
20UniversityofCaliforniaOfficeofthePresident.(2015).MajorFeaturesoftheCaliforniaMasterPlanforHigherEducation.Retrieved from http://www.ucop.edu/acadinit/mastplan/mpsummary.htm on October 12, 2015.
21UniversityofCaliforniaOfficeofthePresident.(2015).TheCaliforniaMasterPlanforHigherEducationinPerspective.Retrieved from http://www.ucop.edu/acadinit/mastplan/mpperspective.htm on October 12, 2015.
22CaliforniaCommunityCollegesChancellor’sOffice.(2015).FirstCaliforniaCommunityCollegeBachelor’sDegreePrograms Receive Initial Approval from Board of Governors. Retrieved from http://californiacommunitycolleges.cccco.edu/Portals/0/DocDownloads/PressReleases/JAN2015/PR_4yrDegree-January-20-2015_final.pdf on November 20, 2015.
23 Fall 2013 undergraduate enrollment estimate.
24UniversityofCaliforniaOfficeofthePresident.(2015).TheCaliforniaMasterPlanforHigherEducationinPerspective.Retrieved from http://www.ucop.edu/acadinit/mastplan/mpperspective.htm on October 12, 2015.
25UniversityofCaliforniaOfficeofthePresident.(2014).AccountabilityReport2015:Chapter14HonorsandRankings.Retrieved from http://accountability.universityofcalifornia.edu/2015/chapters/chapter-14.html on November 18, 2015.
26CaliforniaStateUniversityOfficeoftheChancellor.(2014).StudentAcademicOutreachPrograms2013-2014AnnualReport. Retrieved from https://www.calstate.edu/SAS/documents/2013-14_OutreachReport.pdf on November 18, 2015.
27 Palomino, J. (2015). How foreign, out-of-state students pad UC’s shrinking budget. San Jose Mercury News. Retrieved from http://www.sfchronicle.com/business/article/How-foreign-out-of-state-students-pad-UC-s-6434407.php on November 18, 2015.
28 Palomino, J. (2015). How foreign, out-of-state students pad UC’s shrinking budget. San Jose Mercury News. Retrieved from http://www.sfchronicle.com/business/article/How-foreign-out-of-state-students-pad-UC-s-6434407.php on November 18, 2015.
29 Geiser, S. 2014.
30 Board of Admissions and Relations with Schools. (2013). Impact of the New Freshman Eligibility Policy at the University of California A Report to the Regents of the University of California. Retrieved from http://senate.universityofcalifornia.edu/committees/boars/Nov52013BOARSReporttoRegents-Final.pdf on November 7, 2015.

Access Denied: Rising Selectivity at California’s Public Universities 47
31UniversityofCaliforniaOfficeofthePresident.(2002).UniversityofCaliforniaEligibilityintheLocalContextProgramEvaluation Report. Retrieved from http://www.ucop.edu/news/cr/report02.pdf on November 7, 2015.
32 Board of Admissions and Relations with Schools (BOARS) (2001). The Use of Admissions Tests by the University of California. Retrieved from http://senate.universityofcalifornia.edu/committees/boars/admissionstests.pdf on November 18, 2015.
33 Columbia Broadcasting System. (2011). UC To Expand Individualized Review Of Applications. Retrieved from http://sanfrancisco.cbslocal.com/2011/01/20/uc-to-expand-individualized-review-of-applications/ on November 10, 2015.
34UniversityofCaliforniaOfficeofthePresident.(2015).FreshmanAdmissions.Retrievedfromhttp://admission.universityofcalifornia.edu/counselors/freshman/minimum-requirements/index.html on July 30, 2015.
35TheCollegeBoard.(2014).10YearsofAdvancedPlacementExamDataShowSignificantGainsinAccessandSuccess;Areas for Improvement. Retrieved from https://www.collegeboard.org/releases/2014/class-2013-advanced-placement-results-announced on October 16, 2015.
36 Geiser, S. & Santelices, V. (2004). The Role of Advanced Placement and Honors Courses in College Admissions. Retrieved from http://www.cshe.berkeley.edu/sites/default/files/shared/publications/docs/ROP.Geiser.4.04.pdf on November 18, 2015.
37UniversityofCaliforniaOfficeofthePresident.(2015).UniversityofCaliforniaAdmissions:CaliforniaResidents.Retrieved from http://admission.universityofcalifornia.edu/freshman/california-residents/index.html on September 29, 2015.
38 Note the CSU does not provide data on California resident admissions years prior to 2011.
39 As we do not know how many of these students are eligible for admission, please interpret the applicant/admit gap with caution.
40UniversityofCaliforniaOfficeofthePresident.
41 Students receive a GPA bump for taking AP classes.
42UniversityofCaliforniaOfficeofthePresident.(2015).Admissions.Retrievedfromhttp://admission.universityofcalifornia.edu/counselors/freshman/california-residents/admissions-index.html on November 18, 2015.
43 PowerScore. (2015). The Old SAT vs. The New SAT. Retrieved from http://www.powerscore.com/sat/help/sat_oldvsnew.cfm on November 18, 2015.
44 PowerScore. (2015). The Old SAT vs. The New SAT. Retrieved from http://www.powerscore.com/sat/help/sat_oldvsnew.cfm on November 18, 2015.
45 PowerScore. (2015). The Old SAT vs. The New SAT. Retrieved from http://www.powerscore.com/sat/help/sat_oldvsnew.cfm on November 18, 2015.
46 Koseff, A. (2014). University of California steps up out-of-state recruiting. The Sacramento Bee. Retrieved from http://www.sacbee.com/news/politics-government/article2606325.html on October 23, 2015.
47 California State Assembly Budget Report (May 13 2015). Retrieved from http://abgt.assembly.ca.gov/sites/abgt.assembly.ca.gov/files/UC%20May%2013%20Agenda.pdf on July 25, 2015.
48 Board of Admissions and Relations with Schools (BOARS) (2001). The Use of Admissions Tests by the University of California. Retrieved from http://senate.universityofcalifornia.edu/committees/boars/admissionstests.pdf on November 18, 2015.
48 Access Denied: Rising Selectivity at California’s Public Universities
49 Board of Admissions and Relations with Schools (BOARS) (2001). The Use of Admissions Tests by the University of California. Retrieved from http://senate.universityofcalifornia.edu/committees/boars/admissionstests.pdf on November 18, 2015.
50 Johnson, Hans. (2012). Defunding Higher Education: What are the Effects on College Enrollment? A report produced by the Public Policy Institute of California. Retrieved from http://www.ppic.org/content/pubs/report/R_512HJR.pdf on October 12, 2015.
51CaliforniaStateUniversityOfficeoftheChancellor.(2015).EligibilityIndex.Retrievedfromhttp://www.csumentor.edu/planning/high_school/eligibility_index.asp on November 20, 2015.
52 Taylor, M. (2011). The Master Plan at 50: Guaranteed Regional Access Needed for State Universities. A report produced bytheCaliforniaLegislativeAnalyst’sOffice(LAO),Sacramento,CA.
53 Taylor, M. (2011). The Master Plan at 50: Guaranteed Regional Access Needed for State Universities. A report produced bytheCaliforniaLegislativeAnalyst’sOffice(LAO),Sacramento,CA.
54CaliforniaStateUniversityOfficeoftheChancellor.(2015).FreshmenAdmissionRequirementsOverview.Retrievedfromhttps://secure.csumentor.edu/planning/high_school/ on September 29, 2015.
CaliforniaStateUniversityOfficeoftheChancellor.(2014).AdmissionsHandbook:2014-2015.Retrievedfromhttp://www.calstate.edu/sas/onestopkiosk/documents/AdmissionHandbook.pdf on September 30, 2015.
University of California Admissions. (2015). CSU-UC Comparison of Minimum Freshman Admission Requirements. Retrieved from http://admission.universityofcalifornia.edu/counselors/files/csu-uc-a-g-comparison-matrix.pdf on September 30, 2015.
55 We make no claim about the eligibility status of CSU applicants.
56 Note the CSU does not provide data on California resident admissions years prior to 2011.
57 California State Senate. (2015). Subcommittee No. 1. Agenda Wednesday May 20, 2015. Retrieved from http://sbud.senate.ca.gov/sites/sbud.senate.ca.gov/files/SUB1/May202015Sub1PtB.pdf on November 20, 2015.
58 Jaschik, S. (2009). The Big Admissions Shift. Inside Higher Education. Retrieved from https://www.insidehighered.com/news/2009/12/01/calstate on July 27, 2015.
59CaliforniaStateUniversityOfficeoftheChancellor.(2015).ExecutiveOrderNo.8.Establishment of Enrollment Limitations. Retrieved from http://www.calstate.edu/eo/eo-008.pdf on July 27, 2015.
60 California State Assembly. (2015). California Assembly Bill No. 2402. California State University: admissions: procedural requirements. Retrieved from http://leginfo.legislature.ca.gov/faces/billNavClient.xhtml?bill_id=200920100AB2402 on July 27, 2015,
61 California State Assembly. (2015). California Assembly Bill No. 2402. California State University: admissions: procedural requirements. Retrieved from http://leginfo.legislature.ca.gov/faces/billNavClient.xhtml?bill_id=200920100AB2402 on July 27, 2015.
62 California State University. (2015). The California State University Enrollment Management Policy and Practices. Retrieved from https://www.calstate.edu/acadres/docs/CSU_Enroll_Mngment_Policy_Practices.pdf on September 29, 2015.
63 California State Assembly. (2015). AB 2402 Bill Analysis. Retrieved from http://www.leginfo.ca.gov/pub/09-10/bill/asm/ab_2401-2450/ab_2402_cfa_20100629_134153_sen_comm.html on July 27, 2015.

Access Denied: Rising Selectivity at California’s Public Universities 49
64CaliforniaStateUniversityOfficeoftheChancellor.(2015).ImpactedUndergraduateMajorsandCampusesintheCalifornia State University 2016-2017. Retrieved from http://www.calstate.edu/sas/impactioninfo.shtml on August 5, 2015.
65 Rivera, C. (2015). Cal State is tightening admissions criteria to control demand. Los Angeles Times. Retrieved from http://www.latimes.com/local/education/la-me-cal-state-admit-20150309-story.html on September 29, 2015.
66CaliforniaStateUniversityOfficeoftheChancellor.(2015).ImpactedUndergraduateMajorsandCampusesintheCalifornia State University, 2016-2017. Retrieved from http://www.calstate.edu/sas/impactionsearch/ on November 20, 2015.
67 Chandler, C. (2015). CSUN Proposes Admission Requirement Changes Beginning Fall 2016. California State University Northridge. Retrieved from http://csunshinetoday.csun.edu/education/csun-proposes-admission-requirement-changes-beginning-fall-2016/ on October 12, 2015.
68CaliforniaStateUniversityOfficeoftheChancellor.(2015).TaskForceforaSustainableFinancialModelfortheCSU.Force Draft: Ensuring Success for California’s Students. Retrieved from http://calstate.edu/financial-future/documents/Draft-Task-Force-Report-9-17-15.pdf on October 29, 2015.
69 Geiser, S. & Atkinson, R.C., 2012
70CaliforniaCommunityCollegesChancellor’sOffice.(2015).KeyFactsaboutCaliforniaCommunityColleges.Retrievedfrom http://www.californiacommunitycolleges.cccco.edu/PolicyInAction/KeyFacts.aspx on October 12, 2015.
71UniversityofCaliforniaOfficeofthePresident.(2015).TheCaliforniaMasterPlanforHigherEducationinPerspective.Retrieved from http://www.ucop.edu/acadinit/mastplan/mpperspective.htm on October 12, 2015.
72 Geiser & Atkinson, R.C. 2012
73 Long, B., Kurlaender, M. (2009), Do Community Colleges Provide a Viable Pathway to a Baccalaureate Degree? NBER Working Paper Series No. 14367. Cambridge, MA: National Bureau of Economic Research., p. 25-26 Retrieved from http://isites.harvard.edu/fs/docs/icb.topic1233359.files/Long%20Kurlaender%202009%20Do%20CCs%20provide%20a%20viable%20path%20to%20a%20Baccalaureate%20-%20EEPA.pdf on September 21, 2015.
74 Geiser & Atkinson, 2012.
Page 14: Sather Gate at University of California, Berkeley, cdrin / Shutterstock.com
Page 20: Kendall Hall at California State University, Chico, Ray Bouknight, https://www.flickr.com/photos/raybouk/15501432630/.
Photo Credits

ABOUT THE CAMPAIGNThe Campaign for College Opportunity is a broad-based, bipartisan coalition, including business, education and civil rights leaders that is dedicated to ensuring that all Californians have an equal opportunity to attend and succeed in college in order to build a vibrant workforce, economy and democracy. The Campaign works to create an environment of change and lead the state toward effective policy solutions. It is focused upon substantially increasing the number of students attending two- and four-year colleges in California so that we can produce the 2.3 million additional college graduates that our state needs.
For more information, visit: www.collegecampaign.org.
BOARD OF DIRECTORSThomas A. Saenz (Chair) President & General Counsel, Mexican American Legal Defense and Educational Fund (MALDEF)
Gary K. Hart (Vice Chair) Former California Secretary of Education & State Senator
Marcus A. Allen (Treasurer) Partner, Englander Knabe & Allen
Lisa A. Smith (Secretary) ManagingDirector/HeadofthePacificRegion,SiebertBrandford Shank & Co., L.L.C.
George Boggs Superintendent-President Emeritus, Palomar College; President & CEO Emeritus, American Association of Community Colleges
Camila Chavez Executive Director, Dolores Huerta Foundation
Pamela H. David Executive Director, Walter & Elise Haas Fund
Robert Lapsley President, California Business Roundtable
William G. McGinnis Trustee, Butte-Glenn Community College District
Rory O’Sullivan Policy and Research Director, Young Invincibles
Darline Robles Professor of Clinical Education USC Rossier School of Education
Frederick R. Ruiz Co-Founder & Chairman Emeritus, Ruiz Food Products; Regent, University of California
David Wolf Co-Founder, Campaign for College Opportunity
Los Angeles Office714 W. Olympic Boulevard, Suite 745Los Angeles, CA 90015Tel: 213.744.9434Fax: 800.207.3560President: Michele Siqueiros
Sacramento Office1512 14th StreetSacramento, CA 95814Tel: 916.443.1681Fax: 916.443.1682Executive Vice President: Jessie Ryan
www.facebook.com/collegecampaign www.twitter.com/CollegeOpp
www.collegecampaign.org