risk analysis division — risk map considerations for developing rainfall- runoff models for large...
TRANSCRIPT
Risk Analysis Division
—Risk MAP
Considerations for Developing Rainfall-Runoff Models for Large Watersheds – Passaic River Watershed, New Jersey
Considerations for Developing Rainfall-Runoff Models for Large Watersheds – Passaic River Watershed, New Jersey
Presented by
Paul Weberg, P.E., Senior Engineer
Z. John Licsko, P.E., CFM, Dewberry
Dinakar, Nimmala, CFM,Dewberry
Risk Analysis Division
—Risk MAP
2
OutlineOutline
Study ScopeWatershed DescriptionFlood CharacteristicsModel ApproachModeling ChallengesResultsConclusions
Risk Analysis Division
—Risk MAP
3
Study Scope - LocationStudy Scope - Location
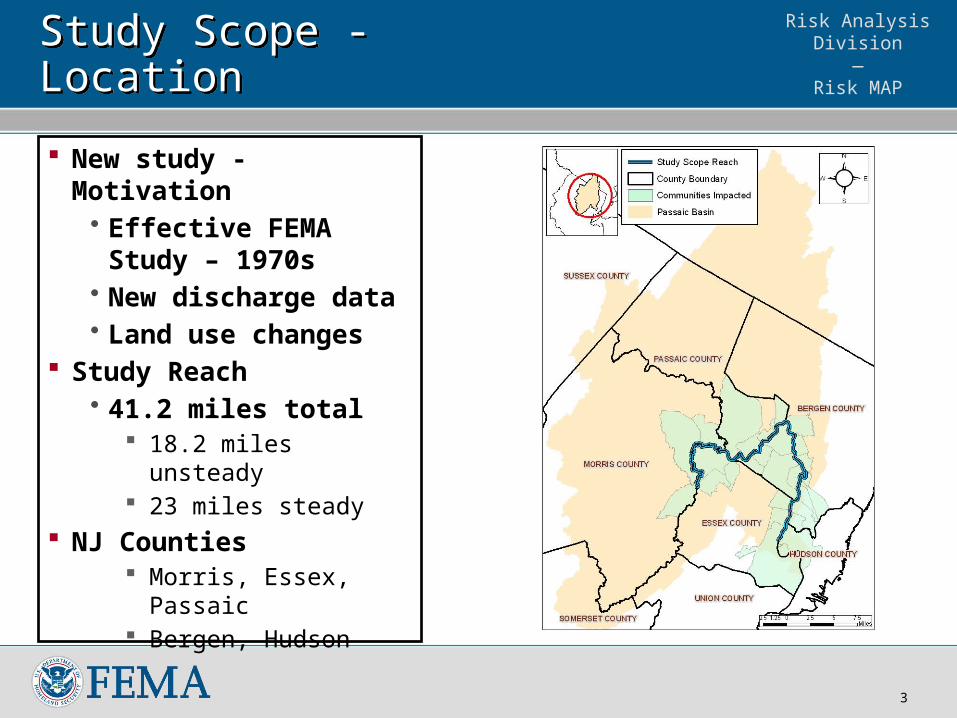
New study - Motivation• Effective FEMA Study –
1970s• New discharge data• Land use changes
Study Reach• 41.2 miles total
18.2 miles unsteady 23 miles steady
NJ Counties Morris, Essex, Passaic Bergen, Hudson

Risk Analysis Division
—Risk MAP
4
Study Scope - WatershedStudy Scope - Watershed
• Passaic River Length = 86 miles (study includes 41.2 miles)
• Drainage Area = 937 Sq.Miles• 84% area in NJ, 16% area in NY• 4 Major Tributaries
• Whippany River• Rockaway River• Pompton River
• Ramapo• Wanaque• Pequannock
• Saddle River• Numerous Storage Features
(Natural Wetlands and Reservoirs)

Risk Analysis Division
—Risk MAP
5
Watershed CharacteristicsWatershed Characteristics
• Highland Areas• Forested Upland Areas• Natural lakes and large
reservoirs.• Central Basin and Lower
Valley• Highly Urbanized• Large natural wetland• Valley constriction
below Pompton/• Passaic Confluence
• Highly variable difference in hydrologic response of different watersheds.
Risk Analysis Division
—Risk MAP
6
Flooding CharacteristicsFlooding Characteristics
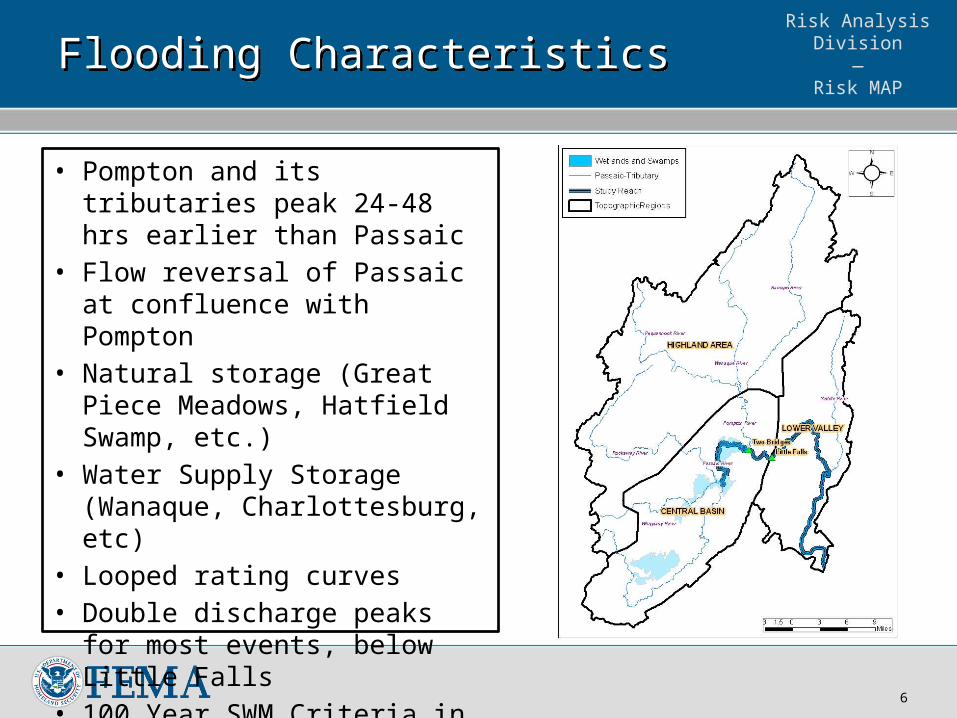
• Pompton and its tributaries peak 24-48 hrs earlier than Passaic
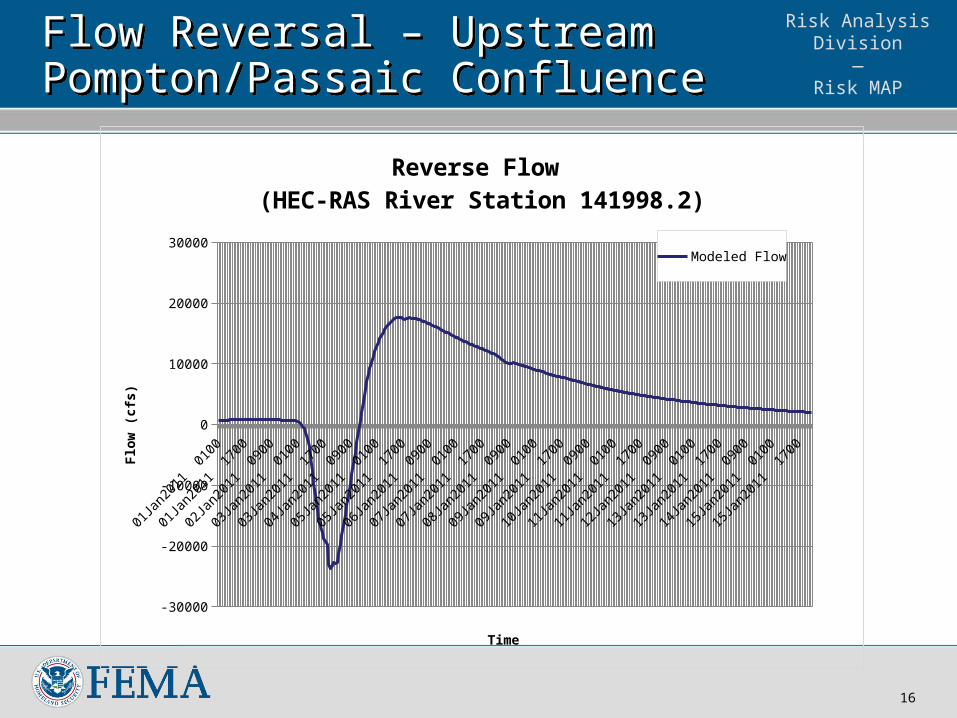
• Flow reversal of Passaic at confluence with Pompton
• Natural storage (Great Piece Meadows, Hatfield Swamp, etc.)
• Water Supply Storage (Wanaque, Charlottesburg, etc)
• Looped rating curves• Double discharge peaks for most
events, below Little Falls• 100 Year SWM Criteria in Urban
Areas

Risk Analysis Division
—Risk MAP
7
Initial Modeling Approach Initial Modeling Approach
Hydrology Single HEC-HMS Model
• SCS CN and Lag (Unit Hydrograph) • Reach Routing (Hydrologic and Hydraulic)
Hydrologic– Muskingum-Cunge– Modified-Puls (steady state HEC-RAS)
Hydraulic (unsteady state HEC-RAS, detailed and approximate)• Reservoir Routing
Hydraulics Detailed Unsteady State HEC-RAS above Little Falls Detailed Steady State HEC-RAS below Little Falls

Risk Analysis Division
—Risk MAP
8
Modeling ChallengesModeling Challenges
Applicability of SCS Hydrology• Required significant increases in lag times to match gages
Rainfall Distribution/Duration• Rainfall Distribution Methodology Required• Four day 100 event required
Routing Methods• Muskingum Cunge, Modified Puls Routing Hydrologic
Routing and Unsteady HEC-RAS Hydraulic Routing Significant Levels of Storage
• Reservoirs and Wetlands

Risk Analysis Division
—Risk MAP
9
Final Modeling ApproachFinal Modeling Approach
Hydrology/Hydraulics Modeling Groups 7 HEC-HMS Basin Models
• Average subbasin area = 10 Sq.miles 7 Approximate Steady State HEC-RAS models
(Modified Puls) 4 Approximate Unsteady State HEC-RAS models
(Tributary Storage) 1 Coupled HEC-HMS/ Detailed Unsteady State HEC-
RAS Model 1 Detailed Steady State HEC-RAS HEC-DSS Data Management Requirements

Risk Analysis Division
—Risk MAP
10
Central Passaic Model GroupCentral Passaic Model Group
Risk Analysis Division
—Risk MAP
11
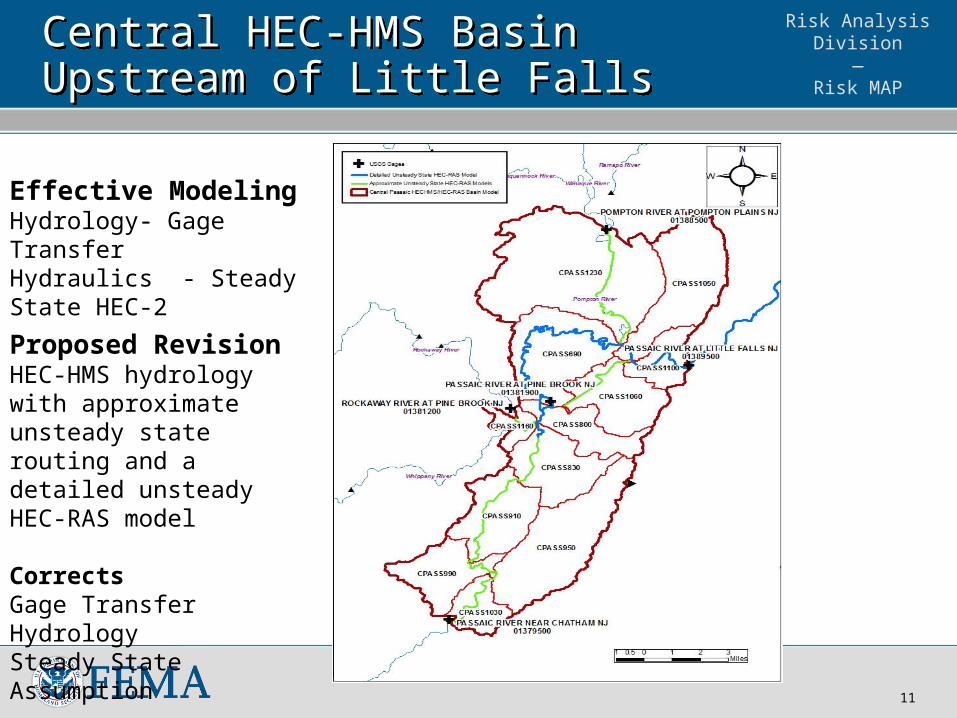
Central HEC-HMS BasinUpstream of Little FallsCentral HEC-HMS BasinUpstream of Little Falls
Effective ModelingHydrology- Gage TransferHydraulics - Steady State HEC-2
Proposed Revision HEC-HMS hydrology with approximate unsteady state routing and a detailed unsteady HEC-RAS model
CorrectsGage Transfer HydrologySteady State Assumption
Risk Analysis Division
—Risk MAP
12
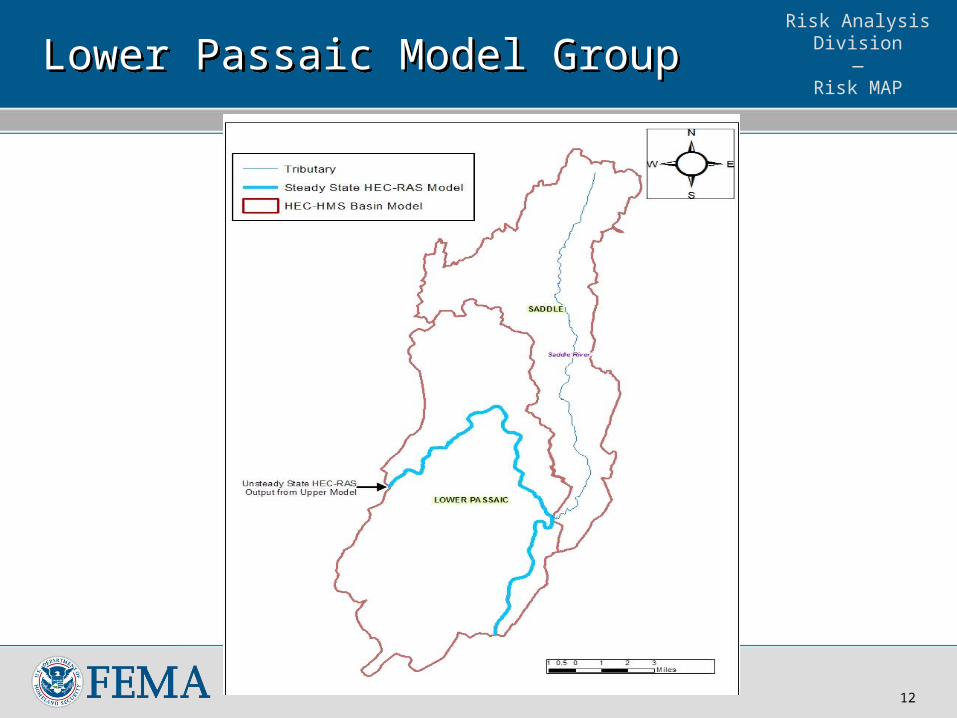
Lower Passaic Model GroupLower Passaic Model Group

Risk Analysis Division
—Risk MAP
13
HEC-HMS CalibrationHEC-HMS Calibration
100 Year Frequency Storm – 24 Hour
Basin Gage Drainage Area (square miles)
Peak (cfs) Diff.
(Mod/Obs)Model
Obs.(LPIII)
Pompton Pompton River at Pompton Plains, NJ
(01388500)355 24,401 25,480* -4.4 %
Whippany Rockaway near Pine Brook, NJ
(01381800)68.5 1,788 1,870** -4.0%
Rockaway Rockaway River below Reservoir at Boonton, NJ (USGS 01381000)
119.0 6,196 5,595* +10.0%
Upper Passaic Passaic River near Millington, NJ
(USGS 01379000)55.4 2,959 3,365 -12.0%*
Saddle River Saddle River At Lodi, NJ (01391500)* 54.6 5,215 5,680 -8.0%*
* Gage effected by regulation** Looped Rating Curve – Backwater from Passaic (Hatfield Swamp)

Risk Analysis Division
—Risk MAP
14
Flow Reversal – Upstream Pompton/Passaic ConfluenceFlow Reversal – Upstream Pompton/Passaic Confluence

Risk Analysis Division
—Risk MAP
15
USGS Gage – Above Beatties Dam at Little FallsUSGS Gage – Above Beatties Dam at Little Falls
Risk Analysis Division
—Risk MAP
16
Flow Reversal – Upstream Pompton/Passaic ConfluenceFlow Reversal – Upstream Pompton/Passaic Confluence
01Ja
n201
1 0
100
01Ja
n201
1 1
400
02Ja
n201
1 0
300
02Ja
n201
1 1
600
03Ja
n201
1 0
500
03Ja
n201
1 1
800
04Ja
n201
1 0
700
04Ja
n201
1 2
000
05Ja
n201
1 0
900
05Ja
n201
1 2
200
06Ja
n201
1 1
100
06Ja
n201
1 2
400
07Ja
n201
1 1
300
08Ja
n201
1 0
200
08Ja
n201
1 1
500
09Ja
n201
1 0
400
09Ja
n201
1 1
700
10Ja
n201
1 0
600
10Ja
n201
1 1
900
11Ja
n201
1 0
800
11Ja
n201
1 2
100
12Ja
n201
1 1
000
12Ja
n201
1 2
300
13Ja
n201
1 1
200
14Ja
n201
1 0
100
14Ja
n201
1 1
400
15Ja
n201
1 0
300
15Ja
n201
1 1
600
-30000
-20000
-10000
0
10000
20000
30000
Reverse Flow (HEC-RAS River Station 141998.2)
Modeled Flow
Time
Flo
w (
cfs)

Risk Analysis Division
—Risk MAP
17
USGS Gage – Twin BridgesUSGS Gage – Twin Bridges

Risk Analysis Division
—Risk MAP
18
USGS Gage at Pine BrookUSGS Gage at Pine Brook
Risk Analysis Division
—Risk MAP
19
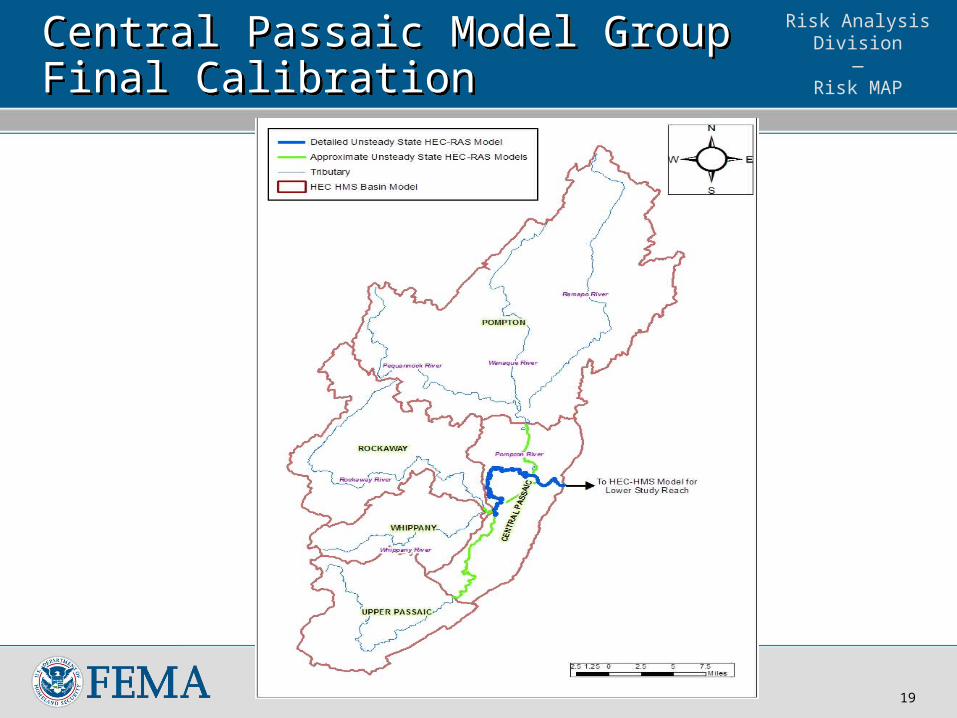
Central Passaic Model Group Final CalibrationCentral Passaic Model Group Final Calibration

Risk Analysis Division
—Risk MAP
20
Central Passaic Model Group Final CalibrationCentral Passaic Model Group Final Calibration
Rainfall Areal Correction Factors (NOAA Atlas 14 – 4 day 100 year rainfall)
Basin D.A. (sq. mls.) 10 50 100 500 Pompton Basin 355 -5% -11% -13% -16%
Upper Passaic Basin 99 19% 9% 5% -2% Whippany Basin 70 -17% -29% -34% -43% Rockaway Basin 137 -10% -18% -21% -28%
Saddle Basin 60 11% 2% -3% -12% Central Passaic Basin 103 0% 0% 0% 0% Lower Passaic Basin 114 0% 0% 0% 0%
Risk Analysis Division
—Risk MAP
21
ResultsResults
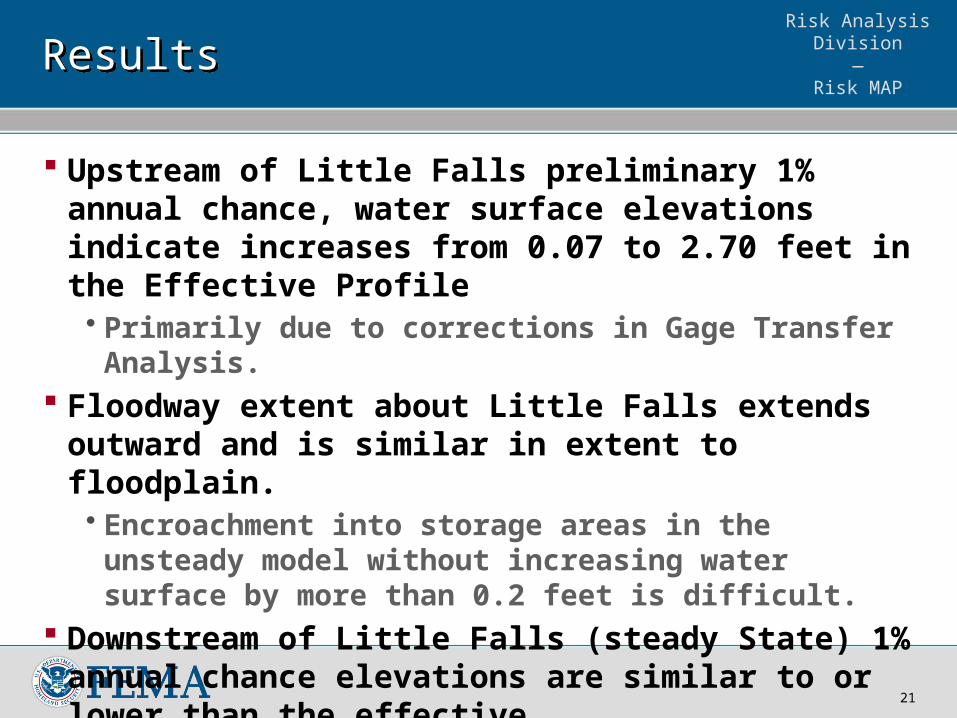
Upstream of Little Falls preliminary 1% annual chance, water surface elevations indicate increases from 0.07 to 2.70 feet in the Effective Profile• Primarily due to corrections in Gage Transfer Analysis.
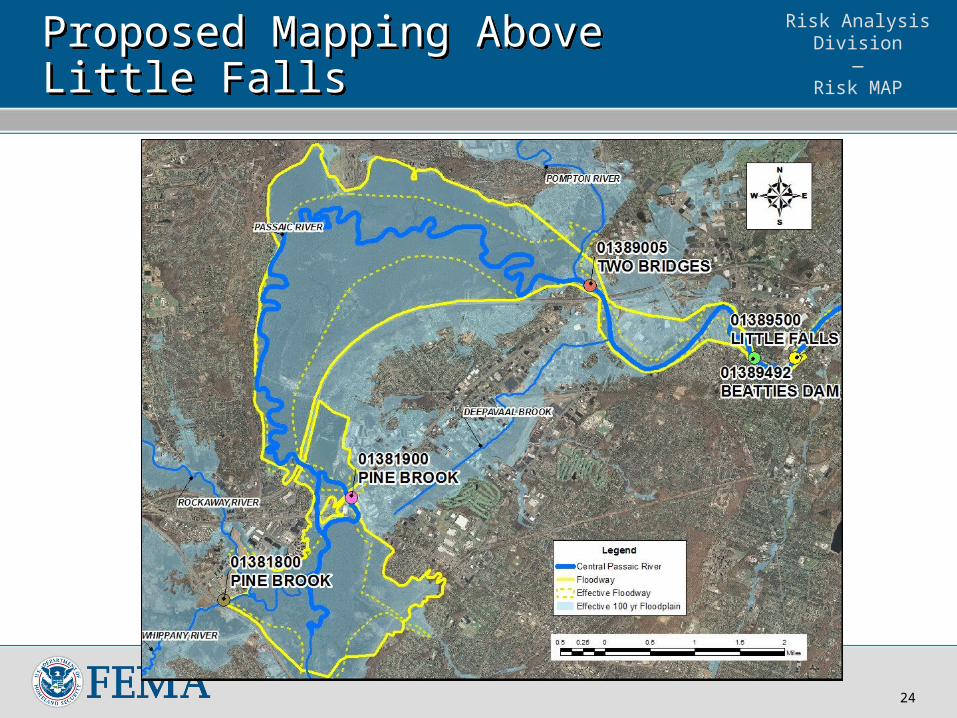
Floodway extent about Little Falls extends outward and is similar in extent to floodplain.• Encroachment into storage areas in the unsteady model
without increasing water surface by more than 0.2 feet is difficult.
Downstream of Little Falls (steady State) 1% annual chance elevations are similar to or lower than the effective.

Risk Analysis Division
—Risk MAP
22
Results Below Little FallsResults Below Little Falls
Location Drainage Area (mi2)
Discharges (cfs)
1% 0.2%
FIS New %Diff FIS New %Diff Above confluence with Second River1
906 30,200 30,772 2% 46,200 43,185 -7%
Upstream of Beatties Dam
777.2 21,700 21,469 -1% 30,200 30,008 -1%

Risk Analysis Division
—Risk MAP
23
100-Yr Hydrograph on Passaic River above Second River100-Yr Hydrograph on Passaic River above Second River
Risk Analysis Division
—Risk MAP
24
Proposed Mapping Above Little FallsProposed Mapping Above Little Falls

Risk Analysis Division
—Risk MAP
25
ConclusionsConclusions
Gage transfer procedures for large watersheds need to be used carefully.
Steady State Assumptions for Flood Studies need to be better supported particularly when related to storage and possible flow reversals during 100 year events.
Procedures for developing rainfall distributions for large watersheds is limited
Data management requirements for large studies could benefit from familiarity with tools, such as HEC-WAT 1.0, for linking HEC-HMS and Unsteady HEC-RAS Models
Approximate 2-D Unsteady State Modeling needed to validate the
1-D Analysis Assumptions

Risk Analysis Division
—Risk MAP
26
AcknowledgementsAcknowledgements
Alicia F. Gould & Roy Messaros (USACE, New York)• USACE 1995 General Design Memorandum which
included a detailed hydrologic and hydraulic analysis of the Passaic River Basin, including an digital version of the UNET hydraulic model for the Passaic River and Tributaries
Patti Wnek & Joe Ostrowkski (National Weather Service/NOAA/Middle Atlantic River Forecast Center)
Alice Yeh (US EPA) Joe Ruggeri (NJ Department of Environmental
Protection) Bob (Robert) Schopp, Kara Watson (NJ USGS)