risk and uncertainty management - dewardt.com 97269 ris… · • risk register not linked to the...
TRANSCRIPT

SPE 97269; J de Wardt, S Peterson & J Murtha 1
Risk and Uncertainty Management Best Practices and Misapplications for Cost and
Schedule Estimates
SPE 97269
John de Wardt, DE WARDT AND CO INC
Susan Peterson, J Murtha and Assoc’s
James Murtha, J Murtha and Assoc’s

SPE 97269; J de Wardt, S Peterson & J Murtha 2
We have an important message for
engineers and managers
• Risk and uncertainty management is a powerful
tool that improves project outcome
• The two stages are qualitative and quantitative: • Managing risk and uncertainty
• Understanding project outcome ranges
• Misunderstandings and misapplications are
losing huge performance opportunities
• Our recommendations will ensure correct
application with improved project outcomes

N Sea development well in active faulting
area • Drilling problems threatened project economics
• trouble costs approached 35% and occasionally 50%
• 1 in 3 wells failed to reach objectives
• extended drilling time – delayed production
• Operator / supplier team risk / uncertainty
management
• very challenging ERD well 25% below historic cost
• slot recovery in 18 vs 29 days
• drilled well 30% ahead of past performance
• repeated performance overcame failed wells

SPE 97269; J de Wardt, S Peterson & J Murtha 4
Deepwater GOM

SPE 97269; J de Wardt, S Peterson & J Murtha 5
Start by developing the Qualitative
process as the first phase
• Identification is a critical & continuous process
– Group of people representing full cross section
– Brainstorming meetings, interviews or similar
• Assessment
– Develop a risk / uncertainty matrix that is relevant to the
project
– Rank the risks to identify those that are project critical
– Develop mitigation plans
• Design / re-plan to reduce or remove
• Contingency plan to offset
• Management
– Build and maintain a log (register)

SPE 97269; J de Wardt, S Peterson & J Murtha 6
An example of an assessment matrix
HSE
Sch
edule
Cap
ital c
ost
Oper
atin
g cos
t
Functio
nality
Pro
ductio
n
Rep
utatio
n
Imp
ac
t
Fatality or
serious
permanent injury
1 w eek $ 1 mill Loss of >50%PI Reduction
50%
Prosecution
Possible loss of
operating license25 25 50 75 100
Serious injury 1 day $100,000 Loss of 10 to
50%
PI Reduction
25%
Regulator
involvement 10 10 20 30 40
Lost Time
Incident6 hours $25,000 Loss of <10%
PI Reduction
10%
Complaints from
local community 5 5 10 15 20
First Aid 1 hour $5,000 Little impact Little impact Little impact 1 1 2 3 4
Probability / Frequency
Imp
ac
t
1 2 3 4
> 5 years 1 year 6 months < 14 days
< 5% 5 - 25% 25 - 50% > 50%

SPE 97269; J de Wardt, S Peterson & J Murtha 7
Key headings in the Qualitative Risk Log
• Risk identifier
• Project phase
• Risk event
• Risk cause
• Estimate of risk probability (from the matrix)
• Estimate of risk impact
• Identification of type of impact
– (safety, cost (opex / capex), schedule, functionality)
• Risk ownership
• Mitigation actions
– Plan it out, develop contingency
• Cost / benefit of mitigation
• Timing of mitigation

SPE 97269; J de Wardt, S Peterson & J Murtha 8
Key headings in the Qualitative Risk Log
• Risk identifier
• Project phase
• Risk event
• Risk cause
• Estimate of risk probability (from the matrix)
• Estimate of risk impact
• Identification of type of impact
– (safety, cost (opex / capex), schedule, functionality)
• Risk ownership
• Mitigation actions
– Plan it out, develop contingency
• Cost / benefit of mitigation
• Timing of mitigation

SPE 97269; J de Wardt, S Peterson & J Murtha 9
Risk ID
Project
sub
group
Project
phaseDescription of event Description of cause
Ris
k o
r
Un
ce
rta
inty
Imp
ac
t ty
pe
Imp
ac
t
rati
ng
Pro
ba
bilit
y
rati
ng
Ris
k r
ati
ng
1
Proj
Specification NAPIMS approval later than scheduled Delays beyond expected duration Risk Schedule 25 3 75
2 Poorly understood process requirement
Uncertainty of process rate and stream
conditions is interpreted as chnages in design
parameter Uncertainty Functionality 10 4 40
3 Work not completed according to schedule
Resources assigned late, insufficient resources
assigned Risk Schedule 25 4 100
4 Subsurface
Proj
Specification
Gas volumes are larger than base case used in
FEED Oron production Uncertainty Functionality 5 1 5
5 Subsurface
Proj
Specification
Gas volumes are larger than base case used in
FEED Additional upside production Uncertainty Functionality 5 2 10
6 Facilities
Proj
Specification
Current structures unable to take additional
loads of risers, etc Structures inadequate for additional use Risk Capital cost 10 2 20
7 Facilities
Proj
Specification Loss of oil production
Shut down required for interfacing the CPU 2 to
current production Risk Production 10 3 30
8 Facilities
Proj
Specification Insuffiicient reserves to meet sales contract Non associated gas less than expected 0
10 0

SPE 97269; J de Wardt, S Peterson & J Murtha 10
Risk ID
Project
sub
group
Project
phaseDescription of event Description of cause
Ris
k o
r
Un
ce
rta
inty
Imp
ac
t ty
pe
Imp
ac
t
rati
ng
Pro
ba
bilit
y
rati
ng
Ris
k r
ati
ng
1
Proj
Specification NAPIMS approval later than scheduled Delays beyond expected duration Risk Schedule 25 3 75
2 Poorly understood process requirement
Uncertainty of process rate and stream
conditions is interpreted as chnages in design
parameter Uncertainty Functionality 10 4 40
3 Work not completed according to schedule
Resources assigned late, insufficient resources
assigned Risk Schedule 25 4 100
4 Subsurface
Proj
Specification
Gas volumes are larger than base case used in
FEED Oron production Uncertainty Functionality 5 1 5
5 Subsurface
Proj
Specification
Gas volumes are larger than base case used in
FEED Additional upside production Uncertainty Functionality 5 2 10
6 Facilities
Proj
Specification
Current structures unable to take additional
loads of risers, etc Structures inadequate for additional use Risk Capital cost 10 2 20
7 Facilities
Proj
Specification Loss of oil production
Shut down required for interfacing the CPU 2 to
current production Risk Production 10 3 30
8 Facilities
Proj
Specification Insuffiicient reserves to meet sales contract Non associated gas less than expected 0
10 0
•Risk identifier
•Project phase
•Risk event
•Risk cause
•Estimate of risk probability (from
the matrix)
•Estimate of risk impact
•Identification of type of impact
–(safety, cost (opex / capex),
schedule, functionality)
•Risk ownership
•Mitigation actions
–Plan it out, develop contingency
•Cost / benefit of mitigation
•Timing of mitigation

SPE 97269; J de Wardt, S Peterson & J Murtha 11
Misunderstandings and misapplications in
the qualitative process
• Single person compiles the register and leaves
many risks unidentified
• Risk events are overlooked because they are
trivialized (“That never happens”)
• Register is not linked to quantitative analysis
• Register is built but insufficient action to mitigate
• Complex computer programs act like black boxes
– open, visible spreadsheets work very well

SPE 97269; J de Wardt, S Peterson & J Murtha 12
Transition from Qualitative to
Quantitative analysis
• Qualitative analysis prioritizes risks and
uncertainties for action
• Quantitative analysis evaluates the risks and
uncertainties using the following methods:
– Deterministic
• Decision trees
– Stochastic
• Monte Carlo simulation

SPE 97269; J de Wardt, S Peterson & J Murtha 13
Risk and Uncertainty Management Misunderstandings in Cost and Schedule Estimating
• That it is possible to have enough information
and/or data to do a deterministic analysis, yet not
enough to do uncertainty and risk analysis.

SPE 97269; J de Wardt, S Peterson & J Murtha 14
Risk and Uncertainty Management Misunderstandings in Cost and Schedule Estimating
• That it is possible to have enough information
and/or data to do a deterministic analysis, yet not
enough to do uncertainty and risk analysis.
• Uncertainty and risk analysis are only useful
once the program or project is underway and
well-defined.

SPE 97269; J de Wardt, S Peterson & J Murtha 15
Risk and Uncertainty Management Misunderstandings in Cost and Schedule Estimating
• There must be an agreed deterministic estimate
prior to creating a probabilistic estimate.

SPE 97269; J de Wardt, S Peterson & J Murtha 16
Risk and Uncertainty Management Misunderstandings in Cost and Schedule Estimating
• There must be an agreed deterministic estimate
prior to creating a probabilistic estimate.
• The deterministic estimate has some statistical
relevance.
SPE 97269; J de Wardt, S Peterson & J Murtha 17
Risk and Uncertainty Management Misunderstandings in Cost and Schedule Estimating
• Risk and uncertainty analysis will lead to more
accurate estimates.

SPE 97269; J de Wardt, S Peterson & J Murtha 18
Risk and Uncertainty Management Misunderstandings in Cost and Schedule Estimating
• Risk and uncertainty analysis will lead to more
accurate estimates.
• All risks can, or should, be explicitly listed.

SPE 97269; J de Wardt, S Peterson & J Murtha 19
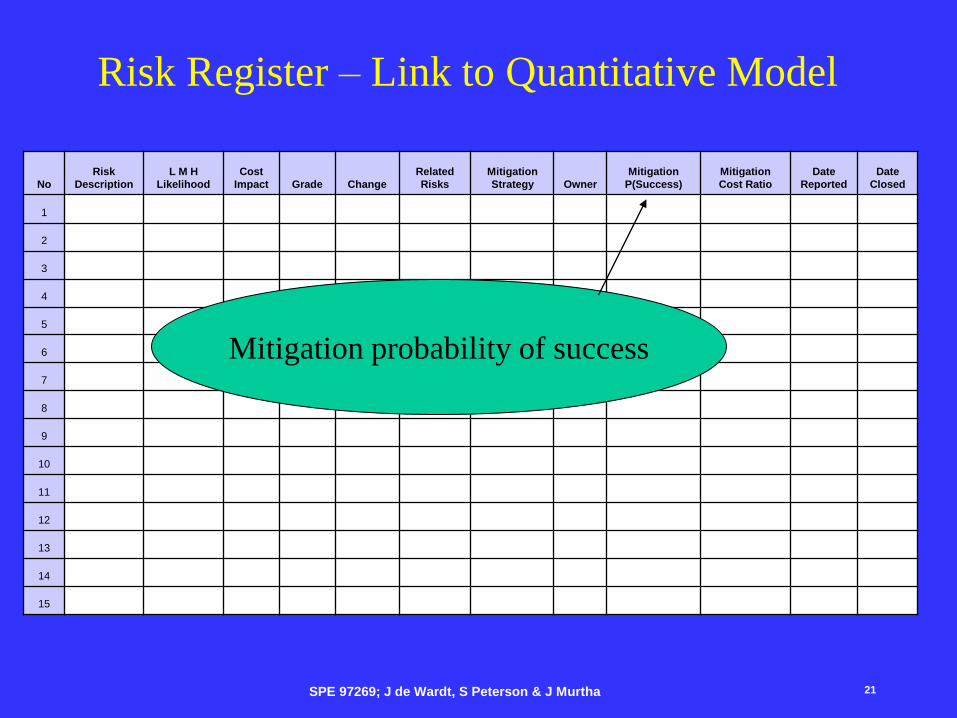
Additional items in Risk Register for
Quantitative Model
• Relation to other risks
• Mitigation success probability
• Cost / benefit of mitigation
• Timing of mitigation

SPE 97269; J de Wardt, S Peterson & J Murtha 20
No
Risk
Description
L M H
Likelihood
Cost
Impact Grade Change
Related
Risks
Mitigation
Strategy
Owner
Mitigation
P(Success)
Mitigation
Cost Ratio
Date
Reported
Date
Closed
1
2
3
4
5
6
7
8
9
10
11
12
13
14
15
Risk Register – Link to Quantitative Model
Related Risks (correlation and mutual exclusivity)
SPE 97269; J de Wardt, S Peterson & J Murtha 21
No
Risk
Description
L M H
Likelihood
Cost
Impact Grade Change
Related
Risks
Mitigation
Strategy
Owner
Mitigation
P(Success)
Mitigation
Cost Ratio
Date
Reported
Date
Closed
1
2
3
4
5
6
7
8
9
10
11
12
13
14
15
Risk Register – Link to Quantitative Model
Mitigation probability of success

SPE 97269; J de Wardt, S Peterson & J Murtha 22
No
Risk
Description
L M H
Likelihood
Cost
Impact Grade Change
Related
Risks
Mitigation
Strategy
Owner
Mitigation
P(Success)
Mitigation
Cost Ratio
Date
Reported
Date
Closed
1
2
3
4
5
6
7
8
9
10
11
12
13
14
15
Risk Register – Link to Quantitative Model
Mitigation Cost Ratio (cost of mitigation to risk cost)

SPE 97269; J de Wardt, S Peterson & J Murtha 23
Misapplications in the quantitative analysis
• Risk register not linked to the quantitative risk
and uncertainty model.
• Distributions assigned to all the inputs, just
because we can.

SPE 97269; J de Wardt, S Peterson & J Murtha 24
Operation Min time Avg time max time Min NPT Avg NPT Max Npt Avg NPT
hrs hrs hrs hrs hrs hrs hrs
Mobilize Rig Job
Move Equipment 1.00 2.00 3.00 2.00 0.10 0.30 0.75 0.30
Transit Rig 8.00 12.00 24.00 12.00 0.80 1.80 6.00 1.80
Inspect Area 0.50 1.00 2.00 1.00 0.05 0.15 0.50 0.15
Safety Meeting 0.25 0.50 0.75 0.50 0.03 0.08 0.19 0.08
Position Rig 1.00 2.00 3.00 2.00 0.10 0.30 0.75 0.30
Rig Up Land Rig 4.00 8.00 12.00 8.00 0.40 1.20 3.00 1.20
Rig Up Surface Equipment 2.00 4.00 6.00 4.00 0.20 0.60 1.50 0.60
Pick Up And Make Up Tubular 1.00 2.00 3.00 2.00 0.10 0.30 0.75 0.30
Drill Wellbore Job
Drive Conductor
Safety Meeting 0.25 0.50 0.75 0.50 0.03 0.08 0.19 0.08
Assemble Equipment 1.00 2.00 3.00 2.00 0.10 0.30 0.75 0.30
Drive Conductor 4.30 5.74 7.17 5.74 0.43 0.86 1.79 0.86
Disassemble Equipment 0.50 2.00 2.00 2.00 0.05 0.30 0.50 0.30
Drillout
Safety Meeting 0.25 0.50 0.75 0.50 0.01 0.05 0.11 0.05
Pick Up And Make Up Bha 2.00 3.00 4.00 3.00 0.10 0.30 0.60 0.30
Run In Hole 0.09 0.12 0.16 0.12 0.00 0.01 0.02 0.01
Circulate 0.25 0.50 0.63 0.50 0.01 0.05 0.09 0.05
Drill Shoe Track 0.50 1.00 2.00 1.00 0.03 0.10 0.30 0.10
Drill Surface
Drill Rotary 1.86 2.48 3.10 2.48 0.09 0.25 0.47 0.25
Circulate 0.63 0.78 0.94 0.78 0.03 0.08 0.14 0.08
Short Trip 0.17 0.26 0.35 0.26 0.01 0.03 0.05 0.03
Circulate 0.63 0.78 0.94 0.78 0.03 0.08 0.14 0.08
Pull Out Of Hole 0.16 0.21 0.32 0.21 0.01 0.02 0.05 0.02
Pull Out And Lay Down BHA 2.00 3.00 4.00 3.00 0.10 0.30 0.60 0.30
Run Surface
Clear Rig Floor 0.30 0.50 1.00 0.50 0.02 0.05 0.15 0.05
Assemble Equipment 0.30 0.50 1.00 0.50 0.02 0.05 0.15 0.05
Safety Meeting 0.25 0.50 0.75 0.50 0.01 0.05 0.11 0.05
Pick Up And Make Up Tubular 0.50 1.00 2.00 1.00 0.03 0.10 0.30 0.10
Run Tubular 0.74 0.98 1.23 0.98 0.04 0.10 0.18 0.10
Circulate 0.06 0.11 0.17 0.11 0.00 0.01 0.03 0.01
Cement Surface
Rig Up Surface Equipment 0.50 1.00 2.00 1.00 0.03 0.10 0.30 0.10
Safety Meeting 0.30 0.50 0.75 0.50 0.02 0.05 0.11 0.05
Test Equipment 0.30 0.50 1.00 0.50 0.02 0.05 0.15 0.05
Circulate 0.09 0.11 0.14 0.11 0.00 0.01 0.02 0.01
Pump Spacer 0.09 0.12 0.15 0.12 0.00 0.01 0.02 0.01
Mix And Pump Slurry 0.27 0.35 0.44 0.35 0.01 0.04 0.07 0.04
Displace Slurry 0.09 0.11 0.14 0.11 0.00 0.01 0.02 0.01
Rig Down Surface Equipment 0.50 1.00 2.00 1.00 0.03 0.10 0.30 0.10
Planned Wait 3.00 5.00 8.00 5.00 0.15 0.50 1.20 0.50
Install BOP
Safety Meeting 0.25 0.50 0.75 0.50 0.03 0.08 0.19 0.08
Inspect Area 0.25 0.50 0.75 0.50 0.03 0.08 0.19 0.08
Inspect Equipment 0.25 0.50 0.75 0.50 0.03 0.08 0.19 0.08
Install Blow Out Preventer 4.00 8.00 12.00 8.00 0.40 1.20 3.00 1.20
Test BOP Stack 2.00 4.00 6.00 4.00 0.20 0.60 1.50 0.60
Drillout
Safety Meeting 0.25 0.50 0.75 0.50 0.01 0.05 0.11 0.05
Pick Up And Make Up Bha 2.00 3.00 4.00 3.00 0.10 0.30 0.60 0.30
Run In Hole 0.16 0.21 0.26 0.21 0.01 0.02 0.04 0.02
Circulate 0.63 0.78 0.94 0.78 0.03 0.08 0.14 0.08
Drill Shoe Track 0.50 1.00 2.00 1.00 0.03 0.10 0.30 0.10
Conduct FIT or LOT
Rig Up Surface Equipment 0.25 0.50 0.75 0.50 0.01 0.05 0.11 0.05
Safety Meeting 0.25 0.50 0.75 0.50 0.01 0.05 0.11 0.05
Test Equipment 0.25 0.50 0.75 0.50 0.01 0.05 0.11 0.05
Circulate 0.63 0.78 0.94 0.78 0.03 0.08 0.14 0.08
Perform LOT 0.25 0.50 0.75 0.50 0.01 0.05 0.11 0.05
Rig Down Surface Equipment 0.25 0.50 0.75 0.50 0.01 0.05 0.11 0.05
Drill Intermediate
Drill Rotary 75.91 101.22 126.52 101.22 3.80 10.12 18.98 10.12
Circulate 0.82 1.03 1.23 1.03 0.04 0.10 0.18 0.10
Short Trip 3.57 5.35 7.13 5.35 0.18 0.53 1.07 0.53
Circulate 0.82 1.03 1.23 1.03 0.04 0.10 0.18 0.10
Pull Out Of Hole 2.91 3.88 4.85 3.88 0.15 0.39 0.73 0.39
Pull Out And Lay Down Bha 2.00 3.00 4.00 3.00 0.10 0.30 0.60 0.30
Distributions on every entry

SPE 97269; J de Wardt, S Peterson & J Murtha 25

SPE 97269; J de Wardt, S Peterson & J Murtha 26

SPE 97269; J de Wardt, S Peterson & J Murtha 27
Misapplications in the quantitative analysis
• Risk register not linked to the quantitative risk
and uncertainty model.
• Distributions assigned to all the inputs, just
because we can.
• Models not used for decision-making.

SPE 97269; J de Wardt, S Peterson & J Murtha 28
Comparison Of Well Cost Using WBM to OBM
WBM , M ean = 11.2 M M $
OBM , M ean = 11.1 M M $
5% 95%
0
0.2
0.4
0.6
0.8
1
9.5 11 12.5 14
Well Cost [MM$]
Use Models for Technology Decision-Making….

SPE 97269; J de Wardt, S Peterson & J Murtha 29
OK
OK OK
POOR
POOR POOR
2X COMP.
(no ST)
2X COMP.
(1 ST)
OK POOR
1X COMP.
(1 ST)
OK POOR
2X COMP.
(1 ST)
1X COMP.
(1 ST)
OK
2X COMP.
(1 ST)
RE-B locB
1X COMP.
(no ST)
OK
POOR
RE-B locA BO locB
BO locC
BO locA
RE-A locOK-1
RE-B locA
90% 10%
60% 40% 10% 90%
40% 10% 90%
40% 40% 20%
60%
20% 80%
P = 0.54
P = 0.14 P = 0.12 P = 0.03 P = 0.07 P = 0.05 P = 0.04
P = 0.01
Summary 39% of cases require a ST
85% of cases involve 2X
Completions
15% of cases involve only 1X
Completion
Well 1

SPE 97269; J de Wardt, S Peterson & J Murtha 30
Misapplications in the quantitative analysis
• Risk register not linked to the quantitative risk
and uncertainty model.
• Distributions assigned to all the inputs, just
because we can.
• Models not used for decision-making.
• Abandoning uncertainty and risk analysis
because the desired deterministic estimate falls
at an embarrassing point in (or off) the
probabilistic distribution.

SPE 97269; J de Wardt, S Peterson & J Murtha 31
Misapplications in the quantitative analysis
• Risk register not linked to the quantitative risk
and uncertainty model.
• Distributions assigned to all the inputs, just
because we can.
• Models not used for decision-making.
• Abandoning uncertainty and risk analysis
because the desired deterministic estimate falls
at an embarrassing point in (or off) the
probabilistic distribution.
• Cost and schedule risk isolated from production
and market risk.

SPE 97269; J de Wardt, S Peterson & J Murtha 32
Use Models for Bid Evaluations….
Including Production and Schedule Risk!
Bidder Comparison, Buy After 1 Year Option
90%10%
0
0.2
0.4
0.6
0.8
1
-200 -100 0 100 200 300
NPV (MM$)
Cu
mu
lati
ve P
rob
ab
ilit
y
Bidder1
Bidder2
Bidder3
Bidder4

SPE 97269; J de Wardt, S Peterson & J Murtha 33
Conclusions
• Best practice projects out perform the norm
• Correct application enables re-design, re-
planning and contingencies for improved
performance
• Quantitative analysis enables significantly
improved decision making
• Realistic cost and schedule estimates can only
be generated through correct probabilistic
analysis
• Correct understanding of qualitative and
quantitative analysis is linked to company
performance through project delivery