risk assessment and fertilizer regulation – a valuation ...€¦ · risk assessment and...
TRANSCRIPT
I
Risk Assessment and Fertilizer regulation –
A valuation with respect to recycled phosphorus materials from wastewater
Fabian Kraus, Christian Kabbe, Wolfgang Seis
Kompetenzzentrum Wasser Berlin gGmbH
Berlin, 17.11.2015
This paper had been prepared within the EU-FP7 Project P-REX. It is a brief version of “Deliverable D 9.1-
Quantitative risk assessment of potential hazards for humans and the environment: quantification of potential
hazards resulting from agricultural use of the manufactured fertilizers” and the presentation on risk assessment
from the 11.06.2015 at the P-REX Final Workshop in Amsterdam. This paper provides a further discussion
regarding limit values for fertilizer regulation. It should be noted that this work is based on a quantitative risk
assessment with qualitative sensitivity analysis based on a data-set compiled in 2014. Many uncertainties are not
entirely addressed in this paper. An enhanced version with better consideration of these uncertainties and a
quantitative sensitivity analysis is planned for mid-2018.
Abstract
In recent years several ways of recovering phosphorous from municipal wastewater have been
developed. Depending on the applied technology the recovered materials as well as the quality of
sewage sludge vary significantly concerning the concentrations of heavy metals and organic residues.
A comparative risk assessment of seven renewable and not certified phosphorus fertilizers, sewage
sludge, raw ash and triple super phosphates has been conducted for PCDD/Fs + dl-PCBs, PAHs, As,
Cd, Cr, Cu, Hg, Ni, Pb and Zn. Results indicate that Cd and Zn are of concern under specific
conditions for some endpoints. Additional risk reduction measures are recommended for many
observed substances and endpoints to reduce risks to a negligible level. The use of limit values as one
instrument in fertilizer regulations is one possible measure for risk reduction. Considering the results
of this risk assessment, substance-contents in materials and current fertilizer policies; the effectiveness
of stricter limit values to reduce the input of hazardous substances into the ecosystem is assessed and
risk-based values are proposed.
II
Table of content
1 Introduction ............................................................................................................................... 1
2 Methods .................................................................................................................................... 2
2.1 Scope ......................................................................................................................................... 2
2.2 General Methodology ............................................................................................................... 2
2.3 Approach for risk assessment ................................................................................................... 4
3 Results ....................................................................................................................................... 6
3.1 Risk assessment and classification ............................................................................................ 6
3.2 Relevance of product contamination compared to diffuse sources ........................................... 8
3.3 Contamination of products and legal classification .................................................................. 9
4 Discussion and derivation of limit values ............................................................................... 13
5 Conclusion .............................................................................................................................. 16
6 Acknowledgement .................................................................................................................. 18
7 Literature ................................................................................................................................. 18
1
1 Introduction
On European level, it is expected that the Commission’s proposal for a new fertilizer regulation enters
the legislative process in 2015 [1]. Recycled phosphorus materials will be included in this regulation.
Conventional P-fertilizers as well as renewable/recycled fertilizers contain various by-
products/impurities, which are emitted into environment together with fertilizers applied in
agriculture. The present study intends to evaluate the environmental risks of those impurities.
Moreover, the method of environmental risk assessment is used to assess the effectiveness of stricter
limit values for risk reduction in fertilizer regulation.
The limit values of the German Fertilizer Ordinance (DüMV) and the drafted novel of the Sewage
Sludge Ordinance (AbfKlärV) of Germany are arbitrarily chosen to illustrate this approach, but could
be replaced by any other benchmark or national regulation (in comparison to other EU member states
Germany has rather strict limit values).
The drafted fertilizer regulation of the EU was not taken into account, since suggested fertilizer-
category-specific limit values raises questions regarding the quality criteria for certification into a
specific fertilizer-category. Although this is roughly possible for the investigated materials of this
study, the current approach by EU has to be rethought on categorization of fertilizers and consequently
on varying limit values of several fertilizer-categories.
In chemical risk assessment “risk” is defined as “the probability of an adverse effect on man or the
environment occurring as a result of a given exposure to a chemical or mixture” [2 p.2 Table 1.1].
Risk assessment involves four steps: hazard identification, hazard characterization, exposure
assessment and risk characterization. [2]
In hazard identification, the capacity of substances to cause harm is identified. “[…] Hazard means a
biological, chemical or physical agent […] with the potential to cause an adverse health effect” [3 p.8
Chapt.1 Art.3 (14)].
Hazard characterization correlates the dose of a hazard and the corresponding effect on human health
and/or the environment. The Predicted No-Effect Concentration (PNEC), “[…] a concentration below
which an unacceptable effect will most likely not occur.” [4 p. 93, sect. 3.1], is derived from the result
of toxicological testing and assessment factors in order to cope with present uncertainties.
Exposure assessment models are used to estimate the Predicted Environmental Concentration (PEC) to
which humans or environmental endpoints are likely to be exposed. For this part of risk assessment
assumptions are needed to quantify the expected concentrations as simple as possible but as accurate
as needed.
Risk is expressed as the quotient of PEC and the PNEC in risk characterization. This risk quotient
(RQ) is no absolute measure of risk. In fact, the absolute value of risk remains unknown. The only
conclusion which can be drawn is that the probability of an adverse effect increases with an increasing
RQ. Once a risk was determined, more detailed information must be collected to refine the PNEC in
hazard characterization or the PEC in exposure assessment. Thus, risk assessment is an iterative
process. [2]
2
It has to be understood that even if the risk ratio exceeds the value of “1” it does not mean that an
adverse effect will actually happen, but that by applying a precautionary approach negative effects
cannot be excluded.
It has been shown that on the one hand stricter limit values for heavy metals as precautionary measure
of risk reduction may reduce environmental risks effectively, while on the other hand they fail as other
(diffuse) sources are more important than the inputs on arable land via fertilizers or recycled materials.
The study emphasizes the added value and the need of a sound and competitive scientific evaluation of
all relevant inputs before limit value setting and the advantages of the systematic and transparent
method of environmental risk assessment.
2 Methods
2.1 Scope
The scope of this assessment is compartmentalized in hazards, materials and endpoints:
Hazards: PCDD/F & dl-PCB as WHO-TEQ, PAH, As, Cr, Cu, Hg, Pb, Cd, Ni and Zn
Materials: 13 materials
types of sludge: samples for Bio-P sludge and Fe sludge from Germany; generic
sludge based on measurements of ashes of 13 municipal sewage sludge mono-
incineration plants in Germany
raw ash based on measurements of ashes of 13 municipal sewage sludge mono-
incineration plants in Germany
4 struvite/CaP from sludge/liquor: struvite from Pearl/Struvia and AirPrex
without acidification of sludge and struvite/CaP from Stuttgart and Gifhorn
process with acidification of sludge
3 phosphorus materials from ash/thermal treatment: thermochemical AshDec
material, Mephrec material by metallurgic sludge or ash treatment, Leachphos
material by acidification of ash
2 conventional TSP fertilizers: TSP Pot-tests as sample TSP for the European
market and more polluted average TSP calculated by world-market shares in
2010
Endpoints: human via plant consumption, soil organisms, groundwater
2.2 General Methodology
The risk assessment is conducted for each combination of hazard, material and endpoint. Following
the process of risk management, risk reduction measures are required when the ratio is higher than
one. According to [2] risk can be classified in “unacceptable risk” (RQ > 1), “risk reduction required”
(0.01 < RQ < 1) and “negligible risk” (RQ < 0.01). Since this wording is sharp and may be
misunderstand a classification into “risk reduction required/ need for action” (RQ > 1), “risk reduction
recommended/ ALARA principle” (0.01 < RQ < 1) is used. This classification is adopted in this study
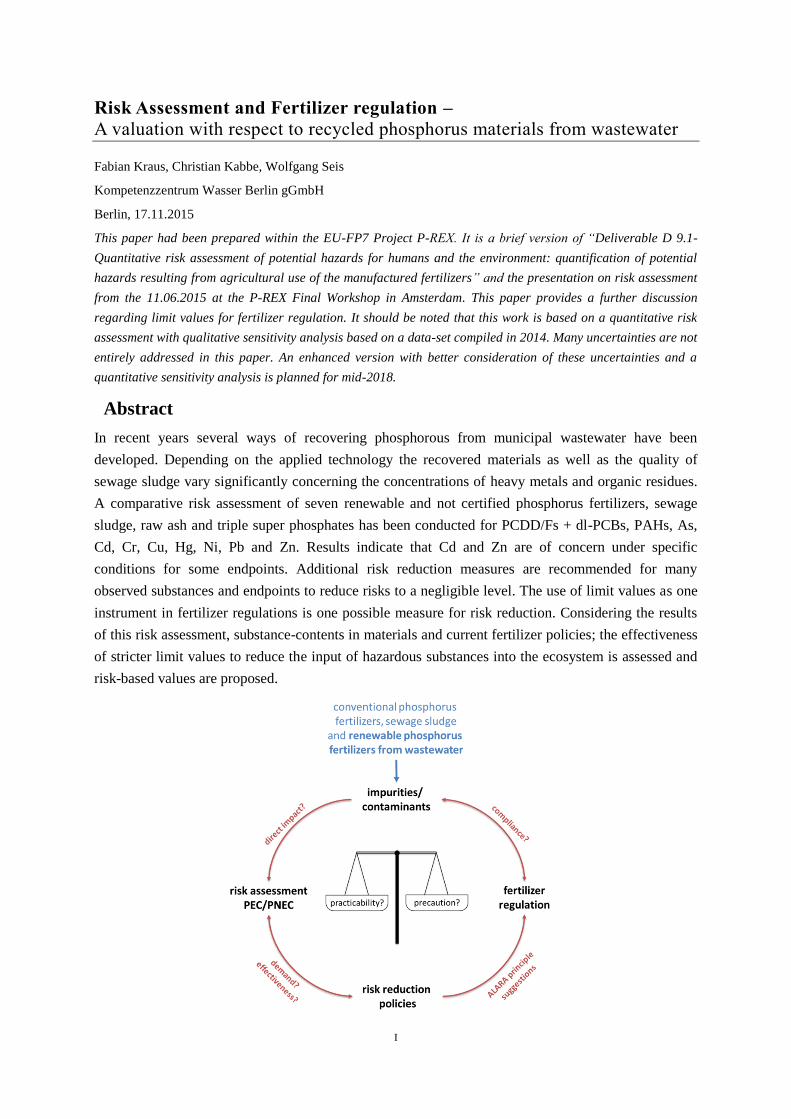
(see Figure 1, results see chapter 3.1) to quantify the urgency of risk reduction measures for specific
hazards in combination with endpoints. If a hazard showed a RQ < 0.01 for all three endpoints
(human, soil organisms and groundwater), there is no need for action. However, the limit value in the
3
fertilizer ordinance is compared with the contamination of materials (chapter 3.3) to estimate a by
legislation permitted PECmax/PNEC quotient.
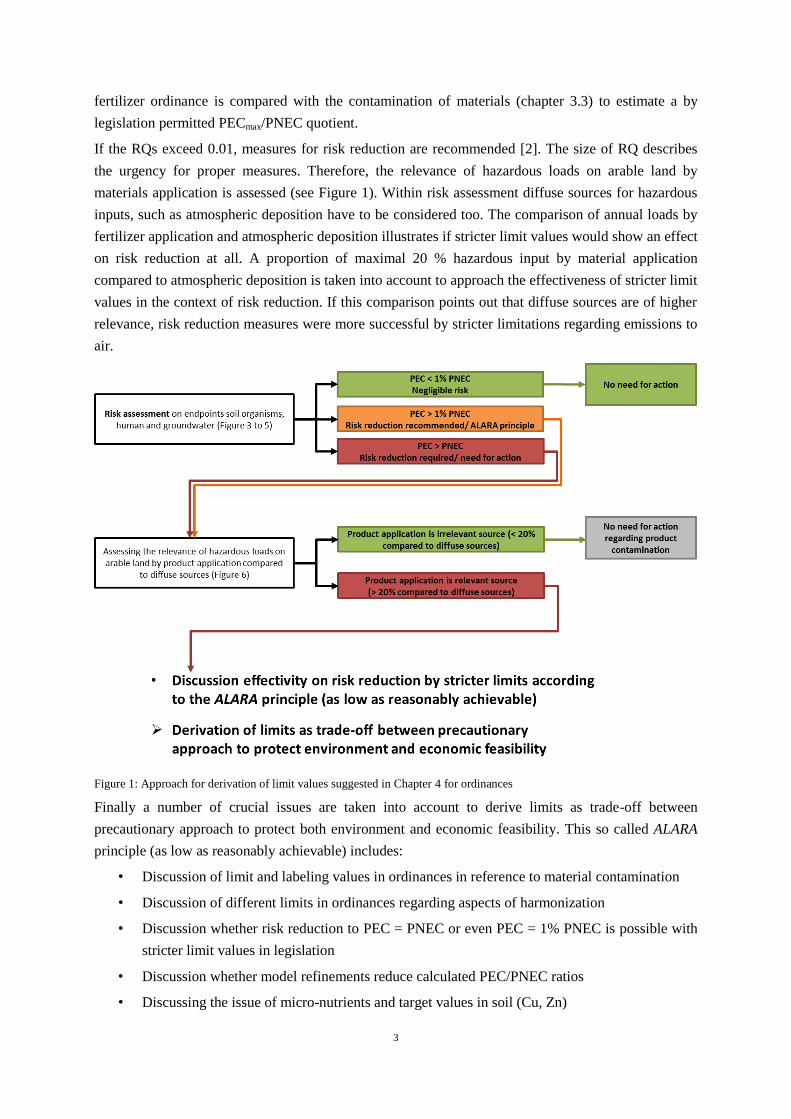
If the RQs exceed 0.01, measures for risk reduction are recommended [2]. The size of RQ describes
the urgency for proper measures. Therefore, the relevance of hazardous loads on arable land by
materials application is assessed (see Figure 1). Within risk assessment diffuse sources for hazardous
inputs, such as atmospheric deposition have to be considered too. The comparison of annual loads by
fertilizer application and atmospheric deposition illustrates if stricter limit values would show an effect
on risk reduction at all. A proportion of maximal 20 % hazardous input by material application
compared to atmospheric deposition is taken into account to approach the effectiveness of stricter limit
values in the context of risk reduction. If this comparison points out that diffuse sources are of higher
relevance, risk reduction measures were more successful by stricter limitations regarding emissions to
air.
Figure 1: Approach for derivation of limit values suggested in Chapter 4 for ordinances
Finally a number of crucial issues are taken into account to derive limits as trade-off between
precautionary approach to protect both environment and economic feasibility. This so called ALARA
principle (as low as reasonably achievable) includes:
• Discussion of limit and labeling values in ordinances in reference to material contamination
• Discussion of different limits in ordinances regarding aspects of harmonization
• Discussion whether risk reduction to PEC = PNEC or even PEC = 1% PNEC is possible with
stricter limit values in legislation
• Discussion whether model refinements reduce calculated PEC/PNEC ratios
• Discussing the issue of micro-nutrients and target values in soil (Cu, Zn)
4
The following points provide two possible examples:
For a certain hazard the RQ exceed 0.01 for at least one endpoint, so risk reduction is
recommended; the comparison with atmospheric deposition indicates that the hazardous input
by fertilizer application is way below 20 % of annual atmospheric deposition and stricter limit
values for fertilizers would not have an effect on risk reduction: consequently the limit value
for fertilizers is sufficiently strict in terms of environmental protection
For a certain hazard the RQ exceed 0.01 for at least one endpoint, so risk reduction is
recommended; the comparison with atmospheric deposition indicates that the hazardous input
by fertilizer application exceeds 20 % of annual atmospheric deposition although the limit
value in fertilizer ordinance is met by the materials: consequently a stricter limit value has to
be considered as one option of risk reduction. It may be that even without fertilizer application
the negligible level is exceeded. Consequently very strict limit values for fertilizers would not
conclude in an RQ below 0.01 but risk reduction still can be achieved by stricter limit values.
Considering a number of crucial issues according to the ALARA principle a stricter limit value
for this hazard is eventually suggested in terms of risk reduction and feasibility.
2.3 Approach for risk assessment
Based on the potential accumulation of hazards in soil, a time span of 100 years of fertilizer
application is modelled in exposure assessment. An annual fertilizer equivalent to 60 kg P2O5/ ha ×
year is assumed. Average atmospheric deposition of hazards in Germany is considered as well as the
initial concentrations of the hazardous substances in soil based on literature values and pre-modelling
In exposure assessment model refinements additional to the proposed model by EU Technical
Guidance Document [4] were realized with a solute transport and a precipitation model for the hazards
of concern (Cd and Zn). Generally, the assumption for an “European standard environment” [4] was
applied for modelling. A number of sensitivity analyses were conducted on the different input
parameters: water flow parameters, rain and infiltration rate, substance-specific parameters, soil-pH
(for hazards Cd, Ni and Zn with high potential of mobilization in acidic soils), initial and boundary
fluxes and quantity of fertilizer application. Figure 2 illustrates the exposure routes considered in the
risk assessment.
5
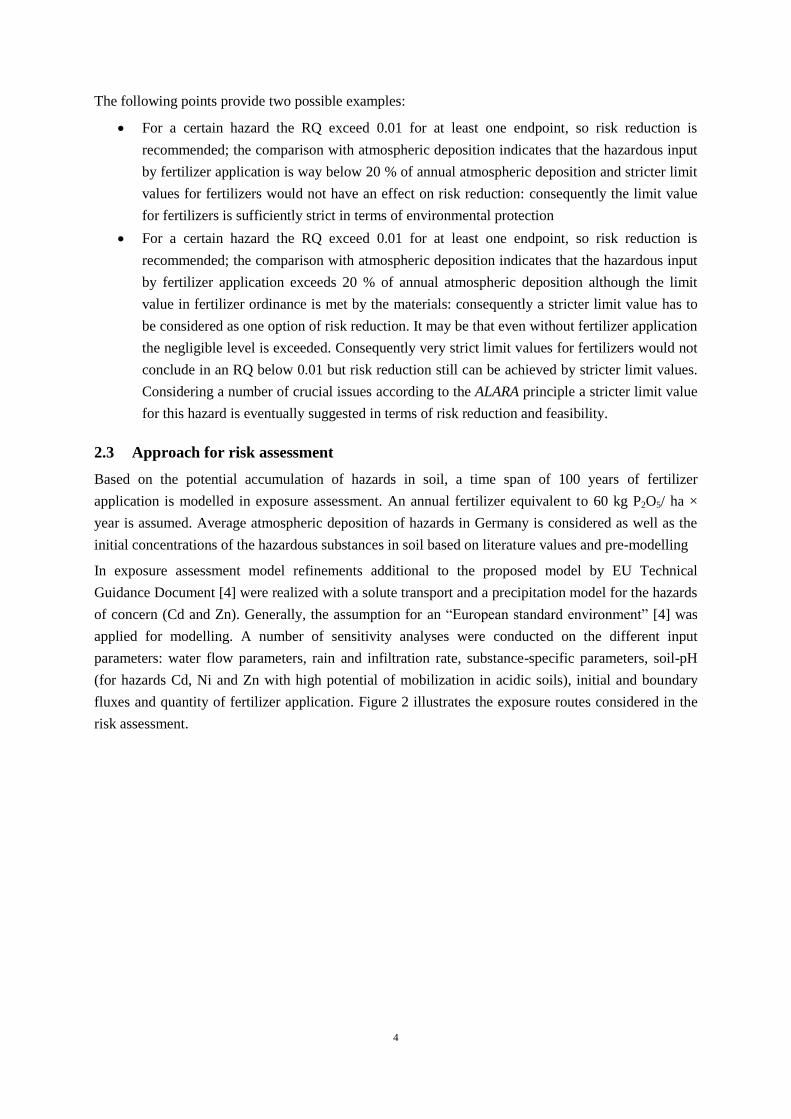
Figure 2: Pathways for exposure, endpoints and midpoints in the risk assessment
For topsoil the model [4] considers the input of hazards by fertilizer application and atmospheric
deposition and the outputs volatilization, biodegradation and leaching for organic substances. For
heavy metals the model has been modified, so leaching is the only output. Leaching is thereby
described by soil hydraulic properties and the retardation of metals by their behaviour to adsorb on soil
particles. Hazard uptake by plants or organisms is only considered for risk characterization regarding
the endpoint human and soil organisms, so an equivalent load is not reduced in topsoil. This worst-
case assumption is common practice in risk assessments [4].
Risk characterization is realized for two midpoints: topsoil and leachate. Thereby the PNEC is
described as a concentration in topsoil or leachate which is tolerable for humans, soil organisms or
groundwater due to inverse modelling. For humans this inverse modelling is founded on safety
parameters, like the Tolerable Daily Intake, for each hazard. Assumptions to derive a tolerable
concentration in topsoil for humans regarding wheat consumption were applied [5], [6], [7]. The
precise description for derivation of PNEChuman is described in in the Deliverable D 9.1 of the EU FP7
project P-REX [8]. The hazard- and endpoint-specific PNECs are shown in Table 1.
6
Table 1: Hazard- and Endpoint-specific PNECs for assessment
Substance
Endpoint soil organisms
Midpoint topsoil
Endpoint humans
Midpoint topsoil
Endpoint groundwater
Midpoint leachate
PNEC [mg/kg
topsoil] Source
PNEC [mg/kg
topsoil]
Source for safety
parameter
PNEC [µg/L
leachate] Source
PCDD/F &
dl-PCB
2∙10-5 WHO-TEQ
From NOEC: [9], [10]
5.44∙10-5 WHO-TEQ
[11]
PCB approx.
3.25∙10-6
WHO-TEQ
Minor threeshold
value [12]
PAH (BaP) BaP: 0.053 [13] PAH: 3109 [14] PAH: 0.2
As 7 From NOEC: [15] 8.39 [16] 10
Cr 62 [17] 327 [18] 7
Cu 78.9 [19] 107 [20] 14
Hg 0.3 [21] 17.1 [22] 0.2
Pb 166 [23] 20.1 [6] 7
Cd 1.15 [24] 0.42 [25] 0.5
Ni 50 [26] 143 [27] 14
Zn 26 [28] 817 [29] 58
3 Results
3.1 Risk assessment and classification
The RQ is calculated from quotient PEC to PNEC for each endpoint, each hazard and product [4 sect.
5.1, p.172, Table 32]. The ranges of hazard- and endpoint-specific ratios are shown in Figure 3 to
Figure 5.
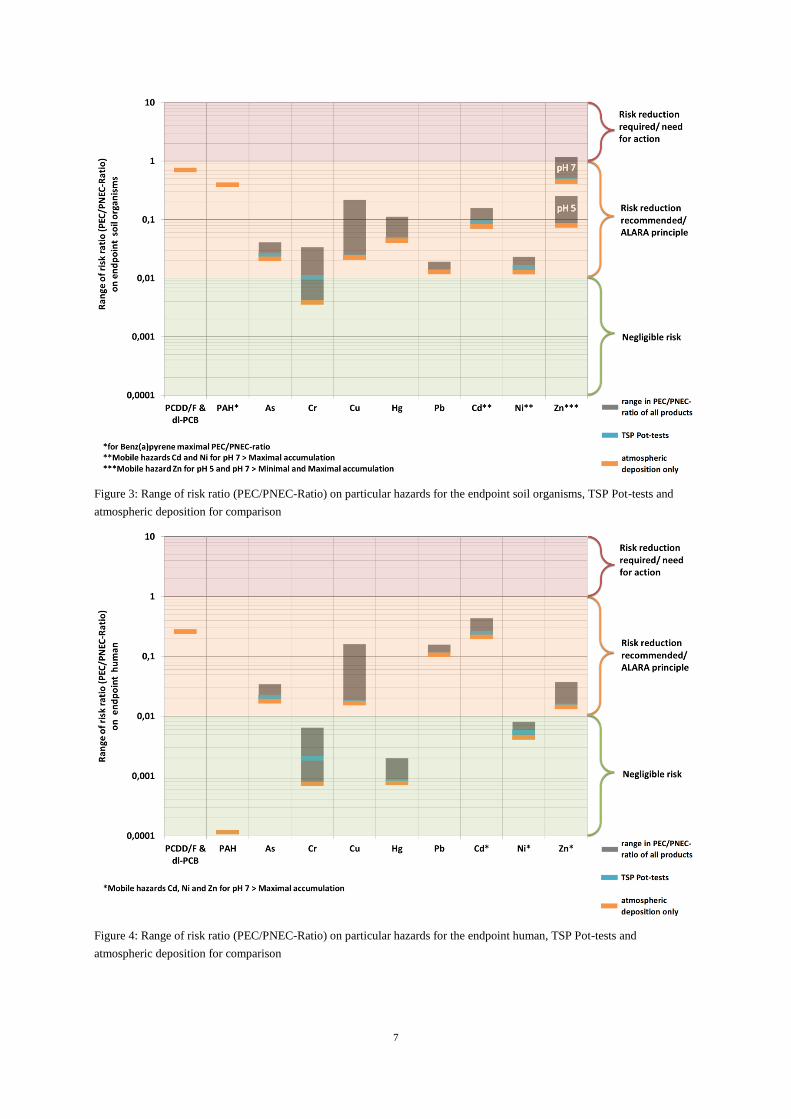
1. Endpoint soil organisms (see Figure 3).
a. For zinc by application of the products Bio-P sludge, Fe sludge, generic sludge, raw
ash or AshDec for pH-values above pH 6 an exceeding of the PNEC cannot be
excluded. Below pH 6 the risk ratio for these products is below 1, but measures for
risk reduction are still recommended
2. Endpoint humans (see Figure 4)
a. No exceeding of the PNEC was calculated.
b. The highest risk characterization ratios are for PCDD/F and dl-PCB (0.3) regarding
organic substances and for cadmium (0.5) regarding heavy metals by using worst-case
assumptions for calculation.
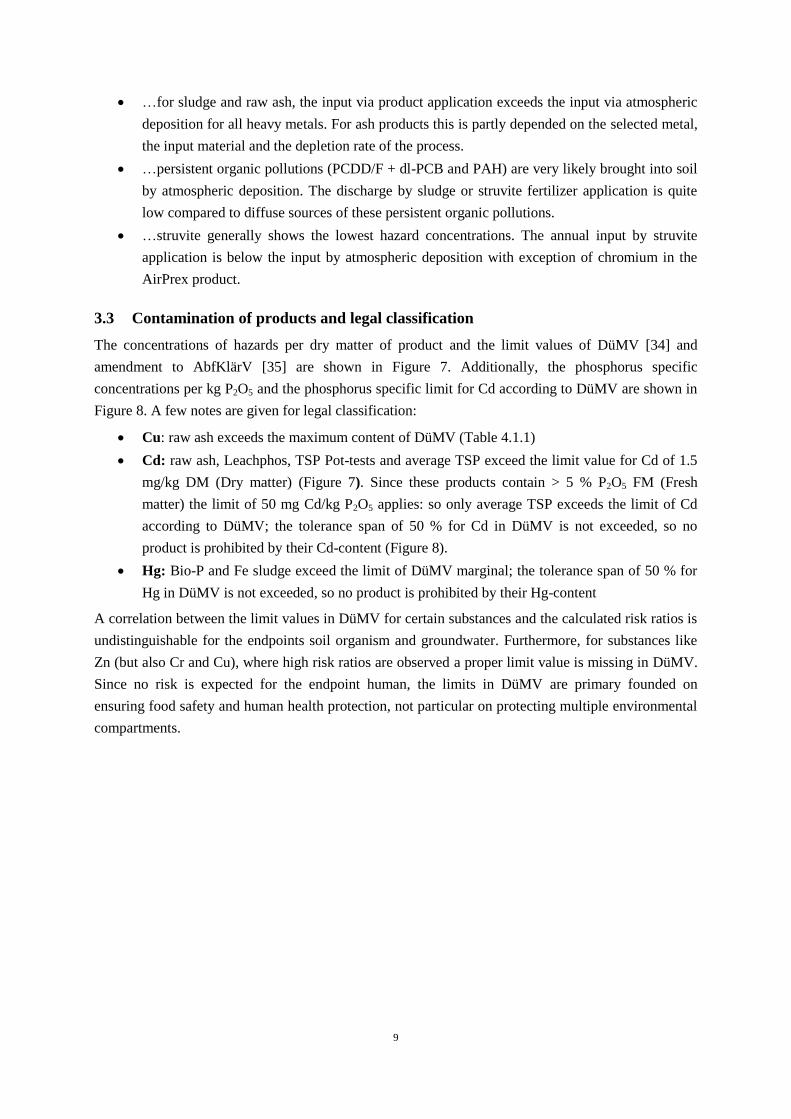
3. Endpoint groundwater (see Figure 5)
a. High risk characterization ratios for the heavy metals cadmium, copper, nickel and
zinc are calculated compared to the other endpoints.
b. Depending on metal and Kd-value (in dependency form soil-pH) the PNEC for Cd and
Zn is considerably exceeded.
c. Especially for zinc the PEC exceeds the PNEC for most of the products in the whole
selected pH-range
d. Regarding cadmium the PEC exceeds the PNEC for all product applications and low
pH-values below pH 6.
7
Figure 3: Range of risk ratio (PEC/PNEC-Ratio) on particular hazards for the endpoint soil organisms, TSP Pot-tests and
atmospheric deposition for comparison
Figure 4: Range of risk ratio (PEC/PNEC-Ratio) on particular hazards for the endpoint human, TSP Pot-tests and
atmospheric deposition for comparison
8
Figure 5: Range of risk ratio (PEC/PNEC-Ratio) on particular hazards for the endpoint groundwater, TSP Pot-tests and
atmospheric deposition for comparison
The risk ratios of secondary phosphates are in the same magnitude as for TSP. Against the background
of assumptions made, there are no unacceptable risks caused by the organic substances, arsenic,
chromium, copper, mercury, nickel or lead.
Besides cadmium and zinc, many hazards lead to endpoint-specific risk quotients above the negligible
level. Based on the worst-case assumptions made the quotients could be reduced by further model
refinements in many cases. Risk is on a negligible level concerning humans for PAHs, chromium and
mercury.
In case of low-contaminated products, the exceeding of PNEC for Cd and Zn regarding groundwater is
often a result of high previous or present rates of atmospheric deposition of these substances. In these
cases a risk cannot be excluded, although the product-quality is not responsible. For an effective
minimization of risks a reduced diffuse discharge into the atmosphere would be necessary instead to
any process development refining the product.
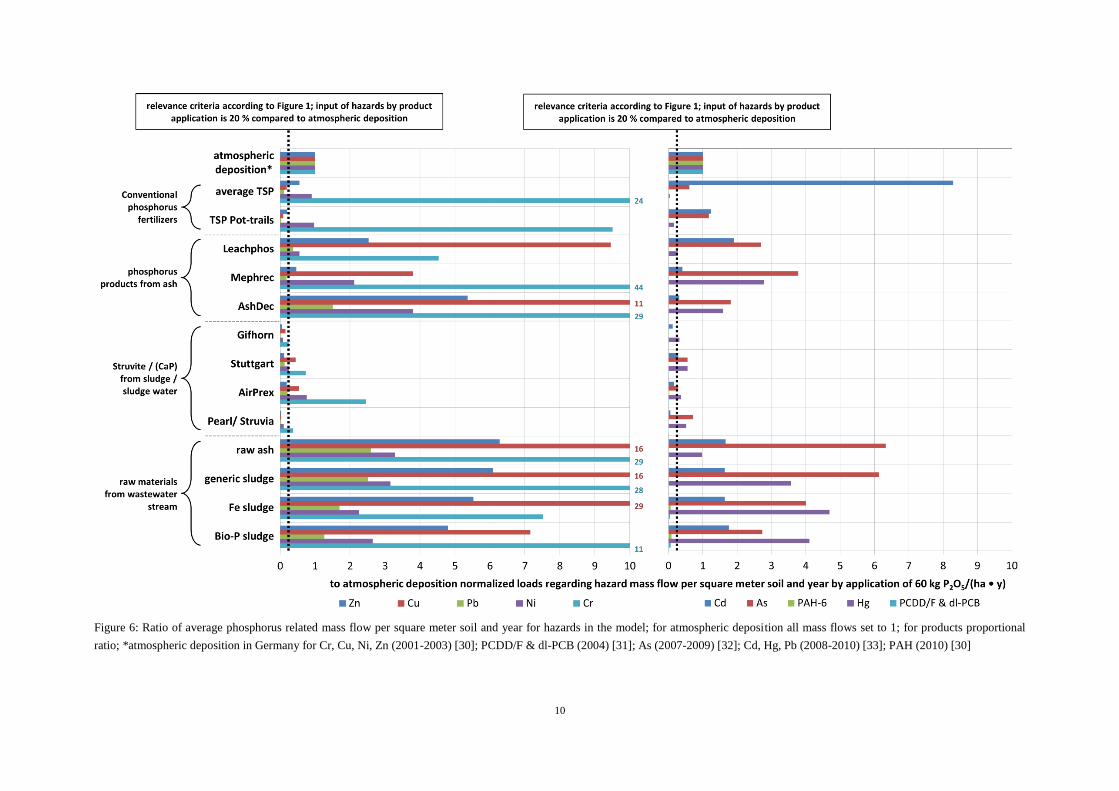
3.2 Relevance of product contamination compared to diffuse sources
Figure 6 illustrates the relevance of the hazards in the products compared to the input via diffuse
sources, such as atmospheric deposition. It becomes apparent that…
…in comparison to the annual load of atmospheric deposition, almost all products have
elevated chromium contents. In case of sludge, raw ash and ash products additionally copper
appears to be a relevant hazard compared to atmospheric deposition.
9
…for sludge and raw ash, the input via product application exceeds the input via atmospheric
deposition for all heavy metals. For ash products this is partly depended on the selected metal,
the input material and the depletion rate of the process.
…persistent organic pollutions (PCDD/F + dl-PCB and PAH) are very likely brought into soil
by atmospheric deposition. The discharge by sludge or struvite fertilizer application is quite
low compared to diffuse sources of these persistent organic pollutions.
…struvite generally shows the lowest hazard concentrations. The annual input by struvite
application is below the input by atmospheric deposition with exception of chromium in the
AirPrex product.
3.3 Contamination of products and legal classification
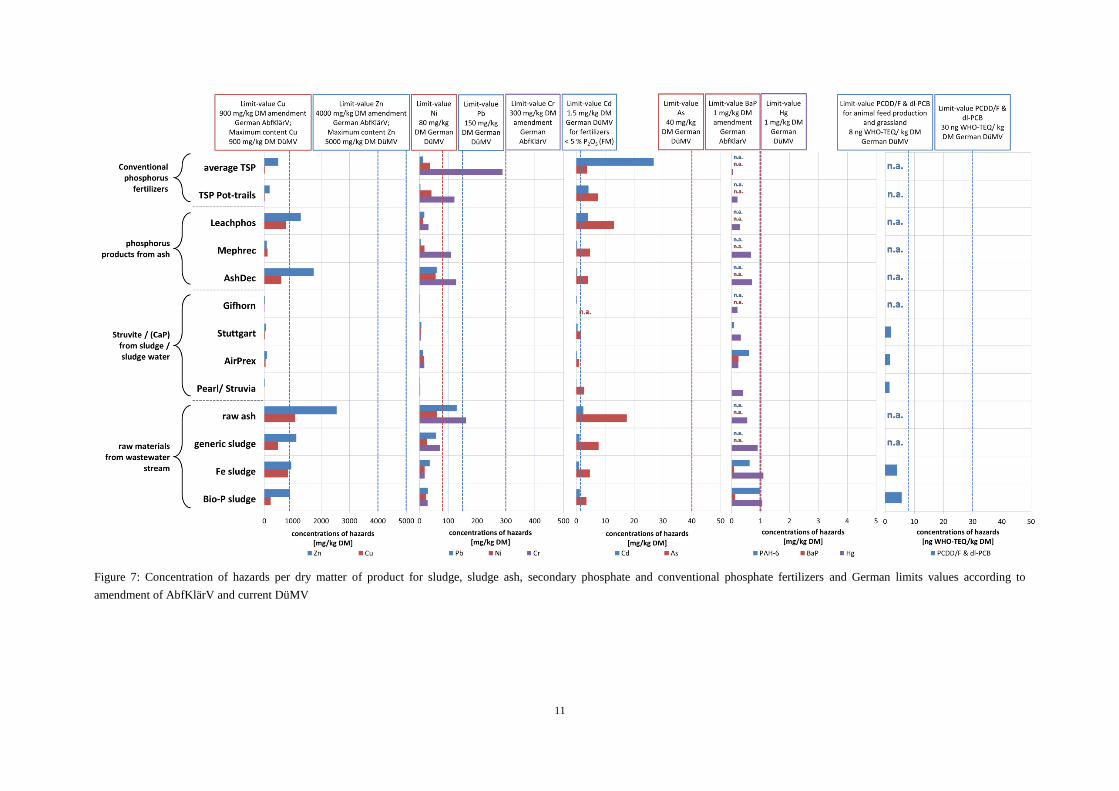
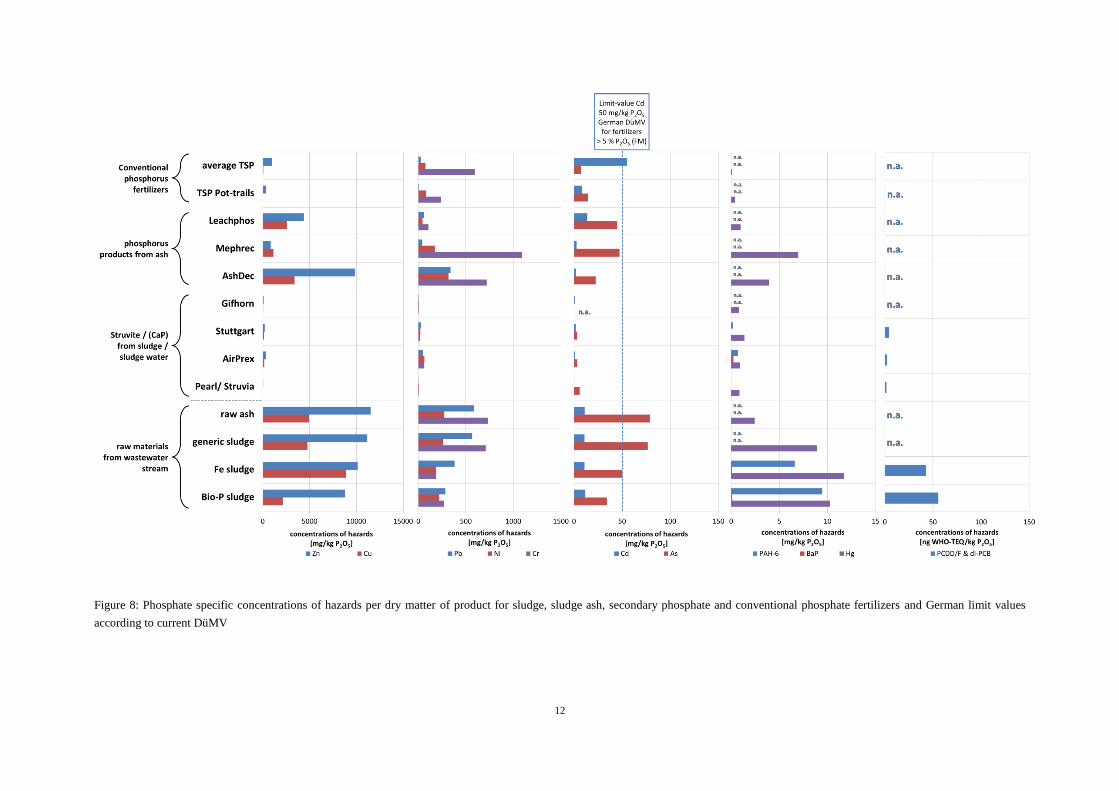
The concentrations of hazards per dry matter of product and the limit values of DüMV [34] and
amendment to AbfKlärV [35] are shown in Figure 7. Additionally, the phosphorus specific
concentrations per kg P2O5 and the phosphorus specific limit for Cd according to DüMV are shown in
Figure 8. A few notes are given for legal classification:
Cu: raw ash exceeds the maximum content of DüMV (Table 4.1.1)
Cd: raw ash, Leachphos, TSP Pot-tests and average TSP exceed the limit value for Cd of 1.5
mg/kg DM (Dry matter) (Figure 7). Since these products contain > 5 % P2O5 FM (Fresh
matter) the limit of 50 mg Cd/kg P2O5 applies: so only average TSP exceeds the limit of Cd
according to DüMV; the tolerance span of 50 % for Cd in DüMV is not exceeded, so no
product is prohibited by their Cd-content (Figure 8).
Hg: Bio-P and Fe sludge exceed the limit of DüMV marginal; the tolerance span of 50 % for
Hg in DüMV is not exceeded, so no product is prohibited by their Hg-content
A correlation between the limit values in DüMV for certain substances and the calculated risk ratios is
undistinguishable for the endpoints soil organism and groundwater. Furthermore, for substances like
Zn (but also Cr and Cu), where high risk ratios are observed a proper limit value is missing in DüMV.
Since no risk is expected for the endpoint human, the limits in DüMV are primary founded on
ensuring food safety and human health protection, not particular on protecting multiple environmental
compartments.
10
Figure 6: Ratio of average phosphorus related mass flow per square meter soil and year for hazards in the model; for atmospheric deposition all mass flows set to 1; for products proportional
ratio; *atmospheric deposition in Germany for Cr, Cu, Ni, Zn (2001-2003) [30]; PCDD/F & dl-PCB (2004) [31]; As (2007-2009) [32]; Cd, Hg, Pb (2008-2010) [33]; PAH (2010) [30]
11
Figure 7: Concentration of hazards per dry matter of product for sludge, sludge ash, secondary phosphate and conventional phosphate fertilizers and German limits values according to
amendment of AbfKlärV and current DüMV
12
Figure 8: Phosphate specific concentrations of hazards per dry matter of product for sludge, sludge ash, secondary phosphate and conventional phosphate fertilizers and German limit values
according to current DüMV
13
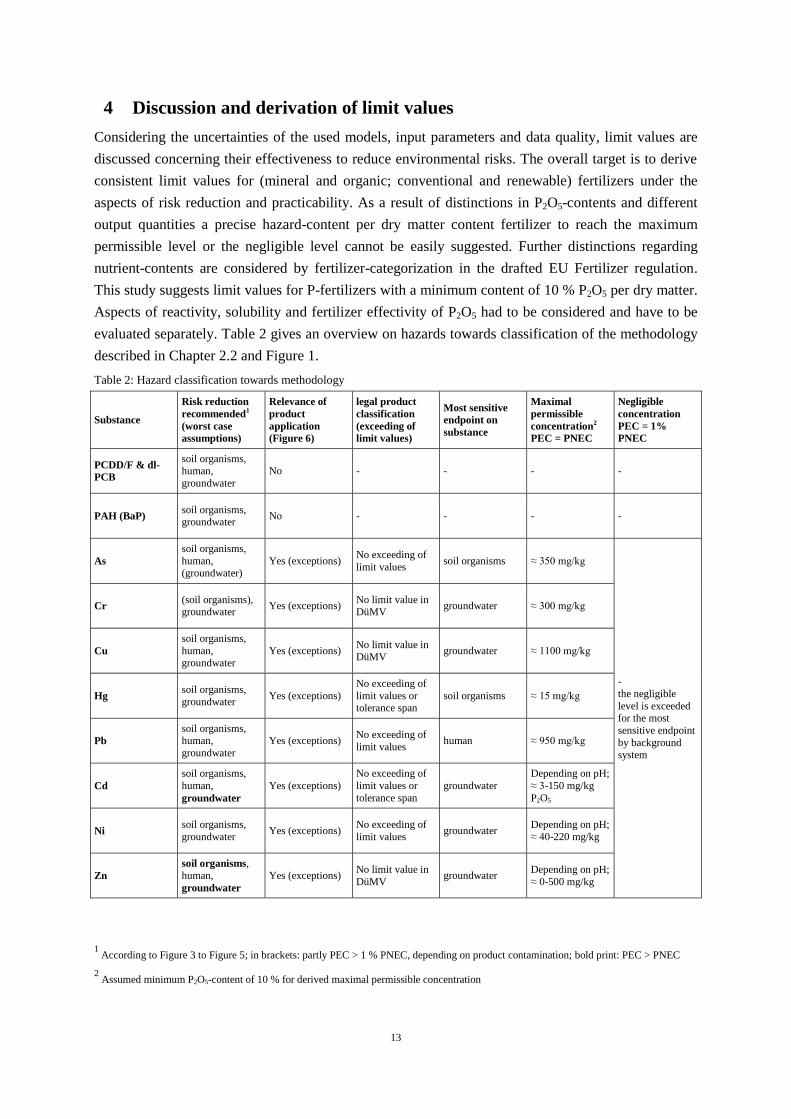
4 Discussion and derivation of limit values
Considering the uncertainties of the used models, input parameters and data quality, limit values are
discussed concerning their effectiveness to reduce environmental risks. The overall target is to derive
consistent limit values for (mineral and organic; conventional and renewable) fertilizers under the
aspects of risk reduction and practicability. As a result of distinctions in P2O5-contents and different
output quantities a precise hazard-content per dry matter content fertilizer to reach the maximum
permissible level or the negligible level cannot be easily suggested. Further distinctions regarding
nutrient-contents are considered by fertilizer-categorization in the drafted EU Fertilizer regulation.
This study suggests limit values for P-fertilizers with a minimum content of 10 % P2O5 per dry matter.
Aspects of reactivity, solubility and fertilizer effectivity of P2O5 had to be considered and have to be
evaluated separately. Table 2 gives an overview on hazards towards classification of the methodology
described in Chapter 2.2 and Figure 1.
Table 2: Hazard classification towards methodology
Substance
Risk reduction
recommended1
(worst case
assumptions)
Relevance of
product
application
(Figure 6)
legal product
classification
(exceeding of
limit values)
Most sensitive
endpoint on
substance
Maximal
permissible
concentration2
PEC = PNEC
Negligible
concentration
PEC = 1%
PNEC
PCDD/F & dl-
PCB
soil organisms, human,
groundwater
No - - - -
PAH (BaP) soil organisms, groundwater
No - - - -
As
soil organisms,
human, (groundwater)
Yes (exceptions) No exceeding of
limit values soil organisms ≈ 350 mg/kg
-
the negligible
level is exceeded for the most
sensitive endpoint
by background system
Cr (soil organisms), groundwater
Yes (exceptions) No limit value in DüMV
groundwater ≈ 300 mg/kg
Cu
soil organisms,
human, groundwater
Yes (exceptions) No limit value in DüMV
groundwater ≈ 1100 mg/kg
Hg soil organisms,
groundwater Yes (exceptions)
No exceeding of
limit values or tolerance span
soil organisms ≈ 15 mg/kg
Pb
soil organisms, human,
groundwater
Yes (exceptions) No exceeding of
limit values human ≈ 950 mg/kg
Cd
soil organisms,
human,
groundwater
Yes (exceptions)
No exceeding of
limit values or
tolerance span
groundwater
Depending on pH;
≈ 3-150 mg/kg
P2O5
Ni soil organisms,
groundwater Yes (exceptions)
No exceeding of
limit values groundwater
Depending on pH;
≈ 40-220 mg/kg
Zn
soil organisms, human,
groundwater
Yes (exceptions) No limit value in
DüMV groundwater
Depending on pH;
≈ 0-500 mg/kg
1 According to Figure 3 to Figure 5; in brackets: partly PEC > 1 % PNEC, depending on product contamination; bold print: PEC > PNEC
2 Assumed minimum P2O5-content of 10 % for derived maximal permissible concentration
14
PCDD/F & dl-PCB and PAH: Figure 6 as well as Figure 3 to Figure 5 underline the
negligible effect on the overall immissions due to fertilizer application. The risk ratio is either
a result of the background concentration in soil or due to high rates of atmospheric deposition.
Stricter limit values in DüMV will not have any effect on risk reduction.
As: According to Figure 3 and Figure 4 risk reduction is recommended regarding the
endpoints soil organisms and humans. The current limit value of 40 mg/kg in DüMV is totally
sufficient to deceed the maximal permissible concentration (see Table 2). A stricter limit value
e.g. the labelling value according to DüMV of 20 mg/kg will not reduce the risk ratios to the
negligible level, but can be considered as reasonable measure of risk reduction. None of the
observed fertilizers exceeds 20 mg/kg. Hence other measures of risk reduction may achieve
similar results by lower efforts a risk-benefit analysis can be conducted.
Cr: There is currently no limit value for total Cr in DüMV. Figure 4 confirms the low
relevance of Cr (III) regarding human health. Leaching of chromium depends on pH-value
because of a low saturation concentration of Cr in neutral soils. In current fertilizer regulations
often a limit value for Cr (VI) of 2 mg/kg is set or discussed instead of a limit for total
chromium. [36] Although Cr (VI) has a considerably higher toxicity compared to Cr (III), this
discussion should not underestimate toxicity to organisms of Cr (III)/ total Cr especially under
acidic conditions [17]. Furthermore Cr (VI) is likely to be reduced to Cr (III) under
environmental conditions [17]. Under aspects of precaution the limit value from AbfKlärV
and the labelling value from DüMV of 300 mg/kg (total Cr) should be considered as one
possible limit value for an upcoming fertilizer regulation. This limit achieves the maximal
permissible level of risk for groundwater considering worst-case assumptions according to this
risk assessment.
Cu: Cu is on the one hand an essential micro-nutrient and on the other hand a hazard
depending on concentration in soil. Figure 3 to Figure 5 indicate a recommendation of risk
reduction measures regarding Cu for all endpoints. This is still the case, although precipitation
of Cu takes place in neutral soils and the real PEC/PNEC ratio is reduced in this case for the
endpoint groundwater. The maximum content for Cu in DüMV in fertilizers and the limit
value in AbfKlärV is fixed at 900 mg/kg. Considering both, risk reduction measures and the
essentiality of Cu, a limit value with exceptions is suggested: for soils with content of
exchangeable Cu above 2-4 mg/kg soil [37], a limit value in fertilizer ordinance of 900 mg/kg
is sufficient, so the maximum permissible level is not exceed (see Table 2). Below this level
no limit value should be applied, to ensure the Cu-supply of the soil. A limit value of 900
mg/kg would prohibit valorization on arable land of some sewage sludge incineration ashes.
Hg: Risks on human health by Hg are on a negligible level due its high immobility in soil
(Figure 4). For risk reduction regarding soil organisms the limit value of 1 mg/kg in DüMV is
totally sufficient to deceed the maximum permissible concentration (see Table 2). For
groundwater the calculated risk ratio (Figure 5) can be reduced by model refinement, since Hg
is likely to precipitate in a pH-range between 5 and 7. A Stricter limit value would result only
minor effects on risk reduction but would correspond with an almost complete prohibition of
sewage sludge valorization on arable land and is as a result not a reasonable option reflecting
the current situation in Germany or Europe.

15
Pb: Risk reduction is recommended regarding all three endpoints. By model-refinement of the
worst-case assumptions the risks regarding the endpoints human and groundwater could be
reduced (refining of transfer-rate for plant-uptake and precipitation of Pb). The current limit
value of 150 mg/kg in DüMV is totally sufficient to deceed the maximum permissible
concentration (see Table 2). A stricter limit value e.g. the labelling value according to DüMV
of 100 mg/kg will not reduce the risk ratios to the negligible level, but can be considered as
useful measure of risk reduction. Hence other measures of risk reduction may achieve similar
results by lower efforts a risk-benefit analysis can be conducted. A limit value of 100 mg/kg
would prohibit valorization on arable land of many sewage sludge incineration ashes.
Cd: Cd is often seen as most problematic hazard, due to high toxicity, ascertained transfer-rate
regarding accumulation in plants, mobile behavior even in neutral soils and elevated Cd-
concentrations in conventional fertilizers as a result of high concentrations in sedimentary
phosphate rock. Against the background of assumptions made the risk for the endpoint
groundwater cannot be excluded on acidic soils (Figure 5). An exceeding of the PNECgroundwater
is not necessarily the result of fertilizer application, but is likely to be already reached by
background-concentrations and atmospheric deposition. In DüMV two limit values are applied
for Cd. For P2O5-poor fertilizers (< 5 % P2O5 FM) the limit value can be sufficiently
protective dependent on the quantity of fertilizer, that is been used. In contrast, for P2O5-rich
fertilizers (> 5 % P2O5 FM), the limit value is too high regarding sustainable groundwater
protection. A limit value of 3 mg/kg P2O5 DM would reduce risks based on the assumptions to
the maximum permissible level on acidic soils. This limit value would exclude all commonly
produced conventional phosphorus fertilizers. Therefore a limit value of 30 mg/kg P2O5 DM is
suggested, since this value also meets the other limit value of 1.5 mg/kg for Cd at a P2O5-
content of 5 % DM. Concerning the endpoints soil organisms and humans, risk reduction is
included by this proceeding.
Ni: Primary because of the solubility of Ni in acid soils, risk reduction is recommended
(Figure 5). Against the background of Figure 7 a reduction of the limit value to the current
labelling of 40 mg/kg seems not possible concerning conventional fertilizers. Nevertheless this
value can be debated as target under the aspect of risk reduction, so the maximum permissible
level is not exceeded (see Table 2) on acid soils. A limit value of 40 mg/kg would also
prohibit valorization on arable land for many sewage sludge incineration ashes and recent ash-
based products. Hence other measures of risk reduction may achieve similar results by lower
efforts a risk-benefit analysis can be conducted.
Zn: Zn seems one of the most problematic hazards especially in context with the missing
limit-value in DüMV. On neutral soil risks regarding the endpoint soil organisms and
groundwater cannot partly be excluded, dependent on the Zn-load of the products. On acidic
soils an exceeding of the PNECgroundwater is very likely. This is the consequence of the high
mobility and the high Zn-concentrations especially in sewage sludge, ashes and partly ash-
products. Zn is an essential micro-nutrient. Therefore, a similar proceeding like for Cu is
suggested. A limit value in fertilizer legislation of 1000-1500 mg/kg is meaningful for soils
with content of exchangeable Zn above 3 mg/kg [37]. Below this level no limit value should
be applied, to ensure the Zn-supply of the soil. Depending on the strictness of the limit value
16
for Zn, a corresponding prohibition of sewage sludge incineration ash is intended; but also for
recent ash-based products and partly sewage sludge this measure would intend new
challenges. It should also be noted that even a limit value of 1000 mg/kg is not sufficient to
deceed the maximum permissible level (see Table 2) for all conditions.
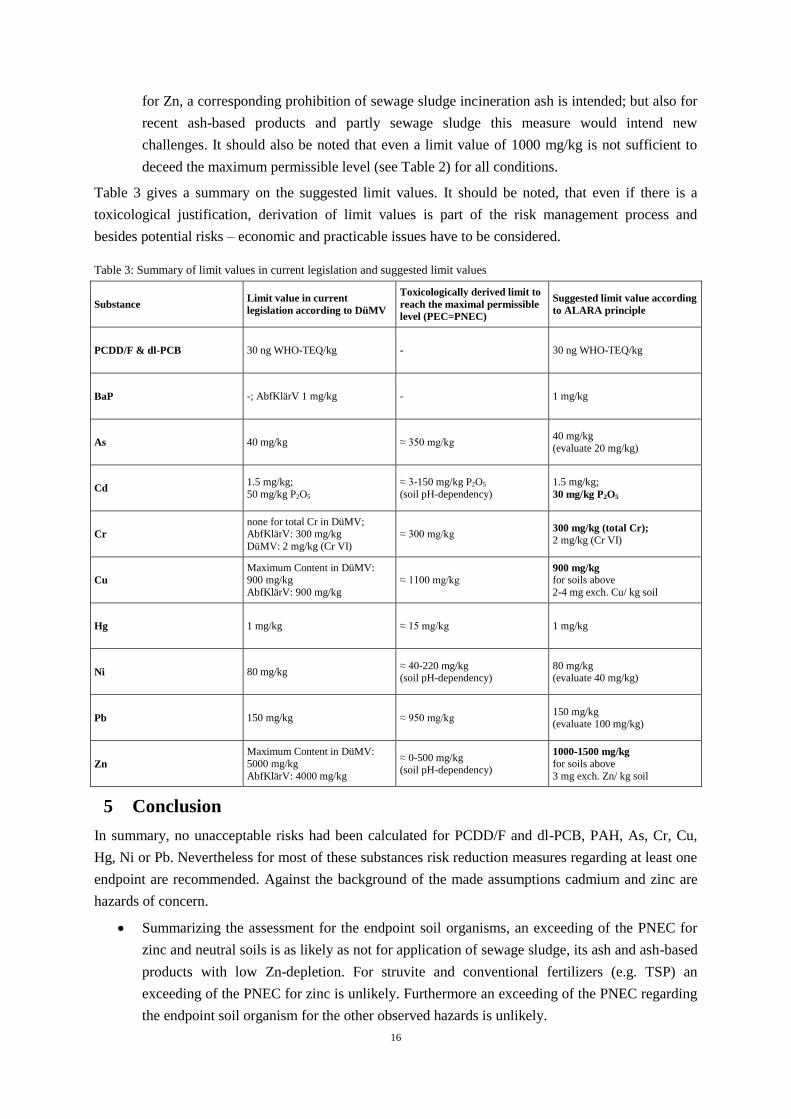
Table 3 gives a summary on the suggested limit values. It should be noted, that even if there is a
toxicological justification, derivation of limit values is part of the risk management process and
besides potential risks – economic and practicable issues have to be considered.
Table 3: Summary of limit values in current legislation and suggested limit values
Substance Limit value in current
legislation according to DüMV
Toxicologically derived limit to
reach the maximal permissible
level (PEC=PNEC)
Suggested limit value according
to ALARA principle
PCDD/F & dl-PCB 30 ng WHO-TEQ/kg - 30 ng WHO-TEQ/kg
BaP -; AbfKlärV 1 mg/kg - 1 mg/kg
As 40 mg/kg ≈ 350 mg/kg 40 mg/kg
(evaluate 20 mg/kg)
Cd 1.5 mg/kg;
50 mg/kg P2O5
≈ 3-150 mg/kg P2O5
(soil pH-dependency)
1.5 mg/kg;
30 mg/kg P2O5
Cr
none for total Cr in DüMV; AbfKlärV: 300 mg/kg
DüMV: 2 mg/kg (Cr VI)
≈ 300 mg/kg 300 mg/kg (total Cr);
2 mg/kg (Cr VI)
Cu
Maximum Content in DüMV: 900 mg/kg
AbfKlärV: 900 mg/kg
≈ 1100 mg/kg 900 mg/kg
for soils above
2-4 mg exch. Cu/ kg soil
Hg 1 mg/kg ≈ 15 mg/kg 1 mg/kg
Ni 80 mg/kg ≈ 40-220 mg/kg (soil pH-dependency)
80 mg/kg (evaluate 40 mg/kg)
Pb 150 mg/kg ≈ 950 mg/kg 150 mg/kg (evaluate 100 mg/kg)
Zn
Maximum Content in DüMV:
5000 mg/kg
AbfKlärV: 4000 mg/kg
≈ 0-500 mg/kg (soil pH-dependency)
1000-1500 mg/kg
for soils above
3 mg exch. Zn/ kg soil
5 Conclusion
In summary, no unacceptable risks had been calculated for PCDD/F and dl-PCB, PAH, As, Cr, Cu,
Hg, Ni or Pb. Nevertheless for most of these substances risk reduction measures regarding at least one
endpoint are recommended. Against the background of the made assumptions cadmium and zinc are
hazards of concern.
Summarizing the assessment for the endpoint soil organisms, an exceeding of the PNEC for
zinc and neutral soils is as likely as not for application of sewage sludge, its ash and ash-based
products with low Zn-depletion. For struvite and conventional fertilizers (e.g. TSP) an
exceeding of the PNEC for zinc is unlikely. Furthermore an exceeding of the PNEC regarding
the endpoint soil organism for the other observed hazards is unlikely.
17
Summarizing the assessment for the endpoint human, an exceeding of the PNEC for any
hazard and product is unlikely.
Summarizing the assessment for the endpoint groundwater, an exceeding of the PNEC for
cadmium and zinc for soils with a pH-value around 5 is very likely for all assessed products.
For cadmium, an exceeding of the PNEC for groundwater is unlikely for soils with a pH-value
around 7. For application of sewage sludge, its ash and ash-based products with low Zn-
depletion, an exceeding of the PNEC for zinc and soils with a pH-value around 7 is likely. For
all other products it is about as likely as not. Furthermore, an exceeding of the PNEC
regarding the endpoint groundwater and the other observed hazards is unlikely.
By comparison of the hazard contents in fertilizers a relative risk ranking of the products can be
derived. In principle lower concentrations will reduce the risk. Thus, struvite can be considered a high
quality phosphate fertilizer and an extensive struvite recovery and recycling in agriculture can be
recommended. Considering sludge or TSP application as status-quo in agriculture, struvite application
even reduces risks regarding the selected hazards. Considering ash related processes an improvement
regarding heavy metal depletion is in some cases necessary.
The comparison of risk assessment results with regulated limit values revealed a lack in regulation for
Cr, Cu and Zn, which are not strictly limited by DüMV. Especially in case of Zn a limit value is
necessary to reduce potential risks to environment. It becomes apparent that this ordinance is focussed
on protecting the endpoint human; risks for environment are not completely covered.
The present study also showed that:
1. Risk assessment is appropriate method to support political decisions regarding limit values
(here for fertilizer regulation) and to reveal and communicate present knowledge and
uncertainties in a transparent way.
2. Stricter limit values for fertilizers are not in all cases a suitable measure for risk reduction
because other routes of exposure are far more important than fertilizer application.
3. Limit values can be used as an instrument to exclude certain product groups from the market.
If the political decision for excluding a product (e.g. sewage sludge) from the market a stricter
limit value for a certain substance can be used to do so, without actually banning it.
4. In many cases common fertilizers are in compliance with toxicologically derived limits, but
there are also exceptions (e.g. Cd and Cr for some products and especially Zn). In the latter
cases, the ALARA principle has to be applied. When toxicologically derived limits are not
suitable as limit values in fertilizer regulations, since several materials would be excluded
from the market, other political measures may be considered to reduce the possibility of
negative effects on the environment. One idea might be a “contamination tax” in dependency
on hazardous content per nutrients in fertilizers.
Regarding the issue of certification and implementation of renewable phosphate fertilizers into
fertilizer legislation, not only the hazardous content is of importance. The product has to be classified
according to fertilizer legislation [38 p.19 sect. A2]. This European Fertilizer Legislation is, as
mentioned, currently recast. Thereby renewable phosphate fertilizers from sewage treatment are
intended to be included into the legislation. For products, like AshDec and Leachphos, whose quality
depends highly on the quality of the raw materials a certification (also REACH-registration) will be
18
difficult. In contrast, for products with a defined composition, such as struvite or fertilizers with
defined composition out of technical phosphoric acid from sewage sludge ash, a certification and
integration into fertilizer legislation is more likely.
Apart from the relative risk ranking and issues of certification and legislation a general measure for
risk reduction in practice can be suggested: A demand-actuated (restock-orientated) fertilizer
application may be advisable. There is no need for phosphorus fertilizer application, when the
phosphorus storage in soil is sufficiently filled with plant available phosphorus or sufficiently enough
phosphorus from soil is mineralized within a short time-frame into a plant available form. As further
consequence the input of hazards is reduced due to a demand-actuated fertilizer application. Stricter
legislative limits for particular hazards and effective high quality fertilizers can additionally help to
ensure fertilizer quality and to reduce risks. Nevertheless, sufficiency of fertilizer-use in agriculture, in
terms of risk reduction and with respect to responsible handling of limited resources, is the area which
requires the highest attention.
6 Acknowledgement
The contributions of the authors were financially supported by the European Commission (FP7 project
P-REX, grant agreement #308645).
Reports (also full report of this risk assessment [8]), technical factsheets and publications of the P-
REX Project are available on the website www.p-rex.eu.
7 Literature
1. Liegeois, E., Activities and instruments to foster P-recycling in EU - How to stimulate
investments related to P-recovery activities? 2015, European Comission, DG GROW D.2.
2. van Leeuwen, C.J. and T.G. Vermeire, Risk Assessment of Chemicals - An Introduction. Vol.
2nd edition. 2007: Springer.
3. EU, Regulation (EC) No 178/2002 of the European Parliament and of the Council of 28
January 2002 - laying down the general principles and requirements of food law, establishing
the European Food Safety Authority and laying down procedures in matters of food safety.
2002, Official Journal of the European Communitie.
4. IHCP, Technical Guidance Document on Risk Assessment - Part II: Environmental Risk
Assessment. 2003, European Union - Institute for Health and Consumer Protection.
5. Schütze, G., U. Lorenz, and T. Spranger, Proceedings Expert Meeting on Critical Limits for
Heavy Metals and Methods for their Application. 2002, Umweltbundesamt.
6. VKM, Risk assessment of contaminants in sewage sludge applied on norwegian soils. 2009,
Norwegian Scientific Committee for Food Safety.
7. MRI, Ergebnisbericht Teil 2 - Nationale Verzehrsstudie II - Die bundesweite Befragung zur
Ernährung von Jugendlichen und Erwachsenen. 2008, Max Rubner-Institut -
Bundesforschungsinstitut für Ernährung und Lebensmittel
8. Kraus, F. and W. Seis, P-REX: D 9.1 Quantitative risk assessment of potential hazards for
humans and the environment: quantification of potential hazards resulting from agricultural
use of the manufactured fertilizers. 2015, Kompetenzzentrum Wasser Berlin gGmbH (KWB).
9. Herter, U. and D. Külling, Risikoanalyse zur Abfalldüngerverwertung in der Landwirtschaft -
Teil 1: Grobbeurteilung. 2001, Eidgenössische Forschungsanstalt für Agrarökologie und
Landbau FAL, Reckenholz, Zürich: Bundesamtes für Landwirtschaft, Bundesamt für Umwelt,
Wald und Landschaft.
10. LUBW, Schadstoffe in klärschlammgedüngten Ackerböden Baden-Württembergs, in
Bodenschutz 14. 2003, Landesanstalt für Umweltschutz Baden-Württemberg.
19
11. BfR, Fragen und Antworten zu Dioxinen und PCB in Lebensmitteln. 2012, Bundesinstitut für
Risikobewertung.
12. LAWA, Ableitung von Geringfügigkeitsschwellenwerten für das Grundwasser. 2004,
Länderarbeitsgemeinschaft Wasser (LAWA).
13. IHCP, European Union Risk Assessment Report - Coil-tar pitch, High Temperatur - Risk
Assessment. 2008, European Union - Institute for Health and Consumer Protection.
14. EFSA, Polycyclic Aromatic Hydrocarbons in Food - Scientific Opinion of the Panel on
Contaminants in the Food Chain. 2008, European Food Safety Authority.
15. Scheffer and Schachtschabel, Lehrbuch der Bodenkunde, 16. Auflage. 2010: Spektrum
Akademischer Verlag.
16. EFSA, Scientific Opinion on Arsenic in Food - EFSA Panel on Contaminants in the Food
Chain (CONTAM). 2009, European Food Safety Authority.
17. IHCP, European Union Risk Assessment Report - Chromium trioxide, sodium chromate,
sodium dichromate, ammonium dichromate and potassium dichromate. 2005, European Union
- Institute for Health and Consumer Protection.
18. EFSA, Tolerable upper intake levels for vitamins and minerals. 2006, European Food Safety
Authority.
19. ECI, European Union Risk Assessment Report - Voluntary Risk Assessment of Copper, Copper
II Sulphate Pentahydrate, Copper(I)oxide, Copper(II)oxide, Dicopper Chloride Trihydroxide -
Chapter 3 - Environmental Exposure - Part 2. 2009, European Copper Institute.
20. SCF, Opinion of the Scientific Committee on Food on the Tolerable Upper Intake Level of
Copper. 2003, European Union Scientific Committee on Food.
21. van Wijk, D., Combining it all: Mercury risk assessment - local. 2004, Euro Chlor - WCC
Science Ambassador Programme.
22. EFSA, Scientific Opinion on the risk for public health related to the presence of mercury and
methylmercury in food. 2012, European Food Safety Authority.
23. IHCP, European Union Risk Assessment Report - Lead metal, Lead oxide, Lead tetroxide,
Lead stabiliser compounds - Effect assessment & risk characterization. 2008, European Union
- Institute for Health and Consumer Protection.
24. IHCP, European Union Risk Assessment Report - Cadmium oxide and cadmium metal - Part I
- environment. 2007, European Union - Institute for Health and Consumer Protection.
25. EFSA, Cadmium in food - Scientific Opinion of the Panel on Contaminants in the Food
Chain. 2009, European Food Safety Authority.
26. IHCP, European Union Risk Assessment Report - Nickel. 2008, Institute for Health and
Consumer Protection.
27. WHO, Nickel in Drinking-water - Background document for development of WHO Guidelines
for Drinking-water Quality. 2005, World Health Organisation.
28. IHCP, European Union Risk Assessment Report - Zinc. 2010, Institute for Health and
Consumer Protection.
29. SCF, Opinion of the Scientific Committee on Food on the Tolerable Upper Intake Level of
Zinc. 2003, European Union Scientific Committee on Food.
30. Fuchs, S., et al., Berechnung von Stoffeinträgen in die Fließgewässer Deutschlands mit dem
Modell MONERIS - Nährstoffe, Schwermetalle und Polyzyklische aromatische
Kohlenwasserstoffe. 2010, Umweltbundesamt.
31. Akkan, Z., J. Oltmanns, and F. Kalberlah, Literaturstudie zur Ermittlung des
Depositionswertes von Dioxinen, Furanen und dioxinähnlichen PCB. 2004, Landesanstalt für
Umweltschutz Baden-Württemberg.
32. Lehmhaus, J., et al., Atmosphärische Stoffeinträge in Schleswig-Holstein. 2009, Landesamt für
Landwirtschaft, Umwelt und ländliche Räume des Landes Schleswig-Holstein -
Lufthygienische Überwachung
20
33. Ilyin, I., et al., EMEP/MSC-E Technical Report 5/2012 - Transboundary Pollution of
Germany by Heavy Metals and Persistent Organic Pollutants in 2010. 2012.
34. BMELV, Verordnung über das Inverkehrbringen von Düngemitteln, Bodenhilfsstoffen,
Kultursubstraten und Pflanzenhilfsmitteln (Düngemittelverordnung - DüMV). 2012,
Bundesministerium für Ernährung Landwirtschaft und Verbraucherschutz.
35. Bergs, C.-B., Novelle der Klärschlammverordnung und Übelegungen des BMUB zu einer
Phosphor-Rückgewinnungsverordnung. 2014, Bundesministerium für Umwelt, Naturschutz,
Bau und Reaktorsicherheit.
36. Embert, G., Comments on preparing a new EU fertiliser legislation. 2014.
37. Niedersachsen, L., Richtwerte für die Düngung in Niedersachsen - Auszug aus den
Düngemittelrichtlinien, Stand März 2008, Mikronährstoffe Bor, Mangan, Kupfer und Zink.
2008.
38. European Commission, Regulation (EC) No 2003/2003 of the European Parliament and of the
Council of 13 October 2003 relating to fertilizers, E.P.a. Council, Editor. 2003, Journal of the
European Commission.