risk assessment and impact on technology decisions
TRANSCRIPT
This document is the property of Rystad Energy. The document must not be reproduced or distributed in any forms, in parts or full without permission from Rystad Energy. The information contained in this document
is based on Rystad Energy’s global oil & gas database UCUBE, public information from company presentations, industry reports, and other, general research by Rystad Energy. The document is not intended to be
used on a stand-alone basis but in combination with other material or in discussions. The document is subject to revisions. Rystad Energy is not responsible for actions taken based on information in this document.
Miljødirektoratet
07.02.2019
Risk assessment and impact on
technology decisions

Perceived risk seldom aligns with assessed risk – oil and gas technologies are no exception
Source: Susanna Hertrich, 2008: «Reality Checking Device»; OG21 2016 strategy; Rystad Energy research and analysis
Risk perception vs assessed risk
2
PE
RC
EV
IE
D
RI
SK
AS
SE
SS
ED
R
IS
K
Airplane
crash
Mobile
phones
Terrorist attack
Gun crime
Stock crash
Heat wave
Credit card fraud
Road traffic accident
Applying new
technologies
in oil and gas
• Studies reveal that there is a large discrepancy between the scenarios that the population fears and those that are actually harmful (see
chart above). I.e., the public’s perceived risk of flying is far higher than that of driving a car. Assessed risk of flying is actually very low,
and driving a car is objectively one of the more dangerous things to undertake.
• In the OG21 strategy, perceived risk is identified as one of the barriers of technology adoption. That is, an additional premium on
the assessed risk, explaining the conservatism and risk aversion that characterizes the industry in adopting new technologies.
• For the purpose of this study, we always assume that the perceived risk is higher than the assessed risk, driven by the detailed
procedures on HSE and qualification underlying risk assessment procedures.
Not to scale
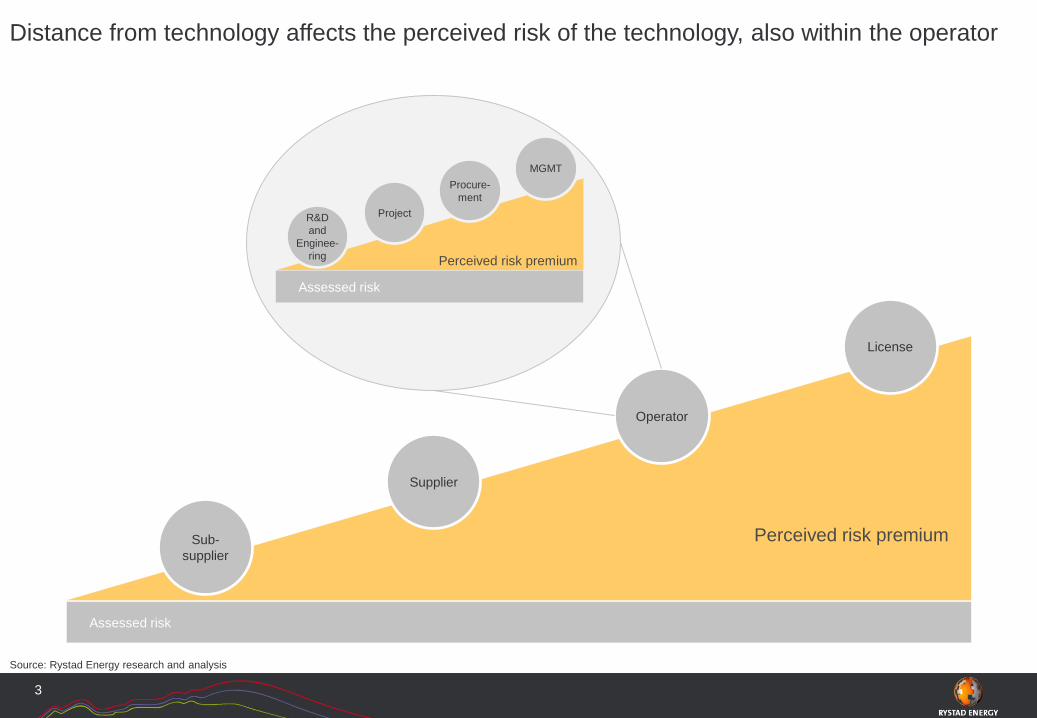
Distance from technology affects the perceived risk of the technology, also within the operator
Source: Rystad Energy research and analysis
3
Perceived risk premium
Supplier
Operator
License
Perceived risk premium
R&D
and
Enginee-
ring
MGMT
Assessed risk
Project
Assessed risk
Sub-
supplier
Procure-
ment

Government /regulatory
Perception of risk and value likely to be different in the various “decision locations”
4
Supplier Operator LicenseSub-
supplier
Perceived risk premium
Assessed risk
Key decision
criteria
Fund own R&D to sell to many
suppliers/operators
Most profitable
solution for company
portfolio
Build competence
Most profitable
solution for field
Distance from
technology /
competence
Risk premium
Typical risk
distributionShare of risk taken
Source: Rystad Energy research and analysis

Stakeholders from a wide range of companies and institutions have provided input
Source: OG21; Rystad Energy
5
25+in-depth
interviews
55workshop
participants

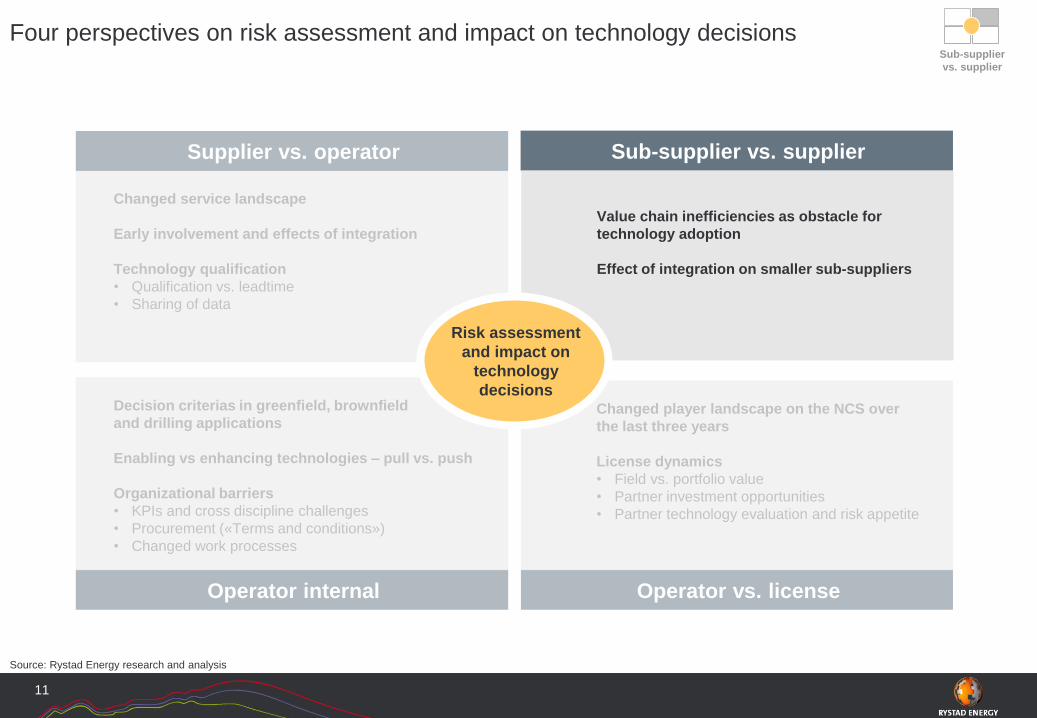
Four perspectives on risk assessment and impact on technology decisions
Source: Rystad Energy research and analysis
6
Sub-supplier vs. supplier
Changed service landscape
Early involvement and effects of integration
Technology qualification
• Qualification vs. lead time
• Sharing of data
Value chain inefficiencies as obstacle for
technology adoption
Effect of integration on smaller sub-suppliers
Operator internal Operator vs. license
Changed player landscape on the NCS over
the last three years
License dynamics
• Field vs. portfolio value
• Partner investment opportunities
• Partner technology evaluation and risk appetite
Decision criteria in greenfield, brownfield
and drilling applications
Enabling vs enhancing technologies – pull vs. push
Organizational barriers
• KPIs and cross discipline challenges
• Procurement («Terms and conditions»)
• Changed work processes
Supplier vs. operator
Risk assessment
and impact on
technology
decisions

Four perspectives on risk assessment and impact on technology decisions
Source: Rystad Energy research and analysis
7
Sub-supplier vs. supplier
Changed service landscape
Early involvement and effects of integration
Technology qualification
• Qualification vs. leadtime
• Sharing of data
Value chain inefficiencies as obstacle for
technology adoption
Effect of integration on smaller sub-suppliers
Operator internal Operator vs. license
Changed player landscape on the NCS over
the last three years
License dynamics
• Field vs. portfolio value
• Partner investment opportunities
• Partner technology evaluation and risk appetite
Decision criteria in greenfield, brownfield
and drilling applications
Enabling vs enhancing technologies – pull vs. push
Organizational barriers
• KPIs and cross discipline challenges
• Procurement («Terms and conditions»)
• Changed work processes
Supplier vs. operator
Risk assessment
and impact on
technology
decisions
Supplier vs. operator

Changed service landscape
Alliances and JVs followed by M&A in the downturn
Source: Rystad Energy research and analysis
8
Schlumberger / WesternGeco (divest)
McDermott / CB&I
TechnipFMC / Plexus (wellhead)
Emerson / Paradigm (software)
Altus / Quinterra
Ensco / Atwood
Transocean / Songa
Jacobs / C2HM Hill (EPC)
Subsea 7 / EMAS
SNC-Lavalin / Atkins
Schlumberger / Borr (20% stake)
Borr / Transocean (jack-ups)
Aker Solutions / Reinertsen
Wood Group / AMEC FW
Solstad / Farstad / Deep Sea Supply
Subsea 7 / Seaway (heavy lift)
GE / Baker Hughes
TechnipFMC
Baker Hugher / Halliburton (failed)
Schlumberger / Meta (Clad tech)
Fluor / Stork (EPC+ maintn.)
Schlumberger / Cameron = OneSubsea
AMEC / Foster Wheeler
Halliburton / Odfjell / AkerBP
TechnipFMC / Lundin Petroleum
Borr / Schlumberger (performanced based)
Aker Solutions / Subsea 7 / AkerBP
GE / NOV (FPSO solutions)
McDermott / Petrofac (SURF)
Aker Solutions / ABB (subsea power & automation)Aker Solutions / Saipem (selected projects)
Subsea 7 / KBR (concept and FEED)
OneSubsea / Subsea 7 (SPS & SURF)
EMAS AMC / Chioyda
Technip / FMC = Forsys (SPS / SURF)
GE / McDermott = io oil & gas consulting (concept + FEED)
OneSubsea / Helix / Schlumberger (well intervention)
Saipem / Chioyda = Xodus (concept + FEED)
Aker Solutions / Baker Hughes (Well & SPS)
GE / Sapura Kencana (rotating equipments)
Schlumberger / Cameron = OneSubsea
0
20
40
60
80
100
120
140
Jul-12 Jan-13 Jul-13 Jan-14 Jul-14 Jan-15 Jul-15 Jan-16 Jul-16 Jan-17 Jul-17 Jan-18
Alliances and Joint Ventures
Alliance, joint venture and merger & acquisition in Offshore OFS, July 2012 - Jan 2018
Supplier vs. operator
Mergers and acquisitions
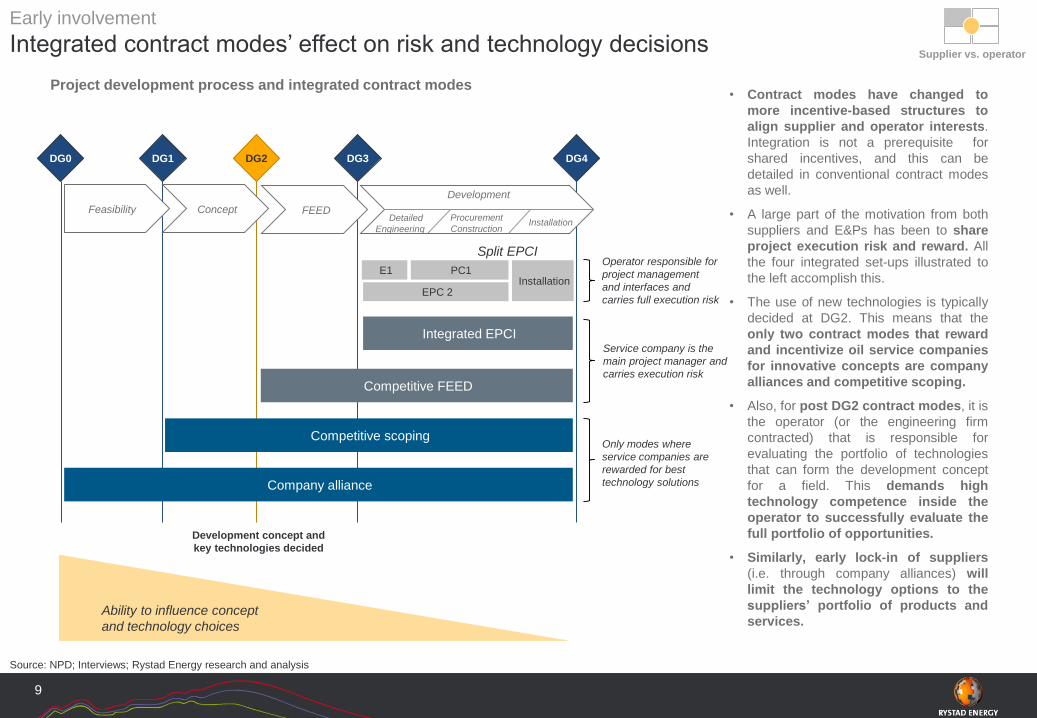
Early involvement
Integrated contract modes’ effect on risk and technology decisions
Source: NPD; Interviews; Rystad Energy research and analysis
Project development process and integrated contract modes
9
DG0 DG1 DG2 DG3 DG4
Feasibility Concept FEED
Development
PC1
Competitive FEED
Detailed
Engineering
Procurement
ConstructionInstallation
EPC 2Installation
Competitive scoping
Company alliance
Integrated EPCI
Ability to influence concept
and technology choices
• Contract modes have changed to
more incentive-based structures to
align supplier and operator interests.
Integration is not a prerequisite for
shared incentives, and this can be
detailed in conventional contract modes
as well.
• A large part of the motivation from both
suppliers and E&Ps has been to share
project execution risk and reward. All
the four integrated set-ups illustrated to
the left accomplish this.
• The use of new technologies is typically
decided at DG2. This means that the
only two contract modes that reward
and incentivize oil service companies
for innovative concepts are company
alliances and competitive scoping.
• Also, for post DG2 contract modes, it is
the operator (or the engineering firm
contracted) that is responsible for
evaluating the portfolio of technologies
that can form the development concept
for a field. This demands high
technology competence inside the
operator to successfully evaluate the
full portfolio of opportunities.
• Similarly, early lock-in of suppliers
(i.e. through company alliances) will
limit the technology options to the
suppliers’ portfolio of products and
services.
Operator responsible for
project management
and interfaces and
carries full execution risk
Only modes where
service companies are
rewarded for best
technology solutions
Service company is the
main project manager and
carries execution risk
Split EPCI
E1
Supplier vs. operator
Development concept and
key technologies decided

TRL4 stuck between two chairs, “too big for Rotvoll” and too time consuming for license to adopt
*Exceptions exist, but using less mature technologies increases risk of project delay significantly
Source: Interviews; OG21 2016 strategy; Rystad Energy research and analysis
Maturing technologiesTechnology Readiness Level (TRL) – API17N
10
All operators interviewed require a technology
level of TRL4 or higher before sanctioning a
project (DG3)*
Supplier vs. operator
TRL0 TRL1 TRL2 TRL4 TRL5 TRL6 TRL7
Unproven concept
Basic R&D
Study or
experiment to prove
concept
Experimental proof
of conceptProduction system
interface tested
Production system
installed and tested
Production system
field proven
Pre production
system
environment
tested
TRL3
Prototype tested
Cost to progress to next step
Steps on the
TRL ladder
E&P funding
sourceOperator R&D budget (FoT setup) License
To qualify a technology from TRL3 to TRL4 is typically too
expensive to be carried over the operators’ R&D budget
and will need funding from a license
Paradox:
Technology qualification does not match time sensitive nature of the development project,
yet is dependent on the project for further maturation
Paradox
Four perspectives on risk assessment and impact on technology decisions
Source: Rystad Energy research and analysis
11
Sub-supplier vs. supplier
Changed service landscape
Early involvement and effects of integration
Technology qualification
• Qualification vs. leadtime
• Sharing of data
Value chain inefficiencies as obstacle for
technology adoption
Effect of integration on smaller sub-suppliers
Operator internal Operator vs. license
Changed player landscape on the NCS over
the last three years
License dynamics
• Field vs. portfolio value
• Partner investment opportunities
• Partner technology evaluation and risk appetite
Decision criterias in greenfield, brownfield
and drilling applications
Enabling vs enhancing technologies – pull vs. push
Organizational barriers
• KPIs and cross discipline challenges
• Procurement («Terms and conditions»)
• Changed work processes
Supplier vs. operator
Risk assessment
and impact on
technology
decisions
Sub-supplier
vs. supplier

Trend
Effect of integrated contracts
Operators are playing with bigger blocks; integrated suppliers are the new gatekeepers
Source: Interviews; Rystad Energy research and analysis
12
Smaller supplier with new
technology
• Integrated contracts, bigger building blocks
• Sub-supplier cannot deliver directly to operator
• Split contracts, smaller building blocks purchased at a time.
• Possible for smaller supplier with independent delivery
to operator
XTraditional project
delivery setupIntegrated project
delivery setup
Operators are playing with bigger building blocks; smaller suppliers can’t deliver directly to operator and
must go through the integrated service company
New ventures have been key in developing technologies to keep the NCS competitive
Where do they fit now? Who takes the risk?
Sub-supplier
vs. supplier
0
20
40
60
80
100
120
2000 2005 2010 2015 2017
Production wells
Exploration wells
All wells
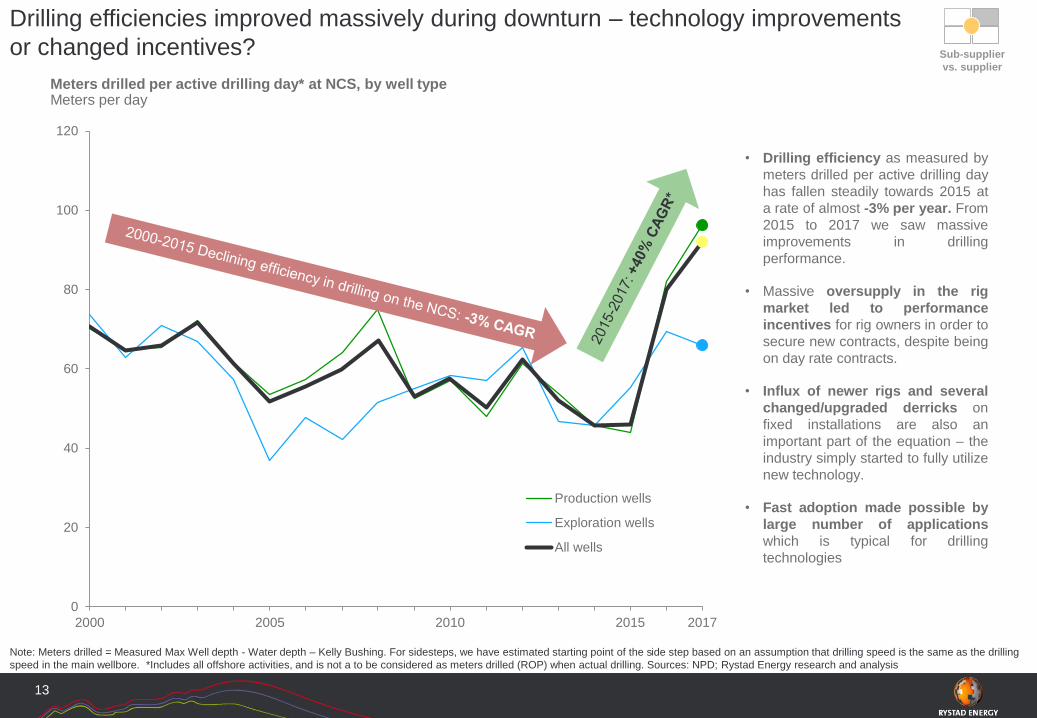
• Drilling efficiency as measured by
meters drilled per active drilling day
has fallen steadily towards 2015 at
a rate of almost -3% per year. From
2015 to 2017 we saw massive
improvements in drilling
performance.
• Massive oversupply in the rig
market led to performance
incentives for rig owners in order to
secure new contracts, despite being
on day rate contracts.
• Influx of newer rigs and several
changed/upgraded derricks on
fixed installations are also an
important part of the equation – the
industry simply started to fully utilize
new technology.
• Fast adoption made possible by
large number of applications
which is typical for drilling
technologies
Drilling efficiencies improved massively during downturn – technology improvements
or changed incentives?
Note: Meters drilled = Measured Max Well depth - Water depth – Kelly Bushing. For sidesteps, we have estimated starting point of the side step based on an assumption that drilling speed is the same as the drilling
speed in the main wellbore. *Includes all offshore activities, and is not a to be considered as meters drilled (ROP) when actual drilling. Sources: NPD; Rystad Energy research and analysis
Meters drilled per active drilling day* at NCS, by well typeMeters per day
13
Sub-supplier
vs. supplier

Four perspectives on risk assessment and impact on technology decisions
Source: Rystad Energy research and analysis
14
Operator internal
Sub-supplier vs. supplier
Changed service landscape
Early involvement and effects of integration
Technology qualification
• Qualification vs. leadtime
• Sharing of data
Value chain inefficiencies as obstacle for
technology adoption
Effect of integration on smaller sub-suppliers
Operator internal Operator vs. license
Changed player landscape on the NCS over
the last three years
License dynamics
• Field vs. portfolio value
• Partner investment opportunities
• Partner technology evaluation and risk appetite
Decision criterias in greenfield, brownfield
and drilling applications
Enabling vs enhancing technologies – pull vs. push
Organizational barriers
• KPIs and cross discipline challenges
• Procurement («Terms and conditions»)
• Changed work processes
Supplier vs. operator
Risk assessment
and impact on
technology
decisions
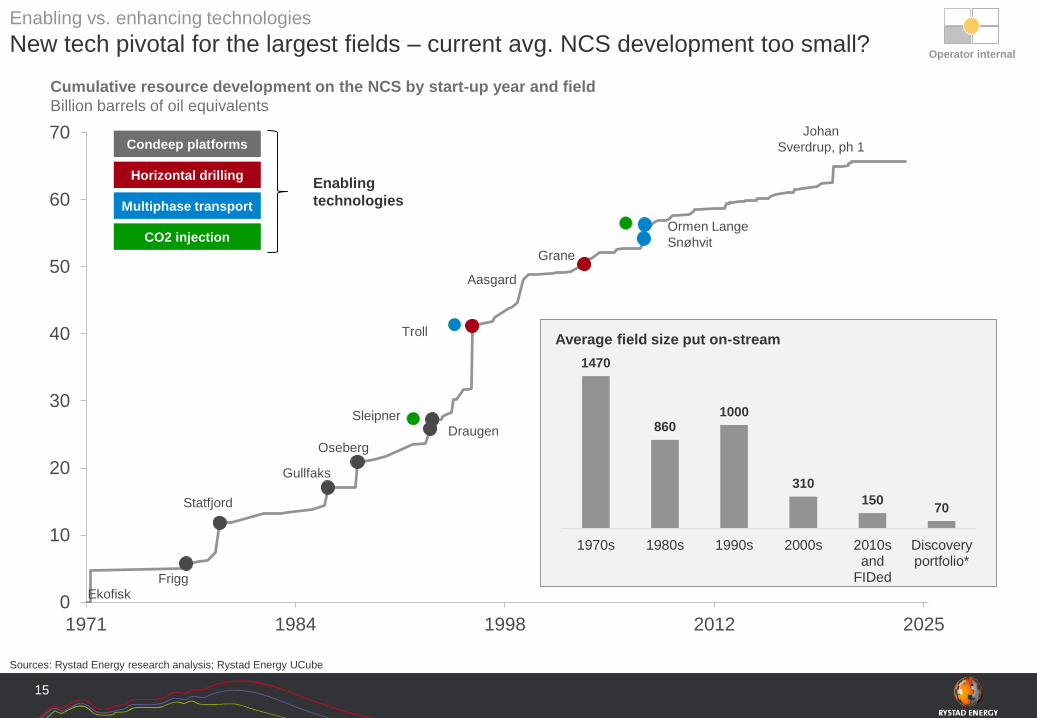
Enabling vs. enhancing technologies
New tech pivotal for the largest fields – current avg. NCS development too small?
Sources: Rystad Energy research analysis; Rystad Energy UCube
Cumulative resource development on the NCS by start-up year and field
Billion barrels of oil equivalents
15
0
10
20
30
40
50
60
70
1971 1984 1998 2012 2025
Troll
Ekofisk
Statfjord
Gullfaks
Oseberg
Ormen Lange
Snøhvit
Johan
Sverdrup, ph 1
Aasgard
Condeep platforms
Horizontal drilling
Multiphase transport
Grane
Frigg
SleipnerDraugen
CO2 injection
1470
8601000
310
15070
1970s 1980s 1990s 2000s 2010sand
FIDed
Discoveryportfolio*
Average field size put on-stream
Operator internal
Enabling
technologies
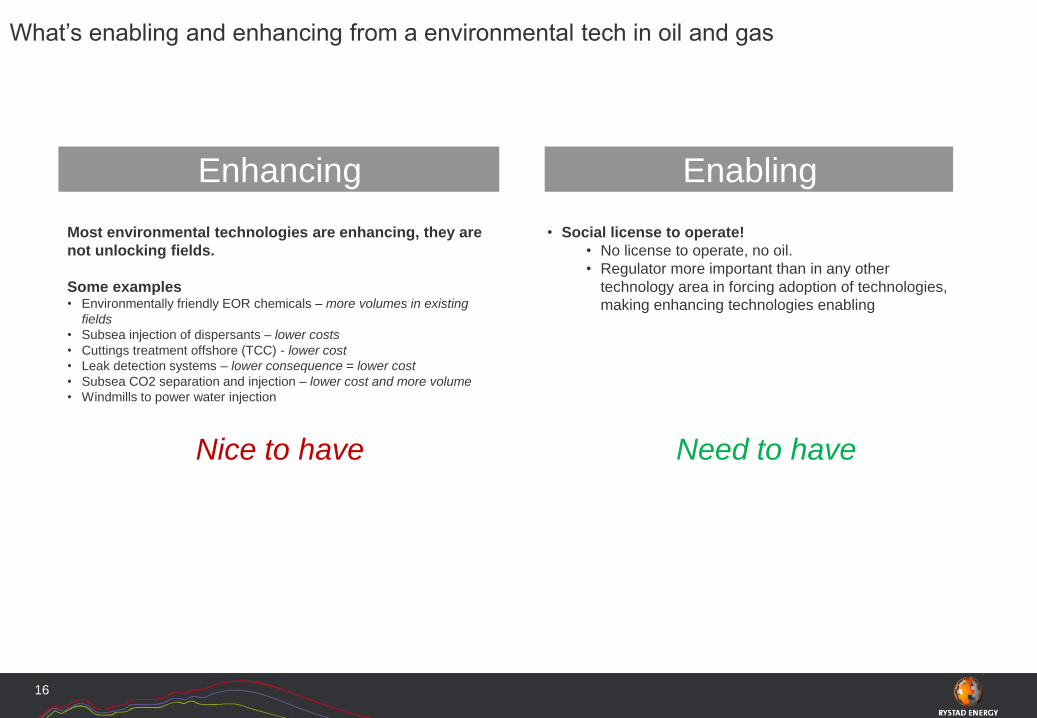
What’s enabling and enhancing from a environmental tech in oil and gas
16
EnablingEnhancing
• Social license to operate!
• No license to operate, no oil.
• Regulator more important than in any other
technology area in forcing adoption of technologies,
making enhancing technologies enabling
Most environmental technologies are enhancing, they are
not unlocking fields.
Some examples• Environmentally friendly EOR chemicals – more volumes in existing
fields
• Subsea injection of dispersants – lower costs
• Cuttings treatment offshore (TCC) - lower cost
• Leak detection systems – lower consequence = lower cost
• Subsea CO2 separation and injection – lower cost and more volume
• Windmills to power water injection
Need to haveNice to have

Water
diversion
Forces within the
organization Driving mechanism
Example
technologies Assessment
Enabling
technologies
Easy technology
decision –
positive forces
from all parts of
organization
Enhancing
technologiesDifficult to find
project or asset
to undertake first
use
Enabling vs. enhancing technologies
Most example technologies are enhancing – need to be pushed through the system
Source: Rystad Energy research and analysis
17
Field
Technology Field
Technology
Well
Field
R&D / Eng.
Procurement
Mgmt
Project
P U L L
P U S H
Field
Field
FieldField
Well
WellProcurement
Project /
Asset
R&D / Eng.
Mgmt
Electrification
from onshore
grid
Robotic drill
floor
PWC P&A
CO2 EOR &
storage
All electric
subsea
Unmanned
facilities /
Automation
Subsea
boosting
Subsea
boosting
(Wisting)
Radical new
EOR
solutions
Technology technically enables field
(i.e. horizontal drilling on Troll Oil or EH PiP on Fenja)
Unmanned
facilities /
Automation
Organization has evaluated positive effects and
pushes for technology adoption
?
Operator internal
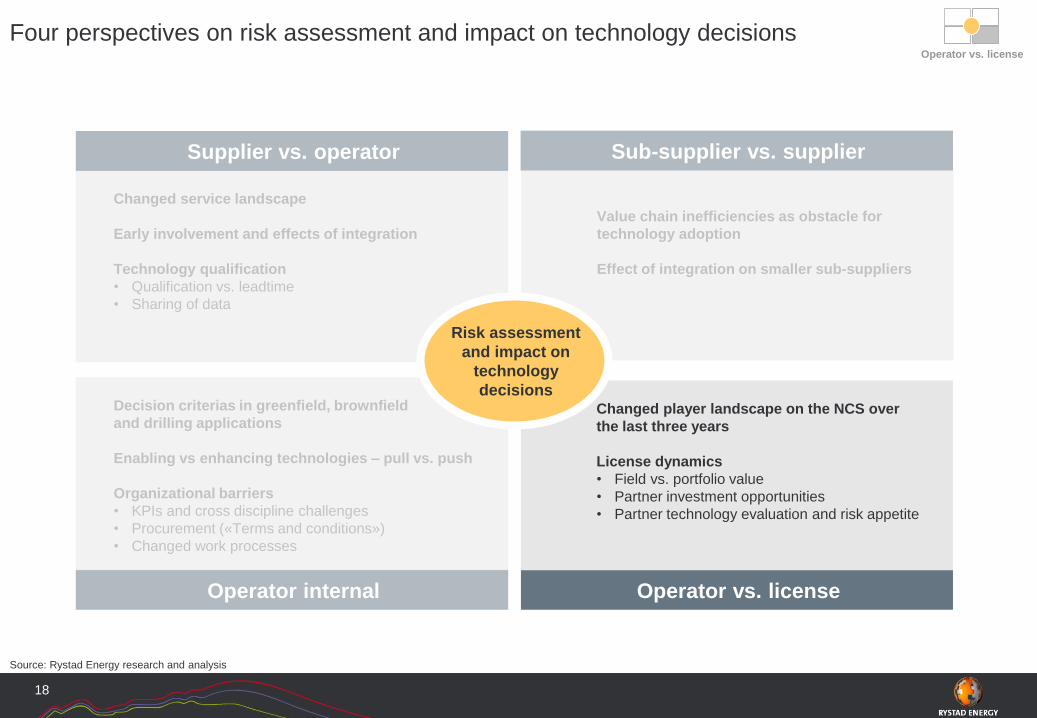
Four perspectives on risk assessment and impact on technology decisions
Source: Rystad Energy research and analysis
18
Sub-supplier vs. supplier
Changed service landscape
Early involvement and effects of integration
Technology qualification
• Qualification vs. leadtime
• Sharing of data
Value chain inefficiencies as obstacle for
technology adoption
Effect of integration on smaller sub-suppliers
Operator internal Operator vs. license
Changed player landscape on the NCS over
the last three years
License dynamics
• Field vs. portfolio value
• Partner investment opportunities
• Partner technology evaluation and risk appetite
Decision criterias in greenfield, brownfield
and drilling applications
Enabling vs enhancing technologies – pull vs. push
Organizational barriers
• KPIs and cross discipline challenges
• Procurement («Terms and conditions»)
• Changed work processes
Supplier vs. operator
Risk assessment
and impact on
technology
decisions
Operator vs. license

License dynamics
Visualizing the license: Operator positive to technology due to high portfolio value
Source: Interviews; Rystad Energy research and analysis
Risk – value matrix
19
Pe
rce
ive
d r
isk
Hig
hL
ow
Low High
Potential value
Portfolio evaluation
Higher value due to application on
multiple fields with economies of scale.
Lower perceived risk with multiple fields
to share the first use risk. Reduced risk
for subsequent applications.
Acceptable risk compared to value
Op.
Op
Operator vs. license
Single use evaluation
First time use on field, high
perceived risk. Positive risk
neutral value.
Too high risk vs. value

License dynamics
Visualizing the license: Portfolio differences and risk assessment key differentiators
Source: Interviews; Rystad Energy research and analysis
Risk – value matrix
20
Pe
rce
ive
d r
isk
Hig
hL
ow
Low High
Potential value
Op
Operator vs. license
A
C
D
Partner archetype B
Same evaluation as operator on
field level, but has no portfolio to
apply technology on or sees no
effect in own portfolio by applying
technology as a license partner
B
Partner archetype A
Typically license partner /
smaller companies with limited
field portfolio. Perceived risk
premium due to limited
understanding of technology.
Risk premium on
assessed risk by
operator
Partner archetype C
Sees additional value in own portfolio, but has
the same risk perception as single use
application. Risk is not reduced for partner C’s
portfolio due to either:
- Limited learning in own organization from
application of technology
- Inefficient sharing of data with operator
Partner archetype D
Sees significant portfolio value,
based on own experience / failure
data (non-anonymized) have
lower risk perception than
operator.
Operator
(portfolio evaluation)
Higher value due to application
on multiple fields with
economies of scale. Lower
perceived risk with multiple
fields to share the first time.
Reduced risk for subsequent
applications.
X
X
X
X
Positive decision
Negative decision

Key take-aways from the four perspectives
Source: Rystad Energy research and analysis
21
Sub-supplier vs. supplier
• Early involvement has positive impact on the use of new
technologies and innovative concepts, but could limit the set
of potential technologies for application.
• Technology must find a license for last qualification steps,
but the license may not have sufficient time for qualification
without affecting lead time.
• Technology pipeline management challenging for suppliers
with respect to field use cases and timing
• Limited data sharing results in requalification and
negative technology decisions
• Sub-suppliers are a key contributor to technology
development on the NCS and globally
• Value chain inefficiencies, like day-rate models, hinder
adoption of new technologies from smaller sub-suppliers
• Although integrated set-ups create one more gatekeeper for
the sub-suppliers, it may resolve some but not all value chain
inefficiencies
Operator internal Operator vs. license
• Technology adoption may stop in licenses due to differences
in perceived value and risk
• License partners do not get the same portfolio effect as
operators in applying the technology for the first time, partly
due to inefficient sharing of data
• The operator is often late in bringing technology decisions to
the license – can result in conservative decisions
• Mostly benefits from the changed NCS player landscape
• Decision holders are not incentivized to be first movers on
new technologies, particularly for enhancing technologies
• Technologies that are cross discipline tend to amplify
“first mover disadvantage”
• Procurement is cost-optimized rather than value-
optimized – terms and conditions do not favor suppliers to
take on technology risk
• Change of work process needed to fully realize value
from new technologies
Supplier vs. operator
Risk assessment
and impact on
technology
decisions