risk assessment mitigation phase risk mitigation plan … · risk assessment mitigation phase risk...
TRANSCRIPT
310286
Risk Assessment Mitigation Phase
Risk Mitigation Plan
Fail to Blackstart (Chapter SDG&E-6)
November 30, 2016
Page SDGE 6-i 310286
TABLE OF CONTENTS
1 Purpose........................................................................................................................................... 2
2 Background ................................................................................................................................... 3
3 Risk Information ........................................................................................................................... 4
3.1 Risk Classification ............................................................................................................. 5
3.2 Potential Drivers ............................................................................................................... 5
3.3 Potential Consequences .................................................................................................... 7
3.4 Risk Bow Tie ...................................................................................................................... 7
4 Risk Score ...................................................................................................................................... 8
4.1 Risk Scenario – Reasonable Worst Case ........................................................................ 8
4.2 2015 Risk Assessment ....................................................................................................... 9
4.3 Explanation of Health, Safety, and Environmental Score ............................................ 9
4.4 Explanation of Other Impact Scores ............................................................................. 10
4.5 Explanation of Frequency Score ................................................................................... 11
5 Baseline Risk Mitigation Plan .................................................................................................... 11
6 Proposed Risk Mitigation Plan .................................................................................................. 12
7 Summary of Mitigations ............................................................................................................. 14
8 Risk Spend Efficiency ................................................................................................................. 20
8.1 General Overview of Risk Spend Efficiency Methodology ......................................... 20
8.1.1 Calculating Risk Reduction ............................................................................... 20
8.1.2 Calculating Risk Spend Efficiency .................................................................... 21
8.2 Risk Spend Efficiency Applied to This Risk ................................................................. 21
8.3 Risk Spend Efficiency Results........................................................................................ 24
9 Alternatives Analysis .................................................................................................................. 25
9.1 Alternative 1 – Modernization of Grid Control Centers ............................................. 25
9.2 Alternative 2 – Substation backup power ..................................................................... 26
Page SDGE 6-ii 310286
Figure 1: Risk Bow Tie ............................................................................................................................... 8
Figure 2: Formula for Calculating RSE ................................................................................................... 21
Figure 3: Risk Spend Efficiency ................................................................................................................ 25
Table 1: Risk Classification per Taxonomy ................................................................................................ 5
Table 2: Operational Risk Drivers ............................................................................................................. 6
Table 3: Risk Score ..................................................................................................................................... 9
Table 4: Baseline Risk Mitigation Plan .................................................................................................... 15
Table 5: Proposed Risk Mitigation Plan .................................................................................................. 17

Page SDGE 6-1 310286
Executive Summary
The Fail to Blackstart risk is the inability to restore electric services to customers in the SDG&E service territory following a disturbance or an event in which the SDG&E service territory suffers a complete blackout or shut down condition. An essential part of having the ability to restore electric services from a blackout is to have access to adequate Blackstart facilities and Cranking Paths1 when restoration from an interconnection with a neighboring utility is not an available option.
SDG&E’s 2015 risk mitigation plan includes two controls: (1) Maintenance, certification, and testing of existing Blackstart facilities, and (2) Annual Blackstart plan review and training. These controls focus on safety-related impacts (i.e., Health, Safety, and Environment) per guidance provided by the Commission in Decision16-08-018 as well as controls and mitigations that may address reliability.
The 2015 baseline mitigations will continue to be performed in the proposed plan to, in most cases, maintain the current residual risk level. SDG&E’s proposed risk mitigation plan includes the addition of Blackstart facilities, the modernization of SDG&E control centers, and enhancements to substation backup power.
A risk spend efficiency was developed for Fail to Blackstart. The risk spend efficiency is a new tool that was developed to attempt to quantify how the proposed mitigations will incrementally reduce risk. The following is the ranking of the mitigation groupings from the highest to the lowest efficiency, as indicated by the RSE number:
1. Maintenance, certification, testing, and training (current controls) 2. The South Grid Black Start Project (incremental mitigations) 3. Substation backup power enhancements (fuel cells) (incremental mitigations) 4. Modernization of Grid Control Centers (incremental mitigations)
1 A portion of the electric system that can be isolated and then energized to deliver electric power from a generation source to enable the startup of one or more other generating units. Source: North American Electric Reliability Corporation, Glossary of Terms Used in Reliability Standards (http://www.eia.gov/electricity/data/eia411/nerc_glossary_2009.pdf).

Page SDGE 6-2 310286
Risk: Fail to Blackstart
1 Purpose
The purpose of this chapter is to present the mitigation plan of San Diego Gas & Electric Company (SDG&E or Company) for the risk of Fail to Blackstart. A Fail to Blackstart is the inability to restore electric services to customers in the SDG&E service territory following a disturbance or an event in which the SDG&E service territory suffers a complete blackout or shut down condition. An essential part of having the ability to restore electric services from a blackout is to have access to adequate Blackstart facilities and Cranking Paths2 when restoration from an interconnection with a neighboring utility is not an available option.
To more fully understand the nature of risk, one must recognize the distinction between an isolated blackout and a complete system blackout. An isolated blackout is the loss of the electrical service in neighborhoods or regions of the SDG&E territory while the electric grid, overall, continues to operate. A complete system blackout happens when the entire SDG&E electric power grid has been de-energized as a result of a disturbance or unforeseen event. Fail to Blackstart relates to the latter situation when there is an assumption that restoration through an interconnection with a neighboring utility is not available; that the only viable restoration option is through a generation Blackstart Resource instead of using an interconnection.
Blackstart facilities are small generators that have the ability to start without support from the external electric transmission system. Those units are used during blackouts to energize designated transmission lines and larger generators which, in turn, are used to restore loads, maintain frequency and voltages, until the isolated system reestablishes connections with neighboring transmission systems. The designated transmission lines used to route power from the Blackstart facilities to the larger generators is called the Cranking Path.
This risk is a product of SDG&E’s September 2015 annual risk registry assessment cycle. Any events that occurred after that time were not considered in determining the 2015 risk assessment, in preparation for this Report. Note that while 2015 is used a base year for mitigation planning, risk management has been occurring, successfully, for many years within the Company. SDG&E and Southern California Gas Company (SoCalGas) (collectively, the utilities) take compliance and managing risks seriously, as can be seen by the number of actions taken to mitigate each risk. This is the first time, however, that the utilities have presented a Risk Assessment Mitigation Phase (RAMP) Report, so it is important to consider the data presented in this plan in that context. The baseline mitigations are determined based
2 A portion of the electric system that can be isolated and then energized to deliver electric power from a generation source to enable the startup of one or more other generating units. Source: North American Electric Reliability Corporation, Glossary of Terms Used in Reliability Standards. (http://www.eia.gov/electricity/data/eia411/nerc_glossary_2009.pdf).
Page SDGE 6-3 310286
on the relative expenditures during 2015; however, the utilities do not currently track expenditures in this way, so the baseline amounts are the best effort of each utility to benchmark both capital and operations and maintenance (O&M) costs during that year. The level of precision in process and outcomes is expected to evolve through work with the California Public Utilities Commission (Commission or CPUC) and other stakeholders over the next several General Rate Case (GRC) cycles. The Commission has ordered that RAMP be focused on safety related risks and mitigating those risks.3 Mitigations considered in this chapter improve and maintain safety by reducing the duration of system wide blackouts. In many risks, safety and reliability are inherently related and cannot be separated, and the mitigations reflect that fact. Compliance with laws and regulations is also inherently tied to safety and the utilities take those activities very seriously. In all cases, the 2015 baseline mitigations include activities and amounts necessary to comply with the laws in place at that time. Laws rapidly evolve, however, so the RAMP baseline has not taken into account any new laws that have been passed since September 2015. Some proposed mitigations, however, do take into account those new laws.
The purpose of RAMP is not to request funding. Any funding requests will be made in the GRC. The forecasts for mitigation are not for funding purposes, but are rather to provide a range for the future GRC filing. This range will be refined with supporting testimony in the GRC. Although some risks have overlapping costs, the utilities have made efforts to identify those costs.
The mitigation activities and risk scores presented in this chapter captures what was known in 2015. These activities presented herein help mitigate the risk Fail to Blackstart, but may not be performed solely for that purpose. Nonetheless, these mitigations are presented in this chapter and the entire cost of the activity is included. It should be noted that a large portion of this risk is under the jurisdiction of the Federal Energy Regulatory Commission (FERC). SDG&E has included FERC jurisdictional mitigations to demonstrate the completeness of its mitigation plan. However, these costs are for demonstration in the RAMP only and will not be addressed or requested in the Test Year 2019 GRC. Mitigations related to the maintenance of existing transmission infrastructures, such as the Cranking Paths, although important for preventing a failure to blackstart, are not covered in this chapter because they are already included in the Electric Infrastructure Integrity risk chapter within this Report.
2 Background
On September 8, 2011, SDG&E experienced a total system blackout during the Pacific Southwest Blackout. Both major interconnections to the SDG&E system remained energized at the Southern California Edison and Arizona Public Service facilities. This allowed for the preferred method of restoration using the Interconnection. SDG&E Blackstart facilities were not used to restart the SDG&E system4. However, in different circumstances, when adjacent systems are also blacked out and the
3 Commission Decision (D.) 14-12-025 at p. 31. 4 SDG&E’s Blackstart resource at its Miramar facility was operated in case it was needed.
Page SDGE 6-4 310286
SDG&E system must be re-energized internally, then the need for a Blackstart facility as well as its Cranking Path becomes extremely critical.
In 2015, several Blackstart facilities were available. The legacy units originally owned by SDG&E, but divested in the late 1990s to NRG, have blackstart capability that allows a V8 reciprocating engine to start every other Cabrillo II peaking generator (4 V8 units at Kearny, 1 V8 unit at Miramar)5. SDG&E currently has two Blackstart facilities. The first, owned and maintained by SDG&E, is located at the Miramar Energy Facility (MEF) where a gas-fired reciprocating engine generator has the ability to start either of the MEF gas turbines. The other is located at the Orange Grove Energy facility at the Pala substation. A Power Purchase Agreement (PPA) between SDG&E and Orange Grove requires a reciprocating engine generator to start either of the Pala gas turbine units to serve as Blackstart facilities. Both Blackstart facilities are reciprocating engines that will start co-located combustion (gas) turbine generators, which would then start the large Palomar Energy Center (PEC) generators required to restore the SDG&E system.
A failure to be able to restore the SDG&E system would have costly impacts. For example, a lack of ability to restore electric service not only has the obvious impacts of endangering life and property, but access to water and sewage services may be impaired as well. The presence of many military installations in the San Diego area also underscores the importance of being able to restore the power system in the event of a major blackout. Furthermore, portions of neighboring systems that are also blacked out could need help from the SDG&E system to speed up their restoration process.
3 Risk Information
As stated in the testimony of Jorge M. DaSilva in the Safety Model Assessment Proceeding (S-MAP) Application (A.) 15-05-002, “SDG&E is moving towards a more structured approach to classifying risks and mitigations through the development of its new risk taxonomy. The purpose of the risk taxonomy is to define a rational, logical and common framework that can be used to understand analyze and categorize risks.”6 The Enterprise Risk Management (ERM) process and lexicon that SDG&E has put in place was built on the internationally-accepted IS0 31000 risk management standard. In the application and evolution of this process, the Company is committed to increasing the use of quantification within
5 These units were contracted to the California Department of Water Resources through 2011. All attributes, including blackstart, was considered to be under contract. The CAISO did not separately contract for blackstart. SDG&E does not consider the Kearny units a Blackstart Resource because the units do not currently qualify under NERC Standard EOP-005-2 R13. After 2011, various contractual obligations existed between Cabrillo II and SDG&E or the CAISO. Three of the five units will retire at the end of 2016, with the other two expected to retire after 2017. 6 A.15-05-002, filed May 1, 2015, at p. JMD-7.
Page SDGE 6-5 310286
its evaluation and prioritization of risks.7 This includes identifying leading indicators of risk. Sections 3 – 9 of this plan describe the key outputs of the ERM process and resultant risk mitigations.
In accordance with the ERM process, this section describes the risk classification, possible drivers and potential consequences of the Fail to Blackstart risk.
3.1 Risk Classification
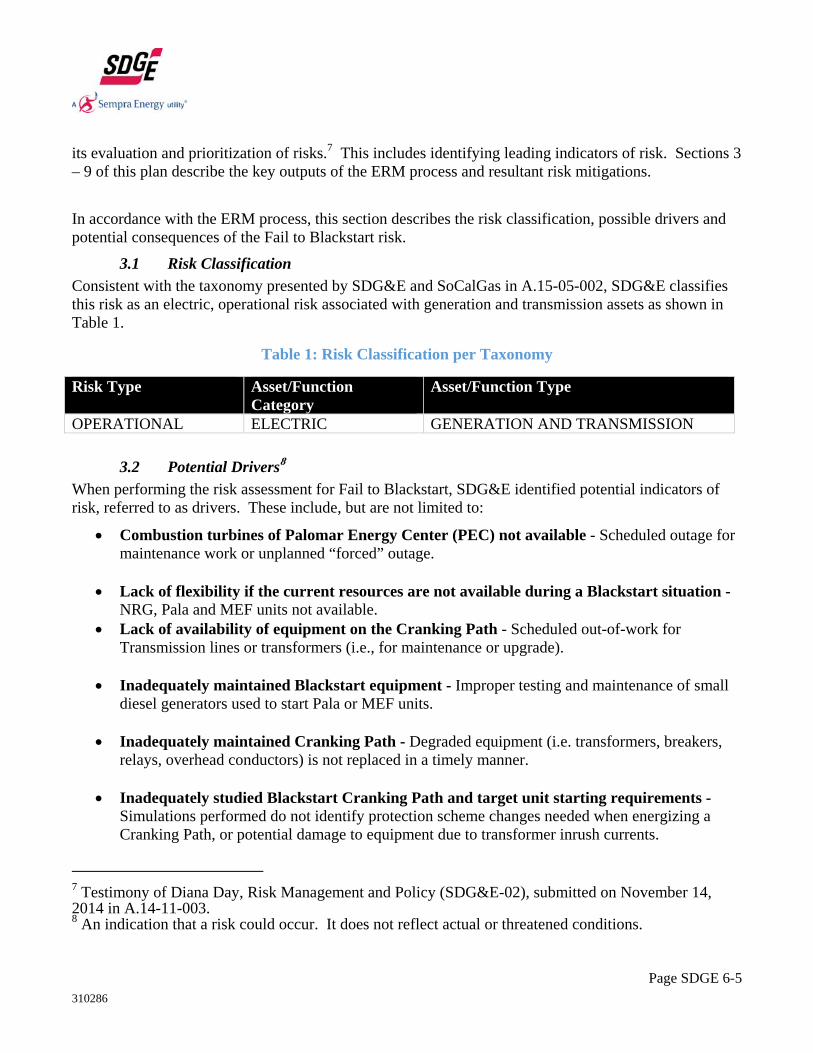
Consistent with the taxonomy presented by SDG&E and SoCalGas in A.15-05-002, SDG&E classifies this risk as an electric, operational risk associated with generation and transmission assets as shown in Table 1.
Table 1: Risk Classification per Taxonomy
Risk Type Asset/Function Category
Asset/Function Type
OPERATIONAL ELECTRIC GENERATION AND TRANSMISSION
3.2 Potential Drivers8
When performing the risk assessment for Fail to Blackstart, SDG&E identified potential indicators of risk, referred to as drivers. These include, but are not limited to:
Combustion turbines of Palomar Energy Center (PEC) not available - Scheduled outage for maintenance work or unplanned “forced” outage.
Lack of flexibility if the current resources are not available during a Blackstart situation - NRG, Pala and MEF units not available.
Lack of availability of equipment on the Cranking Path - Scheduled out-of-work for Transmission lines or transformers (i.e., for maintenance or upgrade).
Inadequately maintained Blackstart equipment - Improper testing and maintenance of small diesel generators used to start Pala or MEF units.
Inadequately maintained Cranking Path - Degraded equipment (i.e. transformers, breakers, relays, overhead conductors) is not replaced in a timely manner.
Inadequately studied Blackstart Cranking Path and target unit starting requirements - Simulations performed do not identify protection scheme changes needed when energizing a Cranking Path, or potential damage to equipment due to transformer inrush currents.
7 Testimony of Diana Day, Risk Management and Policy (SDG&E-02), submitted on November 14, 2014 in A.14-11-003. 8 An indication that a risk could occur. It does not reflect actual or threatened conditions.

Page SDGE 6-6 310286
Inadequate Blackstart training - Blackstart drills do not provide operators the opportunity to
acquire hands-on experience on how to restore the transmission system; or, drills are not performed at a frequency so that operators knowhow to restore the transmission system.
Human error - Unintentional faults due to human mistakes.
Force of Nature Events and Acts of Terror - Unforeseen weather events, fires, sabotage, or earthquake (particularly if occur in the northern portion of the system) isolate the PEC unit or render the cranking paths inoperable.
Table 2 maps the specific drivers of Fail to Blackstart to SDG&E’s risk taxonomy.
Table 2: Operational Risk Drivers
Driver Category Fail to Blackstart Driver(s)
Asset Failure
Combustion turbines of Palomar Energy Center (PEC) not available Lack of flexibility if one of the current resources is not available
during a Blackstart situation Lack of availability of equipment on the Cranking Path Inadequately maintained Blackstart equipment Inadequately maintained Cranking Path
Asset-Related Information Technology Failure
Not applicable
Employee Incident
Inadequately studied Blackstart Cranking Path and target unit starting requirements
Inadequate Blackstart training Human error
Contractor Incident Not applicable
Public Incident Not applicable
Force of Nature Force of nature events and acts of terror
Subject matter experts from SDG&E Electric Grid Operations determined the risk drives using historical data of restoration issues encountered during past Blackouts around the world:
New York State Department of Public Service review of the August 2003 Northeast Blackout shows that only one of the designated Blackstart generators was ready and able to start. Two other Blackstart generator locations failed to start until start-up power was provided to them from
Page SDGE 6-7 310286
the transmission grid. This prevented several larger generators in New York City to come online during the early hours of the Blackout that could have hastened the overall restoration process and minimized the impact of the blackout9. Furthermore, analysis of the conversations between transmission and generation operators during the event showed a lot of confusion as to what had happened and the exact status of the transmission and generation facilities, resulting in restoration decisions being delayed. Finally, the synchronization of a small part of the electric system in the Gilboa area to the rest of grid was delayed due to the inability to close a 345 kV transmission line. It was later determined by the New York Power Authority (NYPA) that the line could not be closed due to an erratically operating switch yard synchroscope, until an operator was able to switch over to a backup synchroscope.
EURELECTRIC’s investigation of the blackout that affected Sweden and Denmark on September 23, 2003, found that restoration in Denmark was slower than in Sweden, because the Blackstart facilities in the central power plants in Zeeland failed to operate. Similar issues were also found during a blackout in Italy on September 28, 2003.
3.3 Potential Consequences
If one of the risk drivers listed above were to occur, resulting in an incident, the potential consequences, in a reasonable worst case scenario, could include:
Serious injuries or fatalities; Prolonged delays to restart SDG&E’s system after a complete system-wide blackout; Exposure to compliance violations and penalties; and Adverse litigation and resulting financial impacts.
These potential consequences were used in the scoring of the Fail to Blackstart risk that occurred during the SDG&E’s 2015 risk registry process. See Section 4 for more detail.
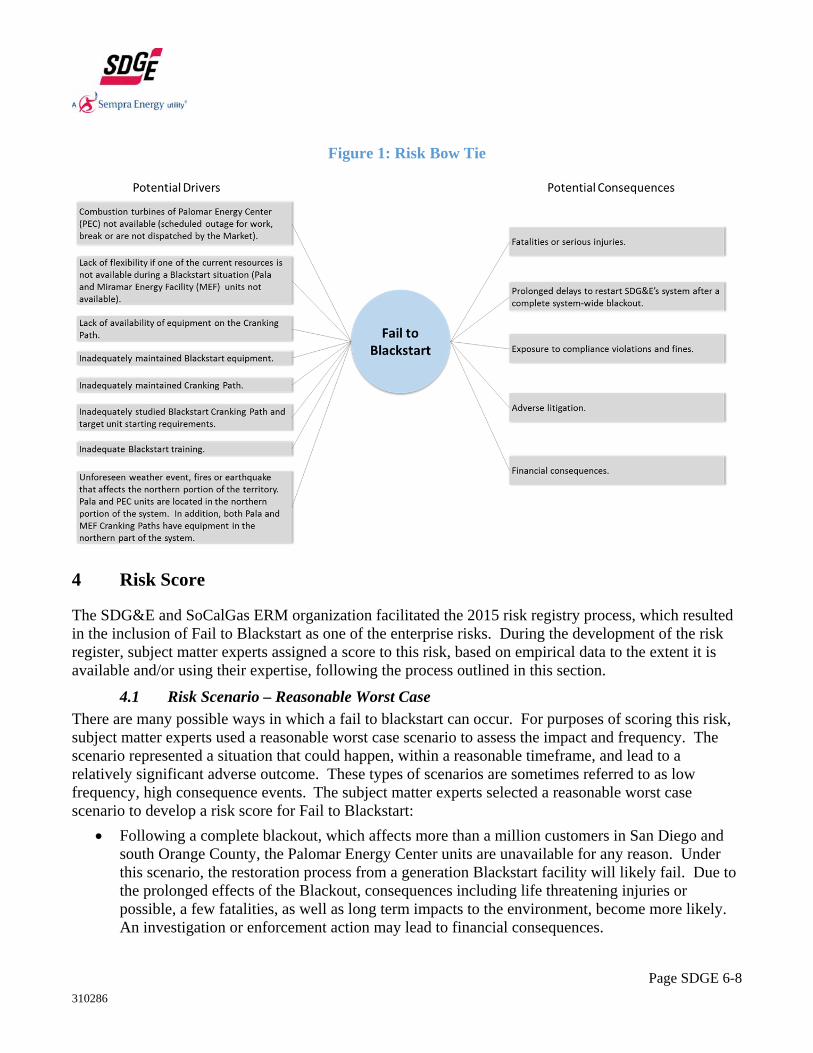
3.4 Risk Bow Tie
The risk “bow tie,” shown in Figure 1, is a commonly-used tool for risk analysis. The left side of the bow tie illustrates potential drivers that lead to a risk event and the right side shows the potential consequences of a risk event. SDG&E applied this framework to identify and summarize the information provided above.
9 New York State Department of Public Service, Second Report on the August 14, 2003 Blackout.
Page SDGE 6-8 310286
Figure 1: Risk Bow Tie
4 Risk Score
The SDG&E and SoCalGas ERM organization facilitated the 2015 risk registry process, which resulted in the inclusion of Fail to Blackstart as one of the enterprise risks. During the development of the risk register, subject matter experts assigned a score to this risk, based on empirical data to the extent it is available and/or using their expertise, following the process outlined in this section.
4.1 Risk Scenario – Reasonable Worst Case
There are many possible ways in which a fail to blackstart can occur. For purposes of scoring this risk, subject matter experts used a reasonable worst case scenario to assess the impact and frequency. The scenario represented a situation that could happen, within a reasonable timeframe, and lead to a relatively significant adverse outcome. These types of scenarios are sometimes referred to as low frequency, high consequence events. The subject matter experts selected a reasonable worst case scenario to develop a risk score for Fail to Blackstart:
Following a complete blackout, which affects more than a million customers in San Diego and south Orange County, the Palomar Energy Center units are unavailable for any reason. Under this scenario, the restoration process from a generation Blackstart facility will likely fail. Due to the prolonged effects of the Blackout, consequences including life threatening injuries or possible, a few fatalities, as well as long term impacts to the environment, become more likely. An investigation or enforcement action may lead to financial consequences.

Page SDGE 6-9 310286
Note that the following narrative and scores are based on this scenario; they do not address all consequences that can happen if the risk occurs.
4.2 2015 Risk Assessment
Using this scenario, subject matter experts then evaluated the frequency of occurrence and potential impact of the risk using SDG&E’s 7X7 Risk Evaluation Framework (REF). The framework (also called a matrix) includes criteria to assess levels of impact ranging from Insignificant to Catastrophic and levels of frequency ranging from Remote to Common. The 7X7 framework includes one or more criteria to distinguish one level from another. The Commission adopted the REF as a valid method to assess risks for purposes of this RAMP.10 Using the levels defined in the REF, the subject matter experts, applied empirical data to the extent it is available and/or their expertise to determine a score for each of four residual impact areas and the frequency of occurrence of the risk.
Table 3 provides a summary of the Fail to Blackstart risk score in 2015. This risk has a score of 4 or above in the Health, Safety, and Environmental impact area and, therefore, was included in the RAMP. These are residual scores because they reflect the risk remaining after existing controls are in place. For additional information regarding the REF, please refer to the RAMP Risk Management Framework chapter within this Report.
Table 3: Risk Score
Residual Impact Residual Frequency
Residual Risk Score
Health, Safety, Environmental
(40%)
Operational & Reliability
(20%)
Regulatory, Legal,
Compliance (20%)
Financial
(20%) 6 7 5 5 2 44,548
4.3 Explanation of Health, Safety, and Environmental Score
SDG&E scored this risk a 6 (severe) in the Health, Safety, and Environmental impact area due to its potential to result in a few fatalities or life-threatening injuries to employees or the public. This is reasonable because failing to restore the electric system from a system-wide blackout essentially means prolonging all the negative effects of a blackout. For example, during the Northeast Blackout of August 2003, many New York City beaches remained closed after several millions of gallons of raw sewage overflowed into the waters around the city, sending bacteria counts soaring. Back-up generators at two sewage treatment plants failed, emptying waste into the Hudson River and into New York harbor. City officials reported a spike in emergency room treatments for diarrheal illnesses, presumably caused by
10 D.16-08-018 Ordering Paragraph 9.

Page SDGE 6-10 310286
eating spoiled food.11 Fires caused by burning candles were reported across the city. Some of the deaths reported that day were attributed to carbon monoxide poisoning caused by fires or malfunction of home generators. Similar deaths were also reported during the 2012 Superstorm Sandy that caused extensive power outages in the New Jersey area.12 New research suggests that more deaths and injuries can be attributed to a blackout if accidents, cardiovascular conditions, respiratory problems, home medical device failures, and various other health conditions are considered.13
4.4 Explanation of Other Impact Scores
Based on the selected reasonable worst case risk scenario, SDG&E subject matter experts assigned the following scores to the remaining residual risk impact categories.
Operational and Reliability: A 7 (catastrophic) was given to this impact, drawing on Company experience in the September 8, 2011, Pacific Southwest Blackout. A similar system-wide blackout, could affect SDG&E’s the 3.6 million electric customers. Failing to restore the system could leave all those customers without power for prolonged periods of time. The ability to quickly restore electric power to those millions of customers in a safe and reliable manner becomes critical in order to minimize the impacts of a blackout. Substation equipment and control centers, needed to restore the system, depend on backup power and batteries. Failing to restore the system before substation batteries run out would prevent conditions that would further exacerbate the restoration process.
Regulatory, Legal, and Compliance: A 5 (extensive) was given to this impact. Often, blackouts and failure to blackstart causes can be traced back to weak implementations of some of the North American Electric Reliability Corporation (NERC) standards by a utility company, an Independent System Operator (ISO), or a Reliability Coordinator (RC). For example, during the Pacific Southwest blackout, it was found that some of the entities involved violated one or more reliability standards. The alleged compliance violations resulted in penalties.14
Financial: Financial consequences to the Company and the public resulting from a blackout will be worse if the restoration process takes too long. In addition to potential direct losses of sales revenue by a utility company during a blackout, indirect losses to local businesses (e.g., restaurants, grocery stores) and households, which may be forced to discard quantities of spoiled food, can be significant. Business continuity of manufacturing plants and commercial businesses
11 Shao Lin, Barbara A. Fletcher, Ming Luo, et al. “Health Impact in New York City During the Northeastern Blackout of 2003”, Public Health Reports, 2011 May-Jun, http://www.publichealthreports.org/issueopen.cfm?articleID=2629 12 Centers for Disease Control and Prevention, “Deaths Associated with Hurricane Sandy – October –November 2012”, https://www.cdc.gov/mmwr/preview/mmwrhtml/mm6220a1.htm. SDG&E was not penalized. 13 G. Brooke Anderson and Michelle L. Bell, “Lights out: Impact of the August 2003 power outage on mortality in New York”, Public Health Reports, Epidemiology. 2012 Mar; http://www.ncbi.nlm.nih.gov/pmc/articles/PMC3276729/#R25. 14 Federal Energy Regulatory Commission, “FERC Approves Final Settlement in 2011 Southwest Blackout Case”, May 26,2015, Docket No IN14-11-000, http://www.ferc.gov/media/news-releases/2015/2015-2/05-26-15.asp#.V5aaIPkrJhE.

Page SDGE 6-11 310286
also may be impaired during a long lasting blackout. Furthermore, a blackout can cause data loss or corruption and damage to assets such as computers and plant equipment. Lastly, possible lawsuits by individuals or businesses, coupled with regulatory penalties, may also negatively affect the Company.15 Considering these inputs, SMEs scoring this risk a 5 (extensive) in the financial impact category.
4.5 Explanation of Frequency Score
The frequency of failing to restore the SDG&E System depends on the frequency of occurrence of a regional blackout. During the Pacific Southwest Blackout, which is the only system-wide blackout that has affected SDG&E, power was restored using the Interconnection. This essentially means that SDG&E did not need to use its Blackstart facilities to restore its system. Analysis of other utilities shows that despite preparation and testing, failing to restore a system using Blackstart facilities is common due to unforeseen problems that cannot be identified in studies and simulations. They only can be identified during an actual Blackout situation. The SDG&E power grid is such that part of its system cannot be shutdown to comprehensively test Blackstart facilities, along with their Cranking Paths, without affecting customers. Accordingly, SDG&E scored this risk a 2 (rare), defined by the 7X7 matrix as an event that occurs once every 30-100 years. This score ties directly to the Blackout risk frequency score because in order to fail to blackstart the SDG&E system, a regional blackout will first need to occur.
5 Baseline Risk Mitigation Plan16
As stated above, a Fail to Blackstart risk is the inability to restore electric services to customers in the SDG&E service territory following a disturbance or an event in which the SDG&E service territory suffers a complete blackout or shut down condition. The 2015 baseline mitigations discussed below include the current evolution of the utilities’ risk management of this risk. The baseline mitigations have been developed over many years to address this risk. They include the amount to comply with laws that were in effect at that time. SDG&E’s 2015 risk mitigation plan includes two controls: (1) Maintenance, certification, and testing of existing Blackstart facilities, and (2) Annual Blackstart plan review and training. Subject matter experts from Electric Grid Operations, which is part of the Electric Transmission and System Engineering department, collaborated to identify and document them.
15 E. Mills and R. Jones, “An Insurance Perspective on U.S. Electric Grid Disruption Costs”, Electricity Markets and Policy Group, Geneva Papers on Risk and Insurance Issues and Practice, Feb 2016; https://emp.lbl.gov/sites/all/files/lbnl-1004466.pdf. 16 As of 2015, which is the base year for purposes of this Report.
Page SDGE 6-12 310286
These controls focus on safety-related impacts17 (i.e., Health, Safety, and Environment) per guidance provided by the Commission in D.16-08-01818 as well as controls and mitigations that may address reliability.19 Accordingly, the controls and mitigations described in Sections 5 and 6 address safety-related impacts primarily. Note that the controls and mitigations in the baseline and proposed plans are intended to address various Fail to Blackstart events, not just the scenario used for purposes of risk scoring.
1. Maintenance, certification, and testing of existing Blackstart facilities
NERC standard EOP-005-2 mandates Transmission Operators to have Blackstart facilities that are tested at least once every three years. The MEF units are owned and maintained by SDG&E, while the Pala units are maintained by Orange Grove through the PPA agreement they have with SDG&E. The continuous maintenance of those existing Blackstart facilities is necessary so that Blackstart facilities are able to properly operate when they are needed. California ISO oversees the testing and certification of Blackstart facilities.
2. Annual Blackstart plan review and training
On average, regional blackouts happen once every 25 years;20 hence, Transmission Operators generally can only get experience restoring systems through other methods, such as simulations. SDG&E conducts annual Blackstart training, which is a week-long session that gives operators the opportunity to respond to Blackstart scenarios with involvement of generation operators within SDG&E's footprint, and distribution operators. The training teaches the concepts of voltage control and generation control when a system has experienced a wide-scale shutdown. The training is based on Blackstart plans that are reviewed and coordinated every year with California ISO, Peak Regional Coordinator, and neighboring utilities. This activity is mandated by NERC standard EOP-005-2 and helps reduce the likelihood of human errors when restoring a system.
6 Proposed Risk Mitigation Plan
The 2015 baseline mitigations outlined in Section 5 will continue to be performed in the proposed plan to, in most cases, maintain the current residual risk level. This section provides an overview of the
17 The Baseline and Proposed Risk Mitigation Plans may include mandated, compliance-driven mitigations. 18 D.16-08-018 at p. 146 states “Overall, the utility should show how it will use its expertise and budget to improve its safety record” and the goal is to “make California safer by identifying the mitigations that can optimize safety.” 19 Reliability typically has an impact on safety. Accordingly, it is difficult to separate reliability and safety. 20JR Minkel, “The 2003 Northeast Blackout – Five Years Later”, Scientific American, August 13, 2008 http://www.scientificamerican.com/article/2003-blackout-five-years-later/.
Page SDGE 6-13 310286
proposed risk mitigation plans for the years 2017, 2018 and 2019. SDG&E’s proposed risk mitigation plan during the 2017-2019 timeframe, as explained below, includes the addition of Blackstart facilities, the modernization of SDG&E control centers, and enhancements to substation backup power. The proposed plan also assumes that the Pio Pico Energy Center (PPEC) achieves its expected commercial operation date.21
1. South Grid Blackstart Project
NERC Emergency Preparedness and Operations Reliability Standard EOP-005 states: “Ensure plans, Facilities, and personnel are prepared to enable System restoration from Blackstart Resources to assure reliability is maintained during restoration and priority is placed on restoring the Interconnection”. The South Grid Blackstart project is proposed to provide Blackstart capability to the southern part of the SDG&E electric grid and to address the dependence on the Palomar Energy Center (PEC) units. These are the only Blackstart facilities remaining in this area since the retirement of the Southbay Power plant in 2010. The PEC units are the only reachable units through a Cranking Path from the current Blackstart facilities that have isochronous mode.22
This project is required to Blackstart the southern portion of the transmission grid in case of a Blackout and it provides an alternative to restore the system when the PEC units are out of service for maintenance or if they fail. A smaller-sized engine generator will be installed at SDG&E’s El Cajon facility, enabling emergency starting of the Cuyamaca unit that will then start the Pio Pico Energy Center units. Once the PPEC units are energized by the Cuyamaca unit through a selected Cranking Path, the PPEC units will be used to maintain frequency and voltages to reenergize the transmission backbone and restore loads, as well as facilitate the interconnection with neighboring transmission systems.
2. Modernization of grid control centers
During the September 8, 2011, Pacific Southwest Blackout, the use of the existing static control room mimic board proved to be confusing to operators. It was difficult for operators to determine if lines were out of service or if circuit breakers were opened. This made the static mimic board inadequate to portray the “big picture” of the system needed to make timely decisions. Operators had to use their workstation EMS displays instead, and dispatch personnel to sites to prevent errors from happening. This led to delays in the restoration process. The Transmission Energy Management System Modernization Project will upgrade SDG&E current mimic board and control room. Similar projects have already been implemented at SCE and PG&E.
21 Pio Pico Energy Center is a 318 MW simple-cycle electrical generating facility. 22 Isochronous mode allows generators to maintain the frequency of an electrical system constant.
Page SDGE 6-14 310286
Moreover, he upgrades will help improve situational awareness, manage the new challenges faced by electric transmission systems due to the recent penetration of renewable resources, and their inherent intermittent nature, and prevent potential human errors. SDG&E expects that the Transmission EMS Modernization Project will enhance safety and reliability by expediting the identification of critical system conditions through means of dynamic visual content. Upgrades would include the replacement of the static mosaic tile board to a dynamic video wall, upgrading the peripheral devices/applications that support such systems, and maximizing the utilization of control room space while maintaining an ergonomic work environment consistent with the Company's policies.
3. Substation backup power enhancements (fuel cells)
Part of the restoration process following a blackout is to energize the Cranking Path which comprises several transmission lines and circuit breakers. It is imperative that operators can energize the Cranking Path during a blackout. If a blackout lasts more than eight hours, as experienced during the Pacific Southwest Blackout, it is highly likely that the batteries at the substations on the Cranking Path will be depleted. If this happens, personnel would be deployed to set portable diesel generators to recharge batteries for the duration of the outages. This manual deployment likely would further delay the restoration. Without the ability to quickly charge batteries, the reliability of the Cranking path could be degraded to the point of failure. The purpose of the substation backup power enhancement project is to purchase 30-GenCell 5kW fuel cells to be installed, at major substations throughout the SDG&E service territory, as an auxiliary power system for control shelters. SDG&E anticipates that these fuel cells increase battery charge life to over a day ensuring power is continuously available during outages for switching, control, protection, and communication equipment. In addition, the use of fuel cells will decrease the potential for environmental hazards caused by spills of portable diesel generators, which have also occurred in the past.
4. Maintenance, certification, and testing of existing Blackstart facilities
SDG&E is proposing to maintain this baseline activity with little to no changes. Please refer to Section 5 for details about this mitigation.
5. Annual Blackstart plan review and training
This mitigation also is a continuation of the baseline control. Please refer to Section 5 for details about this mitigation.
7 Summary of Mitigations
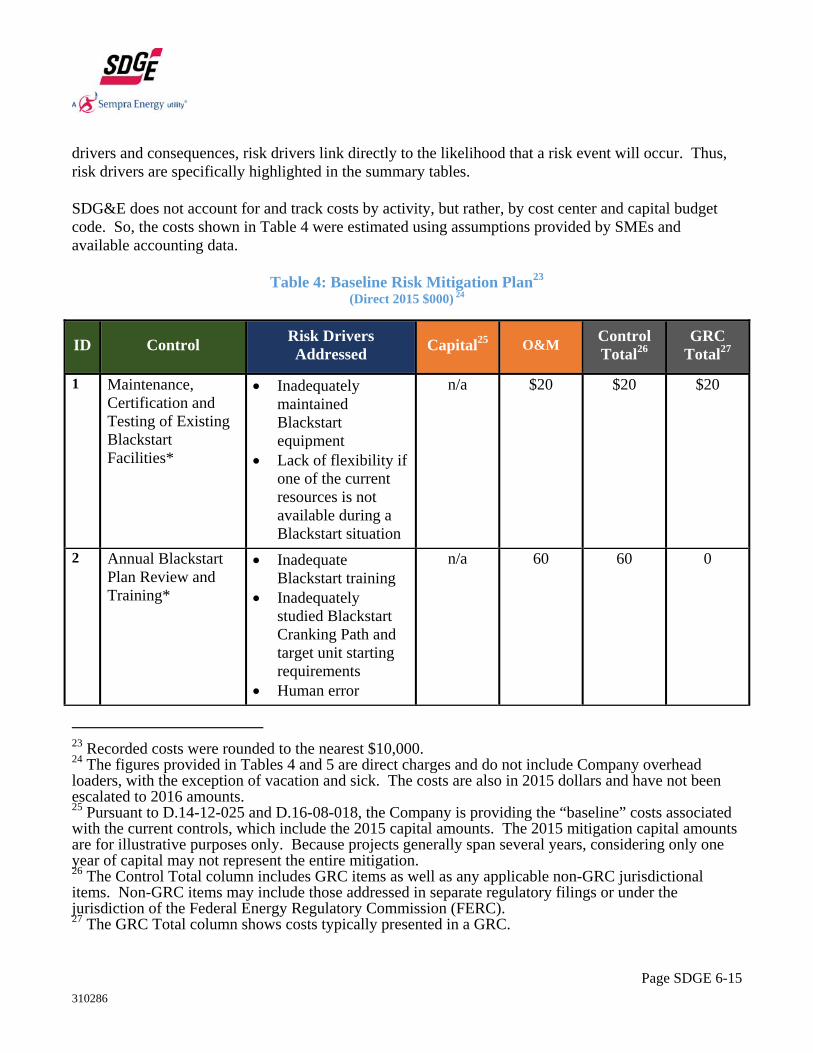
Table 4 summarizes the 2015 baseline risk mitigation plan, the risk driver(s) a control addresses, and the 2015 baseline costs for Fail to Blackstart. While control or mitigation activities may address both risk
Page SDGE 6-15 310286
drivers and consequences, risk drivers link directly to the likelihood that a risk event will occur. Thus, risk drivers are specifically highlighted in the summary tables.
SDG&E does not account for and track costs by activity, but rather, by cost center and capital budget code. So, the costs shown in Table 4 were estimated using assumptions provided by SMEs and available accounting data.
Table 4: Baseline Risk Mitigation Plan23 (Direct 2015 $000) 24
ID Control Risk Drivers Addressed
Capital25 O&M Control Total26
GRC Total27
1 Maintenance, Certification and Testing of Existing Blackstart Facilities*
Inadequately maintained Blackstart equipment
Lack of flexibility if one of the current resources is not available during a Blackstart situation
n/a
$20 $20 $20
2 Annual Blackstart Plan Review and Training*
Inadequate Blackstart training
Inadequately studied Blackstart Cranking Path and target unit starting requirements
Human error
n/a 60 60 0
23 Recorded costs were rounded to the nearest $10,000. 24 The figures provided in Tables 4 and 5 are direct charges and do not include Company overhead loaders, with the exception of vacation and sick. The costs are also in 2015 dollars and have not been escalated to 2016 amounts. 25 Pursuant to D.14-12-025 and D.16-08-018, the Company is providing the “baseline” costs associated with the current controls, which include the 2015 capital amounts. The 2015 mitigation capital amounts are for illustrative purposes only. Because projects generally span several years, considering only one year of capital may not represent the entire mitigation. 26 The Control Total column includes GRC items as well as any applicable non-GRC jurisdictional items. Non-GRC items may include those addressed in separate regulatory filings or under the jurisdiction of the Federal Energy Regulatory Commission (FERC). 27 The GRC Total column shows costs typically presented in a GRC.

Page SDGE 6-16 310286
ID Control Risk Drivers Addressed
Capital25 O&M Control Total26
GRC Total27
TOTAL COST n/a $80 $80 $20
* Includes one or more mandated activities
1. Maintenance certification and testing of existing Blackstart facilities
The cost estimates for this control are for the labor hours of 17 operation technicians at Palomar associated with weekly 1-hour unloaded testing, monthly 2-hour loaded testing, and annual training. Average annual salary rates were used to forecast the costs. Only the costs of maintaining and testing the MEF Blackstart equipment (i.e., small diesel generator) were considered. Costs associated with the maintenance of the MEF gas turbine generators, and for maintaining the grid and Palomar were excluded. This mitigation requires eight hours of training, annually, for all operation technicians and, again, average salary rates were utilized.
2. Annual Blackstart plan review and training
The cost estimates for this control are for the labor hours from Grid Operations Support group and the Mission Control Training Section. The Grid Operations Support group estimates that eight weeks of an engineer’s time is used for this mitigation. The derivation of engineer’s labor entailed calculating the average pay rate for engineers and average number of hours in a month multiplied by two months. The costs associated with Mission Control Training Section reflects labor associated with the development and implementation of on-going Blackstart training of transmission system operators (TSO) and Operation Shift Supervisors (OSS) on an annual basis as mandated by NERC Standard EOP-005-2.
These costs are FERC jurisdictional and, therefore, are not included in the GRC Total column shown in Table 4.
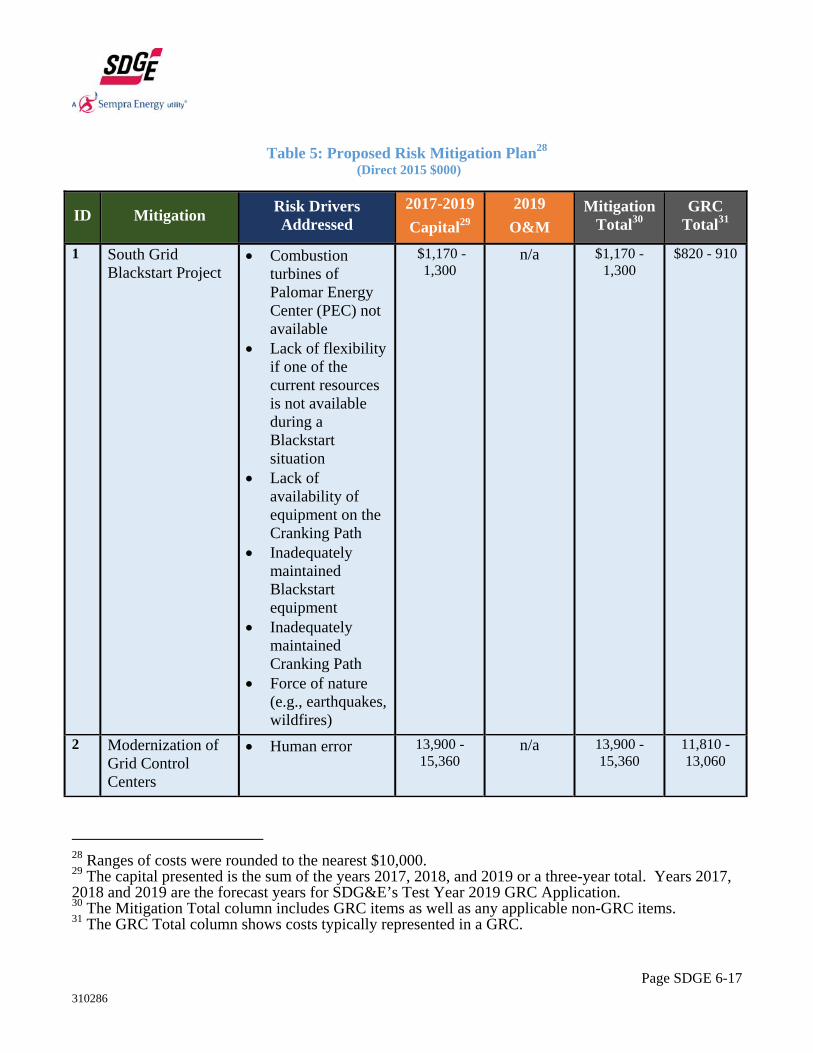
Table 5 summarizes SDG&E’s proposed mitigation plan, associated projected ranges of estimated O&M expenses for 2019, and projected ranges of estimated capital costs for the years 2017-2019. It is important to note that SDG&E is identifying potential ranges of costs in this plan, and is not requesting funding approval. SDG&E will request approval of funding, in its next GRC. There are non-CPUC jurisdictional mitigation activities addressed in RAMP; the costs associated with these will not be carried over to the GRC. As set forth in Table 5 the utilities are using a 2019 forecast provided in ranges based on 2015 dollars.
Page SDGE 6-17 310286
Table 5: Proposed Risk Mitigation Plan28 (Direct 2015 $000)
ID Mitigation Risk Drivers Addressed
2017-2019
Capital29
2019
O&M
Mitigation Total30
GRC Total31
1 South Grid Blackstart Project
Combustion turbines of Palomar Energy Center (PEC) not available
Lack of flexibility if one of the current resources is not available during a Blackstart situation
Lack of availability of equipment on the Cranking Path
Inadequately maintained Blackstart equipment
Inadequately maintained Cranking Path
Force of nature (e.g., earthquakes, wildfires)
$1,170 - 1,300
n/a $1,170 - 1,300
$820 - 910
2 Modernization of Grid Control Centers
Human error 13,900 -15,360
n/a 13,900 -15,360
11,810 - 13,060
28 Ranges of costs were rounded to the nearest $10,000. 29 The capital presented is the sum of the years 2017, 2018, and 2019 or a three-year total. Years 2017, 2018 and 2019 are the forecast years for SDG&E’s Test Year 2019 GRC Application. 30 The Mitigation Total column includes GRC items as well as any applicable non-GRC items. 31 The GRC Total column shows costs typically represented in a GRC.
Page SDGE 6-18 310286
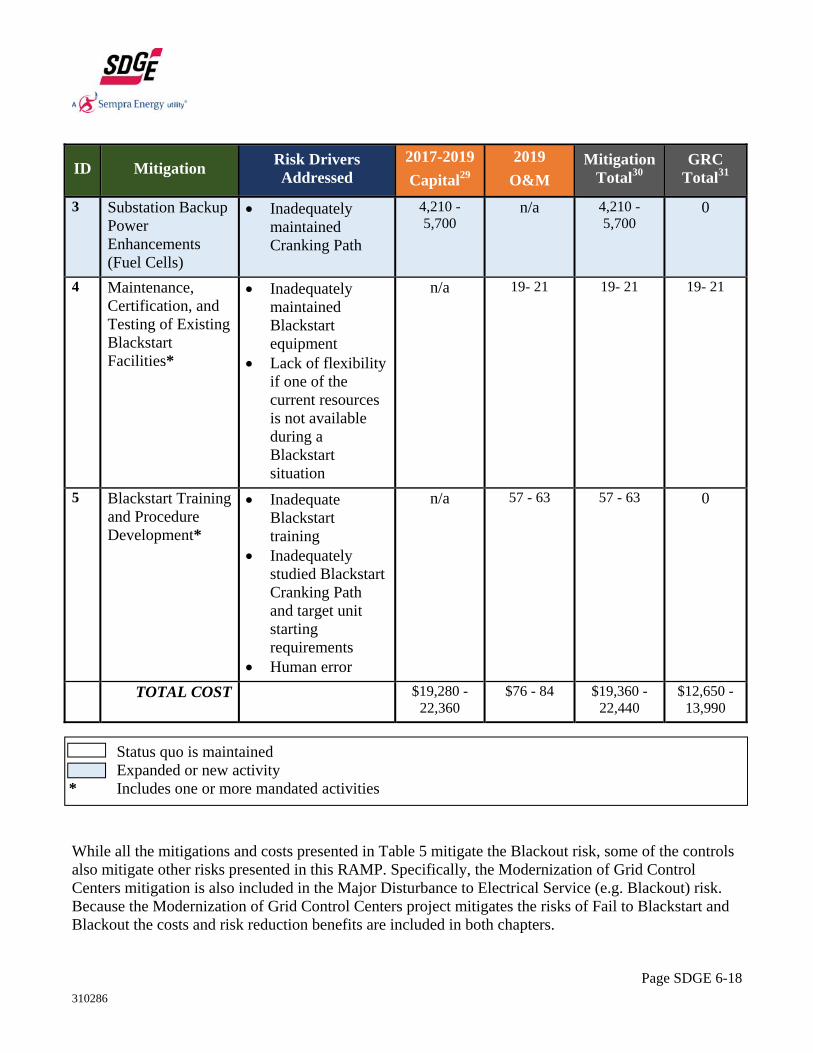
ID Mitigation Risk Drivers Addressed
2017-2019
Capital29
2019
O&M
Mitigation Total30
GRC Total31
3 Substation Backup Power Enhancements (Fuel Cells)
Inadequately maintained Cranking Path
4,210 - 5,700
n/a 4,210 - 5,700
0
4 Maintenance, Certification, and Testing of Existing Blackstart Facilities*
Inadequately maintained Blackstart equipment
Lack of flexibility if one of the current resources is not available during a Blackstart situation
n/a 19- 21 19- 21 19- 21
5 Blackstart Training and Procedure Development*
Inadequate Blackstart training
Inadequately studied Blackstart Cranking Path and target unit starting requirements
Human error
n/a 57 - 63 57 - 63 0
TOTAL COST $19,280 -22,360
$76 - 84 $19,360 - 22,440
$12,650 - 13,990
While all the mitigations and costs presented in Table 5 mitigate the Blackout risk, some of the controls also mitigate other risks presented in this RAMP. Specifically, the Modernization of Grid Control Centers mitigation is also included in the Major Disturbance to Electrical Service (e.g. Blackout) risk. Because the Modernization of Grid Control Centers project mitigates the risks of Fail to Blackstart and Blackout the costs and risk reduction benefits are included in both chapters.
- Status quo is maintained - Expanded or new activity
* Includes one or more mandated activities
Page SDGE 6-19 310286
1. South Grid Blackstart Project
The costs shown in Table 5 represent capital plant expenditures and SDG&E labor. The dollars associated with the addition of capital plant and labor are based on estimated costs provided in accounting documents such as Capital Budget Documentation (CBD) and/or Work Order Authorization forms (WOA). While these capital costs were zero-based, subject matter experts reviewed the costs of previous capital projects and used their experience when developing estimates. Costs are presented as ranges to account for potential variability in capital and labor costs over the time period..
Thirty percent (30%) of the South Grid Blackstart costs have been identified as FERC jurisdictional. Therefore, 70% of the capital costs associated with South Grid Blackstart are presented in the GRC Total column of Table 5, while the remaining 30% are omitted from the GRC total.
2. Modernization of Grid Control Centers
These costs reflect estimates provided in CBD and WOA internal accounting documents. While these capital costs were zero-based, subject matter experts reviewed the costs of previous capital projects and used their experience when developing estimates. Costs are presented as ranges to account for potential variability in capital and labor costs over the time period. The Capital cost ($13.9 million - $15.3 million)includes a portion identified as FERC jurisdictional, non-GRC dollars. Following SDG&E’s Capitalization Policy, 15% of the range ($2.1 million - $2.3 million) has been identified as non-GRC dollars. Accordingly these FERC jurisdictional costs are not included in the GRC Total column in Table 5.
3. Substation Back Up Power Enhancements
The substation backup power enhancement (fuel cells) costs reflect estimates provided in the CBD and WOA internal accounting documents. While these capital costs were zero-based, subject matter experts reviewed the costs of previous capital projects and used their experience when developing estimates. Costs are presented as ranges to account for potential variability in capital and labor costs over the time period.
All of the capital costs associated with Substation backup power enhancement have been identified as FERC jurisdictional, non-GRC costs. Therefore, these costs are not included in the GRC Total column in Table 5.
4. & 5. Maintenance, Certification, and Testing of Existing Blackstart Facilities; & Annual Blackstart Plan Review
Page SDGE 6-20 310286
SDG&E proposes to maintain two of the baseline controls in 2017-2019: (1) Maintenance, certification, and testing of existing Blackstart facilities, and (2) Annual Blackstart plan review and training. SDG&E does not expect a significant change in these activities as compared to 2015. A range of costs for each is provided to account for potential variation in annual spend over the time period.
8 Risk Spend Efficiency
Pursuant to D.16-08-018, the utilities are required in this Report to “explicitly include a calculation of risk reduction and a ranking of mitigations based on risk reduction per dollar spent.”32 For the purposes of this Section, Risk Spend Efficiency (RSE) is a ratio developed to quantify and compare the effectiveness of a mitigation at reducing risk to other mitigations for the same risk. It is synonymous with “risk reduction per dollar spent” required in D.16-08-018.33
As discussed in greater detail in the RAMP Approach chapter within this Report, to calculate the RSE the Company first quantified the amount of Risk Reduction attributable to a mitigation, then applied the Risk Reduction to the Mitigation Costs (discussed in Section 7). The Company applied this calculation to each of the mitigations or mitigation groupings, then ranked the proposed mitigations in accordance with the RSE result.
8.1 General Overview of Risk Spend Efficiency Methodology
This subsection describes, in general terms, the methods used to quantify the Risk Reduction. The quantification process was intended to accommodate the variety of mitigations and accessibility to applicable data pertinent to calculating risk reductions. Importantly, it should be noted that the analysis described in this chapter uses ranges of estimates of costs, risk scores and RSE. Given the newness of RAMP and its associated requirements, the level of precision in the numbers and figures cannot and should not be assumed.
8.1.1 Calculating Risk Reduction
The Company’s SMEs followed these steps to calculate the Risk Reduction for each mitigation:
1. Group mitigations for analysis: The Company “grouped” the proposed mitigations in one of three ways in order to determine the risk reduction: (1) Use the same groupings as shown in the Proposed Risk Mitigation Plan; (2) Group the mitigations by current controls or future mitigations, and similarities in potential drivers, potential consequences, assets, or dependencies (e.g., purchase of software and training on the software); or (3) Analyze the proposed mitigations as one group (i.e., to cover a range of activities associated with the risk).
2. Identify mitigation groupings as either current controls or incremental mitigations: The Company identified the groupings by either current controls, which refer to controls that are already in place, or incremental mitigations, which refer to significantly new or expanded mitigations.
32 D.16-08-018 Ordering Paragraph 8. 33 D.14-12-025 also refers to this as “estimated mitigation costs in relation to risk mitigation benefits.”
Page SDGE 6-21 310286
3. Identify a methodology to quantify the impact of each mitigation grouping: The Company identified the most pertinent methodology to quantify the potential risk reduction resulting from a mitigation grouping’s impact by considering a spectrum of data, including empirical data to the extent available, supplemented with the knowledge and experience of subject matter experts. Sources of data included existing Company data and studies, outputs from data modeling, industry studies, and other third-party data and research.
4. Calculate the risk reduction (change in the risk score): Using the methodology in Step 3, the Company determined the change in the risk score by using one of the following two approaches to calculate a Potential Risk Score: (1) for current controls, a Potential Risk Score was calculated that represents the increased risk score if the current control was not in place; (2) for incremental mitigations, a Potential Risk Score was calculated that represents the new risk score if the incremental mitigation is put into place. Next, the Company calculated the risk reduction by taking the residual risk score (See Table 3 in this chapter.) and subtracting the Potential Risk Score. For current controls, the analysis assesses how much the risk might increase (i.e., what the potential risk score would be) if that control was removed.34 For incremental mitigations, the analysis assesses the anticipated reduction of the risk if the new mitigations are implemented. The change in risk score is the risk reduction attributable to each mitigation.
8.1.2 Calculating Risk Spend Efficiency
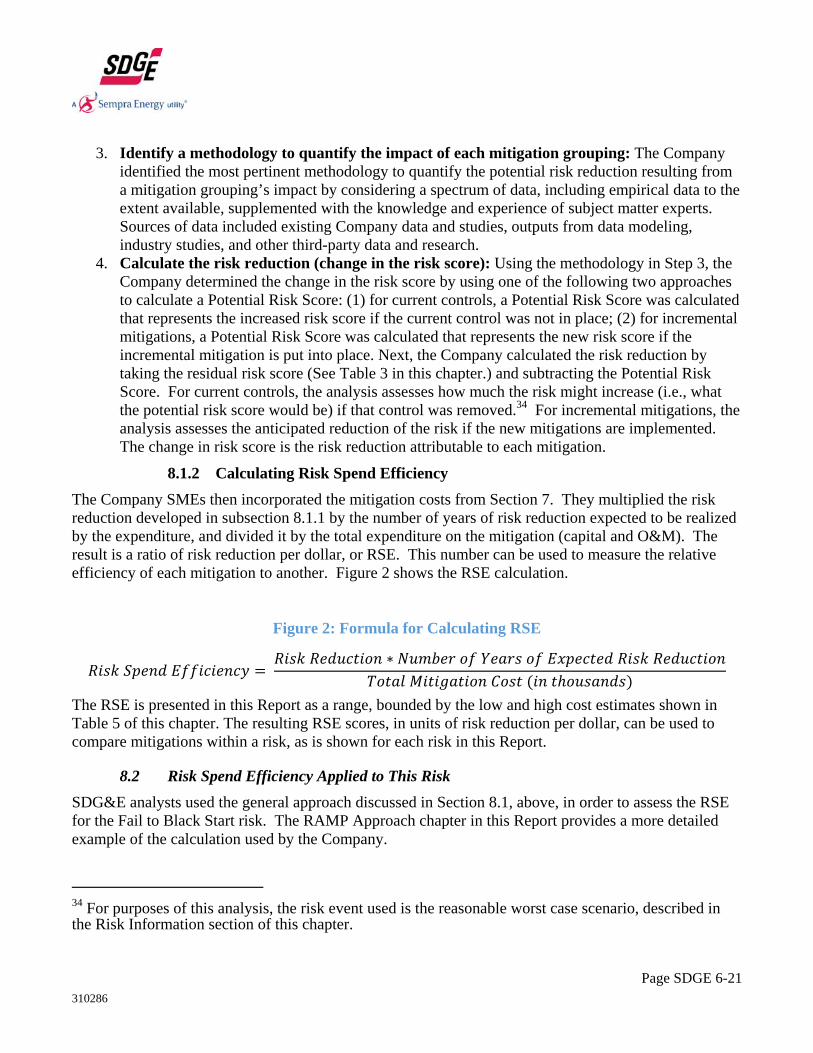
The Company SMEs then incorporated the mitigation costs from Section 7. They multiplied the risk reduction developed in subsection 8.1.1 by the number of years of risk reduction expected to be realized by the expenditure, and divided it by the total expenditure on the mitigation (capital and O&M). The result is a ratio of risk reduction per dollar, or RSE. This number can be used to measure the relative efficiency of each mitigation to another. Figure 2 shows the RSE calculation.
Figure 2: Formula for Calculating RSE
∗
The RSE is presented in this Report as a range, bounded by the low and high cost estimates shown in Table 5 of this chapter. The resulting RSE scores, in units of risk reduction per dollar, can be used to compare mitigations within a risk, as is shown for each risk in this Report.
8.2 Risk Spend Efficiency Applied to This Risk
SDG&E analysts used the general approach discussed in Section 8.1, above, in order to assess the RSE for the Fail to Black Start risk. The RAMP Approach chapter in this Report provides a more detailed example of the calculation used by the Company.
34 For purposes of this analysis, the risk event used is the reasonable worst case scenario, described in the Risk Information section of this chapter.
Page SDGE 6-22 310286
This risk is dependent on SDG&E being in a blackout. The probability of being in a blackout was given to be 0.0183 in the Blackout risk. The residual risk score for the likelihood of a failure to black start did not account for this probability and all RSE scores were thus adjusted to account for this dependency.
The risk assessment team analyzed four mitigation groupings. The first is the only current, ongoing control and consists of several projects related to maintenance, certification, and testing of the existing black start resources. The remaining mitigations are incremental: adding black start capabilities to the southern part of the system, upgrading a visualization tool, and adding fuel cells to provide backup power in the event of a blackout. The analysis for these mitigations consisted of a combination of industry research and risk team estimates, based on SME input.
The mitigation groupings include:
(a) Maintenance, Certification, and testing of existing Black start Resources & Black start training and procedure development MEF I and II black start generators maintenance and testing programs Bicertification of MEF I and II as black start units Maintenance of Orange Grove as a black start resource through current Power Purchase
Agreement (PPA) (SDG&E does not incur any cost specific to this mitigation) SDG&E black start/system restoration training and drill Development and coordination of Black start plans with CAISO, Peak RC, and neighboring
utilities through SDG&E EOP5005 procedure update
(b) South Grid Black-Start Project Add black start capabilities to the southern part of the SDG&E electric system
(c) Transmission Energy Management System Modernization Project
Upgrade antiquated EMS visualization tool and control room
(d) Substation Auxiliary Power System (fuel cells) Use fuel cells to provide backup power at major substations and substations on the Black start
Cranking Paths.
Current Controls: Maintenance, Certification, Testing, and Training
Industry research performed in fields other than the electric power field since the 1800s shows the importance of repetitive training, and that forgetting depends on many factors, such as the type of material being learned, learners’ prior knowledge and motivation to learn, and training format. In some experiments, learners forgot 51% of what they learn after three years. This phenomenon has been extensively documented as the “forgetting curve,” and is usually characterized by an exponential or a

Page SDGE 6-23 310286
power function that decays. 35,36 Additionally, not maintaining blackstart equipment will further increase the decay rate of the forgetting curve, augmenting the likelihood of failing to black start.
The analysis team estimated that after three years, the likelihood of failure to black start, without maintenance and training, will go to approximately 30%. This estimate was based on the following: the likelihood of being able to black start, after one year of no training or maintenance, was assumed to be around 80-90%; after two years, 70-80%; after three years, 40-60%. This is an average of 70% success over the three years. The average likelihood of failing to black start, after three years, was therefore assumed to be approximately 30%.
Incremental: South Grid Black Start Project
This mitigation provides a redundancy to the PEC units. To determine the new likelihood of a failure to black start after implementing this mitigation, the team developed a fault/decision tree that compared the original likelihood to black start and the new likelihood after implementing this mitigation. Factors considered included neighboring utilities in blackout, availability of PEC units, duration of event, availability of redundant path, and battery failure.
o Original probability of failure to black start, given SDG&E is in blackout: neighbors in blackout * PEC units unavailable * event lasts less than eight hours + neighbors in blackout * (PEC units unavailable or PEC units available but batteries fail) * event lasts longer than eight hours
o New Probability = neighbors in blackout * [event lasts less than eight hours * PEC units unavailable * Redundant Path Unavailable + event lasts longer than eight hours * ((PEC units unavailable * Redundant Path unavailable or Redundant Path available but batteries fail) + PEC units available but batteries fail * Redundant Path unavailable or Redundant Path available but batteries fail)]
The original probability of failure to black start, given SDG&E is in blackout is 0.0183, based on the likelihood score assigned to this risk. The new probability from the South Grid Black Start Project was calculated to be 0.00622, a 65.9% risk reduction.
Incremental: Modernization of Grid Control Centers
This mitigation upgrades an antiquated EMS visualization tool and control room. This tool will help improve situational awareness and prevent potential human errors. SMEs estimate that this improvement
35 Thalheimer, W., “How Much Do People Forget?” April 2010, http://www.work-learning.com/catalog.html. 36 Murre JMJ, Dros J , “Replication and Analysis of Ebbinghaus’ Forgetting Curve”, PLOS ONE, July 2015 https://www.ncbi.nlm.nih.gov/pmc/articles/PMC4492928/.

Page SDGE 6-24 310286
will reduce the likelihood of a blackout by 10%. SDG&E’s SMEs consider this to be the best estimate at this time since there is no industry data available for validation.
Incremental: Substation Backup Power Enhancements (fuel cells)
The scope of this project is to purchase 30-GenCell 5kW Fuel Cells, to be installed in electric substations throughout the SDG&E service territory, as an auxiliary power system for control shelters. To determine the new likelihood of a failure to black start after implementing this mitigation, the team developed a fault/decision tree that compared the original likelihood to black start and the new likelihood after implementing this mitigation. Factors considered included neighboring utilities in blackout, availability of PEC units, and duration of event.
o Original probability of failure to black start, given SDG&E is in blackout: neighbors in blackout * PEC units unavailable * event lasts less than eight hours + neighbors in blackout * (PEC units unavailable or PEC units available but batteries fail) * event lasts longer than eight hours
o With this mitigation, events lasting longer than eight hours can still be black started 100% of the time, if PEC units are available. New Probability = neighbors in blackout * 100% * PEC units unavailable
The original probability of failure to black start, given SDG&E is in blackout is 0.0183, based on the likelihood score assigned to this risk. The new probability from Substation Backup Power Enhancements (fuel cells) was calculated to be 0.01462, a 19.9% risk reduction.
8.3 Risk Spend Efficiency Results
Based on the foregoing analysis, SDG&E calculated the RSE ratio for each of the proposed mitigation groupings. Following is the ranking of the mitigation groupings from the highest to the lowest efficiency, as indicated by the RSE number:
5. Maintenance, certification, testing, and training (current controls) 6. The South Grid Black Start Project (incremental mitigations) 7. Substation backup power enhancements (fuel cells) (incremental mitigations) 8. Modernization of Grid Control Centers (incremental mitigations)
Figure 3 displays the range37 of RSEs for each of the SDG&E Fail to Black Start risk mitigation groupings, arrayed in descending order.38 That is, the more efficient mitigations, in terms of risk reduction per spend, are on the left side of the chart.
37 Based on the low and high cost ranges provided in Table 5 of this chapter. 38 It is important to note that the risk mitigation prioritization shown in this Report, is not comparable across other risks in this Report.
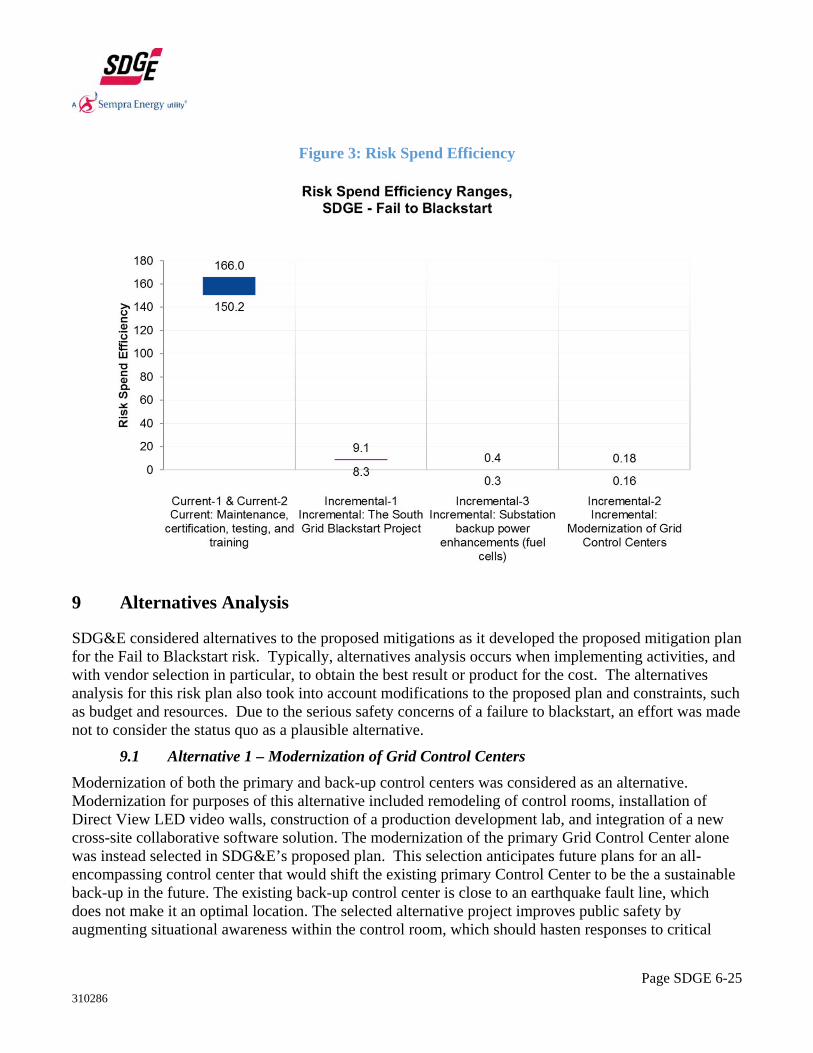
Page SDGE 6-25 310286
Figure 3: Risk Spend Efficiency
9 Alternatives Analysis
SDG&E considered alternatives to the proposed mitigations as it developed the proposed mitigation plan for the Fail to Blackstart risk. Typically, alternatives analysis occurs when implementing activities, and with vendor selection in particular, to obtain the best result or product for the cost. The alternatives analysis for this risk plan also took into account modifications to the proposed plan and constraints, such as budget and resources. Due to the serious safety concerns of a failure to blackstart, an effort was made not to consider the status quo as a plausible alternative.
9.1 Alternative 1 – Modernization of Grid Control Centers
Modernization of both the primary and back-up control centers was considered as an alternative. Modernization for purposes of this alternative included remodeling of control rooms, installation of Direct View LED video walls, construction of a production development lab, and integration of a new cross-site collaborative software solution. The modernization of the primary Grid Control Center alone was instead selected in SDG&E’s proposed plan. This selection anticipates future plans for an all-encompassing control center that would shift the existing primary Control Center to be the a sustainable back-up in the future. The existing back-up control center is close to an earthquake fault line, which does not make it an optimal location. The selected alternative project improves public safety by augmenting situational awareness within the control room, which should hasten responses to critical
Page SDGE 6-26 310286
system conditions that jeopardize public safety, and by laying the groundwork for a more reliable back-up control center in the future.
9.2 Alternative 2 – Substation backup power
The installation of diesel generators at major substations was considered as one of the alternatives to the deployment of fuel cells to enhance substation backup power at SDG&E. Diesel generators were not selected and were viewed as infeasible because they are costlier to run and maintain, as well as require additional environmental permitting. The deployment of fuel cell technology was selected instead because it is more cost-effective and environmentally friendly.